EP4008254B1 - Method for classifying atrial fibrillation - Google Patents
Method for classifying atrial fibrillation Download PDFInfo
- Publication number
- EP4008254B1 EP4008254B1 EP20212255.2A EP20212255A EP4008254B1 EP 4008254 B1 EP4008254 B1 EP 4008254B1 EP 20212255 A EP20212255 A EP 20212255A EP 4008254 B1 EP4008254 B1 EP 4008254B1
- Authority
- EP
- European Patent Office
- Prior art keywords
- frequency
- dominant
- window
- control system
- ecg data
- Prior art date
- Legal status (The legal status is an assumption and is not a legal conclusion. Google has not performed a legal analysis and makes no representation as to the accuracy of the status listed.)
- Active
Links
Images

Classifications
-
- A—HUMAN NECESSITIES
- A61—MEDICAL OR VETERINARY SCIENCE; HYGIENE
- A61B—DIAGNOSIS; SURGERY; IDENTIFICATION
- A61B5/00—Measuring for diagnostic purposes; Identification of persons
- A61B5/24—Detecting, measuring or recording bioelectric or biomagnetic signals of the body or parts thereof
- A61B5/316—Modalities, i.e. specific diagnostic methods
- A61B5/318—Heart-related electrical modalities, e.g. electrocardiography [ECG]
- A61B5/346—Analysis of electrocardiograms
- A61B5/349—Detecting specific parameters of the electrocardiograph cycle
- A61B5/361—Detecting fibrillation
-
- A—HUMAN NECESSITIES
- A61—MEDICAL OR VETERINARY SCIENCE; HYGIENE
- A61B—DIAGNOSIS; SURGERY; IDENTIFICATION
- A61B5/00—Measuring for diagnostic purposes; Identification of persons
- A61B5/24—Detecting, measuring or recording bioelectric or biomagnetic signals of the body or parts thereof
- A61B5/30—Input circuits therefor
- A61B5/307—Input circuits therefor specially adapted for particular uses
- A61B5/308—Input circuits therefor specially adapted for particular uses for electrocardiography [ECG]
-
- A—HUMAN NECESSITIES
- A61—MEDICAL OR VETERINARY SCIENCE; HYGIENE
- A61B—DIAGNOSIS; SURGERY; IDENTIFICATION
- A61B5/00—Measuring for diagnostic purposes; Identification of persons
- A61B5/48—Other medical applications
- A61B5/4842—Monitoring progression or stage of a disease
-
- A—HUMAN NECESSITIES
- A61—MEDICAL OR VETERINARY SCIENCE; HYGIENE
- A61B—DIAGNOSIS; SURGERY; IDENTIFICATION
- A61B5/00—Measuring for diagnostic purposes; Identification of persons
- A61B5/72—Signal processing specially adapted for physiological signals or for diagnostic purposes
- A61B5/7235—Details of waveform analysis
- A61B5/7253—Details of waveform analysis characterised by using transforms
-
- A—HUMAN NECESSITIES
- A61—MEDICAL OR VETERINARY SCIENCE; HYGIENE
- A61B—DIAGNOSIS; SURGERY; IDENTIFICATION
- A61B5/00—Measuring for diagnostic purposes; Identification of persons
- A61B5/72—Signal processing specially adapted for physiological signals or for diagnostic purposes
- A61B5/7235—Details of waveform analysis
- A61B5/7264—Classification of physiological signals or data, e.g. using neural networks, statistical classifiers, expert systems or fuzzy systems
-
- A—HUMAN NECESSITIES
- A61—MEDICAL OR VETERINARY SCIENCE; HYGIENE
- A61B—DIAGNOSIS; SURGERY; IDENTIFICATION
- A61B5/00—Measuring for diagnostic purposes; Identification of persons
- A61B5/72—Signal processing specially adapted for physiological signals or for diagnostic purposes
- A61B5/7235—Details of waveform analysis
- A61B5/7253—Details of waveform analysis characterised by using transforms
- A61B5/7257—Details of waveform analysis characterised by using transforms using Fourier transforms
-
- A—HUMAN NECESSITIES
- A61—MEDICAL OR VETERINARY SCIENCE; HYGIENE
- A61B—DIAGNOSIS; SURGERY; IDENTIFICATION
- A61B5/00—Measuring for diagnostic purposes; Identification of persons
- A61B5/72—Signal processing specially adapted for physiological signals or for diagnostic purposes
- A61B5/7235—Details of waveform analysis
- A61B5/7253—Details of waveform analysis characterised by using transforms
- A61B5/726—Details of waveform analysis characterised by using transforms using Wavelet transforms
Definitions
- the invention relates to a method for classifying atrial fibrillation by analyzing ECG data via a control system according to the general part of claim 1 and a control system for performing such a method according to claim 16.
- Atrial fibrillation is the chaotic activation of muscle cells of the atria.
- Atrial fibrillation During atrial fibrillation, the atria only minimally contribute to the function of the heart. Atrial fibrillation, therefore, reduces the output of the heart but is not imminently dangerous. However, when becoming chronical, atrial fibrillation is correlated with increased morbidity and mortality.
- ablation therapy is the destruction of the cells that allow electrical wave reentry to reduce chaotic activation of the atrial muscle cells.
- the success rate of and strategy for atrial fibrillation ablation heavily depends on the level of complexity of the electrical conduction through the atria. If complexity is low, ablation of the usual reentry paths has a high chance of success. If complexity is higher, additional electrical mapping of activation paths can be used. Independent of the treatment, classifying the complexity of atrial fibrillation allows patient-specific treatment and outcome prediction of ablation therapy.
- One of the promising methods for classifying atrial fibrillation is calculating the dominant frequency of the electrical activation of the atria from a body surface ecg.
- dominant frequency determination often uses the steps of isolating atrial activation from ECG data and analyzing a frequency spectrum of the remaining atrial signal data.
- Known methods US 5,772,604 A ) detect a peak frequency in the spectrum of the atrial signal data. While these methods yield promising results, there is still room for improving the classification of atrial fibrillation by providing new classification methods.
- the main realization of the present invention is that atrial activation is not adequately described by a single peak or main frequency but in itself a complex, instable and rapidly changing chaotic phenomenon. Looking for a single dominant frequency is therefore not an optimal way of describing the physiological reality.
- the central realization in the present case is that atrial fibrillation can be characterized by searching for a window of frequencies representing the dominant part of the atrial fibrillation.
- a dominant window After decomposing the ECG data thereby generating frequency data comprising a frequency dimension and an amplitude dimension, a dominant window can be found by searching in the frequency dimension for a window meeting an amplitude criterion based on a sum of amplitudes inside the dominant window.
- the control system identifies in the frequency data a dominant window having a width in the frequency dimension and meeting an amplitude criterion, that the amplitude criterion is based on a sum of amplitudes inside the dominant window, that the control system identifies the dominant window by searching on at least a section, in particular a pre-defined section, of the frequency dimension for a window fulfilling the amplitude criterion and that based on the dominant window the control system determines the classification of atrial fibrillation in the ECG data.
- the window is found by searching on at least a section of the frequency dimension and not by defining the window around a dominant frequency.
- ventricular components are removed from the ECG data to focus the analysis on fibrillation waves.
- the amplitude dimension is an energy density or power density dimension. The frequency distribution of the power of the atrial fibrillation signal inside the ECG is directly related to the complexity of the atrial fibrillation. The same is true for the mathematically dependent signal energy.
- Claim 4 names preferred frequency decompositions. All of these methods for frequency decomposition have different strengths and can be used in varying embodiments of the proposed method. The Fourier transformation and the Welch method impose less restrictions on the signal to be analyzed compared to other methods and are therefore also well suited for analyzing the chaotic atrial fibrillation waves. Model-based decompositions like the autoregressive moving average based decomposition again provide the possibility to adapt the decomposition to expected atrial fibrillation waves.
- the wavelet transformation allows specifically choosing a wavelet according to expected fibrillation waves and adapting the coarseness of the transformation specifically to the purpose of searching for a dominant window in a section of the frequency dimension.
- the amplitude criterion may comprise a primary criterion that a sum of amplitudes in the dominant window is at least equal to a percentage of a sum of amplitudes along a part of the frequency dimension.
- the dominant window can be defined as a window containing a pre-defined percentage of the total power of the signal.
- the power density spectrum could be a normalized or otherwise adapted power density spectrum. In this way, instead of searching for a single power spike, a search for a power band is conducted.
- Claim 7 relates to defining the width of the dominant window by using a boundary condition. In this way, further information about the signal can be included in the dominant window. For example, a small dominant window containing a large amount of power may be indicative for a less complex atrial fibrillation.
- a dominant frequency can be identified based on the dominant window.
- the width of the dominant window may be advantageous to analyze the width of the dominant window and classify the atrial fibrillation based on this analysis as described in claim 9.
- a wider dominant window implies higher complexity of the atrial fibrillation.
- Further analysis of the dominant window may include looking at harmonics of the frequency values of the dominant window as harmonic dominant windows.
- the power contained in these harmonic dominant windows may be related to atrial fibrillation complexity.
- Skewness and kurtosis contain additional information about the primary frequencies of atrial fibrillation and their amplitude.
- the classification of atrial fibrillation may comprise a presence or absence and preferably a severity indicator of the atrial fibrillation.
- the severity of atrial fibrillation is an important factor for deciding for or against ablation therapy and the used ablation method.
- Claim 12 relates to the electrical measurement environment with the preferred possibility of using a body-surface ECG.
- Body-surface ECG data combines high precision with low invasion.
- ventricular component removal step may comprise a QRS or QRST removal as described in claim 14. Either may be combined with a morphology grouping to adapt to varying QRST complex morphology. These variations in QRST complex morphology can for example be caused by the atrial fibrillation itself. As atrial fibrillation inhibits the physiological electrical conduction from the sinus node to the ventricles, ventricular activity during atrial fibrillation may have different physiological causes resulting in two or more sharply different morphology groups each related to their physiological cause.
- the proposed method is used for classifying atrial fibrillation by analysing ECG data 1 via a control system 2.
- the control system 2 is shown schematically as a control system 2 comprising hardware connected to a user U.
- the control system 2 measures the ECG data 1 as a single-channel ECG.
- the ECG data 1 may also comprise one or more channels of a multi-channel ECG.
- Physically measuring the ECG data 1 is not necessarily comprised by the proposed method, such that the control system 2 may also process ECG data measured by another system separate from the control system 2.
- the control system 2 therefore also may be a general-purpose computer, cloud-based or the like, and configured to perform the proposed method.
- the method may comprise a ventricular component removal step 3 in which the control system 2 processes the ECG data 1 to remove ventricular components 4 from the ECG data 1.
- the ventricular components 4 may be mostly QRS or QRST complex data.
- removing the ventricular components 4 from the ECG data 1 allows focussing the analysis onto atrial signal data 5 contained in the ECG data 1.
- Fig. 1 shows the ventricular component removal step 3 in the bottom part.
- the top part of Fig. 1 refers to a pre-processing of the ECG data 1 which is explained further below.
- the ventricular component removal step 3 comprises a subtraction of a template 6. This will also be explained further below.
- the ventricular component removal step may comprise the complete removal of sections of the ECG data 1 containing the QRS or QRST complex.
- the method may then comprise analysing one or more sections of the ECG data between QRS or QRST complexes. To acquire higher frequency resolution, known methods like zero padding or known methods for connecting the signal sections may be used.
- the method comprises a decomposition step which, due to its abstract nature, is not shown in Fig. 1 .
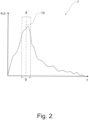
- the control system 2 decomposes the ECG data 1 by a frequency decomposition thereby generating frequency data 7 shown in Fig. 2 .
- the frequency data 7 may in particular be a frequency spectrum as shown.
- the frequency data 7 comprises a frequency dimension f and an amplitude dimension a.
- the frequency decomposition may be any suitable frequency decomposition.
- the frequency dimension f may be separated into scales instead of "frequencies" according to the narrow physical meaning.
- the amplitude dimension a may represent a physical parameter like power density but may also be a purely theoretical dimension.
- the control system 2 identifies in the frequency data 7 a dominant window 8 having a width 9 in the frequency dimension f and meeting an amplitude criterion.
- the dominant window 8 is a part of the frequency dimension f found by looking for the amplitude criterion.
- the width 9 of the dominant window 8 may be pre-defined or variable.
- the dominant window 8 includes at least two, preferably at least 5, more preferably at least 10, frequencies or frequency bins in the frequency dimension f.
- the amplitude criterion is based on a sum of amplitudes inside the dominant window 8.
- the term "sum” includes calculating an integral along the frequency dimension f even though the amplitudes will usually be defined discreetly. It may also comprise any other mathematical concept leading to a value representing the sum, like calculating a mean value and the like.
- the sum of amplitudes is based on a real addition of the amplitudes and/or is the sum of all amplitudes inside the dominant window 8.
- control system 2 identifies the dominant window 8 by searching on at least a section, in particular a pre-defined section, of the frequency dimension f for a window fulfilling the amplitude criterion.
- the search may be conducted on the whole frequency dimension f.
- the control system 2 may use any suitable search method.
- the search method may be optimized for the amplitude criterion to avoid more complex calculations on parts of the frequency dimension f that are easily excludable.
- the pre-defined section of the frequency dimension f may, for example, exclude non-physiological frequencies, for example, frequencies higher than 10Hz.
- control system 2 determines the classification of atrial fibrillation in the ECG data 1.
- the amplitude dimension a is an energy density or power density dimension p. This dimension may be normalized or otherwise processed without changing its information content.
- the frequency data 7 comprises a power spectral density spectrum of the ECG data 1.
- the frequency decomposition may additionally or alternatively comprise a Fourier transformation and/or a Welch method.
- the Fourier transformation and the Welch method are well known to the person skilled in the art.
- the frequency decomposition may also comprise a model-based decomposition, preferably an autoregressive moving average based decomposition.
- Such a model-based decomposition can be adapted specifically to the atrial signal data 5. It is evident that presently a broad definition of "frequency" is used, including scales, in particular Wavelet scales, and the like.
- the frequency decomposition may comprise a time-frequency decomposition with a time dimension, in particular a short-time Fourier transformation.
- the time-frequency decomposition may also comprise a wavelet transformation, preferably a wavelet transformation based on a Gaussian wavelet, more preferably a first or second derivative of a Gaussian wavelet.
- the wavelet transformation may be scaled according to an expected dominant window 8. It may also be applied in different scales subsequently during searching for the dominant window 8.
- a window function in particular, a Hamming window
- the time-frequency decomposition may be, at least partially, averaged over the time dimension.
- the amplitude criterion here and preferably comprises the primary criterion that a sum of amplitudes in the dominant window 8 is at least equal to a percentage of a sum of amplitudes along a part of the frequency dimension f.
- the dominant window 8 is the smallest window comprising for example 15 percent of the total power of the power spectral density spectrum of the ECG data 1.
- the percentage of the sum of amplitudes may be pre-defined. It may be constant, for example always 15 percent but may also depend on the ECG data 1, in particular, the atrial fibrillation data 5 and then, for example, the total power of the power spectral density spectrum. It may be mentioned again that in a continuous spectrum like the one shown in Fig. 2 the sum could be an integral.
- the percentage of the sum of amplitudes can be a percentage of the total frequency dimension f and it may be pre-defined.
- the part of the frequency dimension f could comprise only a physiological part or any other part of the frequency dimension f chosen in particular to exclude possible problem frequencies like powerline interference frequencies or harmonics.
- the primary criterion may also be that a sum of amplitudes in the dominant window 8 and harmonic frequencies of the dominant window is at least equal to a percentage of a sum of amplitudes along a part of the frequency dimension f.
- the amplitude criterion may comprise a boundary condition.
- the boundary condition can be an absolute condition like the amplitude dropping below a pre-defined value or a value defined relative to the total power or a power peak or the like.
- the boundary condition is a differential boundary condition and preferably the boundary of the dominant window 8 is set to a local minimum.
- the amplitude criterion may further or alternatively comprise the secondary criterion that the dominant window 8 is the smallest window for fulfilling the primary criterion. With all criteria, the required search precision may be reduced.
- the control system 2 may conduct further analysis.
- the control system 2 identifies a dominant frequency 10 based on and in particular in the dominant window 8 and classifies the atrial fibrillation based on the dominant frequency 10.
- known methods to use the dominant frequency 10 may be used with this newly identified dominant frequency 10.
- the dominant frequency 10 is the centre, defined as the middle between the boundaries, of the dominant window 8. It may alternatively be the boundary of a, in particular pre-defined, percentile of the amplitudes of the dominant window 8 or a frequency associated with an average value, in particular the mean value or the median value, of the amplitudes of the dominant window 8.
- the dominant frequency 10 is not the peak frequency, leading to a different result than known algorithms.
- control system 2 may carry out a plausibility check for the dominant window 8 and/or the dominant frequency 10.
- This plausibility check comprises checking if the dominant window 8 and/or the dominant frequency 10 are inside a physiologically plausible frequency band. If the plausibility check is negative, the control system 2 may resort to a different search method and in particular identify a second-best candidate as the dominant window 8.
- the control system 2 analyzes the width 9 of the dominant window 8 and classifies the atrial fibrillation based on this analysis. Reverting to the example, if the dominant window 8 is the smallest window fulfilling the amplitude criterion, a small dominant window 8 may be indicative for low complexity of atrial fibrillation.
- the control system 2 can identify harmonic dominant windows as multiples of the frequency values of the dominant window 8 and here and preferably analyzes the harmonic dominant windows and classifies the atrial fibrillation based on the harmonic dominant windows. For example, a high power density inside the harmonic dominant windows could be used as an indicator for a good dominant window 8 estimation. Not being able to identify harmonic dominant windows could be an indicator for a high signal complexity which could be based on bad signal processing, but also on high atrial fibrillation complexity. These reasons can be separated by further analysis.
- control system 2 analyses skewness and/or kurtosis of the amplitude dimension a inside the dominant window 8, preferably around the dominant frequency 10, and classifies the atrial fibrillation based on the skewness and/or kurtosis.
- the classification of atrial fibrillation may comprise a presence or absence of the atrial fibrillation.
- the classification of the atrial fibrillation may further or alternatively comprise a severity indicator of the atrial fibrillation. This severity indicator may comprise a likelihood of success of ablation therapy.
- the method could also be used for a long time ECG to analyze the frequency of atrial fibrillation episodes and their duration.
- the classification may be or include a quantification of atrial fibrillation, in particular the severity indicator.
- the ECG data 1 may be body surface ECG data. Other preferred embodiments include the ECG data 1 being intracardiac or subcutaneous ECG data 1. If the ECG data 1 is intracardiac data, its measurement may preferably be unipolar or bipolar.
- the control system 2 may comprise an electrical input interface 11 connectable to electrodes 12 and adapted to measure the ECG data 1.
- Fig. 1 there are shown only three electrodes 12 which are used to measure a single-channel ECG. However, other ECGs and in particular a 12-channel ECG may be used.
- the ECG data 1 can then be one of those channels or a mixture, particularly a mean value, of multiple channels.
- the electrodes 12 are part of a wearable, in particular a smartwatch, and/or a smartphone and/or an implant and/or for the ECG data 1 to be ECG data 1 measured by a wearable and/or smartphone and/or implant.
- control system 2 comprises electrodes 12 connected to the electrical input interface 11 and a patient, here the user U. It is preferred that the surface ECG data 1 is measured via the electrodes 12.
- a pre-processing step 13 It is preferred that in the pre-processing step 13 the control system 2 processes the ECG data 1 to remove noise, preferably by using non-linear filtering, in particular median filtering, and/or to remove powerline interference data 14, in particular at 50Hz or 60Hz and harmonic frequencies of 50Hz or 60Hz, preferably using an adaptive notch filter. As shown, the pre-processing is preferably done prior to the ventricular component removal step 3 and/or the decomposition step.
- the ventricular component removal step 3 here and preferably comprises a QRS removal and preferably a T-wave filtering.
- the QRS removal is preferably based on the subtraction of a template 6 of a QRS complex. This template 6 may be subtracted from the ECG data 1 and the time domain. It has been found that in some instances a QRS removal is advantageous over a QRST removal.
- the T-wave is not always fully dependent on the QRS complex. Especially when using a template 6 for subtracting it can be advantageous to only subtract the QRS complex and filter the T-wave by a different method or with a different template 6.
- the T-wave filtering is a non-linear t-wave filtering.
- the ventricular component removal step 3 may comprise a QRST removal, preferably also based on a template 6.
- QRST removal preferably also based on a template 6.
- the QRS removal or QRST removal comprises a grouping of QRS or QRST complexes contained in the ECG data 1 into at least two different morphology groups, creating a QRS or QRST template 15 for at least two of the morphology groups and removing the QRS or QRST complexes of the respective morphology groups with the respective templates 15.
- Fig. 1 there are shown three different templates 15. The necessary number of templates 15 may be detected automatically.
- control system 2 may analyze the ECG data 1 in the time domain using a time domain analysis after removing the ventricular components 4 and additionally classifies the atrial fibrillation based on the time domain analysis.
- time domain analysis comprises a sample entropy analysis and/or a principle component analysis and/or a wave amplitude analysis and/or a wave correlation analysis. These may be used to generally judge the complexity of the atrial fibrillation in the time domain.
- control system 2 for performing the proposed method is proposed.
- the control system 2 may comprise the electrical input interface 11 and preferably electrodes 12.
Landscapes
- Health & Medical Sciences (AREA)
- Life Sciences & Earth Sciences (AREA)
- Engineering & Computer Science (AREA)
- Cardiology (AREA)
- Physics & Mathematics (AREA)
- Animal Behavior & Ethology (AREA)
- Public Health (AREA)
- Biomedical Technology (AREA)
- Heart & Thoracic Surgery (AREA)
- Medical Informatics (AREA)
- Molecular Biology (AREA)
- Surgery (AREA)
- Biophysics (AREA)
- General Health & Medical Sciences (AREA)
- Pathology (AREA)
- Veterinary Medicine (AREA)
- Artificial Intelligence (AREA)
- Computer Vision & Pattern Recognition (AREA)
- Physiology (AREA)
- Psychiatry (AREA)
- Signal Processing (AREA)
- Evolutionary Computation (AREA)
- Fuzzy Systems (AREA)
- Mathematical Physics (AREA)
- Measurement And Recording Of Electrical Phenomena And Electrical Characteristics Of The Living Body (AREA)
Description
- The invention relates to a method for classifying atrial fibrillation by analyzing ECG data via a control system according to the general part of
claim 1 and a control system for performing such a method according to claim 16. - Known methods and systems for classifying atrial fibrillation can be found e.g. in
US 2013/197380 A1 ,CN 111 449 647 A ,WO 2008/035070 A2 , andEP 3 020 333 A1 - Electrically, atrial fibrillation is the chaotic activation of muscle cells of the atria.
- During atrial fibrillation, the atria only minimally contribute to the function of the heart. Atrial fibrillation, therefore, reduces the output of the heart but is not imminently dangerous. However, when becoming chronical, atrial fibrillation is correlated with increased morbidity and mortality. One treatment option for atrial fibrillation is ablation therapy. Ablation therapy is the destruction of the cells that allow electrical wave reentry to reduce chaotic activation of the atrial muscle cells.
- The success rate of and strategy for atrial fibrillation ablation heavily depends on the level of complexity of the electrical conduction through the atria. If complexity is low, ablation of the usual reentry paths has a high chance of success. If complexity is higher, additional electrical mapping of activation paths can be used. Independent of the treatment, classifying the complexity of atrial fibrillation allows patient-specific treatment and outcome prediction of ablation therapy.
- One of the promising methods for classifying atrial fibrillation is calculating the dominant frequency of the electrical activation of the atria from a body surface ecg. Generally said, dominant frequency determination often uses the steps of isolating atrial activation from ECG data and analyzing a frequency spectrum of the remaining atrial signal data. Known methods (
US 5,772,604 A ) detect a peak frequency in the spectrum of the atrial signal data. While these methods yield promising results, there is still room for improving the classification of atrial fibrillation by providing new classification methods. - It is therefore an object of the present invention to provide an improved method for classifying atrial fibrillation yielding more robust results.
- The above-noted problem is solved for a method with the features of the general part of
claim 1 by the features of the characterizing part ofclaim 1. - The main realization of the present invention is that atrial activation is not adequately described by a single peak or main frequency but in itself a complex, instable and rapidly changing chaotic phenomenon. Looking for a single dominant frequency is therefore not an optimal way of describing the physiological reality. The central realization in the present case is that atrial fibrillation can be characterized by searching for a window of frequencies representing the dominant part of the atrial fibrillation.
- After decomposing the ECG data thereby generating frequency data comprising a frequency dimension and an amplitude dimension, a dominant window can be found by searching in the frequency dimension for a window meeting an amplitude criterion based on a sum of amplitudes inside the dominant window.
- In this way, it becomes possible for a control system to directly search for a part of the frequency dimension, the dominant window, which in particular contains a pre-defined part of the signal power, instead of looking for a single frequency with the maximum power. This method is more robust against random and/or temporary peaks of power in less relevant frequencies.
- In detail, it is proposed that in an analysis step the control system identifies in the frequency data a dominant window having a width in the frequency dimension and meeting an amplitude criterion, that the amplitude criterion is based on a sum of amplitudes inside the dominant window, that the control system identifies the dominant window by searching on at least a section, in particular a pre-defined section, of the frequency dimension for a window fulfilling the amplitude criterion and that based on the dominant window the control system determines the classification of atrial fibrillation in the ECG data.
- While it is known from previous methods to look for a window around the found dominant frequency, presently the window is found by searching on at least a section of the frequency dimension and not by defining the window around a dominant frequency.
- In a preferred embodiment according to
claim 2 ventricular components are removed from the ECG data to focus the analysis on fibrillation waves. In another embodiment according toclaim 3, the amplitude dimension is an energy density or power density dimension. The frequency distribution of the power of the atrial fibrillation signal inside the ECG is directly related to the complexity of the atrial fibrillation. The same is true for the mathematically dependent signal energy. - Claim 4 names preferred frequency decompositions. All of these methods for frequency decomposition have different strengths and can be used in varying embodiments of the proposed method. The Fourier transformation and the Welch method impose less restrictions on the signal to be analyzed compared to other methods and are therefore also well suited for analyzing the chaotic atrial fibrillation waves. Model-based decompositions like the autoregressive moving average based decomposition again provide the possibility to adapt the decomposition to expected atrial fibrillation waves.
- As atrial fibrillation has components that vary rapidly over time, in another preferred embodiment according to claim 5, using a time-frequency decomposition is proposed. In this way, it becomes possible to separate time-stable and non-stable components of the atrial fibrillation waves. In particular, the wavelet transformation allows specifically choosing a wavelet according to expected fibrillation waves and adapting the coarseness of the transformation specifically to the purpose of searching for a dominant window in a section of the frequency dimension.
- According to claim 6 in one embodiment, the amplitude criterion may comprise a primary criterion that a sum of amplitudes in the dominant window is at least equal to a percentage of a sum of amplitudes along a part of the frequency dimension. Preferably in this way, the dominant window can be defined as a window containing a pre-defined percentage of the total power of the signal. However, other mathematically related concepts are equally preferred. For example, the power density spectrum could be a normalized or otherwise adapted power density spectrum. In this way, instead of searching for a single power spike, a search for a power band is conducted.
-
Claim 7 relates to defining the width of the dominant window by using a boundary condition. In this way, further information about the signal can be included in the dominant window. For example, a small dominant window containing a large amount of power may be indicative for a less complex atrial fibrillation. - It may be useful or necessary to identify a single dominant frequency for classifying atrial fibrillation. According to an embodiment described in
claim 8, a dominant frequency can be identified based on the dominant window. - Depending on the algorithm used for defining the width of the dominant window, it may be advantageous to analyze the width of the dominant window and classify the atrial fibrillation based on this analysis as described in
claim 9. Mostly a wider dominant window implies higher complexity of the atrial fibrillation. Further analysis of the dominant window, as also described inclaim 9, may include looking at harmonics of the frequency values of the dominant window as harmonic dominant windows. In particular, the power contained in these harmonic dominant windows may be related to atrial fibrillation complexity. - Further preferred ways of analyzing the frequency data inside the dominant window may include analyzing skewness and/or kurtosis as named in
claim 10. Skewness and kurtosis contain additional information about the primary frequencies of atrial fibrillation and their amplitude. - According to an embodiment, described in
claim 11, the classification of atrial fibrillation may comprise a presence or absence and preferably a severity indicator of the atrial fibrillation. In particular, the severity of atrial fibrillation is an important factor for deciding for or against ablation therapy and the used ablation method. -
Claim 12 relates to the electrical measurement environment with the preferred possibility of using a body-surface ECG. Body-surface ECG data combines high precision with low invasion. - Particularly useful pre-processing steps for the proposed method are named in
claim 13. These include removing noise with non-linear filtering and removing powerline interference data. The, preferably subsequent, ventricular component removal step may comprise a QRS or QRST removal as described inclaim 14. Either may be combined with a morphology grouping to adapt to varying QRST complex morphology. These variations in QRST complex morphology can for example be caused by the atrial fibrillation itself. As atrial fibrillation inhibits the physiological electrical conduction from the sinus node to the ventricles, ventricular activity during atrial fibrillation may have different physiological causes resulting in two or more sharply different morphology groups each related to their physiological cause. - Further information on the atrial fibrillation may be inferred from additional analysis of the time domain as described in claim 15.
- Another teaching according to claim 16, which is of equal importance, is directed to a control system for performing the proposed method. All explanations given with respect to the proposed method are fully applicable.
- In the following, an embodiment of the invention is explained with respect to the drawings. The drawings show
- Fig. 1
- steps of the proposed method applied in the time domain and
- Fig. 2
- a frequency spectrum of the ECG data.
- The proposed method is used for classifying atrial fibrillation by analysing
ECG data 1 via acontrol system 2. InFig. 1 thecontrol system 2 is shown schematically as acontrol system 2 comprising hardware connected to a user U. In this case, thecontrol system 2 measures theECG data 1 as a single-channel ECG. However, theECG data 1 may also comprise one or more channels of a multi-channel ECG. Physically measuring theECG data 1 is not necessarily comprised by the proposed method, such that thecontrol system 2 may also process ECG data measured by another system separate from thecontrol system 2. Thecontrol system 2 therefore also may be a general-purpose computer, cloud-based or the like, and configured to perform the proposed method. - In a preferred embodiment as shown in the figures, the method may comprise a ventricular
component removal step 3 in which thecontrol system 2 processes theECG data 1 to remove ventricular components 4 from theECG data 1. The ventricular components 4 may be mostly QRS or QRST complex data. As the more powerful part of the activation of the heart, removing the ventricular components 4 from theECG data 1 allows focussing the analysis onto atrial signal data 5 contained in theECG data 1.Fig. 1 shows the ventricularcomponent removal step 3 in the bottom part. The top part ofFig. 1 refers to a pre-processing of theECG data 1 which is explained further below. In this case, the ventricularcomponent removal step 3 comprises a subtraction of a template 6. This will also be explained further below. It is equally preferred to use different methods of removing some or all ventricular components 4. In particular, the ventricular component removal step may comprise the complete removal of sections of theECG data 1 containing the QRS or QRST complex. The method may then comprise analysing one or more sections of the ECG data between QRS or QRST complexes. To acquire higher frequency resolution, known methods like zero padding or known methods for connecting the signal sections may be used. - As a further step, preferably subsequent step to the
removal step 3, the method comprises a decomposition step which, due to its abstract nature, is not shown inFig. 1 . In the decomposition step, thecontrol system 2 decomposes theECG data 1 by a frequency decomposition thereby generatingfrequency data 7 shown inFig. 2 . Thefrequency data 7 may in particular be a frequency spectrum as shown. Thefrequency data 7 comprises a frequency dimension f and an amplitude dimension a. The frequency decomposition may be any suitable frequency decomposition. The frequency dimension f may be separated into scales instead of "frequencies" according to the narrow physical meaning. The amplitude dimension a may represent a physical parameter like power density but may also be a purely theoretical dimension. - It is essential that in an analysis step, which due to its abstract nature is also not shown in
Fig. 1 as such, thecontrol system 2 identifies in the frequency data 7 adominant window 8 having awidth 9 in the frequency dimension f and meeting an amplitude criterion. Thedominant window 8 is a part of the frequency dimension f found by looking for the amplitude criterion. Thewidth 9 of thedominant window 8 may be pre-defined or variable. Thedominant window 8 includes at least two, preferably at least 5, more preferably at least 10, frequencies or frequency bins in the frequency dimension f. - It is further essential, that the amplitude criterion is based on a sum of amplitudes inside the
dominant window 8. Here and in the following the term "sum" includes calculating an integral along the frequency dimension f even though the amplitudes will usually be defined discreetly. It may also comprise any other mathematical concept leading to a value representing the sum, like calculating a mean value and the like. In the preferred embodiment, the sum of amplitudes is based on a real addition of the amplitudes and/or is the sum of all amplitudes inside thedominant window 8. - It is further essential, that the
control system 2 identifies thedominant window 8 by searching on at least a section, in particular a pre-defined section, of the frequency dimension f for a window fulfilling the amplitude criterion. The search may be conducted on the whole frequency dimension f. Thecontrol system 2 may use any suitable search method. The search method may be optimized for the amplitude criterion to avoid more complex calculations on parts of the frequency dimension f that are easily excludable. The pre-defined section of the frequency dimension f may, for example, exclude non-physiological frequencies, for example, frequencies higher than 10Hz. - It is further essential that based on the
dominant window 8 thecontrol system 2 determines the classification of atrial fibrillation in theECG data 1. - Here and preferably, the amplitude dimension a is an energy density or power density dimension p. This dimension may be normalized or otherwise processed without changing its information content. In the embodiment shown in
Fig. 2 and preferred as such, thefrequency data 7 comprises a power spectral density spectrum of theECG data 1. - The frequency decomposition may additionally or alternatively comprise a Fourier transformation and/or a Welch method. The Fourier transformation and the Welch method are well known to the person skilled in the art. The frequency decomposition may also comprise a model-based decomposition, preferably an autoregressive moving average based decomposition. Such a model-based decomposition can be adapted specifically to the atrial signal data 5. It is evident that presently a broad definition of "frequency" is used, including scales, in particular Wavelet scales, and the like.
- The frequency decomposition may comprise a time-frequency decomposition with a time dimension, in particular a short-time Fourier transformation. The time-frequency decomposition may also comprise a wavelet transformation, preferably a wavelet transformation based on a Gaussian wavelet, more preferably a first or second derivative of a Gaussian wavelet. The wavelet transformation may be scaled according to an expected
dominant window 8. It may also be applied in different scales subsequently during searching for thedominant window 8. - By calculating multiple frequency decompositions along the time dimension of the
ECG data 1 rapidly changing transient components of the atrial activation can be identified and analyzed and/or removed. For the frequency-decomposition, in particular the time-frequency decomposition, a window function, in particular, a Hamming window, may be used. The time-frequency decomposition may be, at least partially, averaged over the time dimension. - With regards to
Fig. 2 , the amplitude criterion in the preferred embodiment will now be explained. The amplitude criterion here and preferably comprises the primary criterion that a sum of amplitudes in thedominant window 8 is at least equal to a percentage of a sum of amplitudes along a part of the frequency dimension f. This can be better understood by way of example. Here, thedominant window 8 is the smallest window comprising for example 15 percent of the total power of the power spectral density spectrum of theECG data 1. - Based on this example but speaking generally, the percentage of the sum of amplitudes may be pre-defined. It may be constant, for example always 15 percent but may also depend on the
ECG data 1, in particular, the atrial fibrillation data 5 and then, for example, the total power of the power spectral density spectrum. It may be mentioned again that in a continuous spectrum like the one shown inFig. 2 the sum could be an integral. The percentage of the sum of amplitudes can be a percentage of the total frequency dimension f and it may be pre-defined. As an alternative, the part of the frequency dimension f could comprise only a physiological part or any other part of the frequency dimension f chosen in particular to exclude possible problem frequencies like powerline interference frequencies or harmonics. - The primary criterion may also be that a sum of amplitudes in the
dominant window 8 and harmonic frequencies of the dominant window is at least equal to a percentage of a sum of amplitudes along a part of the frequency dimension f. - The amplitude criterion may comprise a boundary condition. The boundary condition can be an absolute condition like the amplitude dropping below a pre-defined value or a value defined relative to the total power or a power peak or the like. Preferably the boundary condition is a differential boundary condition and preferably the boundary of the
dominant window 8 is set to a local minimum. - The amplitude criterion may further or alternatively comprise the secondary criterion that the
dominant window 8 is the smallest window for fulfilling the primary criterion. With all criteria, the required search precision may be reduced. - After finding the
dominant window 8 thecontrol system 2 may conduct further analysis. Preferably thecontrol system 2 identifies adominant frequency 10 based on and in particular in thedominant window 8 and classifies the atrial fibrillation based on thedominant frequency 10. For example, known methods to use thedominant frequency 10 may be used with this newly identifieddominant frequency 10. In the embodiment shown inFig. 2 , thedominant frequency 10 is the centre, defined as the middle between the boundaries, of thedominant window 8. It may alternatively be the boundary of a, in particular pre-defined, percentile of the amplitudes of thedominant window 8 or a frequency associated with an average value, in particular the mean value or the median value, of the amplitudes of thedominant window 8. As can be seen inFig. 2 , in this example thedominant frequency 10 is not the peak frequency, leading to a different result than known algorithms. - In general, the
control system 2 may carry out a plausibility check for thedominant window 8 and/or thedominant frequency 10. This plausibility check comprises checking if thedominant window 8 and/or thedominant frequency 10 are inside a physiologically plausible frequency band. If the plausibility check is negative, thecontrol system 2 may resort to a different search method and in particular identify a second-best candidate as thedominant window 8. - In the cases where the
width 9 of thedominant window 8 is not pre-defined as a constant, it may be the case that thecontrol system 2 analyzes thewidth 9 of thedominant window 8 and classifies the atrial fibrillation based on this analysis. Reverting to the example, if thedominant window 8 is the smallest window fulfilling the amplitude criterion, a smalldominant window 8 may be indicative for low complexity of atrial fibrillation. - The
control system 2 can identify harmonic dominant windows as multiples of the frequency values of thedominant window 8 and here and preferably analyzes the harmonic dominant windows and classifies the atrial fibrillation based on the harmonic dominant windows. For example, a high power density inside the harmonic dominant windows could be used as an indicator for a gooddominant window 8 estimation. Not being able to identify harmonic dominant windows could be an indicator for a high signal complexity which could be based on bad signal processing, but also on high atrial fibrillation complexity. These reasons can be separated by further analysis. - Here and preferably the
control system 2 analyses skewness and/or kurtosis of the amplitude dimension a inside thedominant window 8, preferably around thedominant frequency 10, and classifies the atrial fibrillation based on the skewness and/or kurtosis. - If the method is applied to
ECG data 1 of users U that have not yet been diagnosed in relation to atrial fibrillation, it may be interesting to diagnose atrial fibrillation in a first step. Hence, in such a case, the classification of atrial fibrillation may comprise a presence or absence of the atrial fibrillation. The classification of the atrial fibrillation may further or alternatively comprise a severity indicator of the atrial fibrillation. This severity indicator may comprise a likelihood of success of ablation therapy. The method could also be used for a long time ECG to analyze the frequency of atrial fibrillation episodes and their duration. The classification may be or include a quantification of atrial fibrillation, in particular the severity indicator. - As indicated in
Fig. 1 , theECG data 1 may be body surface ECG data. Other preferred embodiments include theECG data 1 being intracardiac orsubcutaneous ECG data 1. If theECG data 1 is intracardiac data, its measurement may preferably be unipolar or bipolar. - The
control system 2 may comprise anelectrical input interface 11 connectable toelectrodes 12 and adapted to measure theECG data 1. InFig. 1 there are shown only threeelectrodes 12 which are used to measure a single-channel ECG. However, other ECGs and in particular a 12-channel ECG may be used. TheECG data 1 can then be one of those channels or a mixture, particularly a mean value, of multiple channels. Another preferred possibility is that theelectrodes 12 are part of a wearable, in particular a smartwatch, and/or a smartphone and/or an implant and/or for theECG data 1 to beECG data 1 measured by a wearable and/or smartphone and/or implant. - Here and preferably the
control system 2 compriseselectrodes 12 connected to theelectrical input interface 11 and a patient, here the user U. It is preferred that thesurface ECG data 1 is measured via theelectrodes 12. - Also shown in
Fig. 1 is apre-processing step 13. It is preferred that in thepre-processing step 13 thecontrol system 2 processes theECG data 1 to remove noise, preferably by using non-linear filtering, in particular median filtering, and/or to removepowerline interference data 14, in particular at 50Hz or 60Hz and harmonic frequencies of 50Hz or 60Hz, preferably using an adaptive notch filter. As shown, the pre-processing is preferably done prior to the ventricularcomponent removal step 3 and/or the decomposition step. - The ventricular
component removal step 3 here and preferably comprises a QRS removal and preferably a T-wave filtering. The QRS removal is preferably based on the subtraction of a template 6 of a QRS complex. This template 6 may be subtracted from theECG data 1 and the time domain. It has been found that in some instances a QRS removal is advantageous over a QRST removal. The T-wave is not always fully dependent on the QRS complex. Especially when using a template 6 for subtracting it can be advantageous to only subtract the QRS complex and filter the T-wave by a different method or with a different template 6. Here and preferably the T-wave filtering is a non-linear t-wave filtering. - In other instances, the ventricular
component removal step 3 may comprise a QRST removal, preferably also based on a template 6. As morphologies ofECG data 1 vary between different persons, it may also be advantageous to implement both methods and compare the results for a single user U. - Shown in the left bottom part of
Fig. 1 is the preferred embodiment that the QRS removal or QRST removal comprises a grouping of QRS or QRST complexes contained in theECG data 1 into at least two different morphology groups, creating a QRS or QRST template 15 for at least two of the morphology groups and removing the QRS or QRST complexes of the respective morphology groups with the respective templates 15. InFig. 1 , there are shown three different templates 15. The necessary number of templates 15 may be detected automatically. - Further to the analysis described above, the
control system 2 may analyze theECG data 1 in the time domain using a time domain analysis after removing the ventricular components 4 and additionally classifies the atrial fibrillation based on the time domain analysis. Preferably the time domain analysis comprises a sample entropy analysis and/or a principle component analysis and/or a wave amplitude analysis and/or a wave correlation analysis. These may be used to generally judge the complexity of the atrial fibrillation in the time domain. - According to another teaching, a
control system 2 for performing the proposed method is proposed. Reference is made to all explanations given before. Thecontrol system 2 may comprise theelectrical input interface 11 and preferablyelectrodes 12. -
- 1
- ECG data
- 2
- control system
- 3
- ventricular component removal step
- 4
- ventricular components
- 5
- atrial signal data
- 6
- template
- 7
- frequency data
- 8
- dominant window
- 9
- width
- 10
- dominant frequency
- 11
- electrical input interface
- 12
- electrodes
- 13
- pre-processing step
- 14
- powerline interference data
- 15
- QRS template
- U
- user
- f
- frequency dimension
- a
- amplitude dimension
- p
- power density dimension
Claims (16)
- Method for classifying atrial fibrillation by analysing ECG data (1) via a control system (2),wherein in a decomposition step the control system (2) decomposes the ECG data (1) by a frequency decomposition thereby generating frequency data (7), in particular a frequency spectrum, comprising a frequency dimension (f) and an amplitude dimension (a),characterized inthat in an analysis step the control system (2) identifies in the frequency data (7) a dominant window (8) having a width (9) in the frequency dimension (f) and meeting an amplitude criterion, that the dominant window (8) includes at least two frequencies or frequency bins in the frequency dimension (f), that the amplitude criterion is based on a sum of amplitudes inside the dominant window (8), that the control system (2) identifies the dominant window (8) by searching on at least a section, in particular a pre-defined section, of the frequency dimension (f) for a window fulfilling the amplitude criterion andthat based on the dominant window (8) the control system (2) determines the classification of atrial fibrillation in the ECG data (1).
- Method according to claim 1, characterized in that in a ventricular component removal step (3) the control system (2) processes the ECG data (1) to remove ventricular components (4) from the ECG data (1).
- Method according to claim 1 or 2, characterized in that the amplitude dimension (a) is an energy density or power density dimension (p), preferably, that the frequency data (7) comprises a power spectral density spectrum of the ECG data (1).
- Method according to one of the preceding claims, characterized in that the frequency decomposition comprises a Fourier transformation, and/or, that the frequency decomposition comprises a Welch method, and/or, that the frequency decomposition comprises a model-based decomposition, preferably an autoregressive moving average based decomposition.
- Method according to one of the preceding claims, characterized in that the frequency decomposition comprises a time-frequency decomposition with a time dimension, in particular a short time Fourier transformation and/or a Wavelet transformation, preferably that the time-frequency decomposition is, at least partly, averaged over the time dimension.
- Method according to one of the preceding claims, characterized in that the amplitude criterion comprises the primary criterion that a sum of amplitudes in the dominant window (8) is at least equal to an, in particular pre-defined, percentage of a sum of amplitudes along an, in particular pre-defined, part of the frequency dimension (f), preferably the total frequency dimension (f).
- Method according to claim 6, characterized in that the amplitude criterion comprises a boundary condition, in particular a differential boundary condition, and/or, that the amplitude criterion comprises the secondary criterion that the dominant window (8) is the smallest window fulfilling the primary criterion.
- Method according to one of the preceding claims, characterized in that the control system (2) identifies a dominant frequency (10) based on, in particular in, the dominant window (8) and classifies the atrial fibrillation based on the dominant frequency (10), preferably that the dominant frequency (10) is the centre of the dominant window (8) or the boundary of an, in particular pre-defined, percentile of the amplitudes of the dominant window (8) or a frequency associated with an average value, in particular the mean value or the median value, of the amplitudes of the dominant window (8).
- Method according to one of the preceding claims, characterized in that the control system (2) analyses the width (9) of the dominant window (8) and classifies the atrial fibrillation based on this analysis, and/or, that the control system (2) identifies harmonic dominant windows as multiples of the frequency values of the dominant window (8) and analyses the harmonic dominant windows and classifies the atrial fibrillation based on the harmonic dominant windows.
- Method according to one of the preceding claims, characterized in that the control system (2) analyses skewness and/or kurtosis of the amplitude dimension (a) inside the dominant window (8), preferably around the dominant frequency (10), and classifies the atrial fibrillation based on the skewness and/or kurtosis.
- Method according to one of the preceding claims, characterized in that the classification of atrial fibrillation comprises a presence or absence and/or a severity indicator of the atrial fibrillation, preferably that the severity indicator comprises a likelihood of success of ablation therapy
- Method according to one of the preceding claims, characterized in that the ECG data (1) is body surface ECG data (1) and/or intracardiac ECG data (1) and/or subcutaneous ECG data (1), and/or, that the control system (2) comprises an electrical input interface (11) connectable to electrodes (12) and adapted to measure the ECG data (1).
- Method according to one of the preceding claims, characterized in that in a pre-processing step (13) the control system (2) processes the ECG data (1) to remove noise using non-linear filtering, in particular median filtering and/or removing powerline interference data (14), in particular at 50 Hz or 60 Hz and harmonic frequencies of 50 Hz or 60 Hz, preferably using an adaptive notch filter.
- Method according to one of the preceding claims, characterized in that the ventricular component removal step (3) comprises a QRS removal and preferably a T-wave filtering, in particular a non-linear T-wave filtering, or a QRST removal, preferably that the QRS removal or QRST removal comprises a grouping of QRS or QRST complexes contained in the ECG data (1) into at least two different morphology groups, creating a QRS or QRST template (15) for at least two of the morphology groups and removing the QRS or QRST complexes of the respective morphology groups with the respective templates (15).
- Method according to one of the preceding claims, characterized in that the control system (2) analyses the ECG data (1) in the time domain using a time domain analysis after removing the ventricular components (4) and additionally classifies the atrial fibrillation based on the time domain analysis, preferably that the time domain analysis comprises a sample entropy analysis and/or a principal component analysis and/or a wave amplitude analysis and/or a wave correlation analysis.
- Control system for performing the method according to one of the preceding claims.
Priority Applications (6)
| Application Number | Priority Date | Filing Date | Title |
|---|---|---|---|
| ES20212255T ES2964930T3 (en) | 2020-12-07 | 2020-12-07 | Method for classifying atrial fibrillation |
| EP20212255.2A EP4008254B1 (en) | 2020-12-07 | 2020-12-07 | Method for classifying atrial fibrillation |
| PCT/EP2021/073107 WO2022122192A1 (en) | 2020-12-07 | 2021-08-20 | Method for classifying atrial fibrillation |
| JP2023534280A JP7572558B2 (en) | 2020-12-07 | 2021-08-20 | How to Classify Atrial Fibrillation |
| CN202180082342.0A CN116829051A (en) | 2020-12-07 | 2021-08-20 | Methods used to classify atrial fibrillation |
| US18/265,504 US20240115186A1 (en) | 2020-12-07 | 2021-08-20 | Method for classifying atrial fibrillation |
Applications Claiming Priority (1)
| Application Number | Priority Date | Filing Date | Title |
|---|---|---|---|
| EP20212255.2A EP4008254B1 (en) | 2020-12-07 | 2020-12-07 | Method for classifying atrial fibrillation |
Publications (3)
| Publication Number | Publication Date |
|---|---|
| EP4008254A1 EP4008254A1 (en) | 2022-06-08 |
| EP4008254B1 true EP4008254B1 (en) | 2023-10-04 |
| EP4008254C0 EP4008254C0 (en) | 2023-10-04 |
Family
ID=73740314
Family Applications (1)
| Application Number | Title | Priority Date | Filing Date |
|---|---|---|---|
| EP20212255.2A Active EP4008254B1 (en) | 2020-12-07 | 2020-12-07 | Method for classifying atrial fibrillation |
Country Status (6)
| Country | Link |
|---|---|
| US (1) | US20240115186A1 (en) |
| EP (1) | EP4008254B1 (en) |
| JP (1) | JP7572558B2 (en) |
| CN (1) | CN116829051A (en) |
| ES (1) | ES2964930T3 (en) |
| WO (1) | WO2022122192A1 (en) |
Families Citing this family (1)
| Publication number | Priority date | Publication date | Assignee | Title |
|---|---|---|---|---|
| GB202414394D0 (en) * | 2024-10-01 | 2024-11-13 | Univ Edinburgh | Method and system for phenotyping atrial fibrillation |
Family Cites Families (13)
| Publication number | Priority date | Publication date | Assignee | Title |
|---|---|---|---|---|
| US5609158A (en) * | 1995-05-01 | 1997-03-11 | Arrhythmia Research Technology, Inc. | Apparatus and method for predicting cardiac arrhythmia by detection of micropotentials and analysis of all ECG segments and intervals |
| US5772604A (en) | 1997-03-14 | 1998-06-30 | Emory University | Method, system and apparatus for determining prognosis in atrial fibrillation |
| US6615075B2 (en) * | 2000-03-15 | 2003-09-02 | The Regents Of The University Of California | QRST subtraction using an adaptive template for analysis of TU wave obscured atrial activity |
| SE0103312D0 (en) * | 2001-10-04 | 2001-10-04 | Siemens Elema Ab | Method of and Apparatus for Deriving Indices Characterizing Atrial Arrhythmias |
| GB0618522D0 (en) * | 2006-09-20 | 2006-11-01 | Imp Innovations Ltd | Atrial fibrillation analysis |
| EP2720751B1 (en) | 2011-06-15 | 2015-04-15 | Max-Planck-Gesellschaft zur Förderung der Wissenschaften e.V. | Apparatus for and method of terminating a high frequency arrhythmic electric state of a biological tissue |
| US9037223B2 (en) * | 2012-01-10 | 2015-05-19 | The Regents Of The University Of Michigan | Atrial fibrillation classification using power measurement |
| US9282908B2 (en) * | 2013-01-16 | 2016-03-15 | University Of Vermont | Methods and systems for optimizing lesion placement to minimize and treat cardiac fibrillation |
| JP2014171589A (en) | 2013-03-07 | 2014-09-22 | Seiko Epson Corp | Atrial fibrillation analyzation equipment and program |
| EP3020333A1 (en) * | 2014-11-17 | 2016-05-18 | Fundación Centro Nacional de Investigaciones Cardiovasculares Carlos III (CNIC) | Method of predicting or prognosticating neurological performance in patients who have suffered a cardiac arrest and optionally comatose status due to ventricular fibrillation |
| JP2016185288A (en) | 2015-03-27 | 2016-10-27 | シャープ株式会社 | Portable electrocardiograph and computer program |
| CN111449647B (en) * | 2020-03-18 | 2023-05-02 | 广州视源电子科技股份有限公司 | Electrocardiogram identification method and device, storage medium and electronic equipment |
| CN111449622A (en) * | 2020-03-20 | 2020-07-28 | 复旦大学 | An Atrial Fibrillation Recognition System Based on BCG Detection |
-
2020
- 2020-12-07 EP EP20212255.2A patent/EP4008254B1/en active Active
- 2020-12-07 ES ES20212255T patent/ES2964930T3/en active Active
-
2021
- 2021-08-20 JP JP2023534280A patent/JP7572558B2/en active Active
- 2021-08-20 US US18/265,504 patent/US20240115186A1/en active Pending
- 2021-08-20 WO PCT/EP2021/073107 patent/WO2022122192A1/en not_active Ceased
- 2021-08-20 CN CN202180082342.0A patent/CN116829051A/en active Pending
Also Published As
| Publication number | Publication date |
|---|---|
| EP4008254A1 (en) | 2022-06-08 |
| US20240115186A1 (en) | 2024-04-11 |
| ES2964930T3 (en) | 2024-04-10 |
| JP2023552562A (en) | 2023-12-18 |
| EP4008254C0 (en) | 2023-10-04 |
| WO2022122192A1 (en) | 2022-06-16 |
| JP7572558B2 (en) | 2024-10-23 |
| CN116829051A (en) | 2023-09-29 |
Similar Documents
| Publication | Publication Date | Title |
|---|---|---|
| Jekova et al. | Real time detection of ventricular fibrillation and tachycardia | |
| Alcaraz et al. | Classification of paroxysmal and persistent atrial fibrillation in ambulatory ECG recordings | |
| Anuradha et al. | CARDIAC ARRHYTHMIA CLASSIFICATION USING FUZZY CLASSIFIERS. | |
| Alcaraz et al. | Sample entropy of the main atrial wave predicts spontaneous termination of paroxysmal atrial fibrillation | |
| KR20120116213A (en) | System for discriminating premature ventricular contraction, method for discriminating premature ventricular contraction and the recording media storing the program performing the said method | |
| Kumari et al. | Optimization of multi-layer perceptron neural network using genetic algorithm for arrhythmia classification | |
| Manik et al. | Classification of electrocardiogram signals using principal component analysis and levenberg marquardt backpropagation for detection ventricular tachyarrhythmia | |
| Krasteva et al. | Assessment of ECG frequency and morphology parameters for automatic classification of life-threatening cardiac arrhythmias | |
| Riasi et al. | Prediction of ventricular tachycardia using morphological features of ECG signal | |
| US20240115186A1 (en) | Method for classifying atrial fibrillation | |
| Mykoliuk et al. | Machine learning methods in ECG classification | |
| Maji et al. | Characterization of cardiac arrhythmias by variational mode decomposition technique | |
| Othman et al. | A new semantic mining approach for detecting ventricular tachycardia and ventricular fibrillation | |
| Prabhakararao et al. | Efficient and robust ventricular tachycardia and fibrillation detection method for wearable cardiac health monitoring devices | |
| Sahoo et al. | Classification of heart rhythm disorders using instructive features and artificial neural networks | |
| Luengo et al. | Blind analysis of atrial fibrillation electrograms: a sparsity-aware formulation | |
| Li et al. | Detecting ventricular fibrillation by fast algorithm of dynamic sample entropy | |
| Tun et al. | Analysis of computer aided identification system for ECG characteristic points | |
| Rao et al. | QRS detection of ECG-a statistical analysis | |
| Thatipelli et al. | Classification of myocardial infarction using discrete wavelet transform and support vector machine | |
| Chin et al. | A fast critical arrhythmic ECG waveform identification method using cross-correlation and multiple template matching | |
| Khandait et al. | ECG signal processing using classifier to analyses cardiovascular disease | |
| EP3248542A1 (en) | Method for automatic detection of atrial fibrillation and flutter | |
| Arumugam et al. | Wavelet based detection of ventricular arrhythmias with neural network classifier | |
| Gossler et al. | A wavelet generated from Fibonacci-coefficient polynomials and its application in cardiac arrhythmia classification |
Legal Events
| Date | Code | Title | Description |
|---|---|---|---|
| PUAI | Public reference made under article 153(3) epc to a published international application that has entered the european phase |
Free format text: ORIGINAL CODE: 0009012 |
|
| STAA | Information on the status of an ep patent application or granted ep patent |
Free format text: STATUS: THE APPLICATION HAS BEEN PUBLISHED |
|
| AK | Designated contracting states |
Kind code of ref document: A1 Designated state(s): AL AT BE BG CH CY CZ DE DK EE ES FI FR GB GR HR HU IE IS IT LI LT LU LV MC MK MT NL NO PL PT RO RS SE SI SK SM TR |
|
| STAA | Information on the status of an ep patent application or granted ep patent |
Free format text: STATUS: REQUEST FOR EXAMINATION WAS MADE |
|
| 17P | Request for examination filed |
Effective date: 20221111 |
|
| RBV | Designated contracting states (corrected) |
Designated state(s): AL AT BE BG CH CY CZ DE DK EE ES FI FR GB GR HR HU IE IS IT LI LT LU LV MC MK MT NL NO PL PT RO RS SE SI SK SM TR |
|
| STAA | Information on the status of an ep patent application or granted ep patent |
Free format text: STATUS: EXAMINATION IS IN PROGRESS |
|
| 17Q | First examination report despatched |
Effective date: 20230331 |
|
| GRAP | Despatch of communication of intention to grant a patent |
Free format text: ORIGINAL CODE: EPIDOSNIGR1 |
|
| STAA | Information on the status of an ep patent application or granted ep patent |
Free format text: STATUS: GRANT OF PATENT IS INTENDED |
|
| INTG | Intention to grant announced |
Effective date: 20230717 |
|
| GRAS | Grant fee paid |
Free format text: ORIGINAL CODE: EPIDOSNIGR3 |
|
| GRAA | (expected) grant |
Free format text: ORIGINAL CODE: 0009210 |
|
| STAA | Information on the status of an ep patent application or granted ep patent |
Free format text: STATUS: THE PATENT HAS BEEN GRANTED |
|
| RAP3 | Party data changed (applicant data changed or rights of an application transferred) |
Owner name: CATHVISION APS |
|
| AK | Designated contracting states |
Kind code of ref document: B1 Designated state(s): AL AT BE BG CH CY CZ DE DK EE ES FI FR GB GR HR HU IE IS IT LI LT LU LV MC MK MT NL NO PL PT RO RS SE SI SK SM TR |
|
| REG | Reference to a national code |
Ref country code: GB Ref legal event code: FG4D |
|
| REG | Reference to a national code |
Ref country code: CH Ref legal event code: EP |
|
| REG | Reference to a national code |
Ref country code: DE Ref legal event code: R096 Ref document number: 602020018566 Country of ref document: DE |
|
| REG | Reference to a national code |
Ref country code: IE Ref legal event code: FG4D |
|
| U01 | Request for unitary effect filed |
Effective date: 20231031 |
|
| U07 | Unitary effect registered |
Designated state(s): AT BE BG DE DK EE FI FR IT LT LU LV MT NL PT SE SI Effective date: 20231106 |
|
| U20 | Renewal fee for the european patent with unitary effect paid |
Year of fee payment: 4 Effective date: 20231219 |
|
| PG25 | Lapsed in a contracting state [announced via postgrant information from national office to epo] |
Ref country code: GR Free format text: LAPSE BECAUSE OF FAILURE TO SUBMIT A TRANSLATION OF THE DESCRIPTION OR TO PAY THE FEE WITHIN THE PRESCRIBED TIME-LIMIT Effective date: 20240105 |
|
| PG25 | Lapsed in a contracting state [announced via postgrant information from national office to epo] |
Ref country code: IS Free format text: LAPSE BECAUSE OF FAILURE TO SUBMIT A TRANSLATION OF THE DESCRIPTION OR TO PAY THE FEE WITHIN THE PRESCRIBED TIME-LIMIT Effective date: 20240204 |
|
| REG | Reference to a national code |
Ref country code: ES Ref legal event code: FG2A Ref document number: 2964930 Country of ref document: ES Kind code of ref document: T3 Effective date: 20240410 |
|
| PG25 | Lapsed in a contracting state [announced via postgrant information from national office to epo] |
Ref country code: IS Free format text: LAPSE BECAUSE OF FAILURE TO SUBMIT A TRANSLATION OF THE DESCRIPTION OR TO PAY THE FEE WITHIN THE PRESCRIBED TIME-LIMIT Effective date: 20240204 Ref country code: GR Free format text: LAPSE BECAUSE OF FAILURE TO SUBMIT A TRANSLATION OF THE DESCRIPTION OR TO PAY THE FEE WITHIN THE PRESCRIBED TIME-LIMIT Effective date: 20240105 |
|
| PG25 | Lapsed in a contracting state [announced via postgrant information from national office to epo] |
Ref country code: RS Free format text: LAPSE BECAUSE OF FAILURE TO SUBMIT A TRANSLATION OF THE DESCRIPTION OR TO PAY THE FEE WITHIN THE PRESCRIBED TIME-LIMIT Effective date: 20231004 Ref country code: PL Free format text: LAPSE BECAUSE OF FAILURE TO SUBMIT A TRANSLATION OF THE DESCRIPTION OR TO PAY THE FEE WITHIN THE PRESCRIBED TIME-LIMIT Effective date: 20231004 Ref country code: NO Free format text: LAPSE BECAUSE OF FAILURE TO SUBMIT A TRANSLATION OF THE DESCRIPTION OR TO PAY THE FEE WITHIN THE PRESCRIBED TIME-LIMIT Effective date: 20240104 Ref country code: HR Free format text: LAPSE BECAUSE OF FAILURE TO SUBMIT A TRANSLATION OF THE DESCRIPTION OR TO PAY THE FEE WITHIN THE PRESCRIBED TIME-LIMIT Effective date: 20231004 |
|
| REG | Reference to a national code |
Ref country code: DE Ref legal event code: R097 Ref document number: 602020018566 Country of ref document: DE |
|
| PG25 | Lapsed in a contracting state [announced via postgrant information from national office to epo] |
Ref country code: CZ Free format text: LAPSE BECAUSE OF FAILURE TO SUBMIT A TRANSLATION OF THE DESCRIPTION OR TO PAY THE FEE WITHIN THE PRESCRIBED TIME-LIMIT Effective date: 20231004 |
|
| PG25 | Lapsed in a contracting state [announced via postgrant information from national office to epo] |
Ref country code: SK Free format text: LAPSE BECAUSE OF FAILURE TO SUBMIT A TRANSLATION OF THE DESCRIPTION OR TO PAY THE FEE WITHIN THE PRESCRIBED TIME-LIMIT Effective date: 20231004 |
|
| PG25 | Lapsed in a contracting state [announced via postgrant information from national office to epo] |
Ref country code: SM Free format text: LAPSE BECAUSE OF FAILURE TO SUBMIT A TRANSLATION OF THE DESCRIPTION OR TO PAY THE FEE WITHIN THE PRESCRIBED TIME-LIMIT Effective date: 20231004 Ref country code: SK Free format text: LAPSE BECAUSE OF FAILURE TO SUBMIT A TRANSLATION OF THE DESCRIPTION OR TO PAY THE FEE WITHIN THE PRESCRIBED TIME-LIMIT Effective date: 20231004 Ref country code: RO Free format text: LAPSE BECAUSE OF FAILURE TO SUBMIT A TRANSLATION OF THE DESCRIPTION OR TO PAY THE FEE WITHIN THE PRESCRIBED TIME-LIMIT Effective date: 20231004 Ref country code: CZ Free format text: LAPSE BECAUSE OF FAILURE TO SUBMIT A TRANSLATION OF THE DESCRIPTION OR TO PAY THE FEE WITHIN THE PRESCRIBED TIME-LIMIT Effective date: 20231004 |
|
| REG | Reference to a national code |
Ref country code: CH Ref legal event code: PL |
|
| PLBE | No opposition filed within time limit |
Free format text: ORIGINAL CODE: 0009261 |
|
| STAA | Information on the status of an ep patent application or granted ep patent |
Free format text: STATUS: NO OPPOSITION FILED WITHIN TIME LIMIT |
|
| PG25 | Lapsed in a contracting state [announced via postgrant information from national office to epo] |
Ref country code: MC Free format text: LAPSE BECAUSE OF FAILURE TO SUBMIT A TRANSLATION OF THE DESCRIPTION OR TO PAY THE FEE WITHIN THE PRESCRIBED TIME-LIMIT Effective date: 20231004 |
|
| PG25 | Lapsed in a contracting state [announced via postgrant information from national office to epo] |
Ref country code: MC Free format text: LAPSE BECAUSE OF FAILURE TO SUBMIT A TRANSLATION OF THE DESCRIPTION OR TO PAY THE FEE WITHIN THE PRESCRIBED TIME-LIMIT Effective date: 20231004 |
|
| 26N | No opposition filed |
Effective date: 20240705 |
|
| REG | Reference to a national code |
Ref country code: IE Ref legal event code: MM4A |
|
| PG25 | Lapsed in a contracting state [announced via postgrant information from national office to epo] |
Ref country code: IE Free format text: LAPSE BECAUSE OF NON-PAYMENT OF DUE FEES Effective date: 20231207 |
|
| PG25 | Lapsed in a contracting state [announced via postgrant information from national office to epo] |
Ref country code: CH Free format text: LAPSE BECAUSE OF NON-PAYMENT OF DUE FEES Effective date: 20231231 |
|
| PG25 | Lapsed in a contracting state [announced via postgrant information from national office to epo] |
Ref country code: IE Free format text: LAPSE BECAUSE OF NON-PAYMENT OF DUE FEES Effective date: 20231207 Ref country code: CH Free format text: LAPSE BECAUSE OF NON-PAYMENT OF DUE FEES Effective date: 20231231 |
|
| U20 | Renewal fee for the european patent with unitary effect paid |
Year of fee payment: 5 Effective date: 20241223 |
|
| PG25 | Lapsed in a contracting state [announced via postgrant information from national office to epo] |
Ref country code: CY Free format text: LAPSE BECAUSE OF FAILURE TO SUBMIT A TRANSLATION OF THE DESCRIPTION OR TO PAY THE FEE WITHIN THE PRESCRIBED TIME-LIMIT; INVALID AB INITIO Effective date: 20201207 |
|
| PG25 | Lapsed in a contracting state [announced via postgrant information from national office to epo] |
Ref country code: HU Free format text: LAPSE BECAUSE OF FAILURE TO SUBMIT A TRANSLATION OF THE DESCRIPTION OR TO PAY THE FEE WITHIN THE PRESCRIBED TIME-LIMIT; INVALID AB INITIO Effective date: 20201207 |
|
| PG25 | Lapsed in a contracting state [announced via postgrant information from national office to epo] |
Ref country code: TR Free format text: LAPSE BECAUSE OF FAILURE TO SUBMIT A TRANSLATION OF THE DESCRIPTION OR TO PAY THE FEE WITHIN THE PRESCRIBED TIME-LIMIT Effective date: 20231004 |
|
| PGFP | Annual fee paid to national office [announced via postgrant information from national office to epo] |
Ref country code: GB Payment date: 20251219 Year of fee payment: 6 |
|
| U20 | Renewal fee for the european patent with unitary effect paid |
Year of fee payment: 6 Effective date: 20251223 |
|
| PGFP | Annual fee paid to national office [announced via postgrant information from national office to epo] |
Ref country code: ES Payment date: 20260130 Year of fee payment: 6 |