EP3964835A1 - Marker for diagnosing colorectal cancer and method for providing information required for diagnosis of colorectal cancer - Google Patents
Marker for diagnosing colorectal cancer and method for providing information required for diagnosis of colorectal cancer Download PDFInfo
- Publication number
- EP3964835A1 EP3964835A1 EP20801458.9A EP20801458A EP3964835A1 EP 3964835 A1 EP3964835 A1 EP 3964835A1 EP 20801458 A EP20801458 A EP 20801458A EP 3964835 A1 EP3964835 A1 EP 3964835A1
- Authority
- EP
- European Patent Office
- Prior art keywords
- cips
- pbmc
- cells
- cytokine
- crc
- Prior art date
- Legal status (The legal status is an assumption and is not a legal conclusion. Google has not performed a legal analysis and makes no representation as to the accuracy of the status listed.)
- Pending
Links
Images







Classifications
-
- G—PHYSICS
- G01—MEASURING; TESTING
- G01N—INVESTIGATING OR ANALYSING MATERIALS BY DETERMINING THEIR CHEMICAL OR PHYSICAL PROPERTIES
- G01N33/00—Investigating or analysing materials by specific methods not covered by groups G01N1/00 - G01N31/00
- G01N33/48—Biological material, e.g. blood, urine; Haemocytometers
- G01N33/483—Physical analysis of biological material
- G01N33/487—Physical analysis of biological material of liquid biological material
- G01N33/49—Blood
- G01N33/4915—Blood using flow cells
-
- G—PHYSICS
- G01—MEASURING; TESTING
- G01N—INVESTIGATING OR ANALYSING MATERIALS BY DETERMINING THEIR CHEMICAL OR PHYSICAL PROPERTIES
- G01N33/00—Investigating or analysing materials by specific methods not covered by groups G01N1/00 - G01N31/00
- G01N33/48—Biological material, e.g. blood, urine; Haemocytometers
- G01N33/50—Chemical analysis of biological material, e.g. blood, urine; Testing involving biospecific ligand binding methods; Immunological testing
- G01N33/53—Immunoassay; Biospecific binding assay; Materials therefor
- G01N33/575—Immunoassay; Biospecific binding assay; Materials therefor for cancer
- G01N33/57535—Immunoassay; Biospecific binding assay; Materials therefor for cancer of the large intestine, e.g. colon, rectum or anus
-
- G—PHYSICS
- G01—MEASURING; TESTING
- G01N—INVESTIGATING OR ANALYSING MATERIALS BY DETERMINING THEIR CHEMICAL OR PHYSICAL PROPERTIES
- G01N33/00—Investigating or analysing materials by specific methods not covered by groups G01N1/00 - G01N31/00
- G01N33/48—Biological material, e.g. blood, urine; Haemocytometers
- G01N33/50—Chemical analysis of biological material, e.g. blood, urine; Testing involving biospecific ligand binding methods; Immunological testing
- G01N33/53—Immunoassay; Biospecific binding assay; Materials therefor
- G01N33/575—Immunoassay; Biospecific binding assay; Materials therefor for cancer
- G01N33/5753—Immunoassay; Biospecific binding assay; Materials therefor for cancer of the stomach or small intestine
-
- G—PHYSICS
- G01—MEASURING; TESTING
- G01N—INVESTIGATING OR ANALYSING MATERIALS BY DETERMINING THEIR CHEMICAL OR PHYSICAL PROPERTIES
- G01N1/00—Sampling; Preparing specimens for investigation
- G01N1/28—Preparing specimens for investigation including physical details of (bio-)chemical methods covered elsewhere, e.g. G01N33/50, C12Q
- G01N1/30—Staining; Impregnating ; Fixation; Dehydration; Multistep processes for preparing samples of tissue, cell or nucleic acid material and the like for analysis
-
- G—PHYSICS
- G01—MEASURING; TESTING
- G01N—INVESTIGATING OR ANALYSING MATERIALS BY DETERMINING THEIR CHEMICAL OR PHYSICAL PROPERTIES
- G01N15/00—Investigating characteristics of particles; Investigating permeability, pore-volume or surface-area of porous materials
- G01N15/10—Investigating individual particles
- G01N15/14—Optical investigation techniques, e.g. flow cytometry
-
- G—PHYSICS
- G01—MEASURING; TESTING
- G01N—INVESTIGATING OR ANALYSING MATERIALS BY DETERMINING THEIR CHEMICAL OR PHYSICAL PROPERTIES
- G01N33/00—Investigating or analysing materials by specific methods not covered by groups G01N1/00 - G01N31/00
- G01N33/48—Biological material, e.g. blood, urine; Haemocytometers
- G01N33/50—Chemical analysis of biological material, e.g. blood, urine; Testing involving biospecific ligand binding methods; Immunological testing
- G01N33/5005—Chemical analysis of biological material, e.g. blood, urine; Testing involving biospecific ligand binding methods; Immunological testing involving human or animal cells
- G01N33/5008—Chemical analysis of biological material, e.g. blood, urine; Testing involving biospecific ligand binding methods; Immunological testing involving human or animal cells for testing or evaluating the effect of chemical or biological compounds, e.g. drugs, cosmetics
- G01N33/5044—Chemical analysis of biological material, e.g. blood, urine; Testing involving biospecific ligand binding methods; Immunological testing involving human or animal cells for testing or evaluating the effect of chemical or biological compounds, e.g. drugs, cosmetics involving specific cell types
- G01N33/5047—Cells of the immune system
- G01N33/505—Cells of the immune system involving T-cells
-
- G—PHYSICS
- G01—MEASURING; TESTING
- G01N—INVESTIGATING OR ANALYSING MATERIALS BY DETERMINING THEIR CHEMICAL OR PHYSICAL PROPERTIES
- G01N33/00—Investigating or analysing materials by specific methods not covered by groups G01N1/00 - G01N31/00
- G01N33/48—Biological material, e.g. blood, urine; Haemocytometers
- G01N33/50—Chemical analysis of biological material, e.g. blood, urine; Testing involving biospecific ligand binding methods; Immunological testing
- G01N33/5005—Chemical analysis of biological material, e.g. blood, urine; Testing involving biospecific ligand binding methods; Immunological testing involving human or animal cells
- G01N33/5091—Chemical analysis of biological material, e.g. blood, urine; Testing involving biospecific ligand binding methods; Immunological testing involving human or animal cells for testing the pathological state of an organism
-
- G—PHYSICS
- G01—MEASURING; TESTING
- G01N—INVESTIGATING OR ANALYSING MATERIALS BY DETERMINING THEIR CHEMICAL OR PHYSICAL PROPERTIES
- G01N33/00—Investigating or analysing materials by specific methods not covered by groups G01N1/00 - G01N31/00
- G01N33/48—Biological material, e.g. blood, urine; Haemocytometers
- G01N33/50—Chemical analysis of biological material, e.g. blood, urine; Testing involving biospecific ligand binding methods; Immunological testing
- G01N33/68—Chemical analysis of biological material, e.g. blood, urine; Testing involving biospecific ligand binding methods; Immunological testing involving proteins, peptides or amino acids
- G01N33/6893—Chemical analysis of biological material, e.g. blood, urine; Testing involving biospecific ligand binding methods; Immunological testing involving proteins, peptides or amino acids related to diseases not provided for elsewhere
-
- G—PHYSICS
- G01—MEASURING; TESTING
- G01N—INVESTIGATING OR ANALYSING MATERIALS BY DETERMINING THEIR CHEMICAL OR PHYSICAL PROPERTIES
- G01N2333/00—Assays involving biological materials from specific organisms or of a specific nature
- G01N2333/435—Assays involving biological materials from specific organisms or of a specific nature from animals; from humans
- G01N2333/52—Assays involving cytokines
- G01N2333/54—Interleukins [IL]
- G01N2333/5412—IL-6
-
- G—PHYSICS
- G01—MEASURING; TESTING
- G01N—INVESTIGATING OR ANALYSING MATERIALS BY DETERMINING THEIR CHEMICAL OR PHYSICAL PROPERTIES
- G01N2333/00—Assays involving biological materials from specific organisms or of a specific nature
- G01N2333/435—Assays involving biological materials from specific organisms or of a specific nature from animals; from humans
- G01N2333/52—Assays involving cytokines
- G01N2333/54—Interleukins [IL]
- G01N2333/5428—IL-10
-
- G—PHYSICS
- G01—MEASURING; TESTING
- G01N—INVESTIGATING OR ANALYSING MATERIALS BY DETERMINING THEIR CHEMICAL OR PHYSICAL PROPERTIES
- G01N2440/00—Post-translational modifications [PTMs] in chemical analysis of biological material
- G01N2440/14—Post-translational modifications [PTMs] in chemical analysis of biological material phosphorylation
-
- G—PHYSICS
- G01—MEASURING; TESTING
- G01N—INVESTIGATING OR ANALYSING MATERIALS BY DETERMINING THEIR CHEMICAL OR PHYSICAL PROPERTIES
- G01N2800/00—Detection or diagnosis of diseases
- G01N2800/52—Predicting or monitoring the response to treatment, e.g. for selection of therapy based on assay results in personalised medicine; Prognosis
Definitions
- the present disclosure relates to a marker for diagnosing colorectal cancer, a method for providing information required for the diagnosis of colorectal cancer by using the same, and a method for providing information for monitoring a therapeutic response of colorectal cancer by using the same.
- a colonoscopy is mainly performed to examine for the presence or absence of colorectal cancer.
- a bowel emptying procedure was needed to perform the colonoscopy. Accordingly, though a colonoscopy has been recommended for colorectal cancer screening, only some subjects get examined due to the above inconvenience in the procedure. Moreover, a colonoscopy may cause some serious side effects, such as bowel perforation or bowel bleeding.
- a stool occult blood test has also been used as a screening test, but has a disadvantage of low sensitivity.
- a diagnostic marker capable of identifying the presence or absence of colorectal cancer through a blood test is known to detect CEA protein in blood.
- the sensitivity changes depending on the stage of disease, for example, about 30% at stages 1 and 2 and 75% or more at stages 3 and 4, and thus such a diagnostic marker is less useful for a screening test. Except for these, nothing has been well established so far.
- ctDNA circulating tumor DNA
- STAT proteins are subordinate transcription factors of the JAK signaling system, and are known to be STAT 1, 2, 3, 4, 5A, 5B, and 6.
- STAT protein is activated through phosphorylation by specific cytokine stimulation and the reaction between receptors thereof to induce cytokine secretion through signaling to nuclei, and is involved in the differentiation, survival, and activity of cells, especially, immune cells.
- an aspect of the present disclosure is to provide a marker for diagnosing colorectal cancer.
- Another aspect of the present disclosure is to provide information required for the diagnosis of colorectal cancer.
- Still another aspect of the present disclosure is to provide a method for providing information for monitoring a therapeutic response of colorectal cancer.
- the present disclosure relates to a marker for diagnosing colorectal cancer, a method for providing information required for the diagnosis of colorectal cancer by using the same, and a method for providing information for monitoring a therapeutic response of colorectal cancer by using the same.
- An aspect of the present disclosure is directed to a method for providing information required for the diagnosis of colorectal cancer, the method including:
- the first sample may be obtained from organs, tissues, and cells of a subject.
- the first sample may include lymphocytes, and for example, may include peripheral blood, but is not limited thereto.
- the first sample may be prepared by the following steps:
- the cytokine with which the first sample is treated may be IL-10.
- the concentration of the IL-10 may be 9.0 to 11.0 ng/ml, 9.0 to 10.8 ng/ml, 9.0 to 10.6 ng/ml, 9.0 to 10.4 ng/ml, 9.0 to 10.2 ng/ml, 9.2 to 11.0 ng/ml, 9.2 to 10.8 ng/ml, 9.2 to 10.6 ng/ml, 9.2 to 10.4 ng/ml, 9.2 to 10.2 ng/ml, 9.4 to 11.0 ng/ml, 9.4 to 10.8 ng/ml, 9.4 to 10.6 ng/ml, 9.4 to 10.4 ng/ml, 9.4 to 10.2 ng/ml, 9.6 to 11.0 ng/ml, 9.6 to 10.8 ng/ml, 9.6 to 10.6 ng/ml, 9.6 to 10.4 ng/ml, 9.6 to 10.4 ng/ml, 9.6 to 10.2 ng/ml, 9.6 to 11.0 ng/ml, 9.6 to
- the second sample may be obtained from organs, tissues, and cells of a subject.
- the second sample may include lymphocytes, and for example, may include peripheral blood, but are not limited thereto.
- the second sample may be prepared by the following steps:
- the cytokine with which the second sample is treated may be IL-6.
- the concentration of the IL-6 may be 19.0 to 21.0 ng/ml, 19.0 to 20.8 ng/ml, 19.0 to 20.6 ng/ml, 19.0 to 20.4 ng/ml, 19.0 to 20.2 ng/ml, 19.2 to 21.0 ng/ml, 19.2 to 20.8 ng/ml, 19.2 to 20.6 ng/ml, 19.2 to 20.4 ng/ml, 19.2 to 20.2 ng/ml, 19.4 to 21.0 ng/ml, 19.4 to 20.8 ng/ml, 19.4 to 20.6 ng/ml, 19.4 to 20.4 ng/ml, 19.4 to 20.2 ng/ml, 19.6 to 21.0 ng/ml, 19.6 to 20.8 ng/ml, 19.6 to 20.6 ng/ml, 19.6 to 20.4 ng/ml, 19.6 to 20.2 ng/ml, 19.6 to 21.0 ng/ml, 19.6 to 20.8 ng/ml, 19.6 to
- the measuring of the level of STAT3 phosphorylation is performed using flow cytometry, but is not limited thereto.
- Another aspect of the present disclosure is directed to a method for providing information for monitoring a therapeutic response of colorectal cancer, the method including:
- the first sample may be obtained from organs, tissues, and cells of a subject.
- the first sample may include lymphocytes, and for example, may include peripheral blood, but are not limited thereto.
- the first sample may be prepared by the following steps:
- the cytokine with which the first sample is treated may be IL-10.
- the concentration of the IL-10 may be 9.0 to 11.0 ng/ml, 9.0 to 10.8 ng/ml, 9.0 to 10.6 ng/ml, 9.0 to 10.4 ng/ml, 9.0 to 10.2 ng/ml, 9.2 to 11.0 ng/ml, 9.2 to 10.8 ng/ml, 9.2 to 10.6 ng/ml, 9.2 to 10.4 ng/ml, 9.2 to 10.2 ng/ml, 9.4 to 11.0 ng/ml, 9.4 to 10.8 ng/ml, 9.4 to 10.6 ng/ml, 9.4 to 10.4 ng/ml, 9.4 to 10.2 ng/ml, 9.6 to 11.0 ng/ml, 9.6 to 10.8 ng/ml, 9.6 to 10.6 ng/ml, 9.6 to 10.4 ng/ml, 9.6 to 10.4 ng/ml, 9.6 to 10.2 ng/ml, 9.6 to 11.0 ng/ml, 9.6 to
- the second sample may be obtained from organs, tissues, and cells of a subject.
- the second sample may include lymphocytes, and for example, may include peripheral blood, but are not limited thereto.
- the second sample may be prepared by the following steps:
- the cytokine with which the second sample is treated may be IL-6.
- the concentration of the IL-6 may be 19.0 to 21.0 ng/ml, 19.0 to 20.8 ng/ml, 19.0 to 20.6 ng/ml, 19.0 to 20.4 ng/ml, 19.0 to 20.2 ng/ml, 19.2 to 21.0 ng/ml, 19.2 to 20.8 ng/ml, 19.2 to 20.6 ng/ml, 19.2 to 20.4 ng/ml, 19.2 to 20.2 ng/ml, 19.4 to 21.0 ng/ml, 19.4 to 20.8 ng/ml, 19.4 to 20.6 ng/ml, 19.4 to 20.4 ng/ml, 19.4 to 20.2 ng/ml, 19.6 to 21.0 ng/ml, 19.6 to 20.8 ng/ml, 19.6 to 20.6 ng/ml, 19.6 to 20.4 ng/ml, 19.6 to 20.2 ng/ml, 19.6 to 21.0 ng/ml, 19.6 to 20.8 ng/ml, 19.6 to
- the subject may be a patient who is being treated for colorectal cancer, for example, a patient who has undergone colorectal cancer surgery.
- the method for providing information for monitoring of the present disclosure cannot be employed for patients receiving chemoimmunotherapy or immunotherapy for colorectal cancer treatment.
- the measuring of the level of STAT3 phosphorylation is performed using flow cytometry, but is not limited thereto.
- the "Th cells” refers to helper T cells, also known as CD4+ cells or CD4-positive cells, which are cells playing an important role in the action of the immune system and are a kind of lymphocyte. Th cells usually do not have cytotoxic activity and cannot directly kill infected (somatic) cells or antigens.
- the helper T cells (Th cells) serve to activate and direct other immune cells, and especially play a very important role in the immune system.
- the helper T cells are essential for antibody production by B cells, activation of cytotoxic T cells, promotion of antibacterial activity of phagocytes including macrophages, and the like.
- the naming of helper T cells or assisting T cells is also due to the fact that they help a lot in the activities of other cells.
- Tc cells refers to cytotoxic T cells (CD8+, Tc), which are a kind of lymphocyte and can destroy somatic or tumor cells infected with viruses.
- Cytotoxic T cells eliminate the cells infected with antigens such as viruses, damaged or malfunctioning cells, and the like.
- Most cytotoxic T cells have T cell receptors (TCRs) and thus can recognize specific antigenic peptides attached to the type I MHC molecules located on the surface of all cells.
- TCRs T cell receptors
- CD8 a glycoprotein located on the surface of cytotoxic T cells to bind to a constant region of the type I MHC molecule. The binding between CD8 and the MHC molecule further enhances the binding between cytotoxic T cells (TC) and target cells.
- CD8+ T cells appear to usually perform predetermined cytotoxic activity in the immune system.
- the present disclosure relates to a marker for diagnosing colorectal cancer, a method for providing information required for the diagnosis of colorectal cancer by using the same, and a method for providing information for monitoring a therapeutic response of colorectal cancer by using the same, wherein the marker and the methods have effects of significantly improving diagnostic sensitivity and specificity.
- a method for providing information required for the diagnosis of colorectal cancer including: measuring the level of STAT3 phosphorylation in Th cells contained in a first sample; and measuring the level of STAT3 phosphorylation in Tc cells contained in a second sample.
- the subject group included a colorectal cancer group and a healthy group.
- the colorectal cancer group was composed of patients before surgery and anticancer treatment among patients diagnosed with colorectal cancer in a biopsy during colonoscopy. About 10 ml of fresh peripheral blood was collected prior to surgery, from each of the patients who verbally consented, into a test tube containing heparin as an anti-coagulant.
- the blood from healthy persons was obtained from an external tissue bank (Korea Gynecology Cancer Back). The blood was promptly delivered to a laboratory of our center on the day of collection.
- Mononuclear were isolated from fresh whole blood by using a specific gravity liquid (1.077) such as Ficoll.
- the isolation method followed a typical method. Briefly, whole blood was diluted with RPMI1640 medium at 1:1, and then Ficoll and the diluted whole blood were placed in a 50-ml test tube at a ratio of 1:1. After centrifugation at 1300 rpm (350 g) for 20 minutes, the mononuclear cell layer separated between Ficoll and plasma was carefully recovered.
- test tube 1 no cytokine 1 stimulation (unstimulated, unstim)
- test tube 2 cytokine 1 stimulated (stimulated, stim)
- test tube 3 no cytokine 2 stimulation (unstimulated, unstim)
- test tube 4 cytokine 2 stimulation (stimulated, stim), and the like) according to the number of cytokines to be identified, and corresponding cytokines were added thereto according to Table 1 below, followed by incubation in a 37°C incubator for 15 minutes.
- the upper methanol was removed by centrifugation at 1000 rpm (300g) for 10 minutes, and then the cells were washed three times with phosphate buffered saline (PBS) containing 0.5% bovine serum albumin (BSA) to completely remove the residual liquid.
- PBS phosphate buffered saline
- BSA bovine serum albumin
- a monoclonal antibody to pSTAT to be identified and a monoclonal antibody cocktail capable of identifying cell fraction were prepared, and then mixed and incubated with the cell suspension to make a final volume of 100 ⁇ l.
- the cells were incubated in a dark place for 30 minutes, washed once with PBS containing 0.5% BSA, and then re-suspended in 300 ⁇ l, and thereafter, subjected to acquisition and analysis by using a flow cytometer.
- each test tube for cytokine stimulation is shown in Table 2, and the composition of the antibody reagent used for each test tube is shown in Table 3.
- helper T cells and cytotoxic T cells were discriminated by a particular monoclonal marker, and then the median value (median MFI) of the pSTAT expression levels (mean fluorescence intensity, MFI) to each cytokine stimulation on histogram was derived under unstim and stim conditions. Finally, the ratio of stim MFI/unstim MFI was expressed and the results are shown in Table 4.
- Example 1 Levels of STAT phosphorylation to cytokines in immune cells
- IL-6-induced pSTAT1 and pSTAT3 were significantly decreased in tumor infiltrating lymphocytes (TILs). It was also identified that the cytokine-induced phosphorylated STAT signature (CIPS signature) of the peripheral blood lymphocytes reflected the CIPS signature of TILs.
- CIPS signature cytokine-induced phosphorylated STAT signature
- HCT116 American Type Culture Collection, ATCC CCL-247
- ATCC CCL-247 which is a colorectal cancer cell line
- mononuclear cells of the peripheral blood of normal persons were co-cultured in vitro.
- the cell mixing conditions and the number of cells in the in-vitro co-culture experiment are shown in Table 6.
- the levels of STAT protein phosphorylation for each cytokine were measured, the results are shown in FIG. 6 and Tables 13 to 15. (Table 13: Th, Table 14: Treg, and Table 15: Tc)
- Co-culturing was performed under two conditions. That is, while the ratios of tumor cells and mononuclear cells of normal persons were 1:1 and 1:10, the first condition was that the two kinds of cells were directly mixed and co-cultured in one experimental well (direct), and the second condition was that, in an experimental well with a septum (transwell), the tumor cells were placed in the upper layer of the septum and the mononuclear cells of normal persons were placed in the lower layer and co-cultured (indirect).
- CIPS signatures of 30 CRC patients and 15 healthy persons were subjected to cluster analysis. Specifically, the distances between sample results were analyzed by the hierarchical clustering method using R language, and in order to schematize the distances, a heatmap was drawn using the gplot R package. The results are shown in FIG. 7 .
- the colorectal cancer patient group and the normal person group can be well distinguished by only the numerical values of IL-6-induced pSTAT3 on Tc cells and IL-10-induced pSTAT3 on Th cells.
- Test Example Statistical method and leave-one-out cross validation (LOOCV)
- the use of IL-6-induced pSTAT3 on Tc cells and IL-10-induced pSTAT3 on Th cells can discriminate the tumor group and the normal group, and the AUC was 0.88. This was reproduced in the validation cohort with 15 CRC patients and 17 healthy persons (AUC 0.941). When training cohort and validation cohort were synthetically analyzed, the AUC was 0.938.
- the discrimination between groups was analyzed by applying the carcinoembryonic antigen (CEA) protein marker, known as an existing CRC tumor marker, to both the two CIPS patterns, that is, IL-6-induced pSTAT3 on Tc cells and IL-10-induced pSTAT3 on Th cells.
- CEA carcinoembryonic antigen
- the tumor patients were essentially tested for CEA, and thus the previously obtained test value and two markers derived in this experiment were analyzed by the same manner and model, and the results are shown in FIG. 13 and Table 16.
- the AUC was identified to be excellent, 0.958, proving that the diagnostic use of the two markers in combination can maximize the utility thereof.
- the positive and negative predictive values were shown as 91% and 88%, respectively.
- the present disclosure relates to a marker for diagnosing colorectal cancer, a method for providing information required for diagnosis of colorectal cancer by using the same, and a method for providing information for monitoring a therapeutic response of colorectal cancer by using the same.
Landscapes
- Health & Medical Sciences (AREA)
- Life Sciences & Earth Sciences (AREA)
- Engineering & Computer Science (AREA)
- Immunology (AREA)
- Chemical & Material Sciences (AREA)
- Biomedical Technology (AREA)
- Molecular Biology (AREA)
- Hematology (AREA)
- Urology & Nephrology (AREA)
- Physics & Mathematics (AREA)
- Analytical Chemistry (AREA)
- Biochemistry (AREA)
- General Health & Medical Sciences (AREA)
- General Physics & Mathematics (AREA)
- Pathology (AREA)
- Cell Biology (AREA)
- Food Science & Technology (AREA)
- Medicinal Chemistry (AREA)
- Biotechnology (AREA)
- Microbiology (AREA)
- Tropical Medicine & Parasitology (AREA)
- Ecology (AREA)
- Proteomics, Peptides & Aminoacids (AREA)
- Biophysics (AREA)
- Dispersion Chemistry (AREA)
- Toxicology (AREA)
- Physiology (AREA)
- Bioinformatics & Cheminformatics (AREA)
- Investigating Or Analysing Biological Materials (AREA)
- Measuring Or Testing Involving Enzymes Or Micro-Organisms (AREA)
Abstract
Description
- This application claims priority to and the benefit of
Korean Patent Application No. 10-2019-0052556 filed in the Korean Intellectual Property Office on 03 May 2019 - The present disclosure relates to a marker for diagnosing colorectal cancer, a method for providing information required for the diagnosis of colorectal cancer by using the same, and a method for providing information for monitoring a therapeutic response of colorectal cancer by using the same.
- Typically, a colonoscopy is mainly performed to examine for the presence or absence of colorectal cancer. However, a bowel emptying procedure was needed to perform the colonoscopy. Accordingly, though a colonoscopy has been recommended for colorectal cancer screening, only some subjects get examined due to the above inconvenience in the procedure. Moreover, a colonoscopy may cause some serious side effects, such as bowel perforation or bowel bleeding. A stool occult blood test has also been used as a screening test, but has a disadvantage of low sensitivity.
- A diagnostic marker capable of identifying the presence or absence of colorectal cancer through a blood test is known to detect CEA protein in blood. However, the sensitivity changes depending on the stage of disease, for example, about 30% at
stages stages - Therefore, there is a need for an examination that has few side effects, is easily performed by simple blood collection or the like, and has high diagnostic sensitivity. Signal transducer and activator of transcription (STAT) proteins are subordinate transcription factors of the JAK signaling system, and are known to be
STAT - Accordingly, an aspect of the present disclosure is to provide a marker for diagnosing colorectal cancer.
- Another aspect of the present disclosure is to provide information required for the diagnosis of colorectal cancer.
- Still another aspect of the present disclosure is to provide a method for providing information for monitoring a therapeutic response of colorectal cancer.
- The present disclosure relates to a marker for diagnosing colorectal cancer, a method for providing information required for the diagnosis of colorectal cancer by using the same, and a method for providing information for monitoring a therapeutic response of colorectal cancer by using the same.
- Hereinafter, the present disclosure will be described in more detail.
- An aspect of the present disclosure is directed to a method for providing information required for the diagnosis of colorectal cancer, the method including:
- measuring the level of STAT3 phosphorylation in Th cells contained in a first sample; and
- measuring the level of STAT3 phosphorylation in Tc cells contained in a second sample.
- In the present disclosure, the first sample may be obtained from organs, tissues, and cells of a subject. The first sample may include lymphocytes, and for example, may include peripheral blood, but is not limited thereto.
- In the present disclosure, the first sample may be prepared by the following steps:
- a mononuclear cells isolation step of isolating mononuclear cellss contained in blood;
- a cytokine treatment step of treating the isolated mononuclear cellss with a cytokine; and
- a phosphorylation staining step of performing phosphorylation staining.
- In the present disclosure, the cytokine with which the first sample is treated may be IL-10.
- In the present disclosure, the concentration of the IL-10 may be 9.0 to 11.0 ng/ml, 9.0 to 10.8 ng/ml, 9.0 to 10.6 ng/ml, 9.0 to 10.4 ng/ml, 9.0 to 10.2 ng/ml, 9.2 to 11.0 ng/ml, 9.2 to 10.8 ng/ml, 9.2 to 10.6 ng/ml, 9.2 to 10.4 ng/ml, 9.2 to 10.2 ng/ml, 9.4 to 11.0 ng/ml, 9.4 to 10.8 ng/ml, 9.4 to 10.6 ng/ml, 9.4 to 10.4 ng/ml, 9.4 to 10.2 ng/ml, 9.6 to 11.0 ng/ml, 9.6 to 10.8 ng/ml, 9.6 to 10.6 ng/ml, 9.6 to 10.4 ng/ml, 9.6 to 10.2 ng/ml, 9.8 to 11.0 ng/ml, 9.8 to 10.8 ng/ml, 9.8 to 10.6 ng/ml, 9.8 to 10.4 ng/ml, or 9.8 to 10.2 ng/ml, and for example, 10.0 ng/ml.
- In the present disclosure, the second sample may be obtained from organs, tissues, and cells of a subject. The second sample may include lymphocytes, and for example, may include peripheral blood, but are not limited thereto.
- In the present disclosure, the second sample may be prepared by the following steps:
- a mononuclear cell isolation step of isolating mononuclear cells contained in blood;
- a cytokine treatment step of treating the isolated mononuclear cells with a cytokine; and
- a phosphorylation staining step of performing phosphorylation staining.
- In the present disclosure, the cytokine with which the second sample is treated may be IL-6.
- In the present disclosure, the concentration of the IL-6 may be 19.0 to 21.0 ng/ml, 19.0 to 20.8 ng/ml, 19.0 to 20.6 ng/ml, 19.0 to 20.4 ng/ml, 19.0 to 20.2 ng/ml, 19.2 to 21.0 ng/ml, 19.2 to 20.8 ng/ml, 19.2 to 20.6 ng/ml, 19.2 to 20.4 ng/ml, 19.2 to 20.2 ng/ml, 19.4 to 21.0 ng/ml, 19.4 to 20.8 ng/ml, 19.4 to 20.6 ng/ml, 19.4 to 20.4 ng/ml, 19.4 to 20.2 ng/ml, 19.6 to 21.0 ng/ml, 19.6 to 20.8 ng/ml, 19.6 to 20.6 ng/ml, 19.6 to 20.4 ng/ml, 19.6 to 20.2 ng/ml, 19.8 to 21.0 ng/ml, 19.8 to 20.8 ng/ml, 19.8 to 20.6 ng/ml, 19.8 to 20.4 ng/ml, or 19.8 to 20.2 ng/ml, and for example, 20.0 ng/ml, but is not limited thereto.
- In the present disclosure, the measuring of the level of STAT3 phosphorylation is performed using flow cytometry, but is not limited thereto.
- Another aspect of the present disclosure is directed to a method for providing information for monitoring a therapeutic response of colorectal cancer, the method including:
- measuring the level of STAT3 phosphorylation in Th cells contained in a first sample; and
- measuring the level of STAT3 phosphorylation in Tc cells contained in a second sample.
- In the present disclosure, the first sample may be obtained from organs, tissues, and cells of a subject. The first sample may include lymphocytes, and for example, may include peripheral blood, but are not limited thereto.
- In the present disclosure, the first sample may be prepared by the following steps:
- a mononuclear cell isolation step of isolating mononuclear cells contained in blood;
- a cytokine treatment step of treating the isolated mononuclear cells with a cytokine; and
- a phosphorylation staining step of performing phosphorylation staining.
- In the present disclosure, the cytokine with which the first sample is treated may be IL-10.
- In the present disclosure, the concentration of the IL-10 may be 9.0 to 11.0 ng/ml, 9.0 to 10.8 ng/ml, 9.0 to 10.6 ng/ml, 9.0 to 10.4 ng/ml, 9.0 to 10.2 ng/ml, 9.2 to 11.0 ng/ml, 9.2 to 10.8 ng/ml, 9.2 to 10.6 ng/ml, 9.2 to 10.4 ng/ml, 9.2 to 10.2 ng/ml, 9.4 to 11.0 ng/ml, 9.4 to 10.8 ng/ml, 9.4 to 10.6 ng/ml, 9.4 to 10.4 ng/ml, 9.4 to 10.2 ng/ml, 9.6 to 11.0 ng/ml, 9.6 to 10.8 ng/ml, 9.6 to 10.6 ng/ml, 9.6 to 10.4 ng/ml, 9.6 to 10.2 ng/ml, 9.8 to 11.0 ng/ml, 9.8 to 10.8 ng/ml, 9.8 to 10.6 ng/ml, 9.8 to 10.4 ng/ml, or 9.8 to 10.2 ng/ml, and for example, 10.0 ng/ml, but is not limited thereto.
- In the present disclosure, the second sample may be obtained from organs, tissues, and cells of a subject. The second sample may include lymphocytes, and for example, may include peripheral blood, but are not limited thereto.
- In the present disclosure, the second sample may be prepared by the following steps:
- a mononuclear cell isolation step of isolating mononuclear cells contained in blood;
- a cytokine treatment step of treating the isolated mononuclear cells with a cytokine; and
- a phosphorylation staining step of performing phosphorylation staining.
- In the present disclosure, the cytokine with which the second sample is treated may be IL-6.
- In the present disclosure, the concentration of the IL-6 may be 19.0 to 21.0 ng/ml, 19.0 to 20.8 ng/ml, 19.0 to 20.6 ng/ml, 19.0 to 20.4 ng/ml, 19.0 to 20.2 ng/ml, 19.2 to 21.0 ng/ml, 19.2 to 20.8 ng/ml, 19.2 to 20.6 ng/ml, 19.2 to 20.4 ng/ml, 19.2 to 20.2 ng/ml, 19.4 to 21.0 ng/ml, 19.4 to 20.8 ng/ml, 19.4 to 20.6 ng/ml, 19.4 to 20.4 ng/ml, 19.4 to 20.2 ng/ml, 19.6 to 21.0 ng/ml, 19.6 to 20.8 ng/ml, 19.6 to 20.6 ng/ml, 19.6 to 20.4 ng/ml, 19.6 to 20.2 ng/ml, 19.8 to 21.0 ng/ml, 19.8 to 20.8 ng/ml, 19.8 to 20.6 ng/ml, 19.8 to 20.4 ng/ml, or 19.8 to 20.2 ng/ml, and for example, 20.0 ng/ml, but is not limited thereto.
- In the present disclosure, the subject may be a patient who is being treated for colorectal cancer, for example, a patient who has undergone colorectal cancer surgery. The method for providing information for monitoring of the present disclosure cannot be employed for patients receiving chemoimmunotherapy or immunotherapy for colorectal cancer treatment.
- In the present disclosure, the measuring of the level of STAT3 phosphorylation is performed using flow cytometry, but is not limited thereto.
- In the present disclosure, the "Th cells" refers to helper T cells, also known as CD4+ cells or CD4-positive cells, which are cells playing an important role in the action of the immune system and are a kind of lymphocyte. Th cells usually do not have cytotoxic activity and cannot directly kill infected (somatic) cells or antigens. The helper T cells (Th cells) serve to activate and direct other immune cells, and especially play a very important role in the immune system. The helper T cells are essential for antibody production by B cells, activation of cytotoxic T cells, promotion of antibacterial activity of phagocytes including macrophages, and the like. The naming of helper T cells or assisting T cells is also due to the fact that they help a lot in the activities of other cells.
- In the present disclosure, the term "Tc cells" refers to cytotoxic T cells (CD8+, Tc), which are a kind of lymphocyte and can destroy somatic or tumor cells infected with viruses. Cytotoxic T cells eliminate the cells infected with antigens such as viruses, damaged or malfunctioning cells, and the like. Most cytotoxic T cells have T cell receptors (TCRs) and thus can recognize specific antigenic peptides attached to the type I MHC molecules located on the surface of all cells. In addition, a glycoprotein called CD8 is located on the surface of cytotoxic T cells to bind to a constant region of the type I MHC molecule. The binding between CD8 and the MHC molecule further enhances the binding between cytotoxic T cells (TC) and target cells. CD8+ T cells appear to usually perform predetermined cytotoxic activity in the immune system.
- The present disclosure relates to a marker for diagnosing colorectal cancer, a method for providing information required for the diagnosis of colorectal cancer by using the same, and a method for providing information for monitoring a therapeutic response of colorectal cancer by using the same, wherein the marker and the methods have effects of significantly improving diagnostic sensitivity and specificity.
-
-
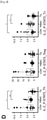
FIG. 1 is a graph showing the results that there were differences in STAT1 phosphorylation by IL-6 stimulation in the blood immune cells of healthy persons and the blood immune cells and tumor immune cells of cancer patients according to an embodiment of the present disclosure. -
FIG. 2 is a graph showing the results that there was a difference in STAT3 phosphorylation by IL-6 stimulation in the blood immune cells of healthy person and the blood immune cells and tumor immune cells of cancer patients. -
FIG. 3 is a graph showing the results that there was a difference in STAT3 phosphorylation by IL-10 stimulation in the blood immune cells of healthy person and the blood immune cells and tumor immune cells of cancer patients. -
FIG. 4 is a graph showing the results that there was a difference in STAT5 phosphorylation by IL-2 stimulation in the blood immune cells of healthy person and the blood immune cells and tumor immune cells of cancer patients. -
FIG. 5 is a schematic diagram showing changes in values in the blood immune cells and tumor immune cells of cancer patients by using the values in the blood immune cells of healthy persons as base values, from the results inFIGS. 1 to 4 according to an embodiment of the present disclosure. -
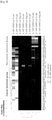
FIG. 6 shows the results of experimenting the change of phosphorylation of each STAT to each cytokine after co-culture of blood immune cells of healthy persons and a colorectal cell line at various ratios according to an embodiment of the present disclosure. On the whole, statistically significant decrease patterns were shown in the immune cells (B, C, and D) co-cultured with the colorectal cell line compared with the base values (A). (A: PBMC only, B: direct culture of PBMC+HCT116 (1:1), C: direct culture of PBMC+HCT116 (1:10), D: indirect culture of PBMC+HCT116 (1:10)) -
FIG. 7 shows that cluster analysis was performed with the levels of phosphorylation of each STAT to each cytokine according to an embodiment of the present disclosure, and resultantly, there were two groups wherein colorectal patients were mainly distributed in one group and healthy persons were mainly distributed in the other group. -
FIG. 8 shows that principal component analysis (PCA) was performed with the phosphorylation levels of each STAT to each cytokine according to an embodiment of the present disclosure and that the colorectal cancer patients (red dots) and healthy persons (green dots) were discriminated from each other. -
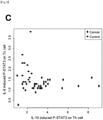
FIG. 9 is a schematic diagram of the distributions of colorectal cancer patients (red dots) and healthy persons (green dots) by using, as axes, respective items from cytokine and STAT combinations with largest differences (IL-6/pSTAT3 and IL-10/pSTAT3) found in the colorectal cancer patients and the healthy persons according to an embodiment of the present disclosure. -
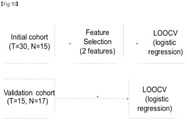
FIG. 10 is a schematic diagram showing a procedure wherein a statistical model was made by finding useful features for distinguishing between cancer patients and normal persons in training cohort and then validating the performance of the model through the use of validation cohort according to an embodiment of the present invention. -
FIG. 11 shows the ROC analysis result depicting the performance of a statistical model using two features (IL-6/pSTAT3 and IL-10/pSTAT3) presented in this study in a training cohort according to an embodiment of the present invention. -
FIG. 12 shows the ROC analysis result depicting the performance of a statistical model using two features (IL-6/pSTAT3 and IL-10/pSTAT3) presented in this study in a validation cohort according to an embodiment of the present invention. -
FIG. 13 shows the ROC analysis result depicting the performance of a statistical model using the two features (IL-6/pSTAT3 and IL-10/pSTAT3) presented in this study in training and validation cohorts (black line) and the ROC analysis result depicting the performance of a statistical model simultaneously employing the two features (IL-6/pSTAT3 and IL-10/pSTAT3) presented in this study in training and validation cohorts (red line) and a colorectal cancer marker (CEA) according to an embodiment of the present disclosure. - A method for providing information required for the diagnosis of colorectal cancer, the method including: measuring the level of STAT3 phosphorylation in Th cells contained in a first sample; and measuring the level of STAT3 phosphorylation in Tc cells contained in a second sample.
- Hereinafter, the present disclosure will be described in more detail by the following examples. However, these examples are used only for illustration, and the scope of the present disclosure is not limited by these examples.
- The subject group included a colorectal cancer group and a healthy group. The colorectal cancer group was composed of patients before surgery and anticancer treatment among patients diagnosed with colorectal cancer in a biopsy during colonoscopy. About 10 ml of fresh peripheral blood was collected prior to surgery, from each of the patients who verbally consented, into a test tube containing heparin as an anti-coagulant. The blood from healthy persons was obtained from an external tissue bank (Korea Gynecology Cancer Back). The blood was promptly delivered to a laboratory of our center on the day of collection.
- Mononuclear were isolated from fresh whole blood by using a specific gravity liquid (1.077) such as Ficoll. The isolation method followed a typical method. Briefly, whole blood was diluted with RPMI1640 medium at 1:1, and then Ficoll and the diluted whole blood were placed in a 50-ml test tube at a ratio of 1:1. After centrifugation at 1300 rpm (350 g) for 20 minutes, the mononuclear cell layer separated between Ficoll and plasma was carefully recovered. The isolated mononuclear cells were suspended in RPMI 1640 culture medium containing 10% fetal bovine serum (FBS), at a concentration of 0.5 × 10⁶ to 1.0 × 10⁶ cells/ml, and then 1.0 ml was dispensed in each of test tubes prepared under the conditions of
test tubes 1 to 4 (test tube 1: nocytokine 1 stimulation (unstimulated, unstim), test tube 2:cytokine 1 stimulated (stimulated, stim), test tube 3: nocytokine 2 stimulation (unstimulated, unstim), and test tube 4:cytokine 2 stimulation (stimulated, stim), and the like) according to the number of cytokines to be identified, and corresponding cytokines were added thereto according to Table 1 below, followed by incubation in a 37°C incubator for 15 minutes. When the phosphorylated STAT protein (pSTAT) targets to be measured are the same, even different cytokines may share the unstim test tubes. The optimal concentration for each cytokine is shown in Table 1 below. The optimal concentration and reaction time were established through prior experiments. - Then, the test tubes were taken out, and quickly treated with 1.5% paraformaldehyde, and then left at room temperature at 25°C for 10 minutes, and the supernatant was removed by centrifugation at 1000 rpm (300 g) for 10 minutes. Then, the cells were well suspended as single cells by using a mixer (vortex), and 1.0 ml of a cold 100% methanol stock solution, which had been stored at -20°C or lower, was added to fix the cells. Care is taken to ensure that the cells were sufficiently present as single cells by adding the cells while mixing cells on the mixer, even during addition. Then, the cells were fixed in a -70°C refrigerator for 1 hour or longer.
TABLE 1 Cytokine IL-6 IL-10 IL-2 Concentration 20ng/ml 10ng/ml 20ng/ml - The upper methanol was removed by centrifugation at 1000 rpm (300g) for 10 minutes, and then the cells were washed three times with phosphate buffered saline (PBS) containing 0.5% bovine serum albumin (BSA) to completely remove the residual liquid. A monoclonal antibody to pSTAT to be identified and a monoclonal antibody cocktail capable of identifying cell fraction were prepared, and then mixed and incubated with the cell suspension to make a final volume of 100 µl. The cells were incubated in a dark place for 30 minutes, washed once with PBS containing 0.5% BSA, and then re-suspended in 300 µl, and thereafter, subjected to acquisition and analysis by using a flow cytometer.
- The composition of each test tube for cytokine stimulation is shown in Table 2, and the composition of the antibody reagent used for each test tube is shown in Table 3.
- In addition, helper T cells and cytotoxic T cells were discriminated by a particular monoclonal marker, and then the median value (median MFI) of the pSTAT expression levels (mean fluorescence intensity, MFI) to each cytokine stimulation on histogram was derived under unstim and stim conditions. Finally, the ratio of stim MFI/unstim MFI was expressed and the results are shown in Table 4.
TABLE 2 Test tube 1 2 3 4 5 6 Stimulant None None IL-6 IL-6 IL-10 IL-2 Concentration - - 20ng/ml 20ng/ml 10ng/ml 20ng/ml TABLE 3 Stain antibody/ Test tube 1 2 3 4 5 6 pSTAT1 (FITC) 5 - 5 - - - pSTAT3 (FITC) - 5 - 5 5 - pSTAT3 (FITC)5 - - - - - 5 CD25 (PE) 2 2 2 2 2 2 CD3 (PercpCY5.5) 10 10 10 10 10 10 CD4 (PE-CY7) 5 5 5 5 5 5 CD45(APC-CY7) 5 5 5 5 5 5 - The levels of phosphorylated STAT proteins (pSTAT) in response to IL-6, IL-10 and IL-2 in the immune cells of the peripheral blood and tumor tissue of the patients and the peripheral blood of the healthy control were observed, and the results are shown in
FIGS. 1 to 5 and Tables 4 to 7 (peripheral blood) and Tables 8 to 11 (tumor site).TABLE 4 ID \ CIPS IL-2_pS TAT 5 Th IL-6_pS TAT1 Th IL-6_pS TAT3 Th IL-10_p STAT 3 Th IL-2_pS TAT5 _Tre g IL-6_pS TAT1 _Tre g IL-6_pS TAT3 _Tre g IL-10_p STAT 3_Tr eg IL-2_pS TAT5 Tc IL-6_pS TAT1 Tc IL-6_pS TAT3 Tc IL-10_p STAT 3 Tc CRC_CIPS 01 NA 2.79 1.67 0.95 NA 2.24 1.57 1.22 NA 2.52 1.68 0.95 CRC_CIPS 02 NA 1.96 3.35 1.92 NA 2.04 3.53 2.34 NA 0.89 1.3 2.27 CRC_CIPS 03 NA 6.59 3.46 2.8 NA 3.94 3.56 3.43 NA 0.89 0.92 3.47 CRC_CIPS 04 NA 16.9 3.53 3.3 NA 7.19 4.05 4.38 NA 1 1.11 5.91 CRC_CIPS 05 NA 9.68 4.1 4.03 NA 5.48 4.79 5.55 NA 1.04 1.26 7.9 CRC_CIPS 06 NA 15.7 3.53 3.14 NA 5.51 3.28 3.85 NA 1.48 1.23 4.66 CRC_CIPS 07 NA 7.09 4.07 3.37 NA 2.85 4.11 4.03 NA 1.08 1.14 5.21 CRC_CIPS 08 NA 6.75 4.66 5.46 NA 3.79 4.43 5.14 NA 1.37 1.48 6.9 CRC_CIPS 09 NA 14.4 7.66 8.34 NA 7.99 6.59 7.47 NA 1.3 1.57 9.87 CRC_CIPS 10 NA 14 7.81 9.04 NA 7.67 6.94 7.91 NA 1.33 1.24 9.86 CRC_CIPS 11 NA 1.59 3.88 3.81 NA 1.68 3.24 3.6 NA 1.14 1.38 4.4 CRC_CIPS 12 NA 3 4.4 3.41 NA 1.83 4.26 4.34 NA 1.08 1.59 5.89 CRC_CIPS 13 NA 8.23 2.86 1.46 NA 3.1 3.93 1.95 NA 1.6 1.3 1.86 CRC_CIPS 14 NA 8.15 6.83 2.55 NA 4.68 6.71 3.84 NA 0.97 1.14 3.81 CRC_CIPS 15 NA 3.75 5.26 3 NA 2.04 4.57 3.98 NA 1.64 1.14 4 TABLE 5 ID \ CIPS IL-2_pS TAT5 Th IL-6_pS TAT1 Th IL-6_pS TAT3 Th IL-10_p STAT 3 Th IL-2_pS TAT5 _Tre g IL-6_pS TAT1 _Tre g IL-6_pS TAT3 _Tre g IL-10_p STAT 3_Tr eg IL-2_pS TAT5 Tc IL-6_pS TAT1 Tc IL-6_pS TAT3 Tc IL-10_p STAT 3 Tc CRC_CIPS 16 NA 0.84 1.22 6.97 NA 2.75 8.7 6.59 NA 0.82 1.16 7.4 CRC_CIPS 17 NA 2.13 4.11 3.27 NA 2.09 4.42 3.81 NA 0.97 1.22 3.8 CRC_CIPS 18 NA 5 8.99 4.19 NA 2.49 11.7 7.03 NA 1.08 1.49 5.52 CRC_CIPS 19 NA 5.13 5.04 3.55 NA 4.52 6.08 5.01 NA 1.16 1.27 7.24 CRC_CIPS 20 NA 2.4 6.09 3.24 NA 2.92 7 4.09 NA 1.23 1.14 4.6 CRC_CIPS 21 NA 9.71 4.11 2.71 NA 17.6 8.53 6.33 NA 1.02 1.25 7.21 CRC_CIPS 22 NA 7.07 1.53 1.14 NA 4.64 1.02 1.29 NA 1.1 0.31 1.25 CRC_CIPS 23 NA 4.61 3.73 1.57 NA 7.29 4.46 2.04 NA 1.29 1.09 1.83 CRC_CIPS 24 NA 13.2 6.06 3.97 NA 9.5 9.11 6.95 NA 1.12 1.47 3.97 CRC_CIPS 25 5.67 NA 5.57 4.3 12.6 NA 10.4 9.59 7.16 NA 1.19 6.65 CRC_CIPS 26 3.6 5.49 5.21 3.75 6.3 3.84 10.5 10.8 4.64 1.33 1.22 5.07 CRC_CIPS 27 3.08 7.34 3.36 1.75 6.53 6.11 3.07 2.27 2.38 1.25 1.02 1.78 CRC_CIPS 28 3.97 9.2 5.56 5.42 5.93 10 5.49 6.47 3.79 1.05 1.15 5.38 CRC_CIPS 29 NA NA 6.04 5.35 NA NA 5.69 6.02 NA NA 1.42 6.02 CRC_CIPS 30 3.18 2.19 4.39 3.61 5.44 2.38 4.83 4.74 2.58 1.14 1.4 3.56 TABLE 6 ID \ CIPS IL-2_pS TAT5 Th IL-6_pS TAT1 Th IL-6_pS TAT3 Th IL-10_p STAT 3 Th IL-2_pS TAT5 _Tre g IL-6_pS TAT1 _Tre g IL-6_pS TAT3 _Tre g IL-10_p STAT 3_Tr eg IL-2_pS TAT5 Tc IL-6_pS TAT1 Tc IL-6_pS TAT3 Tc IL-10_p STAT 3 Tc CRC_CIPS 31 3.67 NA 5.42 NA 7.14 NA 4.98 NA 3.32 NA 1.04 NA CRC_CIPS 32 3.36 NA 5.57 NA 6.04 NA 7.2 NA 3.37 NA 1.25 NA CRC_CIPS 33 3.27 NA 4.57 NA 5.06 NA 5.73 NA 3.19 NA 1.16 NA CRC_CIPS 34 3.26 NA 3 NA 5.03 NA 4.03 NA 2.53 NA 1.12 NA CRC_CIPS 35 3.73 7.46 6.41 1.5 7.96 2.04 5.05 1.93 4.13 1.08 1.26 1.65 CRC_CIPS 36 2.96 11.1 5.82 2.7 5.96 15.1 5.94 3.91 4 1.12 1.17 2.83 CRC_CIPS 37 5.63 NA 5.4 2.25 7.48 NA 6.59 3.81 4.55 NA 1.09 2.24 CRC_CIPS 38 6.19 NA 4.74 4.15 13.8 NA 7.48 7.14 5.19 NA 1.28 4.38 CRC_CIPS 39 5.09 NA 3.65 2.98 7.18 NA 4.18 4.02 4.43 NA 1.18 3.27 CRC_CIPS 40 3.96 NA 3.72 1.72 6.8 NA 4.76 2.62 2.8 NA 0.95 1.53 TABLE 7 ID \ CIPS IL-2_pS TAT5 Th IL-6_pS TAT1 Th IL-6_pS TAT3 Th IL-10_p STAT 3 Th IL-2_pS TAT5 _Tre g IL-6_pS TAT1 _Tre g IL-6_pS TAT3 _Tre g IL-10_p STAT 3_Tr eg IL-2_pS TAT5 Tc IL-6_pS TAT1 Tc IL-6_pS TAT3 Tc IL-10_p STAT 3 Tc CON CIPS 01 3.7 9.48 4.93 2.27 6.67 6.75 5.43 3.8 2.42 7.69 3.85 2.22 CON CIPS 02 3.13 7.39 4.54 2.15 8.86 7.39 5.15 3.42 2.98 1.17 1.36 2.62 CON CIPS 03 4.76 15.4 4.67 2.38 12.1 13.4 6 4.14 6.17 1.71 1.8 3.25 CON CIPS 04 5.22 16 2.71 1.54 12 19.4 3.55 2.45 5.55 15.5 2.67 1.83 CON CIPS 05 3.57 15 3.41 1.68 6.85 12.9 3.57 2.46 3.46 2.92 2.33 1.75 CON CIPS 06 2.73 13.3 4.63 2.06 5.56 6.72 4.46 3.06 2.87 1.34 1.48 2.61 CON CIPS 07 2.77 7.91 4.13 2.06 5.79 4.61 4.26 2.92 2.45 1.63 1.91 2.21 CON CIPS 08 2.31 9.55 3.55 2 4.63 7.9 4.07 2.78 1.92 2.88 2.17 1.95 CON CIPS 09 8.92 5.95 5.35 2.91 23.8 4.88 10.3 8.5 8.67 1.4 1.33 4.14 CON CIPS 10 9.88 3.46 6.47 2.49 22 3.97 8.91 5.3 7.39 0.92 1.07 3.3 CON CIPS 11 7.47 3.16 4.93 2.76 19.6 4.55 6.25 4.72 4.99 1.1 1.28 3.36 CON CIPS 12 3.42 8.27 3.05 1.63 4.99 6.89 2.84 1.84 2.93 1.53 1.39 1.68 CON CIPS 13 2.77 10.5 3.13 1.83 4.21 9.75 2.68 2.14 3.19 1.33 1.42 2.03 CON CIPS 14 2.3 10.3 4.09 2.17 4.65 9.03 3.72 2.67 2.78 1.53 1.59 2.36 CON CIPS 15 3.91 9.11 4.92 1.49 10.9 5.66 5.17 2.23 3.29 1.67 1.74 1.75 CON CIPS 16 4.86 15.4 4.06 1.49 10.4 8.41 4.04 2.4 4.51 2.4 2.32 1.54 TABLE 8 ID / CIPS IL-2_pS TAT5 Th IL-6_pS TAT1 Th IL-6_pS TAT3 Th IL-10_p STAT 3 Th IL-2_pS TAT5 _Tre g IL-6_pS TAT1 _Tre g IL-6_pS TAT3 _Tre g IL-10_p STAT 3_Tr eg IL-2_pS TAT5 Tc IL-6_pS TAT1 Tc IL-6_pS TAT3 Tc IL-10_p STAT 3 Tc CRC_CIPS 01 NA 1 0.72 NA 1.25 0.65 NA 0.97 0.87 CRC_CIPS 02 NA 2.05 1.77 1.39 NA 2.2 1.7 1.48 NA 1.29 1.13 1.48 CRC_CIPS 03 NA 1.56 1.98 1.09 NA 1.48 2.06 1.14 NA 0.94 1.26 1.17 CRC_CIPS 04 NA 1.34 1.16 1.51 NA 1.49 1.47 1.61 NA 1.04 0.97 1.78 CRC_CIPS 05 NA 1.01 0.84 1.61 NA 1.11 0.96 2.04 NA 1.05 0.93 2.16 CRC_CIPS 06 NA 1.35 0.91 2.28 NA 1.67 1.44 3 NA 1.23 1.06 4.3 CRC_CIPS 07 NA 1.03 1.2 2.02 NA 1.15 1.27 2.37 NA 1.02 1.03 2.43 CRC_CIPS 08 NA 1.6 1.46 3.37 NA 1.8 1.7 3.5 NA 1.11 1.27 6.12 CRC_CIPS 09 NA 0.94 1.13 2.42 NA 0.84 0.96 2.22 NA 1.06 1.01 3.49 CRC_CIPS 10 NA 0.94 1.3 2.58 NA 1 1.38 2.75 NA 0.85 1.23 4.65 CRC_CIPS 11 NA 1.12 1.26 1.46 NA 1.1 1.46 0.55 NA 1.42 1.46 3.43 CRC_CIPS 12 NA 1.04 1.14 2.01 NA 1.08 1.14 2.13 NA 1.42 1.01 2.07 CRC_CIPS 13 NA 0.59 1.18 1.37 NA 0.59 1.46 1.55 NA 0.48 0.98 1.49 CRC_CIPS 14 NA 1.13 1.92 2.01 NA 1.45 2.91 3.1 NA 0.8 1.12 2.22 CRC_CIPS 15 NA 1.24 1.01 2 NA 1.17 1.34 2.56 NA 1.12 1.07 2.85 TABLE 9 ID / CIPS IL-2_pS TAT5 Th IL-6_pS TAT1 Th IL-6_pS TAT3 Th IL-10_p STAT 3 Th IL-2_pS TAT5 _Tre g IL-6_pS TAT1 _Tre g IL-6_pS TAT3 _Tre g IL-10_p STAT 3_Tr eg IL-2_pS TAT5 Tc IL-6_pS TAT1 Tc IL-6_pS TAT3 Tc IL-10_p STAT 3 Tc CRC_CIPS 16 NA 1.85 2.41 1.9 NA 2.45 3.05 2.6 NA 1.08 1.05 2.66 CRC_CIPS 17 NA 0.89 1.12 1.52 NA 0.92 1.37 2.04 NA 0.77 0.92 1.4 CRC_CIPS 18 NA 0.94 1.46 2.28 NA 0.82 1.49 2.92 NA 0.89 1.25 2.78 CRC_CIPS 19 NA 0.99 1.26 2.33 NA 1.28 2.12 4.12 NA 0.89 1.08 2.19 CRC_CIPS 20 NA 1.73 3.32 1.87 NA 3.22 4.96 2.6 NA 1.08 1.21 1.87 CRC_CIPS 21 NA 1.39 1.81 2.2 NA 8.27 8.36 7.86 NA 1.1 1.22 3.74 CRC_CIPS 22 NA 1.65 2.32 1.93 NA 2.24 3 3.22 NA 0.7 0.98 1.9 CRC_CIPS 23 NA 0.94 1.06 3.72 NA 2 0.93 7.33 NA 1 1.11 4.56 CRC_CIPS 24 NA 1.53 1.73 2.35 NA 1.68 2.58 3.96 NA 1.21 1.2 2.34 CRC_CIPS 25 3.33 NA 1.86 1.68 12.7 NA 4.61 5.56 4.69 NA 1.12 2.27 CRC_CIPS 26 3.79 1.39 1.42 2.53 9.69 1.71 4.89 10.6 4.08 1.07 1.06 3 CRC_CIPS 27 3 1.05 1.26 1.4 5.93 1.04 1.3 1.68 2.4 0.92 1.04 1.45 CRC_CIPS 28 2.84 1.2 1.2 2.8 5.21 2.23 2.56 4.44 3.04 1.04 1.05 2.98 CRC_CIPS 29 4.43 1.17 1.15 1.95 6.08 1.96 1.78 2.54 4.71 1.12 1.13 2.57 CRC_CIPS 30 2.53 NA NA NA 4.52 NA NA NA 2.3 NA NA NA TABLE 10 ID / CIPS IL-2_pS TAT5 Th IL-6_pS TAT1 Th IL-6_pS TAT3 Th IL-10_p STAT 3 Th IL-2_pS TAT5 _Tre g IL-6_pS TAT1 _Tre g IL-6_pS TAT3 _Tre g IL-10_p STAT 3_Tr eg IL-2_pS TAT5 Tc IL-6_pS TAT1 Tc IL-6_pS TAT3 Tc IL-10_p STAT 3 Tc CRC_CIPS 31 2.1 NA 1.06 NA 4.93 NA 2.1 NA 2.66 NA 0.92 NA CRC_CIPS 32 2.89 NA 1.08 NA 6.79 NA 1.28 NA 3.07 NA 1.09 NA CRC_CIPS 33 3.04 NA 1.06 NA 9.39 NA 1.1 NA 2.62 NA 1.09 NA CRC_CIPS 34 3.1 NA NA NA 8.61 NA NA NA 2.59 NA NA NA CRC CIPS 35 1.28 NA NA NA 1.89 NA NA NA 1.34 NA NA NA CRC CIPS 36 2.35 NA 1.21 1.05 4.21 NA 1.71 NA 2.04 NA 1.11 1.15 CRC_CIPS 37 3.57 NA 1.22 1.62 7.72 NA 1.68 2.53 3.02 NA 1.13 1.61 CRC_CIPS 38 1.85 NA 1.32 1.34 7.82 NA 2.11 2.32 1.84 NA 1.38 1.49 CRC_CIPS 39 1.86 NA 1.17 1.27 4.45 NA 1.2 1.65 2.08 NA 1.09 1.38 CRC_CIPS 40 2.97 0.99 1.15 1.31 6.14 1.41 1.67 1.49 3.14 1.01 1.08 1.26 TABLE 11 ID / CIPS IL-2_pS TAT5 Th IL-6_pS TAT1 Th IL-6_pS TAT3 Th IL-10_p STAT 3 Th IL-2_pS TAT5 _Tre g IL-6_pS TAT1 _Tre g IL-6_pS TAT3 _Tre g IL-10_p STAT 3_Tr eg IL-2_pS TAT5 Tc IL-6_pS TAT1 Tc IL-6_pS TAT3 Tc IL-10_p STAT 3 Tc CON CIPS 01 NA NA NA NA NA NA NA NA NA NA NA NA CON CIPS 02 NA NA NA NA NA NA NA NA NA NA NA NA CON CIPS 03 NA NA NA NA NA NA NA NA NA NA NA NA CON CIPS 04 NA NA NA NA NA NA NA NA NA NA NA NA CON CIPS 05 NA NA NA NA NA NA NA NA NA NA NA NA CON CIPS 06 NA NA NA NA NA NA NA NA NA NA NA NA CON CIPS 07 NA NA NA NA NA NA NA NA NA NA NA NA CON CIPS 08 NA NA NA NA NA NA NA NA NA NA NA NA CON CIPS 09 NA NA NA NA NA NA NA NA NA NA NA NA CON CIPS 10 NA NA NA NA NA NA NA NA NA NA NA NA CON CIPS 11 NA NA NA NA NA NA NA NA NA NA NA NA CON CIPS 12 NA NA NA NA NA NA NA NA NA NA NA NA CON CIPS 13 NA NA NA NA NA NA NA NA NA NA NA NA CON CIPS 14 NA NA NA NA NA NA NA NA NA NA NA NA CON CIPS 15 NA NA NA NA NA NA NA NA NA NA NA NA CON CIPS 16 NA NA NA NA NA NA NA NA NA NA NA NA - As can be seen in
FIGS. 1 to 5 and Tables 4 to 11, IL-6-induced pSTAT1 and pSTAT3 were significantly decreased in tumor infiltrating lymphocytes (TILs). It was also identified that the cytokine-induced phosphorylated STAT signature (CIPS signature) of the peripheral blood lymphocytes reflected the CIPS signature of TILs. - Such similar phenomenon was observed in IL-6-induced pSTAT1 of Helper T cells, regulatory T cells, and cytotoxic T cells, as well as in pSTAT3 of Tc cells. However, unusually, IL-10-induced pSTAT3 was similar in both TILs and healthy control cells, but significantly increased in the peripheral blood lymphocytes of the patients.
- Overall, it was identified that the levels of intracellular STAT protein phosphorylation (pSTAT) by IL-6 and IL-10 were statistically very different between the immune cells derived from tumor tissue of colorectal cancer patients and the immune cells derived from the blood of normal persons and that there was phosphorylation at the medium levels therebetween in the immune cells derived from the blood of the colorectal cancer patients.
- In order to investigate whether the findings observed in the patient-derived immune cells were caused by tumor cells, HCT116 (American Type Culture Collection, ATCC CCL-247), which is a colorectal cancer cell line, and mononuclear cells of the peripheral blood of normal persons were co-cultured in vitro. The cell mixing conditions and the number of cells in the in-vitro co-culture experiment are shown in Table 6. The levels of STAT protein phosphorylation for each cytokine were measured, the results are shown in
FIG. 6 and Tables 13 to 15. (Table 13: Th, Table 14: Treg, and Table 15: Tc) - Co-culturing was performed under two conditions. That is, while the ratios of tumor cells and mononuclear cells of normal persons were 1:1 and 1:10, the first condition was that the two kinds of cells were directly mixed and co-cultured in one experimental well (direct), and the second condition was that, in an experimental well with a septum (transwell), the tumor cells were placed in the upper layer of the septum and the mononuclear cells of normal persons were placed in the lower layer and co-cultured (indirect).
TABLE 12 Ratio Number of tumor cells Number of mononuclear cells of normal persons 1:1 3 × 10⁶ 3 × 10⁶ 1:10 3 × 10⁵ 3 × 10⁶ TABLE 13 ID / CIPS IL-2_pSTAT5_T h IL-6_pSTAT1_T h IL-6_pSTAT3_T h IL-10_pSTAT3_ Th PBMC_01 11.72 5.98 PBMC_02 2.31 2.94 1.96 1.02 PBMC_03 3.86 1.97 1.62 1.08 PBMC_04 3.92 1.88 1.72 0.87 PBMC_05 5.51 5.62 3.07 1.55 PBMC_06 6.32 7.68 2.49 1.32 PBMC_07 6.88 2.03 2.76 1.41 PBMC_08 3.68 5.31 3.80 1.91 PBMC_09 8.03 3.10 2.34 1.67 PBMC_10 7.00 1.82 1.45 1.37 PBMC_11 8.11 1.05 1.58 1.38 PBMC_12 4.55 2.99 1.46 1.36 PBMC_13 4.04 5.49 2.29 1.57 PBMC_14 7.41 7.54 2.55 1.68 PBMC_HCT116_R1_Direct_01 3.50 0.09 0.69 1.15 PBMC_HCT116_R1_Direct_02 2.23 1.47 1.12 1.15 PBMC_HCT116_R1_Direct_03 2.69 1.17 1.20 0.95 PBMC_HCT116_R1_Direct_04 2.39 1.20 1.11 1.12 PBMC_HCT116_R1_Direct_05 2.71 1.28 1.18 1.41 PBMC_HCT116_R1_Direct_06 5.29 1.26 1.24 1.28 PBMC_HCT116_R1_Direct_07 3.07 1.58 1.34 1.22 PBMC_HCT116_R1_Direct_08 4.76 1.30 0.90 0.88 PBMC_HCT116_R10_Direct_01 2.80 0.27 0.68 0.91 PBMC_HCT116_R10_Direct_02 1.70 1.12 1.28 1.02 PBMC_HCT116_R10_Direct_03 2.47 1.68 1.43 1.09 PBMC_HCT116_R10_Direct_04 2.53 1.90 1.56 1.22 PBMC_HCT116_R10_Direct_05 1.71 1.70 1.21 1.39 PBMC_HCT116_R10_Direct_06 4.16 1.38 1.36 1.16 PBMC_HCT116_R10_Direct_07 2.49 1.55 1.16 1.30 PBMC_HCT116_R10_Direct_08 3.80 0.97 1.21 1.53 PBMC_HCT116_R10_Direct_09 5.46 1. 08 1.22 1.14 PBMC_HCT116_R10_Direct_10 3.29 0.87 0.99 1.28 PBMC_HCT116_R10_Direct_11 2.71 0.95 1.05 1.12 PBMC_HCT116_R10_Direct_12 4.00 0.86 1.15 1.12 PBMC_HCT116_R10_Indirect_01 7.26 1.09 1.30 1.07 PBMC_HCT116_R10_Indirect_02 7.16 1.14 1.30 1.28 PBMC_HCT116_R10_Indirect_03 2.63 1.04 0.97 1.14 PBMC_HCT116_R10_Indirect_04 5.34 1.01 1.16 1.30 TABLE 14 ID / CIPS IL-2_pSTAT5_T reg IL-6_pSTAT1_T reg IL-6_pSTAT3_T reg IL-10_pSTAT3_ Treg PBMC_01 30.51 6.61 PBMC_02 4.01 2.29 1.75 1.48 PBMC_03 3.25 1.98 5.70 2.10 PBMC_04 10.92 9.03 1.43 0.90 PBMC_05 13.47 3.28 3.02 1.80 PBMC_06 10.96 10.74 3.28 2.57 PBMC_07 11.54 3.29 2.44 1.79 PBMC_08 6.27 4.53 2.80 2.28 PBMC_09 7.68 4.75 3.22 2.10 PBMC_10 11.00 1.63 1.35 1.41 PBMC_11 8.19 0.97 1.52 1.63 PBMC_12 4.82 1.63 1.52 1.50 PBMC_13 1.74 6.84 2.98 2.56 PBMC_14 6.36 7.70 2.94 2.06 PBMC_HCT116_R1_Direct_01 4.98 -0.12 0.52 1.78 PBMC_HCT116_R1_Direct_02 2.72 1.15 1.69 1.77 PBMC_HCT116_R1_Direct_03 1.73 0.96 1.45 1.28 PBMC_HCT116_R1_Direct_04 12.00 1.15 1.17 1.38 PBMC_HCT116_R1_Direct_05 10.88 2.14 1.27 2.15 PBMC_HCT116_R1_Direct_06 7.77 1.72 0.98 1.15 PBMC_HCT116_R1_Direct_07 8.14 1.65 1.33 1.36 PBMC_HCT116_R1_Direct_08 14.60 1.31 0.94 1.02 PBMC_HCT116_R10_Direct_01 4.94 0.11 0.51 1.47 PBMC_HCT116_R10_Direct_02 1.61 1.15 1.45 1.24 PBMC_HCT116_R10_Direct_03 1.16 2.26 1.93 1.34 PBMC_HCT116_R10_Direct_04 8.56 3.58 1.62 1.26 PBMC_HCT116_R10_Direct_05 4.27 1.45 1.16 1.68 PBMC_HCT116_R10_Direct_06 6.02 3.75 1.37 1.29 PBMC_HCT116_R10_Direct_07 5.20 1.89 1.27 1.74 PBMC_HCT116_R10_Direct_08 7.94 0.87 1.24 1.54 PBMC_HCT116_R10_Direct_09 6.89 0.96 0.96 1.31 PBMC_HCT116_R10_Direct_10 6.72 0.80 1.21 1.37 PBMC_HCT116_R10_Direct_11 2.27 0.95 1.02 1.25 PBMC_HCT116_R10_Direct_12 3.92 1.01 1.15 1.26 PBMC_HCT116_R10_Indirect_01 8.50 0.93 1.24 1.04 PBMC_HCT116_R10_Indirect_02 3.20 1.36 1.42 1.59 PBMC_HCT116_R10_Indirect_03 1.26 1.05 0.94 1.24 PBMC_HCT116_R10_Indirect_04 2.68 1.27 1.27 1.46 TABLE 15 ID \ CIPS IL-2_pSTAT5_T c IL-6_pSTAT1_T c IL-6_pSTAT3_T c IL-10_pSTAT3_ Tc PBMC_01 1.63 1.76 PBMC_02 3.32 0.36 0.12 1.25 PBMC_03 6.04 1.22 1.06 1.27 PBMC_04 0.83 1.14 1.09 1.13 PBMC_05 6.93 1.37 1.44 1.65 PBMC_06 6.63 1.66 1. 98 1.61 PBMC_07 7.88 0.94 1.00 1.70 PBMC_08 3.51 1.48 1.78 1.92 PBMC_09 4.58 1.27 1.41 2.13 PBMC_10 6.48 1.21 1.00 1.76 PBMC_11 7.95 0.95 1.11 1.70 PBMC_12 4.86 1.12 1.05 2.39 PBMC_13 4.50 2.06 1.98 1.82 PBMC_14 5.40 1.53 1.44 2.00 PBMC_HCT116_R1_Direct_01 4.15 -0.18 0.06 1.81 PBMC_HCT116_R1_Direct_02 4.22 1.24 1.00 1.39 PBMC_HCT116_R1_Direct_03 0.55 0.98 1.05 1.42 PBMC_HCT116_R1_Direct_04 5.71 1.00 1.01 1.57 PBMC_HCT116_R1_Direct_05 5.53 1.00 1.00 1.92 PBMC_HCT116_R1_Direct_06 5.64 1.07 1.04 1.52 PBMC_HCT116_R1_Direct_07 3.64 1.25 1.11 1.38 PBMC_HCT116_R1_Direct_08 9.34 1.21 0.89 1.21 PBMC_HCT116_R10_Direct_01 4.06 -0.06 0.03 1.52 PBMC_HCT116_R10_Direct_02 3.92 0.99 1.09 1.28 PBMC_HCT116_R10_Direct_03 1.94 1. 18 1.10 1.53 PBMC_HCT116_R10_Direct_04 5.05 1.19 1.29 1.54 PBMC_HCT116_R10_Direct_05 2.59 1.39 1.06 1.57 PBMC_HCT116_R10_Direct_06 4.36 1.14 0.90 1.57 PBMC_HCT116_R10_Direct_07 2.56 1.30 1.16 1.53 PBMC_HCT116_R10_Direct_08 3.64 0.90 1.09 1.88 PBMC_HCT116_R10_Direct_09 5.91 1.01 1.01 1.17 PBMC_HCT116_R10_Direct_10 7.27 0.79 0.96 1.35 PBMC_HCT116_R10_Direct_11 4.39 0.98 0.98 1.22 PBMC_HCT116_R10_Direct_12 4.22 1.00 1.03 1.32 PBMC_HCT116_R10_Indirect_01 7.69 1.11 1.21 1.17 PBMC_HCT116_R10_Indirect_02 7.38 1.00 1.13 1.68 PBMC_HCT116_R10_Indirect_03 3.39 1.04 0.98 1.35 PBMC_HCT116_R10_Indirect_04 5.23 0.93 1.05 1.56 - As can be seen from
FIG. 6 and Tables 13 to 15, it was observed that in both cases of direct contact culture or indirect culture with tumor cells, abnormality was induced in cytokine signaling in peripheral lymphocytes of normal persons similar to T cells of the tumor infiltrating environment. In addition, this was not affected by the ratio of normal cells and tumor cell lines in co-culture or the manner of direct or indirect culture (1:1 and 1:10). However, the IL-2-induced pSTAT5 signatures were not observed to show significant decreases in all of Th cells, Tc cells, and Treg cells. Especially, almost similar levels of phosphorylation in Treg cells, suggesting that no functional abnormality occurred in response to IL-2 in the STAT signaling system even in the tumor environment. Overall, similar to the results in actual patients, the levels of pSTAT by IL-6 and IL-10 were statistically significantly different, and mainly decreased in the immune T cells cultured with tumor cells. - CIPS signatures of 30 CRC patients and 15 healthy persons were subjected to cluster analysis. Specifically, the distances between sample results were analyzed by the hierarchical clustering method using R language, and in order to schematize the distances, a heatmap was drawn using the gplot R package. The results are shown in
FIG. 7 . - As can be seen in
FIG. 7 , between the two groups, there were distinct differences in the IL-10-induced pSTAT3 signatures on Th, Treg, and Tc cells. - Analysis was performed using the principal component analysis package embedded in software through the R language, and the results are shown in
FIGS. 8 and9 . - As can be seen from
FIG. 8 , there was different types of clustering between the colorectal cancer patient group and the normal person group. Especially, as confirmed inFIG. 9 ., the colorectal cancer patient group and the normal person group can be well distinguished by only the numerical values of IL-6-induced pSTAT3 on Tc cells and IL-10-induced pSTAT3 on Th cells. - Two CIPS patterns were identified through a statistical method and leave-one-out cross validation. Specifically, two features with the highest mean decrease Gini (MDG) value were selected among several CIPS features by using the random Forest package of R language, and a model was established using the logistic regression function embedded in R language. LOOCV was performed through R coding, and the ROCR package was utilized to plot an ROC curve. The results are shown in
FIGS. 10 to 11 . - As can be confirmed from
FIGS. 10 and11 , the use of IL-6-induced pSTAT3 on Tc cells and IL-10-induced pSTAT3 on Th cells can discriminate the tumor group and the normal group, and the AUC was 0.88. This was reproduced in the validation cohort with 15 CRC patients and 17 healthy persons (AUC 0.941). When training cohort and validation cohort were synthetically analyzed, the AUC was 0.938. - The discrimination between groups was analyzed by applying the carcinoembryonic antigen (CEA) protein marker, known as an existing CRC tumor marker, to both the two CIPS patterns, that is, IL-6-induced pSTAT3 on Tc cells and IL-10-induced pSTAT3 on Th cells. Specifically, it was predicted whether each patient was a cancer patient with a probability of 50% or more by using the previously established model, and the results were compared with the actually labeled (cancer patient vs. healthy person) values. The tumor patients were essentially tested for CEA, and thus the previously obtained test value and two markers derived in this experiment were analyzed by the same manner and model, and the results are shown in
FIG. 13 and Table 16.TABLE 16 CRC patients Health controls Positive predicted 41 4 Negative predicted 4 29 - As can be seen from
FIG. 13 and Table 16, the AUC was identified to be excellent, 0.958, proving that the diagnostic use of the two markers in combination can maximize the utility thereof. The positive and negative predictive values were shown as 91% and 88%, respectively. - Combining the above results, it was confirmed that the measurement values of STAT phosphorylation by interleukin in immune T cells derived from blood were different between normal persons and colorectal cancer patients, and the combination of these values enables a technique capable of diagnosing a colorectal patient through the blood. Even the use of two markers in combination showed excellent performance with sensitivity of 91% and specificity of 88%, and the use thereof in combination with existing known colorectal cancer markers can further improve the diagnostic sensitivity and specificity thereof.
- The present disclosure relates to a marker for diagnosing colorectal cancer, a method for providing information required for diagnosis of colorectal cancer by using the same, and a method for providing information for monitoring a therapeutic response of colorectal cancer by using the same.
Claims (19)
- A method for providing information required for the diagnosis of colorectal cancer, the method comprising:measuring the level of STAT3 phosphorylation in Th cells contained in a first sample; andmeasuring the level of STAT3 phosphorylation in Tc cells contained in a second sample.
- The method of claim 1, wherein the first sample and the second sample include peripheral blood.
- The method of claim 1, wherein the measuring of the level of STAT3 phosphorylation is performed using flow cytometry.
- The method of claim 1, wherein the first sample is prepared by:a mononuclear cell isolation step of isolating mononuclear cells contained in blood;a cytokine treatment step of treating the isolated mononuclear cells with a cytokine; anda phosphorylation staining step of performing phosphorylation staining.
- The method of claim 4, wherein the cytokine is IL-10.
- The method of claim 4, wherein the concentration of the cytokine is 9.0 to 11.0 ng/ml.
- The method of claim 1, wherein the second sample is prepared by:a mononuclear cell isolation step of isolating mononuclear cells contained in blood;a cytokine treatment step of treating the isolated mononuclear cells with a cytokine; anda phosphorylation staining step of performing phosphorylation staining.
- The method of claim 7, wherein the cytokine is IL-6.
- The method of claim 7, wherein the concentration of the cytokine is 19.0 to 21.0 ng/ml.
- A method for providing information for monitoring a therapeutic response of colorectal cancer, the method comprising:measuring the level of STAT3 phosphorylation in Th cells contained in a first sample; andmeasuring the level of STAT3 phosphorylation in Tc cells contained in a second sample.
- The method of claim 10, wherein the first sample and the second sample are obtained from a patient who is being treated for colorectal cancer.
- The method of claim 10, wherein the first sample and the second sample include peripheral blood.
- The method of claim 10, wherein the measuring of the level of STAT3 phosphorylation is performed using flow cytometry.
- The method of claim 10, wherein the first sample is prepared by:a mononuclear cell isolation step of isolating mononuclear cells contained in blood;a cytokine treatment step of treating the isolated mononuclear cells with a cytokine; anda phosphorylation staining step of performing phosphorylation staining.
- The method of claim 14, wherein the cytokine is IL-10.
- The method of claim 14, wherein the concentration of the cytokine is 9.0 to 11.0 ng/ml.
- The method of claim 10, wherein the second sample is prepared by:a mononuclear cell isolation step of isolating mononuclear cells contained in blood;a cytokine treatment step of treating the isolated mononuclear cells with a cytokine; anda phosphorylation staining step of performing phosphorylation staining.
- The method of claim 17, wherein the cytokine is IL-6.
- The method of claim 17, wherein the concentration of the cytokine is 19.0 to 21.0 ng/ml.
Applications Claiming Priority (2)
| Application Number | Priority Date | Filing Date | Title |
|---|---|---|---|
| KR1020190052556A KR102199141B1 (en) | 2019-05-03 | 2019-05-03 | Diagnostic biomarker of colorectal cancer using cytokine-induced STAT phosphorylation in peripheral blood immune cells by flow cytometry |
| PCT/KR2020/005778 WO2020226366A1 (en) | 2019-05-03 | 2020-04-29 | Marker for diagnosing colorectal cancer and method for providing information required for diagnosis of colorectal cancer |
Publications (2)
| Publication Number | Publication Date |
|---|---|
| EP3964835A1 true EP3964835A1 (en) | 2022-03-09 |
| EP3964835A4 EP3964835A4 (en) | 2022-07-20 |
Family
ID=73051511
Family Applications (1)
| Application Number | Title | Priority Date | Filing Date |
|---|---|---|---|
| EP20801458.9A Pending EP3964835A4 (en) | 2019-05-03 | 2020-04-29 | MARKER FOR DIAGNOSING COLORECTAL CANCER AND METHOD FOR PROVIDING INFORMATION REQUIRED FOR DIAGNOSIS OF COLORECTAL CANCER |
Country Status (4)
| Country | Link |
|---|---|
| US (1) | US12345710B2 (en) |
| EP (1) | EP3964835A4 (en) |
| KR (1) | KR102199141B1 (en) |
| WO (1) | WO2020226366A1 (en) |
Family Cites Families (6)
| Publication number | Priority date | Publication date | Assignee | Title |
|---|---|---|---|---|
| WO2006065894A2 (en) | 2004-12-14 | 2006-06-22 | University Of South Florida | Methods for inhibiting stat3 signaling in immune cells |
| WO2010081158A2 (en) * | 2009-01-12 | 2010-07-15 | The Board Of Regents Of The University Of Texas System | Blood test for the detection of cancer |
| CN102947706B (en) | 2010-04-19 | 2018-04-13 | 生物标志物策略公司 | Compositions and methods for predicting drug sensitivity, resistance and disease progression |
| WO2012078982A2 (en) | 2010-12-09 | 2012-06-14 | The Ohio State University | Xzh-5 inhibits constitutive and interleukin-6-induced stat3 phosphorylation in human hepatocellular carcinoma cells |
| WO2013112942A1 (en) | 2012-01-25 | 2013-08-01 | Dna Trix, Inc. | Biomarkers and combination therapies using oncolytic virus and immunomodulation |
| KR101999359B1 (en) | 2017-11-08 | 2019-10-01 | 주식회사 엠프로스 | Respiratory sensing device and respiratory monitoring system |
-
2019
- 2019-05-03 KR KR1020190052556A patent/KR102199141B1/en active Active
-
2020
- 2020-04-29 EP EP20801458.9A patent/EP3964835A4/en active Pending
- 2020-04-29 US US17/594,925 patent/US12345710B2/en active Active
- 2020-04-29 WO PCT/KR2020/005778 patent/WO2020226366A1/en not_active Ceased
Also Published As
| Publication number | Publication date |
|---|---|
| WO2020226366A1 (en) | 2020-11-12 |
| US12345710B2 (en) | 2025-07-01 |
| US20220221462A1 (en) | 2022-07-14 |
| KR20200127779A (en) | 2020-11-11 |
| EP3964835A4 (en) | 2022-07-20 |
| KR102199141B1 (en) | 2021-01-06 |
Similar Documents
| Publication | Publication Date | Title |
|---|---|---|
| US11705220B2 (en) | Systems and methods for identifying cancer treatments from normalized biomarker scores | |
| Ogino et al. | Randomized trial of neoadjuvant vaccination with tumor-cell lysate induces T cell response in low-grade gliomas | |
| Vujanovic et al. | CD56dim CD16− natural killer cell profiling in melanoma patients receiving a cancer vaccine and interferon-α | |
| KR20150035521A (en) | In Vitro Method for the Diagnosis and Surveillance of Cancer | |
| US20190284640A1 (en) | Methods and Systems for Predicting Response to Immunotherapies for Treatment of Cancer | |
| JP2020533608A (en) | Prediction of response to immunotherapy | |
| JP5295950B2 (en) | Methods and reagents for detecting susceptibility to graft-versus-host disease or transplant-related death | |
| Page et al. | A phase Ib study of preoperative, locoregional IRX-2 cytokine immunotherapy to prime immune responses in patients with early-stage breast cancer | |
| Bai et al. | Quantification and functional studies of neutrophilic cells identifies distinct papilloma phenotypes | |
| Hara et al. | Type 2 diabetes alters quiescent pancreatic stellate cells to tumor-prone state | |
| US12345710B2 (en) | Marker for diagnosing colorectal cancer and method for providing information required for diagnosis of colorectal cancer | |
| Kosmider et al. | VEXAS syndrome is characterized by blood and tissues inflammasome pathway activation and monocyte dysregulation | |
| Jansen et al. | Immune niches in brain metastases contain TCF1+ stem-like T cells, are associated with disease control and are modulated by preoperative SRS | |
| Szántó et al. | Real-time quantitative PCR detection of WT1 and M-BCR-ABL expressions in chronic myeloid leukemia | |
| El-Sayed et al. | Prognostic value of FOXP3 and TGF-β expression in both peripheral blood and lymph nodes in patients with B-Non Hodgkin’s lymphoma | |
| JP7175068B2 (en) | Biomarkers for predicting response to cancer therapy | |
| US20240036060A1 (en) | Optimal combination of early biomarkers for infection and sepsis diagnosis in emergency department | |
| Potchen et al. | Tissue-specific adaptation of human T cells is preserved during tissue inflammation | |
| To et al. | Single-cell transcriptomics reveal distinct subsets of activated dendritic cells in the tumor microenvironment | |
| Marino et al. | Differential IL-7 responses in developing human thymocytes | |
| KR20230046404A (en) | Plasma exosomal RNAs marker composition for diagnosing cervical cancer | |
| Sirc et al. | Functionally characterizing the renal cell carcinoma tumor immune microenvironment via patient-derived ex vivo models | |
| CN115400204B (en) | Application of chemokine CCL23 in the preparation of immunotherapy drugs for breast cancer | |
| WO2014047278A1 (en) | A method for determination of cellular immune response to therapeutic vaccines | |
| Wang et al. | Antigen-Specific Profiling Identifies T-bet-Expressing Melanoma-Specific CD8 T Cells Associated with Pathologic Response to Neoadjuvant Anti-PD-1 |
Legal Events
| Date | Code | Title | Description |
|---|---|---|---|
| STAA | Information on the status of an ep patent application or granted ep patent |
Free format text: STATUS: THE INTERNATIONAL PUBLICATION HAS BEEN MADE |
|
| PUAI | Public reference made under article 153(3) epc to a published international application that has entered the european phase |
Free format text: ORIGINAL CODE: 0009012 |
|
| STAA | Information on the status of an ep patent application or granted ep patent |
Free format text: STATUS: REQUEST FOR EXAMINATION WAS MADE |
|
| 17P | Request for examination filed |
Effective date: 20211110 |
|
| AK | Designated contracting states |
Kind code of ref document: A1 Designated state(s): AL AT BE BG CH CY CZ DE DK EE ES FI FR GB GR HR HU IE IS IT LI LT LU LV MC MK MT NL NO PL PT RO RS SE SI SK SM TR |
|
| REG | Reference to a national code |
Ref country code: DE Ref legal event code: R079 Free format text: PREVIOUS MAIN CLASS: G01N0033490000 Ipc: G01N0033500000 |
|
| A4 | Supplementary search report drawn up and despatched |
Effective date: 20220622 |
|
| RIC1 | Information provided on ipc code assigned before grant |
Ipc: G01N 33/574 20060101ALI20220616BHEP Ipc: G01N 33/50 20060101AFI20220616BHEP |
|
| DAV | Request for validation of the european patent (deleted) | ||
| DAX | Request for extension of the european patent (deleted) | ||
| STAA | Information on the status of an ep patent application or granted ep patent |
Free format text: STATUS: EXAMINATION IS IN PROGRESS |
|
| 17Q | First examination report despatched |
Effective date: 20240130 |