EP3951601A1 - Information processing device and api usage history display program - Google Patents
Information processing device and api usage history display program Download PDFInfo
- Publication number
- EP3951601A1 EP3951601A1 EP19923619.1A EP19923619A EP3951601A1 EP 3951601 A1 EP3951601 A1 EP 3951601A1 EP 19923619 A EP19923619 A EP 19923619A EP 3951601 A1 EP3951601 A1 EP 3951601A1
- Authority
- EP
- European Patent Office
- Prior art keywords
- apis
- api
- nodes
- service
- use history
- Prior art date
- Legal status (The legal status is an assumption and is not a legal conclusion. Google has not performed a legal analysis and makes no representation as to the accuracy of the status listed.)
- Withdrawn
Links
Images




Classifications
-
- G—PHYSICS
- G06—COMPUTING OR CALCULATING; COUNTING
- G06F—ELECTRIC DIGITAL DATA PROCESSING
- G06F9/00—Arrangements for program control, e.g. control units
- G06F9/06—Arrangements for program control, e.g. control units using stored programs, i.e. using an internal store of processing equipment to receive or retain programs
- G06F9/46—Multiprogramming arrangements
- G06F9/54—Interprogram communication
- G06F9/547—Remote procedure calls [RPC]; Web services
-
- G—PHYSICS
- G06—COMPUTING OR CALCULATING; COUNTING
- G06F—ELECTRIC DIGITAL DATA PROCESSING
- G06F11/00—Error detection; Error correction; Monitoring
- G06F11/30—Monitoring
- G06F11/32—Monitoring with visual or acoustical indication of the functioning of the machine
- G06F11/323—Visualisation of programs or trace data
-
- G—PHYSICS
- G06—COMPUTING OR CALCULATING; COUNTING
- G06F—ELECTRIC DIGITAL DATA PROCESSING
- G06F11/00—Error detection; Error correction; Monitoring
- G06F11/30—Monitoring
- G06F11/34—Recording or statistical evaluation of computer activity, e.g. of down time, of input/output operation ; Recording or statistical evaluation of user activity, e.g. usability assessment
-
- G—PHYSICS
- G06—COMPUTING OR CALCULATING; COUNTING
- G06F—ELECTRIC DIGITAL DATA PROCESSING
- G06F11/00—Error detection; Error correction; Monitoring
- G06F11/30—Monitoring
- G06F11/34—Recording or statistical evaluation of computer activity, e.g. of down time, of input/output operation ; Recording or statistical evaluation of user activity, e.g. usability assessment
- G06F11/3438—Recording or statistical evaluation of computer activity, e.g. of down time, of input/output operation ; Recording or statistical evaluation of user activity, e.g. usability assessment monitoring of user actions
-
- G—PHYSICS
- G06—COMPUTING OR CALCULATING; COUNTING
- G06F—ELECTRIC DIGITAL DATA PROCESSING
- G06F3/00—Input arrangements for transferring data to be processed into a form capable of being handled by the computer; Output arrangements for transferring data from processing unit to output unit, e.g. interface arrangements
- G06F3/14—Digital output to display device ; Cooperation and interconnection of the display device with other functional units
-
- G—PHYSICS
- G06—COMPUTING OR CALCULATING; COUNTING
- G06T—IMAGE DATA PROCESSING OR GENERATION, IN GENERAL
- G06T11/00—Two-dimensional [2D] image generation
- G06T11/20—Drawing from basic elements
- G06T11/26—Drawing of charts or graphs
-
- G—PHYSICS
- G06—COMPUTING OR CALCULATING; COUNTING
- G06T—IMAGE DATA PROCESSING OR GENERATION, IN GENERAL
- G06T2200/00—Indexing scheme for image data processing or generation, in general
- G06T2200/24—Indexing scheme for image data processing or generation, in general involving graphical user interfaces [GUIs]
Definitions
- the present invention relates to an information processing apparatus and an API use history display program.
- API application programming interface
- FIG. 9 is a diagram illustrating a configuration of a computer system configured by using an API.
- a computer system 500 connected to each of a settlement system, a communication/short message service (SMS) system, and a map system via an API is indicated.
- SMS communication/short message service
- the computer system 500 may, for example, call a map function of the map system via the API for the map system and use the map function provided by the map system via the API.
- a use history for example, the number of times of use and date and time of use, of an API is managed by viewing individual log data.
- the information processing apparatus includes: a display form determination unit that extracts, from use history data of a computer service that uses a plurality of APIs, the numbers of times of execution of the APIs, and determines display forms for the APIs according to the numbers of times of execution of the APIs; and a display control unit that displays, in a directed graph that represents a node that corresponds to each of the plurality of APIs, the nodes that correspond to the APIs in the determined display forms.
- use states of APIs may be easily grasped.
- FIG. 1 is a diagram schematically illustrating a configuration of a computer system 1 as an example of the embodiment
- FIG. 2 is a diagram illustrating a hardware configuration thereof.
- FIG. 2 mainly illustrates a hardware configuration of a management device 10 in detail.
- the computer system 1 includes the management device 10 and a computer service 20.
- the computer service 20 is a service used by a service user (end user), and is configured by combining a plurality of types of application programs (hereinafter, simply referred to as applications).
- the computer service 20 may be simply referred to as the service 20.
- an API is provided for each application, and in order to cause an application to execute processing (function), the processing of the application is called via the API.
- FIG. 1 three APIs of API_A, API_B, and API_C are illustrated.
- applications are linked also via the APIs.
- an API of one application calls an API of another application, and the called API executes another program.
- the data is transferred via APIs of these applications.
- the management device 10 is connected to a network 50 via a network 18a.
- a network 50 To the network 50, one or more service providing servers 51 and one or more user terminals 52 are connected.
- the user terminal 52 may be referred to as EU 52.
- the service providing server 51 is an information processing apparatus (computer) having a server function, and provides an application that implements various functions and an API provided corresponding to the application. Furthermore, the service providing server 51 may provide an API corresponding to an application other than the application provided by itself. The service providing server 51 may be referred to as SP 51. The service 20 is provided by the service providing server 51. A plurality of service providing servers 51 may cooperate to provide the service 20.
- the service providing server 51 may be, for example, a virtual server virtually provided on the network 50 in a cloud computing system.
- logs are collected along with execution of an application or an API, and are stored as use history data regarding use of the service 20 by a service user.
- the use history data includes, for example, information regarding time when an API was executed and identification information (service user ID) for specifying a service user who used the API. These pieces of information indicating a use history of the API are stored in a storage device (not illustrated) of the service providing server 51 as an API use history log.
- a service user identification which is identification information that may uniquely identify a service user, is set in advance for each service user.
- a service user is made to input a service user ID on a login screen (not illustrated).
- a service user who used the API may be specified and collected as a use history log by a log collection unit 101 described later.
- Each API constituting the service 20 has a function of recording information regarding a service user ID of a service user who used the API and use time as a use history log in a predetermined storage area (not illustrated) managed by the service 20.
- the storage area that records the use history log may be the storage device of the service providing server 51 that provides the service 20.
- the user terminal 52 is an information processing apparatus (computer) used by a service user.
- the service user uses the service 20 by using the user terminal 52.
- the management device 10 manages an API used in the service 20.
- the management device 10 is, for example, an information processing apparatus (computer) having a server function.
- the hardware configuration of the management device 10 of the computer system 1 as an example of the embodiment will be described with reference to FIG. 2 .
- the management device 10 includes, for example, a processor 11, a memory 12, a storage device 13, a graphic processing device 14, an input interface 15, an optical drive device 16, a device connection interface 17, and a network interface 18 as components. These components 11 to 18 are configured to be communicable with each other via a bus 19.
- the processor (processing unit) 11 controls the entire management device 10.
- the processor 11 may be a multiprocessor.
- the processor 11 may be, for example, any one of a central processing unit (CPU), a micro processing unit (MPU), a digital signal processor (DSP), an application specific integrated circuit (ASIC), a programmable logic device (PLD), and a field programmable gate array (FPGA).
- the processor 11 may be a combination of two or more types of elements of the CPU, MPU, DSP, ASIC, PLD, and FPGA.
- the processor 11 executes an API use history display program (not illustrated), functions as the log collection unit 101, the log analysis unit 102, a graph creation/display control unit 103, and a log management database 104 illustrated in FIG. 1 are implemented.
- the functions as the log collection unit 101, the log analysis unit 102, and the graph creation/display control unit 103 may be, for example, implemented as functions that operate on an operating system (OS) program or implemented as functions of the OS program.
- OS operating system
- the management device 10 implements the functions as the log collection unit 101, the log analysis unit 102, the graph creation/display control unit 103, and the log management database 104 by executing, for example, a program (API use history display program or OS program) recorded in a computer-readable non-transitory recording medium.
- a program API use history display program or OS program
- a program in which processing content to be executed by the management device 10 is described may be recorded in various recording media.
- programs to be executed by the management device 10 may be stored in the storage device 13.
- the processor 11 loads at least a part of the programs in the storage device 13 on the memory (RAM) 12 and executes the loaded program.
- a program to be executed by the management device 10 may also be recorded in a non-transitory portable recording medium such as an optical disk 16a, a memory device 17a, or a memory card 17c.
- the program stored in the portable recording medium may be executed after being installed in the storage device 13, for example, by control from the processor 11.
- the processor 11 may directly read and execute the program from the portable recording medium.
- the memory 12 is a storage memory including a read only memory (ROM) and a random access memory (RAM).
- the RAM of the memory 12 is used as a main storage device of the management device 10.
- the RAM temporarily stores at least a part of OS programs and control programs to be executed by the processor 11.
- the memory 12 stores various types of data needed for processing by the processor 11.
- the storage device 13 is a storage device such as a hard disk drive (HDD), a solid state drive (SSD), or a storage class memory (SCM), and stores various types of data.
- the storage device 13 is used as an auxiliary storage device of the management device 10.
- the storage device 13 stores an OS program, a control program, and various types of data.
- the control program includes the API use history display program.
- a semiconductor storage device such as an SCM or a flash memory may be used as the auxiliary storage device.
- redundant arrays of inexpensive disks RAID may be configured by using a plurality of storage devices 13.
- the storage device 13 stores data constituting the log management database 104 described later.
- the graphic processing device 14 is connected to a monitor 14a.
- the graphic processing device 14 displays an image on a screen of the monitor 14a according to a command from the processor 11.
- Examples of the monitor 14a include a display device using a cathode ray tube (CRT) and a liquid crystal display device.
- An output screen 200 (see FIG. 7 ) described later is displayed (output) on the monitor 14a.
- the input interface 15 is connected to a keyboard 15a and a mouse 15b.
- the input interface 15 transmits signals sent from the keyboard 15a and the mouse 15b to the processor 11.
- the mouse 15b is an example of a pointing device, and another pointing device may also be used. Examples of the another pointing device include a touch panel, a tablet, a touch pad, and a track ball.
- the optical drive device 16 reads data recorded on the optical disk 16a by using laser light or the like.
- the optical disk 16a is a non-transitory portable recording medium having data recorded in a readable manner by reflection of light. Examples of the optical disk 16a include a digital versatile disc (DVD), a DVD-RAM, a compact disc read only memory (CD-ROM), and a CD-recordable (R)/rewritable (RW).
- the device connection interface 17 is a communication interface for connecting a peripheral device to the management device 10.
- the device connection interface 17 may be connected to the memory device 17a or a memory reader/writer 17b.
- the memory device 17a is a non-transitory recording medium having a communication function with the device connection interface 17, and is, for example, a universal serial bus (USB) memory.
- the memory reader/writer 17b writes data to the memory card 17c or reads data from the memory card 17c.
- the memory card 17c is a card-type non-transitory recording medium.
- the network interface 18 is connected to the network 18a.
- the network interface 18 exchanges data with the service 20 (service providing servers 51) via the network 18a.
- Another information processing apparatus, communication device, or the like may be connected to the network 18a.
- the service providing servers 51 that provide the service 20 are connected to the network 18a, and the management device 10 is communicably connected to the service providing servers 51 via the network interface 18 and the network 18a.
- the management device 10 is operated by a service administrator.
- the service administrator inputs information regarding APIs constituting the service 20 to the graph creation/display control unit 103 described later.
- the service administrator has certain knowledge about a development cost and quality of each API as well as a relationship between a plurality of APIs constituting the service 20.
- the service administrator confirms a result displayed by the graph creation/display control unit 103, and considers future improvement of the service.
- the log collection unit 101 collects an API use history log from each API constituting the service 20.
- the log collection unit 101 collects the API use history logs from the service providing servers 51.
- the API use history logs may be collected regularly or at any time.
- the log collection unit 101 extracts information needed for analysis by the log analysis unit 102 described later, and stores the information in a corresponding table of the log management database 104.
- the log collection unit 101 acquires information regarding the APIs constituting the service 20 in advance from the graph creation/display control unit 103 described later.
- the log management database 104 stores data (use history log) collected and extracted by the log collection unit 101.
- FIG. 3 is a diagram illustrating records in tables managed by the log management database 104 of the computer system 1 as an example of the embodiment.
- FIG. 3 illustrates an example in which the log management database 104 manages data in a table format, but the present embodiment is not limited to this, and may be variously modified to be implemented.
- the log management database 104 includes a table for each API.
- a reference sign P1 indicates a use history log related to the API_A
- a reference sign P2 indicates a use history log related to the API_B
- a reference sign P3 indicates a use history log related to the API_C.
- the tables of the log management database 104 illustrated in FIG. 3 are configured by associating an ID of a service user who used the API with use time.
- the log collection unit 101 extracts the service user ID and the time when the service user used the API from the use history log of each API, and stores these pieces of information in the table of the corresponding API of the log management database 104.
- the log analysis unit 102 analyzes use states of the APIs by using records in the tables of the log management database 104.
- the log analysis unit 102 analyzes the number of times of use of an API (API use frequency) by a service user for each API.
- the log analysis unit 102 acquires the number of records (cumulative number of times of use of the API by all service users) from each table prepared for each API of the log management database 104.
- the number of records in each of the tables indicated by the reference signs P1 to P3 is 4.
- the log analysis unit 102 obtains, as a first analysis result, "4" as an API use frequency of each of these API_A, API_B, and API_C.
- the log analysis unit 102 determines, according to magnitude of the number of records for each API, for example, the API use frequency, the size (node size) of a node 201 representing the API on the output screen 200 (see FIG. 7 ) to be displayed on the monitor 14a by the graph creation/display control unit 103 described later.
- the log analysis unit 102 determines, for the API, a larger node size as the API use frequency increases, and determines a smaller node size as the API use frequency decreases.
- the log analysis unit 102 outputs (provides notification of) node size information indicating the determined node size of each API to the graph creation/display control unit 103.
- the log analysis unit 102 notifies the graph creation/display control unit 103 of the node size information together with information for specifying the API (API identification information) represented by the node size.
- the log analysis unit 102 corresponds to a display form determination unit that extracts the numbers of times of execution of the APIs from the plurality of API use history logs, and determines, according to the numbers of times of execution of the APIs, display forms (node sizes) of the nodes 201 corresponding to the APIs in a directed graph of the output screen 200.
- the log analysis unit 102 analyzes order in which a service user used APIs.
- the log analysis unit 102 groups, for each service user, records stored in a table prepared for each API of the log management database 104, and arranges the records in chronological order.
- FIG. 4 is a diagram for describing an analysis method by the log analysis unit 102 of the computer system 1 as an example of the embodiment.
- API use history logs by the service users illustrated in FIG. 3 are grouped for each service user, further arranged in chronological order, and represented in tables.
- the use history log for each API is represented in a table format, but the present embodiment is not limited to this, and may be variously modified to be implemented.
- a reference sign P4 indicates a use history log of the service user whose service user ID is "001".
- a reference sign P5 indicates a use history log of a service user whose service user ID is "002”
- a reference sign P6 indicates a use history log of a service user whose service user ID is "003”
- a reference sign P7 indicates a use history log of a service user whose service user ID is "004".
- the tables of the use history logs illustrated in FIG. 4 are configured by associating an API used with use time.
- the API_A was used at 12:00 on 02/13/2019. Furthermore, in this table, it is indicated that, thereafter, the API_B was used at 12:05 on 02/13/2019, the API_C was used at 12:10 on 02/13/2019, and, further thereafter, the API_A was used at 12:15 on 02/13/2019.
- the service user whose service user ID is "001" used the APIs in the order of the API_A, API_B, API_C, and API_A.
- the log analysis unit 102 determines that these entries are processed continuously as a series of processing (there is continuity).
- the log analysis unit 102 determines that these entries (APIs) are not used continuously as a series of processing.
- the API_A was used at 12:30 on 02/13/2019 after the API_C was used at 11:30 on 02/13/2019.
- the service user whose service user ID is "002" used the API_A 60 minutes after using the API_C.
- T 30 minutes
- the log analysis unit 102 determines that the use of these APIs is also not continuous (there is no continuity).
- the threshold T is not limited to 30 minutes, and may be appropriately changed and set.
- a service administrator estimates average service stay time of a service user and inputs a value greater than the estimated value as the threshold T in advance to the log analysis unit 102.
- the estimation of the average service stay time of a service user may be implemented by a known method such as referring to past actual values, for example, and description thereof will be omitted.
- the log analysis unit 102 obtains, for each of record groups grouped for each service user in the processing 1 described above, the number of occurrences of each of API call patterns (execution order patterns) recognized to have continuity, on the basis of the use order of the APIs. Note that the use order of the APIs is assumed to be synonymous with execution order of the APIs.
- the API call pattern is a combination of two APIs used continuously and is execution order of two APIs executed continuously.
- the API call pattern represents transition of the API used.
- the API used first may be referred to as a start point
- the API used later may be referred to as an end point.
- the API call pattern has the start point and the end point.
- the log analysis unit 102 extracts (divides) a combination of two continuous APIs recognized to have continuity in use of the APIs (call pattern or execution order pattern) as one unit, and counts the number of occurrences of each combination.
- the service user uses the APIs in the order of the API_A, API_B, API_C, and API_A.
- Such use order includes three call patterns of API_A ⁇ API_B, API_B ⁇ API_C, and API_C ⁇ API_A. The number of occurrences of each of these call patterns is 1.
- FIG. 5 is a diagram illustrating a method of managing the number of occurrences of each API call pattern by the log analysis unit 102 of the computer system 1 as an example of the embodiment.
- API_A, API_B, and API_C may be represented by A, B, and C, respectively.
- a matrix in which the APIs (API_A, API_B, and API_C) that are the starting points are arranged in columns and the APIs (API_A, API_B, and API_C) that are the ending points are arranged in rows is indicated for each service user.
- the number of occurrences of the API call pattern is set at a corresponding position in the matrix.
- a reference sign P8 indicates the number of occurrences of the API call pattern in the use history log of the service user whose service user ID is "001".
- a reference sign P9 indicates the number of occurrences of the API call pattern in the use history log of the service user whose service user ID is "002".
- a reference sign P10 indicates the number of occurrences of the API call pattern in the use history log of the service user whose service user ID is "003”
- a reference sign P11 indicates the number of occurrences of the API call pattern in the use history log of the service user whose service user ID is "004".
- the matrices of the respective service users mutually have the same format.
- the table related to the service user whose service user ID is "001", which is indicated by the reference sign P4 in FIG. 4 includes three call patterns of API_A ⁇ API_B, API_B ⁇ API_C, and API_C ⁇ API_A.
- the number of occurrences of each of the three call patterns of a start point A to end point B, a start point B to end point C, and a start point C to end point A is 1.
- the number of occurrences of 1 is set at each position of the start point A to end point B, the start point B to end point C, and the start point C to end point A.
- the log analysis unit 102 uses a combination of two APIs that are continuously executed (used) (call pattern) as one unit to extract a part of use order of the APIs that is recognized to have continuity, and counts the number of occurrences of each combination.
- the log analysis unit 102 obtains the number of occurrences of each of the API call patterns recognized to have continuity.
- the log analysis unit 102 does not (exceptionally) include the use of these APIs in the count.
- the number of occurrences of 1 is set at each position of a start point A to end point C and a start point C to end point C.
- the log analysis unit 102 adds up the matrices created for the respective service users in the processing 2. Thus, the log analysis unit 102 obtains the total number of occurrences (number of calls) of each of the API call patterns recognized to have continuity for all service users.
- the log analysis unit 102 obtains the number of times of execution of two APIs executed continuously in the execution order.
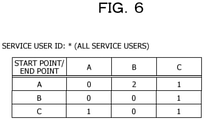
- FIG. 6 is a diagram illustrating the method of managing the number of occurrences of each API call pattern by the log analysis unit 102 of the computer system 1 as an example of the embodiment, and indicates the total number of occurrences for all service users.
- the number of occurrences (number of calls) of the call pattern of the start point A to end point B for example, the pattern in which the API_B is called next to the API_A, is the largest.
- the log analysis unit 102 determines a display form of a corresponding edge 202 on a directed graph on the output screen 200 (described later by using FIG. 7 ) to be displayed by the graph creation/display control unit 103 according to the size of each element of the matrices that are added up, and output the display form to the graph creation/display control unit 103.
- the log analysis unit 102 determines a line type of the edge 202 according to the number of calls between the APIs having continuity analyzed as described above. For example, the log analysis unit 102 thickens a line of the edge 202 as the number of calls of the call pattern increases.
- the log analysis unit 102 outputs (provides notification of) information indicating the line type (line type information) of the determined edge 202 to the graph creation/display control unit 103.
- the log analysis unit 102 notifies the graph creation/display control unit 103 of the line type information of the edge 202 together with information for specifying the edge 202 represented by the line type information (for example, API identification information of APIs that are a start point and an end point of the edge 202).
- the log analysis unit 102 corresponds to the display form determination unit that determines, on the basis of the API use history log, a display form (line type) of the edge 202 that connects between two nodes 201 corresponding to two APIs in a directed graph of the output screen 200 according to the number of times of execution of the two APIs continuously executed in the execution order among a plurality of APIs.
- the graph creation/display control unit 103 generates a display screen to be displayed on the monitor 14a.
- the graph creation/display control unit 103 generates a display screen to be provided to a service administrator, and displays the display screen on the monitor 14a via the graphic processing device 14.
- the display screen generated by the graph creation/display control unit 103 may include an input screen for the service administrator to perform an input operation and an output screen for outputting a log analysis result by the log analysis unit 102.
- the input screen generated by the graph creation/display control unit 103 has a graphical user interface (GUI), and the service administrator performs the input operation via the GUI.
- GUI graphical user interface
- the service administrator inputs, for example, information regarding APIs constituting the service 20.
- the service administrator inputs the information regarding the APIs in a format of, for example, a directed graph with nodes and edges (sides and branches).
- the information regarding the APIs includes, for example, names of the APIs, quality of the APIs, development costs of the APIs, and presence or absence of relevance between the APIs.
- the input information regarding the APIs is used to generate the output screen 200 illustrated in FIG. 7 .
- the quality of the API may be represented by, for example, the number of error occurrences (error occurrence rate) in the API.
- the development cost of the API may be represented by an amount of money or work man-hours.
- FIG. 7 is a diagram illustrating the output screen 200 in the computer system 1 as an example of the embodiment.
- the output screen 200 reflects and represents information regarding use histories of APIs in the service 20 on a directed graph, and is mainly provided to a service administrator.
- the output screen 200 is generated corresponding to the service 20.
- the output screen 200 illustrated in FIG. 7 includes a plurality of (seven in the example illustrated in FIG. 7 ) nodes 201-1 to 201-7 and a plurality of (eleven in the example illustrated in FIG. 7 ) edges 202-1 to 202-11. These nodes 201-1 to 201-7 and edges 202-1 to 202-11 constitute the directed graph. Furthermore, the output screen 200 illustrated in FIG. 7 also includes undirected edges 203 that connect the nodes 201 having relevance.
- the nodes 201-1 to 201-7 represent APIs.
- the seven nodes 201-1 to 201-7 are indicated in circles, and these nodes 201-1 to 201-7 correspond to seven APIs (API_A, API_B, API_C, API_D, API_E, API_F, and API_G) included in the service 20.
- the seven nodes 201-1 to 201-7 are not particularly distinguished, they are written as the nodes 201. Names of the nodes 201 are indicated in the nodes 201.
- edges 202-1 to 202-11 are directed line segments (arrows) that connect the nodes 201 having relevance.
- the eleven edges 202-1 to 202-11 are not particularly distinguished, they are written as the edges 202.
- the graph creation/display control unit 103 displays, on the output screen 200, the names of the APIs input from the GUI of the input screen as the names of the nodes 201. Furthermore, the presence or absence of relevance between the APIs is expressed as presence or absence of the edge between the nodes 201 on the output screen 200.
- linkage between the APIs is visually represented by connecting the nodes 201 corresponding to the APIs related to each other, such as the APIs that exchange data, with the lines (the undirected edges 203 and the edges 202).
- the undirected edges 203 and the edges 202 that connect the nodes 201 indicate that API call has been repeated.
- the thicker the line thickness of the edge 202 the greater the number of times of repeat of the API call.
- the graph creation/display control unit 103 sets, for example, a line type of the edge 202 to a broken line or a dotted line (see the edge 202-9).
- the graph creation/display control unit 103 may suppress illustration of the edge 202. With this configuration, the information to be displayed on the output screen 200 may be suppressed to make it easier to see.
- the graph creation/display control unit 103 expresses the quality of the APIs input from the GUI of the input screen as positions of the nodes 201 in a vertical axis direction on the output screen 200. For example, an API with higher quality is arranged at an upper position in the output screen 200, and an API with lower quality is arranged at a lower position in the output screen 200.
- the graph creation/display control unit 103 displays the nodes 201 in the directed graph of the output screen 200 in a state according to the quality of the APIs corresponding to the nodes 201.
- the log collection unit 101 may collect information regarding an error detected by each API, and the log analysis unit 102 may obtain the number of error occurrences (error occurrence rate) for each API. Then, the graph creation/display control unit 103 may appropriately move positions of the nodes 201 in the output screen 200 according to the number of error occurrences (error occurrence rate).
- the graph creation/display control unit 103 expresses the development costs of the APIs input from the GUI of the input screen as positions of the nodes 201 in a horizontal axis direction on the output screen 200.
- an API with higher development cost is arranged at a leftward position in the output screen 200, and an API with lower development cost is arranged at a rightward position in the output screen 200.
- an API provided as free open source software (OSS) does not need a development cost, it is arranged at a right end position in the output screen 200.
- an API of a self-developed core function is arranged at a left side position in the output screen 200 as an API with a high development cost.
- An API which is a charged product may be arranged at a position near the center in a horizontal direction in the output screen 200, for example.
- the graph creation/display control unit 103 displays the nodes 201 in the directed graph of the output screen 200 in a state according to the development costs of the APIs corresponding to the nodes 201.
- the graph creation/display control unit 103 reflects the node size information and the line type information notified from the log analysis unit 102 on the output screen 200 generated as described above.
- the graph creation/display control unit 103 changes the size of the node 201 of the API specified by the API identification information to the size indicated by the node size information.
- the graph creation/display control unit 103 changes the line type of the edge 202 specified by the information for specifying the edge 202 to the line type indicated by the line type information.
- the graph creation/display control unit 103 displays the output screen 200 reflecting the node size information and the line type information on the monitor 14a, thereby providing the node size information and the line type information to a service administrator.
- Steps A1 to S8 Processing in the computer system 1 as an example of the embodiment configured as described above will be described with reference to a flowchart (Steps A1 to S8) illustrated in FIG. 8 .
- Step S1 a service administrator uses the keyboard 15a and the mouse 15b to input information regarding APIs constituting the service 20 from a GUI of an input screen provided by the graph creation/display control unit 103.
- the service administrator inputs the information regarding the APIs in a format of a directed graph with the nodes 201 and the edges 202.
- the input information is stored in, for example, a predetermined storage area of the storage device 13.
- Step S2 a service user uses the service 20.
- the service providing servers 51 use the APIs constituting the service 20, and API use history logs are recorded in, for example, a memory or storage device (not illustrated) of the API providing server 51, while being included in a use history of the service 20.
- Step S3 the log collection unit 101 acquires the information regarding the APIs input in Step S1 from the graph creation/display control unit 103.
- Step S4 the log collection unit 101 acquires the API use history logs recorded in Step S2 from the service providing server 51 on the basis of the information regarding the APIs acquired in Step S3.
- Step S5 the log collection unit 101 extracts necessary data (for example, a service user ID and use time) from the API use history logs acquired in Step S4, and stores the data in the log management database 104.
- necessary data for example, a service user ID and use time
- Step S6 the log analysis unit 102 acquires the data stored in Step S5 from the log management database 104 and analyzes the data.
- the log analysis unit 102 analyzes the number of times of use of an API (API use frequency) by the service user for each API.
- the log analysis unit 102 analyzes order in which the service user used the APIs, and obtains, on the basis of the use order of the APIs, the total number of occurrences (number of calls) of each of API call patterns (execution order patterns) recognized to have continuity for all service users.
- Step S7 the log analysis unit 102 determines node size information on the basis of the API use frequency by the service user, and outputs the node size information to the graph creation/display control unit 103 together with information for specifying the API represented by the node size (API identification information).
- the log analysis unit 102 obtains the total number of occurrences (number of calls) of each of the API call patterns recognized to have continuity for all service users. Then, the log analysis unit 102 determines a line type (display form) of the edge 202 according to the number of calls between the APIs having continuity.
- the log analysis unit 102 outputs, to the graph creation/display control unit 103, the determined line type information of the edge 202 together with information for specifying the edge 202 represented by the line type information (for example, API identification information of APIs that are a start point and an end point of the edge 202).
- Step S8 the graph creation/display control unit 103 reflects the node size information and line type information output from the log analysis unit 102 on the directed graph of the output screen 200, outputs them to the monitor 14a, and presents them to the service administrator. Thereafter, the processing ends.
- the log analysis unit 102 analyzes the number of times of use of an API (API use frequency) by a service user for each API, determines the size (node size) of the node 201 representing the PI according to the API use frequency, and notifies the graph creation/display control unit 103 of the size.
- API use frequency the number of times of use of an API
- node size the size of the node 201 representing the PI according to the API use frequency
- the graph creation/display control unit 103 displays the node 201 corresponding to the API with the node size notified from the log analysis unit 102 in a directed graph of the output screen 200.
- use states (the numbers of times of use) of a plurality of APIs used in the service 20 are visualized, and a service administrator may easily grasp the use states of the APIs, which is highly convenient. For example, it is possible to take improvement measures at an early stage for APIs that are used infrequently.
- the log analysis unit 102 obtains, on the basis of use order of each API, the total number of occurrences (number of calls) of each of API call patterns (execution order patterns) recognized to have continuity for all service users. Then, the log analysis unit 102 creates line type information for changing a line type of the edge 202 according to the analyzed number of calls between the APIs having continuity.
- the graph creation/display control unit 103 displays the edges 202 between the nodes 201 with the line type information notified from the log analysis unit 102 in the directed graph of the output screen 200.
- the service administrator may easily grasp the use states of the APIs in what order the service users are using the APIs, which is highly convenient.
- the log analysis unit 102 changes the size of the node 201 corresponding to the API in the directed graph of the output screen 200 according to the number of times of use of the API.
- the embodiment is not limited to this.
- the color, shape, pattern, or the like of the node 201 may be displayed differently according to the number of times of use of the API, and various modifications may be made to be implemented.
- the color may include saturation or brightness.
- the log analysis unit 102 changes line type so that lines of the edges 202 between the nodes 201 corresponding to the APIs in the directed graph of the output screen 200 are thickened.
- the embodiment is not limited to this.
- the color, shape, pattern, or the like of the nodes 201 may be displayed differently according to the number of times of execution of the two APIs continuously executed in the execution order, and various modifications may be made to be implemented.
- the color may include saturation or brightness.
- the graph creation/display control unit 103 displays the nodes 201 in the directed graph of the output screen 200 at positions according to the quality or development costs of the APIs corresponding to the nodes 201.
- the graph creation/display control unit 103 may display the color, shape, pattern, or the like of the nodes 201 differently according to the quality or development costs of the APIs, and various modifications may be made to be implemented.
Landscapes
- Engineering & Computer Science (AREA)
- Theoretical Computer Science (AREA)
- Physics & Mathematics (AREA)
- General Physics & Mathematics (AREA)
- General Engineering & Computer Science (AREA)
- Quality & Reliability (AREA)
- Software Systems (AREA)
- Computer Hardware Design (AREA)
- Human Computer Interaction (AREA)
- Data Mining & Analysis (AREA)
- Debugging And Monitoring (AREA)
Abstract
Description
- The present invention relates to an information processing apparatus and an API use history display program.
- In recent years, a computer service including a plurality of software components linked by using an application programming interface (API) has been implemented. In addition, a wide variety of APIs are provided.
-
FIG. 9 is a diagram illustrating a configuration of a computer system configured by using an API. - In an example illustrated in
FIG. 9 , acomputer system 500 connected to each of a settlement system, a communication/short message service (SMS) system, and a map system via an API is indicated. - The
computer system 500 may, for example, call a map function of the map system via the API for the map system and use the map function provided by the map system via the API. - System administrators want to grasp use states of a plurality of APIs.
- Conventionally, a use history, for example, the number of times of use and date and time of use, of an API is managed by viewing individual log data.
- However, such a conventional API management method has a problem that it is not convenient because it is not possible to grasp how the API was used, whether it was actually useful, and the like.
- In one aspect, it is an object of the present invention to make it easy to grasp use states of APIs.
- Therefore, the information processing apparatus includes: a display form determination unit that extracts, from use history data of a computer service that uses a plurality of APIs, the numbers of times of execution of the APIs, and determines display forms for the APIs according to the numbers of times of execution of the APIs; and a display control unit that displays, in a directed graph that represents a node that corresponds to each of the plurality of APIs, the nodes that correspond to the APIs in the determined display forms.
- According to one embodiment, use states of APIs may be easily grasped.
-
-
FIG. 1 is a diagram schematically illustrating a configuration of a computer system as an example of an embodiment; -
FIG. 2 is a diagram illustrating a hardware configuration of the computer system as an example of the embodiment; -
FIG. 3 is a diagram illustrating records in tables managed by a log management database of the computer system as an example of the embodiment; -
FIG. 4 is a diagram for describing an analysis method by a log analysis unit of the computer system as an example of the embodiment; -
FIG. 5 is a diagram illustrating a method of managing the number of occurrences of each API call pattern by the log analysis unit of the computer system as an example of the embodiment; -
FIG. 6 is a diagram illustrating the method of managing the number of occurrences of each API call pattern by the log analysis unit of the computer system as an example of the embodiment; -
FIG. 7 is a diagram illustrating an output screen in the computer system as an example of the embodiment; -
FIG. 8 is a flowchart for describing processing in the computer system as an example of the embodiment; and -
FIG. 9 is a diagram illustrating a configuration of a computer system configured by using an API. - Hereinafter, an embodiment relating to this information processing apparatus and API use history display program will be described with reference to the drawings. Note that the embodiment to be described below is merely an example, and there is no intention to exclude application of various modifications and techniques not explicitly described in the embodiment. For example, the present embodiment may be variously modified and implemented without departing from the scope of the gist thereof. Furthermore, each drawing is not intended to include only components illustrated in the drawings, and may include another function and the like.
-
FIG. 1 is a diagram schematically illustrating a configuration of acomputer system 1 as an example of the embodiment, andFIG. 2 is a diagram illustrating a hardware configuration thereof.FIG. 2 mainly illustrates a hardware configuration of amanagement device 10 in detail. - As illustrated in
FIG. 1 , thecomputer system 1 includes themanagement device 10 and acomputer service 20. - The
computer service 20 is a service used by a service user (end user), and is configured by combining a plurality of types of application programs (hereinafter, simply referred to as applications). Hereinafter, thecomputer service 20 may be simply referred to as theservice 20. - In the
service 20, an API is provided for each application, and in order to cause an application to execute processing (function), the processing of the application is called via the API. InFIG. 1 , three APIs of API_A, API_B, and API_C are illustrated. - Furthermore, applications are linked also via the APIs. For example, an API of one application calls an API of another application, and the called API executes another program. Furthermore, in a case where data is transferred from one application to another application, the data is transferred via APIs of these applications.
- As illustrated in
FIG. 2 , themanagement device 10 is connected to anetwork 50 via anetwork 18a. To thenetwork 50, one or moreservice providing servers 51 and one ormore user terminals 52 are connected. Theuser terminal 52 may be referred to as EU 52. - The
service providing server 51 is an information processing apparatus (computer) having a server function, and provides an application that implements various functions and an API provided corresponding to the application. Furthermore, theservice providing server 51 may provide an API corresponding to an application other than the application provided by itself. Theservice providing server 51 may be referred to as SP 51. Theservice 20 is provided by theservice providing server 51. A plurality ofservice providing servers 51 may cooperate to provide theservice 20. - The
service providing server 51 may be, for example, a virtual server virtually provided on thenetwork 50 in a cloud computing system. - In the
service providing server 51, logs are collected along with execution of an application or an API, and are stored as use history data regarding use of theservice 20 by a service user. - The use history data includes, for example, information regarding time when an API was executed and identification information (service user ID) for specifying a service user who used the API. These pieces of information indicating a use history of the API are stored in a storage device (not illustrated) of the
service providing server 51 as an API use history log. - In this
computer system 1, as described later, it is needed to specify a service user who used the API when alog analysis unit 102 of themanagement device 10 analyzes the API use history log, and thus, a service user identification (ID), which is identification information that may uniquely identify a service user, is set in advance for each service user. - In this
computer system 1, for example, at the start of using theservice 20, a service user is made to input a service user ID on a login screen (not illustrated). With this configuration, when theservice 20 is used, a service user who used the API may be specified and collected as a use history log by alog collection unit 101 described later. - Each API constituting the
service 20 has a function of recording information regarding a service user ID of a service user who used the API and use time as a use history log in a predetermined storage area (not illustrated) managed by theservice 20. As described above, the storage area that records the use history log may be the storage device of theservice providing server 51 that provides theservice 20. - The
user terminal 52 is an information processing apparatus (computer) used by a service user. The service user uses theservice 20 by using theuser terminal 52. - The
management device 10 manages an API used in theservice 20. - The
management device 10 is, for example, an information processing apparatus (computer) having a server function. - The hardware configuration of the
management device 10 of thecomputer system 1 as an example of the embodiment will be described with reference toFIG. 2 . - The
management device 10 includes, for example, aprocessor 11, amemory 12, astorage device 13, agraphic processing device 14, aninput interface 15, anoptical drive device 16, adevice connection interface 17, and anetwork interface 18 as components. Thesecomponents 11 to 18 are configured to be communicable with each other via abus 19. - The processor (processing unit) 11 controls the
entire management device 10. Theprocessor 11 may be a multiprocessor. Theprocessor 11 may be, for example, any one of a central processing unit (CPU), a micro processing unit (MPU), a digital signal processor (DSP), an application specific integrated circuit (ASIC), a programmable logic device (PLD), and a field programmable gate array (FPGA). Furthermore, theprocessor 11 may be a combination of two or more types of elements of the CPU, MPU, DSP, ASIC, PLD, and FPGA. - Then, when the
processor 11 executes an API use history display program (not illustrated), functions as thelog collection unit 101, thelog analysis unit 102, a graph creation/display control unit 103, and alog management database 104 illustrated inFIG. 1 are implemented. The functions as thelog collection unit 101, thelog analysis unit 102, and the graph creation/display control unit 103 may be, for example, implemented as functions that operate on an operating system (OS) program or implemented as functions of the OS program. - Note that the
management device 10 implements the functions as thelog collection unit 101, thelog analysis unit 102, the graph creation/display control unit 103, and thelog management database 104 by executing, for example, a program (API use history display program or OS program) recorded in a computer-readable non-transitory recording medium. - A program in which processing content to be executed by the
management device 10 is described may be recorded in various recording media. For example, programs to be executed by themanagement device 10 may be stored in thestorage device 13. Theprocessor 11 loads at least a part of the programs in thestorage device 13 on the memory (RAM) 12 and executes the loaded program. - Furthermore, a program to be executed by the management device 10 (processor 11) may also be recorded in a non-transitory portable recording medium such as an
optical disk 16a, amemory device 17a, or amemory card 17c. The program stored in the portable recording medium may be executed after being installed in thestorage device 13, for example, by control from theprocessor 11. Furthermore, theprocessor 11 may directly read and execute the program from the portable recording medium. - The
memory 12 is a storage memory including a read only memory (ROM) and a random access memory (RAM). The RAM of thememory 12 is used as a main storage device of themanagement device 10. The RAM temporarily stores at least a part of OS programs and control programs to be executed by theprocessor 11. Furthermore, thememory 12 stores various types of data needed for processing by theprocessor 11. - The
storage device 13 is a storage device such as a hard disk drive (HDD), a solid state drive (SSD), or a storage class memory (SCM), and stores various types of data. Thestorage device 13 is used as an auxiliary storage device of themanagement device 10. Thestorage device 13 stores an OS program, a control program, and various types of data. The control program includes the API use history display program. - Note that a semiconductor storage device such as an SCM or a flash memory may be used as the auxiliary storage device. Furthermore, redundant arrays of inexpensive disks (RAID) may be configured by using a plurality of
storage devices 13. - Furthermore, the
storage device 13 stores data constituting thelog management database 104 described later. - The
graphic processing device 14 is connected to amonitor 14a. - The
graphic processing device 14 displays an image on a screen of themonitor 14a according to a command from theprocessor 11. Examples of themonitor 14a include a display device using a cathode ray tube (CRT) and a liquid crystal display device. An output screen 200 (seeFIG. 7 ) described later is displayed (output) on themonitor 14a. - The
input interface 15 is connected to akeyboard 15a and amouse 15b. Theinput interface 15 transmits signals sent from thekeyboard 15a and themouse 15b to theprocessor 11. Note that themouse 15b is an example of a pointing device, and another pointing device may also be used. Examples of the another pointing device include a touch panel, a tablet, a touch pad, and a track ball. - The
optical drive device 16 reads data recorded on theoptical disk 16a by using laser light or the like. Theoptical disk 16a is a non-transitory portable recording medium having data recorded in a readable manner by reflection of light. Examples of theoptical disk 16a include a digital versatile disc (DVD), a DVD-RAM, a compact disc read only memory (CD-ROM), and a CD-recordable (R)/rewritable (RW). - The
device connection interface 17 is a communication interface for connecting a peripheral device to themanagement device 10. For example, thedevice connection interface 17 may be connected to thememory device 17a or a memory reader/writer 17b. Thememory device 17a is a non-transitory recording medium having a communication function with thedevice connection interface 17, and is, for example, a universal serial bus (USB) memory. The memory reader/writer 17b writes data to thememory card 17c or reads data from thememory card 17c. Thememory card 17c is a card-type non-transitory recording medium. - The
network interface 18 is connected to thenetwork 18a. Thenetwork interface 18 exchanges data with the service 20 (service providing servers 51) via thenetwork 18a. Another information processing apparatus, communication device, or the like may be connected to thenetwork 18a. - The
service providing servers 51 that provide theservice 20 are connected to thenetwork 18a, and themanagement device 10 is communicably connected to theservice providing servers 51 via thenetwork interface 18 and thenetwork 18a. - The
management device 10 is operated by a service administrator. The service administrator inputs information regarding APIs constituting theservice 20 to the graph creation/display control unit 103 described later. Thus, it is desirable that the service administrator has certain knowledge about a development cost and quality of each API as well as a relationship between a plurality of APIs constituting theservice 20. - Furthermore, the service administrator confirms a result displayed by the graph creation/
display control unit 103, and considers future improvement of the service. - The
log collection unit 101 collects an API use history log from each API constituting theservice 20. Thelog collection unit 101 collects the API use history logs from theservice providing servers 51. The API use history logs may be collected regularly or at any time. Thelog collection unit 101 extracts information needed for analysis by thelog analysis unit 102 described later, and stores the information in a corresponding table of thelog management database 104. - Furthermore, the
log collection unit 101 acquires information regarding the APIs constituting theservice 20 in advance from the graph creation/display control unit 103 described later. - The
log management database 104 stores data (use history log) collected and extracted by thelog collection unit 101. -
FIG. 3 is a diagram illustrating records in tables managed by thelog management database 104 of thecomputer system 1 as an example of the embodiment. -
FIG. 3 illustrates an example in which thelog management database 104 manages data in a table format, but the present embodiment is not limited to this, and may be variously modified to be implemented. - For example, the
log management database 104 includes a table for each API. - In the example illustrated in
FIG. 3 , a reference sign P1 indicates a use history log related to the API_A, a reference sign P2 indicates a use history log related to the API_B, and a reference sign P3 indicates a use history log related to the API_C. - The tables of the
log management database 104 illustrated in FIG.
3 are configured by associating an ID of a service user who used the API with use time. - For example, in a first entry of the table indicated by the reference sign P1 in
FIG. 3 , it is indicated that a service user whose service user ID is "001" used the API_A at 12:00 on 02/13/2019. - The
log collection unit 101 extracts the service user ID and the time when the service user used the API from the use history log of each API, and stores these pieces of information in the table of the corresponding API of thelog management database 104. - The
log analysis unit 102 analyzes use states of the APIs by using records in the tables of thelog management database 104. - The
log analysis unit 102 analyzes the number of times of use of an API (API use frequency) by a service user for each API. - The
log analysis unit 102 acquires the number of records (cumulative number of times of use of the API by all service users) from each table prepared for each API of thelog management database 104. - For example, in
FIG. 3 , the number of records in each of the tables indicated by the reference signs P1 to P3 is 4. Thelog analysis unit 102 obtains, as a first analysis result, "4" as an API use frequency of each of these API_A, API_B, and API_C. - The
log analysis unit 102 determines, according to magnitude of the number of records for each API, for example, the API use frequency, the size (node size) of anode 201 representing the API on the output screen 200 (seeFIG. 7 ) to be displayed on themonitor 14a by the graph creation/display control unit 103 described later. - The
log analysis unit 102 determines, for the API, a larger node size as the API use frequency increases, and determines a smaller node size as the API use frequency decreases. - The
log analysis unit 102 outputs (provides notification of) node size information indicating the determined node size of each API to the graph creation/display control unit 103. Thelog analysis unit 102 notifies the graph creation/display control unit 103 of the node size information together with information for specifying the API (API identification information) represented by the node size. - The
log analysis unit 102 corresponds to a display form determination unit that extracts the numbers of times of execution of the APIs from the plurality of API use history logs, and determines, according to the numbers of times of execution of the APIs, display forms (node sizes) of thenodes 201 corresponding to the APIs in a directed graph of theoutput screen 200. - Furthermore, the
log analysis unit 102 analyzes order in which a service user used APIs. - The order in which the APIs were used is performed according to the following
processing 1 to 3. - The
log analysis unit 102 groups, for each service user, records stored in a table prepared for each API of thelog management database 104, and arranges the records in chronological order. -
FIG. 4 is a diagram for describing an analysis method by thelog analysis unit 102 of thecomputer system 1 as an example of the embodiment. - In
FIG. 4 , API use history logs by the service users illustrated inFIG. 3 are grouped for each service user, further arranged in chronological order, and represented in tables. - Note that, in
FIG. 4 , the use history log for each API is represented in a table format, but the present embodiment is not limited to this, and may be variously modified to be implemented. - In the example illustrated in
FIG. 4 , a reference sign P4 indicates a use history log of the service user whose service user ID is "001". Similarly, a reference sign P5 indicates a use history log of a service user whose service user ID is "002", a reference sign P6 indicates a use history log of a service user whose service user ID is "003", and a reference sign P7 indicates a use history log of a service user whose service user ID is "004". - The tables of the use history logs illustrated in
FIG. 4 are configured by associating an API used with use time. - For example, in the table related to the service user whose service user ID is "001", which is indicated by the reference sign P4 in
FIG. 4 , it is indicated that the API_A was used at 12:00 on 02/13/2019. Furthermore, in this table, it is indicated that, thereafter, the API_B was used at 12:05 on 02/13/2019, the API_C was used at 12:10 on 02/13/2019, and, further thereafter, the API_A was used at 12:15 on 02/13/2019. - Thus, it may be seen that the service user whose service user ID is "001" used the APIs in the order of the API_A, API_B, API_C, and API_A.
- Furthermore, in the table indicated by the reference sign P4 in
FIG. 4 , it may be seen that the use time in each entry changes at 5-minute intervals. - In a case where elapsed time from use time in a previous entry to use time in a subsequent entry is within a predetermined threshold T (for example, T = 30 minutes) in a plurality of entries arranged in chronological order, the
log analysis unit 102 determines that these entries are processed continuously as a series of processing (there is continuity). - On the other hand, in a case where elapsed time from use time in the previous entry to the use time in the subsequent entry is greater than the predetermined threshold T (for example, T = 30 minutes), the
log analysis unit 102 determines that these entries (APIs) are not used continuously as a series of processing. - For example, in the table related to the service user whose service user ID is "002", which is indicated by the reference sign P5 in
FIG. 4 , it may be seen that the service user whose service user ID is "002" used the APIs in the order of the API_C, API_A, and API_B. - Here, the API_A was used at 12:30 on 02/13/2019 after the API_C was used at 11:30 on 02/13/2019. For example, the service user whose service user ID is "002" used the
API_A 60 minutes after using the API_C. In this case, elapsed time (60 minutes) from the use time in the previous entry to the use time in the subsequent entry is greater than the threshold T (T = 30 minutes). Thus, thelog analysis unit 102 determines that the use of these APIs is not used continuously (there is no continuity). - Furthermore, in the table related to the service user whose service user ID is "003", which is indicated by the reference sign P6 in
FIG. 4 , 75 minutes have passed between use time of the API_B and use time of the API_A thereafter. Therefore, thelog analysis unit 102 determines that the use of these APIs is also not continuous (there is no continuity). - Note that the threshold T is not limited to 30 minutes, and may be appropriately changed and set. In order to set the threshold T, it is desirable that a service administrator estimates average service stay time of a service user and inputs a value greater than the estimated value as the threshold T in advance to the
log analysis unit 102. The estimation of the average service stay time of a service user may be implemented by a known method such as referring to past actual values, for example, and description thereof will be omitted. - Next, the
log analysis unit 102 obtains, for each of record groups grouped for each service user in theprocessing 1 described above, the number of occurrences of each of API call patterns (execution order patterns) recognized to have continuity, on the basis of the use order of the APIs. Note that the use order of the APIs is assumed to be synonymous with execution order of the APIs. - Here, the API call pattern is a combination of two APIs used continuously and is execution order of two APIs executed continuously. The API call pattern represents transition of the API used. Here, in the combination of the two APIs used continuously, the API used first may be referred to as a start point, and the API used later may be referred to as an end point. The API call pattern has the start point and the end point.
- In the API use history log for each service user arranged in chronological order, the
log analysis unit 102 extracts (divides) a combination of two continuous APIs recognized to have continuity in use of the APIs (call pattern or execution order pattern) as one unit, and counts the number of occurrences of each combination. - For example, in the table related to the service user whose service user ID is "001", which is indicated by the reference sign P4 in
FIG. 4 , the service user uses the APIs in the order of the API_A, API_B, API_C, and API_A. Such use order includes three call patterns of API_A → API_B, API_B → API_C, and API_C → API_A. The number of occurrences of each of these call patterns is 1. -
FIG. 5 is a diagram illustrating a method of managing the number of occurrences of each API call pattern by thelog analysis unit 102 of thecomputer system 1 as an example of the embodiment. - Hereinafter, the API_A, API_B, and API_C may be represented by A, B, and C, respectively.
- In the example illustrated in
FIG. 5 , a matrix in which the APIs (API_A, API_B, and API_C) that are the starting points are arranged in columns and the APIs (API_A, API_B, and API_C) that are the ending points are arranged in rows is indicated for each service user. In addition, the number of occurrences of the API call pattern is set at a corresponding position in the matrix. - Note that, in
FIG. 5 , the combinations of the APIs, which constitute the call patterns, are represented in a matrix format, but the present embodiment is not limited to this, and may be variously modified to be implemented. - In the example illustrated in
FIG. 5 , a reference sign P8 indicates the number of occurrences of the API call pattern in the use history log of the service user whose service user ID is "001". Similarly, a reference sign P9 indicates the number of occurrences of the API call pattern in the use history log of the service user whose service user ID is "002". Furthermore, a reference sign P10 indicates the number of occurrences of the API call pattern in the use history log of the service user whose service user ID is "003", and a reference sign P11 indicates the number of occurrences of the API call pattern in the use history log of the service user whose service user ID is "004". The matrices of the respective service users mutually have the same format. - As described above, the table related to the service user whose service user ID is "001", which is indicated by the reference sign P4 in
FIG. 4 , includes three call patterns of API_A → API_B, API_B → API_C, and API_C → API_A. For example, the number of occurrences of each of the three call patterns of a start point A to end point B, a start point B to end point C, and a start point C to end point A is 1. - Thus, in the matrix indicated by the reference sign P8 in
FIG. 5 , the number of occurrences of 1 is set at each position of the start point A to end point B, the start point B to end point C, and the start point C to end point A. - In this way, the
log analysis unit 102 uses a combination of two APIs that are continuously executed (used) (call pattern) as one unit to extract a part of use order of the APIs that is recognized to have continuity, and counts the number of occurrences of each combination. - Furthermore, as described above, the
log analysis unit 102 obtains the number of occurrences of each of the API call patterns recognized to have continuity. Thus, in a case where the elapsed time (60 minutes) from the use time in the previous entry to the use time in the subsequent entry is greater than the threshold T (for example, T = 30 minutes), thelog analysis unit 102 does not (exceptionally) include the use of these APIs in the count. - The table related to the service user whose service user ID is "003", which is indicated by the reference sign P6 in
FIG. 4 , includes three call patterns of API_B → API_A, API_A → API_C, and API_C → API_C. However, for the call pattern of API_B → API_A, elapsed time (75 minutes) from use time of the API_B to use time of the subsequent API_A is greater than the threshold T (for example, T = 30 minutes). Thus, thelog analysis unit 102 does not include this call pattern in the count. - Thus, in the matrix indicated by the reference sign P10 in
FIG. 5 , the number of occurrences of 1 is set at each position of a start point A to end point C and a start point C to end point C. - The
log analysis unit 102 adds up the matrices created for the respective service users in theprocessing 2. Thus, thelog analysis unit 102 obtains the total number of occurrences (number of calls) of each of the API call patterns recognized to have continuity for all service users. - For example, the
log analysis unit 102 obtains the number of times of execution of two APIs executed continuously in the execution order. -
FIG. 6 is a diagram illustrating the method of managing the number of occurrences of each API call pattern by thelog analysis unit 102 of thecomputer system 1 as an example of the embodiment, and indicates the total number of occurrences for all service users. - In a matrix illustrated in
FIG. 6 , it may be seen that the number of occurrences (number of calls) of the call pattern of the start point A to end point B, for example, the pattern in which the API_B is called next to the API_A, is the largest. - The
log analysis unit 102 determines a display form of acorresponding edge 202 on a directed graph on the output screen 200 (described later by usingFIG. 7 ) to be displayed by the graph creation/display control unit 103 according to the size of each element of the matrices that are added up, and output the display form to the graph creation/display control unit 103. - The
log analysis unit 102 determines a line type of theedge 202 according to the number of calls between the APIs having continuity analyzed as described above. For example, thelog analysis unit 102 thickens a line of theedge 202 as the number of calls of the call pattern increases. - The
log analysis unit 102 outputs (provides notification of) information indicating the line type (line type information) of thedetermined edge 202 to the graph creation/display control unit 103. Thelog analysis unit 102 notifies the graph creation/display control unit 103 of the line type information of theedge 202 together with information for specifying theedge 202 represented by the line type information (for example, API identification information of APIs that are a start point and an end point of the edge 202). - The
log analysis unit 102 corresponds to the display form determination unit that determines, on the basis of the API use history log, a display form (line type) of theedge 202 that connects between twonodes 201 corresponding to two APIs in a directed graph of theoutput screen 200 according to the number of times of execution of the two APIs continuously executed in the execution order among a plurality of APIs. - The graph creation/
display control unit 103 generates a display screen to be displayed on themonitor 14a. - The graph creation/
display control unit 103 generates a display screen to be provided to a service administrator, and displays the display screen on themonitor 14a via thegraphic processing device 14. - The display screen generated by the graph creation/
display control unit 103 may include an input screen for the service administrator to perform an input operation and an output screen for outputting a log analysis result by thelog analysis unit 102. - The input screen generated by the graph creation/
display control unit 103 has a graphical user interface (GUI), and the service administrator performs the input operation via the GUI. The service administrator inputs, for example, information regarding APIs constituting theservice 20. - The service administrator inputs the information regarding the APIs in a format of, for example, a directed graph with nodes and edges (sides and branches).
- The information regarding the APIs includes, for example, names of the APIs, quality of the APIs, development costs of the APIs, and presence or absence of relevance between the APIs. The input information regarding the APIs is used to generate the
output screen 200 illustrated inFIG. 7 . - Note that the quality of the API may be represented by, for example, the number of error occurrences (error occurrence rate) in the API. Furthermore, the development cost of the API may be represented by an amount of money or work man-hours.
-
FIG. 7 is a diagram illustrating theoutput screen 200 in thecomputer system 1 as an example of the embodiment. - The
output screen 200 reflects and represents information regarding use histories of APIs in theservice 20 on a directed graph, and is mainly provided to a service administrator. Theoutput screen 200 is generated corresponding to theservice 20. - The
output screen 200 illustrated inFIG. 7 includes a plurality of (seven in the example illustrated inFIG. 7 ) nodes 201-1 to 201-7 and a plurality of (eleven in the example illustrated inFIG. 7 ) edges 202-1 to 202-11. These nodes 201-1 to 201-7 and edges 202-1 to 202-11 constitute the directed graph. Furthermore, theoutput screen 200 illustrated inFIG. 7 also includesundirected edges 203 that connect thenodes 201 having relevance. - The nodes 201-1 to 201-7 represent APIs. In the example illustrated in
FIG. 7 , the seven nodes 201-1 to 201-7 are indicated in circles, and these nodes 201-1 to 201-7 correspond to seven APIs (API_A, API_B, API_C, API_D, API_E, API_F, and API_G) included in theservice 20. - Hereinafter, in a case where the seven nodes 201-1 to 201-7 are not particularly distinguished, they are written as the
nodes 201. Names of thenodes 201 are indicated in thenodes 201. - The edges 202-1 to 202-11 are directed line segments (arrows) that connect the
nodes 201 having relevance. Hereinafter, in a case where the eleven edges 202-1 to 202-11 are not particularly distinguished, they are written as theedges 202. - The graph creation/
display control unit 103 displays, on theoutput screen 200, the names of the APIs input from the GUI of the input screen as the names of thenodes 201. Furthermore, the presence or absence of relevance between the APIs is expressed as presence or absence of the edge between thenodes 201 on theoutput screen 200. - On the
output screen 200, linkage between the APIs is visually represented by connecting thenodes 201 corresponding to the APIs related to each other, such as the APIs that exchange data, with the lines (theundirected edges 203 and the edges 202). - On the
output screen 200, theundirected edges 203 and theedges 202 that connect thenodes 201 indicate that API call has been repeated. In addition, it is indicated that the thicker the line thickness of theedge 202, the greater the number of times of repeat of the API call. - Furthermore, in a case where the number of times of repeat of the API call is equal to or smaller than a predetermined threshold, for example, in a case where the number of times of repeat of the API call is small, the graph creation/
display control unit 103 sets, for example, a line type of theedge 202 to a broken line or a dotted line (see the edge 202-9). - Note that, in a case where the number of times of repeat of the API call is equal to or greater than a first threshold and equal to or smaller than a second threshold, for example, in a case where the number of times of repeat of the API call is not large or small, the graph creation/
display control unit 103 may suppress illustration of theedge 202. With this configuration, the information to be displayed on theoutput screen 200 may be suppressed to make it easier to see. - Furthermore, the graph creation/
display control unit 103 expresses the quality of the APIs input from the GUI of the input screen as positions of thenodes 201 in a vertical axis direction on theoutput screen 200. For example, an API with higher quality is arranged at an upper position in theoutput screen 200, and an API with lower quality is arranged at a lower position in theoutput screen 200. - For example, the graph creation/
display control unit 103 displays thenodes 201 in the directed graph of theoutput screen 200 in a state according to the quality of the APIs corresponding to thenodes 201. - Note that the
log collection unit 101 may collect information regarding an error detected by each API, and thelog analysis unit 102 may obtain the number of error occurrences (error occurrence rate) for each API. Then, the graph creation/display control unit 103 may appropriately move positions of thenodes 201 in theoutput screen 200 according to the number of error occurrences (error occurrence rate). - Moreover, the graph creation/
display control unit 103 expresses the development costs of the APIs input from the GUI of the input screen as positions of thenodes 201 in a horizontal axis direction on theoutput screen 200. - For example, an API with higher development cost is arranged at a leftward position in the
output screen 200, and an API with lower development cost is arranged at a rightward position in theoutput screen 200. For example, since an API provided as free open source software (OSS) does not need a development cost, it is arranged at a right end position in theoutput screen 200. Furthermore, an API of a self-developed core function is arranged at a left side position in theoutput screen 200 as an API with a high development cost. An API which is a charged product may be arranged at a position near the center in a horizontal direction in theoutput screen 200, for example. - For example, the graph creation/
display control unit 103 displays thenodes 201 in the directed graph of theoutput screen 200 in a state according to the development costs of the APIs corresponding to thenodes 201. - The graph creation/
display control unit 103 reflects the node size information and the line type information notified from thelog analysis unit 102 on theoutput screen 200 generated as described above. - For example, on the basis of the node size information notified from the
log analysis unit 102 together with the API identification information, the graph creation/display control unit 103 changes the size of thenode 201 of the API specified by the API identification information to the size indicated by the node size information. - Furthermore, on the basis of the line type information notified from the
log analysis unit 102 together with the information for specifying theedge 202, the graph creation/display control unit 103 changes the line type of theedge 202 specified by the information for specifying theedge 202 to the line type indicated by the line type information. - The graph creation/
display control unit 103 displays theoutput screen 200 reflecting the node size information and the line type information on themonitor 14a, thereby providing the node size information and the line type information to a service administrator. - Processing in the
computer system 1 as an example of the embodiment configured as described above will be described with reference to a flowchart (Steps A1 to S8) illustrated inFIG. 8 . - In Step S1, a service administrator uses the
keyboard 15a and themouse 15b to input information regarding APIs constituting theservice 20 from a GUI of an input screen provided by the graph creation/display control unit 103. The service administrator inputs the information regarding the APIs in a format of a directed graph with thenodes 201 and theedges 202. The input information is stored in, for example, a predetermined storage area of thestorage device 13. - In Step S2, a service user uses the
service 20. At this time, theservice providing servers 51 use the APIs constituting theservice 20, and API use history logs are recorded in, for example, a memory or storage device (not illustrated) of theAPI providing server 51, while being included in a use history of theservice 20. - In Step S3, the
log collection unit 101 acquires the information regarding the APIs input in Step S1 from the graph creation/display control unit 103. - In Step S4, the
log collection unit 101 acquires the API use history logs recorded in Step S2 from theservice providing server 51 on the basis of the information regarding the APIs acquired in Step S3. - In Step S5, the
log collection unit 101 extracts necessary data (for example, a service user ID and use time) from the API use history logs acquired in Step S4, and stores the data in thelog management database 104. - In Step S6, the
log analysis unit 102 acquires the data stored in Step S5 from thelog management database 104 and analyzes the data. - For example, the
log analysis unit 102 analyzes the number of times of use of an API (API use frequency) by the service user for each API. - Furthermore, the
log analysis unit 102 analyzes order in which the service user used the APIs, and obtains, on the basis of the use order of the APIs, the total number of occurrences (number of calls) of each of API call patterns (execution order patterns) recognized to have continuity for all service users. - In Step S7, the
log analysis unit 102 determines node size information on the basis of the API use frequency by the service user, and outputs the node size information to the graph creation/display control unit 103 together with information for specifying the API represented by the node size (API identification information). - Furthermore, the
log analysis unit 102 obtains the total number of occurrences (number of calls) of each of the API call patterns recognized to have continuity for all service users. Then, thelog analysis unit 102 determines a line type (display form) of theedge 202 according to the number of calls between the APIs having continuity. - The
log analysis unit 102 outputs, to the graph creation/display control unit 103, the determined line type information of theedge 202 together with information for specifying theedge 202 represented by the line type information (for example, API identification information of APIs that are a start point and an end point of the edge 202). - In Step S8, the graph creation/
display control unit 103 reflects the node size information and line type information output from thelog analysis unit 102 on the directed graph of theoutput screen 200, outputs them to themonitor 14a, and presents them to the service administrator. Thereafter, the processing ends. - Thus, according to the
computer system 1 as an embodiment of the present invention, thelog analysis unit 102 analyzes the number of times of use of an API (API use frequency) by a service user for each API, determines the size (node size) of thenode 201 representing the PI according to the API use frequency, and notifies the graph creation/display control unit 103 of the size. - The graph creation/
display control unit 103 displays thenode 201 corresponding to the API with the node size notified from thelog analysis unit 102 in a directed graph of theoutput screen 200. - With this configuration, on the
output screen 200, use states (the numbers of times of use) of a plurality of APIs used in theservice 20 are visualized, and a service administrator may easily grasp the use states of the APIs, which is highly convenient. For example, it is possible to take improvement measures at an early stage for APIs that are used infrequently. - For example, on the
output screen 200 illustrated inFIG. 7 , it is possible to easily grasp that the numbers of times of use of API_E and API_G are small, and it is possible to work on improvement at an early stage. - Here, it is considered to be a problem that the number of times of use of the API_E is small despite a high development cost. As a measure, it is possible to take measures at an early stage, such as improving quality of the API_E or stopping self-development and replacing the API_E with OSS having the same function.
- Although the number of times of use of the API_G is small similarly to the API_E, a development cost of the API_G is originally low. Thus, it may be determined that an influence on the
service 20 is small. Here, however, when a policy of increasing frequency of use of the API_G is adopted, measures such as replacement to a rich product having the same function or self-development of the API_G may be taken at an early stage. - Furthermore, the
log analysis unit 102 obtains, on the basis of use order of each API, the total number of occurrences (number of calls) of each of API call patterns (execution order patterns) recognized to have continuity for all service users. Then, thelog analysis unit 102 creates line type information for changing a line type of theedge 202 according to the analyzed number of calls between the APIs having continuity. - The graph creation/
display control unit 103 displays theedges 202 between thenodes 201 with the line type information notified from thelog analysis unit 102 in the directed graph of theoutput screen 200. - With this configuration, by looking at the
edges 202 between the APIs on theoutput screen 200, the service administrator may easily grasp the use states of the APIs in what order the service users are using the APIs, which is highly convenient. - For example, on the
output screen 200 illustrated inFIG. 7 , it may be seen that there are extremely few people who use the APIs in the order of API_B → API_E, even though the API_B and the API_E are linked APIs. The service administrator may infer that there is a bottleneck here in difficulty of use for the service users. - On the other hand, since the number of times another API is continuously used after the API_C is large, it may be easily grasped that the API_C plays a role like a hub. Therefore, it is possible to analyze that the number of times of use of the API_E is expected to increase by improving the
service 20 so that the API_C and the API_E are linked. - The disclosed technique is not limited to the embodiment described above, and various modifications may be made to be implemented without departing from the gist of the present embodiment. Each configuration and each processing of the present embodiment may be selected or omitted as needed or may be appropriately combined.
- For example, in the embodiment described above, the
log analysis unit 102 changes the size of thenode 201 corresponding to the API in the directed graph of theoutput screen 200 according to the number of times of use of the API. However, the embodiment is not limited to this. - For example, the color, shape, pattern, or the like of the
node 201 may be displayed differently according to the number of times of use of the API, and various modifications may be made to be implemented. The color may include saturation or brightness. - Furthermore, in the embodiment described above, according to the number of times of execution of two APIs continuously executed in the execution order, the
log analysis unit 102 changes line type so that lines of theedges 202 between thenodes 201 corresponding to the APIs in the directed graph of theoutput screen 200 are thickened. However, the embodiment is not limited to this. - For example, the color, shape, pattern, or the like of the
nodes 201 may be displayed differently according to the number of times of execution of the two APIs continuously executed in the execution order, and various modifications may be made to be implemented. The color may include saturation or brightness. - The graph creation/
display control unit 103 displays thenodes 201 in the directed graph of theoutput screen 200 at positions according to the quality or development costs of the APIs corresponding to thenodes 201. However, the embodiment is not limited to this. The graph creation/display control unit 103 may display the color, shape, pattern, or the like of thenodes 201 differently according to the quality or development costs of the APIs, and various modifications may be made to be implemented. - Furthermore, the present embodiment may be implemented and manufactured by those skilled in the art according to the disclosure described above.
-
- 1
- Computer system
- 10
- Management device
- 11
- Processor
- 12
- RAM
- 13
- HDD
-
- 14
- Graphic processing device
- 14a
- Monitor
- 15
- Input interface
- 15a
- Keyboard
- 15b
- Mouse
- 16
- Optical drive device
- 16a
- Optical disk
- 17
- Device connection interface
- 17a
- Memory device
- 17b
- Memory reader/writer
- 17c
- Memory card
- 18
- Network interface
- 18a
- Network
- 19
- Bus
- 20
- Computer service
- 50
- Network
- 51
- Service providing server
- 52
- User terminal
- 101
- Log collection unit
- 102
- Log analysis unit
- 103
- Graph creation/display control unit
- 104
- Log management database
- 200
-
Output screen 200 - 201-1 to 201-7,201
- Node
- 202-1 to 202-11,202
- Edge
- 203
- Undirected edge
-
-
Japanese Laid-open Patent Publication No. 2015-106268 -
Japanese Laid-open Patent Publication No. 2017-228257 -
Japanese Laid-open Patent Publication No. 2018-147350
Claims (8)
- An information processing apparatus comprising:a display form determination unit that extracts, from use history data of a computer service that uses a plurality of application programming interfaces (APIs), the numbers of times of execution of the APIs, and determines display forms for the APIs according to the numbers of times of execution of the APIs; anda display control unit that displays, in a directed graph that represents a node that corresponds to each of the plurality of APIs, the nodes that correspond to the APIs in the determined display forms.
- The information processing apparatus according to claim 1, whereinthe display form determination unit determines, according to the number of times of execution of two APIs continuously executed in the execution order among the plurality of APIs, a display form of a directed line segment that connects, on the basis of the use history data, between two nodes that correspond to the two APIs in the directed graph, andthe display control unit displays the directed line segment in the determined display form in the directed graph.
- The information processing apparatus according to claim 1 or 2, whereinthe display control unitdisplays, in the directed graph, the nodes in a state according to quality of the APIs that correspond to the nodes.
- The information processing apparatus according to any one of claims 1 to 3, whereinthe display control unitdisplays, in the directed graph, the nodes in a state according to development costs of the APIs that correspond to the nodes.
- An API use history display program that causes a processor of an information processing apparatus connected to a computer service that uses a plurality of application programming interfaces (APIs) to execute processing comprising:extracting, from use history data of the computer service, the numbers of times of execution of the APIs, and determining display forms for the APIs according to the numbers of times of execution of the APIs; anddisplaying, in a directed graph that represents a node that corresponds to each of the plurality of APIs, the nodes that correspond to the APIs in the determined display forms.
- The API use history display program according to claim 5, causing the processor to execute processing comprising:determining, according to the number of times of execution of two APIs continuously executed in the execution order among the plurality of APIs, a display form of a directed line segment that connects between two nodes that correspond to the two APIs in the directed graph, on the basis of the use history data; anddisplaying the directed line segment in the determined display form in the directed graph.
- The API use history display program according to claim 5 or 6, causing the processor to execute processing comprising
displaying, in the directed graph, the nodes in a state according to quality of the APIs that correspond to the nodes. - The API use history display program according to any one of claims 5 to 7, causing the processor to execute processing comprising
displaying, in the directed graph, the nodes in a state according to development costs of the APIs that correspond to the nodes.
Applications Claiming Priority (1)
| Application Number | Priority Date | Filing Date | Title |
|---|---|---|---|
| PCT/JP2019/014458 WO2020202433A1 (en) | 2019-04-01 | 2019-04-01 | Information processing device and api usage history display program |
Publications (2)
| Publication Number | Publication Date |
|---|---|
| EP3951601A1 true EP3951601A1 (en) | 2022-02-09 |
| EP3951601A4 EP3951601A4 (en) | 2022-04-13 |
Family
ID=72666775
Family Applications (1)
| Application Number | Title | Priority Date | Filing Date |
|---|---|---|---|
| EP19923619.1A Withdrawn EP3951601A4 (en) | 2019-04-01 | 2019-04-01 | INFORMATION PROCESSING DEVICE AND API USAGE HISTORY DISPLAY PROGRAM |
Country Status (4)
| Country | Link |
|---|---|
| US (1) | US11762720B2 (en) |
| EP (1) | EP3951601A4 (en) |
| JP (1) | JP7218797B2 (en) |
| WO (1) | WO2020202433A1 (en) |
Families Citing this family (5)
| Publication number | Priority date | Publication date | Assignee | Title |
|---|---|---|---|---|
| US11803428B2 (en) * | 2021-04-30 | 2023-10-31 | Salesforce, Inc. | Feature based application programming interface federation |
| JP7771576B2 (en) * | 2021-09-06 | 2025-11-18 | オムロン株式会社 | Device management system, method for estimating the cause of device failure, and program |
| US11537448B1 (en) * | 2021-12-14 | 2022-12-27 | Asapp, Inc. | Adapting application programming interfaces with schema mappings |
| US20230214312A1 (en) * | 2021-12-30 | 2023-07-06 | American Express Travel Related Services Company, Inc. | Mapping api dependencies for a journey test |
| JP7775416B1 (en) * | 2024-10-25 | 2025-11-25 | 日立ヴァンタラ株式会社 | Software usage status investigation system, software usage status investigation device, and software usage status investigation method |
Family Cites Families (8)
| Publication number | Priority date | Publication date | Assignee | Title |
|---|---|---|---|---|
| JP2000330821A (en) * | 1999-05-21 | 2000-11-30 | Mitsubishi Electric Corp | How to create software for embedded systems |
| JP2011242891A (en) * | 2010-05-14 | 2011-12-01 | Canon Inc | Distribution device, image processing device, distribution method and installation method |
| US8782614B2 (en) * | 2011-04-08 | 2014-07-15 | Ca, Inc. | Visualization of JVM and cross-JVM call stacks |
| US9396046B2 (en) * | 2013-10-31 | 2016-07-19 | International Business Machines Corporation | Graph based data model for API ecosystem insights |
| JP6228824B2 (en) | 2013-11-29 | 2017-11-08 | 株式会社Nttドコモ | Analysis device, analysis system, program, and control method of analysis device |
| JP6617617B2 (en) * | 2016-03-10 | 2019-12-11 | 富士通株式会社 | Management device, management program, and management method |
| JP6577914B2 (en) | 2016-06-24 | 2019-09-18 | 日本電信電話株式会社 | Business process generation program and business process generation method |
| JP6718835B2 (en) | 2017-03-08 | 2020-07-08 | 株式会社日立製作所 | Utilization status analysis device for information processing system and utilization status analysis method |
-
2019
- 2019-04-01 WO PCT/JP2019/014458 patent/WO2020202433A1/en not_active Ceased
- 2019-04-01 JP JP2021511802A patent/JP7218797B2/en active Active
- 2019-04-01 EP EP19923619.1A patent/EP3951601A4/en not_active Withdrawn
-
2021
- 2021-09-10 US US17/471,214 patent/US11762720B2/en active Active
Also Published As
| Publication number | Publication date |
|---|---|
| WO2020202433A1 (en) | 2020-10-08 |
| EP3951601A4 (en) | 2022-04-13 |
| JPWO2020202433A1 (en) | 2021-11-25 |
| US11762720B2 (en) | 2023-09-19 |
| US20210406104A1 (en) | 2021-12-30 |
| JP7218797B2 (en) | 2023-02-07 |
Similar Documents
| Publication | Publication Date | Title |
|---|---|---|
| US11762720B2 (en) | Information processing apparatus and non-transitory computer-readable storage medium for storing API use history display program | |
| US10761687B2 (en) | User interface that facilitates node pinning for monitoring and analysis of performance in a computing environment | |
| CN109697066B (en) | Method and system for realizing data sheet splicing and automatically training machine learning model | |
| EP4182796B1 (en) | Machine learning-based techniques for providing focus to problematic compute resources represented via a dependency graph | |
| US10205643B2 (en) | Systems and methods for monitoring and analyzing performance in a computer system with severity-state sorting | |
| US10469344B2 (en) | Systems and methods for monitoring and analyzing performance in a computer system with state distribution ring | |
| US10268564B2 (en) | Dynamic tracing using ranking and rating | |
| JP5324958B2 (en) | Method, program and apparatus for generating an integrated display of performance trends for multiple resources in a data processing system (integrated display of resource performance trends) | |
| US7546220B1 (en) | System and method for preparing trace data for analysis | |
| JP6256115B2 (en) | Operation search program, operation search method, and operation search device | |
| WO2017104119A1 (en) | Log analysis system, method, and program | |
| WO2024055663A1 (en) | Database performance monitoring method and related system | |
| US8887077B2 (en) | Synchronized graphical and tabular performance data display | |
| JP5803935B2 (en) | Availability analysis apparatus and availability analysis method | |
| US11487462B2 (en) | Method and device of predicting inter-volume copy time based on inter-pool copy speed | |
| CN118897784B (en) | Interface call log analysis method, device, equipment, medium and product | |
| US12373497B1 (en) | Dynamic generation of performance state tree | |
| US20170206143A1 (en) | Management apparatus, management method, and computer-readable recording medium recorded with management program | |
| CN119046465A (en) | Log classification method, device, equipment, storage medium and computer program product | |
| JP7799580B2 (en) | Source code analysis device, source code analysis method, and source code analysis program | |
| JP2021135541A (en) | Model generator, model generator, and model generator | |
| US9952773B2 (en) | Determining a cause for low disk space with respect to a logical disk | |
| JP2023106867A (en) | Evidence management device, evidence management method, program and recording medium | |
| JP7838225B2 (en) | Contact center support device and contact center support method | |
| US20260023788A1 (en) | Dynamic generation of performance state tree |
Legal Events
| Date | Code | Title | Description |
|---|---|---|---|
| STAA | Information on the status of an ep patent application or granted ep patent |
Free format text: STATUS: THE INTERNATIONAL PUBLICATION HAS BEEN MADE |
|
| PUAI | Public reference made under article 153(3) epc to a published international application that has entered the european phase |
Free format text: ORIGINAL CODE: 0009012 |
|
| STAA | Information on the status of an ep patent application or granted ep patent |
Free format text: STATUS: REQUEST FOR EXAMINATION WAS MADE |
|
| 17P | Request for examination filed |
Effective date: 20210916 |
|
| AK | Designated contracting states |
Kind code of ref document: A1 Designated state(s): AL AT BE BG CH CY CZ DE DK EE ES FI FR GB GR HR HU IE IS IT LI LT LU LV MC MK MT NL NO PL PT RO RS SE SI SK SM TR |
|
| A4 | Supplementary search report drawn up and despatched |
Effective date: 20220314 |
|
| RIC1 | Information provided on ipc code assigned before grant |
Ipc: G06T 11/20 20060101ALI20220307BHEP Ipc: G06F 11/32 20060101ALI20220307BHEP Ipc: G06F 11/34 20060101AFI20220307BHEP |
|
| DAV | Request for validation of the european patent (deleted) | ||
| DAX | Request for extension of the european patent (deleted) | ||
| STAA | Information on the status of an ep patent application or granted ep patent |
Free format text: STATUS: EXAMINATION IS IN PROGRESS |
|
| 17Q | First examination report despatched |
Effective date: 20230421 |
|
| STAA | Information on the status of an ep patent application or granted ep patent |
Free format text: STATUS: THE APPLICATION IS DEEMED TO BE WITHDRAWN |
|
| 18D | Application deemed to be withdrawn |
Effective date: 20241101 |