EP3945321A1 - Quality control support method, quality control support system, quality control support device, and program - Google Patents
Quality control support method, quality control support system, quality control support device, and program Download PDFInfo
- Publication number
- EP3945321A1 EP3945321A1 EP21187161.1A EP21187161A EP3945321A1 EP 3945321 A1 EP3945321 A1 EP 3945321A1 EP 21187161 A EP21187161 A EP 21187161A EP 3945321 A1 EP3945321 A1 EP 3945321A1
- Authority
- EP
- European Patent Office
- Prior art keywords
- period
- chart
- control
- quality control
- control chart
- Prior art date
- Legal status (The legal status is an assumption and is not a legal conclusion. Google has not performed a legal analysis and makes no representation as to the accuracy of the status listed.)
- Granted
Links
Images













Classifications
-
- G—PHYSICS
- G01—MEASURING; TESTING
- G01N—INVESTIGATING OR ANALYSING MATERIALS BY DETERMINING THEIR CHEMICAL OR PHYSICAL PROPERTIES
- G01N35/00—Automatic analysis not limited to methods or materials provided for in any single one of groups G01N1/00 - G01N33/00; Handling materials therefor
- G01N35/00584—Control arrangements for automatic analysers
- G01N35/00594—Quality control, including calibration or testing of components of the analyser
- G01N35/00613—Quality control
-
- G—PHYSICS
- G01—MEASURING; TESTING
- G01N—INVESTIGATING OR ANALYSING MATERIALS BY DETERMINING THEIR CHEMICAL OR PHYSICAL PROPERTIES
- G01N35/00—Automatic analysis not limited to methods or materials provided for in any single one of groups G01N1/00 - G01N33/00; Handling materials therefor
- G01N35/00584—Control arrangements for automatic analysers
- G01N35/00594—Quality control, including calibration or testing of components of the analyser
- G01N35/00613—Quality control
- G01N35/00623—Quality control of instruments
-
- G—PHYSICS
- G16—INFORMATION AND COMMUNICATION TECHNOLOGY [ICT] SPECIALLY ADAPTED FOR SPECIFIC APPLICATION FIELDS
- G16H—HEALTHCARE INFORMATICS, i.e. INFORMATION AND COMMUNICATION TECHNOLOGY [ICT] SPECIALLY ADAPTED FOR THE HANDLING OR PROCESSING OF MEDICAL OR HEALTHCARE DATA
- G16H40/00—ICT specially adapted for the management or administration of healthcare resources or facilities; ICT specially adapted for the management or operation of medical equipment or devices
- G16H40/40—ICT specially adapted for the management or administration of healthcare resources or facilities; ICT specially adapted for the management or operation of medical equipment or devices for the management of medical equipment or devices, e.g. scheduling maintenance or upgrades
-
- G—PHYSICS
- G01—MEASURING; TESTING
- G01N—INVESTIGATING OR ANALYSING MATERIALS BY DETERMINING THEIR CHEMICAL OR PHYSICAL PROPERTIES
- G01N35/00—Automatic analysis not limited to methods or materials provided for in any single one of groups G01N1/00 - G01N33/00; Handling materials therefor
- G01N35/00584—Control arrangements for automatic analysers
- G01N35/00594—Quality control, including calibration or testing of components of the analyser
- G01N35/00693—Calibration
-
- G—PHYSICS
- G01—MEASURING; TESTING
- G01N—INVESTIGATING OR ANALYSING MATERIALS BY DETERMINING THEIR CHEMICAL OR PHYSICAL PROPERTIES
- G01N35/00—Automatic analysis not limited to methods or materials provided for in any single one of groups G01N1/00 - G01N33/00; Handling materials therefor
- G01N35/00584—Control arrangements for automatic analysers
- G01N35/00594—Quality control, including calibration or testing of components of the analyser
- G01N35/00712—Automatic status testing, e.g. at start-up or periodic
-
- G—PHYSICS
- G01—MEASURING; TESTING
- G01N—INVESTIGATING OR ANALYSING MATERIALS BY DETERMINING THEIR CHEMICAL OR PHYSICAL PROPERTIES
- G01N35/00—Automatic analysis not limited to methods or materials provided for in any single one of groups G01N1/00 - G01N33/00; Handling materials therefor
- G01N35/00584—Control arrangements for automatic analysers
- G01N35/00722—Communications; Identification
- G01N35/00871—Communications between instruments or with remote terminals
-
- G—PHYSICS
- G06—COMPUTING OR CALCULATING; COUNTING
- G06F—ELECTRIC DIGITAL DATA PROCESSING
- G06F3/00—Input arrangements for transferring data to be processed into a form capable of being handled by the computer; Output arrangements for transferring data from processing unit to output unit, e.g. interface arrangements
- G06F3/01—Input arrangements or combined input and output arrangements for interaction between user and computer
- G06F3/048—Interaction techniques based on graphical user interfaces [GUI]
- G06F3/0484—Interaction techniques based on graphical user interfaces [GUI] for the control of specific functions or operations, e.g. selecting or manipulating an object, an image or a displayed text element, setting a parameter value or selecting a range
-
- G—PHYSICS
- G01—MEASURING; TESTING
- G01N—INVESTIGATING OR ANALYSING MATERIALS BY DETERMINING THEIR CHEMICAL OR PHYSICAL PROPERTIES
- G01N35/00—Automatic analysis not limited to methods or materials provided for in any single one of groups G01N1/00 - G01N33/00; Handling materials therefor
- G01N35/00584—Control arrangements for automatic analysers
- G01N35/00722—Communications; Identification
- G01N35/00732—Identification of carriers, materials or components in automatic analysers
- G01N2035/00792—Type of components bearing the codes, other than sample carriers
- G01N2035/00811—Type of components bearing the codes, other than sample carriers consumable or exchangeable components other than sample carriers, e.g. detectors, flow cells
-
- G—PHYSICS
- G01—MEASURING; TESTING
- G01N—INVESTIGATING OR ANALYSING MATERIALS BY DETERMINING THEIR CHEMICAL OR PHYSICAL PROPERTIES
- G01N35/00—Automatic analysis not limited to methods or materials provided for in any single one of groups G01N1/00 - G01N33/00; Handling materials therefor
- G01N35/00584—Control arrangements for automatic analysers
- G01N35/00722—Communications; Identification
- G01N35/00871—Communications between instruments or with remote terminals
- G01N2035/00881—Communications between instruments or with remote terminals network configurations
-
- G—PHYSICS
- G01—MEASURING; TESTING
- G01N—INVESTIGATING OR ANALYSING MATERIALS BY DETERMINING THEIR CHEMICAL OR PHYSICAL PROPERTIES
- G01N35/00—Automatic analysis not limited to methods or materials provided for in any single one of groups G01N1/00 - G01N33/00; Handling materials therefor
- G01N35/00584—Control arrangements for automatic analysers
- G01N35/00722—Communications; Identification
- G01N2035/00891—Displaying information to the operator
- G01N2035/0091—GUI [graphical user interfaces]
Definitions
- the present invention relates to a quality control support method, a quality control support system, a quality control support device, and a program.
- a method using a control chart by the LJ (Levey-Jennings) method, measurement results of quality control substances prepared to obtain predetermined measured values in chronological order, and a method using a control chart showing the average value transition of the measurement results of a subject sample without using a quality control substance are known as quality control methods.
- LJ Levey-Jennings
- a method using a control chart showing the average value transition of the measurement results of a subject sample without using a quality control substance are known as quality control methods.
- the number of measurements of quality control substances is generally 1 to 3 times a day, whereas the number of measurements of subject samples may be tens to hundreds of times. Since the control chart by the LJ method and the control chart showing the result of PBRTQC are displayed in the same period in the method described in Lo TP, Cervinski MA, et al., "Recommendations for laboratory informatics specifications needed for the application of patient-based real time quality control", Clinica Chimica Acta, 2019 Aug, 495, pages 625-629 , if the display period is shortened, for example, it is difficult to grasp the transition the measurement result of the quality control substances over a long period of time, such as 2 weeks, and if the display time is lengthened for example, it is difficult to grasp the transition of the measurement result of the subject sample in a short period such as one day.
- the present invention provides a quality control support method, a quality control support system, a quality control support device, and a program that facilitates identification of the cause when an abnormality is found in a measurement result.
- the quality control support method is a quality control support method for displaying a control chart of quality control related to an analyzer that measures a subject sample, the method comprising: generating a first control chart showing results of measured quality control substances by the analyzer in a first period; receiving a designation of a second period different from the first period, the second period being shorter than the first period and at least partially overlapping with the first period; generating a second control chart showing results of the measured subject samples by the analyzer in the second period; displaying the generated first control chart; and displaying the generated second control chart.
- the above-mentioned quality control support method displays the first control chart in the first period, receives the designation of the second period, which is different from the first period, shorter than the first period, and at least partially overlaps with the first period, and displays the second control chart in the second period. Therefore, in the above quality control support method, the first control chart and the second control chart are displayed in the display period according to the difference between the measurement frequency of the quality control substance and the measurement frequency of the subject sample. Accordingly, the cause can be easily identified when there is an abnormality in the measurement result.
- Receiving the designation of the second period separately from the designation of the first period is to receive the designation of the designation of the second period separetly from the first period preset as the default period, or an arbitrarily designated first period. When an arbitrary first period is designated, the timing of receiving the designation may be different from each other or simultaneous with each other in the first period and the second period.
- the quality control support method is a quality control support method for displaying a control chart of quality control related to an analyzer that measures a subject sample, the method comprising: generating a first control chart showing results of measured quality control substances by the analyzer in a first period; generating a second control chart showing results of measured subject samples by the analyzer in a second period, which is a part of the first period; and displaying the first control chart and the second control chart side by side.
- the quality control support method displays the first control chart in the first period, and displays the second control chart in the second period, which is a part of the first period, and displays the first control chart and the second control chart side by side. Therefore, in the above quality control support method, the first control chart and the second control chart are displayed side by side in the display period according to the difference between the measurement frequency of the quality control substance and the measurement frequency of the subject sample. Accordingly, since the first control chart and the second control chart are displayed side by side, the cause can be more easily identified when there is an abnormality in the measurement result.
- the quality control support system is a quality control support system for displaying a control chart of quality control related to an analyzer that measures a subject sample, the system comprising: a quality control support device comprising a first control unit; a terminal device, which is connected to the quality control support device via a network, comprising a second control unit and a display; wherein the first control unit of the quality control support device is configured to execute operations comprising: generating a first control chart showing results of measured quality control substances by the analyzer in a first period; receiving a designation of a second period different from the first period, the second period being shorter than the first period and at least partially overlapping with the first period; generating a second control chart showing results of measured subject samples by the analyzer in the second period; and the second control unit of the terminal device is configured to execute: displaying the generated first control chart on the display; and displaying the generated second control chart on the display.
- the quality control support system displays the first control chart in the first period, receives the designation of the second period, which is shorter than the first period and at least partially overlaps with the first period, separately from the designation of the first period, and displays the second control chart in the second period. Therefore, in the above quality control support method, the first control chart and the second control chart are displayed in the display period according to the difference between the measurement frequency of the quality control substance and the measurement frequency of the subject sample. Accordingly, the cause can be easily identified when there is an abnormality in the measurement result.
- the quality control support device is a quality control support device for displaying a control chart of quality control related to an analyzer that measures a subject sample, the device comprising: a control unit; and a display; wherein the control unit is configured to execute operations comprising: generating a first control chart showing results of measured quality control substances by the analyzer in a first period; receiving a designation of a second period different from the first period, the second period being shorter than the first period and at least partially overlapping with the first period; generating a second control chart showing results of the measured subject samples by the analyzer in the second period; displaying the generated first control chart on the display; and displaying the generated second control chart on the display.
- the quality control support device displays the first control chart in the first period, receives the designation of the second period, which is shorter than the first period and at least partially overlaps with the first period, separately from the designation of the first period, and displays the second control chart in the second period. Therefore, in the above quality control support device, the first control chart and the second control chart are displayed in the display period according to the difference between the measurement frequency of the quality control substance and the measurement frequency of the subject sample. Accordingly, the cause can be easily identified when there is an abnormality in the measurement result.
- the quality control support device is a quality control support device that is connected to a terminal device comprising a display via a network and displays a control chart of quality control related to an analyzer that measures a subject sample on a display of the terminal device, the quality control support devise comprising: a control unit, wherein the control unit is configured to execute operations comprising: generating a first control chart showing results of measured quality control substances by the analyzer in a first period; receiving a designation of a second period different from the first period, the second period being shorter than the first period and at least partially overlapping with the first period; generating a second control chart showing results of the measured subject samples by the analyzer in the second period; sending the generated first control chart to the terminal device; and sending the generated second control chart to the terminal device.
- the quality control support device generates the first control chart in the first period, receives the designation of the second period, which is shorter than the first period and at least partially overlaps with the first period, separately from the designation of the first period, and generates a second control chart in the second period.
- the quality control support device transmits the generated first control chart to the terminal device, and transmits the generated second control chart to the terminal device. Therefore, in the terminal device connected to the quality control support device via the network and equipped with a display, the first control chart and the second control chart are displayed in a display period according to the difference between the measurement frequency of the quality control substance and the measurement frequency of the subject sample. Accordingly, the cause can be easily identified when there is an abnormality in the measurement result.
- the program according to one aspect of the invention is a program in a quality control support device that displays a control chart of quality control related to an analyzer that measures a subject sample on a display of a terminal device, the quality control support device and the terminal device being connected via the network, the program executing operations comprising: generating a first control chart showing results of measured quality control substances by the analyzer in a first period; receiving a designation of a second period different from the first period, the second period being shorter than the first period and at least partially overlapping with the first period; generating a second control chart showing results of the measured subject samples by the analyzer in the second period; sending the generated first control chart to the terminal device; and sending the generated second control chart to the terminal device.
- the program in the quality control support device, executes operations for generating the first control chart in the first period, receiving the designation of the second period, which is shorter than the first period and at least partially overlaps with the first period, separately from the designation of the first period, and generating a second control chart in the second period.
- the program executes operations for sending the generated first control chart to the terminal device, and sending the generated second control chart to the terminal device. Therefore, in the terminal device connected to the quality control support device via the network and equipped with a display, the first control chart and the second control chart are displayed in a display period according to the difference between the measurement frequency of the quality control substance and the measurement frequency of the subject sample. Accordingly, the cause can be easily identified when there is an abnormality in the measurement result.
- the program of one aspect of the invention is a program in a quality control support device comprising a display that displays a control chart of quality control related to an analyzer that measures a subject sample, the program executing operations comprising: generating a first control chart showing results of measured quality control substances by the analyzer in a first period; receiving a designation of a second period different from the first period, the second period being shorter than the first period and at least partially overlapping with the first period; generating a second control chart showing results of the measured subject samples by the analyzer in the second period; displaying the generated first control chart on the display; and displaying the generated second control chart on the display.
- the program in the quality control support device, executes operations for generating the first control chart in the first period, receiving the designation of a second period, which is different from the first period, shorter than the first period and at least partially overlaps with the first period, generating a second control chart in the second period, displaying the generated first control chart on the display, and displaying the generated second control chart on the display. Therefore, in the above quality control support device, the program displays the first control chart and the second control chart in the display period according to the difference between the measurement frequency of the quality control substance and the measurement frequency of the subject sample. Accordingly, the cause can be easily identified when there is an abnormality in the measurement result.
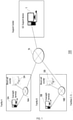
- FIG. 1 is a diagram showing an example of the structure of the quality control support system according to the first embodiment.
- the quality control support system 100 illustratively includes a quality control support device 1, a blood cell counter 3A and an oversight terminal 5A arranged in facility A, and a blood cell counter 3B and an oversight terminal 5B arranged in facility B.
- the quality control support device 1 is a device that displays various charts (control charts) of quality control related to the blood cell counter 3 that measures a subject sample, and/or generates display information for display on another computer.
- the blood cell counter 3 is a device for measuring a subject sample.
- the blood cell counter 3 performs measurement (QC measurement) on the quality control substance, for example, once or twice a day.
- the blood cell counter 3 performs measurements on subject samples, for example, tens to hundreds of times a day.
- the oversight terminal 5 is, for example, a device operated by a person working at the facility, and executes various processes related to the management of the entire facility.
- the oversight terminal 5 receives from the person in charge an instruction to display various charts of quality control related to the blood cell counter 3 or an input regarding a display period.
- the oversight terminal 5 inputs the input.
- the oversight terminal 5 Upon receipt, the corresponding control signal is transmitted to the quality control support device 1.
- the oversight terminal 5 receives the information for displaying the various charts generated by the quality control support device 1, the oversight terminal 5 displays various charts on the display provided in the oversight terminal 5 based on the received information.
- the processing can be distributed to the quality control support device 1 and the oversight terminal 5A. Therefore, it is possible to prevent the oversight terminal 5A from slowing down processing other than displaying various charts, such as viewing inspection results and creating inspection reports.
- Each of the facilities A and B includes, for example, a clinical laboratory, a clinical laboratory center, or the like. When facilities A and B are not distinguished, they are referred to as "facility" below.
- the number of facilities may be two or less, or three or more.
- each facility is managed by a different management entity.
- two or more facilities among the plurality of facilities may be managed by the same management entity.
- blood cell counter 3A and the blood cell counter 3B are not distinguished, they are referred to as “blood cell counter 3" (analyzer).
- the oversight terminal 5A and the oversight terminal 5B are not distinguished, it is referred to as "oversight terminal 5". Note that the number of blood cell counter 3 and the oversight terminal 5 arranged in each facility may be two or more.
- Each facility and the support center are communicably connected via the communication network N.
- the blood cell counter 3A and the oversight terminal 5A are connected to each other so as to be able to communicate with each other via the communication network NA.
- the blood cell counter 3B and the oversight terminal 5B are communicably connected to each other via the communication network NB.
- Each communication network comprises a wired and/or wireless network.
- FIG. 2 is a diagram showing an example of the hardware structure of the quality control support device 1 and the oversight terminal 5 according to the first embodiment.
- the quality control support device 1 includes, for example, a processor 11 (control unit), a memory 12, a storage device 13, a communication device 14, an input device 15, and an output device 16.
- the processor 11 is configured to control the operation of each part of the quality control support device 1.
- the processor 11 includes, for example, a CPU (Central Processing Unit), a DSP (Digital Signal Processor), an ASIC (Application Specific Integrated Circuit), a PLD (Programmable Logic Device), an FPGA (Field Programmable Gate Array), and a SoC (System-on-a-chip) and other integrated circuits.
- a CPU Central Processing Unit
- DSP Digital Signal Processor
- ASIC Application Specific Integrated Circuit
- PLD Programmable Logic Device
- FPGA Field Programmable Gate Array
- SoC System-on-a-chip
- the memory 12 is mainly used as a temporary storage area for performing data processing.
- the storage device 13 is mainly configured to store a program, a large amount of data, and the like.
- the memory 12 is composed of, for example, a ROM (Read Only Memory), an EPROM (Erasable Programmable ROM), an EEPROM (Electrically Erasable Programmable ROM), and/or a RAM (Random Access Memory).
- the storage device 13 is composed of, for example, a storage such as an HDD (Hard Disk Drive), an SSD (Solid State Drive) and/or an eMMC (embedded Multi Media Card).
- the communication device 14 is configured to communicate with the blood cell counter 3 and the oversight terminal 5 at each facility via the communication network N shown in FIG. 1 .
- the communication device 14 includes, for example, a network card, a communication module, and the like.
- the communication device 14 also may include an amplifier, an RF (Radio Frequency) device that performs processing related to radio signals, and the like.
- the input device 15 is configured so that information can be input by a user operation in the support center.
- the input device 15 includes, for example, a keyboard, a pointing device, and/or a microphone.
- pointing devices include a mouse, a trackball, a touchpad, and a touch panel.
- the output device 16 is configured to output information.
- the output device 16 includes, for example, a liquid crystal display, an EL (Electroluminescence) display, a display device such as a plasma display, and/or a speaker.
- the output device 16 also may further include the function of the input device 15.
- the output device 16 also may be a device including a touch panel display.
- the oversight terminal 5A includes a processor 11 (control unit), a memory 12, a storage device 13, a communication device 14, an input device 15, and an output device 16 as in the quality control support device 1.
- FIG. 3 is a diagram showing an outline of an outline of a measurement data collection process of the blood cell counter according to the embodiment.
- FIG. 3A is a diagram showing an example of a measurement data collection process of the QC measurement process (quality control measurement process) in the blood cell counter 3.
- FIG. 3B is a diagram showing an example of a measurement data collection process of the measurement process of the patient sample (subject sample) in the blood cell counter 3.
- each of the blood cell counters 3 transmits a predetermined data set including the result of the measurement process relating to the quality control substance to the quality control support device 1.
- the transmitted data set includes the device ID of the blood cell counter 3, the measurement date and time, the lot number of the quality control substance, and the measured value in association with each other.
- the measurement result regarding the quality control substance is transmitted to the quality control support device 1.
- the measurement result regarding the quality control substance may be transmitted, for example, daily.
- the transmission timing of the measurement result regarding the quality control substance may be set for each facility and each blood cell counter.
- each of the blood cell counters 3 transmits a data set including the result of the measurement process for the subject sample to the quality control support device 1.
- the transmitted data set includes the device ID of the blood cell counter 3, the measurement date and time, and the measured value in association with each other.
- the result of the measurement process relating to the subject sample is transmitted to the quality control support device 1 when the measurement of a predetermined number (for example, 20 samples) is completed. Note that the predetermined number may be set for each facility.
- the data sets shown in FIGS. 3A and 3B transmitted from each of the blood cell counters 3 are stored in the storage device 13 of the quality control support device 1.
- the data sets shown in FIGS. 3A and 3B contain information regarding at least one of error occurrence in the blood cell counter 3, calibration of the blood cell counter 3, or reagent exchange of the blood cell counter 3.
- the information regarding the occurrence of an error in the blood cell counter 3 includes, for example, the date and time of the occurrence of the error and the content of the error.
- the information regarding the execution of the calibration of the blood cell counter 3 includes, for example, the date and time of the calibration and the content of the calibration.
- the information regarding the reagent exchange for the blood cell counter 3 may include, for example, the reagent exchange date and time and the reagent identification information before and after the exchange.
- the transmission format of the data set shown in FIGS. 3A and 3B is arbitrary, and may be configured in, for example, a predetermined data packet format.
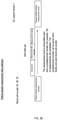
- FIG. 4 is a flowchart showing an example of the display process of the QC chart according to the first embodiment.
- the QC chart display process is executed between the oversight terminal 5 and the quality control support device 1.
- the measurement data measured by the blood cell counter 3 at each facility are transmitted to the quality control support device 1 as a part of a predetermined data set, as described with reference to FIG. 3 .
- the quality control support device 1 stores the received measurement data in the storage device 13 shown in FIG. 2 .
- the processor 11 of the oversight terminal 5 operated by the person in charge of the facility determines whether a designation related to the display period of the QC chart (for example, the LJ chart and the XbarM chart) to be displayed on the quality control support device 1 has been received from the person in charge. If the designation is received (YES in step S1), the process proceeds to step S2, whereas if the designation is not received (NO in step S1), the process proceeds to step S10.
- the LJ chart is a control chart showing the results of measuring the quality control substances in time series
- the XbarM chart is a control chart showing the results of measuring the subject samples in time series.
- One display period is specified as the display period of the LJ chart and the XbarM chart. For example, if the display period of the LJ chart is specified from December 27, 2019 to January 5, 2020, both the LJ chart and the XbarM chart will be displayed for the period from December 27, 2019 to January 5, 2020. That is, the display period of the LJ chart is automatically set to the display period of the XbarM chart.
- the oversight terminal 5 determines whether the person in charge has received the display instruction of the LJ chart and the XbarM chart. If the designation is received (YES in step S2), the process proceeds to step S3, whereas if the designation is not received (NO in step S2), the process waits until the designation is received.
- the oversight terminal 5 transmits the display data creation instruction to the quality control support device 1 based on the received display instruction.
- the processor 11 of the quality control support device 1 determines whether a display data creation instruction has been received from the oversight terminal 5. If the instruction is received (YES in step S4), the process proceeds to step S5, whereas if the instruction is not received (NO in step S4), the process proceeds to step S12.
- the quality control support device 1 reads out the measurement data of the blood cell counter 3 stored in advance from the storage device 13 shown in FIG. 2 .
- the quality control support device 1 reads out the QC measurement result and the subject sample measurement result in the display period corresponding to the period from December 27, 2019 to January 5, 2020.
- the quality control support device 1 identifies a QC measurement result outside the permissible range. As will be described later with reference to FIG. 5 , the quality control support device 1 may specify, for example, measurement data exceeding the upper limit value 1 and measurement data below the lower limit value 1. The quality control support device 1 also may be controlled so as not to reflect the specified measurement data in the chart, for example.
- the quality control support device 1 generates information for displaying the LJ chart and the XbarM chart on the display provided in the oversight terminal 5, and transmits the information to the oversight terminal 5. Note that the quality control support device 1 also may display the LJ chart and the XbarM chart on the output device 16 shown in FIG. 2 included in the quality control support device 1.
- the oversight terminal 5 determines whether the display data for displaying the LJ chart and the XbarM chart have been received from the quality control support device 1. When the display data are received (YES in step S8), the process proceeds to step S9, whereas when the display data are not received (NO in step S8), the process waits until the display data are received.
- the oversight terminal 5 Based on the received display data, the oversight terminal 5 displays the LJ chart and the XbarM chart on the display during the display period specified in step S1 (the period corresponding to December 27, 2019 to January 5, 2020).
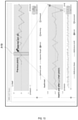
- FIG. 5A is a diagram showing an example of an LJ chart.
- FIG. 5B is a diagram showing an example of an XbarM chart.
- the oversight terminal 5 displays the LJ chart (first control chart) and the XbarM chart on the display from the display period December 27, 2019 to January 5, 2020.
- the LJ chart is a chart in which the measurement results of the quality control substances (QC samples) measured by the blood cell counter 3 are plotted in time series.
- the measurement frequency of the quality control substance is one to several times per day.
- the "target value” (for example, "30") in the LJ chart is a reference value determined for each lot of QC samples.
- Each of the "upper limit value 1" and the “lower limit value 1" in the LJ chart is an upper limit value and a lower limit value determined for each lot of the QC sample.
- each of the “upper limit value 2" and the “lower limit value 2" in the LJ chart is a value set according to the respective values of the “upper limit value 1" and the “lower limit value 1", for example.
- the "upper limit value 2” may be set to a value corresponding to approximately 97% of the "upper limit value 1".
- Each of the "upper limit value 2" and the “lower limit value 2” can be freely set by the user.
- the XbarM chart is a chart created by calculating the average values of the measurement results of a predetermined number of subject samples (for example, 20 samples) received from the blood cell counter 3, and plots the average values in time series.
- the "target value” (for example, "8.07") in the XbarM chart is a value determined by aggregating the measurement results of past subject samples.
- the "target value” is provided by the service provider.
- the “target value” also may be a value set by the user.
- Each of the "upper limit value 1" and the “lower limit value 1" in the XbarM chart is an upper limit value and a lower limit value provided by the service provider.
- Each of the “upper limit value 1" and the “lower limit value 1” also may be a value set by the user.
- the “target value”, “upper limit value 1", and “lower limit value 1” also may be different for each blood cell counter 3.
- Each of the “upper limit value 2" and the “lower limit value 2" in the XbarM chart is a value set according to the respective values of the “upper limit value 1" and the “lower limit value 1", for example.
- Each of the "upper limit value 2" and the “lower limit value 2” also may be a value set by the user. Note that each limit value in the XbarM chart can be omitted.
- the line L1 in FIG. 5A is displayed so as to pass through the QC measurement point MP1 closest to the mouse cursor C1 when the mouse cursor C1 is displayed on the LJ chart.
- the area corresponding to one day (24 hours) including the QC measurement point MP1 may be displayed.
- the specific area A1 is displayed on the XbarM chart shown in FIG. 5B .
- the specific area A1 on the XbarM chart (third control chart) also moves following the left-right direction. That is, the display form of the XbarM chart is changed according to the change of the line L1 on the LJ chart.
- Step S10 in FIG. 4 Step S10 in FIG. 4.
- the oversight terminal 5 determines whether a display instruction has been received from the person in charge for a predetermined period (for example, one day) (second period) on the XbarM chart or the LJ chart via the pointing device. If an instruction is received (YES in step S10), the process proceeds to step S11, whereas if an instruction is not received (NO in step S10), the process proceeds to step S16.
- the oversight terminal 5 transmits a display data preparation instruction corresponding to the received display instruction to the quality control support device 1.
- the quality control support device 1 determines whether a display data preparation instruction corresponding to the display instruction received by the oversight terminal 5 has been received. If the instruction is received (YES in step S12), the process proceeds to step S13, whereas if the instruction is not received (NO in step S12), the process proceeds to step S18.
- the quality control support device 1 creates display data for displaying the XbarM chart (second control chart) in the above day corresponding to the received instruction, and transmits the data to the oversight terminal 5.
- the oversight terminal 5 determines whether the display data for displaying the XbarM chart (second control chart) has been received from the quality control support device 1. When the display data are received (YES in step S14), the process proceeds to step S15, whereas when the display data are not received (NO in step S14), the process waits until display data are received.
- the oversight terminal 5 displays the XbarM chart (second control chart) based on the received display data.
- the oversight terminal 5 determines whether the display end instruction has been received from the person in charge. If the instruction is received (YES in step S16), the process proceeds to step S17, whereas if the instruction is not received (NO in step S16), the process returns to step S1.
- the oversight terminal 5 transmits an instruction to end the display to the quality control support device 1 and ends the process.
- the quality control support device 1 determines whether a display end instruction has been received from the person in charge terminal 5. When the end instruction is received (YES in step S18), the process ends, whereas when the end instruction is not received (NO in step S18), the process returns to step S4.
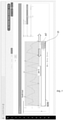
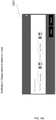
- FIG. 6A is a diagram showing examples of an LJ chart and an XbarM chart.
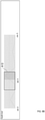
- FIG. 6B is a diagram showing an example of an XbarM chart.
- the FIG. 6A show an example of a LJ chart (first control chart) displayed on the display of the oversight terminal 5 during the display period (first period) from December 27, 2019 to January 5, 2020, and displays an XbarM chart (third control chart) during the display period (third period) from December 27, 2019 to January 5, 2020.
- first control chart displayed on the display of the oversight terminal 5 during the display period (first period) from December 27, 2019 to January 5, 2020
- XbarM chart third control chart
- the specific area A3 (a part of the area of the third control chart) on the XbarM chart corresponding to the above one day (January 3, 2020) is displayed in a form different from the other areas.
- the specific area A3 and the other areas may be displayed in different colors, or only the specific area A3 may be highlighted.
- the XbarM chart (second control chart) of FIG.
- an XbarM chart (second control chart) is displayed for any one day desired by the viewer. Therefore, it becomes possible to confirm the measurement result on the day when the abnormality occurs, and it becomes easier to identify the cause of the abnormality.
- the display period of the LJ chart (first control chart) is received and the LJ chart (first control chart) is displayed for the received display period, such that, for example, the QC samples can be traced back to the past and it becomes easy to grasp the fluctuation of the measurement results of the sample since the LJ chart (first control chart) is displayed for the received display period. Therefore, it becomes easier to identify the cause of an abnormality.
- the time at which an abnormality occurs can be estimated via the LJ chart (first control chart) and it is possible to confirm the fluctuation of the estimated occurrence time in detail from the XbarM chart (second control chart) shown in FIG. 6B . Therefore, it becomes easier to identify the cause of an abnormality.
- the XbarM chart (second control chart) shown in FIG. 6B is displayed by displaying the XbarM chart (third control chart) shown in FIG. 6A on the display and receiving the designation of the of the specific area A3 of the XbarM chart (third control chart) shown in FIG. 6A , with regard to the fluctuation of the measurement result of the subject sample, it becomes possible to confirm both the fluctuation in the medium- to long-term and the fluctuation in the short-term, and it becomes easier to estimate the time when the cause of the abnormality occurs. Therefore, it becomes easier to identify the cause of an abnormality.
- FIG. 7 is a diagram showing an example of an XbarM chart according to an embodiment.
- the XbarM chart (second control chart) shown in FIG. 7 is a screen showing which display period corresponds to the display period from December 27, 2019 to January 5, 2020 of the XbarM chart (third control chart) shown in FIG. 6A . That is, in the display of the XbarM chart shown in FIG. 7 , the indicator screen SD5 is a relationship screen displaying the relationship between the display period (second period: January 3, 2020 in this example) and a display period of the XbarM chart shown in FIG. 6A (third period: December 27, 2019 to January 5, 2020 in the example).
- the change of the display period of the XbarM chart shown in FIG. 7 is received via the display on the oversight terminal 5 on which the indicator screen SD5 is displayed (the position of the specific area A7 is changed by moving the indicator I1 to the left or right), and the display period of the XbarM chart is changed according to the received change .
- FIG. 8A is a diagram showing an example of an LJ chart and an XbarM chart.
- FIG. 8B is a diagram showing an example of an XbarM chart (second control chart) displayed when a predetermined operation is executed in the XbarM chart of FIG. 8A .
- FIG. 8C is a diagram showing an example of an XbarM chart (second control chart) displayed when a predetermined operation is executed in the XbarM chart of FIG. 8B .
- FIG. 8A is a diagram showing an example of an LJ chart and an XbarM chart.
- FIG. 8B is a diagram showing an example of an XbarM chart (second control chart) displayed when a predetermined operation is executed in the XbarM chart of FIG. 8A .
- FIG. 8C is a diagram showing an example of an XbarM chart (second control chart) displayed when a predetermined operation is executed in the XbarM chart of FIG. 8B .
- the LJ chart (first control chart) is displayed on the display of the oversight terminal 5 during the display period (first period) from December 27, 2019 to January 5, 2020, and an example is shown in which the XbarM chart (third control chart) is displayed during the display period (third period) from December 27, 2019 to January 5, 2020.
- the specific area A9 on the XbarM chart corresponding to one day (January 5, 2020) including the line L3 is displayed in a form different from the other areas.
- the specific area A9 is an area defined by the line L5 and the line L7 on the XbarM chart.
- the line L9 and the line L5 are displayed on the XbarM chart and a new defined region A11 is formed.
- the specific area A11 designates a part of the area in the third control chart
- the results of measuring the subject samples with the blood cell counter 3 during the period from January 2, 2020 to January 5, 2020 are shown, and the XbarM chart (second control chart) shown in FIG. 8B is displayed.
- the XbarM chart (second control chart) shown in FIG. 8C is displayed.
- FIGS. 9 and 10 are diagrams showing an examples of the LJ chart and the XbarM chart according to the embodiment.
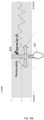
- FIG. 9 is a diagram showing an example of an LJ chart and an XbarM chart when calibration is performed during the display period.
- FIG. 10 is a diagram showing another example of the LJ chart and the XbarM chart when the reagent is exchanged in the blood cell counter 3 during the display period.
- FIG. 11 is a diagram showing an example of an LJ chart and an XbarM chart when an error occurs in the blood cell counter 3 during the display period.
- FIGS. 9 to 11 when a predetermined event occurs within the display period in the display of the LJ chart and the XbarM chart, a mark indicating the occurrence of the predetermined event is displayed.
- a predetermined event includes at least one of error occurrence in the blood counter 3, calibration of the blood counter 3, or reagent exchange of the blood cell counter 3.
- the measurement result is more likely to become abnormal than at other times such that by displaying a mark indicating the occurrence of a predetermined event, it is easy to estimate the time when the abnormality occurs.
- the mark indicating the occurrence of a predetermined event also may be displayed on the XbarM chart (second control chart) for which the display period is shorter than that of the LJ chart, which is shown in FIG. 6B .
- the mark • (black circle) S1 is displayed at the position corresponding to the date and time of the calibration (January 3, 2020).
- the implementation date and time (January 3, 2020) corresponds to the specific area A15 on the LJ chart and corresponds to the specific area A17 on the XbarM chart. Calibration is performed to confirm that the blood cell counter 3 outputs the optimum measurement result.
- the mark ⁇ (black triangle) S3 is displayed at the position corresponding to the date and time (January 3, 2020).
- the implementation date and time (January 3, 2020) corresponds to the specific area A15 on the LJ chart and corresponds to the specific area A17 on the XbarM chart.
- the mark S5 is displayed at a position corresponding to the date and time of occurrence (January 3, 2020).
- an image G showing a history of error occurrence also may be displayed on the display.
- the marks indicating the occurrence of the predetermined event shown in FIGS. 9 , 10 , and 11 are displayed based on the data set described in FIG. 3 .
- the data set contains information on calibration, reagent exchange, and error occurrence in association with their occurrence date, and the indicator indicating the occurrence of a predetermined event is displayed at the position corresponding to the occurrence date and time.
- both the LJ chart and the XbarM chart are displayed, but in the modified example 1 of the QC chart display process, the quality control support device 1 first displays the LJ chart, and thereafter displays the XbarM chart according to the operation of the person in charge.
- FIG. 12 is a diagram showing another example of the display process of the LJ chart and the XbarM chart according to the embodiment.
- the LJ chart (first control chart) is first displayed on the display of the oversight terminal 5 shown in FIG. 1 .
- the XbarM chart (second control chart) having January 3, 2020 as the display period (second period) corresponding to the designated line L11 is displayed on the display on the oversight terminal 5.
- the XbarM chart with the period corresponding to line L11 as the display period (second period) is displayed by designating the line L11 corresponding to the measurement date (January 3, 2020) on the LJ chart, it is possible to confirm the fluctuation of the measurement results of the subject in a short period of time with a small number of steps. Therefore, the cause of the abnormality can be identified more quickly.
- a modified example of the display processing of the line L1 of FIG. 5A , the line L2 of FIG. 6A , and the line L3 of FIG. 8A (hereinafter referred to as a designated area) will be described below.
- a designated area an example of arranging the designated area at the time of measurement or at the time of occurrence of a predetermined event will be described first.
- the designated areas are displayed in the following priority order of (1) to (4).
- FIG. 13 is a diagram showing another example of the display form of the LJ chart according to the embodiment.
- the designated area is not a line shape like the line L1 of FIG. A, the line L2 of FIG. 6A , and the line L3 of FIG. 8A , rather the LJ chart as shown in FIG. 13 may be displayed in the designated area A19 having a predetermined polygonal shape (for example, a quadrangular shape).
- the quality control support device 1 executes the designation of the area on the LJ chart on the area designation screen.
- FIG. 14A is a diagram showing an example of the designated area designation screen DS1.
- FIG. 14B is a diagram showing an example of an LJ chart in which a period corresponding to a period designated on the designated area setting screen DS1 is displayed as a designated area.
- the display period of the designated area on the LJ chart is designated from December 30, 2019 to December 31, 2019.
- the LJ chart including the designated area A21 starting from December 30, 2019 and ending on December 31, 2019 is displayed.
- the quality control support device 1 executes control of the display size of the designated area on the LJ chart or control of the display position.
- FIG. 15A is an example showing size control of a designated area in the LJ chart.
- FIG. 15B is an example showing position control of a designated area in the LJ chart.
- the display size of the designated area on the LJ chart may be controlled.
- the person in charge executes a multi-touch screen operation on the display on the oversight terminal 5 on which the LJ chart is displayed.
- the size of the designated area A23 is controllable by moving two fingers of the person in charge so as to expand (pinch out) or shrink (pinch in) the display size of the area A23.
- the control of the display size of the designated area A23 also may be executed in any direction, and may be in the horizontal direction or the vertical direction.
- the display position of the designated area on the LJ chart also may be controlled.
- the person in charge may operate the cursor C9 to specify the designated area A23 and then move the designated area A23 in the left-right direction.
- the designated area A23 may be moved in the left-right direction by a touch operation of a person in charge.
- the display period of the LJ chart can be specified separately from the display period of the XbarM chart, whereas the form described with reference to FIGS. 4 and 5 describes the display period of the LJ chart as automatically set to the display period of the XbarM chart.
- FIG. 16 is a diagram showing an example of a display period designation screen, an LJ chart, and an XbarM chart according to an embodiment.
- the display period of the XbarM chart is designated from December 27, 2019 to January 5, 2020.
- the display period designation screen DS5 of the LJ chart the display period of the LJ chart is separately designated from December 27, 2019 to January 5, 2020.
- the LJ chart and the XbarM chart are displayed in the respective display periods specified via the display period designation screen DS3 and the display period designation screen DS5.
- Modification 2 is different from modification 1 in that the display period of the XbarM chart is set shorter than the display period of the LJ chart.
- FIG. 17 is a diagram showing an example of a display period designation screen, an LJ chart, and an XbarM chart according to an embodiment when the display period of the XbarM chart is set shorter than the display period of the LJ chart.
- the display period (January 3, 2020) which is shorter than the period specified on the display period designation screen DS7 of the LJ chart (December 27, 2019 to January 5, 2020)
- the display period specification screen DS9 of the XbarM chart is specified on the display period specification screen DS9 of the XbarM chart.
- the LJ chart displayed in the display period corresponding to the period from December 27, 2019 to January 5, 2020, and the XbarM chart displaying the display period corresponding to the separately specified period (January 3, 2020) are displayed side by side.
- the display period of the XbarM chart can be specified on the display period specification screen DS9, so that a short period of time can be achieved with a small number of steps, thus allowing confirmation of the fluctuation of the measurement result of the subject during the period. Therefore, the cause of the abnormality can be identified more quickly.
- the display period of the XbarM chart display period may overlap at least partly with the display period of the LJ chart; for example, the display period of the LJ chart may be specified from December 27, 2019 to 2020 to January 5, 2019, and December 26, 2019 to December 28, 2019 may be specified as the display period of the XbarM chart.
- the upper XbarM chart in FIG. 18 is an XbarM chart displayed during the display period from December 27, 2019 to January 5, 2020.
- the specific area A25 corresponding to January 3, 2020 on this XbarM chart is designated by, for example, the cursor C11.
- the display is switched to the XbarM chart on the lower side of FIG. 18 .
- the lower XbarM chart in FIG. 18 is an XbarM chart having a display period of January 3, 2020 corresponding to the specific area A25.
- the XbarM with a predetermined display period of the display period of the LJ chart (for example, the last day of the display period of the LJ chart) is displayed automatically.
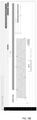
- FIG. 19A is a diagram showing an example of an LJ chart displayed in a designated display period.
- FIG. 19B is a diagram showing an example of an XbarM chart displayed in the display period corresponding to the last day of the display period of the LJ chart in the LJ chart of FIG. 19A .
- the last day on the LJ chart displayed during the display period from December 27, 2019 to January 5, 2020 is January 5, 2020.
- the XbarM chart having the display period of January 5, 2020 corresponding to the last day on the LJ chart is automatically displayed.
- the quality control support system 100 displays the first control chart (MJ chart) on the display in the first period, and the second control chart (XbarM chart) in the second period which is shorter than the first period on the display. Therefore, in the above quality control support method, the first control chart and the second control chart are displayed in the display period according to the difference between the measurement frequency of the quality control substance and the measurement frequency of the subject sample. Accordingly, the cause can be easily identified when there is an abnormality in the measurement result.
- the second embodiment differs from the first embodiment in that the target value and the limit value of the LJ chart are determined by external quality control, and the target value and the limit value determined for each lot of the QC sample are used.
- the points different from the first embodiment will be particularly described with respect to the second embodiment.
- FIG. 20 is a diagram showing an example of an LJ chart according to the second embodiment.
- the "target value” for example, "30" in the LJ chart is a reference value determined by aggregating the QC measurement results of each facility.
- "Upper limit value 3" for example, "40”
- "lower limit value 3” for example, "20”
- the "upper limit value 4" for example, "37”
- the “lower limit value 4" for example, "23” are values set according to the respective values of the "upper limit value 3" and the "lower limit value 3".
- Each upper limit value and each lower limit value can be set by the user.
- FIG. 21 is a flowchart showing an example of the display process of the QC chart according to the second embodiment.
- the process steps S21 to S39 of FIG. 21 correspond to the process steps S1 to S18 shown in FIG. 4 .
- the quality control support device 1 aggregates the QC measurement results of each facility during the display period, and determines the target value and each limit value shown in FIG. 20 .
- the quality control support system 100 can be managed by the same management entity that manages each facility within a management group having a plurality of facilities such that external quality control becomes possible.
- the third embodiment is different from the first embodiment in that the functions of the quality control support device 1 and the oversight terminal 5 in the first embodiment 1 are integrated in the quality control support device 1. In the following, the differences between the third embodiment and the first embodiment will be particularly described.
- the quality control support device 1 is connected to the blood cell counter 3A via the network NA.
- the hardware configuration of the quality control support device 1 is the same as the configuration shown in FIG. 2 .
- FIG. 23 is a flowchart showing an example of the display process of the QC chart according to the third embodiment.
- the quality control support device 1 determines whether the person in charge has received the designation regarding the display period of the QC chart (for example, the LJ chart and the XbarM chart) to be displayed on the quality control support device 1. If the designation is received (YES in step S41), the process proceeds to step S42, whereas if the designation is not received (NO in step S41), the process proceeds to step S47.
- the designation regarding the display period of the QC chart for example, the LJ chart and the XbarM chart
- the quality control support device 1 determines whether a display instruction for the LJ chart and the XbarM chart has been received from the person in charge. If the designation is received (YES in step S42), the process proceeds to step S43, whereas if the designation is not received (NO in step S42), the process waits until the designation is received.
- the quality control support device 1 reads out the measurement data of the blood cell counter 3 stored in advance from the storage device 13 shown in FIG. 2 .
- the quality control support device 1 identifies a QC measurement result outside the permissible range.
- the quality control support device 1 generates display data for displaying the LJ chart and the XbarM chart on the display included in the quality control support device 1.
- the quality control support device 1 Based on the generated display data, the quality control support device 1 displays the LJ chart and the XbarM chart on the display for the display period (the period corresponding from December 27, 2019 to January 5, 2020) specified in step S41.
- the quality control support device 1 determines whether a display instruction for a predetermined period (for example, one day) (second period) on the XbarM chart or the LJ chart has been received from the person in charge via the pointing device. If the instruction is received (YES in step S47), the process proceeds to step S48, whereas if the instruction is not received (NO in step S47), the process proceeds to step S50.
- a display instruction for a predetermined period for example, one day
- second period on the XbarM chart or the LJ chart
- the quality control support device 1 generates display data for displaying the XbarM chart (second control chart) in the above day corresponding to the received instruction.
- the quality control support device 1 displays an XbarM chart (second control chart) based on the generated display data.
- the quality control support device 1 determines whether a display end instruction has been received from the person in charge. When the instruction is received (YES in step S50), the process ends, whereas when the instruction is not received (NO in step S50), the process returns to step S41. According to the third embodiment described above, it is not necessary to prepare the oversight terminal separately from the quality control support device 1.
- the blood cell counter 3 has been described as an example of the analyzer, but the present invention is not limited to a blood cell counter.
- the analyzer for example, another analyzer such as a blood coagulation measuring device, a biochemical analyzer, an immunoanalyzing device, a urine analyzer, or a nucleic acid analyzer may be adopted.
- FIG. 24 is a diagram showing another example of the configuration of the quality control support system according to the embodiment.
- the quality control support device 1 is arranged in a support center different from the facility where the oversight terminal is arranged in FIG. 1
- the quality control support device 1 also may be installed within the facility in which the oversight terminal 5 is installed as shown in FIG. 24 .
Landscapes
- Engineering & Computer Science (AREA)
- Health & Medical Sciences (AREA)
- Quality & Reliability (AREA)
- General Health & Medical Sciences (AREA)
- General Physics & Mathematics (AREA)
- Physics & Mathematics (AREA)
- Life Sciences & Earth Sciences (AREA)
- Chemical & Material Sciences (AREA)
- Pathology (AREA)
- Immunology (AREA)
- Biochemistry (AREA)
- Analytical Chemistry (AREA)
- General Business, Economics & Management (AREA)
- Biomedical Technology (AREA)
- Business, Economics & Management (AREA)
- General Engineering & Computer Science (AREA)
- Epidemiology (AREA)
- Public Health (AREA)
- Primary Health Care (AREA)
- Medical Informatics (AREA)
- Theoretical Computer Science (AREA)
- Human Computer Interaction (AREA)
- Automatic Analysis And Handling Materials Therefor (AREA)
- Investigating Or Analysing Biological Materials (AREA)
- Measuring And Recording Apparatus For Diagnosis (AREA)
- Measurement Of The Respiration, Hearing Ability, Form, And Blood Characteristics Of Living Organisms (AREA)
Abstract
Description
- This application claims priority from prior
Japanese Patent Application No. 2020-130438, filed on July 31, 2020 - The present invention relates to a quality control support method, a quality control support system, a quality control support device, and a program.
- A method using a control chart by the LJ (Levey-Jennings) method, measurement results of quality control substances prepared to obtain predetermined measured values in chronological order, and a method using a control chart showing the average value transition of the measurement results of a subject sample without using a quality control substance are known as quality control methods. When there is an abnormality in the measurement result, it is possible to identify whether the cause is the analyzer, the reagent used in the analyzer, or the quality control substance by checking these control charts. Also described is an example displaying a control chart (control chart showing the result of PBRTQC (Patient-Based Real Time Quality Control)) showing the average value transition of the measurement result of the subject sample as a method of supporting quality control.
- The number of measurements of quality control substances (plot of control chart by LJ method) is generally 1 to 3 times a day, whereas the number of measurements of subject samples may be tens to hundreds of times. Since the control chart by the LJ method and the control chart showing the result of PBRTQC are displayed in the same period in the method described in Lo TP, Cervinski MA, et al., "Recommendations for laboratory informatics specifications needed for the application of patient-based real time quality control", Clinica Chimica Acta, 2019 Aug, 495, pages 625-629, if the display period is shortened, for example, it is difficult to grasp the transition the measurement result of the quality control substances over a long period of time, such as 2 weeks, and if the display time is lengthened for example, it is difficult to grasp the transition of the measurement result of the subject sample in a short period such as one day. Therefore, even if the method described in Lo TP, Cervinski MA, et al., "Recommendations for laboratory informatics specifications needed for the application of patient-based real time quality control", Clinica Chimica Acta, 2019 Aug, 495, pages 625-629 is used, it is difficult to identify the cause when there is an abnormality in the measurement result.
- The present invention provides a quality control support method, a quality control support system, a quality control support device, and a program that facilitates identification of the cause when an abnormality is found in a measurement result.
- The quality control support method according to an aspect of the present invention is a quality control support method for displaying a control chart of quality control related to an analyzer that measures a subject sample, the method comprising: generating a first control chart showing results of measured quality control substances by the analyzer in a first period; receiving a designation of a second period different from the first period, the second period being shorter than the first period and at least partially overlapping with the first period; generating a second control chart showing results of the measured subject samples by the analyzer in the second period; displaying the generated first control chart; and displaying the generated second control chart.
- According to the above aspect, the above-mentioned quality control support method displays the first control chart in the first period, receives the designation of the second period, which is different from the first period, shorter than the first period, and at least partially overlaps with the first period, and displays the second control chart in the second period. Therefore, in the above quality control support method, the first control chart and the second control chart are displayed in the display period according to the difference between the measurement frequency of the quality control substance and the measurement frequency of the subject sample. Accordingly, the cause can be easily identified when there is an abnormality in the measurement result. Receiving the designation of the second period separately from the designation of the first period is to receive the designation of the designation of the second period separetly from the first period preset as the default period, or an arbitrarily designated first period. When an arbitrary first period is designated, the timing of receiving the designation may be different from each other or simultaneous with each other in the first period and the second period.
- The quality control support method according to one aspect of the present invention is a quality control support method for displaying a control chart of quality control related to an analyzer that measures a subject sample, the method comprising: generating a first control chart showing results of measured quality control substances by the analyzer in a first period; generating a second control chart showing results of measured subject samples by the analyzer in a second period, which is a part of the first period; and displaying the first control chart and the second control chart side by side.
- According to the above aspect, the quality control support method displays the first control chart in the first period, and displays the second control chart in the second period, which is a part of the first period, and displays the first control chart and the second control chart side by side. Therefore, in the above quality control support method, the first control chart and the second control chart are displayed side by side in the display period according to the difference between the measurement frequency of the quality control substance and the measurement frequency of the subject sample. Accordingly, since the first control chart and the second control chart are displayed side by side, the cause can be more easily identified when there is an abnormality in the measurement result.
- The quality control support system according to one aspect of the present invention is a quality control support system for displaying a control chart of quality control related to an analyzer that measures a subject sample, the system comprising: a quality control support device comprising a first control unit; a terminal device, which is connected to the quality control support device via a network, comprising a second control unit and a display; wherein the first control unit of the quality control support device is configured to execute operations comprising: generating a first control chart showing results of measured quality control substances by the analyzer in a first period; receiving a designation of a second period different from the first period, the second period being shorter than the first period and at least partially overlapping with the first period; generating a second control chart showing results of measured subject samples by the analyzer in the second period; and the second control unit of the terminal device is configured to execute: displaying the generated first control chart on the display; and displaying the generated second control chart on the display.
- According to the above aspect, the quality control support system displays the first control chart in the first period, receives the designation of the second period, which is shorter than the first period and at least partially overlaps with the first period, separately from the designation of the first period, and displays the second control chart in the second period. Therefore, in the above quality control support method, the first control chart and the second control chart are displayed in the display period according to the difference between the measurement frequency of the quality control substance and the measurement frequency of the subject sample. Accordingly, the cause can be easily identified when there is an abnormality in the measurement result.
- The quality control support device according to one aspect of the present invention is a quality control support device for displaying a control chart of quality control related to an analyzer that measures a subject sample, the device comprising: a control unit; and a display; wherein the control unit is configured to execute operations comprising: generating a first control chart showing results of measured quality control substances by the analyzer in a first period; receiving a designation of a second period different from the first period, the second period being shorter than the first period and at least partially overlapping with the first period; generating a second control chart showing results of the measured subject samples by the analyzer in the second period; displaying the generated first control chart on the display; and displaying the generated second control chart on the display.
- According to the above aspect, the quality control support device displays the first control chart in the first period, receives the designation of the second period, which is shorter than the first period and at least partially overlaps with the first period, separately from the designation of the first period, and displays the second control chart in the second period. Therefore, in the above quality control support device, the first control chart and the second control chart are displayed in the display period according to the difference between the measurement frequency of the quality control substance and the measurement frequency of the subject sample. Accordingly, the cause can be easily identified when there is an abnormality in the measurement result.
- The quality control support device according to one aspect of the present invention is a quality control support device that is connected to a terminal device comprising a display via a network and displays a control chart of quality control related to an analyzer that measures a subject sample on a display of the terminal device, the quality control support devise comprising: a control unit, wherein the control unit is configured to execute operations comprising: generating a first control chart showing results of measured quality control substances by the analyzer in a first period; receiving a designation of a second period different from the first period, the second period being shorter than the first period and at least partially overlapping with the first period; generating a second control chart showing results of the measured subject samples by the analyzer in the second period; sending the generated first control chart to the terminal device; and sending the generated second control chart to the terminal device.
- According to the above aspect, the quality control support device generates the first control chart in the first period, receives the designation of the second period, which is shorter than the first period and at least partially overlaps with the first period, separately from the designation of the first period, and generates a second control chart in the second period. The quality control support device transmits the generated first control chart to the terminal device, and transmits the generated second control chart to the terminal device. Therefore, in the terminal device connected to the quality control support device via the network and equipped with a display, the first control chart and the second control chart are displayed in a display period according to the difference between the measurement frequency of the quality control substance and the measurement frequency of the subject sample. Accordingly, the cause can be easily identified when there is an abnormality in the measurement result.
- The program according to one aspect of the invention is a program in a quality control support device that displays a control chart of quality control related to an analyzer that measures a subject sample on a display of a terminal device, the quality control support device and the terminal device being connected via the network, the program executing operations comprising: generating a first control chart showing results of measured quality control substances by the analyzer in a first period; receiving a designation of a second period different from the first period, the second period being shorter than the first period and at least partially overlapping with the first period; generating a second control chart showing results of the measured subject samples by the analyzer in the second period; sending the generated first control chart to the terminal device; and sending the generated second control chart to the terminal device.
- According to the above aspect, the program, in the quality control support device, executes operations for generating the first control chart in the first period, receiving the designation of the second period, which is shorter than the first period and at least partially overlaps with the first period, separately from the designation of the first period, and generating a second control chart in the second period. In the quality control support device, the program executes operations for sending the generated first control chart to the terminal device, and sending the generated second control chart to the terminal device. Therefore, in the terminal device connected to the quality control support device via the network and equipped with a display, the first control chart and the second control chart are displayed in a display period according to the difference between the measurement frequency of the quality control substance and the measurement frequency of the subject sample. Accordingly, the cause can be easily identified when there is an abnormality in the measurement result.
- The program of one aspect of the invention is a program in a quality control support device comprising a display that displays a control chart of quality control related to an analyzer that measures a subject sample, the program executing operations comprising: generating a first control chart showing results of measured quality control substances by the analyzer in a first period; receiving a designation of a second period different from the first period, the second period being shorter than the first period and at least partially overlapping with the first period; generating a second control chart showing results of the measured subject samples by the analyzer in the second period; displaying the generated first control chart on the display; and displaying the generated second control chart on the display.
- According to the above aspect, the program, in the quality control support device, executes operations for generating the first control chart in the first period, receiving the designation of a second period, which is different from the first period, shorter than the first period and at least partially overlaps with the first period, generating a second control chart in the second period, displaying the generated first control chart on the display, and displaying the generated second control chart on the display. Therefore, in the above quality control support device, the program displays the first control chart and the second control chart in the display period according to the difference between the measurement frequency of the quality control substance and the measurement frequency of the subject sample. Accordingly, the cause can be easily identified when there is an abnormality in the measurement result.
- According to the present invention, it is possible to provide a quality control support technique that facilitates identification of the cause when an abnormality is found in the measurement result.
-
-
FIG. 1 is a diagram showing an example of a structure of a quality control support system according to a first embodiment; -
FIG. 2 is a diagram showing an example of a structure of a quality control support device and an oversight terminal according to the first embodiment; -
FIG. 3A is a diagram showing an example of a measurement data collection process of a QC (Quality Control) measurement process in a blood cell counter; -
FIG. 3B is a diagram showing an example of a measurement data collection process of a subject sample measurement process in a blood cell counter; -
FIG. 4 is a flowchart showing an example of a QC (Quality Control) chart display process according to the first embodiment; -
FIG. 5A is a diagram showing an example of an LJ chart; -
FIG. 5B is a diagram showing an example of an XbarM chart; -
FIG. 6A is a diagram showing an example of an LJ chart and XbarM chart; -
FIG. 6B is a diagram showing an example of an XbarM chart; -
FIG. 7 is a diagram showing an example of an XbarM chart according to the first embodiment; -
FIG. 8A is a diagram showing an example of an LJ chart and an XbarM chart; -
FIG. 8B is a diagram showing an example of an XbarM chart displayed when a predetermined operation is executed in the XbarM chart ofFIG. 8A ; -
FIG. 8C is a diagram showing an example of an XbarM chart displayed when a predetermined operation is executed in the XbarM chart ofFIG. 8B ; -
FIG. 9 is a diagram showing an example of an LJ chart and an XbarM chart; -
FIG. 10 is a diagram showing another example of the LJ chart and the XbarM chart; -
FIG. 11 is a diagram showing an example of an LJ chart and an XbarM chart according to the first embodiment; -
FIG. 12 is a diagram showing another example of a display process of the LJ chart and the XbarM chart according to the first embodiment; -
FIG. 13 is a diagram showing another example of the display form of the LJ chart and the XbarM chart according to the first embodiment; -
FIG. 14A is a diagram showing an example of a display period designation screen of the XbarM chart; -
FIG. 14B is a diagram showing an example of an LJ chart showing a period corresponding to a period specified on the display period designation screen of the XbarM chart shown inFIG. 14A ; -
FIG. 15A is an example showing an example of size control of a specific region in an LJ chart; -
FIG. 15B is an example showing an example of position control of a specific region in the LJ chart; -
FIG. 16 is a diagram showing another example of the QC chart according to the first embodiment; -
FIG. 17 is a diagram showing an example of an LJ chart and an XbarM chart according to the first embodiment, when the display period of the XbarM chart is set shorter than the display period of the LJ chart; -
FIG. 18 is a diagram showing an example of an XbarM chart according to the first embodiment; -
FIG. 19A is a diagram showing an example of an LJ chart displayed in a designated display period; -
FIG. 19B is a diagram showing an example of an XbarM chart displayed in a display period corresponding to a specific period in the LJ chart ofFIG. 19A ; -
FIG. 20 is a diagram showing an example of an LJ chart according to a second embodiment; -
FIG. 21 is a flowchart showing an example of QC chart display processing according to the second embodiment; -
FIG. 22 is a diagram showing an example of a structure of a quality control support system according to a third embodiment; -
FIG. 23 is a flowchart showing an example of a QC chart display process according to a third embodiment; and -
FIG. 24 is a diagram showing another example of the structure of the quality control support system according to the embodiment. - Hereinafter, preferred embodiments of the present invention will be described with reference to the drawings. Note that the same elements are designated by the same reference numerals, and duplicate description will be omitted. The positional relationship such as up, down, left, and right shall be based on the positional relationship shown in the drawings unless otherwise specified. The dimensional ratios in the drawings are not limited to the ratios shown. The following embodiments are examples for explaining the present invention, and the present invention is not limited to these embodiments.
-
FIG. 1 is a diagram showing an example of the structure of the quality control support system according to the first embodiment. As shown inFIG. 1 , the qualitycontrol support system 100 illustratively includes a qualitycontrol support device 1, ablood cell counter 3A and anoversight terminal 5A arranged in facility A, and ablood cell counter 3B and anoversight terminal 5B arranged in facility B. The qualitycontrol support device 1 is a device that displays various charts (control charts) of quality control related to theblood cell counter 3 that measures a subject sample, and/or generates display information for display on another computer. - The
blood cell counter 3 is a device for measuring a subject sample. Theblood cell counter 3 performs measurement (QC measurement) on the quality control substance, for example, once or twice a day. Theblood cell counter 3 performs measurements on subject samples, for example, tens to hundreds of times a day. Theoversight terminal 5 is, for example, a device operated by a person working at the facility, and executes various processes related to the management of the entire facility. Theoversight terminal 5 receives from the person in charge an instruction to display various charts of quality control related to theblood cell counter 3 or an input regarding a display period. Theoversight terminal 5 inputs the input. - Upon receipt, the corresponding control signal is transmitted to the quality
control support device 1. When theoversight terminal 5 receives the information for displaying the various charts generated by the qualitycontrol support device 1, theoversight terminal 5 displays various charts on the display provided in theoversight terminal 5 based on the received information. - By providing the quality
control support system 100 with the qualitycontrol support device 1 and theoversight terminal 5A, the processing can be distributed to the qualitycontrol support device 1 and theoversight terminal 5A. Therefore, it is possible to prevent theoversight terminal 5A from slowing down processing other than displaying various charts, such as viewing inspection results and creating inspection reports. - Each of the facilities A and B includes, for example, a clinical laboratory, a clinical laboratory center, or the like. When facilities A and B are not distinguished, they are referred to as "facility" below. The number of facilities may be two or less, or three or more. In the first embodiment, each facility is managed by a different management entity. As described in the second embodiment described later, two or more facilities among the plurality of facilities may be managed by the same management entity. When the
blood cell counter 3A and theblood cell counter 3B are not distinguished, they are referred to as "blood cell counter 3" (analyzer). Further, when theoversight terminal 5A and theoversight terminal 5B are not distinguished, it is referred to as "oversight terminal 5". Note that the number ofblood cell counter 3 and theoversight terminal 5 arranged in each facility may be two or more. - Each facility and the support center (accuracy control support device 1) are communicably connected via the communication network N. At the facility A, the
blood cell counter 3A and theoversight terminal 5A are connected to each other so as to be able to communicate with each other via the communication network NA. At the facility B, theblood cell counter 3B and theoversight terminal 5B are communicably connected to each other via the communication network NB. Each communication network comprises a wired and/or wireless network. -
FIG. 2 is a diagram showing an example of the hardware structure of the qualitycontrol support device 1 and theoversight terminal 5 according to the first embodiment. As shown inFIG. 2 , the qualitycontrol support device 1 includes, for example, a processor 11 (control unit), amemory 12, astorage device 13, acommunication device 14, aninput device 15, and anoutput device 16. - The
processor 11 is configured to control the operation of each part of the qualitycontrol support device 1. Theprocessor 11 includes, for example, a CPU (Central Processing Unit), a DSP (Digital Signal Processor), an ASIC (Application Specific Integrated Circuit), a PLD (Programmable Logic Device), an FPGA (Field Programmable Gate Array), and a SoC (System-on-a-chip) and other integrated circuits. Each function such as the display processing function in theprocessor 11 is executed by executing the program stored in thememory 12 or thestorage device 13. - The
memory 12 is mainly used as a temporary storage area for performing data processing. Thestorage device 13 is mainly configured to store a program, a large amount of data, and the like. Thememory 12 is composed of, for example, a ROM (Read Only Memory), an EPROM (Erasable Programmable ROM), an EEPROM (Electrically Erasable Programmable ROM), and/or a RAM (Random Access Memory). Thestorage device 13 is composed of, for example, a storage such as an HDD (Hard Disk Drive), an SSD (Solid State Drive) and/or an eMMC (embedded Multi Media Card). - The
communication device 14 is configured to communicate with theblood cell counter 3 and theoversight terminal 5 at each facility via the communication network N shown inFIG. 1 . Thecommunication device 14 includes, for example, a network card, a communication module, and the like. Thecommunication device 14 also may include an amplifier, an RF (Radio Frequency) device that performs processing related to radio signals, and the like. - The
input device 15 is configured so that information can be input by a user operation in the support center. Theinput device 15 includes, for example, a keyboard, a pointing device, and/or a microphone. Examples of pointing devices include a mouse, a trackball, a touchpad, and a touch panel. - The
output device 16 is configured to output information. Theoutput device 16 includes, for example, a liquid crystal display, an EL (Electroluminescence) display, a display device such as a plasma display, and/or a speaker. Theoutput device 16 also may further include the function of theinput device 15. For example, theoutput device 16 also may be a device including a touch panel display.
Theoversight terminal 5A includes a processor 11 (control unit), amemory 12, astorage device 13, acommunication device 14, aninput device 15, and anoutput device 16 as in the qualitycontrol support device 1. -
FIG. 3 is a diagram showing an outline of an outline of a measurement data collection process of the blood cell counter according to the embodiment.FIG. 3A is a diagram showing an example of a measurement data collection process of the QC measurement process (quality control measurement process) in theblood cell counter 3.FIG. 3B is a diagram showing an example of a measurement data collection process of the measurement process of the patient sample (subject sample) in theblood cell counter 3. - As shown in
FIG. 3A , each of the blood cell counters 3 transmits a predetermined data set including the result of the measurement process relating to the quality control substance to the qualitycontrol support device 1. The transmitted data set includes the device ID of theblood cell counter 3, the measurement date and time, the lot number of the quality control substance, and the measured value in association with each other. When the measurement is completed, the measurement result regarding the quality control substance is transmitted to the qualitycontrol support device 1. The measurement result regarding the quality control substance may be transmitted, for example, daily. The transmission timing of the measurement result regarding the quality control substance may be set for each facility and each blood cell counter. - As shown in
FIG. 3B , each of the blood cell counters 3 transmits a data set including the result of the measurement process for the subject sample to the qualitycontrol support device 1. The transmitted data set includes the device ID of theblood cell counter 3, the measurement date and time, and the measured value in association with each other. The result of the measurement process relating to the subject sample is transmitted to the qualitycontrol support device 1 when the measurement of a predetermined number (for example, 20 samples) is completed. Note that the predetermined number may be set for each facility. The data sets shown inFIGS. 3A and3B transmitted from each of the blood cell counters 3 are stored in thestorage device 13 of the qualitycontrol support device 1. - The data sets shown in
FIGS. 3A and3B contain information regarding at least one of error occurrence in theblood cell counter 3, calibration of theblood cell counter 3, or reagent exchange of theblood cell counter 3. The information regarding the occurrence of an error in theblood cell counter 3 includes, for example, the date and time of the occurrence of the error and the content of the error. The information regarding the execution of the calibration of theblood cell counter 3 includes, for example, the date and time of the calibration and the content of the calibration. The information regarding the reagent exchange for theblood cell counter 3 may include, for example, the reagent exchange date and time and the reagent identification information before and after the exchange. Note that the transmission format of the data set shown inFIGS. 3A and3B is arbitrary, and may be configured in, for example, a predetermined data packet format. -
FIG. 4 is a flowchart showing an example of the display process of the QC chart according to the first embodiment. As shown inFIG. 4 , the QC chart display process is executed between theoversight terminal 5 and the qualitycontrol support device 1. Note that, as a premise, the measurement data measured by theblood cell counter 3 at each facility are transmitted to the qualitycontrol support device 1 as a part of a predetermined data set, as described with reference toFIG. 3 . The qualitycontrol support device 1 stores the received measurement data in thestorage device 13 shown inFIG. 2 . - The
processor 11 of theoversight terminal 5 operated by the person in charge of the facility (hereinafter, simply referred to as the oversight terminal 5) determines whether a designation related to the display period of the QC chart (for example, the LJ chart and the XbarM chart) to be displayed on the qualitycontrol support device 1 has been received from the person in charge. If the designation is received (YES in step S1), the process proceeds to step S2, whereas if the designation is not received (NO in step S1), the process proceeds to step S10. Here, the LJ chart is a control chart showing the results of measuring the quality control substances in time series, and the XbarM chart is a control chart showing the results of measuring the subject samples in time series. - One display period is specified as the display period of the LJ chart and the XbarM chart. For example, if the display period of the LJ chart is specified from December 27, 2019 to January 5, 2020, both the LJ chart and the XbarM chart will be displayed for the period from December 27, 2019 to January 5, 2020. That is, the display period of the LJ chart is automatically set to the display period of the XbarM chart.
- The
oversight terminal 5 determines whether the person in charge has received the display instruction of the LJ chart and the XbarM chart. If the designation is received (YES in step S2), the process proceeds to step S3, whereas if the designation is not received (NO in step S2), the process waits until the designation is received. - The
oversight terminal 5 transmits the display data creation instruction to the qualitycontrol support device 1 based on the received display instruction. - The
processor 11 of the quality control support device 1 (hereinafter, simply referred to as the quality control support device 1) determines whether a display data creation instruction has been received from theoversight terminal 5. If the instruction is received (YES in step S4), the process proceeds to step S5, whereas if the instruction is not received (NO in step S4), the process proceeds to step S12. - The quality
control support device 1 reads out the measurement data of theblood cell counter 3 stored in advance from thestorage device 13 shown inFIG. 2 . For example, the qualitycontrol support device 1 reads out the QC measurement result and the subject sample measurement result in the display period corresponding to the period from December 27, 2019 to January 5, 2020. - The quality
control support device 1 identifies a QC measurement result outside the permissible range. As will be described later with reference toFIG. 5 , the qualitycontrol support device 1 may specify, for example, measurement data exceeding theupper limit value 1 and measurement data below thelower limit value 1. The qualitycontrol support device 1 also may be controlled so as not to reflect the specified measurement data in the chart, for example. - The quality
control support device 1 generates information for displaying the LJ chart and the XbarM chart on the display provided in theoversight terminal 5, and transmits the information to theoversight terminal 5. Note that the qualitycontrol support device 1 also may display the LJ chart and the XbarM chart on theoutput device 16 shown inFIG. 2 included in the qualitycontrol support device 1. - The
oversight terminal 5 determines whether the display data for displaying the LJ chart and the XbarM chart have been received from the qualitycontrol support device 1. When the display data are received (YES in step S8), the process proceeds to step S9, whereas when the display data are not received (NO in step S8), the process waits until the display data are received. - Based on the received display data, the
oversight terminal 5 displays the LJ chart and the XbarM chart on the display during the display period specified in step S1 (the period corresponding to December 27, 2019 to January 5, 2020). -
FIG. 5A is a diagram showing an example of an LJ chart.FIG. 5B is a diagram showing an example of an XbarM chart. As shown inFIGS. 5A and5B , theoversight terminal 5 displays the LJ chart (first control chart) and the XbarM chart on the display from the display period December 27, 2019 to January 5, 2020. - As shown in
FIG. 5A , the LJ chart is a chart in which the measurement results of the quality control substances (QC samples) measured by theblood cell counter 3 are plotted in time series. As shown inFIG. 5A , the measurement frequency of the quality control substance is one to several times per day. The "target value" (for example, "30") in the LJ chart is a reference value determined for each lot of QC samples. Each of the "upper limit value 1" and the "lower limit value 1" in the LJ chart is an upper limit value and a lower limit value determined for each lot of the QC sample. When a measurement result outside the range ("27" to "33") specified by "upper limit value 1" and "lower limit value 1" in the LJ chart is reflected in the LJ chart, identification information corresponding to "(!) Error" is added to the measurement result. Each of the "upper limit value 2" and the "lower limit value 2" in the LJ chart is a value set according to the respective values of the "upper limit value 1" and the "lower limit value 1", for example. For example, the "upper limit value 2" may be set to a value corresponding to approximately 97% of the "upper limit value 1". Each of the "upper limit value 2" and the "lower limit value 2" can be freely set by the user. If the measurement result within the range ("32" to "33") specified by "upper limit value 1" and "upper limit value 2" is reflected in the LJ chart, identification information corresponding to "(x) Warning" is added to the measurement result. If the measurement result within the range ("27" to "28") defined by "lower limit value 1" and "lower limit value 2" is reflected in the LJ chart, identification information corresponding to "(x) Warning" is added to the measurement result. - As shown in
FIG. 5B , the XbarM chart is a chart created by calculating the average values of the measurement results of a predetermined number of subject samples (for example, 20 samples) received from theblood cell counter 3, and plots the average values in time series. The "target value" (for example, "8.07") in the XbarM chart is a value determined by aggregating the measurement results of past subject samples. The "target value" is provided by the service provider. The "target value" also may be a value set by the user. Each of the "upper limit value 1" and the "lower limit value 1" in the XbarM chart is an upper limit value and a lower limit value provided by the service provider. Each of the "upper limit value 1" and the "lower limit value 1" also may be a value set by the user. The "target value", "upper limit value 1", and "lower limit value 1" also may be different for eachblood cell counter 3. Each of the "upper limit value 2" and the "lower limit value 2" in the XbarM chart is a value set according to the respective values of the "upper limit value 1" and the "lower limit value 1", for example. Each of the "upper limit value 2" and the "lower limit value 2" also may be a value set by the user. Note that each limit value in the XbarM chart can be omitted. - The line L1 in
FIG. 5A is displayed so as to pass through the QC measurement point MP1 closest to the mouse cursor C1 when the mouse cursor C1 is displayed on the LJ chart. Note that instead of displaying the line L1, for example, the area corresponding to one day (24 hours) including the QC measurement point MP1 may be displayed. When the user aligns the mouse cursor C1 (when the display displaying the LJ chart is a touch panel, a touch pen, the user's finger or the like) on the line L1 and moves the line L1 in the left-right direction, the display position of the line L1 Is changed. Regarding one day including the line L1 (a part of the area of the first control chart) on the LJ chart shown inFIG. 5A (in the example ofFIG. 5A , January 3, 2020), the specific area A1 is displayed on the XbarM chart shown inFIG. 5B . When the line L1 on the LJ chart is moved in the left-right direction, the specific area A1 on the XbarM chart (third control chart) also moves following the left-right direction. That is, the display form of the XbarM chart is changed according to the change of the line L1 on the LJ chart. - Returning to
FIG. 4 , theoversight terminal 5 determines whether a display instruction has been received from the person in charge for a predetermined period (for example, one day) (second period) on the XbarM chart or the LJ chart via the pointing device. If an instruction is received (YES in step S10), the process proceeds to step S11, whereas if an instruction is not received (NO in step S10), the process proceeds to step S16. - The
oversight terminal 5 transmits a display data preparation instruction corresponding to the received display instruction to the qualitycontrol support device 1. - The quality
control support device 1 determines whether a display data preparation instruction corresponding to the display instruction received by theoversight terminal 5 has been received. If the instruction is received (YES in step S12), the process proceeds to step S13, whereas if the instruction is not received (NO in step S12), the process proceeds to step S18. - The quality
control support device 1 creates display data for displaying the XbarM chart (second control chart) in the above day corresponding to the received instruction, and transmits the data to theoversight terminal 5. - The
oversight terminal 5 determines whether the display data for displaying the XbarM chart (second control chart) has been received from the qualitycontrol support device 1. When the display data are received (YES in step S14), the process proceeds to step S15, whereas when the display data are not received (NO in step S14), the process waits until display data are received. - The
oversight terminal 5 displays the XbarM chart (second control chart) based on the received display data. - The
oversight terminal 5 determines whether the display end instruction has been received from the person in charge. If the instruction is received (YES in step S16), the process proceeds to step S17, whereas if the instruction is not received (NO in step S16), the process returns to step S1. - The
oversight terminal 5 transmits an instruction to end the display to the qualitycontrol support device 1 and ends the process. - The quality
control support device 1 determines whether a display end instruction has been received from the person incharge terminal 5. When the end instruction is received (YES in step S18), the process ends, whereas when the end instruction is not received (NO in step S18), the process returns to step S4. -
FIG. 6A is a diagram showing examples of an LJ chart and an XbarM chart.FIG. 6B is a diagram showing an example of an XbarM chart. TheFIG. 6A show an example of a LJ chart (first control chart) displayed on the display of theoversight terminal 5 during the display period (first period) from December 27, 2019 to January 5, 2020, and displays an XbarM chart (third control chart) during the display period (third period) from December 27, 2019 to January 5, 2020. When the line L2 on the LJ chart shown inFIG. 6A is specified (a part of the area of the first control chart is specified), the specific area A3 (a part of the area of the third control chart) on the XbarM chart corresponding to the above one day (January 3, 2020) is displayed in a form different from the other areas. On the XbarM chart, the specific area A3 and the other areas may be displayed in different colors, or only the specific area A3 may be highlighted. Here, when the person in charge operates the cursor C3 and selects the specific area A3 corresponding to January 3, 2020 (designates a part of the area of the third control chart), the XbarM chart (second control chart) ofFIG. 6B showing the results of measuring the subject sample with theblood cell counter 3 is displayed in the period corresponding to January 3, 2020 (second period), which is shorter than the period corresponding to December 27, 2019 to January 5, 2020 (third period). According to this configuration, the LJ chart (first control chart) and the XbarM chart (second control chart) are displayed in the display period according to the difference between the measurement frequency of the quality control substance and the measurement frequency of the subject sample. Accordingly, the cause can be easily identified when there is an abnormality in the measurement result. - For example, although it is difficult to grasp the fluctuation of the measurement results of the subject sample on January 3, 2020 due to the short interval between the measurement results in the XbarM chart (third control chart) shown in
FIG. 6A , the fluctuation of the measurement results of the subject sample in one day can be easily grasped in the XbarM chart (second control chart) of the second period shown inFIG. 6B . - According to this configuration, an XbarM chart (second control chart) is displayed for any one day desired by the viewer. Therefore, it becomes possible to confirm the measurement result on the day when the abnormality occurs, and it becomes easier to identify the cause of the abnormality.
- According to this configuration, the display period of the LJ chart (first control chart) is received and the LJ chart (first control chart) is displayed for the received display period, such that, for example, the QC samples can be traced back to the past and it becomes easy to grasp the fluctuation of the measurement results of the sample since the LJ chart (first control chart) is displayed for the received display period. Therefore, it becomes easier to identify the cause of an abnormality.
- According to this configuration, since the designation of the display period of the XbarM chart (second control chart) shown in
FIG. 6B is received while the LJ chart (first control chart) is displayed on the display, the time at which an abnormality occurs can be estimated via the LJ chart (first control chart) and it is possible to confirm the fluctuation of the estimated occurrence time in detail from the XbarM chart (second control chart) shown inFIG. 6B . Therefore, it becomes easier to identify the cause of an abnormality. - According to the configuration, since the XbarM chart (second control chart) shown in
FIG. 6B is displayed by displaying the XbarM chart (third control chart) shown inFIG. 6A on the display and receiving the designation of the of the specific area A3 of the XbarM chart (third control chart) shown inFIG. 6A , with regard to the fluctuation of the measurement result of the subject sample, it becomes possible to confirm both the fluctuation in the medium- to long-term and the fluctuation in the short-term, and it becomes easier to estimate the time when the cause of the abnormality occurs. Therefore, it becomes easier to identify the cause of an abnormality. According to this configuration, since the specific area A1 indicating the period corresponding to the line L1 displayed on the LJ chart (first control chart) shown inFIG. 6A is displayed in a mode different from that of other periods in the XbarM chart (third control chart) shown inFIG. 6A , it becomes easy to confirm the measurement result of the subject sample at the time when the measurement result of the QC sample is abnormal. Therefore, it becomes easier to estimate the time when the cause of the abnormality occurs. Since the specific area A1 moves following the movement of the line L1, it becomes easy to specify the display period of the XbarM chart (second control chart) shown inFIG. 6B . -
FIG. 7 is a diagram showing an example of an XbarM chart according to an embodiment. In the indicator screen SD5 shown inFIG. 7 , the XbarM chart (second control chart), which has a display period of 1 day (in this example, January 3, 2020) shown inFIG. 7 , is a screen showing which display period corresponds to the display period from December 27, 2019 to January 5, 2020 of the XbarM chart (third control chart) shown inFIG. 6A . That is, in the display of the XbarM chart shown inFIG. 7 , the indicator screen SD5 is a relationship screen displaying the relationship between the display period (second period: January 3, 2020 in this example) and a display period of the XbarM chart shown inFIG. 6A (third period: December 27, 2019 to January 5, 2020 in the example). - The change of the display period of the XbarM chart shown in
FIG. 7 is received via the display on theoversight terminal 5 on which the indicator screen SD5 is displayed (the position of the specific area A7 is changed by moving the indicator I1 to the left or right), and the display period of the XbarM chart is changed according to the received change . - According to this configuration, since the relationship between the display period of the XbarM chart (third control chart) shown in
FIG. 6A and the display period of the XbarM chart (second control chart) shown inFIG. 7 becomes readily understood, regarding the fluctuation of the measurement result of the subject sample, it becomes possible to confirm both the fluctuation in the medium- to long-term and the fluctuation in the short-term, and becomes easier to estimate the time when the cause of the abnormality occurs. - According to this configuration, since the display period of the XbarM chart (second control chart) shown in
FIG. 7 can be changed, it becomes possible to confirm the short-term fluctuation of the measurement result in a plurality of periods, and becomes easier to estimate the time when the cause of the abnormality occurs. -
FIG. 8A is a diagram showing an example of an LJ chart and an XbarM chart.FIG. 8B is a diagram showing an example of an XbarM chart (second control chart) displayed when a predetermined operation is executed in the XbarM chart ofFIG. 8A .FIG. 8C is a diagram showing an example of an XbarM chart (second control chart) displayed when a predetermined operation is executed in the XbarM chart ofFIG. 8B . InFIG. 8A , the LJ chart (first control chart) is displayed on the display of theoversight terminal 5 during the display period (first period) from December 27, 2019 to January 5, 2020, and an example is shown in which the XbarM chart (third control chart) is displayed during the display period (third period) from December 27, 2019 to January 5, 2020. When the line L3 on the LJ chart shown inFIG. 8A is specified, the specific area A9 on the XbarM chart corresponding to one day (January 5, 2020) including the line L3 is displayed in a form different from the other areas. The specific area A9 is an area defined by the line L5 and the line L7 on the XbarM chart. Here, when the person in charge operates the cursor C2 to move the line L7 on the XbarM chart to the position of the line L9 corresponding to January 2, 2020, the line L9 and the line L5 are displayed on the XbarM chart and a new defined region A11 is formed. When the person in charge selects the specific area A11 (designates a part of the area in the third control chart), the results of measuring the subject samples with theblood cell counter 3 during the period from January 2, 2020 to January 5, 2020 are shown, and the XbarM chart (second control chart) shown inFIG. 8B is displayed. When the person in charge selects the specific region A13 corresponding to January 3, the results of measuring the subject samples with theblood cell counter 3 in the period corresponding to January 3, 2020 is shown, and the XbarM chart (second control chart) shown inFIG. 8C is displayed. -
FIGS. 9 and10 are diagrams showing an examples of the LJ chart and the XbarM chart according to the embodiment.FIG. 9 is a diagram showing an example of an LJ chart and an XbarM chart when calibration is performed during the display period.FIG. 10 is a diagram showing another example of the LJ chart and the XbarM chart when the reagent is exchanged in theblood cell counter 3 during the display period.FIG. 11 is a diagram showing an example of an LJ chart and an XbarM chart when an error occurs in theblood cell counter 3 during the display period. As shown inFIGS. 9 to 11 , when a predetermined event occurs within the display period in the display of the LJ chart and the XbarM chart, a mark indicating the occurrence of the predetermined event is displayed. A predetermined event includes at least one of error occurrence in theblood counter 3, calibration of theblood counter 3, or reagent exchange of theblood cell counter 3. Before and after such an event occurs, the measurement result is more likely to become abnormal than at other times such that by displaying a mark indicating the occurrence of a predetermined event, it is easy to estimate the time when the abnormality occurs. Note that the mark indicating the occurrence of a predetermined event also may be displayed on the XbarM chart (second control chart) for which the display period is shorter than that of the LJ chart, which is shown inFIG. 6B . - As shown in
FIG. 9 , when theblood cell counter 3 is calibrated during the display period, the mark • (black circle) S1 is displayed at the position corresponding to the date and time of the calibration (January 3, 2020). The implementation date and time (January 3, 2020) corresponds to the specific area A15 on the LJ chart and corresponds to the specific area A17 on the XbarM chart. Calibration is performed to confirm that theblood cell counter 3 outputs the optimum measurement result. - As shown in
FIG. 10 , when the reagent of theblood cell counter 3 is exchanged during the display period, the mark ▲ (black triangle) S3 is displayed at the position corresponding to the date and time (January 3, 2020). The implementation date and time (January 3, 2020) corresponds to the specific area A15 on the LJ chart and corresponds to the specific area A17 on the XbarM chart. - As shown in
FIG. 10 , when an error occurs in theblood cell counter 3 during the display period, the mark S5 is displayed at a position corresponding to the date and time of occurrence (January 3, 2020). When the mark ■ is selected on the display of theoversight terminal 5, an image G showing a history of error occurrence (predetermined event) also may be displayed on the display. According to this configuration, the history of error occurrence can be easily grasped on the LJ chart or the XbarM chart. The marks indicating the occurrence of the predetermined event shown inFIGS. 9 ,10 , and11 are displayed based on the data set described inFIG. 3 . The data set contains information on calibration, reagent exchange, and error occurrence in association with their occurrence date, and the indicator indicating the occurrence of a predetermined event is displayed at the position corresponding to the occurrence date and time. - In the examples of
FIGS. 6A and8A , both the LJ chart and the XbarM chart are displayed, but in the modified example 1 of the QC chart display process, the qualitycontrol support device 1 first displays the LJ chart, and thereafter displays the XbarM chart according to the operation of the person in charge. -
FIG. 12 is a diagram showing another example of the display process of the LJ chart and the XbarM chart according to the embodiment. As shown inFIG. 12 , the LJ chart (first control chart) is first displayed on the display of theoversight terminal 5 shown inFIG. 1 . When the line L11 (a part of the area of the first control chart) corresponding to the measurement date (January 3, 2020) on the LJ chart is specified, the XbarM chart (second control chart) having January 3, 2020 as the display period (second period) corresponding to the designated line L11 is displayed on the display on theoversight terminal 5. - According to this configuration, since the XbarM chart with the period corresponding to line L11 as the display period (second period) is displayed by designating the line L11 corresponding to the measurement date (January 3, 2020) on the LJ chart, it is possible to confirm the fluctuation of the measurement results of the subject in a short period of time with a small number of steps. Therefore, the cause of the abnormality can be identified more quickly.
- A modified example of the display processing of the line L1 of
FIG. 5A , the line L2 ofFIG. 6A , and the line L3 ofFIG. 8A (hereinafter referred to as a designated area) will be described below. In the first modification, an example of arranging the designated area at the time of measurement or at the time of occurrence of a predetermined event will be described first. In the first modification, the designated areas are displayed in the following priority order of (1) to (4). - (1) If an error occurs in the
blood cell counter 3 or if a QC measurement result warning (Warning) occurs, the designated area is displayed at the time of occurrence (point). In the case of multiple points, the specified area is displayed on the point with the largest deviation from the target value. - (2) If there is a calibration result of the
blood cell counter 3, the designated area is displayed on the point. - (3) When the reagent of the
blood cell counter 3 is exchanged, the designated area is displayed on the point. - (4) If (1) to (3) do not apply, the designated area is displayed on the latest data plot on the LJ chart.
-
FIG. 13 is a diagram showing another example of the display form of the LJ chart according to the embodiment. The designated area is not a line shape like the line L1 of FIG. A, the line L2 ofFIG. 6A , and the line L3 ofFIG. 8A , rather the LJ chart as shown inFIG. 13 may be displayed in the designated area A19 having a predetermined polygonal shape (for example, a quadrangular shape). - In the third modification, the quality
control support device 1 executes the designation of the area on the LJ chart on the area designation screen. -
FIG. 14A is a diagram showing an example of the designated area designation screen DS1.FIG. 14B is a diagram showing an example of an LJ chart in which a period corresponding to a period designated on the designated area setting screen DS1 is displayed as a designated area. On the designated area setting screen DS1 shown inFIG. 14A , the display period of the designated area on the LJ chart is designated from December 30, 2019 to December 31, 2019. In this case, as shown inFIG. 14B , the LJ chart including the designated area A21 starting from December 30, 2019 and ending on December 31, 2019 is displayed. - In the
modification 4, the qualitycontrol support device 1 executes control of the display size of the designated area on the LJ chart or control of the display position. -
FIG. 15A is an example showing size control of a designated area in the LJ chart.FIG. 15B is an example showing position control of a designated area in the LJ chart. As shown inFIG. 15A , the display size of the designated area on the LJ chart may be controlled. The person in charge executes a multi-touch screen operation on the display on theoversight terminal 5 on which the LJ chart is displayed. For example, after specifying the designated area A23 on the display, the size of the designated area A23 is controllable by moving two fingers of the person in charge so as to expand (pinch out) or shrink (pinch in) the display size of the area A23. The control of the display size of the designated area A23 also may be executed in any direction, and may be in the horizontal direction or the vertical direction. As shown inFIG. 15B , the display position of the designated area on the LJ chart also may be controlled. The person in charge may operate the cursor C9 to specify the designated area A23 and then move the designated area A23 in the left-right direction. When the display has a touch panel function, the designated area A23 may be moved in the left-right direction by a touch operation of a person in charge. - In the first modification, the display period of the LJ chart can be specified separately from the display period of the XbarM chart, whereas the form described with reference to
FIGS. 4 and5 describes the display period of the LJ chart as automatically set to the display period of the XbarM chart. -
FIG. 16 is a diagram showing an example of a display period designation screen, an LJ chart, and an XbarM chart according to an embodiment. First, on the display period designation screen DS3 of the XbarM chart, the display period of the XbarM chart is designated from December 27, 2019 to January 5, 2020. On the display period designation screen DS5 of the LJ chart, the display period of the LJ chart is separately designated from December 27, 2019 to January 5, 2020. As a result, the LJ chart and the XbarM chart are displayed in the respective display periods specified via the display period designation screen DS3 and the display period designation screen DS5. -
Modification 2 is different frommodification 1 in that the display period of the XbarM chart is set shorter than the display period of the LJ chart. -
FIG. 17 is a diagram showing an example of a display period designation screen, an LJ chart, and an XbarM chart according to an embodiment when the display period of the XbarM chart is set shorter than the display period of the LJ chart. As shown inFIG. 17 , the display period (January 3, 2020), which is shorter than the period specified on the display period designation screen DS7 of the LJ chart (December 27, 2019 to January 5, 2020), is specified on the display period specification screen DS9 of the XbarM chart. In this case, the LJ chart displayed in the display period corresponding to the period from December 27, 2019 to January 5, 2020, and the XbarM chart displaying the display period corresponding to the separately specified period (January 3, 2020), are displayed side by side. - According to this configuration, for example, when the time of occurrence of an abnormality can be estimated from the occurrence of an error during measurement operation, the display period of the XbarM chart can be specified on the display period specification screen DS9, so that a short period of time can be achieved with a small number of steps, thus allowing confirmation of the fluctuation of the measurement result of the subject during the period. Therefore, the cause of the abnormality can be identified more quickly.
- Note that the display period of the XbarM chart display period may overlap at least partly with the display period of the LJ chart; for example, the display period of the LJ chart may be specified from December 27, 2019 to 2020 to January 5, 2019, and December 26, 2019 to December 28, 2019 may be specified as the display period of the XbarM chart.
- In
modification 3, when a specific area is specified in the XbarM chart displayed in the predetermined display period, the display is switched to the XbarM chart in the display period corresponding to the specific area. - The upper XbarM chart in
FIG. 18 is an XbarM chart displayed during the display period from December 27, 2019 to January 5, 2020. The specific area A25 corresponding to January 3, 2020 on this XbarM chart is designated by, for example, the cursor C11. - In this case, the display is switched to the XbarM chart on the lower side of
FIG. 18 . The lower XbarM chart inFIG. 18 is an XbarM chart having a display period of January 3, 2020 corresponding to the specific area A25. - In the modified example 4, even if the designation of the display period is not received, the XbarM with a predetermined display period of the display period of the LJ chart (for example, the last day of the display period of the LJ chart) is displayed automatically.
-
FIG. 19A is a diagram showing an example of an LJ chart displayed in a designated display period.FIG. 19B is a diagram showing an example of an XbarM chart displayed in the display period corresponding to the last day of the display period of the LJ chart in the LJ chart ofFIG. 19A . As shown inFIG. 19A , the last day on the LJ chart displayed during the display period from December 27, 2019 to January 5, 2020 is January 5, 2020. In this case, as shown inFIG. 19B , the XbarM chart having the display period of January 5, 2020 corresponding to the last day on the LJ chart is automatically displayed. - According to the first embodiment described above, the quality
control support system 100 displays the first control chart (MJ chart) on the display in the first period, and the second control chart (XbarM chart) in the second period which is shorter than the first period on the display. Therefore, in the above quality control support method, the first control chart and the second control chart are displayed in the display period according to the difference between the measurement frequency of the quality control substance and the measurement frequency of the subject sample. Accordingly, the cause can be easily identified when there is an abnormality in the measurement result. - The second embodiment differs from the first embodiment in that the target value and the limit value of the LJ chart are determined by external quality control, and the target value and the limit value determined for each lot of the QC sample are used. In the following, the points different from the first embodiment will be particularly described with respect to the second embodiment.
-
FIG. 20 is a diagram showing an example of an LJ chart according to the second embodiment. As shown inFIG. 20 , the "target value" (for example, "30") in the LJ chart is a reference value determined by aggregating the QC measurement results of each facility. "Upper limit value 3" (for example, "40") and "lower limit value 3" (for example, "20") are upper limit values and lower limit values determined by aggregating the QC measurement results of each facility. The "upper limit value 4" (for example, "37") and the "lower limit value 4" (for example, "23") are values set according to the respective values of the "upper limit value 3" and the "lower limit value 3". Each upper limit value and each lower limit value can be set by the user. -
FIG. 21 is a flowchart showing an example of the display process of the QC chart according to the second embodiment. The process steps S21 to S39 ofFIG. 21 , excluding step S25, correspond to the process steps S1 to S18 shown inFIG. 4 . In step S25 shown inFIG. 21 , the qualitycontrol support device 1 aggregates the QC measurement results of each facility during the display period, and determines the target value and each limit value shown inFIG. 20 . - According to the second embodiment described above, in addition to the above effects in the first embodiment, the quality
control support system 100 can be managed by the same management entity that manages each facility within a management group having a plurality of facilities such that external quality control becomes possible. - The third embodiment is different from the first embodiment in that the functions of the quality
control support device 1 and theoversight terminal 5 in thefirst embodiment 1 are integrated in the qualitycontrol support device 1. In the following, the differences between the third embodiment and the first embodiment will be particularly described. - As shown in
FIG. 22 , the qualitycontrol support device 1 is connected to theblood cell counter 3A via the network NA. The hardware configuration of the qualitycontrol support device 1 is the same as the configuration shown inFIG. 2 . -
FIG. 23 is a flowchart showing an example of the display process of the QC chart according to the third embodiment. - The quality
control support device 1 determines whether the person in charge has received the designation regarding the display period of the QC chart (for example, the LJ chart and the XbarM chart) to be displayed on the qualitycontrol support device 1. If the designation is received (YES in step S41), the process proceeds to step S42, whereas if the designation is not received (NO in step S41), the process proceeds to step S47. - The quality
control support device 1 determines whether a display instruction for the LJ chart and the XbarM chart has been received from the person in charge. If the designation is received (YES in step S42), the process proceeds to step S43, whereas if the designation is not received (NO in step S42), the process waits until the designation is received. - The quality
control support device 1 reads out the measurement data of theblood cell counter 3 stored in advance from thestorage device 13 shown inFIG. 2 . - The quality
control support device 1 identifies a QC measurement result outside the permissible range. - The quality
control support device 1 generates display data for displaying the LJ chart and the XbarM chart on the display included in the qualitycontrol support device 1. - Based on the generated display data, the quality
control support device 1 displays the LJ chart and the XbarM chart on the display for the display period (the period corresponding from December 27, 2019 to January 5, 2020) specified in step S41. - The quality
control support device 1 determines whether a display instruction for a predetermined period (for example, one day) (second period) on the XbarM chart or the LJ chart has been received from the person in charge via the pointing device. If the instruction is received (YES in step S47), the process proceeds to step S48, whereas if the instruction is not received (NO in step S47), the process proceeds to step S50. - The quality
control support device 1 generates display data for displaying the XbarM chart (second control chart) in the above day corresponding to the received instruction. - The quality
control support device 1 displays an XbarM chart (second control chart) based on the generated display data. - The quality
control support device 1 determines whether a display end instruction has been received from the person in charge. When the instruction is received (YES in step S50), the process ends, whereas when the instruction is not received (NO in step S50), the process returns to step S41. According to the third embodiment described above, it is not necessary to prepare the oversight terminal separately from the qualitycontrol support device 1. - Each of the above embodiments is for facilitating the understanding of the present invention, and does not limit the interpretation of the present invention. The present invention can be modified/improved (for example, combining each embodiment, omitting a part of the configuration of each embodiment) without departing from the spirit thereof, and the present invention also includes an equivalent thereof.
- In each of the above embodiments, the
blood cell counter 3 has been described as an example of the analyzer, but the present invention is not limited to a blood cell counter.. As the analyzer, for example, another analyzer such as a blood coagulation measuring device, a biochemical analyzer, an immunoanalyzing device, a urine analyzer, or a nucleic acid analyzer may be adopted. -
FIG. 24 is a diagram showing another example of the configuration of the quality control support system according to the embodiment. Although the qualitycontrol support device 1 is arranged in a support center different from the facility where the oversight terminal is arranged inFIG. 1 , the quality control support device 1also may be installed within the facility in which theoversight terminal 5 is installed as shown inFIG. 24 .
Claims (25)
- A quality control support method for displaying a control chart of quality control related to an analyzer that measures a subject sample, the method comprising:generating a first control chart showing results of measured quality control substances by the analyzer in a first period;receiving a designation of a second period different from the first period, the second period being shorter than the first period and at least partially overlapping with the first period;generating a second control chart showing results of the measured subject samples by the analyzer in the second period;displaying the generated first control chart; anddisplaying the generated second control chart.
- The quality control support method according to claim 1, further comprising:receiving the designation of the first period;wherein in the generating the first control chart, the first control chart is generated in the first period corresponding to the received designation of the first period.
- The quality control support method according to claim 1 or 2, wherein
the receiving the designation of the second period is executed after the first control chart is displayed. - The quality control support method according to any one of claims 1 to 3, wherein
the designation of the second period is received while the first control chart is displayed. - The quality control support method according to any one of claims 1 to 4, further comprising:generating a third control chart showing results of measured subject samples by the analyzer in a third period that is longer than the second period; anddisplaying the generated third control chart;wherein in the receiving the designation of the second period, the designation of the second period is received by designating a partial area of the displayed third control chart, the second period corresponding to the designated partial area.
- The quality control support method according to claim 5, wherein
in the displaying the first control chart, a partial area of the first control chart is displayed in a manner different from that of other areas in the first control chart; and
in the displaying the third control chart, a period corresponding to the partial area on the first control chart is displayed in a mode different from other periods in the third control chart. - The quality control support method according to claim 6, further comprising:changing the partial area of the first control chart; andchanging display mode of the third control chart in accordance with the change of the partial area of the first control chart.
- The quality control support method according to any one of claims 5 to 7, further comprising:
receiving a change of the designated partial area of the third control chart. - The quality control support according to any one of claims 5 to 8, further comprising: displaying a relationship screen showing relationship between the second period and the third period.
- The quality control support method according to claim 9, further comprising:receiving a change of display period of the second control chart through the relationship screen; anddisplaying the second control chart according to the received change.
- The quality control support method according to any one of claims 1 to 4, wherein
in the receiving the designation of the second period, the designation of the second period is received by designating a partial area of the first control chart, the second period corresponding to the received partial area of the first control chart. - The quality control support method according to any one of claims 1 to 4, wherein
in the receiving the designation of the second period, a dialog for designating the second period is displayed, and the designation of the second period is received through the dialog. - The quality control support method according to any one of claims 1 to 11, wherein
when a predetermined event occurs within the first period, a mark indicating the occurrence of the event is displayed in the display of the first control chart. - The quality control support method according to claim 13, wherein
the predetermined event includes at least one of error occurrence in the analyzer, calibration of the analyzer, or reagent exchange for the analyzer. - The quality control support method according to claim 13 or 14, wherein
when the mark is selected, history related to the predetermined event is displayed. - The quality control support method according to any one of claims 1 to 15, wherein the first control chart and the second control chart are displayed side by side.
- The quality control support method according to any one of claims 1 to 15, wherein
the display of the first control chart is terminated when the second control chart is displayed. - The quality control support method according to any one of claims 1 to 17, wherein
the generating the first control chart and the generating the second control chart are executed by a quality control support device; and
the displaying the first control chart and the displaying the second control chart are executed by a terminal device connected to the quality control support device via a network. - The quality control support method according to any one of claims 1 to 17, wherein
the generating the first control chart, the displaying the first control chart, the generating the second control chart, and the displaying the first control chart are executed by a quality control support device. - A quality control support method for displaying a control chart of quality control related to an analyzer that measures a subject sample, the method comprising:generating a first control chart showing results of measured quality control substances by the analyzer in a first period;generating a second control chart showing results of measured subject samples by the analyzer in a second period, which is a part of the first period; anddisplaying the first control chart and the second control chart side by side.
- A quality control support system for displaying a control chart of quality control related to an analyzer that measures a subject sample, the system comprising:a quality control support device comprising a first control unit;a terminal device, which is connected to the quality control support device via a network, comprising a second control unit and a display;wherein the first control unit of the quality control support device is configured to execute operations comprising:generating a first control chart showing results of measured quality control substances by the analyzer in a first period;receiving a designation of a second period different from the first period, the second period being shorter than the first period and at least partially overlapping with the first period;generating a second control chart showing results of measured subject samples by the analyzer in the second period; andthe second control unit of the terminal device is configured to execute:displaying the generated first control chart on the display; anddisplaying the generated second control chart on the display.
- A quality control support device for displaying a control chart of quality control related to an analyzer that measures a subject sample, the device comprising:a control unit; anda display;wherein the control unit is configured to execute operations comprising:generating a first control chart showing results of measured quality control substances by the analyzer in a first period;receiving a designation of a second period different from the first period, the second period being shorter than the first period and at least partially overlapping with the first period;generating a second control chart showing results of the measured subject samples by the analyzer in the second period;displaying the generated first control chart on the display; anddisplaying the generated second control chart on the display.
- A quality control support device that is connected to a terminal device comprising a display via a network and displays a control chart of quality control related to an analyzer that measures a subject sample on a display of the terminal device, the quality control support devise comprising:a control unit,wherein the control unit is configured to execute operations comprising:generating a first control chart showing results of measured quality control substances by the analyzer in a first period;receiving a designation of a second period different from the first period, the second period being shorter than the first period and at least partially overlapping with the first period;generating a second control chart showing results of the measured subject samples by the analyzer in the second period;sending the generated first control chart to the terminal device; andsending the generated second control chart to the terminal device.
- A program in a quality control support device that displays a control chart of quality control related to an analyzer that measures a subject sample on a display of a terminal device, the quality control support device and the terminal device being connected via the network, the program executing operations comprising:generating a first control chart showing results of measured quality control substances by the analyzer in a first period;receiving a designation of a second period different from the first period, the second period being shorter than the first period and at least partially overlapping with the first period;generating a second control chart showing results of the measured subject samples by the analyzer in the second period;sending the generated first control chart to the terminal device; andsending the generated second control chart to the terminal device.
- A program in a quality control support device comprising a display that displays a control chart of quality control related to an analyzer that measures a subject sample, the program executing operations comprising:generating a first control chart showing results of measured quality control substances by the analyzer in a first period;receiving a designation of a second period different from the first period, the second period being shorter than the first period and at least partially overlapping with the first period;generating a second control chart showing results of the measured subject samples by the analyzer in the second period;displaying the generated first control chart on the display; anddisplaying the generated second control chart on the display.
Priority Applications (1)
| Application Number | Priority Date | Filing Date | Title |
|---|---|---|---|
| EP23179194.8A EP4235688A3 (en) | 2020-07-31 | 2021-07-22 | Quality control support method, quality control support system, quality control support device, and program |
Applications Claiming Priority (1)
| Application Number | Priority Date | Filing Date | Title |
|---|---|---|---|
| JP2020130438A JP7629697B2 (en) | 2020-07-31 | 2020-07-31 | QUALITY CONTROL SUPPORT METHOD, QUALITY CONTROL SUPPORT SYSTEM, QUALITY CONTROL SUPPORT DEVICE, AND PROGRAM |
Related Child Applications (2)
| Application Number | Title | Priority Date | Filing Date |
|---|---|---|---|
| EP23179194.8A Division EP4235688A3 (en) | 2020-07-31 | 2021-07-22 | Quality control support method, quality control support system, quality control support device, and program |
| EP23179194.8A Division-Into EP4235688A3 (en) | 2020-07-31 | 2021-07-22 | Quality control support method, quality control support system, quality control support device, and program |
Publications (2)
| Publication Number | Publication Date |
|---|---|
| EP3945321A1 true EP3945321A1 (en) | 2022-02-02 |
| EP3945321B1 EP3945321B1 (en) | 2023-08-23 |
Family
ID=77021249
Family Applications (2)
| Application Number | Title | Priority Date | Filing Date |
|---|---|---|---|
| EP23179194.8A Pending EP4235688A3 (en) | 2020-07-31 | 2021-07-22 | Quality control support method, quality control support system, quality control support device, and program |
| EP21187161.1A Active EP3945321B1 (en) | 2020-07-31 | 2021-07-22 | Quality control support method, quality control support system, quality control support device, and program |
Family Applications Before (1)
| Application Number | Title | Priority Date | Filing Date |
|---|---|---|---|
| EP23179194.8A Pending EP4235688A3 (en) | 2020-07-31 | 2021-07-22 | Quality control support method, quality control support system, quality control support device, and program |
Country Status (4)
| Country | Link |
|---|---|
| US (1) | US12203950B2 (en) |
| EP (2) | EP4235688A3 (en) |
| JP (1) | JP7629697B2 (en) |
| CN (1) | CN114067984B (en) |
Families Citing this family (4)
| Publication number | Priority date | Publication date | Assignee | Title |
|---|---|---|---|---|
| JP7420010B2 (en) * | 2020-08-20 | 2024-01-23 | 株式会社島津製作所 | analysis system |
| AU2022201245A1 (en) * | 2021-03-04 | 2022-09-22 | Sysmex Corporation | Quality control method of specimen analysis system and specimen analysis system |
| CN113539397A (en) * | 2021-05-27 | 2021-10-22 | 内蒙古卫数数据科技有限公司 | Real-time quality control system only using patient sample |
| WO2026002216A1 (en) * | 2024-06-28 | 2026-01-02 | 深圳迈瑞生物医疗电子股份有限公司 | Method for real-time quality control based on patient sample, method for constructing quality control model, and computer-readable storage medium |
Citations (2)
| Publication number | Priority date | Publication date | Assignee | Title |
|---|---|---|---|---|
| EP3546950A1 (en) * | 2018-03-29 | 2019-10-02 | Sysmex Corporation | Apparatus for generating monitoring data of sample analyzer, sample analyzing apparatus and method of generating monitoring data of sample analyzer |
| EP3578993A1 (en) * | 2017-01-31 | 2019-12-11 | Sysmex Corporation | Accuracy management method, accuracy management system, management device, analysis device, and method for determining abnormality in accuracy management |
Family Cites Families (7)
| Publication number | Priority date | Publication date | Assignee | Title |
|---|---|---|---|---|
| JP4436853B2 (en) * | 2007-06-18 | 2010-03-24 | シスメックス株式会社 | Accuracy management apparatus and accuracy management method |
| JP4991586B2 (en) * | 2008-01-31 | 2012-08-01 | 株式会社日立ハイテクノロジーズ | Automatic analyzer |
| CN102265163B (en) * | 2008-12-26 | 2013-12-04 | 株式会社日立高新技术 | Accuracy management method |
| JP5147906B2 (en) * | 2010-07-22 | 2013-02-20 | 株式会社日立ハイテクノロジーズ | Quality control system |
| JP5771060B2 (en) | 2011-05-02 | 2015-08-26 | シスメックス株式会社 | Sample analyzer and data processing apparatus |
| US20140068489A1 (en) * | 2012-09-05 | 2014-03-06 | Intelligent Decisions, Inc. | Interactive historical timeline of personal health record |
| JP2015194903A (en) * | 2014-03-31 | 2015-11-05 | 栄研化学株式会社 | External accuracy management system |
-
2020
- 2020-07-31 JP JP2020130438A patent/JP7629697B2/en active Active
-
2021
- 2021-07-22 EP EP23179194.8A patent/EP4235688A3/en active Pending
- 2021-07-22 US US17/382,785 patent/US12203950B2/en active Active
- 2021-07-22 EP EP21187161.1A patent/EP3945321B1/en active Active
- 2021-07-28 CN CN202110855420.8A patent/CN114067984B/en active Active
Patent Citations (2)
| Publication number | Priority date | Publication date | Assignee | Title |
|---|---|---|---|---|
| EP3578993A1 (en) * | 2017-01-31 | 2019-12-11 | Sysmex Corporation | Accuracy management method, accuracy management system, management device, analysis device, and method for determining abnormality in accuracy management |
| EP3546950A1 (en) * | 2018-03-29 | 2019-10-02 | Sysmex Corporation | Apparatus for generating monitoring data of sample analyzer, sample analyzing apparatus and method of generating monitoring data of sample analyzer |
Non-Patent Citations (2)
| Title |
|---|
| LO TPCERVINSKI MA ET AL.: "Recommendations for laboratory informatics specifications needed for the application of patient-based real time quality control", CLINICA CHIMICA ACTA, vol. 495, August 2019 (2019-08-01), pages 625 - 629 |
| LO TPCERVINSKI MA ET AL.: "Recommendations for laboratory informatics specifications needed for the application of patient-based real time quality control", CLINICA CHIMICA ACTA, vol. 95, 4 August 2019 (2019-08-04), pages 625 - 629 |
Also Published As
| Publication number | Publication date |
|---|---|
| US12203950B2 (en) | 2025-01-21 |
| JP7629697B2 (en) | 2025-02-14 |
| EP4235688A2 (en) | 2023-08-30 |
| CN114067984A (en) | 2022-02-18 |
| EP4235688A3 (en) | 2023-11-08 |
| JP2022026810A (en) | 2022-02-10 |
| CN114067984B (en) | 2026-05-05 |
| EP3945321B1 (en) | 2023-08-23 |
| US20220034922A1 (en) | 2022-02-03 |
Similar Documents
| Publication | Publication Date | Title |
|---|---|---|
| EP3945321B1 (en) | Quality control support method, quality control support system, quality control support device, and program | |
| Joseph et al. | Accurate and robust inference of microbial growth dynamics from metagenomic sequencing reveals personalized growth rates | |
| Peter et al. | Scaling up HIV viral load–lessons from the large‐scale implementation of HIV early infant diagnosis and CD 4 testing | |
| US8538727B2 (en) | Method and apparatus for calibration and testing of scientific measurement equipment | |
| US20110161857A1 (en) | Graphic for Displaying Multiple Assessments of Critical Care Performance | |
| US12300363B2 (en) | Automatically generating rules for lab instruments | |
| CN101630426B (en) | Process monitoring system and method | |
| CN112236675B (en) | Sample detection data processing method and device and computer storage medium | |
| JP2013228968A (en) | Display device and display control program for the same | |
| EP4080435A1 (en) | Reagent management system | |
| WO2012037079A1 (en) | A method and system for managing analytical quality in networked laboratories | |
| Loh et al. | Advances in internal quality control | |
| CN110307864A (en) | A kind of remote gathering system and its adjusting process of energy measurement instrument | |
| EP4506849A1 (en) | Document conversion system and method for managing electronic test report | |
| EP2602625B1 (en) | Method, device and computer program for monitoring diagnostic test processes | |
| Torous et al. | Leveraging thoughtful quality metric selection for individual and system improvements: the atypical category and use of dashboards | |
| US20210264650A1 (en) | Instrument analyzers, data displays, and display methods | |
| Loh et al. | Delta checks | |
| US20250364092A1 (en) | Material Search Method, Material Search System, Program, And Recording Medium | |
| EP4693318A1 (en) | Method, device for recommending quality control rules and computer equipment | |
| Rodriguez-Borja et al. | Failure to review STAT clinical laboratory requests and its economical impact | |
| EP4199001A1 (en) | System and method for monitoring performance of a medical device | |
| JP7801948B2 (en) | Energy calculation device and energy calculation method | |
| EP4312221A1 (en) | Consolidation and prioritization of patient critical notifications | |
| CN109599173A (en) | The unilateral capability assessment method and device of detection system |
Legal Events
| Date | Code | Title | Description |
|---|---|---|---|
| PUAI | Public reference made under article 153(3) epc to a published international application that has entered the european phase |
Free format text: ORIGINAL CODE: 0009012 |
|
| STAA | Information on the status of an ep patent application or granted ep patent |
Free format text: STATUS: THE APPLICATION HAS BEEN PUBLISHED |
|
| AK | Designated contracting states |
Kind code of ref document: A1 Designated state(s): AL AT BE BG CH CY CZ DE DK EE ES FI FR GB GR HR HU IE IS IT LI LT LU LV MC MK MT NL NO PL PT RO RS SE SI SK SM TR |
|
| STAA | Information on the status of an ep patent application or granted ep patent |
Free format text: STATUS: REQUEST FOR EXAMINATION WAS MADE |
|
| 17P | Request for examination filed |
Effective date: 20220725 |
|
| RBV | Designated contracting states (corrected) |
Designated state(s): AL AT BE BG CH CY CZ DE DK EE ES FI FR GB GR HR HU IE IS IT LI LT LU LV MC MK MT NL NO PL PT RO RS SE SI SK SM TR |
|
| GRAP | Despatch of communication of intention to grant a patent |
Free format text: ORIGINAL CODE: EPIDOSNIGR1 |
|
| STAA | Information on the status of an ep patent application or granted ep patent |
Free format text: STATUS: GRANT OF PATENT IS INTENDED |
|
| RIC1 | Information provided on ipc code assigned before grant |
Ipc: G16H 40/40 20180101ALI20230117BHEP Ipc: G06F 3/0484 20130101ALI20230117BHEP Ipc: G01N 35/00 20060101AFI20230117BHEP |
|
| INTG | Intention to grant announced |
Effective date: 20230222 |
|
| GRAS | Grant fee paid |
Free format text: ORIGINAL CODE: EPIDOSNIGR3 |
|
| GRAA | (expected) grant |
Free format text: ORIGINAL CODE: 0009210 |
|
| STAA | Information on the status of an ep patent application or granted ep patent |
Free format text: STATUS: THE PATENT HAS BEEN GRANTED |
|
| AK | Designated contracting states |
Kind code of ref document: B1 Designated state(s): AL AT BE BG CH CY CZ DE DK EE ES FI FR GB GR HR HU IE IS IT LI LT LU LV MC MK MT NL NO PL PT RO RS SE SI SK SM TR |
|
| REG | Reference to a national code |
Ref country code: GB Ref legal event code: FG4D |
|
| REG | Reference to a national code |
Ref country code: CH Ref legal event code: EP |
|
| REG | Reference to a national code |
Ref country code: IE Ref legal event code: FG4D |
|
| REG | Reference to a national code |
Ref country code: DE Ref legal event code: R096 Ref document number: 602021004467 Country of ref document: DE |
|
| REG | Reference to a national code |
Ref country code: LT Ref legal event code: MG9D |
|
| REG | Reference to a national code |
Ref country code: NL Ref legal event code: MP Effective date: 20230823 |
|
| REG | Reference to a national code |
Ref country code: AT Ref legal event code: MK05 Ref document number: 1603187 Country of ref document: AT Kind code of ref document: T Effective date: 20230823 |
|
| PG25 | Lapsed in a contracting state [announced via postgrant information from national office to epo] |
Ref country code: GR Free format text: LAPSE BECAUSE OF FAILURE TO SUBMIT A TRANSLATION OF THE DESCRIPTION OR TO PAY THE FEE WITHIN THE PRESCRIBED TIME-LIMIT Effective date: 20231124 |
|
| PG25 | Lapsed in a contracting state [announced via postgrant information from national office to epo] |
Ref country code: IS Free format text: LAPSE BECAUSE OF FAILURE TO SUBMIT A TRANSLATION OF THE DESCRIPTION OR TO PAY THE FEE WITHIN THE PRESCRIBED TIME-LIMIT Effective date: 20231223 |
|
| PG25 | Lapsed in a contracting state [announced via postgrant information from national office to epo] |
Ref country code: SE Free format text: LAPSE BECAUSE OF FAILURE TO SUBMIT A TRANSLATION OF THE DESCRIPTION OR TO PAY THE FEE WITHIN THE PRESCRIBED TIME-LIMIT Effective date: 20230823 Ref country code: RS Free format text: LAPSE BECAUSE OF FAILURE TO SUBMIT A TRANSLATION OF THE DESCRIPTION OR TO PAY THE FEE WITHIN THE PRESCRIBED TIME-LIMIT Effective date: 20230823 Ref country code: PT Free format text: LAPSE BECAUSE OF FAILURE TO SUBMIT A TRANSLATION OF THE DESCRIPTION OR TO PAY THE FEE WITHIN THE PRESCRIBED TIME-LIMIT Effective date: 20231226 Ref country code: NO Free format text: LAPSE BECAUSE OF FAILURE TO SUBMIT A TRANSLATION OF THE DESCRIPTION OR TO PAY THE FEE WITHIN THE PRESCRIBED TIME-LIMIT Effective date: 20231123 Ref country code: NL Free format text: LAPSE BECAUSE OF FAILURE TO SUBMIT A TRANSLATION OF THE DESCRIPTION OR TO PAY THE FEE WITHIN THE PRESCRIBED TIME-LIMIT Effective date: 20230823 Ref country code: LV Free format text: LAPSE BECAUSE OF FAILURE TO SUBMIT A TRANSLATION OF THE DESCRIPTION OR TO PAY THE FEE WITHIN THE PRESCRIBED TIME-LIMIT Effective date: 20230823 Ref country code: LT Free format text: LAPSE BECAUSE OF FAILURE TO SUBMIT A TRANSLATION OF THE DESCRIPTION OR TO PAY THE FEE WITHIN THE PRESCRIBED TIME-LIMIT Effective date: 20230823 Ref country code: IS Free format text: LAPSE BECAUSE OF FAILURE TO SUBMIT A TRANSLATION OF THE DESCRIPTION OR TO PAY THE FEE WITHIN THE PRESCRIBED TIME-LIMIT Effective date: 20231223 Ref country code: HR Free format text: LAPSE BECAUSE OF FAILURE TO SUBMIT A TRANSLATION OF THE DESCRIPTION OR TO PAY THE FEE WITHIN THE PRESCRIBED TIME-LIMIT Effective date: 20230823 Ref country code: GR Free format text: LAPSE BECAUSE OF FAILURE TO SUBMIT A TRANSLATION OF THE DESCRIPTION OR TO PAY THE FEE WITHIN THE PRESCRIBED TIME-LIMIT Effective date: 20231124 Ref country code: FI Free format text: LAPSE BECAUSE OF FAILURE TO SUBMIT A TRANSLATION OF THE DESCRIPTION OR TO PAY THE FEE WITHIN THE PRESCRIBED TIME-LIMIT Effective date: 20230823 Ref country code: AT Free format text: LAPSE BECAUSE OF FAILURE TO SUBMIT A TRANSLATION OF THE DESCRIPTION OR TO PAY THE FEE WITHIN THE PRESCRIBED TIME-LIMIT Effective date: 20230823 |
|
| PG25 | Lapsed in a contracting state [announced via postgrant information from national office to epo] |
Ref country code: PL Free format text: LAPSE BECAUSE OF FAILURE TO SUBMIT A TRANSLATION OF THE DESCRIPTION OR TO PAY THE FEE WITHIN THE PRESCRIBED TIME-LIMIT Effective date: 20230823 |
|
| PG25 | Lapsed in a contracting state [announced via postgrant information from national office to epo] |
Ref country code: ES Free format text: LAPSE BECAUSE OF FAILURE TO SUBMIT A TRANSLATION OF THE DESCRIPTION OR TO PAY THE FEE WITHIN THE PRESCRIBED TIME-LIMIT Effective date: 20230823 |
|
| PG25 | Lapsed in a contracting state [announced via postgrant information from national office to epo] |
Ref country code: SM Free format text: LAPSE BECAUSE OF FAILURE TO SUBMIT A TRANSLATION OF THE DESCRIPTION OR TO PAY THE FEE WITHIN THE PRESCRIBED TIME-LIMIT Effective date: 20230823 Ref country code: RO Free format text: LAPSE BECAUSE OF FAILURE TO SUBMIT A TRANSLATION OF THE DESCRIPTION OR TO PAY THE FEE WITHIN THE PRESCRIBED TIME-LIMIT Effective date: 20230823 Ref country code: ES Free format text: LAPSE BECAUSE OF FAILURE TO SUBMIT A TRANSLATION OF THE DESCRIPTION OR TO PAY THE FEE WITHIN THE PRESCRIBED TIME-LIMIT Effective date: 20230823 Ref country code: EE Free format text: LAPSE BECAUSE OF FAILURE TO SUBMIT A TRANSLATION OF THE DESCRIPTION OR TO PAY THE FEE WITHIN THE PRESCRIBED TIME-LIMIT Effective date: 20230823 Ref country code: DK Free format text: LAPSE BECAUSE OF FAILURE TO SUBMIT A TRANSLATION OF THE DESCRIPTION OR TO PAY THE FEE WITHIN THE PRESCRIBED TIME-LIMIT Effective date: 20230823 Ref country code: CZ Free format text: LAPSE BECAUSE OF FAILURE TO SUBMIT A TRANSLATION OF THE DESCRIPTION OR TO PAY THE FEE WITHIN THE PRESCRIBED TIME-LIMIT Effective date: 20230823 Ref country code: SK Free format text: LAPSE BECAUSE OF FAILURE TO SUBMIT A TRANSLATION OF THE DESCRIPTION OR TO PAY THE FEE WITHIN THE PRESCRIBED TIME-LIMIT Effective date: 20230823 |
|
| REG | Reference to a national code |
Ref country code: DE Ref legal event code: R097 Ref document number: 602021004467 Country of ref document: DE |
|
| PG25 | Lapsed in a contracting state [announced via postgrant information from national office to epo] |
Ref country code: IT Free format text: LAPSE BECAUSE OF FAILURE TO SUBMIT A TRANSLATION OF THE DESCRIPTION OR TO PAY THE FEE WITHIN THE PRESCRIBED TIME-LIMIT Effective date: 20230823 |
|
| PLBE | No opposition filed within time limit |
Free format text: ORIGINAL CODE: 0009261 |
|
| STAA | Information on the status of an ep patent application or granted ep patent |
Free format text: STATUS: NO OPPOSITION FILED WITHIN TIME LIMIT |
|
| 26N | No opposition filed |
Effective date: 20240524 |
|
| PG25 | Lapsed in a contracting state [announced via postgrant information from national office to epo] |
Ref country code: SI Free format text: LAPSE BECAUSE OF FAILURE TO SUBMIT A TRANSLATION OF THE DESCRIPTION OR TO PAY THE FEE WITHIN THE PRESCRIBED TIME-LIMIT Effective date: 20230823 |
|
| PG25 | Lapsed in a contracting state [announced via postgrant information from national office to epo] |
Ref country code: BG Free format text: LAPSE BECAUSE OF FAILURE TO SUBMIT A TRANSLATION OF THE DESCRIPTION OR TO PAY THE FEE WITHIN THE PRESCRIBED TIME-LIMIT Effective date: 20230823 |
|
| PG25 | Lapsed in a contracting state [announced via postgrant information from national office to epo] |
Ref country code: BG Free format text: LAPSE BECAUSE OF FAILURE TO SUBMIT A TRANSLATION OF THE DESCRIPTION OR TO PAY THE FEE WITHIN THE PRESCRIBED TIME-LIMIT Effective date: 20230823 |
|
| PG25 | Lapsed in a contracting state [announced via postgrant information from national office to epo] |
Ref country code: MC Free format text: LAPSE BECAUSE OF FAILURE TO SUBMIT A TRANSLATION OF THE DESCRIPTION OR TO PAY THE FEE WITHIN THE PRESCRIBED TIME-LIMIT Effective date: 20230823 |
|
| REG | Reference to a national code |
Ref country code: CH Ref legal event code: PL |
|
| PG25 | Lapsed in a contracting state [announced via postgrant information from national office to epo] |
Ref country code: LU Free format text: LAPSE BECAUSE OF NON-PAYMENT OF DUE FEES Effective date: 20240722 |
|
| PG25 | Lapsed in a contracting state [announced via postgrant information from national office to epo] |
Ref country code: LU Free format text: LAPSE BECAUSE OF NON-PAYMENT OF DUE FEES Effective date: 20240722 |
|
| PG25 | Lapsed in a contracting state [announced via postgrant information from national office to epo] |
Ref country code: BE Free format text: LAPSE BECAUSE OF NON-PAYMENT OF DUE FEES Effective date: 20240731 Ref country code: CH Free format text: LAPSE BECAUSE OF NON-PAYMENT OF DUE FEES Effective date: 20240731 |
|
| REG | Reference to a national code |
Ref country code: BE Ref legal event code: MM Effective date: 20240731 |
|
| PGFP | Annual fee paid to national office [announced via postgrant information from national office to epo] |
Ref country code: GB Payment date: 20250529 Year of fee payment: 5 |
|
| PGFP | Annual fee paid to national office [announced via postgrant information from national office to epo] |
Ref country code: FR Payment date: 20250610 Year of fee payment: 5 |
|
| PG25 | Lapsed in a contracting state [announced via postgrant information from national office to epo] |
Ref country code: IE Free format text: LAPSE BECAUSE OF NON-PAYMENT OF DUE FEES Effective date: 20240722 |
|
| PGFP | Annual fee paid to national office [announced via postgrant information from national office to epo] |
Ref country code: DE Payment date: 20250528 Year of fee payment: 5 |
|
| PG25 | Lapsed in a contracting state [announced via postgrant information from national office to epo] |
Ref country code: CY Free format text: LAPSE BECAUSE OF FAILURE TO SUBMIT A TRANSLATION OF THE DESCRIPTION OR TO PAY THE FEE WITHIN THE PRESCRIBED TIME-LIMIT; INVALID AB INITIO Effective date: 20210722 |
|
| PG25 | Lapsed in a contracting state [announced via postgrant information from national office to epo] |
Ref country code: HU Free format text: LAPSE BECAUSE OF FAILURE TO SUBMIT A TRANSLATION OF THE DESCRIPTION OR TO PAY THE FEE WITHIN THE PRESCRIBED TIME-LIMIT; INVALID AB INITIO Effective date: 20210722 |