EP3937022A1 - Method and apparatus of monitoring interface performance of distributed application, device and storage medium - Google Patents
Method and apparatus of monitoring interface performance of distributed application, device and storage medium Download PDFInfo
- Publication number
- EP3937022A1 EP3937022A1 EP21180641.9A EP21180641A EP3937022A1 EP 3937022 A1 EP3937022 A1 EP 3937022A1 EP 21180641 A EP21180641 A EP 21180641A EP 3937022 A1 EP3937022 A1 EP 3937022A1
- Authority
- EP
- European Patent Office
- Prior art keywords
- interface
- performance data
- data distribution
- performance
- distribution characteristic
- Prior art date
- Legal status (The legal status is an assumption and is not a legal conclusion. Google has not performed a legal analysis and makes no representation as to the accuracy of the status listed.)
- Granted
Links
Images






Classifications
-
- G—PHYSICS
- G06—COMPUTING OR CALCULATING; COUNTING
- G06F—ELECTRIC DIGITAL DATA PROCESSING
- G06F11/00—Error detection; Error correction; Monitoring
- G06F11/30—Monitoring
- G06F11/3003—Monitoring arrangements specially adapted to the computing system or computing system component being monitored
- G06F11/3006—Monitoring arrangements specially adapted to the computing system or computing system component being monitored where the computing system is distributed, e.g. networked systems, clusters, multiprocessor systems
-
- G—PHYSICS
- G06—COMPUTING OR CALCULATING; COUNTING
- G06F—ELECTRIC DIGITAL DATA PROCESSING
- G06F11/00—Error detection; Error correction; Monitoring
- G06F11/22—Detection or location of defective computer hardware by testing during standby operation or during idle time, e.g. start-up testing
- G06F11/2205—Detection or location of defective computer hardware by testing during standby operation or during idle time, e.g. start-up testing using arrangements specific to the hardware being tested
- G06F11/2221—Detection or location of defective computer hardware by testing during standby operation or during idle time, e.g. start-up testing using arrangements specific to the hardware being tested to test input/output devices or peripheral units
-
- G—PHYSICS
- G06—COMPUTING OR CALCULATING; COUNTING
- G06F—ELECTRIC DIGITAL DATA PROCESSING
- G06F11/00—Error detection; Error correction; Monitoring
- G06F11/30—Monitoring
- G06F11/3003—Monitoring arrangements specially adapted to the computing system or computing system component being monitored
- G06F11/302—Monitoring arrangements specially adapted to the computing system or computing system component being monitored where the computing system component is a software system
-
- G—PHYSICS
- G06—COMPUTING OR CALCULATING; COUNTING
- G06F—ELECTRIC DIGITAL DATA PROCESSING
- G06F11/00—Error detection; Error correction; Monitoring
- G06F11/22—Detection or location of defective computer hardware by testing during standby operation or during idle time, e.g. start-up testing
- G06F11/2273—Test methods
-
- G—PHYSICS
- G06—COMPUTING OR CALCULATING; COUNTING
- G06F—ELECTRIC DIGITAL DATA PROCESSING
- G06F11/00—Error detection; Error correction; Monitoring
- G06F11/30—Monitoring
- G06F11/3003—Monitoring arrangements specially adapted to the computing system or computing system component being monitored
- G06F11/3041—Monitoring arrangements specially adapted to the computing system or computing system component being monitored where the computing system component is an input/output interface
-
- G—PHYSICS
- G06—COMPUTING OR CALCULATING; COUNTING
- G06F—ELECTRIC DIGITAL DATA PROCESSING
- G06F11/00—Error detection; Error correction; Monitoring
- G06F11/30—Monitoring
- G06F11/3065—Monitoring arrangements determined by the means or processing involved in reporting the monitored data
- G06F11/3072—Monitoring arrangements determined by the means or processing involved in reporting the monitored data where the reporting involves data filtering, e.g. pattern matching, time or event triggered, adaptive or policy-based reporting
- G06F11/3075—Monitoring arrangements determined by the means or processing involved in reporting the monitored data where the reporting involves data filtering, e.g. pattern matching, time or event triggered, adaptive or policy-based reporting the data filtering being achieved in order to maintain consistency among the monitored data, e.g. ensuring that the monitored data belong to the same timeframe, to the same system or component
-
- G—PHYSICS
- G06—COMPUTING OR CALCULATING; COUNTING
- G06F—ELECTRIC DIGITAL DATA PROCESSING
- G06F11/00—Error detection; Error correction; Monitoring
- G06F11/30—Monitoring
- G06F11/3065—Monitoring arrangements determined by the means or processing involved in reporting the monitored data
- G06F11/3072—Monitoring arrangements determined by the means or processing involved in reporting the monitored data where the reporting involves data filtering, e.g. pattern matching, time or event triggered, adaptive or policy-based reporting
- G06F11/3082—Monitoring arrangements determined by the means or processing involved in reporting the monitored data where the reporting involves data filtering, e.g. pattern matching, time or event triggered, adaptive or policy-based reporting the data filtering being achieved by aggregating or compressing the monitored data
-
- G—PHYSICS
- G06—COMPUTING OR CALCULATING; COUNTING
- G06F—ELECTRIC DIGITAL DATA PROCESSING
- G06F11/00—Error detection; Error correction; Monitoring
- G06F11/30—Monitoring
- G06F11/3089—Monitoring arrangements determined by the means or processing involved in sensing the monitored data, e.g. interfaces, connectors, sensors, probes, agents
- G06F11/3093—Configuration details thereof, e.g. installation, enabling, spatial arrangement of the probes
-
- G—PHYSICS
- G06—COMPUTING OR CALCULATING; COUNTING
- G06F—ELECTRIC DIGITAL DATA PROCESSING
- G06F11/00—Error detection; Error correction; Monitoring
- G06F11/30—Monitoring
- G06F11/32—Monitoring with visual or acoustical indication of the functioning of the machine
- G06F11/324—Display of status information
- G06F11/328—Computer systems status display
-
- G—PHYSICS
- G06—COMPUTING OR CALCULATING; COUNTING
- G06F—ELECTRIC DIGITAL DATA PROCESSING
- G06F11/00—Error detection; Error correction; Monitoring
- G06F11/30—Monitoring
- G06F11/34—Recording or statistical evaluation of computer activity, e.g. of down time, of input/output operation ; Recording or statistical evaluation of user activity, e.g. usability assessment
- G06F11/3404—Recording or statistical evaluation of computer activity, e.g. of down time, of input/output operation ; Recording or statistical evaluation of user activity, e.g. usability assessment for parallel or distributed programming
-
- G—PHYSICS
- G06—COMPUTING OR CALCULATING; COUNTING
- G06F—ELECTRIC DIGITAL DATA PROCESSING
- G06F11/00—Error detection; Error correction; Monitoring
- G06F11/30—Monitoring
- G06F11/34—Recording or statistical evaluation of computer activity, e.g. of down time, of input/output operation ; Recording or statistical evaluation of user activity, e.g. usability assessment
- G06F11/3409—Recording or statistical evaluation of computer activity, e.g. of down time, of input/output operation ; Recording or statistical evaluation of user activity, e.g. usability assessment for performance assessment
-
- G—PHYSICS
- G06—COMPUTING OR CALCULATING; COUNTING
- G06F—ELECTRIC DIGITAL DATA PROCESSING
- G06F11/00—Error detection; Error correction; Monitoring
- G06F11/30—Monitoring
- G06F11/34—Recording or statistical evaluation of computer activity, e.g. of down time, of input/output operation ; Recording or statistical evaluation of user activity, e.g. usability assessment
- G06F11/3409—Recording or statistical evaluation of computer activity, e.g. of down time, of input/output operation ; Recording or statistical evaluation of user activity, e.g. usability assessment for performance assessment
- G06F11/3419—Recording or statistical evaluation of computer activity, e.g. of down time, of input/output operation ; Recording or statistical evaluation of user activity, e.g. usability assessment for performance assessment by assessing time
-
- G—PHYSICS
- G06—COMPUTING OR CALCULATING; COUNTING
- G06F—ELECTRIC DIGITAL DATA PROCESSING
- G06F11/00—Error detection; Error correction; Monitoring
- G06F11/30—Monitoring
- G06F11/34—Recording or statistical evaluation of computer activity, e.g. of down time, of input/output operation ; Recording or statistical evaluation of user activity, e.g. usability assessment
- G06F11/3452—Performance evaluation by statistical analysis
-
- G—PHYSICS
- G06—COMPUTING OR CALCULATING; COUNTING
- G06F—ELECTRIC DIGITAL DATA PROCESSING
- G06F11/00—Error detection; Error correction; Monitoring
- G06F11/30—Monitoring
- G06F11/34—Recording or statistical evaluation of computer activity, e.g. of down time, of input/output operation ; Recording or statistical evaluation of user activity, e.g. usability assessment
- G06F11/3466—Performance evaluation by tracing or monitoring
- G06F11/3495—Performance evaluation by tracing or monitoring for systems
-
- G—PHYSICS
- G06—COMPUTING OR CALCULATING; COUNTING
- G06F—ELECTRIC DIGITAL DATA PROCESSING
- G06F2201/00—Indexing scheme relating to error detection, to error correction, and to monitoring
- G06F2201/875—Monitoring of systems including the internet
Definitions
- the present disclosure relates to a field of computer technology, in particular to a field of cloud platform and other technologies.
- interfaces have become bridges for communications between various services. It is important to monitor an interface performance, so that a business system may provide stable services.
- JMeter In a related art, JMeter, LoadRunner and other stress testing tools are used to monitor the interface performance. In a stress testing process, interface response times are recorded, and an average value of the interface response times is used as a reference. Alternatively, Prometheus and other monitoring tools may be used to monitor the interface performance.
- the stress testing tools are generally limited to a stress testing phase, failing to continuously monitor an online system.
- Prometheus and other monitoring tools may only monitor interface response times for a single instance.
- the tools are more suitable for a monolithic architecture, an active-standby architecture and other simple system architectures, but it is difficult to apply the tools to a distributed application cluster.
- a method and apparatus of monitoring an interface performance of a distributed application, a device and a storage medium there is provided a method and apparatus of monitoring an interface performance of a distributed application, a device and a storage medium.
- a method of monitoring an interface performance of a distributed application including: in case of detecting a caller request for calling an interface of the distributed application, obtaining a performance data of the interface for responding the caller request; updating a performance data distribution characteristic of the interface according to the performance data of the interface for responding the caller request, so as to obtain an updated performance data distribution characteristic; and monitoring the interface performance of the distributed application, according to the updated performance data distribution characteristic of the interface.
- an apparatus of monitoring an interface performance of a distributed application including an obtaining module, an updating module and a monitoring module.
- the obtaining module is configured to, in case of detecting a caller request for calling an interface of the distributed application, obtain a performance data of the interface for responding the caller request.
- the updating module is configured to update a performance data distribution characteristic of the interface according to the performance data of the interface for responding the caller request, so as to obtain an updated performance data distribution characteristic.
- the monitoring module is configured to monitor the interface performance of the distributed application, according to the updated performance data distribution characteristic of the interface.
- an electronic device including: at least one processor; and a memory communicatively connected to the at least one processor, wherein the memory stores instructions executable by the at least one processor, and the instructions, when executed by the at least one processor, cause the at least one processor to implement the method as described above.
- a non-transitory computer-readable storage medium having computer instructions stored thereon, wherein the computer instructions allow a computer to implement the method as described above.
- a computer program product including computer programs, and the computer programs, when executed by a processor, implement the method as described above.
- a distributed architecture is a mainstream architecture for an information system.
- the distributed architecture is widely used in various technology systems such as mobile Internet, cloud computing, big data, Internet of Things, etc.
- the distributed architecture is a basic technology in the information age.
- an interface is a basic unit for application service.
- An information system based on the distributed system may have tens of thousands to hundreds of millions of interface calls every day, producing TB level monitoring data, and leading to a challenge in designing a monitoring system.
- a method and apparatus of monitoring an interface performance of a distributed application, an electronic device and a storage medium there is provided a method and apparatus of monitoring an interface performance of a distributed application, an electronic device and a storage medium.
- the method of monitoring an interface performance of a distributed application includes following operations. In case of detecting a caller request for calling an interface of the distributed application, a performance data of the interface for responding the caller request is obtained. A performance data distribution characteristic of the interface is updated according to the performance data of the interface for responding the caller request, so as to obtain an updated performance data distribution characteristic. The interface performance of the distributed application is monitored, according to the updated performance data distribution characteristic of the interface.
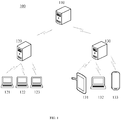
- FIG. 1 schematically shows an exemplary system architecture that may apply a method and apparatus of monitoring an interface performance of a distributed application according to the embodiments of the present disclosure.
- FIG. 1 is only an example of a system architecture that may apply the embodiments of the present disclosure to help those skilled in the art understand the technical content of the disclosure, but it does not mean that the embodiments of the present disclosure may not be used for other devices, systems, environments or scenarios.
- the system architecture 100 may include distributed servers 110, 120, 130, terminal devices 121, 122, 123, and terminal devices 131, 132, 133.
- the server 110 may be communicatively connected to the server 120 and the server 130.
- the terminal devices 121, 122, 123 may be communicatively connected to the server 120.
- the terminal devices 131, 132, 133 may be communicatively connected to the server 130.
- the communicative connections above may include various connection types, such as wired communication links and/or wireless communication links, etc.
- the terminal devices 121, 122, 123, and the terminal devices 131, 132, 133 may have various communication client applications installed, such as knowledge reading applications, web browser applications, search applications, instant messaging tools, mailbox clients and/or social platform software (examples only).
- the terminal devices 121, 122, 123 and the terminal devices 131, 132, 133 may be various electronic devices having display screens and supporting web browsing, including but not limited to smartphones, tablets, laptop computers, desktop computers, etc.
- the servers 110, 120, 130 may be servers providing various services, such as background management servers (example only) supporting content browsed by users using the terminal devices.
- the background management servers may analyze and process user requests and other data received, and feedback processing results (such as web pages, information, or data acquired or generated according to the user requests) to the terminal devices.
- FIG. 1 the numbers of the terminal devices, networks, and servers in FIG. 1 are only schematic. There may be any numbers of terminal devices, networks and servers as needed.
- FIG. 2 schematically shows a flowchart of a method of monitoring an interface performance of a distributed application according to the embodiments of the present disclosure.
- the method includes operations S210 to S230.
- a performance data distribution characteristic of the interface is updated according to the performance data of the interface for responding the caller request, so as to obtain an updated performance data distribution characteristic.
- the interface performance of the distributed application is monitored, according to the updated performance data distribution characteristic of the interface.
- the performance data includes but is not limited to a response interval data, a request data amount data, a concurrency data, a SQL execution number, a cache hit number, a downstream service call number, a log print number, etc.
- the performance data distribution characteristic is a summary for the performance data of the interface, and may be used to approximate a tantile, an average value, etc.
- the data distribution characteristic may be a data structure satisfying one or more of: describing a distribution structure of original data samples; capable of receiving a new data sample to adjust a data distribution (i.e. merging); meeting an associative law (i.e., a plurality of data distributions may be combined into a global data distribution); capable of estimating an approximate tantile of the original data samples by using the data distribution; having a constant memory space with a controllable accuracy.
- the performance data of the interface for the call is acquired, and then the performance data distribution characteristic of the interface is updated.
- the embodiments of the present disclosure tends to integrate with other monitors.
- a distributed monitoring is implemented at an application level most.
- the embodiments of the disclosure implement an interface interception at an application layer. In this way, it tends to integrate with other performance monitoring tools, link monitoring tools, etc.
- FIG. 3 schematically shows a diagram of obtaining the performance data of the interface for responding the caller request according to the embodiments of the present disclosure.
- the new performance data is merged with a previous performance data distribution characteristic of the interface, and the updated performance data distribution characteristic of the interface is obtained using a merging algorithm.
- the data distribution there are many specific implementations of the data distribution, including but not limited to a histogram, a T-Digest algorithm, a Q-Digest algorithm, a DK algorithm, etc., and there is no limitation on the specific implementation of the data distribution.
- a tantile for the interface when monitoring the interface performance of the distributed application according to the updated performance data distribution characteristic of the interface, may be determined according to the updated performance data distribution characteristic of the interface, and the interface performance of the distributed application may be monitored based on the tantile.
- An accuracy of the tantile depends on a selection of a data distribution algorithm. With an appropriate selection and design, the accuracy may achieve about 0.1% in practice.
- the embodiments of the present disclosure it is possible to monitor the interface performance of a large-scale distributed application, especially to monitor the tantile of the interface response times, and statistical information may be accurate to each interface.
- the embodiments of the present disclosure may solve a monitoring complexity caused by characteristics of the distributed system itself, and effectively monitor the interface performance of the distributed system. This is suitable for an online system, and is not limited to a testing phase.
- FIG. 4 schematically shows a diagram of a logical data structure of the histogram according to the embodiments of the present disclosure.
- the histogram is taken as an example of the data distribution.
- the histogram contains several buckets, and each bucket contains a lower boundary and an upper boundary.
- the upper boundary of the bucket and the lower boundary of the bucket determine a number of the original data samples within this interval.
- the interface response time is taken as an example of the sample data.
- the interface response time has strong bias (that is, most interface calls return in a short time, and few calls return in a long time). Therefore, if the bucket interval is closer to 0, then the interval is smaller, and the accuracy is higher; and if the response interval is higher, then the bucket is sparser, and the accuracy is lower.
- the bucket may be increased by a step length of 3%.
- a data storage structure of the performance data distribution characteristic may be an array structure int [] stored in a memory.
- int histogram[N]; N a number of the buckets.
- Each item in the array represents a bucket, and a value of each item in the array represents a number of data samples contained in the bucket.
- histogram [83] 108 means that there are values of 108 data samples in an interval (99-101) of the 83rd bucket.
- histograms in all instances of a distributed application have the same structure, so that the histograms may be merged. Every time a new data sample (for example, an interface response time) is acquired, a bucket is found from the histogram to contain a value of the new data sample between the upper boundary of the bucket and the lower boundary of the bucket. Then a value of the bucket is increased by one. In this manner, the performance data distribution characteristic is updated.
- a new data sample for example, an interface response time
- an algorithm for estimating a tantile P% using the histogram is as follows.
- the tantile P% is a bucket interval corresponding to bucket histogram[k], and the lower boundary of bucket histogram[k] is regarded as the estimated tantile (if bucket histogram[k] is 535-551, then the tantile P% is 535).
- a histogram may be stored for each interface separately to record the performance data of the interface.
- a process of merging a local histogram may include following operations. The data samples are received. A corresponding interface information is found. An interface performance data histogram is updated. The local histogram is uploaded and cleared regularly.
- the response interval data is taken as an example of the performance data.
- Obtaining the performance data of the interface for responding the caller request in case of detecting the caller request for calling the interface of the distributed application includes following operations. In case of detecting the caller request for calling the interface of the distributed application, a start calling moment of the interface is recorded. An end calling moment of the interface is recorded. The performance data of the interface for responding the caller request is determined according to the start calling moment and the end calling moment.
- the start calling moment may be subtracted from the end calling moment to obtain the response interval data.
- the response interval data is used as the performance data of the interface for responding the caller request.
- FIG. 5 the method shown in FIG. 2 may be further described in combination with specific embodiments.
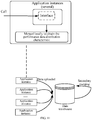
- FIG. 5 schematically shows a diagram of obtaining the performance data of the interface for responding the caller request according to the embodiments of the present disclosure.
- a caller 501 initiates an interface call, for calling an interface 503 of the distributed application.
- interception codes 502 are used to intercept each interface of the application.
- a monitoring logic is implemented before the interface is executed and after the interface is executed, recording the start calling moment of the interface and the end calling moment of the interface, so as to calculate a response time difference of the interface.
- the response time difference is transmitted to a merging logic 504, so that the merging logic 504 may merge and update according to the original data distribution characteristic and the response time difference obtained.
- interception codes 502 may be realized by manual embedding, Java bytecode enhancement, etc.
- updating the performance data distribution characteristic of the interface according to the performance data of the interface for responding the caller request includes following operations.
- a performance data distribution characteristic corresponding to an interface identification of the interface is determined from a merged item storage data structure, according to the interface identification of the interface.
- the merged item storage data structure contains a plurality of interface identifications and a performance data distribution characteristic corresponding to each of the plurality of interface identifications.
- the performance data distribution characteristic of the interface is updated in the merged item storage data structure, according to the performance data of the interface for responding the caller request.
- monitored data of all instances in a cluster may be converged into the application level for observation, by using the merged item storage data structure.
- a discreteness of a bottom layer in the distributed system may be shielded, and interface performance indexes of the distributed application may be monitored visually and globally.
- the merged item storage data structure may satisfy a mapping relationship between the interface identification and the corresponding performance data distribution characteristic.
- the merged item storage data structure may include but not limited to a table, a hash map, a binary search list, etc.
- the merged item storage data structure may be a HashMap data structure in Java.
- Each application instance i.e. the distributed application
- the table may be used to store the data distribution of each interface, as shown in Table 1.
- Table 1 The performance data distributions of several interfaces are recorded in Table 1.
- Table 1 may further include an application name, and may record a start merging moment of the data distribution of each interface, a merging period of the data distribution of each interface, etc.
- a row corresponding to the interface is found in the table above first, according to the interface identification.
- the new performance data (such as a response time of a current call) may be merged into the data distribution corresponding to the interface identification.
- a new merged item for the interface identification of the interface is created in the merged item storage data structure, so as to update the performance data distribution characteristic of the interface in the merged item storage data structure based on the new merged item.
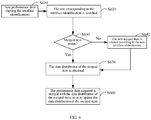
- FIG. 6 schematically shows a flowchart of updating the performance data distribution characteristic in the merged item storage data structure according to the embodiments of the present disclosure.
- the method includes operations S610 to S660.
- the merged item storage data structure is traversed according to the interface identification, so as to search the row corresponding to the interface identification (also called merged item).
- the performance data acquired is merged with the data distribution of the merged item, so as to update the data distribution of the merged item.
- the distributed application may record each interface and the performance data distribution of each interface locally. Every time a preset monitor duration (such as the merging period in Table 1) is elapsed, all contents in the merged item storage data structure are transmitted to a data warehouse, and the merged item storage data structure is cleared locally.
- a preset monitor duration such as the merging period in Table 1
- monitoring the interface performance of the distributed application may include following operations. If the preset monitor duration is elapsed, then the merged item storage data structure is transmitted to the data warehouse. The merged item storage data structure stored in the distributed application locally is removed.
- a stress is shared on the terminal by merging in the distributed application locally.
- a high-concurrency scenario may be carried, and local storage resources may be saved.
- the preset monitor duration may be set as needed.
- the preset monitor duration may be 10 minutes, 1 hour, 2 hours, etc.
- data in the merged item storage data structure when transmitted to the data warehouse, data in the merged item storage data structure may further be serialized.
- FIG. 7 schematically shows a flowchart of transmitting the merged item storage data structure to the data warehouse according to the embodiments of the present disclosure.
- the method includes operations S710 to S750.
- the preset monitor duration is elapsed.
- operation S750 if the row is the last row in the merged item storage data structure, all data is packaged and transmitted to the data warehouse. If the row is not the last row in the merged item storage data structure, operation S720 is re-performed.
- the data may be processed using a little endian. If the data warehouse is realized by C/C++, the little endian may be used for the serialization. In the little endian of an x86 architecture, the serialized data may keep a consistent format, providing convenience for C/C++ parsing. If the data warehouse is realized by Java or other big endian data warehouse, then the little endian may not be adopted.
- the performance data distribution characteristic may be the distribution characteristic of the interface response time. Since the response time data of the interface generally has strong bias, there may be a large number of zeros in the merged item storage data structure.
- a compression may compress a data volume, reducing network transmissions and storage resource occupation.
- Specific compression algorithm may include GZIP, BZIP2, etc.
- the data itself in the merged item storage data structure may be in a binary format.
- the data may be encoded into a text format using algorithms such as BASE64, making it convenient for transmitting, storing and debugging.
- the distributed application includes a plurality of interfaces. Monitoring the interface performance of the distributed application, according to the updated performance data distribution characteristic of the interface includes following operations. If the preset monitor duration is elapsed, current performance data distribution characteristics of each of the plurality of interfaces are transmitted to the data warehouse. All performance data distribution characteristics stored in the distributed application locally are removed.
- the stress is shared on the terminal by merging in the distributed application locally.
- a high-concurrency scenario may be carried.
- a multi-level merging method may control the data amount effectively and carry massive data of the large-scale distributed system.
- the response time is taken as an example of the performance data.
- the local data distributions are uploaded to the data warehouse every time a merging interval (i.e., the preset monitor duration) is elapsed. Then the local data distributions are cleared.
- monitoring in the application level may be realized, which is not limited to a single application instance.
- a performance fluctuation of the distributed application may be perceived intuitively.
- the data distributions uploaded by each application instance may be merged secondarily according to the interface identifications.
- a global data distribution may be merged for each interface, so as to calculate a global tantile for the interface.
- the data warehouse stores performance data distribution characteristic tables of all interfaces in the distributed system.
- a structure of the performance data distribution characteristic table may be shown in Table 2.
- the data warehouse stores performance data distribution characteristics transmitted by one or more distributed applications in the distributed system. Performance data distribution characteristics for the same interface transmitted by each distributed application in the distributed system merged, so as to obtain a merged performance data distribution characteristic for the same interface.
- a monitor carrying capacity of the large-scale distributed system is designed through the multi-level merging and the data compression, and high performance may be realized.
- Table 2 Name Type Meaning Example app String An application of the data distribution app1 method String A method of the data distribution com.baidu.app1.Foo.doSomething() quantile_data Data distribution object A data distribution content H4sIAAAAAAAAAF2TX0hTU log_date Date A recording moment 2020-10-14 18:00:00
- tantile monitoring system Due to the difficulty in the implementation of the tantile, it is difficult to find a tantile monitoring system, tantile monitoring function or tantile monitoring service to meet the requirements of monitoring the distributed application.
- the tantile has a high sensitivity to the interface performance, and tantile data is worthy in a performance analysis. Therefore, a tantile monitoring technology needs to be developed to meet the requirements of the distributed system.
- the tantile for each of the plurality of interfaces in the distributed system may be determined according to the merged performance data distribution characteristic for the same interface.
- a tantile index is more sensitive to a fluctuation of the response time, and the tantile index tends to sense an existence of a system instability.
- FIG. 8 schematically shows a flowchart of merging response time data distribution characteristics for the same interface transmitted by each distributed application and determining a tantile according to the embodiments of the present disclosure.
- the method includes operations S810 to S850.
- the data warehouse are filtered to obtain response time data distribution characteristics uploaded from each application instance.
- a tantile P is estimated by an algorithm using the data distribution after the secondary merging.
- the method of monitoring the interface performance provided by the embodiments of the present disclosure may be applied to monitor the interface performance in the application level.
- determining the tantile for each of the plurality of interfaces in the distributed system, according to the merged performance data distribution characteristic for the same interface includes following operations.
- a target value of a target interface input in a query by a user is acquired.
- a tantile corresponding to the target value is determined, according to the merged performance data distribution characteristic for the same interface.
- query of any tantile may be supported (that is, the target value of the target interface input by the user in the query is supported).
- Tantile calculating technologies may only query a fixed tantile calculated in advance.
- the embodiments of the present disclosure supports an online query of any tantile, and it is convenient to compare optimization effects of different tantiles. Without additional cost, the user is allowed to query any tantile, and effects and profits of different tantiles are compared when monitoring the performance. An error of the monitoring data may achieve about 0.1%, ensuring a reliability of the monitoring data.
- the tantile may be calculated without introducing an additional computing cluster, saving computing resources, relatively easy to be implemented, and reducing development and maintenance costs.
- any tantile may be queried according to the tantile specified by the user in the query.
- a GROUP BY operation may be performed using the application name app and the method (i.e. interface) of the data distribution as a key to merge the performance data distribution characteristics of the same group.
- a distributed data warehouse supporting UDAF (user defined aggregate function) should be selected so that a secondary merging algorithm may be implemented in the data warehouse and take full advantage of the computing resources of the data warehouse.
- UDAF user defined aggregate function
- Apache Doris supports UDAF functions written in C++ and Hive supports UDAF functions written in Java.
- the data warehouse may include a front end node, query nodes and a main query node.
- the front end node is used to manage cluster metadata, receive a query, analyze the query, and plan the query.
- the query node is used to store specific data and implement a specific query.
- the main query node is used to summarize query results from each query node in a query process, and return a final result.
- FIG. 9 schematically shows a flowchart of querying the tantile based on the data warehouse according to the embodiments of the present disclosure.
- the UDAF function is directly written to calculate the response time tantile of a certain interface of an application, according to the structure of the data warehouse above and a specific interface of the data warehouse.
- the UDAF function usually works in a GROUP BY clause of SQL or other merging scenarios.
- Some common UDAF functions include SUM(), COUNT(), etc.
- the UDAF function implemented by the algorithm in the embodiments of the present disclosure takes the interface of the application as the key to group, analyzes and merges all time-consuming histogram data in the group to estimate the tantile.
- the method includes operations S910 to S940.
- performance data distribution characteristics are grouped according to applications and interfaces.
- the tantile is estimated using the UDAF function in the group based on the query node, the main query node, etc.
- the histogram is taken as an example of the performance data distribution characteristic.
- the "init” runs on each query node of the distributed data warehouse for an initialization.
- the “init” is used to initialize a data structure of a merging target on the query node locally.
- a null histogram is created on each query node.
- the "update" is used to sequentially traverse each row in the query node locally, and merge data of the row into the target.
- the histogram data is decoded by BASE64 first.
- a GZIP decompression is performed to obtain a histogram object.
- a merging operation for the histogram is used to merge the histogram object into the target histogram.
- the "serialize" is used after the local merging of each query node has completed.
- a merging result of each query node may be transmitted to the main query node for a result merging. Therefore, the serialization should be implemented by each query node, so that the binary histogram data is transmitted to the main query node accurately and may be parsed accurately.
- the algorithm adopts a histogram data structure without pointers, so that the data may be transmitted directly. If a UDAF function implemented in Java or a C/C++ data structure having pointers is used, then a serialization format should be designed manually.
- each query node transmits a local-merged histogram, and the main node merges all the histograms into one histogram in the merging operation.
- the "finalize” is used to obtain a final result using a final merging result by the main query node.
- the global tantile of the interface is estimated by using the histogram obtained after the "merge”.
- FIG. 10 schematically shows a flowchart of querying the tantile by using the UDAF function according to the embodiments of the present disclosure.
- the method includes operations S1001 to S1010.
- the "init” is used to acquire a query tantile P specified by the user.
- the "update" is used to parse data in a current row into a histogram object and merge the histogram object into the merging target.
- operation S1006 it is determined whether the current row is the last row or not. If the current row is the last row, then operation S1007 is performed. If the current row is not the last row, operation S1004 is re-performed.
- the "serialize” is used to serialize the merging results into the binary format and transmit the serialized merging results to the main query node.
- the "merge” is used to generate a histogram by the main query node, according to the merging results uploaded by all the query nodes.
- the "finalize” is used to perform an estimation on the histogram and calculate the tantile p according to the query tantile P specified.
- the response time tantile for each interface is finally obtained using the process of the UDAF function above.
- Different tantiles may be specified for each query. Thus, any tantile may be queried every time. It should be noted that obtaining the response time tantile is only an illustrative embodiment.
- Other types of tantiles such as a data amount tantile, a concurrency tantile, a SQL execution number tantile, a cache hit number tantile, a downstream service call number tantile, and a log print number tantile
- other than the response time tantile may further be obtained using the method of the embodiments of the present disclosure.
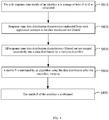
- FIG. 11 schematically shows a flowchart of a method of monitoring an interface performance of a distributed application according to the embodiments of the present disclosure.
- the interface call is intercepted to obtain the performance data of the interface, such as the response interval of the interface, a response data amount of the interface, the cache hit number of the interface, etc.
- the intercepted performance data is merged into the original performance data distribution characteristic.
- all application instances may upload the local performance data distribution characteristics to the data warehouse, and clear the local performance data distribution characteristics.
- the secondary merging may be performed at the data warehouse terminal.
- a function that may identify the data structure of the performance data distribution characteristic may be written manually, to perform the secondary merging.
- the merged performance data distribution characteristic for the same interface may be obtained.
- the interface call is intercepted from a service application, and the response interval of each interface call is counted.
- the data distribution is merged locally in the service application instance, thereby compressing the data amount.
- each application instance uploads the local-merged data to the data warehouse to perform the secondary merging at the data warehouse terminal to obtain the merged performance data distribution characteristic for the same interface.
- FIG. 12 schematically shows a block diagram of an apparatus of monitoring an interface performance of a distributed application according to the embodiments of the present disclosure.
- the apparatus 1200 of monitoring an interface performance of a distributed application includes an obtaining module 1210, an updating module 1220, and a monitoring module 1230.
- the obtaining module 1210 is used to obtain a performance data of the interface for responding the caller request in case of detecting a caller request for calling an interface of the distributed application.
- the updating module 1220 is used to update a performance data distribution characteristic of the interface according to the performance data of the interface for responding the caller request, so as to obtain an updated performance data distribution characteristic.
- the monitoring module 1230 is used to monitor the interface performance of the distributed application, according to the updated performance data distribution characteristic of the interface.
- the embodiments of the present disclosure it is possible to monitor an interface performance of a large-scale distributed application, especially to monitor the tantile of the interface response times, and statistical information may be accurate to each interface.
- the embodiments of the present disclosure may solve a monitoring complexity caused by characteristics of the distributed system itself, and effectively monitor the interface performance of the distributed system. This is suitable for an online system, and is not limited to a testing phase.
- the updating module includes a first determining unit and an updating unit.
- the first determining unit is used to determine a performance data distribution characteristic corresponding to an interface identification of the interface from a merged item storage data structure, according to the interface identification of the interface.
- the merged item storage data structure contains a plurality of interface identifications and a performance data distribution characteristic corresponding to each of the plurality of interface identifications.
- the updating unit is used to update the performance data distribution characteristic of the interface in the merged item storage data structure, according to the performance data of the interface for responding the caller request.
- monitored data of all instances in a cluster may be converged into the application level for observation, by using the merged item storage data structure.
- a discreteness of a bottom layer in the distributed system may be shielded, and interface performance indexes of the distributed application may be monitored visually and globally.
- the updating module further includes a creating unit.
- the creating unit is used to create, if the merged item storage data structure does not include the interface identification of the interface, a new merged item for the interface identification of the interface in the merged item storage data structure, so as to update the performance data distribution characteristic of the interface in the merged item storage data structure based on the new merged item.
- the monitoring module includes a first transmitting unit and a first removing unit.
- the first transmitting unit is used to transmit the merged item storage data structure to a data warehouse if a preset monitor duration is elapsed.
- the first removing unit is used to remove the merged item storage data structure stored in the distributed application locally.
- the distributed application comprises a plurality of interfaces
- the monitoring module includes a second transmitting unit and a second removing unit.
- the second transmitting unit is used to transmit current performance data distribution characteristics of each of the plurality of interfaces to a data warehouse if a preset monitor duration is elapsed.
- the second removing unit is used to remove all performance data distribution characteristics stored in the distributed application locally.
- the data warehouse stores performance data distribution characteristics transmitted by one or more distributed applications in a distributed system.
- the apparatus 1200 of monitoring an interface performance of a distributed application further includes a merging module and a determining module.
- the merging module is used to merge performance data distribution characteristics for the same interface transmitted by each distributed application in the distributed system, so as to obtain a merged performance data distribution characteristic for the same interface.
- the determining module is used to determine a tantile for said each of the plurality of interfaces in the distributed system, according to the merged performance data distribution characteristic for the same interface.
- the determining module includes an acquiring unit and a second determining unit.
- the acquiring unit is used to acquire a target value of a target interface input in a query by a user.
- the second determining unit is used to determine a tantile corresponding to the target value, according to the merged performance data distribution characteristic for the same interface.
- the obtaining module includes a first recording unit, a second recording unit and a third determining unit.
- the first recording unit is used to record a start calling moment of the interface in case of detecting the caller request for calling the interface of the distributed application.
- the second recording unit is used to record an end calling moment of the interface.
- the third determining unit is used to determine the performance data of the interface for responding the caller request according to the start calling moment and the end calling moment.
- the present disclosure further provides an electronic device, a readable storage medium and a computer program product.
- the electronic device includes at least one processor; and a memory communicatively connected to the at least one processor.
- the memory stores instructions executable by the at least one processor.
- the instructions being executed by the at least one processor, causing the at least one processor to implement the method of monitoring an interface performance of a distributed application as described above.
- a non-transitory computer-readable storage medium having computer instructions stored thereon.
- the computer instructions allow a computer to implement the method of monitoring an interface performance of a distributed application as described above.
- the computer program product includes computer programs, and the computer programs, when executed by a processor, implement the method of monitoring an interface performance of a distributed application as described above.
- the embodiments of the present disclosure it is possible to monitor the interface performance of a large-scale distributed application, especially to monitor the tantile of the interface response times, and statistical information may be accurate to each interface.
- the embodiments of the present disclosure may solve a monitoring complexity caused by characteristics of the distributed system itself, and effectively monitor the interface performance of the distributed system. This is suitable for an online system, and is not limited to a testing phase.
- FIG. 13 schematically shows a block diagram of an exemplary electronic device 1300 that may be used to implement the embodiments of the present disclosure.
- the electronic device is intended to represent various forms of digital computers, such as a laptop computer, a desktop computer, a workstation, a personal digital assistant, a server, a blade server, a mainframe computer, and other suitable computers.
- the electronic device may further represent various forms of mobile devices, such as a personal digital assistant, a cellular phone, a smart phone, a wearable device, and other similar computing devices.
- the components as illustrated herein, and connections, relationships, and functions thereof are merely examples, and are not intended to limit the implementation of the present disclosure described and/or required herein.
- the device 1300 includes a computing unit 1301, which may execute various appropriate actions and processing according to computer programs stored in a read only memory (ROM) 1302 or computer programs loaded into a random access memory (RAM) 1303 from a storage unit 1308.
- Various programs and data required for operations of the device 1300 may further be stored in the RAM 1303.
- the computing unit 1301, the ROM 1302 and the RAM 1303 are connected to each other through a bus 1304.
- An input/output (I/O) interface 1305 is further connected to the bus 1304.
- a plurality of components in the device 1300 are connected to the I/O interface 1305, including: an input unit 1306, such as a keyboard, a mouse, etc.; an output unit 1307, such as various types of displays, speakers, etc.; the storage unit 1308, such as a magnetic disk, an optical disk, etc.; and a communication unit 1309, such as a network card, a modem, a wireless communication transceiver, etc.
- the communication unit 1309 allows the device 1300 to exchange information/data with other devices through a computer network such as the Internet and/or various telecommunication networks.
- the computing unit 1301 may be various general-purpose and/or special-purpose processing assemblies having processing and computing capabilities. Examples of the computing unit 1301 include but are not limited to a central processing unit (CPU), a graphics processing unit (GPU), various special-purpose artificial intelligence (AI) computing chips, various computing units running machine learning model algorithms, digital signal processing (DSP), and any appropriate processor, controller, microcontroller, etc.
- the computing unit 1301 implements the various methods and processes described above, for example, the method of monitoring an interface performance of a distributed application.
- the method of monitoring an interface performance of a distributed application may be implemented as computer software programs, which is tangibly contained in a machine-readable medium, such as the storage unit 1308.
- part of the computer programs or all of the computer programs may be loaded and/or installed on the device 1300 via the ROM 1302 and/or the communication unit 1309.
- the computer programs When the computer programs are loaded into the RAM 1303 and executed by the computing unit 1301, one or more operations of the method of monitoring an interface performance of a distributed application described above may be executed.
- the computing unit 1301 may be configured to implement the method of monitoring an interface performance of a distributed application in any other suitable manner (for example, by means of firmware).
- Various implementations of the systems and technologies described above may be implemented in digital electronic circuit systems, integrated circuit systems, field programmable gate arrays (FPGA), application specific integrated circuits (ASIC), application-specific standard products (ASSP), systems on a chip (SOC), complex programmable logic devices (CPLD), computer hardware, firmware, software, and/or a combination thereof.
- FPGA field programmable gate arrays
- ASIC application specific integrated circuits
- ASSP application-specific standard products
- SOC systems on a chip
- CPLD complex programmable logic devices
- computer hardware firmware, software, and/or a combination thereof.
- the programmable processor may be a special-purpose programmable processor or a general-purpose programmable processor that may receive data and instructions from a storage system, at least one input device, and at least one output device, and may transmit data and instructions to a storage system, at least one input device, and at least one output device.
- Program codes for implementing the method of the present disclosure may be written in any combination of one or more programming languages. These program codes may be provided to processors or controllers of general-purpose computers, special-purpose computers, or other programmable data processing devices, so that the program codes, when executed by the processors or controllers, implement the functions/operations specified in the flowcharts and/or block diagrams.
- the program codes may be executed on a machine entirely, executed on a machine partly, executed on a machine partly as an independent software package and executed on a remote machine partly, or executed on a remote machine or server entirely.
- the machine-readable medium may be a tangible medium, which may contain or store programs used by an instruction execution system, an instruction execution apparatus, or an instruction execution device or used in combination with the instruction execution system, the instruction execution apparatus, or the instruction execution device.
- the machine-readable medium may be a machine-readable signal medium or a machine-readable storage medium.
- the machine-readable medium may include, but is not limited to, an electronic, magnetic, optical, electromagnetic, infrared, or semiconductor system, apparatus, or device, or any suitable combination thereof.
- machine-readable storage media may include electrical connections based on one or more wires, portable computer disks, hard disks, random access memories (RAM), read only memories (ROM), erasable programmable read only memories (EPROM or flash memory), optical fibers, portable compact disk read only memory (CD-ROM), optical storage device, magnetic storage device, or any suitable combination of the above.
- RAM random access memories
- ROM read only memories
- EPROM or flash memory erasable programmable read only memories
- CD-ROM portable compact disk read only memory
- magnetic storage device or any suitable combination of the above.
- a computer including a display device (for example, a CRT (cathode ray tube) or LCD (liquid crystal display) monitor) for displaying information to the user, and a keyboard and a pointing device (for example, a mouse or a trackball) through which the user may provide the input to the computer.
- a display device for example, a CRT (cathode ray tube) or LCD (liquid crystal display) monitor
- a keyboard and a pointing device for example, a mouse or a trackball
- Other types of devices may also be used to provide interaction with users.
- a feedback provided to the user may be any form of sensory feedback (for example, visual feedback, auditory feedback, or tactile feedback), and the input from the user may be received in any form (including acoustic input, voice input or tactile input).
- the systems and technologies described herein may be implemented in a computing system including back-end components (for example, a data server), or a computing system including middleware components (for example, an application server), or a computing system including front-end components (for example, a user computer having a graphical user interface or web browser through which the user may interact with the implementation of the systems and technologies described herein), or a computing system including any combination of such back-end components, middleware components or front-end components.
- the components of the system may be connected to each other by digital data communication (for example, a communication network) in any form or through any medium. Examples of the communication network include a local area network (LAN), a wide area network (WAN), and Internet.
- LAN local area network
- WAN wide area network
- Internet Internet
- the computer system may include a client and a server.
- the client and the server are generally far away from each other and usually interact through a communication network.
- the relationship between the client and the server is generated through computer programs running on the corresponding computers and having a client-server relationship with each other.
- steps of the processes illustrated above may be reordered, added or deleted in various manners.
- the steps described in the present disclosure may be performed in parallel, sequentially, or in a different order, as long as a desired result of the technical solution of the present disclosure may be achieved. This is not limited in the present disclosure.
Landscapes
- Engineering & Computer Science (AREA)
- Theoretical Computer Science (AREA)
- General Engineering & Computer Science (AREA)
- Physics & Mathematics (AREA)
- Quality & Reliability (AREA)
- General Physics & Mathematics (AREA)
- Computing Systems (AREA)
- Computer Hardware Design (AREA)
- Mathematical Physics (AREA)
- Computer Vision & Pattern Recognition (AREA)
- Evolutionary Biology (AREA)
- Probability & Statistics with Applications (AREA)
- Bioinformatics & Computational Biology (AREA)
- Bioinformatics & Cheminformatics (AREA)
- Life Sciences & Earth Sciences (AREA)
- Debugging And Monitoring (AREA)
Abstract
Description
- The present disclosure relates to a field of computer technology, in particular to a field of cloud platform and other technologies.
- With a continuous development of computer technology, interfaces have become bridges for communications between various services. It is important to monitor an interface performance, so that a business system may provide stable services.
- In a related art, JMeter, LoadRunner and other stress testing tools are used to monitor the interface performance. In a stress testing process, interface response times are recorded, and an average value of the interface response times is used as a reference. Alternatively, Prometheus and other monitoring tools may be used to monitor the interface performance.
- However, the stress testing tools are generally limited to a stress testing phase, failing to continuously monitor an online system. Prometheus and other monitoring tools may only monitor interface response times for a single instance. The tools are more suitable for a monolithic architecture, an active-standby architecture and other simple system architectures, but it is difficult to apply the tools to a distributed application cluster.
- According to the present disclosure, there is provided a method and apparatus of monitoring an interface performance of a distributed application, a device and a storage medium.
- According to an aspect of the present disclosure, there is provided a method of monitoring an interface performance of a distributed application, including: in case of detecting a caller request for calling an interface of the distributed application, obtaining a performance data of the interface for responding the caller request; updating a performance data distribution characteristic of the interface according to the performance data of the interface for responding the caller request, so as to obtain an updated performance data distribution characteristic; and monitoring the interface performance of the distributed application, according to the updated performance data distribution characteristic of the interface.
- According to another aspect of the present disclosure, there is provided an apparatus of monitoring an interface performance of a distributed application, including an obtaining module, an updating module and a monitoring module.
- The obtaining module is configured to, in case of detecting a caller request for calling an interface of the distributed application, obtain a performance data of the interface for responding the caller request.
- The updating module is configured to update a performance data distribution characteristic of the interface according to the performance data of the interface for responding the caller request, so as to obtain an updated performance data distribution characteristic.
- The monitoring module is configured to monitor the interface performance of the distributed application, according to the updated performance data distribution characteristic of the interface.
- According to another aspect of the present disclosure, there is provided an electronic device, including: at least one processor; and a memory communicatively connected to the at least one processor, wherein the memory stores instructions executable by the at least one processor, and the instructions, when executed by the at least one processor, cause the at least one processor to implement the method as described above.
- According to another aspect of the present disclosure, there is provided a non-transitory computer-readable storage medium having computer instructions stored thereon, wherein the computer instructions allow a computer to implement the method as described above.
- According to another aspect of the present disclosure, there is provided a computer program product including computer programs, and the computer programs, when executed by a processor, implement the method as described above.
- It should be understood that the content described in this part is not intended to identify critical features or important features of the embodiments of the present disclosure, and it is not intended to limit the scope of the present disclosure. Other features of the present disclosure will become easily understood by the following description.
- The accompanying drawings are used to better understand the solution and do not constitute a limitation to the present disclosure, in which:
-
FIG. 1 schematically shows an exemplary system architecture that may apply a method and apparatus of monitoring an interface performance of a distributed application according to the embodiments of the present disclosure; -
FIG. 2 schematically shows a flowchart of a method of monitoring an interface performance of a distributed application according to the embodiments of the present disclosure; -
FIG. 3 schematically shows a diagram of obtaining a performance data of an interface for responding a caller request according to the embodiments of the present disclosure; -
FIG. 4 schematically shows a diagram of a logical data structure of a histogram according to the embodiments of the present disclosure; -
FIG. 5 schematically shows a diagram of obtaining the performance data of the interface for responding the caller request according to the embodiments of the present disclosure; -
FIG. 6 schematically shows a flowchart of updating a performance data distribution characteristic in a merged item storage data structure according to the embodiments of the present disclosure; -
FIG. 7 schematically shows a flowchart of transmitting the merged item storage data structure to a data warehouse according to the embodiments of the present disclosure; -
FIG. 8 schematically shows a flowchart of merging response time data distribution characteristics for the same interface transmitted by each distributed application and determining a tantile according to the embodiments of the present disclosure; -
FIG. 9 schematically shows a flowchart of querying the tantile based on the data warehouse according to the embodiments of the present disclosure; -
FIG. 10 schematically shows a flowchart of querying the tantile by using a UDAF function according to the embodiments of the present disclosure; -
FIG. 11 schematically shows a flowchart of a method of monitoring an interface performance of a distributed application according to the embodiments of the present disclosure; -
FIG. 12 schematically shows a block diagram of an apparatus of monitoring an interface performance of a distributed application according to the embodiments of the present disclosure; and -
FIG. 13 schematically shows a block diagram of an exemplary electronic device that may be used to implement the embodiments of the present disclosure. - The exemplary embodiments of the present disclosure are described below with reference to the drawings, which include various details of the embodiments of the present disclosure to facilitate understanding, and which should be considered as merely illustrative. Therefore, those ordinary skilled in the art should realize that various changes and modifications may be made to the embodiments described herein without departing from the scope and spirit of the present disclosure. In addition, for clarity and conciseness, descriptions of well-known functions and structures are omitted in the following description.
- A distributed architecture is a mainstream architecture for an information system. The distributed architecture is widely used in various technology systems such as mobile Internet, cloud computing, big data, Internet of Things, etc. The distributed architecture is a basic technology in the information age. In the distributed architecture, an interface is a basic unit for application service. An information system based on the distributed system may have tens of thousands to hundreds of millions of interface calls every day, producing TB level monitoring data, and leading to a challenge in designing a monitoring system.
- In a process of realizing the present disclosure, it is found that there is no good monitoring scheme for monitoring an interface performance of a distributed application. Furthermore, monitoring a tantile of interface response times is a difficulty in analyzing the interface performance.
- According to the embodiments of the present disclosure, there is provided a method and apparatus of monitoring an interface performance of a distributed application, an electronic device and a storage medium.
- The method of monitoring an interface performance of a distributed application includes following operations. In case of detecting a caller request for calling an interface of the distributed application, a performance data of the interface for responding the caller request is obtained. A performance data distribution characteristic of the interface is updated according to the performance data of the interface for responding the caller request, so as to obtain an updated performance data distribution characteristic. The interface performance of the distributed application is monitored, according to the updated performance data distribution characteristic of the interface.
-
FIG. 1 schematically shows an exemplary system architecture that may apply a method and apparatus of monitoring an interface performance of a distributed application according to the embodiments of the present disclosure. - It should be noted that
FIG. 1 is only an example of a system architecture that may apply the embodiments of the present disclosure to help those skilled in the art understand the technical content of the disclosure, but it does not mean that the embodiments of the present disclosure may not be used for other devices, systems, environments or scenarios. - As shown in
FIG. 1 , thesystem architecture 100 according to the embodiments may includedistributed servers terminal devices terminal devices server 110 may be communicatively connected to theserver 120 and theserver 130. Theterminal devices server 120. Theterminal devices server 130. - According to the embodiments of the present disclosure, the communicative connections above may include various connection types, such as wired communication links and/or wireless communication links, etc.
- The
terminal devices terminal devices - The
terminal devices terminal devices - The
servers - It should be understood that the numbers of the terminal devices, networks, and servers in
FIG. 1 are only schematic. There may be any numbers of terminal devices, networks and servers as needed. -
FIG. 2 schematically shows a flowchart of a method of monitoring an interface performance of a distributed application according to the embodiments of the present disclosure. - As shown in
FIG. 2 , the method includes operations S210 to S230. - In operation S210, in case of detecting a caller request for calling an interface of the distributed application, a performance data of the interface for responding the caller request is obtained.
- In operation S220, a performance data distribution characteristic of the interface is updated according to the performance data of the interface for responding the caller request, so as to obtain an updated performance data distribution characteristic.
- In operation S230, the interface performance of the distributed application is monitored, according to the updated performance data distribution characteristic of the interface.
- According to the embodiments of the present disclosure, there is no limitation on a type of performance data. For example, the performance data includes but is not limited to a response interval data, a request data amount data, a concurrency data, a SQL execution number, a cache hit number, a downstream service call number, a log print number, etc.
- According to the embodiments of the present disclosure, the performance data distribution characteristic is a summary for the performance data of the interface, and may be used to approximate a tantile, an average value, etc. The data distribution characteristic may be a data structure satisfying one or more of: describing a distribution structure of original data samples; capable of receiving a new data sample to adjust a data distribution (i.e. merging); meeting an associative law (i.e., a plurality of data distributions may be combined into a global data distribution); capable of estimating an approximate tantile of the original data samples by using the data distribution; having a constant memory space with a controllable accuracy.
- According to the embodiments of the present disclosure, every time an interface call is intercepted, the performance data of the interface for the call is acquired, and then the performance data distribution characteristic of the interface is updated.
- According to the embodiments of the present disclosure, it tends to integrate with other monitors. A distributed monitoring is implemented at an application level most. The embodiments of the disclosure implement an interface interception at an application layer. In this way, it tends to integrate with other performance monitoring tools, link monitoring tools, etc.
-
FIG. 3 schematically shows a diagram of obtaining the performance data of the interface for responding the caller request according to the embodiments of the present disclosure. - As shown in
FIG. 3 , after a new performance data of the interface is obtained, the new performance data is merged with a previous performance data distribution characteristic of the interface, and the updated performance data distribution characteristic of the interface is obtained using a merging algorithm. - According to the embodiments of the present disclosure, there are many specific implementations of the data distribution, including but not limited to a histogram, a T-Digest algorithm, a Q-Digest algorithm, a DK algorithm, etc., and there is no limitation on the specific implementation of the data distribution.
- According to the embodiments of the present disclosure, when monitoring the interface performance of the distributed application according to the updated performance data distribution characteristic of the interface, a tantile for the interface may be determined according to the updated performance data distribution characteristic of the interface, and the interface performance of the distributed application may be monitored based on the tantile. An accuracy of the tantile depends on a selection of a data distribution algorithm. With an appropriate selection and design, the accuracy may achieve about 0.1% in practice.
- According to the embodiments of the present disclosure, it is possible to monitor the interface performance of a large-scale distributed application, especially to monitor the tantile of the interface response times, and statistical information may be accurate to each interface. The embodiments of the present disclosure may solve a monitoring complexity caused by characteristics of the distributed system itself, and effectively monitor the interface performance of the distributed system. This is suitable for an online system, and is not limited to a testing phase.
-
FIG. 4 schematically shows a diagram of a logical data structure of the histogram according to the embodiments of the present disclosure. - As shown in
FIG. 4 , the histogram is taken as an example of the data distribution. The histogram contains several buckets, and each bucket contains a lower boundary and an upper boundary. The upper boundary of the bucket and the lower boundary of the bucket determine a number of the original data samples within this interval. - The interface response time is taken as an example of the sample data. The interface response time has strong bias (that is, most interface calls return in a short time, and few calls return in a long time). Therefore, if the bucket interval is closer to 0, then the interval is smaller, and the accuracy is higher; and if the response interval is higher, then the bucket is sparser, and the accuracy is lower. According to the embodiments of the present disclosure, the bucket may be increased by a step length of 3%.
0 , 1 , 2 , 3 , 4 , 5 , 6 , 7 , 8 , 9 , 10 , 11 , 12 , 13 , 14 , 15 , 16 , 17 , 18 , 19 , 20 , 21 , 22 , 23 , 24 , 25 , 26 , 27 , 28 , 29 , 30 , 31 , 32 , 33 , 34 , 35 , 36 , 37 , 38 , 39 , 40 , 41 , 42 , 43 , 44 , 45 , 46 , 47 , 48 , 49 , 50 , 51 , 52 , 53 , 54 , 55 , 56 , 57 , 58 , 59 , 60 , 61 , 62 , 63 , 64 , 65 , 66 , 67 ,
69 , 71 , 73 , 75 , 77 , 79 , 81 , 83 , 85 , 87 , 89 , 91 , 93 , 95 , 97 , 99 , 101 , 104 , 107 , 110 , 113 , 116 , 119 , 122 , 125 , 128 , 131 , 134 , 138 , 142 , 146 , 150 , 154 , 158 , 162 , 166 , 170 , 175 , 180 , 185 , 190 , 195 , 200 , 206 , 212 , 218 , 224 , 230 , 236 , 243 , 250 , 257 , 264 , ...... (increased by a step length of 3%) 300000 - According to the embodiments of the present disclosure, a data storage structure of the performance data distribution characteristic may be an array structure int [] stored in a memory. For example:
int histogram[N]; N = a number of the buckets. - Each item in the array represents a bucket, and a value of each item in the array represents a number of data samples contained in the bucket. For example:
histogram [83] = 108 means that there are values of 108 data samples in an interval (99-101) of the 83rd bucket. - According to the embodiments of the present disclosure, histograms in all instances of a distributed application have the same structure, so that the histograms may be merged. Every time a new data sample (for example, an interface response time) is acquired, a bucket is found from the histogram to contain a value of the new data sample between the upper boundary of the bucket and the lower boundary of the bucket. Then a value of the bucket is increased by one. In this manner, the performance data distribution characteristic is updated.
- According to the embodiments of the present disclosure, an algorithm for estimating a tantile P% using the histogram is as follows.
- First, a sum of the value of each bucket in the histogram is calculated, that is, a total number of the data samples is calculated, by: total = sum (histogram [i]); i=0...N.
- Then, how many values of the data samples are smaller than the P%-th value of the data samples is calculated by: count = total ∗ P%.
- Next, the value of each bucket in the histogram is accumulated from a head of the histogram to a tail of the histogram and the sum is identified as s, until the sum satisfies s ≥ count after the k-th bucket is accumulated. Pseudo codes are shown as follows.
- s=0, i=0
- while(s < count)
- s += histogram[i]
- i++
- end
- k=i
- Thus, the tantile P% is a bucket interval corresponding to bucket histogram[k], and the lower boundary of bucket histogram[k] is regarded as the estimated tantile (if bucket histogram[k] is 535-551, then the tantile P% is 535).
- According to the embodiments of the present disclosure, a histogram may be stored for each interface separately to record the performance data of the interface. A process of merging a local histogram may include following operations. The data samples are received. A corresponding interface information is found. An interface performance data histogram is updated. The local histogram is uploaded and cleared regularly.
- According to the embodiments of the present disclosure, the response interval data is taken as an example of the performance data. Obtaining the performance data of the interface for responding the caller request in case of detecting the caller request for calling the interface of the distributed application includes following operations. In case of detecting the caller request for calling the interface of the distributed application, a start calling moment of the interface is recorded. An end calling moment of the interface is recorded. The performance data of the interface for responding the caller request is determined according to the start calling moment and the end calling moment.
- According to the embodiments of the present disclosure, the start calling moment may be subtracted from the end calling moment to obtain the response interval data. The response interval data is used as the performance data of the interface for responding the caller request.
- Referring to
FIG. 5 , the method shown inFIG. 2 may be further described in combination with specific embodiments. -
FIG. 5 schematically shows a diagram of obtaining the performance data of the interface for responding the caller request according to the embodiments of the present disclosure. - As shown in
FIG. 5 , acaller 501 initiates an interface call, for calling aninterface 503 of the distributed application. - According to the embodiments of the present disclosure, in an interface interception phase,
interception codes 502 are used to intercept each interface of the application. A monitoring logic is implemented before the interface is executed and after the interface is executed, recording the start calling moment of the interface and the end calling moment of the interface, so as to calculate a response time difference of the interface. Then, the response time difference is transmitted to a merginglogic 504, so that the merginglogic 504 may merge and update according to the original data distribution characteristic and the response time difference obtained. - According to the embodiments of the present disclosure, specific technologies of the
interception codes 502 may be realized by manual embedding, Java bytecode enhancement, etc. - According to the embodiments of the present disclosure, updating the performance data distribution characteristic of the interface according to the performance data of the interface for responding the caller request includes following operations. A performance data distribution characteristic corresponding to an interface identification of the interface is determined from a merged item storage data structure, according to the interface identification of the interface. The merged item storage data structure contains a plurality of interface identifications and a performance data distribution characteristic corresponding to each of the plurality of interface identifications. The performance data distribution characteristic of the interface is updated in the merged item storage data structure, according to the performance data of the interface for responding the caller request.
- According to the embodiments of the present disclosure, monitored data of all instances in a cluster may be converged into the application level for observation, by using the merged item storage data structure. Thus, a discreteness of a bottom layer in the distributed system may be shielded, and interface performance indexes of the distributed application may be monitored visually and globally.
- According to the embodiments of the present disclosure, there is no limitation on a form of the merged item storage data structure, as long as the data structure may satisfy a mapping relationship between the interface identification and the corresponding performance data distribution characteristic. The merged item storage data structure, may include but not limited to a table, a hash map, a binary search list, etc. Specifically, the merged item storage data structure may be a HashMap data structure in Java.
- Each application instance (i.e. the distributed application) in the distributed system contains several interfaces. For each interface, the performance data distribution should be recorded respectively. According to the embodiments of the present disclosure, the table may be used to store the data distribution of each interface, as shown in Table 1.
Table 1 Application name : app1 Instance : instance1 (10.20.30.40) Start merging moment : 2020-10-10 18:00:00 Merging period : 1h Interface identification (only as an example) Performance data distribution com.baidu.app1.Foo.doSomethino() <data distribution> com.baidu.app1.Bar.doSomething() <data distribution> com.baidu.app1.Cool.dosomething() <data distribution> ...... - The performance data distributions of several interfaces are recorded in Table 1. In addition, Table 1 may further include an application name, and may record a start merging moment of the data distribution of each interface, a merging period of the data distribution of each interface, etc.
- When a new performance data is collected, a row corresponding to the interface is found in the table above first, according to the interface identification. Next, the new performance data (such as a response time of a current call) may be merged into the data distribution corresponding to the interface identification.
- According to the embodiments of the present disclosure, if the interface identification of the interface is not included in the merged item storage data structure, then a new merged item for the interface identification of the interface is created in the merged item storage data structure, so as to update the performance data distribution characteristic of the interface in the merged item storage data structure based on the new merged item.
-
FIG. 6 schematically shows a flowchart of updating the performance data distribution characteristic in the merged item storage data structure according to the embodiments of the present disclosure. - As shown in
FIG. 6 , the method includes operations S610 to S660. - In operation S610, the performance data having the interface identification is acquired.
- In operation S620, the merged item storage data structure is traversed according to the interface identification, so as to search the row corresponding to the interface identification (also called merged item).
- In operation S630, it is determined whether the merged item exists in the merged item storage data structure or not.
- In operation S640, if the merged item does not exist in the merged item storage data structure, then the new merged item is created according to the new interface identification, and the data distribution of the merged item is null.
- In operation S650, if the merged item exists in the merged item storage data structure, then the data distribution of the merged item is obtained.
- In operation S660, the performance data acquired is merged with the data distribution of the merged item, so as to update the data distribution of the merged item.
- According to the embodiments of the present disclosure, the distributed application may record each interface and the performance data distribution of each interface locally. Every time a preset monitor duration (such as the merging period in Table 1) is elapsed, all contents in the merged item storage data structure are transmitted to a data warehouse, and the merged item storage data structure is cleared locally.
- According to the embodiments of the present disclosure, monitoring the interface performance of the distributed application, according to the updated performance data distribution characteristic of the interface may include following operations. If the preset monitor duration is elapsed, then the merged item storage data structure is transmitted to the data warehouse. The merged item storage data structure stored in the distributed application locally is removed.
- According to the embodiments of the present disclosure, a stress is shared on the terminal by merging in the distributed application locally. Thus, a high-concurrency scenario may be carried, and local storage resources may be saved.
- According to the embodiments of the present disclosure, the preset monitor duration may be set as needed. For example, the preset monitor duration may be 10 minutes, 1 hour, 2 hours, etc.
- According to the embodiments of the present disclosure, when the merged item storage data structure is transmitted to the data warehouse, data in the merged item storage data structure may further be serialized.
-
FIG. 7 schematically shows a flowchart of transmitting the merged item storage data structure to the data warehouse according to the embodiments of the present disclosure. - As shown in
FIG. 7 , the method includes operations S710 to S750. - In operation S710, the preset monitor duration is elapsed.
- In operation S720, data in a row of the merged item storage data structure is acquired.
- In operation S730, the data in the row is serialized into a transmissible format.
- In operation S740, it is determined whether the row is the last row in the merged item storage data structure or not.
- In operation S750, if the row is the last row in the merged item storage data structure, all data is packaged and transmitted to the data warehouse. If the row is not the last row in the merged item storage data structure, operation S720 is re-performed.
- According to the embodiments of the present disclosure, in operation S730, the data may be processed using a little endian. If the data warehouse is realized by C/C++, the little endian may be used for the serialization. In the little endian of an x86 architecture, the serialized data may keep a consistent format, providing convenience for C/C++ parsing. If the data warehouse is realized by Java or other big endian data warehouse, then the little endian may not be adopted.
- According to the embodiments of the present disclosure, the performance data distribution characteristic may be the distribution characteristic of the interface response time. Since the response time data of the interface generally has strong bias, there may be a large number of zeros in the merged item storage data structure. In this case, a compression may compress a data volume, reducing network transmissions and storage resource occupation. Specific compression algorithm may include GZIP, BZIP2, etc.
- According to the embodiments of the present disclosure, the data itself in the merged item storage data structure may be in a binary format. The data may be encoded into a text format using algorithms such as BASE64, making it convenient for transmitting, storing and debugging.
- According to the embodiments of the present disclosure, the distributed application includes a plurality of interfaces. Monitoring the interface performance of the distributed application, according to the updated performance data distribution characteristic of the interface includes following operations. If the preset monitor duration is elapsed, current performance data distribution characteristics of each of the plurality of interfaces are transmitted to the data warehouse. All performance data distribution characteristics stored in the distributed application locally are removed.
- According to the embodiments of the present disclosure, the stress is shared on the terminal by merging in the distributed application locally. Thus, a high-concurrency scenario may be carried. At the same time, a multi-level merging method may control the data amount effectively and carry massive data of the large-scale distributed system.
- According to the embodiments of the present disclosure, the response time is taken as an example of the performance data. After the intercepted response times are merged into the data distributions, the local data distributions are uploaded to the data warehouse every time a merging interval (i.e., the preset monitor duration) is elapsed. Then the local data distributions are cleared.
- According to the embodiments of the present disclosure, monitoring in the application level may be realized, which is not limited to a single application instance. Thus, a performance fluctuation of the distributed application may be perceived intuitively.
- According to the embodiments of the present disclosure, at the data warehouse terminal, the data distributions uploaded by each application instance may be merged secondarily according to the interface identifications. A global data distribution may be merged for each interface, so as to calculate a global tantile for the interface.
- According to the embodiments of the present disclosure, the data warehouse stores performance data distribution characteristic tables of all interfaces in the distributed system. For example, a structure of the performance data distribution characteristic table may be shown in Table 2.
- According to the embodiments of the present disclosure, the data warehouse stores performance data distribution characteristics transmitted by one or more distributed applications in the distributed system. Performance data distribution characteristics for the same interface transmitted by each distributed application in the distributed system merged, so as to obtain a merged performance data distribution characteristic for the same interface.
- According to the embodiments of the present disclosure, a monitor carrying capacity of the large-scale distributed system is designed through the multi-level merging and the data compression, and high performance may be realized.
Table 2 Name Type Meaning Example app String An application of the data distribution app1 method String A method of the data distribution com.baidu.app1.Foo.doSomething() quantile_data Data distribution object A data distribution content H4sIAAAAAAAAAF2TX0hTU log_date Date A recording moment 2020-10-14 18:00:00 - In the process of realizing the present disclosure, it is found that there are limitations to monitor the tantile of the interface using relevant technologies, failing to monitor a distributed application in a cluster deployment. Moreover, there are relatively high requirements for computing resources when monitoring. Therefore, it is difficult to adapt to a balance of performance and profits in the monitoring of the large-scale system.
- Due to the difficulty in the implementation of the tantile, it is difficult to find a tantile monitoring system, tantile monitoring function or tantile monitoring service to meet the requirements of monitoring the distributed application. The tantile has a high sensitivity to the interface performance, and tantile data is worthy in a performance analysis. Therefore, a tantile monitoring technology needs to be developed to meet the requirements of the distributed system.
- According to the embodiments of the present disclosure, after obtaining the performance data distribution characteristic of the interface, the tantile for each of the plurality of interfaces in the distributed system may be determined according to the merged performance data distribution characteristic for the same interface.
- According to the embodiments of the present disclosure, compared with an average value and other indexes, a tantile index is more sensitive to a fluctuation of the response time, and the tantile index tends to sense an existence of a system instability.
-
FIG. 8 schematically shows a flowchart of merging response time data distribution characteristics for the same interface transmitted by each distributed application and determining a tantile according to the embodiments of the present disclosure. - As shown in
FIG. 8 , the method includes operations S810 to S850. - In operation S810, for an interface a, the p-th response time tantile in a period of time t1 to t2 is calculated.
- In operation S820, the data warehouse are filtered to obtain response time data distribution characteristics uploaded from each application instance.
- In operation S830, all response time data distribution characteristics obtained by filtering are merged secondarily into a data distribution by a merging algorithm.
- In operation S840, a tantile P is estimated by an algorithm using the data distribution after the secondary merging.
- In operation S850, the tantile P of the interface a is obtained.
- According to the embodiments of the present disclosure, the method of monitoring the interface performance provided by the embodiments of the present disclosure may be applied to monitor the interface performance in the application level.
- According to the embodiments of the present disclosure, determining the tantile for each of the plurality of interfaces in the distributed system, according to the merged performance data distribution characteristic for the same interface includes following operations. A target value of a target interface input in a query by a user is acquired. A tantile corresponding to the target value is determined, according to the merged performance data distribution characteristic for the same interface.
- According to the embodiments of the present disclosure, query of any tantile may be supported (that is, the target value of the target interface input by the user in the query is supported). Tantile calculating technologies may only query a fixed tantile calculated in advance. Compared with this, the embodiments of the present disclosure supports an online query of any tantile, and it is convenient to compare optimization effects of different tantiles. Without additional cost, the user is allowed to query any tantile, and effects and profits of different tantiles are compared when monitoring the performance. An error of the monitoring data may achieve about 0.1%, ensuring a reliability of the monitoring data.
- According to the embodiments of the present disclosure, the tantile may be calculated without introducing an additional computing cluster, saving computing resources, relatively easy to be implemented, and reducing development and maintenance costs. According to the embodiments of the present disclosure, any tantile may be queried according to the tantile specified by the user in the query.
- According to the embodiments of the present disclosure, in order to calculate the tantile of the interface, a GROUP BY operation may be performed using the application name app and the method (i.e. interface) of the data distribution as a key to merge the performance data distribution characteristics of the same group.
- In order to implement a user-defined GROUP BY function, a distributed data warehouse supporting UDAF (user defined aggregate function) should be selected so that a secondary merging algorithm may be implemented in the data warehouse and take full advantage of the computing resources of the data warehouse. For example, Apache Doris supports UDAF functions written in C++ and Hive supports UDAF functions written in Java.
- According to the embodiments of the present disclosure, the data warehouse may include a front end node, query nodes and a main query node.
- The front end node is used to manage cluster metadata, receive a query, analyze the query, and plan the query.
- The query node is used to store specific data and implement a specific query.
- The main query node is used to summarize query results from each query node in a query process, and return a final result.
-
FIG. 9 schematically shows a flowchart of querying the tantile based on the data warehouse according to the embodiments of the present disclosure. - According to the embodiments of the present disclosure, the UDAF function is directly written to calculate the response time tantile of a certain interface of an application, according to the structure of the data warehouse above and a specific interface of the data warehouse. The UDAF function usually works in a GROUP BY clause of SQL or other merging scenarios. Some common UDAF functions include SUM(), COUNT(), etc. The UDAF function implemented by the algorithm in the embodiments of the present disclosure takes the interface of the application as the key to group, analyzes and merges all time-consuming histogram data in the group to estimate the tantile.
- As shown in
FIG. 9 , the method includes operations S910 to S940. - In operation S910, the tantile for the interface is queried.
- In operation S920, performance data distribution characteristics are grouped according to applications and interfaces.
- In operation S930, the tantile is estimated using the UDAF function in the group based on the query node, the main query node, etc.
- In operation S940, the tantile for the interface is obtained.
- According to the embodiments of the present disclosure, the histogram is taken as an example of the performance data distribution characteristic. To estimate the tantile through the histogram using the UDSF function, it generally needs: init, update, serialize, merge, and finalize. Specific processes are as follows.
- The "init" runs on each query node of the distributed data warehouse for an initialization. The "init" is used to initialize a data structure of a merging target on the query node locally. In the initialization, a null histogram is created on each query node.
- The "update" is used to sequentially traverse each row in the query node locally, and merge data of the row into the target. In the algorithm of the embodiments of the present disclosure, the histogram data is decoded by BASE64 first. Next, a GZIP decompression is performed to obtain a histogram object. Then, a merging operation for the histogram is used to merge the histogram object into the target histogram.
- The "serialize" is used after the local merging of each query node has completed. In this case, a merging result of each query node may be transmitted to the main query node for a result merging. Therefore, the serialization should be implemented by each query node, so that the binary histogram data is transmitted to the main query node accurately and may be parsed accurately. In practice, the algorithm adopts a histogram data structure without pointers, so that the data may be transmitted directly. If a UDAF function implemented in Java or a C/C++ data structure having pointers is used, then a serialization format should be designed manually.
- After the main query node receives the merging results transmitted by each query node, the "merge" is used to further merge the merging results into one result. In the algorithm of the embodiments of the present disclosure, each query node transmits a local-merged histogram, and the main node merges all the histograms into one histogram in the merging operation.
- The "finalize" is used to obtain a final result using a final merging result by the main query node.
- The global tantile of the interface is estimated by using the histogram obtained after the "merge".
-
FIG. 10 schematically shows a flowchart of querying the tantile by using the UDAF function according to the embodiments of the present disclosure. - As shown in
FIG. 10 , the method includes operations S1001 to S1010. - In operation S1001, the "init" is used to acquire a query tantile P specified by the user.
- In operation S1002, a null histogram object is created as the merging target.
- In operation S1003, all data in a row meeting a requirement are selected according to a query time range.
- In operation S1004, data in a subsequent row is obtained.
- In operation S1005, the "update" is used to parse data in a current row into a histogram object and merge the histogram object into the merging target.
- In operation S1006, it is determined whether the current row is the last row or not. If the current row is the last row, then operation S1007 is performed. If the current row is not the last row, operation S1004 is re-performed.
- In operation S1007, the merging results on the query nodes are obtained.
- In operation S1008, the "serialize" is used to serialize the merging results into the binary format and transmit the serialized merging results to the main query node.
- In operation S1009, the "merge" is used to generate a histogram by the main query node, according to the merging results uploaded by all the query nodes.
- In operation S1010, the "finalize" is used to perform an estimation on the histogram and calculate the tantile p according to the query tantile P specified.
- The response time tantile for each interface is finally obtained using the process of the UDAF function above. Different tantiles may be specified for each query. Thus, any tantile may be queried every time. It should be noted that obtaining the response time tantile is only an illustrative embodiment. Other types of tantiles (such as a data amount tantile, a concurrency tantile, a SQL execution number tantile, a cache hit number tantile, a downstream service call number tantile, and a log print number tantile) other than the response time tantile may further be obtained using the method of the embodiments of the present disclosure.
-
FIG. 11 schematically shows a flowchart of a method of monitoring an interface performance of a distributed application according to the embodiments of the present disclosure. - As shown in
FIG. 11 , when the caller requests for calling the interface of the application instance, the interface call is intercepted to obtain the performance data of the interface, such as the response interval of the interface, a response data amount of the interface, the cache hit number of the interface, etc. The intercepted performance data is merged into the original performance data distribution characteristic. - According to the embodiments of the present disclosure, every time the merging interval is elapsed, all application instances may upload the local performance data distribution characteristics to the data warehouse, and clear the local performance data distribution characteristics.
- According to the embodiments of the present disclosure, the secondary merging may be performed at the data warehouse terminal. A function that may identify the data structure of the performance data distribution characteristic may be written manually, to perform the secondary merging. The merged performance data distribution characteristic for the same interface may be obtained.
- According to the embodiments of the present disclosure, the interface call is intercepted from a service application, and the response interval of each interface call is counted. Next, the data distribution is merged locally in the service application instance, thereby compressing the data amount. Then, each application instance uploads the local-merged data to the data warehouse to perform the secondary merging at the data warehouse terminal to obtain the merged performance data distribution characteristic for the same interface.
-
FIG. 12 schematically shows a block diagram of an apparatus of monitoring an interface performance of a distributed application according to the embodiments of the present disclosure. - As shown in
FIG. 12 , theapparatus 1200 of monitoring an interface performance of a distributed application includes an obtainingmodule 1210, anupdating module 1220, and amonitoring module 1230. - The obtaining
module 1210 is used to obtain a performance data of the interface for responding the caller request in case of detecting a caller request for calling an interface of the distributed application. - The
updating module 1220 is used to update a performance data distribution characteristic of the interface according to the performance data of the interface for responding the caller request, so as to obtain an updated performance data distribution characteristic. - The
monitoring module 1230 is used to monitor the interface performance of the distributed application, according to the updated performance data distribution characteristic of the interface. - According to the embodiments of the present disclosure, it is possible to monitor an interface performance of a large-scale distributed application, especially to monitor the tantile of the interface response times, and statistical information may be accurate to each interface. The embodiments of the present disclosure may solve a monitoring complexity caused by characteristics of the distributed system itself, and effectively monitor the interface performance of the distributed system. This is suitable for an online system, and is not limited to a testing phase.
- According to the embodiments of the present disclosure, the updating module includes a first determining unit and an updating unit.
- The first determining unit is used to determine a performance data distribution characteristic corresponding to an interface identification of the interface from a merged item storage data structure, according to the interface identification of the interface. The merged item storage data structure contains a plurality of interface identifications and a performance data distribution characteristic corresponding to each of the plurality of interface identifications.
- The updating unit is used to update the performance data distribution characteristic of the interface in the merged item storage data structure, according to the performance data of the interface for responding the caller request.
- According to the embodiments of the present disclosure, monitored data of all instances in a cluster may be converged into the application level for observation, by using the merged item storage data structure. Thus, a discreteness of a bottom layer in the distributed system may be shielded, and interface performance indexes of the distributed application may be monitored visually and globally.
- According to the embodiments of the present disclosure, the updating module further includes a creating unit. The creating unit is used to create, if the merged item storage data structure does not include the interface identification of the interface, a new merged item for the interface identification of the interface in the merged item storage data structure, so as to update the performance data distribution characteristic of the interface in the merged item storage data structure based on the new merged item.
- According to the embodiments of the present disclosure, the monitoring module includes a first transmitting unit and a first removing unit.
- The first transmitting unit is used to transmit the merged item storage data structure to a data warehouse if a preset monitor duration is elapsed.
- The first removing unit is used to remove the merged item storage data structure stored in the distributed application locally.
- According to the embodiments of the present disclosure, the distributed application comprises a plurality of interfaces, and the monitoring module includes a second transmitting unit and a second removing unit.
- The second transmitting unit is used to transmit current performance data distribution characteristics of each of the plurality of interfaces to a data warehouse if a preset monitor duration is elapsed.
- The second removing unit is used to remove all performance data distribution characteristics stored in the distributed application locally.
- According to the embodiments of the present disclosure, the data warehouse stores performance data distribution characteristics transmitted by one or more distributed applications in a distributed system. The
apparatus 1200 of monitoring an interface performance of a distributed application further includes a merging module and a determining module. - The merging module is used to merge performance data distribution characteristics for the same interface transmitted by each distributed application in the distributed system, so as to obtain a merged performance data distribution characteristic for the same interface.
- The determining module is used to determine a tantile for said each of the plurality of interfaces in the distributed system, according to the merged performance data distribution characteristic for the same interface.
- According to the embodiments of the present disclosure, the determining module includes an acquiring unit and a second determining unit.
- The acquiring unit is used to acquire a target value of a target interface input in a query by a user.
- The second determining unit is used to determine a tantile corresponding to the target value, according to the merged performance data distribution characteristic for the same interface.
- According to the embodiments of the present disclosure, the obtaining module includes a first recording unit, a second recording unit and a third determining unit.
- The first recording unit is used to record a start calling moment of the interface in case of detecting the caller request for calling the interface of the distributed application.
- The second recording unit is used to record an end calling moment of the interface.
- The third determining unit is used to determine the performance data of the interface for responding the caller request according to the start calling moment and the end calling moment.
- According to the embodiments of the present disclosure, the present disclosure further provides an electronic device, a readable storage medium and a computer program product.
- According to the embodiments of the present disclosure, the electronic device includes at least one processor; and a memory communicatively connected to the at least one processor. The memory stores instructions executable by the at least one processor. When the instructions being executed by the at least one processor, causing the at least one processor to implement the method of monitoring an interface performance of a distributed application as described above.
- According to the embodiments of the present disclosure, there is provided a non-transitory computer-readable storage medium having computer instructions stored thereon. The computer instructions allow a computer to implement the method of monitoring an interface performance of a distributed application as described above.
- According to the embodiments of the present disclosure, the computer program product includes computer programs, and the computer programs, when executed by a processor, implement the method of monitoring an interface performance of a distributed application as described above.
- According to the embodiments of the present disclosure, it is possible to monitor the interface performance of a large-scale distributed application, especially to monitor the tantile of the interface response times, and statistical information may be accurate to each interface. The embodiments of the present disclosure may solve a monitoring complexity caused by characteristics of the distributed system itself, and effectively monitor the interface performance of the distributed system. This is suitable for an online system, and is not limited to a testing phase.
-
FIG. 13 schematically shows a block diagram of an exemplaryelectronic device 1300 that may be used to implement the embodiments of the present disclosure. The electronic device is intended to represent various forms of digital computers, such as a laptop computer, a desktop computer, a workstation, a personal digital assistant, a server, a blade server, a mainframe computer, and other suitable computers. The electronic device may further represent various forms of mobile devices, such as a personal digital assistant, a cellular phone, a smart phone, a wearable device, and other similar computing devices. The components as illustrated herein, and connections, relationships, and functions thereof are merely examples, and are not intended to limit the implementation of the present disclosure described and/or required herein. - As shown in
FIG. 13 , thedevice 1300 includes acomputing unit 1301, which may execute various appropriate actions and processing according to computer programs stored in a read only memory (ROM) 1302 or computer programs loaded into a random access memory (RAM) 1303 from astorage unit 1308. Various programs and data required for operations of thedevice 1300 may further be stored in theRAM 1303. Thecomputing unit 1301, theROM 1302 and theRAM 1303 are connected to each other through abus 1304. An input/output (I/O)interface 1305 is further connected to thebus 1304. - A plurality of components in the
device 1300 are connected to the I/O interface 1305, including: aninput unit 1306, such as a keyboard, a mouse, etc.; anoutput unit 1307, such as various types of displays, speakers, etc.; thestorage unit 1308, such as a magnetic disk, an optical disk, etc.; and acommunication unit 1309, such as a network card, a modem, a wireless communication transceiver, etc. Thecommunication unit 1309 allows thedevice 1300 to exchange information/data with other devices through a computer network such as the Internet and/or various telecommunication networks. - The
computing unit 1301 may be various general-purpose and/or special-purpose processing assemblies having processing and computing capabilities. Examples of thecomputing unit 1301 include but are not limited to a central processing unit (CPU), a graphics processing unit (GPU), various special-purpose artificial intelligence (AI) computing chips, various computing units running machine learning model algorithms, digital signal processing (DSP), and any appropriate processor, controller, microcontroller, etc. Thecomputing unit 1301 implements the various methods and processes described above, for example, the method of monitoring an interface performance of a distributed application. For example, in some embodiments, the method of monitoring an interface performance of a distributed application may be implemented as computer software programs, which is tangibly contained in a machine-readable medium, such as thestorage unit 1308. In some embodiments, part of the computer programs or all of the computer programs may be loaded and/or installed on thedevice 1300 via theROM 1302 and/or thecommunication unit 1309. When the computer programs are loaded into theRAM 1303 and executed by thecomputing unit 1301, one or more operations of the method of monitoring an interface performance of a distributed application described above may be executed. Optionally, in other embodiments, thecomputing unit 1301 may be configured to implement the method of monitoring an interface performance of a distributed application in any other suitable manner (for example, by means of firmware). - Various implementations of the systems and technologies described above may be implemented in digital electronic circuit systems, integrated circuit systems, field programmable gate arrays (FPGA), application specific integrated circuits (ASIC), application-specific standard products (ASSP), systems on a chip (SOC), complex programmable logic devices (CPLD), computer hardware, firmware, software, and/or a combination thereof. These various embodiments may include: the systems and technologies being implemented in one or more computer programs. The one or more computer programs may be executed and/or interpreted on a programmable system including at least one programmable processor. The programmable processor may be a special-purpose programmable processor or a general-purpose programmable processor that may receive data and instructions from a storage system, at least one input device, and at least one output device, and may transmit data and instructions to a storage system, at least one input device, and at least one output device.
- Program codes for implementing the method of the present disclosure may be written in any combination of one or more programming languages. These program codes may be provided to processors or controllers of general-purpose computers, special-purpose computers, or other programmable data processing devices, so that the program codes, when executed by the processors or controllers, implement the functions/operations specified in the flowcharts and/or block diagrams. The program codes may be executed on a machine entirely, executed on a machine partly, executed on a machine partly as an independent software package and executed on a remote machine partly, or executed on a remote machine or server entirely.
- In the context of the present disclosure, the machine-readable medium may be a tangible medium, which may contain or store programs used by an instruction execution system, an instruction execution apparatus, or an instruction execution device or used in combination with the instruction execution system, the instruction execution apparatus, or the instruction execution device. The machine-readable medium may be a machine-readable signal medium or a machine-readable storage medium. The machine-readable medium may include, but is not limited to, an electronic, magnetic, optical, electromagnetic, infrared, or semiconductor system, apparatus, or device, or any suitable combination thereof. More specific examples of the machine-readable storage media may include electrical connections based on one or more wires, portable computer disks, hard disks, random access memories (RAM), read only memories (ROM), erasable programmable read only memories (EPROM or flash memory), optical fibers, portable compact disk read only memory (CD-ROM), optical storage device, magnetic storage device, or any suitable combination of the above.
- In order to provide interaction with the user, the systems and technologies described here may be implemented on a computer including a display device (for example, a CRT (cathode ray tube) or LCD (liquid crystal display) monitor) for displaying information to the user, and a keyboard and a pointing device (for example, a mouse or a trackball) through which the user may provide the input to the computer. Other types of devices may also be used to provide interaction with users. For example, a feedback provided to the user may be any form of sensory feedback (for example, visual feedback, auditory feedback, or tactile feedback), and the input from the user may be received in any form (including acoustic input, voice input or tactile input).
- The systems and technologies described herein may be implemented in a computing system including back-end components (for example, a data server), or a computing system including middleware components (for example, an application server), or a computing system including front-end components (for example, a user computer having a graphical user interface or web browser through which the user may interact with the implementation of the systems and technologies described herein), or a computing system including any combination of such back-end components, middleware components or front-end components. The components of the system may be connected to each other by digital data communication (for example, a communication network) in any form or through any medium. Examples of the communication network include a local area network (LAN), a wide area network (WAN), and Internet.
- The computer system may include a client and a server. The client and the server are generally far away from each other and usually interact through a communication network. The relationship between the client and the server is generated through computer programs running on the corresponding computers and having a client-server relationship with each other.
- It should be understood that steps of the processes illustrated above may be reordered, added or deleted in various manners. For example, the steps described in the present disclosure may be performed in parallel, sequentially, or in a different order, as long as a desired result of the technical solution of the present disclosure may be achieved. This is not limited in the present disclosure.
- The above-mentioned specific embodiments do not constitute a limitation on the scope of protection of the present disclosure. Those skilled in the art should understand that various modifications, combinations, sub-combinations and substitutions may be made according to design requirements and other factors. Any modifications, equivalent replacements and improvements made within the spirit and principles of the present disclosure shall be contained in the scope of protection of the present disclosure.
Claims (13)
- A method of monitoring an interface performance of a distributed application, comprising:in case of detecting a caller request for calling an interface of the distributed application,obtaining (S210) a performance data of the interface for responding the caller request;updating (S220) a performance data distribution characteristic of the interface according to the performance data of the interface for responding the caller request, so as to obtain an updated performance data distribution characteristic; andmonitoring (S230) the interface performance of the distributed application, according to the updated performance data distribution characteristic of the interface.
- The method of claim 1, wherein the updating the performance data distribution characteristic of the interface according to the performance data of the interface for responding the caller request comprises:determining a performance data distribution characteristic corresponding to an interface identification of the interface from a merged item storage data structure, according to the interface identification of the interface, wherein the merged item storage data structure contains a plurality of interface identifications and a performance data distribution characteristic corresponding to each of the plurality of interface identifications; andupdating the performance data distribution characteristic of the interface in the merged item storage data structure, according to the performance data of the interface for responding the caller request.
- The method of claim 2, wherein the updating a performance data distribution characteristic of the interface according to the performance data of the interface for responding the caller request further comprises:
creating a new merged item for the interface identification of the interface in the merged item storage data structure, in response to the merged item storage data structure not including the interface identification of the interface, so as to update the performance data distribution characteristic of the interface in the merged item storage data structure based on the new merged item. - The method of claim 2, wherein the monitoring the interface performance of the distributed application, according to the updated performance data distribution characteristic of the interface comprises:transmitting the merged item storage data structure to a data warehouse, in response to a preset monitor duration being elapsed; andremoving the merged item storage data structure stored in the distributed application locally.
- The method of claim 1, wherein the distributed application comprises a plurality of interfaces, and wherein the monitoring the interface performance of the distributed application, according to the updated performance data distribution characteristic of the interface comprises:transmitting current performance data distribution characteristics of each of the plurality of interfaces to a data warehouse, in response to a preset monitor duration being elapsed; andremoving all performance data distribution characteristics stored in the distributed application locally.
- The method of claim 4 or 5, wherein the data warehouse stores performance data distribution characteristics transmitted by one or more distributed applications in a distributed system, and the method further comprising:
merging performance data distribution characteristics for the same interface transmitted by each distributed application in the distributed system, so as to obtain a merged performance data distribution characteristic for the same interface. - The method of claim 6, further comprising:
determining a tantile for said each of the plurality of interfaces in the distributed system, according to the merged performance data distribution characteristic for the same interface. - The method of claim 7, wherein the determining a tantile for said each of the plurality of interfaces in the distributed system, according to the merged performance data distribution characteristic for the same interface comprises:acquiring a target value of a target interface input in a query by a user; anddetermining a tantile corresponding to the target value, according to the merged performance data distribution characteristic for the same interface.
- The method of claim 1, wherein the in case of detecting a caller request for calling an interface of the distributed application, obtaining a performance data of the interface for responding the caller request comprises:in case of detecting the caller request for calling the interface of the distributed application,recording a start calling moment of the interface;recording an end calling moment of the interface; anddetermining the performance data of the interface for responding the caller request according to the start calling moment and the end calling moment.
- An apparatus (1200) of monitoring an interface performance of a distributed application, comprising:an obtaining module (1210), configured to, in case of detecting a caller request for calling an interface of the distributed application, obtain a performance data of the interface for responding the caller request;an updating module (1220), configured to update a performance data distribution characteristic of the interface according to the performance data of the interface for responding the caller request, so as to obtain an updated performance data distribution characteristic; anda monitoring module (1230), configured to monitor the interface performance of the distributed application, according to the updated performance data distribution characteristic of the interface.
- An electronic device, comprising:at least one processor; anda memory communicatively connected to the at least one processor, wherein the memory stores instructions executable by the at least one processor, and the instructions, when executed by the at least one processor, cause the at least one processor to implement the method of any one of proceeding claims.
- A non-transitory computer-readable storage medium having computer instructions stored thereon, wherein the computer instructions allow a computer to implement the method of any one of proceeding claims.
- A computer program product including computer programs, and the computer programs, when executed by a processor, implement the method of any one of proceeding claims.
Applications Claiming Priority (1)
| Application Number | Priority Date | Filing Date | Title |
|---|---|---|---|
| CN202011555255.6A CN112559271B (en) | 2020-12-24 | 2020-12-24 | Interface performance monitoring method, device, equipment and storage medium for distributed applications |
Publications (2)
| Publication Number | Publication Date |
|---|---|
| EP3937022A1 true EP3937022A1 (en) | 2022-01-12 |
| EP3937022B1 EP3937022B1 (en) | 2023-09-06 |
Family
ID=75033882
Family Applications (1)
| Application Number | Title | Priority Date | Filing Date |
|---|---|---|---|
| EP21180641.9A Active EP3937022B1 (en) | 2020-12-24 | 2021-06-21 | Method and apparatus of monitoring interface performance of distributed application, device and storage medium |
Country Status (4)
| Country | Link |
|---|---|
| US (1) | US11645179B2 (en) |
| EP (1) | EP3937022B1 (en) |
| JP (1) | JP7100180B2 (en) |
| CN (1) | CN112559271B (en) |
Families Citing this family (9)
| Publication number | Priority date | Publication date | Assignee | Title |
|---|---|---|---|---|
| US11792089B2 (en) * | 2021-04-09 | 2023-10-17 | Samsung Electronics Co., Ltd. | Method and system for monitoring application services in a network |
| CN113709182B (en) * | 2021-09-13 | 2023-03-10 | 支付宝(杭州)信息技术有限公司 | Interface identification method, device and equipment |
| CN114510291B (en) * | 2022-01-27 | 2023-10-24 | 百度在线网络技术(北京)有限公司 | Data calling method, device, electronic equipment and storage medium |
| CN114637673B (en) * | 2022-03-16 | 2025-03-25 | 京东科技信息技术有限公司 | Micro front-end performance monitoring method, device, equipment and storage medium |
| CN115033823B (en) * | 2022-06-16 | 2025-08-12 | 北京百度网讯科技有限公司 | Method, apparatus, device, medium, and article for processing data |
| CN115081410A (en) * | 2022-07-19 | 2022-09-20 | 中电金信软件有限公司 | Method and device for automatically generating experiment report |
| CN115687002A (en) * | 2022-10-10 | 2023-02-03 | 中国工商银行股份有限公司 | Data processing method, device, device, medium and program product |
| CN116225828A (en) * | 2022-12-13 | 2023-06-06 | 招联消费金融有限公司 | Alarm method, device, equipment, medium and product based on the number of interface calls |
| CN116362212A (en) * | 2023-02-17 | 2023-06-30 | 上海东普信息科技有限公司 | Report generation method, device, equipment and storage medium |
Citations (3)
| Publication number | Priority date | Publication date | Assignee | Title |
|---|---|---|---|---|
| US10305758B1 (en) * | 2014-10-09 | 2019-05-28 | Splunk Inc. | Service monitoring interface reflecting by-service mode |
| CN111352817A (en) * | 2020-02-28 | 2020-06-30 | 北京百度网讯科技有限公司 | Response time testing method, response time testing device and electronic equipment |
| US10817358B2 (en) * | 2017-06-23 | 2020-10-27 | Dynatrace Llc | Method and system for real-time and scalable anomaly detection and classification of multi-dimensional multivariate high-frequency transaction data in a distributed environment |
Family Cites Families (8)
| Publication number | Priority date | Publication date | Assignee | Title |
|---|---|---|---|---|
| JP3945521B2 (en) | 2005-06-13 | 2007-07-18 | 株式会社日立製作所 | Distributed processing system and performance monitoring method thereof |
| JP5471652B2 (en) * | 2010-03-17 | 2014-04-16 | 日本電気株式会社 | COMMUNICATION NODE DEVICE, COMMUNICATION SYSTEM AND DESTINATION RECEIVING INTERFACE SELECTION METHOD USED FOR THEM |
| JP5948257B2 (en) | 2013-01-11 | 2016-07-06 | 株式会社日立製作所 | Information processing system monitoring apparatus, monitoring method, and monitoring program |
| US20160132828A1 (en) * | 2014-11-12 | 2016-05-12 | International Business Machines Corporation | Real-time continuous realignment of a large-scale distributed project |
| DE112016005207T5 (en) * | 2015-11-13 | 2018-08-16 | Google Llc | Performance monitoring in a distributed storage system |
| US10082983B2 (en) * | 2016-04-05 | 2018-09-25 | International Business Machines Corporation | Monitoring storage systems |
| CN108446210B (en) * | 2018-02-07 | 2021-04-30 | 平安科技(深圳)有限公司 | System performance measurement method, storage medium and server |
| CN110808877A (en) * | 2019-10-30 | 2020-02-18 | 深圳前海环融联易信息科技服务有限公司 | Statistical analysis method and device based on interface response duration and computer equipment |
-
2020
- 2020-12-24 CN CN202011555255.6A patent/CN112559271B/en active Active
-
2021
- 2021-06-21 EP EP21180641.9A patent/EP3937022B1/en active Active
- 2021-06-21 US US17/352,466 patent/US11645179B2/en active Active
- 2021-06-22 JP JP2021103277A patent/JP7100180B2/en active Active
Patent Citations (3)
| Publication number | Priority date | Publication date | Assignee | Title |
|---|---|---|---|---|
| US10305758B1 (en) * | 2014-10-09 | 2019-05-28 | Splunk Inc. | Service monitoring interface reflecting by-service mode |
| US10817358B2 (en) * | 2017-06-23 | 2020-10-27 | Dynatrace Llc | Method and system for real-time and scalable anomaly detection and classification of multi-dimensional multivariate high-frequency transaction data in a distributed environment |
| CN111352817A (en) * | 2020-02-28 | 2020-06-30 | 北京百度网讯科技有限公司 | Response time testing method, response time testing device and electronic equipment |
Also Published As
| Publication number | Publication date |
|---|---|
| CN112559271A (en) | 2021-03-26 |
| EP3937022B1 (en) | 2023-09-06 |
| US11645179B2 (en) | 2023-05-09 |
| CN112559271B (en) | 2023-10-20 |
| US20210311845A1 (en) | 2021-10-07 |
| JP7100180B2 (en) | 2022-07-12 |
| JP2021144762A (en) | 2021-09-24 |
Similar Documents
| Publication | Publication Date | Title |
|---|---|---|
| EP3937022B1 (en) | Method and apparatus of monitoring interface performance of distributed application, device and storage medium | |
| US10560465B2 (en) | Real time anomaly detection for data streams | |
| CN109034993B (en) | Account checking method, account checking equipment, account checking system and computer readable storage medium | |
| US20200372007A1 (en) | Trace and span sampling and analysis for instrumented software | |
| US20220300573A1 (en) | Method for presenting information, electronic device, and storage medium | |
| US20220067045A1 (en) | Automated query predicate selectivity prediction using machine learning models | |
| EP4116889A2 (en) | Method and apparatus of processing event data, electronic device, and medium | |
| CN112506800B (en) | Method, apparatus, device, medium and program product for testing code | |
| EP4216076B1 (en) | Method and apparatus of processing an observation information, electronic device and storage medium | |
| US11182386B2 (en) | Offloading statistics collection | |
| CN112214500A (en) | Data comparison method and device, electronic equipment and storage medium | |
| CN110928898A (en) | Data acquisition method, data acquisition device, storage medium and electronic equipment | |
| CN115391286A (en) | Link tracking data management method, device, equipment and storage medium | |
| CN110866031B (en) | Database access path optimization method and device, computing equipment and medium | |
| CN114637809A (en) | Method, device, electronic equipment and medium for dynamic configuration of synchronous delay time | |
| CN114169004A (en) | Data processing method and device, electronic equipment and computer readable storage medium | |
| CN116225746A (en) | Method, apparatus, device, storage medium and program product for determining system problem | |
| CN113676531B (en) | E-commerce traffic peak shaving method, device, electronic equipment and readable storage medium | |
| CN118939360A (en) | Data processing method, device, electronic device and storage medium | |
| CN117931813A (en) | Lake bin metadata change determining method, device, equipment and medium | |
| CN117194161A (en) | Database exception handling method and device, electronic equipment and storage medium | |
| CN117421297B (en) | Statistical information collection method for dynamic partition table of distributed database | |
| CN113362097A (en) | User determination method and device | |
| CN115617824B (en) | A transaction message processing method, device and system | |
| CN121144562A (en) | Business data processing methods, retrieval methods, devices, equipment and media |
Legal Events
| Date | Code | Title | Description |
|---|---|---|---|
| PUAI | Public reference made under article 153(3) epc to a published international application that has entered the european phase |
Free format text: ORIGINAL CODE: 0009012 |
|
| STAA | Information on the status of an ep patent application or granted ep patent |
Free format text: STATUS: REQUEST FOR EXAMINATION WAS MADE |
|
| 17P | Request for examination filed |
Effective date: 20210621 |
|
| AK | Designated contracting states |
Kind code of ref document: A1 Designated state(s): AL AT BE BG CH CY CZ DE DK EE ES FI FR GB GR HR HU IE IS IT LI LT LU LV MC MK MT NL NO PL PT RO RS SE SI SK SM TR |
|
| B565 | Issuance of search results under rule 164(2) epc |
Effective date: 20211213 |
|
| STAA | Information on the status of an ep patent application or granted ep patent |
Free format text: STATUS: EXAMINATION IS IN PROGRESS |
|
| 17Q | First examination report despatched |
Effective date: 20221005 |
|
| GRAP | Despatch of communication of intention to grant a patent |
Free format text: ORIGINAL CODE: EPIDOSNIGR1 |
|
| STAA | Information on the status of an ep patent application or granted ep patent |
Free format text: STATUS: GRANT OF PATENT IS INTENDED |
|
| INTG | Intention to grant announced |
Effective date: 20230321 |
|
| GRAS | Grant fee paid |
Free format text: ORIGINAL CODE: EPIDOSNIGR3 |
|
| GRAA | (expected) grant |
Free format text: ORIGINAL CODE: 0009210 |
|
| STAA | Information on the status of an ep patent application or granted ep patent |
Free format text: STATUS: THE PATENT HAS BEEN GRANTED |
|
| AK | Designated contracting states |
Kind code of ref document: B1 Designated state(s): AL AT BE BG CH CY CZ DE DK EE ES FI FR GB GR HR HU IE IS IT LI LT LU LV MC MK MT NL NO PL PT RO RS SE SI SK SM TR |
|
| REG | Reference to a national code |
Ref country code: GB Ref legal event code: FG4D |
|
| REG | Reference to a national code |
Ref country code: CH Ref legal event code: EP |
|
| REG | Reference to a national code |
Ref country code: IE Ref legal event code: FG4D |
|
| REG | Reference to a national code |
Ref country code: DE Ref legal event code: R096 Ref document number: 602021004863 Country of ref document: DE |
|
| P01 | Opt-out of the competence of the unified patent court (upc) registered |
Effective date: 20230905 |
|
| REG | Reference to a national code |
Ref country code: LT Ref legal event code: MG9D |
|
| REG | Reference to a national code |
Ref country code: NL Ref legal event code: MP Effective date: 20230906 |
|
| PG25 | Lapsed in a contracting state [announced via postgrant information from national office to epo] |
Ref country code: GR Free format text: LAPSE BECAUSE OF FAILURE TO SUBMIT A TRANSLATION OF THE DESCRIPTION OR TO PAY THE FEE WITHIN THE PRESCRIBED TIME-LIMIT Effective date: 20231207 |
|
| PG25 | Lapsed in a contracting state [announced via postgrant information from national office to epo] |
Ref country code: SE Free format text: LAPSE BECAUSE OF FAILURE TO SUBMIT A TRANSLATION OF THE DESCRIPTION OR TO PAY THE FEE WITHIN THE PRESCRIBED TIME-LIMIT Effective date: 20230906 Ref country code: RS Free format text: LAPSE BECAUSE OF FAILURE TO SUBMIT A TRANSLATION OF THE DESCRIPTION OR TO PAY THE FEE WITHIN THE PRESCRIBED TIME-LIMIT Effective date: 20230906 Ref country code: NO Free format text: LAPSE BECAUSE OF FAILURE TO SUBMIT A TRANSLATION OF THE DESCRIPTION OR TO PAY THE FEE WITHIN THE PRESCRIBED TIME-LIMIT Effective date: 20231206 Ref country code: LV Free format text: LAPSE BECAUSE OF FAILURE TO SUBMIT A TRANSLATION OF THE DESCRIPTION OR TO PAY THE FEE WITHIN THE PRESCRIBED TIME-LIMIT Effective date: 20230906 Ref country code: LT Free format text: LAPSE BECAUSE OF FAILURE TO SUBMIT A TRANSLATION OF THE DESCRIPTION OR TO PAY THE FEE WITHIN THE PRESCRIBED TIME-LIMIT Effective date: 20230906 Ref country code: HR Free format text: LAPSE BECAUSE OF FAILURE TO SUBMIT A TRANSLATION OF THE DESCRIPTION OR TO PAY THE FEE WITHIN THE PRESCRIBED TIME-LIMIT Effective date: 20230906 Ref country code: GR Free format text: LAPSE BECAUSE OF FAILURE TO SUBMIT A TRANSLATION OF THE DESCRIPTION OR TO PAY THE FEE WITHIN THE PRESCRIBED TIME-LIMIT Effective date: 20231207 Ref country code: FI Free format text: LAPSE BECAUSE OF FAILURE TO SUBMIT A TRANSLATION OF THE DESCRIPTION OR TO PAY THE FEE WITHIN THE PRESCRIBED TIME-LIMIT Effective date: 20230906 |
|
| REG | Reference to a national code |
Ref country code: AT Ref legal event code: MK05 Ref document number: 1609444 Country of ref document: AT Kind code of ref document: T Effective date: 20230906 |
|
| PG25 | Lapsed in a contracting state [announced via postgrant information from national office to epo] |
Ref country code: NL Free format text: LAPSE BECAUSE OF FAILURE TO SUBMIT A TRANSLATION OF THE DESCRIPTION OR TO PAY THE FEE WITHIN THE PRESCRIBED TIME-LIMIT Effective date: 20230906 |
|
| PG25 | Lapsed in a contracting state [announced via postgrant information from national office to epo] |
Ref country code: IS Free format text: LAPSE BECAUSE OF FAILURE TO SUBMIT A TRANSLATION OF THE DESCRIPTION OR TO PAY THE FEE WITHIN THE PRESCRIBED TIME-LIMIT Effective date: 20240106 |
|
| PG25 | Lapsed in a contracting state [announced via postgrant information from national office to epo] |
Ref country code: AT Free format text: LAPSE BECAUSE OF FAILURE TO SUBMIT A TRANSLATION OF THE DESCRIPTION OR TO PAY THE FEE WITHIN THE PRESCRIBED TIME-LIMIT Effective date: 20230906 |
|
| PG25 | Lapsed in a contracting state [announced via postgrant information from national office to epo] |
Ref country code: ES Free format text: LAPSE BECAUSE OF FAILURE TO SUBMIT A TRANSLATION OF THE DESCRIPTION OR TO PAY THE FEE WITHIN THE PRESCRIBED TIME-LIMIT Effective date: 20230906 |
|
| PG25 | Lapsed in a contracting state [announced via postgrant information from national office to epo] |
Ref country code: SM Free format text: LAPSE BECAUSE OF FAILURE TO SUBMIT A TRANSLATION OF THE DESCRIPTION OR TO PAY THE FEE WITHIN THE PRESCRIBED TIME-LIMIT Effective date: 20230906 Ref country code: RO Free format text: LAPSE BECAUSE OF FAILURE TO SUBMIT A TRANSLATION OF THE DESCRIPTION OR TO PAY THE FEE WITHIN THE PRESCRIBED TIME-LIMIT Effective date: 20230906 Ref country code: IS Free format text: LAPSE BECAUSE OF FAILURE TO SUBMIT A TRANSLATION OF THE DESCRIPTION OR TO PAY THE FEE WITHIN THE PRESCRIBED TIME-LIMIT Effective date: 20240106 Ref country code: ES Free format text: LAPSE BECAUSE OF FAILURE TO SUBMIT A TRANSLATION OF THE DESCRIPTION OR TO PAY THE FEE WITHIN THE PRESCRIBED TIME-LIMIT Effective date: 20230906 Ref country code: EE Free format text: LAPSE BECAUSE OF FAILURE TO SUBMIT A TRANSLATION OF THE DESCRIPTION OR TO PAY THE FEE WITHIN THE PRESCRIBED TIME-LIMIT Effective date: 20230906 Ref country code: CZ Free format text: LAPSE BECAUSE OF FAILURE TO SUBMIT A TRANSLATION OF THE DESCRIPTION OR TO PAY THE FEE WITHIN THE PRESCRIBED TIME-LIMIT Effective date: 20230906 Ref country code: AT Free format text: LAPSE BECAUSE OF FAILURE TO SUBMIT A TRANSLATION OF THE DESCRIPTION OR TO PAY THE FEE WITHIN THE PRESCRIBED TIME-LIMIT Effective date: 20230906 Ref country code: SK Free format text: LAPSE BECAUSE OF FAILURE TO SUBMIT A TRANSLATION OF THE DESCRIPTION OR TO PAY THE FEE WITHIN THE PRESCRIBED TIME-LIMIT Effective date: 20230906 Ref country code: PT Free format text: LAPSE BECAUSE OF FAILURE TO SUBMIT A TRANSLATION OF THE DESCRIPTION OR TO PAY THE FEE WITHIN THE PRESCRIBED TIME-LIMIT Effective date: 20240108 |
|
| PG25 | Lapsed in a contracting state [announced via postgrant information from national office to epo] |
Ref country code: PL Free format text: LAPSE BECAUSE OF FAILURE TO SUBMIT A TRANSLATION OF THE DESCRIPTION OR TO PAY THE FEE WITHIN THE PRESCRIBED TIME-LIMIT Effective date: 20230906 Ref country code: IT Free format text: LAPSE BECAUSE OF FAILURE TO SUBMIT A TRANSLATION OF THE DESCRIPTION OR TO PAY THE FEE WITHIN THE PRESCRIBED TIME-LIMIT Effective date: 20230906 |
|
| REG | Reference to a national code |
Ref country code: DE Ref legal event code: R097 Ref document number: 602021004863 Country of ref document: DE |
|
| PG25 | Lapsed in a contracting state [announced via postgrant information from national office to epo] |
Ref country code: DK Free format text: LAPSE BECAUSE OF FAILURE TO SUBMIT A TRANSLATION OF THE DESCRIPTION OR TO PAY THE FEE WITHIN THE PRESCRIBED TIME-LIMIT Effective date: 20230906 |
|
| PLBE | No opposition filed within time limit |
Free format text: ORIGINAL CODE: 0009261 |
|
| STAA | Information on the status of an ep patent application or granted ep patent |
Free format text: STATUS: NO OPPOSITION FILED WITHIN TIME LIMIT |
|
| PG25 | Lapsed in a contracting state [announced via postgrant information from national office to epo] |
Ref country code: DK Free format text: LAPSE BECAUSE OF FAILURE TO SUBMIT A TRANSLATION OF THE DESCRIPTION OR TO PAY THE FEE WITHIN THE PRESCRIBED TIME-LIMIT Effective date: 20230906 Ref country code: SI Free format text: LAPSE BECAUSE OF FAILURE TO SUBMIT A TRANSLATION OF THE DESCRIPTION OR TO PAY THE FEE WITHIN THE PRESCRIBED TIME-LIMIT Effective date: 20230906 |
|
| 26N | No opposition filed |
Effective date: 20240607 |
|
| PG25 | Lapsed in a contracting state [announced via postgrant information from national office to epo] |
Ref country code: BG Free format text: LAPSE BECAUSE OF FAILURE TO SUBMIT A TRANSLATION OF THE DESCRIPTION OR TO PAY THE FEE WITHIN THE PRESCRIBED TIME-LIMIT Effective date: 20230906 |
|
| PG25 | Lapsed in a contracting state [announced via postgrant information from national office to epo] |
Ref country code: BG Free format text: LAPSE BECAUSE OF FAILURE TO SUBMIT A TRANSLATION OF THE DESCRIPTION OR TO PAY THE FEE WITHIN THE PRESCRIBED TIME-LIMIT Effective date: 20230906 |
|
| PG25 | Lapsed in a contracting state [announced via postgrant information from national office to epo] |
Ref country code: MC Free format text: LAPSE BECAUSE OF FAILURE TO SUBMIT A TRANSLATION OF THE DESCRIPTION OR TO PAY THE FEE WITHIN THE PRESCRIBED TIME-LIMIT Effective date: 20230906 |
|
| REG | Reference to a national code |
Ref country code: CH Ref legal event code: PL |
|
| PG25 | Lapsed in a contracting state [announced via postgrant information from national office to epo] |
Ref country code: LU Free format text: LAPSE BECAUSE OF NON-PAYMENT OF DUE FEES Effective date: 20240621 |
|
| PG25 | Lapsed in a contracting state [announced via postgrant information from national office to epo] |
Ref country code: IE Free format text: LAPSE BECAUSE OF NON-PAYMENT OF DUE FEES Effective date: 20240621 |
|
| PG25 | Lapsed in a contracting state [announced via postgrant information from national office to epo] |
Ref country code: BE Free format text: LAPSE BECAUSE OF NON-PAYMENT OF DUE FEES Effective date: 20240630 Ref country code: CH Free format text: LAPSE BECAUSE OF NON-PAYMENT OF DUE FEES Effective date: 20240630 |
|
| REG | Reference to a national code |
Ref country code: BE Ref legal event code: MM Effective date: 20240630 |
|
| PGFP | Annual fee paid to national office [announced via postgrant information from national office to epo] |
Ref country code: DE Payment date: 20250618 Year of fee payment: 5 |
|
| PGFP | Annual fee paid to national office [announced via postgrant information from national office to epo] |
Ref country code: GB Payment date: 20250508 Year of fee payment: 5 |
|
| PGFP | Annual fee paid to national office [announced via postgrant information from national office to epo] |
Ref country code: FR Payment date: 20250508 Year of fee payment: 5 |
|
| PG25 | Lapsed in a contracting state [announced via postgrant information from national office to epo] |
Ref country code: CY Free format text: LAPSE BECAUSE OF FAILURE TO SUBMIT A TRANSLATION OF THE DESCRIPTION OR TO PAY THE FEE WITHIN THE PRESCRIBED TIME-LIMIT; INVALID AB INITIO Effective date: 20210621 |
|
| PG25 | Lapsed in a contracting state [announced via postgrant information from national office to epo] |
Ref country code: HU Free format text: LAPSE BECAUSE OF FAILURE TO SUBMIT A TRANSLATION OF THE DESCRIPTION OR TO PAY THE FEE WITHIN THE PRESCRIBED TIME-LIMIT; INVALID AB INITIO Effective date: 20210621 |