EP3933759A1 - Image processing method, apparatus and system, and electronic device and storage medium - Google Patents
Image processing method, apparatus and system, and electronic device and storage medium Download PDFInfo
- Publication number
- EP3933759A1 EP3933759A1 EP20762231.7A EP20762231A EP3933759A1 EP 3933759 A1 EP3933759 A1 EP 3933759A1 EP 20762231 A EP20762231 A EP 20762231A EP 3933759 A1 EP3933759 A1 EP 3933759A1
- Authority
- EP
- European Patent Office
- Prior art keywords
- time
- peak
- image
- magnetic resonance
- intensity image
- Prior art date
- Legal status (The legal status is an assumption and is not a legal conclusion. Google has not performed a legal analysis and makes no representation as to the accuracy of the status listed.)
- Granted
Links
Images





Classifications
-
- G—PHYSICS
- G06—COMPUTING OR CALCULATING; COUNTING
- G06T—IMAGE DATA PROCESSING OR GENERATION, IN GENERAL
- G06T7/00—Image analysis
- G06T7/0002—Inspection of images, e.g. flaw detection
- G06T7/0012—Biomedical image inspection
-
- A—HUMAN NECESSITIES
- A61—MEDICAL OR VETERINARY SCIENCE; HYGIENE
- A61B—DIAGNOSIS; SURGERY; IDENTIFICATION
- A61B5/00—Measuring for diagnostic purposes; Identification of persons
- A61B5/05—Detecting, measuring or recording for diagnosis by means of electric currents or magnetic fields; Measuring using microwaves or radio waves
- A61B5/055—Detecting, measuring or recording for diagnosis by means of electric currents or magnetic fields; Measuring using microwaves or radio waves involving electronic [EMR] or nuclear [NMR] magnetic resonance, e.g. magnetic resonance imaging
-
- A—HUMAN NECESSITIES
- A61—MEDICAL OR VETERINARY SCIENCE; HYGIENE
- A61B—DIAGNOSIS; SURGERY; IDENTIFICATION
- A61B5/00—Measuring for diagnostic purposes; Identification of persons
- A61B5/0002—Remote monitoring of patients using telemetry, e.g. transmission of vital signals via a communication network
- A61B5/0004—Remote monitoring of patients using telemetry, e.g. transmission of vital signals via a communication network characterised by the type of physiological signal transmitted
- A61B5/0013—Medical image data
-
- A—HUMAN NECESSITIES
- A61—MEDICAL OR VETERINARY SCIENCE; HYGIENE
- A61B—DIAGNOSIS; SURGERY; IDENTIFICATION
- A61B6/00—Apparatus or devices for radiation diagnosis; Apparatus or devices for radiation diagnosis combined with radiation therapy equipment
- A61B6/48—Diagnostic techniques
- A61B6/481—Diagnostic techniques involving the use of contrast agents
-
- A—HUMAN NECESSITIES
- A61—MEDICAL OR VETERINARY SCIENCE; HYGIENE
- A61B—DIAGNOSIS; SURGERY; IDENTIFICATION
- A61B6/00—Apparatus or devices for radiation diagnosis; Apparatus or devices for radiation diagnosis combined with radiation therapy equipment
- A61B6/50—Apparatus or devices for radiation diagnosis; Apparatus or devices for radiation diagnosis combined with radiation therapy equipment specially adapted for specific body parts; specially adapted for specific clinical applications
- A61B6/502—Apparatus or devices for radiation diagnosis; Apparatus or devices for radiation diagnosis combined with radiation therapy equipment specially adapted for specific body parts; specially adapted for specific clinical applications for diagnosis of breast, i.e. mammography
-
- A—HUMAN NECESSITIES
- A61—MEDICAL OR VETERINARY SCIENCE; HYGIENE
- A61B—DIAGNOSIS; SURGERY; IDENTIFICATION
- A61B6/00—Apparatus or devices for radiation diagnosis; Apparatus or devices for radiation diagnosis combined with radiation therapy equipment
- A61B6/50—Apparatus or devices for radiation diagnosis; Apparatus or devices for radiation diagnosis combined with radiation therapy equipment specially adapted for specific body parts; specially adapted for specific clinical applications
- A61B6/504—Apparatus or devices for radiation diagnosis; Apparatus or devices for radiation diagnosis combined with radiation therapy equipment specially adapted for specific body parts; specially adapted for specific clinical applications for diagnosis of blood vessels, e.g. by angiography
-
- G—PHYSICS
- G01—MEASURING; TESTING
- G01R—MEASURING ELECTRIC VARIABLES; MEASURING MAGNETIC VARIABLES
- G01R33/00—Arrangements or instruments for measuring magnetic variables
- G01R33/20—Arrangements or instruments for measuring magnetic variables involving magnetic resonance
- G01R33/44—Arrangements or instruments for measuring magnetic variables involving magnetic resonance using nuclear magnetic resonance [NMR]
- G01R33/48—NMR imaging systems
- G01R33/54—Signal processing systems, e.g. using pulse sequences ; Generation or control of pulse sequences; Operator console
- G01R33/56—Image enhancement or correction, e.g. subtraction or averaging techniques, e.g. improvement of signal-to-noise ratio and resolution
- G01R33/5601—Image enhancement or correction, e.g. subtraction or averaging techniques, e.g. improvement of signal-to-noise ratio and resolution involving use of a contrast agent for contrast manipulation, e.g. a paramagnetic, super-paramagnetic, ferromagnetic or hyperpolarised contrast agent
-
- G—PHYSICS
- G01—MEASURING; TESTING
- G01R—MEASURING ELECTRIC VARIABLES; MEASURING MAGNETIC VARIABLES
- G01R33/00—Arrangements or instruments for measuring magnetic variables
- G01R33/20—Arrangements or instruments for measuring magnetic variables involving magnetic resonance
- G01R33/44—Arrangements or instruments for measuring magnetic variables involving magnetic resonance using nuclear magnetic resonance [NMR]
- G01R33/48—NMR imaging systems
- G01R33/54—Signal processing systems, e.g. using pulse sequences ; Generation or control of pulse sequences; Operator console
- G01R33/56—Image enhancement or correction, e.g. subtraction or averaging techniques, e.g. improvement of signal-to-noise ratio and resolution
- G01R33/5608—Data processing and visualization specially adapted for MR, e.g. for feature analysis and pattern recognition on the basis of measured MR data, segmentation of measured MR data, edge contour detection on the basis of measured MR data, for enhancing measured MR data in terms of signal-to-noise ratio by means of noise filtering or apodization, for enhancing measured MR data in terms of resolution by means for deblurring, windowing, zero filling, or generation of gray-scaled images, colour-coded images or images displaying vectors instead of pixels
-
- G—PHYSICS
- G06—COMPUTING OR CALCULATING; COUNTING
- G06T—IMAGE DATA PROCESSING OR GENERATION, IN GENERAL
- G06T7/00—Image analysis
- G06T7/0002—Inspection of images, e.g. flaw detection
- G06T7/0012—Biomedical image inspection
- G06T7/0014—Biomedical image inspection using an image reference approach
- G06T7/0016—Biomedical image inspection using an image reference approach involving temporal comparison
-
- A—HUMAN NECESSITIES
- A61—MEDICAL OR VETERINARY SCIENCE; HYGIENE
- A61B—DIAGNOSIS; SURGERY; IDENTIFICATION
- A61B2576/00—Medical imaging apparatus involving image processing or analysis
-
- A—HUMAN NECESSITIES
- A61—MEDICAL OR VETERINARY SCIENCE; HYGIENE
- A61B—DIAGNOSIS; SURGERY; IDENTIFICATION
- A61B5/00—Measuring for diagnostic purposes; Identification of persons
- A61B5/02—Detecting, measuring or recording for evaluating the cardiovascular system, e.g. pulse, heart rate, blood pressure or blood flow
- A61B5/026—Measuring blood flow
- A61B5/0263—Measuring blood flow using NMR
-
- A—HUMAN NECESSITIES
- A61—MEDICAL OR VETERINARY SCIENCE; HYGIENE
- A61B—DIAGNOSIS; SURGERY; IDENTIFICATION
- A61B5/00—Measuring for diagnostic purposes; Identification of persons
- A61B5/43—Detecting, measuring or recording for evaluating the reproductive systems
- A61B5/4306—Detecting, measuring or recording for evaluating the reproductive systems for evaluating the female reproductive systems, e.g. gynaecological evaluations
- A61B5/4312—Breast evaluation or disorder diagnosis
-
- G—PHYSICS
- G01—MEASURING; TESTING
- G01R—MEASURING ELECTRIC VARIABLES; MEASURING MAGNETIC VARIABLES
- G01R33/00—Arrangements or instruments for measuring magnetic variables
- G01R33/20—Arrangements or instruments for measuring magnetic variables involving magnetic resonance
- G01R33/44—Arrangements or instruments for measuring magnetic variables involving magnetic resonance using nuclear magnetic resonance [NMR]
- G01R33/48—NMR imaging systems
- G01R33/54—Signal processing systems, e.g. using pulse sequences ; Generation or control of pulse sequences; Operator console
- G01R33/56—Image enhancement or correction, e.g. subtraction or averaging techniques, e.g. improvement of signal-to-noise ratio and resolution
- G01R33/563—Image enhancement or correction, e.g. subtraction or averaging techniques, e.g. improvement of signal-to-noise ratio and resolution of moving material, e.g. flow contrast angiography
- G01R33/56308—Characterization of motion or flow; Dynamic imaging
-
- G—PHYSICS
- G06—COMPUTING OR CALCULATING; COUNTING
- G06T—IMAGE DATA PROCESSING OR GENERATION, IN GENERAL
- G06T2207/00—Indexing scheme for image analysis or image enhancement
- G06T2207/10—Image acquisition modality
- G06T2207/10072—Tomographic images
- G06T2207/10088—Magnetic resonance imaging [MRI]
- G06T2207/10096—Dynamic contrast-enhanced magnetic resonance imaging [DCE-MRI]
-
- G—PHYSICS
- G06—COMPUTING OR CALCULATING; COUNTING
- G06T—IMAGE DATA PROCESSING OR GENERATION, IN GENERAL
- G06T2207/00—Indexing scheme for image analysis or image enhancement
- G06T2207/30—Subject of image; Context of image processing
- G06T2207/30004—Biomedical image processing
- G06T2207/30068—Mammography; Breast
-
- G—PHYSICS
- G06—COMPUTING OR CALCULATING; COUNTING
- G06T—IMAGE DATA PROCESSING OR GENERATION, IN GENERAL
- G06T2207/00—Indexing scheme for image analysis or image enhancement
- G06T2207/30—Subject of image; Context of image processing
- G06T2207/30004—Biomedical image processing
- G06T2207/30096—Tumor; Lesion
-
- G—PHYSICS
- G06—COMPUTING OR CALCULATING; COUNTING
- G06T—IMAGE DATA PROCESSING OR GENERATION, IN GENERAL
- G06T2207/00—Indexing scheme for image analysis or image enhancement
- G06T2207/30—Subject of image; Context of image processing
- G06T2207/30004—Biomedical image processing
- G06T2207/30101—Blood vessel; Artery; Vein; Vascular
- G06T2207/30104—Vascular flow; Blood flow; Perfusion
Definitions
- the present disclosure relates to the field of medical image processing technologies, and in particular, to an image processing method, apparatus, and system, an electronic device, and a storage medium.
- the analysis is generally performed by generating a corresponding time-intensity curve (TIC) based on dynamic contrast enhanced (DCE) images, which has a certain value.
- the TIC is mainly generated in the following manner: DCE magnetic resonance images of a plurality of time points are obtained by using conventional breast MRI, then a point is selected from a suspect lesion region, to obtain pixel grayscale values corresponding to the point in the DCE magnetic resonance images of different time points, and a curve is drawn, that is, the TIC. In this way, a breast tumor diagnosis result may be determined based on the TIC.
- Embodiments of the present disclosure provide an image processing method, apparatus, and system, an electronic device, and a storage medium, to resolve a problem that in the related art, only a one-dimensional curve can be generated, which provides relatively one-sided reference, and thus a lesion region cannot be expressed completely and accurately.
- An embodiment of the present disclosure provides an image processing method, performed by an electronic device, the method including:
- Another embodiment of the present disclosure provides an image processing apparatus, including:
- Another embodiment of the present disclosure provides an image processing system, including:
- Another embodiment of the present disclosure provides an electronic device, including:
- Another embodiment of the present disclosure provides a computer-readable storage medium, storing a computer program, the computer program, when executed by a processor, implementing steps of any image processing method in the foregoing.
- Contrast agent also referred to as a contrast medium, which is a chemical product injected or taken into a human tissue or organ for enhancing image observation effects, where densities of the products are greater than or less than those of surrounding tissues, and formed contrast is displayed in images by using some instruments.
- Magnetic resonance imaging one type of tomography, which mainly obtains electromagnetic signals from human bodies by using a magnetic resonance phenomenon, and reconstructs human body information.
- Dynamic contrast enhancement physical and physiological properties of an organ or a tissue may be reflected by a level of signal enhancement.
- multi-temporal scanning may be performed based on DCE-MRI, to generate continuous dynamic images, and a series of semi-quantitative and quantitative parameters can be obtained by using a post-processing technology, to reflect enhancement features of a lesion more objectively, thereby providing richer and more complete information of physiological properties of a displayed region.
- Time-intensity curve a curve based on MRI dynamic enhanced scanning, that is, a time-intensity curve generated by DCE-MRI.
- a TIC may reflect changes of image brightness of a tissue over time when the tissue is infused with a contrast medium.
- a qualitative analysis, grading, and other analyses may be performed for a lesion, such as a tumor, by observing a flow-in speed and an amount of the contrast medium in a lesion region, which has a certain value.
- a horizontal coordinate of the TIC represents time
- a vertical coordinate of the TIC represents a pixel grayscale value of a point in an image.
- TICs may be classified as follows: type I, which is a continuously rising type, that is, after a contrast medium is injected, signal intensity of a lesion keeps rising, and the lesion showing the type I curve tends to be a benign lesion; type II, which is a platform type, that is, in a certain period of time after injection of a contrast medium, signal intensity of a lesion rises to a certain level, and then the signal intensity does not change obviously in a relatively long period of time; and type III, which is a flow-out type, that is, after a contrast medium is injected, signal intensity of a lesion rises to a certain level, and then decreases gradually, which is a fast-in fast-out type. Most of the type III TICs represent malignant lesions.
- Time to peak a time at which a peak value is reached, which is mainly a time point with a largest change of signal intensity on a TIC in the embodiments of the present disclosure.
- ROI Region of interest
- 2D 2-dimension
- 3D 3-dimension
- Lesion a part with a lesion on an organism.
- Grayscale value representing a brightness value of a single pixel of a grayscale image. A larger value indicates that the pixel is brighter, and a smaller value indicates that the pixel is darker.
- the grayscale value may be used for describing a brightness value of a specific pixel in the image.
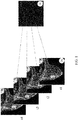
- FIG. 1 is a schematic diagram of a conventional TIC generating principle.
- DCE magnetic resonance images of a plurality of time points are obtained; a point is selected from a suspect lesion region, to obtain pixel grayscale values corresponding to the point in the DCE magnetic resonance images of different time points, and a curve is drawn, that is, the TIC.
- the TIC is drawn, that is, the TIC.
- DCE magnetic resonance images of 4 time points of a point are listed, which are DCE magnetic resonance images of t1, t2, t3, and t4, respectively, and a TIC of the point is obtained, shown in the right part of FIG. 1 .
- a horizontal coordinate of the TIC represents a time point
- a vertical coordinate of the TIC represents a pixel grayscale value of the point.
- the TIC generated in the foregoing method is a one-dimensional curve, which can only express changes of pixel values of a small region, and when the TIC is drawn, points are selected manually, which is random. Different doctors may select different points, but different points may bring about different diagnosis results, which is relatively one-sided, and thus a lesion region cannot be expressed completely and accurately.
- an embodiment of the present disclosure provides an image generation method.
- 3D images may be generated based on DCE magnetic resonance images, a conventional TIC is replaced with two 3D images, and information expressed by the TIC is expressed by the two 3D images.
- DCE magnetic resonance images corresponding to a plurality of time points for the same detection target are obtained, average pixel grayscale values of images of the same lesion region in the DCE magnetic resonance images of the plurality of time points are determined, a time to peak is calculated, and then a first-stage time-intensity image before the time to peak and a second-stage time-intensity image after the time to peak are generated respectively according to the time to peak and the DCE magnetic resonance images of the plurality of time points.
- a grayscale value of a pixel at each point of the first-stage time-intensity image and the second-stage time-intensity image represents a change rate of blood supply intensity of the lesion region, which may reflect a severity level of the lesion region, so that the severity level of the lesion may be determined according to the pixel grayscale values of the first-stage time-intensity image and the second-stage time-intensity image, that is, brightness changes. Therefore, a 3D first-stage time-intensity image and a 3D second-stage time-intensity image may be generated, a larger amount of more complete lesion information can be provided, to show an overall situation of a lesion of a detection target, which is more complete and intuitive. In addition, specific quantitative information may further be provided, to provide more accurate and reliable diagnosis bases, thereby improving the accuracy of lesion diagnosis.
- FIG. 2A is a schematic diagram of an implementation environment of an image processing method according to an embodiment of the present disclosure.
- the image processing method in the embodiments of the present disclosure may be performed by a terminal device 10, for example, a corresponding medical device, or may be performed by a server 20.
- the terminal device 10 transmits obtained DCE magnetic resonance images of a plurality of time points to the server 20.
- the server 20 determines a time to peak, and generates a first-stage time-intensity image before the time to peak and a second-stage time-intensity image after the time to peak.
- the generated first-stage time-intensity image and second-stage time-intensity image may be transmitted to the terminal device 10.
- the terminal device 10 may display the generated first-stage time-intensity image and second-stage time-intensity image.
- the terminal device 10 may be connected to the server 20 through a network 30, to implement intercommunication.
- the network 30 may be a wired network, or may be a wireless network.
- the server 20 may be considered as a backend server providing a corresponding network service.
- the embodiments of the present disclosure do not impose any limitation on the two manners.
- the analysis of MRI images of breast tumors is mainly used as an example for description; certainly, the analysis is also applicable to other application scenarios. This is not limited in the embodiments of the present disclosure.
- FIG. 2B is a flowchart of an image processing method according to an embodiment of the present disclosure. The method includes the following steps:
- Step 200 Obtain DCE magnetic resonance images corresponding to a plurality of time points for the same detection target.
- the detection target for example, is an organ or a tissue of a human body.
- a magnetic resonance scanning instrument such as an MRI scanner
- scanning parameters for example, parameters such as a scanning time and a scanning interval may be set, a breast may be scanned, to obtain DCE magnetic resonance images corresponding to a plurality of time points for the breast.
- a lesion region further needs to be determined in the DCE magnetic resonance images.
- An embodiment of the present disclosure provides an implementation: a lesion region is determined in the DCE magnetic resonance images according to a preset image segmentation algorithm and lesion features.
- 3D DCE magnetic resonance images may be obtained after MRI scanning, and a suspect lesion region, such as a tumor region, may be automatically determined on the 3D DCE magnetic resonance images according to the image segmentation algorithm.
- the suspect lesion region may be determined in one DCE magnetic resonance image, or may be determined in each of the DCE magnetic resonance images respectively.
- the lesion region may alternatively be determined in another manner. This is not limited in the embodiments of the present disclosure.
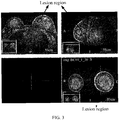
- FIG. 3 is a three-view diagram of DCE magnetic resonance images of 3D breast MRI according to an embodiment of the present disclosure.
- an upper left image is a cross-sectional view
- an upper right image is a sagittal plane view
- a lower right image is a coronal plane view (there is no image at the lower left part, which may be not considered).
- the lesion region may be determined.
- 3D regions shown in circles in the upper left image, the upper right image, and the lower right image in FIG. 3 are determined lesion regions.
- Highlighted circle regions at the intersection of two dotted lines shown in the upper left image, the upper right image, and the lower right image in FIG. 3 are actual tumor positions. Therefore, it may be learned that, the determined lesion region is basically accurate.
- Step 210 Determine average pixel grayscale values of images of the same lesion region in the DCE magnetic resonance images of the plurality of time points respectively.
- each time point corresponds to one DCE sequence, that is, one DCE magnetic resonance image.
- grayscale values of all pixels in the lesion region are determined, an average pixel grayscale value is calculated, and the average pixel grayscale value is used as a grayscale value of the current time point. Therefore, there is no need to select a point from the lesion region for calculation; instead, the average pixel grayscale value is calculated, which can improve accuracy and express features of the entire lesion region more accurately.
- Step 220 Determine a time to peak according to the average pixel grayscale values corresponding to the plurality of time points.
- Step 220 specifically includes the following steps: Step S1: Generate a TIC of the same lesion region according to the average pixel grayscale values corresponding to the plurality of time points.
- a TIC is generated, where a horizontal axis of the TIC represents an index value of time, and a vertical axis of the TIC represents an average pixel grayscale value of the lesion region.
- Step S2 Determine a first-order gradient curve corresponding to the TIC, and use a time point corresponding to a highest point on the corresponding first-order gradient curve as the time to peak.
- a time to peak is a point on the TIC with a largest change of signal intensity.
- a first-order gradient curve corresponding to the TIC may be calculated first. Because a gradient may reflect an amount of change, a highest point on the first-order gradient curve is the point with the largest change of signal intensity, and the point is used as the time to peak.
- FIG. 4A is a schematic diagram of a TIC of a 3D lesion region according to an embodiment of the present disclosure.
- FIG. 4B is a schematic diagram of a first-order gradient curve corresponding to a TIC according to an embodiment of the present disclosure.
- horizontal coordinates are time points 0 to 27, and vertical coordinates are average pixel grayscale values corresponding to the time points.
- a first-order gradient curve corresponding to the TIC of FIG. 4A is calculated, as shown in FIG. 4B . It may be learned that, a time index 4 corresponds to a highest point of the first-order gradient curve, and thus, it may be obtained that the time to peak is 4.
- such a TIC may be usually divided into first-stage time-intensity and second-stage time-intensity.
- time to peak that is, when the time index is 4
- the first-stage time-intensity of the TIC ends, and the second-stage time-intensity starts.
- Step 230 Generate a first-stage time-intensity image before the time to peak and a second-stage time-intensity image after the time to peak respectively according to the DCE magnetic resonance images of the plurality of time points and the time to peak, the first-stage time-intensity image and the second-stage time-intensity image being 3D images, and a grayscale value of a pixel at each point in the first-stage time-intensity image and the second-stage time-intensity image representing a change rate of blood supply intensity and reflecting a severity level of the lesion.
- Step 230 may be performed in the following manners: First manner: generating a first-stage time-intensity image before the time to peak and a second-stage time-intensity image after the time to peak respectively, including the following steps: Step S1: Determine a start time point and an end time point in the plurality of time points.
- a start time point is an index 0
- an end time point is an index 27.
- Step S2 Generate the first-stage time-intensity image before the time to peak according to a difference value between the DCE magnetic resonance image of the time to peak and the DCE magnetic resonance image of the start time point.
- the first-stage time-intensity image represents a time-intensity image calculated for a first stage of the TIC.
- a start time point of the first-stage time-intensity image is a time index 0, and an end time point is the time to peak, which is an index 4.
- a first-stage time-intensity image may be calculated according to a difference value between DCE magnetic resonance images corresponding to the time index 0 and the time index 4.
- the first-stage time-intensity image is denoted by TI1
- a DCE magnetic resonance image with a value of a time index being t is denoted by I _DCE (t)
- ⁇ is an infinitely small amount, and to avoid a scenario that a denominator is 0 during calculation, "*" is multiplication.
- TI1 may represent an incremental percentage of a first-stage signal at the time to peak relative to I _DCE (0), that is, a grayscale value of a pixel at each point in the first-stage time-intensity image represents a change rate of blood supply intensity, which may reflect a severity level of a lesion.
- Step S3 Generate the second-stage time-intensity image after the time to peak according to a difference value between the DCE magnetic resonance image of the end time point and the DCE magnetic resonance image of the time to peak.
- the second-stage time-intensity image represents a time-intensity image calculated for a second stage of the TIC.
- a start time point of the second-stage time-intensity image is the time to peak, which is a time index 4, and an end time point is an index 27.
- a second-stage time-intensity image may be calculated according to a difference value between DCE magnetic resonance images corresponding to the time index 27 and the time index 4.
- the second-stage time-intensity image is denoted by TI2
- a DCE magnetic resonance image with a value of a time index being t is denoted by I _DCE (t)
- Step S1 Determine a start time point and an end time point in the plurality of time points, and sample a preset quantity of time points from the plurality of time points.
- sampling may be performed according to actual requirements, and a plurality of time points may be selected from the time points.
- Step S2 Determine first difference values between the DCE magnetic resonance images of the time points sampled before the time to peak and the DCE magnetic resonance image of the start time point respectively, and generate the first-stage time-intensity image before the time to peak according to an average value of the first difference values.
- Step S3 Determine second difference values between the DCE magnetic resonance images of the time points sampled after the time to peak and the DCE magnetic resonance image of the time to peak respectively, and generate the second-stage time-intensity image after the time to peak according to an average value of the second difference values.
- generation of the first-stage time-intensity image and the second-stage time-intensity image is not limited to the foregoing two manners.
- the first-stage time-intensity image may further be represented by using a difference value between a point, which is different from the time to peak, before the time to peak and the start time point;
- the second-stage time-intensity image may further be represented by using a difference value between a point after the time to peak and the time to peak.
- the generation manner may be specifically set according to actual requirements and situations, and is not limited in the embodiments of the present disclosure.
- the objective is to generate 3D images that may represent the change of image grayscale values before and after the time to peak.
- the first-stage time-intensity image and the second-stage time-intensity image generated based on change rates of image grayscale values are also 3D images.
- a contrast medium that is, a contrast agent
- image brightness that is, image signal intensity
- a grayscale value of a pixel at each point in the first-stage time-intensity image and the second-stage time-intensity image generated by using changes of image grayscale values may be used for determining a lesion region and a severity level of the lesion region.
- a greater grayscale value means the image is brighter, and indicates a higher lesion possibility.
- a lesion level may be determined according to grayscale values of pixels in the lesion regions in the first-stage time-intensity image and the second-stage time-intensity image. For example, it may be determined whether a tumor is a benign tumor or a malignant tumor.
- grayscale values of pixels in the lesion region in the first-stage time-intensity image are positive values and are greater than a specific threshold
- grayscale values of pixels in the lesion region in the second-stage time-intensity image are negative values and are less than a specific threshold, which means that an increment of the grayscale values increases gradually, and then decreases.
- a fast-in fast-out type TIC representing that a severity level of the lesion region is higher than a preset level. That is, generally, the tumor may be determined as a malignant tumor.
- FIG. 5A is a schematic diagram of a first-stage time-intensity image according to an embodiment of the present disclosure. As shown in the upper left image in FIG. 5A , an intersection of two dotted lines represents a point in a lesion region. It may be seen that a grayscale value of the point is 125.2, which means that brightness of I _DCE (4) increases by 125.2% relative to I _DCE (0), and a pixel grayscale value increases.
- FIG. 5B is a schematic diagram of a second-stage time-intensity image according to an embodiment of the present disclosure. As shown in the upper left image in FIG. 5B , an intersection of two dotted lines represents a point in a lesion region. It may be seen that a grayscale value of the point is -19.06, which means that brightness of I _DCE (27) decreases by 19.06% relative to I _DCE (4), and a pixel grayscale value decreases. By analyzing a plurality of points in the lesion region, it may be learned that pixel grayscale values increase gradually and then decrease, and it is highly possible that the lesion region is a tumor.
- FIG. 6 is a schematic diagram of a TIC of a point in another lesion region according to an embodiment of the present disclosure.
- FIG. 6(A) shows the entire TIC
- FIG. 6(B) is a schematic diagram of a TIC before a time to peak
- FIG. 6(C) is a schematic diagram of a TIC after a time to peak.
- a point in FIG. 6 refers to a pixel at the intersection of two dotted lines in FIG. 5A and FIG. 5B . It may be learned that a TIC corresponding to the point is of a fast-in fast-out type, and it is more likely that the tumor is a malignant tumor.
- colors corresponding to different pixel grayscale values may be set. For example, positive grayscale values gradually increase from white to red, negative grayscale values gradually decrease from white to blue.
- the white color in the first-stage time-intensity image and the second-stage time-intensity image may represent that a small brightness difference
- the red color may represent that the brightness increases
- the blue color represents that the brightness decreases, so that a lesion level may be directly determined according to color changes in the first-stage time-intensity image and the second-stage time-intensity image, which is more intuitive.
- average pixel grayscale values of images of the same lesion region in the DCE magnetic resonance images of the plurality of time points are respectively determined, and according to the average pixel grayscale values corresponding to the plurality of time points, a time to peak is determined; according to the DCE magnetic resonance images of the plurality of time points and the time to peak, a first-stage time-intensity image before the time to peak and a second-stage time-intensity image after the time to peak are generated respectively. Therefore, based on the DCE magnetic resonance images, two 3D images are generated, to replace a conventional one-dimensional TIC.
- the conventional one-dimensional TIC can only provide a benign/malignant result of one pixel, and if a doctor is not satisfied with the point, a new point needs to be selected for drawing again.
- the doctor can only use some local pixels as bases, but cannot have a full picture of the tumor and the breast.
- the images not only can express information of the TIC, but also can provide benign/malignant results of all pixels simultaneously, to express changes of the entire lesion region or the entire breast region, which may provide a larger amount of more complete information of benign/malignant trends of the lesion region, and changes of a plurality of lesion regions may be displayed simultaneously.
- a more accurate diagnosis may be performed by combining the first-stage time-intensity image and the second-stage time-intensity image in this embodiment of the present disclosure with the conventional TIC, to avoid diagnosis errors caused by only using the TIC.
- a platform type TIC is shown in FIG. 4A , a diagnosis result tends to be benign.
- 6(A) is of a fast-in fast-out type, and a diagnosis result tends to be malignant. It may be learned that in the same lesion region, due to selection of different pixels, different diagnosis results may be generated. However, in fact, the tumor of the lesion region is malignant.
- a benign/malignant trend of the lesion region may be determined very accurately, which improves diagnosis accuracy.
- an embodiment of the present disclosure further provides an image processing apparatus.
- the image processing apparatus specifically includes:
- the first determining module 81 is further configured to determine a lesion region in each of the DCE magnetic resonance images according to a preset image segmentation algorithm and lesion features.
- the second determining module 82 when determining the time to peak according to the average pixel grayscale values corresponding to the plurality of time points, is specifically configured to: generate a TIC of the same lesion region according to the average pixel grayscale values corresponding to the plurality of time points; and determine a first-order gradient curve corresponding to the TIC, and use a time point corresponding to a highest point on the corresponding first-order gradient curve as the time to peak.
- the generation module 83 when generating the first-stage time-intensity image before the time to peak and the second-stage time-intensity image after the time to peak respectively, is specifically configured to:
- the generation module 83 when generating the first-stage time-intensity image before the time to peak and the second-stage time-intensity image after the time to peak respectively, is specifically configured to:
- an embodiment of the present disclosure further provides an image processing system.
- a schematic structural diagram of the image processing system is shown in FIG. 9 .
- the image processing system at least includes an image acquisition device 90, an image processing device 91, and a display device 92.
- the image acquisition device 90, the image processing device 91, and the display device 92 are related medical instruments, which may be integrated into the same medical instrument, and or may be divided into a plurality of devices connected to each other for communication, to form a medical system for use.
- the image acquisition device 90, the image processing device 91, and the display device 92 may be integrated to be an MRI scanner.
- the image acquisition device 90 is configured to obtain DCE magnetic resonance images corresponding to a plurality of time points for the same detection target.
- the image processing device 91 is configured to respectively determine average pixel grayscale values of images of the same lesion region in DCE magnetic resonance images of the plurality of time points, determine a time to peak according to the average pixel grayscale values corresponding to the plurality of time points, and generate a first-stage time-intensity image before the time to peak and a second-stage time-intensity image after the time to peak respectively according to the DCE magnetic resonance images of the plurality of time points and the time to peak, the first-stage time-intensity image and the second-stage time-intensity image being 3D images, a grayscale value of a pixel at each point in the first-stage time-intensity image and the second-stage time-intensity image representing a change rate of blood supply intensity and reflecting a severity level of the lesion.
- the method that the image processing device 91 processes the DCE magnetic resonance images and generates the first-stage time-intensity image and the second-stage time-intensity image is the same as the image processing method in the foregoing embodiment. Details are not described herein again.
- the display device 92 is configured to output and display the first-stage time-intensity image and the second-stage time-intensity image.
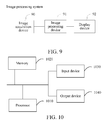
- FIG. 10 is a schematic structural diagram of the electronic device.
- the electronic device may include at least one center processing unit (CPU) 1010, at least one memory 1020, an input device 1030, an output device 1040, and the like.
- the input device 1030 may include a keyboard, a mouse, a touch screen, and the like.
- the output device 1040 may include a display device, such as a liquid crystal display (LCD) or a cathode ray tube (CRT).
- LCD liquid crystal display
- CRT cathode ray tube
- the memory 1020 may include a read-only memory (ROM) and a random access memory (RAM), and provide program instructions and data stored in the memory 1020 for the processor 1010.
- the memory 1020 may be configured to store program instructions of an image processing method according to the embodiments of the present disclosure.
- the processor 1010 invokes the program instructions stored in the memory 1020, and according to the obtained program instructions, the processor 1010 is configured to perform the following operations:
- the processor 1010 is further configured to: determine a lesion region in each of the DCE magnetic resonance images according to a preset image segmentation algorithm and lesion features.
- the processor 1010 when determining the time to peak according to the average pixel grayscale values corresponding to the plurality of time points, is specifically configured to: generate a TIC of the same lesion region according to the average pixel grayscale values corresponding to the plurality of time points; and determine a first-order gradient curve corresponding to the TIC, and use a time point corresponding to a highest point on the corresponding first-order gradient curve as the time to peak.
- the processor 1010 when generating the first-stage time-intensity image before the time to peak and the second-stage time-intensity image after the time to peak respectively, is specifically configured to:
- the processor 1010 when generating the first-stage time-intensity image before the time to peak and the second-stage time-intensity image after the time to peak respectively, is specifically configured to:
- the electronic device may be a medical device, mainly for medical image processing; certainly, the electronic device may alternatively be a terminal device or a server, and the image processing method is performed by the terminal device or the server.
- an embodiment of the present disclosure provides a computer-readable storage medium, storing a computer program, the computer program, when executed by a processor, implementing the image processing method according to any method embodiment described above.
- the embodiments of the present disclosure may be provided as a method, a system, or a computer program product. Therefore, the present disclosure may use a form of hardware-only embodiments, software-only embodiments, or embodiments combining software and hardware. Moreover, an embodiment of the present disclosure may use a form of a computer program product that is implemented on one or more computer-usable storage media (including but not limited to a disk memory, a CD-ROM, an optical memory, and the like) that include computer-usable program code.
- computer-usable storage media including but not limited to a disk memory, a CD-ROM, an optical memory, and the like
- These computer program instructions may alternatively be stored in a computer-readable memory that can instruct a computer or another programmable data processing device to work in a specific manner, so that the instructions stored in the computer-readable memory generate an artifact that includes an instruction apparatus.
- the instruction apparatus implements a specific function in one or more procedures in the flowcharts and/or in one or more blocks in the block diagrams.
- These computer program instructions may further be loaded onto a computer or another programmable data processing device, so that a series of operations and steps are performed on the computer or the another programmable device, thereby generating computer-implemented processing. Therefore, the instructions executed on the computer or the another programmable device provide steps for implementing a specific function in one or more processes in the flowcharts and/or in one or more blocks in the block diagrams.
Landscapes
- Health & Medical Sciences (AREA)
- Engineering & Computer Science (AREA)
- Life Sciences & Earth Sciences (AREA)
- Physics & Mathematics (AREA)
- Medical Informatics (AREA)
- Nuclear Medicine, Radiotherapy & Molecular Imaging (AREA)
- General Health & Medical Sciences (AREA)
- Radiology & Medical Imaging (AREA)
- High Energy & Nuclear Physics (AREA)
- Molecular Biology (AREA)
- Public Health (AREA)
- Veterinary Medicine (AREA)
- Pathology (AREA)
- Biophysics (AREA)
- Biomedical Technology (AREA)
- Heart & Thoracic Surgery (AREA)
- Animal Behavior & Ethology (AREA)
- Surgery (AREA)
- General Physics & Mathematics (AREA)
- Computer Vision & Pattern Recognition (AREA)
- Optics & Photonics (AREA)
- Quality & Reliability (AREA)
- Theoretical Computer Science (AREA)
- Dentistry (AREA)
- Oral & Maxillofacial Surgery (AREA)
- Signal Processing (AREA)
- Condensed Matter Physics & Semiconductors (AREA)
- Vascular Medicine (AREA)
- Artificial Intelligence (AREA)
- Physiology (AREA)
- Computer Networks & Wireless Communication (AREA)
- Magnetic Resonance Imaging Apparatus (AREA)
- Traffic Control Systems (AREA)
Abstract
Description
- This application claims priority to
Chinese Patent Application No. 201910138930.6, filed with China National Intellectual Property Administration on February 25, 2019 - The present disclosure relates to the field of medical image processing technologies, and in particular, to an image processing method, apparatus, and system, an electronic device, and a storage medium.
- Currently, in the analysis of images of magnetic resonance imaging (MRI) of breast tumors, the analysis is generally performed by generating a corresponding time-intensity curve (TIC) based on dynamic contrast enhanced (DCE) images, which has a certain value. Usually, the TIC is mainly generated in the following manner: DCE magnetic resonance images of a plurality of time points are obtained by using conventional breast MRI, then a point is selected from a suspect lesion region, to obtain pixel grayscale values corresponding to the point in the DCE magnetic resonance images of different time points, and a curve is drawn, that is, the TIC. In this way, a breast tumor diagnosis result may be determined based on the TIC.
- Embodiments of the present disclosure provide an image processing method, apparatus, and system, an electronic device, and a storage medium, to resolve a problem that in the related art, only a one-dimensional curve can be generated, which provides relatively one-sided reference, and thus a lesion region cannot be expressed completely and accurately.
- Specific technical solutions provided in the embodiments of the present disclosure are as follows.
- An embodiment of the present disclosure provides an image processing method, performed by an electronic device, the method including:
- obtaining dynamic contrast enhanced (DCE) magnetic resonance images corresponding to a plurality of time points for a same detection target;
- determining average pixel grayscale values of images of a same lesion region in the DCE magnetic resonance images of the plurality of time points respectively;
- determining a time to peak according to the average pixel grayscale values corresponding to the plurality of time points; and
- generating a first-stage time-intensity image before the time to peak and a second-stage time-intensity image after the time to peak respectively according to the DCE magnetic resonance images of the plurality of time points and the time to peak, the first-stage time-intensity image and the second-stage time-intensity image being 3D images, and a grayscale value of a pixel at each point in the first-stage time-intensity image and the second-stage time-intensity image representing a change rate of blood supply intensity and reflecting a severity level of a lesion.
- Another embodiment of the present disclosure provides an image processing apparatus, including:
- an obtaining module, configured to obtain dynamic contrast enhanced (DCE) magnetic resonance images corresponding to a plurality of time points for a same detection target;
- a first determining module, configured to determine average pixel grayscale values of images of a same lesion region in the DCE magnetic resonance images of the plurality of time points respectively;
- a second determining module, configured to determine a time to peak according to the average pixel grayscale values corresponding to the plurality of time points; and
- a generation module, configured to generate a first-stage time-intensity image before the time to peak and a second-stage time-intensity image after the time to peak respectively according to the DCE magnetic resonance images of the plurality of time points and the time to peak, the first-stage time-intensity image and the second-stage time-intensity image being 3D images, and a grayscale value of a pixel at of each point in the first-stage time-intensity image and the second-stage time-intensity image representing a change rate of blood supply intensity and reflecting a severity level of a lesion.
- Another embodiment of the present disclosure provides an image processing system, including:
- an image acquisition device, configured to obtain dynamic contrast enhanced (DCE) magnetic resonance images corresponding to a plurality of time points for a same detection target;
- an image processing device, configured to respectively determine average pixel grayscale values of images of a same lesion region in the DCE magnetic resonance images of the plurality of time points, determine a time to peak according to the average pixel grayscale values corresponding to the plurality of time points, and generate a first-stage time-intensity image before the time to peak and a second-stage time-intensity image after the time to peak respectively according to the DCE magnetic resonance images of the plurality of time points and the time to peak, the first-stage time-intensity image and the second-stage time-intensity image being 3D images, and a grayscale value of a pixel at of each point in the first-stage time-intensity image and the second-stage time-intensity image representing a change rate of blood supply intensity and reflecting a severity level of a lesion; and
- a display device, configured to output and display the first-stage time-intensity image and the second-stage time-intensity image.
- Another embodiment of the present disclosure provides an electronic device, including:
- at least one memory, configured to store program instructions; and
- at least one processor, configured to invoke the program instructions stored in the memory, to perform any image processing method in the foregoing according to the obtained program instructions.
- Another embodiment of the present disclosure provides a computer-readable storage medium, storing a computer program, the computer program, when executed by a processor, implementing steps of any image processing method in the foregoing.
-
-
FIG. 1 is a schematic diagram of a conventional TIC generating principle. -
FIG. 2A is a schematic diagram of an implementation environment of an image processing method according to an embodiment of the present disclosure. -
FIG. 2B is a flowchart of an image processing method according to an embodiment of the present disclosure. -
FIG. 3 is a three-view diagram of DCE magnetic resonance images of 3D breast MRI according to an embodiment of the present disclosure. -
FIG. 4A is a schematic diagram of a TIC of a 3D lesion region according to an embodiment of the present disclosure. -
FIG. 4B is a schematic diagram of a first-order gradient curve corresponding to a TIC according to an embodiment of the present disclosure. -
FIG. 5A is a schematic diagram of a first-stage time-intensity image according to an embodiment of the present disclosure. -
FIG. 5B is a schematic diagram of a second-stage time-intensity image according to an embodiment of the present disclosure. -
FIG. 6 is schematic diagrams of a TIC of a point in another lesion region according to an embodiment of the present disclosure. -
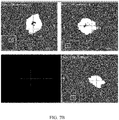
FIG. 7A is a schematic diagram of another DCE magnetic resonance image according to an embodiment of the present disclosure. -
FIG. 7B is a schematic diagram of another first-stage time-intensity image before a time to peak according to an embodiment of the present disclosure. -
FIG. 7C is a schematic diagram of another second-stage time-intensity image after a time to peak according to an embodiment of the present disclosure. -
FIG. 8 is a schematic structural diagram of an image processing apparatus according to an embodiment of the present disclosure. -
FIG. 9 is a schematic structural diagram of an image processing system according to an embodiment of the present disclosure. -
FIG. 10 is a schematic structural diagram of an electronic device according to an embodiment of the present disclosure. - The following clearly and completely describes the technical solutions in embodiments of the present disclosure with reference to the accompanying drawings in the embodiments of the present disclosure. Apparently, the described embodiments are some of the embodiments of the present disclosure rather than all of the embodiments. All other embodiments obtained by a person of ordinary skill in the art based on the embodiments of the present disclosure without creative efforts shall fall within the protection scope of the present disclosure.
- To facilitate the understanding of the embodiments of the present disclosure, the following concepts are briefly introduced.
- Contrast agent: also referred to as a contrast medium, which is a chemical product injected or taken into a human tissue or organ for enhancing image observation effects, where densities of the products are greater than or less than those of surrounding tissues, and formed contrast is displayed in images by using some instruments.
- Magnetic resonance imaging (MRI): one type of tomography, which mainly obtains electromagnetic signals from human bodies by using a magnetic resonance phenomenon, and reconstructs human body information.
- Dynamic contrast enhancement: physical and physiological properties of an organ or a tissue may be reflected by a level of signal enhancement. In practice, multi-temporal scanning may be performed based on DCE-MRI, to generate continuous dynamic images, and a series of semi-quantitative and quantitative parameters can be obtained by using a post-processing technology, to reflect enhancement features of a lesion more objectively, thereby providing richer and more complete information of physiological properties of a displayed region.
- Time-intensity curve (TIC): a curve based on MRI dynamic enhanced scanning, that is, a time-intensity curve generated by DCE-MRI. A TIC may reflect changes of image brightness of a tissue over time when the tissue is infused with a contrast medium. A qualitative analysis, grading, and other analyses may be performed for a lesion, such as a tumor, by observing a flow-in speed and an amount of the contrast medium in a lesion region, which has a certain value. A horizontal coordinate of the TIC represents time, and a vertical coordinate of the TIC represents a pixel grayscale value of a point in an image.
- In addition, for a better understanding, meanings represented by the TIC are now described. TICs may be classified as follows: type I, which is a continuously rising type, that is, after a contrast medium is injected, signal intensity of a lesion keeps rising, and the lesion showing the type I curve tends to be a benign lesion; type II, which is a platform type, that is, in a certain period of time after injection of a contrast medium, signal intensity of a lesion rises to a certain level, and then the signal intensity does not change obviously in a relatively long period of time; and type III, which is a flow-out type, that is, after a contrast medium is injected, signal intensity of a lesion rises to a certain level, and then decreases gradually, which is a fast-in fast-out type. Most of the type III TICs represent malignant lesions.
- Time to peak: a time at which a peak value is reached, which is mainly a time point with a largest change of signal intensity on a TIC in the embodiments of the present disclosure.
- Region of interest (ROI): a local region on original data. In the embodiments of the present disclosure, the ROI represents a 2-dimension (2D) or a 3-dimension (3D) rectangular region, and refers to a certain lesion region.
- Lesion: a part with a lesion on an organism.
- Grayscale value: representing a brightness value of a single pixel of a grayscale image. A larger value indicates that the pixel is brighter, and a smaller value indicates that the pixel is darker. The grayscale value may be used for describing a brightness value of a specific pixel in the image.
- In an analysis of images of MRI of breast tumors, the analysis is generally performed by generating a corresponding TIC based on DEC images. Specifically,
FIG. 1 is a schematic diagram of a conventional TIC generating principle. Through magnetic resonance scanning, DCE magnetic resonance images of a plurality of time points are obtained; a point is selected from a suspect lesion region, to obtain pixel grayscale values corresponding to the point in the DCE magnetic resonance images of different time points, and a curve is drawn, that is, the TIC. For example, as shown inFIG. 1 , DCE magnetic resonance images of 4 time points of a point are listed, which are DCE magnetic resonance images of t1, t2, t3, and t4, respectively, and a TIC of the point is obtained, shown in the right part ofFIG. 1 . A horizontal coordinate of the TIC represents a time point, and a vertical coordinate of the TIC represents a pixel grayscale value of the point. - However, the TIC generated in the foregoing method is a one-dimensional curve, which can only express changes of pixel values of a small region, and when the TIC is drawn, points are selected manually, which is random. Different doctors may select different points, but different points may bring about different diagnosis results, which is relatively one-sided, and thus a lesion region cannot be expressed completely and accurately.
- Therefore, for the foregoing problem, an embodiment of the present disclosure provides an image generation method. 3D images may be generated based on DCE magnetic resonance images, a conventional TIC is replaced with two 3D images, and information expressed by the TIC is expressed by the two 3D images. After DCE magnetic resonance images corresponding to a plurality of time points for the same detection target are obtained, average pixel grayscale values of images of the same lesion region in the DCE magnetic resonance images of the plurality of time points are determined, a time to peak is calculated, and then a first-stage time-intensity image before the time to peak and a second-stage time-intensity image after the time to peak are generated respectively according to the time to peak and the DCE magnetic resonance images of the plurality of time points. A grayscale value of a pixel at each point of the first-stage time-intensity image and the second-stage time-intensity image represents a change rate of blood supply intensity of the lesion region, which may reflect a severity level of the lesion region, so that the severity level of the lesion may be determined according to the pixel grayscale values of the first-stage time-intensity image and the second-stage time-intensity image, that is, brightness changes. Therefore, a 3D first-stage time-intensity image and a 3D second-stage time-intensity image may be generated, a larger amount of more complete lesion information can be provided, to show an overall situation of a lesion of a detection target, which is more complete and intuitive. In addition, specific quantitative information may further be provided, to provide more accurate and reliable diagnosis bases, thereby improving the accuracy of lesion diagnosis.
-
FIG. 2A is a schematic diagram of an implementation environment of an image processing method according to an embodiment of the present disclosure. As shown inFIG. 2A , the image processing method in the embodiments of the present disclosure may be performed by aterminal device 10, for example, a corresponding medical device, or may be performed by aserver 20. For example, theterminal device 10 transmits obtained DCE magnetic resonance images of a plurality of time points to theserver 20. Theserver 20 determines a time to peak, and generates a first-stage time-intensity image before the time to peak and a second-stage time-intensity image after the time to peak. The generated first-stage time-intensity image and second-stage time-intensity image may be transmitted to theterminal device 10. Theterminal device 10 may display the generated first-stage time-intensity image and second-stage time-intensity image. Theterminal device 10 may be connected to theserver 20 through anetwork 30, to implement intercommunication. Thenetwork 30 may be a wired network, or may be a wireless network. Theserver 20 may be considered as a backend server providing a corresponding network service. The embodiments of the present disclosure do not impose any limitation on the two manners. - In addition, in the embodiments of the present disclosure, the analysis of MRI images of breast tumors is mainly used as an example for description; certainly, the analysis is also applicable to other application scenarios. This is not limited in the embodiments of the present disclosure.
-
FIG. 2B is a flowchart of an image processing method according to an embodiment of the present disclosure. The method includes the following steps: - Step 200: Obtain DCE magnetic resonance images corresponding to a plurality of time points for the same detection target.
- The detection target, for example, is an organ or a tissue of a human body.
- For example, during analysis of a breast tumor, based on a magnetic resonance scanning instrument such as an MRI scanner, after scanning parameters are set, for example, parameters such as a scanning time and a scanning interval may be set, a breast may be scanned, to obtain DCE magnetic resonance images corresponding to a plurality of time points for the breast.
- Further, because a main objective in the embodiments of the present disclosure is to analyze a lesion, such as a tumor, a lesion region further needs to be determined in the DCE magnetic resonance images. An embodiment of the present disclosure provides an implementation:
a lesion region is determined in the DCE magnetic resonance images according to a preset image segmentation algorithm and lesion features. - In the embodiments of the present disclosure, 3D DCE magnetic resonance images may be obtained after MRI scanning, and a suspect lesion region, such as a tumor region, may be automatically determined on the 3D DCE magnetic resonance images according to the image segmentation algorithm. The suspect lesion region may be determined in one DCE magnetic resonance image, or may be determined in each of the DCE magnetic resonance images respectively. Of course, the lesion region may alternatively be determined in another manner. This is not limited in the embodiments of the present disclosure.
- Using breast MRI as an example,
FIG. 3 is a three-view diagram of DCE magnetic resonance images of 3D breast MRI according to an embodiment of the present disclosure. InFIG. 3 , an upper left image is a cross-sectional view, an upper right image is a sagittal plane view, and a lower right image is a coronal plane view (there is no image at the lower left part, which may be not considered). Through image segmentation, the lesion region may be determined. 3D regions shown in circles in the upper left image, the upper right image, and the lower right image inFIG. 3 are determined lesion regions. Highlighted circle regions at the intersection of two dotted lines shown in the upper left image, the upper right image, and the lower right image inFIG. 3 are actual tumor positions. Therefore, it may be learned that, the determined lesion region is basically accurate. - Step 210: Determine average pixel grayscale values of images of the same lesion region in the DCE magnetic resonance images of the plurality of time points respectively.
- In practice, each time point corresponds to one DCE sequence, that is, one DCE magnetic resonance image. In the embodiments of the present disclosure, for a DCE magnetic resonance image of any time point, grayscale values of all pixels in the lesion region are determined, an average pixel grayscale value is calculated, and the average pixel grayscale value is used as a grayscale value of the current time point. Therefore, there is no need to select a point from the lesion region for calculation; instead, the average pixel grayscale value is calculated, which can improve accuracy and express features of the entire lesion region more accurately.
- Step 220: Determine a time to peak according to the average pixel grayscale values corresponding to the plurality of time points.
- Step 220 specifically includes the following steps:
Step S1: Generate a TIC of the same lesion region according to the average pixel grayscale values corresponding to the plurality of time points. - That is, based on the plurality of time points, and the average pixel grayscale values corresponding to the plurality of time points, a TIC is generated, where a horizontal axis of the TIC represents an index value of time, and a vertical axis of the TIC represents an average pixel grayscale value of the lesion region.
- Step S2: Determine a first-order gradient curve corresponding to the TIC, and use a time point corresponding to a highest point on the corresponding first-order gradient curve as the time to peak.
- In an embodiment of the present disclosure, a time to peak is a point on the TIC with a largest change of signal intensity. During calculation of the point with the largest change of signal intensity, a first-order gradient curve corresponding to the TIC may be calculated first. Because a gradient may reflect an amount of change, a highest point on the first-order gradient curve is the point with the largest change of signal intensity, and the point is used as the time to peak.
- For example,
FIG. 4A is a schematic diagram of a TIC of a 3D lesion region according to an embodiment of the present disclosure.FIG. 4B is a schematic diagram of a first-order gradient curve corresponding to a TIC according to an embodiment of the present disclosure. By using DCE magnetic resonance images of 28 different time points as an example, as shown inFIG. 4A , horizontal coordinates aretime points 0 to 27, and vertical coordinates are average pixel grayscale values corresponding to the time points. A first-order gradient curve corresponding to the TIC ofFIG. 4A is calculated, as shown inFIG. 4B . It may be learned that, a time index 4 corresponds to a highest point of the first-order gradient curve, and thus, it may be obtained that the time to peak is 4. In addition, such a TIC may be usually divided into first-stage time-intensity and second-stage time-intensity. By using the time to peak as a segmentation point, that is, when the time index is 4, the first-stage time-intensity of the TIC ends, and the second-stage time-intensity starts. - Step 230: Generate a first-stage time-intensity image before the time to peak and a second-stage time-intensity image after the time to peak respectively according to the DCE magnetic resonance images of the plurality of time points and the time to peak, the first-stage time-intensity image and the second-stage time-intensity image being 3D images, and a grayscale value of a pixel at each point in the first-stage time-intensity image and the second-stage time-intensity image representing a change rate of blood supply intensity and reflecting a severity level of the lesion.
- Step 230 may be performed in the following manners:
First manner: generating a first-stage time-intensity image before the time to peak and a second-stage time-intensity image after the time to peak respectively, including the following steps:
Step S1: Determine a start time point and an end time point in the plurality of time points. - For example, as shown in
FIG. 4A , a start time point is anindex 0, and an end time point is an index 27. - Step S2: Generate the first-stage time-intensity image before the time to peak according to a difference value between the DCE magnetic resonance image of the time to peak and the DCE magnetic resonance image of the start time point.
- In an embodiment of the present disclosure, the first-stage time-intensity image represents a time-intensity image calculated for a first stage of the TIC. For example, as shown in
FIG. 4A , a start time point of the first-stage time-intensity image is atime index 0, and an end time point is the time to peak, which is an index 4. A first-stage time-intensity image may be calculated according to a difference value between DCE magnetic resonance images corresponding to thetime index 0 and the time index 4. - For example, the first-stage time-intensity image is denoted by TI1, a DCE magnetic resonance image with a value of a time index being t is denoted by I_DCE(t), and then the first-stage time-intensity image may be represented as:

δ is an infinitely small amount, and to avoid a scenario that a denominator is 0 during calculation, "*" is multiplication. - TI1 may represent an incremental percentage of a first-stage signal at the time to peak relative to I_DCE(0), that is, a grayscale value of a pixel at each point in the first-stage time-intensity image represents a change rate of blood supply intensity, which may reflect a severity level of a lesion.
- Step S3: Generate the second-stage time-intensity image after the time to peak according to a difference value between the DCE magnetic resonance image of the end time point and the DCE magnetic resonance image of the time to peak.
- In an embodiment of the present disclosure, the second-stage time-intensity image represents a time-intensity image calculated for a second stage of the TIC. For example, as shown in
FIG. 4A , a start time point of the second-stage time-intensity image is the time to peak, which is a time index 4, and an end time point is an index 27. A second-stage time-intensity image may be calculated according to a difference value between DCE magnetic resonance images corresponding to the time index 27 and the time index 4. - For example, the second-stage time-intensity image is denoted by TI2, a DCE magnetic resonance image with a value of a time index being t is denoted by I_DCE(t), and then the second-stage time-intensity image may be represented as:

- TI2 may represent an incremental percentage of an index of a time point at the end of a second-stage signal, for example, a grayscale change of a DCE magnetic resonance image of t=27, relative to I_DCE(4), that is, a grayscale value of a pixel at each point in the second-stage time-intensity image may also represent a change rate of blood supply intensity, which may reflect a severity level of a lesion.
- Second manner: generating a first-stage time-intensity image before the time to peak and a second-stage time-intensity image after the time to peak respectively, including the following steps:
Step S1: Determine a start time point and an end time point in the plurality of time points, and sample a preset quantity of time points from the plurality of time points. - For example, sampling may be performed according to actual requirements, and a plurality of time points may be selected from the time points.
- Step S2: Determine first difference values between the DCE magnetic resonance images of the time points sampled before the time to peak and the DCE magnetic resonance image of the start time point respectively, and generate the first-stage time-intensity image before the time to peak according to an average value of the first difference values.
- For example, the sampled time points are 3, 4, 8, and 25, and the time to peak is 4; in this case, the calculated first-stage time-intensity image may be represented as:

- Step S3: Determine second difference values between the DCE magnetic resonance images of the time points sampled after the time to peak and the DCE magnetic resonance image of the time to peak respectively, and generate the second-stage time-intensity image after the time to peak according to an average value of the second difference values.
- For example, the calculated second-stage time-intensity image may be represented as:

- In the embodiments of the present disclosure, generation of the first-stage time-intensity image and the second-stage time-intensity image is not limited to the foregoing two manners. For example, the first-stage time-intensity image may further be represented by using a difference value between a point, which is different from the time to peak, before the time to peak and the start time point; the second-stage time-intensity image may further be represented by using a difference value between a point after the time to peak and the time to peak. The generation manner may be specifically set according to actual requirements and situations, and is not limited in the embodiments of the present disclosure. The objective is to generate 3D images that may represent the change of image grayscale values before and after the time to peak.
- Therefore, in the embodiments of the present disclosure, because DCE magnetic resonance images are 3D images, the first-stage time-intensity image and the second-stage time-intensity image generated based on change rates of image grayscale values are also 3D images. In addition, when MRI scanning is performed, after a contrast medium (that is, a contrast agent) is injected, if there is a lesion such as a tumor, as time changes, image brightness (that is, image signal intensity) changes differently than in a normal situation. Therefore, a grayscale value of a pixel at each point in the first-stage time-intensity image and the second-stage time-intensity image generated by using changes of image grayscale values may be used for determining a lesion region and a severity level of the lesion region. A greater grayscale value means the image is brighter, and indicates a higher lesion possibility. A lesion level may be determined according to grayscale values of pixels in the lesion regions in the first-stage time-intensity image and the second-stage time-intensity image. For example, it may be determined whether a tumor is a benign tumor or a malignant tumor. For example, grayscale values of pixels in the lesion region in the first-stage time-intensity image are positive values and are greater than a specific threshold, and grayscale values of pixels in the lesion region in the second-stage time-intensity image are negative values and are less than a specific threshold, which means that an increment of the grayscale values increases gradually, and then decreases. This is similar to a fast-in fast-out type TIC, representing that a severity level of the lesion region is higher than a preset level. That is, generally, the tumor may be determined as a malignant tumor.
- For example,
FIG. 5A is a schematic diagram of a first-stage time-intensity image according to an embodiment of the present disclosure. As shown in the upper left image inFIG. 5A , an intersection of two dotted lines represents a point in a lesion region. It may be seen that a grayscale value of the point is 125.2, which means that brightness of I_DCE(4) increases by 125.2% relative to I_DCE(0), and a pixel grayscale value increases. -
FIG. 5B is a schematic diagram of a second-stage time-intensity image according to an embodiment of the present disclosure. As shown in the upper left image inFIG. 5B , an intersection of two dotted lines represents a point in a lesion region. It may be seen that a grayscale value of the point is -19.06, which means that brightness of I_DCE(27) decreases by 19.06% relative to I_DCE(4), and a pixel grayscale value decreases. By analyzing a plurality of points in the lesion region, it may be learned that pixel grayscale values increase gradually and then decrease, and it is highly possible that the lesion region is a tumor. - In addition, by mapping to a TIC, a similar conclusion may be obtained. For example,
FIG. 6 is a schematic diagram of a TIC of a point in another lesion region according to an embodiment of the present disclosure.FIG. 6(A) shows the entire TIC,FIG. 6(B) is a schematic diagram of a TIC before a time to peak, andFIG. 6(C) is a schematic diagram of a TIC after a time to peak. A point inFIG. 6 refers to a pixel at the intersection of two dotted lines inFIG. 5A andFIG. 5B . It may be learned that a TIC corresponding to the point is of a fast-in fast-out type, and it is more likely that the tumor is a malignant tumor. - Further, colors corresponding to different pixel grayscale values may be set. For example, positive grayscale values gradually increase from white to red, negative grayscale values gradually decrease from white to blue. In this case, the white color in the first-stage time-intensity image and the second-stage time-intensity image may represent that a small brightness difference, the red color may represent that the brightness increases, and the blue color represents that the brightness decreases, so that a lesion level may be directly determined according to color changes in the first-stage time-intensity image and the second-stage time-intensity image, which is more intuitive.
- In the embodiments of the present disclosure, based on the obtained DCE magnetic resonance images, average pixel grayscale values of images of the same lesion region in the DCE magnetic resonance images of the plurality of time points are respectively determined, and according to the average pixel grayscale values corresponding to the plurality of time points, a time to peak is determined; according to the DCE magnetic resonance images of the plurality of time points and the time to peak, a first-stage time-intensity image before the time to peak and a second-stage time-intensity image after the time to peak are generated respectively. Therefore, based on the DCE magnetic resonance images, two 3D images are generated, to replace a conventional one-dimensional TIC. The conventional one-dimensional TIC can only provide a benign/malignant result of one pixel, and if a doctor is not satisfied with the point, a new point needs to be selected for drawing again. When relying on a TIC to determine whether a lesion is benign or malignant, the doctor can only use some local pixels as bases, but cannot have a full picture of the tumor and the breast. By using a 3D first-stage time-intensity image and a 3D second-stage time-intensity image, high latitude expansion of information is implemented. The images not only can express information of the TIC, but also can provide benign/malignant results of all pixels simultaneously, to express changes of the entire lesion region or the entire breast region, which may provide a larger amount of more complete information of benign/malignant trends of the lesion region, and changes of a plurality of lesion regions may be displayed simultaneously. In addition, a more accurate diagnosis may be performed by combining the first-stage time-intensity image and the second-stage time-intensity image in this embodiment of the present disclosure with the conventional TIC, to avoid diagnosis errors caused by only using the TIC. For example, a platform type TIC is shown in
FIG. 4A , a diagnosis result tends to be benign. However, a TIC shown inFIG. 6(A) is of a fast-in fast-out type, and a diagnosis result tends to be malignant. It may be learned that in the same lesion region, due to selection of different pixels, different diagnosis results may be generated. However, in fact, the tumor of the lesion region is malignant. By using the first-stage time-intensity image and the second-stage time-intensity image generated in the embodiments of the present disclosure, a benign/malignant trend of the lesion region may be determined very accurately, which improves diagnosis accuracy. - Based on the foregoing embodiment, a specific application scenario is used for description in the following. The image processing method in an embodiment of the present disclosure is described by using image schematic diagrams of an implementation as an example.
- 1) In the embodiments of the present disclosure, by MRI scanning, DCE magnetic resonance images of a plurality of time points for a breast may be obtained. The DCE magnetic resonance images of the plurality of time points serve as an input.
FIG. 7A is a schematic diagram of another DCE magnetic resonance image according to an embodiment of the present disclosure, where an upper left image is a cross-sectional view, an upper right image is a sagittal plane view, and a lower right image is a coronal plane view, and highlighted regions on the images are lesion regions of a tumor. - 2) Based on the inputted DCE magnetic resonance images, a time to peak is determined, and a first-stage time-intensity image before the time to peak and a second-stage time-intensity image after the time to peak are generated respectively.
FIG. 7B is a schematic diagram of another first-stage time-intensity image before a time to peak according to an embodiment of the present disclosure.FIG. 7C is a schematic diagram of another second-stage time-intensity image after a time to peak according to an embodiment of the present disclosure.FIG. 7B andFIG. 7C are only schematic diagrams of a lesion region of a part of a tumor, showing changes of the lesion region of the tumor before and after the time to peak. Highlighted regions represent intensity of brightness increasing, and darker regions represent intensity of brightness decreasing. It may be seen fromFIG. 7B andFIG. 7C that, the highlighted regions of the lesion region of the tumor before the time to peak represent that the blood flow-in increases intensively, and the darker regions after the time to peak represent that a blood flow-out speed is relatively high. It may be learned that the tumor is of a fast-in fast-out type, and may be determined as a malignant tumor. - Based on the foregoing embodiment, an embodiment of the present disclosure further provides an image processing apparatus. As shown in
FIG. 8 , the image processing apparatus specifically includes: - an obtaining
module 80, configured to obtain dynamic contrast enhanced (DCE) magnetic resonance images corresponding to a plurality of time points for the same detection target; - a first determining
module 81, configured to determine average pixel grayscale values of images of the same lesion region in the DCE magnetic resonance images of the plurality of time points respectively; - a second determining
module 82, configured to determine a time to peak according to the average pixel grayscale values corresponding to the plurality of time points; and - a
generation module 83, configured to generate a first-stage time-intensity image before the time to peak and a second-stage time-intensity image after the time to peak respectively according to the DCE magnetic resonance images of the plurality of time points and the time to peak, the first-stage time-intensity image and the second-stage time-intensity image being 3D images, a grayscale value of a pixel at each point in the first-stage time-intensity image and the second-stage time-intensity image representing a change rate of blood supply intensity and reflecting a severity level of the lesion. - In an embodiment of the present disclosure, the first determining
module 81 is further configured to determine a lesion region in each of the DCE magnetic resonance images according to a preset image segmentation algorithm and lesion features. - In an embodiment of the present disclosure, when determining the time to peak according to the average pixel grayscale values corresponding to the plurality of time points, the second determining
module 82 is specifically configured to:
generate a TIC of the same lesion region according to the average pixel grayscale values corresponding to the plurality of time points; and determine a first-order gradient curve corresponding to the TIC, and use a time point corresponding to a highest point on the corresponding first-order gradient curve as the time to peak. - In an embodiment of the present disclosure, when generating the first-stage time-intensity image before the time to peak and the second-stage time-intensity image after the time to peak respectively, the
generation module 83 is specifically configured to: - determine a start time point and an end time point in the plurality of time points;
- generate the first-stage time-intensity image before the time to peak according to a difference value between the DCE magnetic resonance image of the time to peak and the DCE magnetic resonance image of the start time point; and
- generate the second-stage time-intensity image after the time to peak according to a difference value between the DCE magnetic resonance image of the end time point and the DCE magnetic resonance image of the time to peak.
- In an embodiment of the present disclosure, when generating the first-stage time-intensity image before the time to peak and the second-stage time-intensity image after the time to peak respectively, the
generation module 83 is specifically configured to: - determine a start time point and an end time point in the plurality of time points, and sample a preset quantity of time points from the plurality of time points;
- determine first difference values between the DCE magnetic resonance images of the time points sampled before the time to peak and the DCE magnetic resonance image of the start time point respectively, and generate the first-stage time-intensity image before the time to peak according to an average value of the first difference values; and
- determine second difference values between the DCE magnetic resonance images of the time points sampled after the time to peak and the DCE magnetic resonance image of the time to peak respectively, and generate the second-stage time-intensity image after the time to peak according to an average value of the second difference values.
- Based on the foregoing embodiment, an embodiment of the present disclosure further provides an image processing system. A schematic structural diagram of the image processing system is shown in
FIG. 9 . - The image processing system at least includes an
image acquisition device 90, animage processing device 91, and adisplay device 92. In an embodiment of the present disclosure, theimage acquisition device 90, theimage processing device 91, and thedisplay device 92 are related medical instruments, which may be integrated into the same medical instrument, and or may be divided into a plurality of devices connected to each other for communication, to form a medical system for use. For example, for an analysis of breast MRI impact tumors, theimage acquisition device 90, theimage processing device 91, and thedisplay device 92 may be integrated to be an MRI scanner. - Specifically, the
image acquisition device 90 is configured to obtain DCE magnetic resonance images corresponding to a plurality of time points for the same detection target. - The
image processing device 91 is configured to respectively determine average pixel grayscale values of images of the same lesion region in DCE magnetic resonance images of the plurality of time points, determine a time to peak according to the average pixel grayscale values corresponding to the plurality of time points, and generate a first-stage time-intensity image before the time to peak and a second-stage time-intensity image after the time to peak respectively according to the DCE magnetic resonance images of the plurality of time points and the time to peak, the first-stage time-intensity image and the second-stage time-intensity image being 3D images, a grayscale value of a pixel at each point in the first-stage time-intensity image and the second-stage time-intensity image representing a change rate of blood supply intensity and reflecting a severity level of the lesion. - Specifically, the method that the
image processing device 91 processes the DCE magnetic resonance images and generates the first-stage time-intensity image and the second-stage time-intensity image is the same as the image processing method in the foregoing embodiment. Details are not described herein again. - The
display device 92 is configured to output and display the first-stage time-intensity image and the second-stage time-intensity image. - Based on the foregoing embodiments, an embodiment of the present disclosure further provides an electronic device.
FIG. 10 is a schematic structural diagram of the electronic device. - The electronic device provided in this embodiment of the present disclosure may include at least one center processing unit (CPU) 1010, at least one
memory 1020, aninput device 1030, anoutput device 1040, and the like. Theinput device 1030 may include a keyboard, a mouse, a touch screen, and the like. Theoutput device 1040 may include a display device, such as a liquid crystal display (LCD) or a cathode ray tube (CRT). - The
memory 1020 may include a read-only memory (ROM) and a random access memory (RAM), and provide program instructions and data stored in thememory 1020 for theprocessor 1010. In an embodiment of the present disclosure, thememory 1020 may be configured to store program instructions of an image processing method according to the embodiments of the present disclosure. - The
processor 1010 invokes the program instructions stored in thememory 1020, and according to the obtained program instructions, theprocessor 1010 is configured to perform the following operations: - obtaining DCE magnetic resonance images corresponding to a plurality of time points for the same detection target;
- determining average pixel grayscale values of images of the same lesion region in the DCE magnetic resonance images of the plurality of time points respectively;
- determining a time to peak according to the average pixel grayscale values corresponding to the plurality of time points; and
- generating a first-stage time-intensity image before the time to peak and a second-stage time-intensity image after the time to peak respectively according to the DCE magnetic resonance images of the plurality of time points and the time to peak, the first-stage time-intensity image and the second-stage time-intensity image being 3D images, a grayscale value of a pixel at each point in the first-stage time-intensity image and the second-stage time-intensity image representing a change rate of blood supply intensity and reflecting a severity level of the lesion.
- In an embodiment of the present disclosure, the
processor 1010 is further configured to: determine a lesion region in each of the DCE magnetic resonance images according to a preset image segmentation algorithm and lesion features. - In an embodiment of the present disclosure, when determining the time to peak according to the average pixel grayscale values corresponding to the plurality of time points, the
processor 1010 is specifically configured to:
generate a TIC of the same lesion region according to the average pixel grayscale values corresponding to the plurality of time points; and determine a first-order gradient curve corresponding to the TIC, and use a time point corresponding to a highest point on the corresponding first-order gradient curve as the time to peak. - In an embodiment of the present disclosure, when generating the first-stage time-intensity image before the time to peak and the second-stage time-intensity image after the time to peak respectively, the
processor 1010 is specifically configured to: - determine a start time point and an end time point in the plurality of time points;
- generate the first-stage time-intensity image before the time to peak according to a difference value between the DCE magnetic resonance image of the time to peak and the DCE magnetic resonance image of the start time point; and
- generate the second-stage time-intensity image after the time to peak according to a difference value between the DCE magnetic resonance image of the end time point and the DCE magnetic resonance image of the time to peak.
- In an embodiment of the present disclosure, when generating the first-stage time-intensity image before the time to peak and the second-stage time-intensity image after the time to peak respectively, the
processor 1010 is specifically configured to: - determine a start time point and an end time point in the plurality of time points, and sample a preset quantity of time points from the plurality of time points;
- determine first difference values between the DCE magnetic resonance images of the time points sampled before the time to peak and the DCE magnetic resonance image of the start time point respectively, and generate the first-stage time-intensity image before the time to peak according to an average value of the first difference values; and
- determine second difference values between the DCE magnetic resonance images of the time points sampled after the time to peak and the DCE magnetic resonance image of the time to peak respectively, and generate the second-stage time-intensity image after the time to peak according to an average value of the second difference values.
- In an embodiment of the present disclosure, the electronic device may be a medical device, mainly for medical image processing; certainly, the electronic device may alternatively be a terminal device or a server, and the image processing method is performed by the terminal device or the server.
- Based on the foregoing embodiments, an embodiment of the present disclosure provides a computer-readable storage medium, storing a computer program, the computer program, when executed by a processor, implementing the image processing method according to any method embodiment described above.
- A person skilled in the art can understand that the embodiments of the present disclosure may be provided as a method, a system, or a computer program product. Therefore, the present disclosure may use a form of hardware-only embodiments, software-only embodiments, or embodiments combining software and hardware. Moreover, an embodiment of the present disclosure may use a form of a computer program product that is implemented on one or more computer-usable storage media (including but not limited to a disk memory, a CD-ROM, an optical memory, and the like) that include computer-usable program code.
- The present disclosure is described with reference to flowcharts and/or block diagrams of the method, the device (system), and the computer program product according to the embodiments of the present disclosure. It is to be understood that computer program instructions can implement each procedure and/or block in the flowcharts and/or block diagrams and a combination of procedures and/or blocks in the flowcharts and/or block diagrams. These computer program instructions may be provided to a general-purpose computer, a special-purpose computer, an embedded processor, or a processor of another programmable data processing device to generate a machine, so that an apparatus configured to implement functions specified in one or more procedures in the flowcharts and/or one or more blocks in the block diagrams is generated by using instructions executed by the computer or the processor of another programmable data processing device.
- These computer program instructions may alternatively be stored in a computer-readable memory that can instruct a computer or another programmable data processing device to work in a specific manner, so that the instructions stored in the computer-readable memory generate an artifact that includes an instruction apparatus. The instruction apparatus implements a specific function in one or more procedures in the flowcharts and/or in one or more blocks in the block diagrams.
- These computer program instructions may further be loaded onto a computer or another programmable data processing device, so that a series of operations and steps are performed on the computer or the another programmable device, thereby generating computer-implemented processing. Therefore, the instructions executed on the computer or the another programmable device provide steps for implementing a specific function in one or more processes in the flowcharts and/or in one or more blocks in the block diagrams.
- Although exemplary embodiments of the present disclosure have been described, once persons skilled in the art know the basic creative concept, they can make additional changes and modifications to these embodiments. Therefore, the following claims are intended to be construed as to cover the exemplary embodiments and all changes and modifications falling within the scope of the present disclosure.
- Obviously, a person skilled in the art can make various modifications and variations to the embodiments of the present disclosure without departing from the spirit and scope of the embodiments of the present disclosure. In this way, if these modifications and variations made to the embodiments of the present disclosure fall within the scope of the claims of the present disclosure and equivalent technologies thereof, the present disclosure also intends to include these changes and variations.
Claims (12)
- An image processing method, performed by an electronic device, the method comprising:obtaining dynamic contrast enhanced (DCE) magnetic resonance images corresponding to a plurality of time points for a same detection target;determining average pixel grayscale values of images of a same lesion region in the DCE magnetic resonance images of the plurality of time points respectively;determining a time to peak according to the average pixel grayscale values corresponding to the plurality of time points; andgenerating a first-stage time-intensity image before the time to peak and a second-stage time-intensity image after the time to peak respectively according to the DCE magnetic resonance images of the plurality of time points and the time to peak, the first-stage time-intensity image and the second-stage time-intensity image being 3D images, and a grayscale value of a pixel at each point in the first-stage time-intensity image and the second-stage time-intensity image representing a change rate of blood supply intensity and reflecting a severity level of a lesion.
- The method according to claim 1, further comprising:
determining the lesion region in each of the DCE magnetic resonance images according to a preset image segmentation algorithm and lesion features. - The method according to claim 1, wherein the determining a time to peak according to the average pixel grayscale values corresponding to the plurality of time points comprises:generating a time-intensity curve (TIC) of the same lesion region according to the average pixel grayscale values corresponding to the plurality of time points; anddetermining a first-order gradient curve corresponding to the TIC, and using a time point corresponding to a highest point on the first-order gradient curve as the time to peak.
- The method according to any one of claims 1 to 3, wherein the generating a first-stage time-intensity image before the time to peak and a second-stage time-intensity image after the time to peak respectively comprises:determining a start time point and an end time point in the plurality of time points;generating the first-stage time-intensity image before the time to peak according to a difference value between the DCE magnetic resonance image of the time to peak and the DCE magnetic resonance image of the start time point; andgenerating the second-stage time-intensity image after the time to peak according to a difference value between the DCE magnetic resonance image of the end time point and the DCE magnetic resonance image of the time to peak.
- The method according to any one of claims 1 to 3, wherein the generating a first-stage time-intensity image before the time to peak and a second-stage time-intensity image after the time to peak respectively comprises:determining a start time point and an end time point in the plurality of time points, and sampling a preset quantity of time points from the plurality of time points;determining first difference values between the DCE magnetic resonance images of the time points sampled before the time to peak and the DCE magnetic resonance image of the start time point respectively, and generating the first-stage time-intensity image before the time to peak according to an average value of the first difference values; anddetermining second difference values between the DCE magnetic resonance images of the time points sampled after the time to peak and the DCE magnetic resonance image of the time to peak respectively, and generating the second-stage time-intensity image after the time to peak according to an average value of the second difference values.
- The method according to claim 1, wherein when grayscale values of pixels of the lesion region in the first-stage time-intensity image are positive values and are greater than a specific threshold, and grayscale values of pixels of the lesion region in the second-stage time-intensity image are negative values and are less than a specific threshold, a severity level of the lesion region is higher than a preset level.
- An image processing apparatus, comprising:an obtaining module, configured to obtain dynamic contrast enhanced (DCE) magnetic resonance images corresponding to a plurality of time points for a same detection target;a first determining module, configured to determine average pixel grayscale values of images of a same lesion region in the DCE magnetic resonance images of the plurality of time points respectively;a second determining module, configured to determine a time to peak according to the average pixel grayscale values corresponding to the plurality of time points; anda generation module, configured to generate a first-stage time-intensity image before the time to peak and a second-stage time-intensity image after the time to peak respectively according to the DCE magnetic resonance images of the plurality of time points and the time to peak, the first-stage time-intensity image and the second-stage time-intensity image being 3D images, and a grayscale value of a pixel at each point in the first-stage time-intensity image and the second-stage time-intensity image representing a change rate of blood supply intensity and reflecting a severity level of a lesion.
- The apparatus according to claim 7, wherein the generation module is further configured to:determine a start time point and an end time point in the plurality of time points;generate the first-stage time-intensity image before the time to peak according to a difference value between the DCE magnetic resonance image of the time to peak and the DCE magnetic resonance image of the start time point; andgenerate the second-stage time-intensity image after the time to peak according to a difference value between the DCE magnetic resonance image of the end time point and the DCE magnetic resonance image of the time to peak.
- The apparatus according to claim 7, wherein the generation module is further configured to:determine a start time point and an end time point in the plurality of time points, and sample a preset quantity of time points from the plurality of time points;determine first difference values between the DCE magnetic resonance images of the time points sampled before the time to peak and the DCE magnetic resonance image of the start time point respectively, and generate the first-stage time-intensity image before the time to peak according to an average value of the first difference values; anddetermine second difference values between the DCE magnetic resonance images of the time points sampled after the time to peak and the DCE magnetic resonance image of the time to peak respectively, and generate the second-stage time-intensity image after the time to peak according to an average value of the second difference values.
- An image processing system, comprising:an image acquisition device, configured to obtain dynamic contrast enhanced (DCE) magnetic resonance images corresponding to a plurality of time points for a same detection target;an image processing device, configured to respectively determine average pixel grayscale values of images of a same lesion region in the DCE magnetic resonance images of the plurality of time points, determine a time to peak according to the average pixel grayscale values corresponding to the plurality of time points, and generate a first-stage time-intensity image before the time to peak and a second-stage time-intensity image after the time to peak respectively according to the DCE magnetic resonance images of the plurality of time points and the time to peak, the first-stage time-intensity image and the second-stage time-intensity image being 3D images, and a grayscale value of a pixel at each point in the first-stage time-intensity image and the second-stage time-intensity image representing a change rate of blood supply intensity and reflecting a severity level of a lesion; anda display device, configured to output and display the first-stage time-intensity image and the second-stage time-intensity image.
- An electronic device, comprising:at least one memory, configured to store program instructions; andat least one processor, configured to invoke the program instructions stored in the memory, to perform the method according to any of claims 1 to 6 according to the obtained program instructions.
- A computer-readable storage medium, storing a computer program, the computer program, when executed by a processor, performing operations of the method according to any one of claims 1 to 6.
Applications Claiming Priority (2)
| Application Number | Priority Date | Filing Date | Title |
|---|---|---|---|
| CN201910138930.6A CN109949274B (en) | 2019-02-25 | 2019-02-25 | Image processing method, device and system |
| PCT/CN2020/076518 WO2020173416A1 (en) | 2019-02-25 | 2020-02-25 | Image processing method, apparatus and system, and electronic device and storage medium |
Publications (3)
| Publication Number | Publication Date |
|---|---|
| EP3933759A1 true EP3933759A1 (en) | 2022-01-05 |
| EP3933759A4 EP3933759A4 (en) | 2022-04-20 |
| EP3933759B1 EP3933759B1 (en) | 2025-02-12 |
Family
ID=67006896
Family Applications (1)
| Application Number | Title | Priority Date | Filing Date |
|---|---|---|---|
| EP20762231.7A Active EP3933759B1 (en) | 2019-02-25 | 2020-02-25 | Image processing method, apparatus and system, and electronic device and storage medium |
Country Status (5)
| Country | Link |
|---|---|
| US (1) | US11928816B2 (en) |
| EP (1) | EP3933759B1 (en) |
| CN (2) | CN110458834B (en) |
| TW (1) | TWI788629B (en) |
| WO (1) | WO2020173416A1 (en) |
Families Citing this family (6)
| Publication number | Priority date | Publication date | Assignee | Title |
|---|---|---|---|---|
| CN110458834B (en) | 2019-02-25 | 2021-02-09 | 腾讯科技(深圳)有限公司 | Breast tumor image processing system, method and device |
| US11521314B2 (en) * | 2019-12-31 | 2022-12-06 | Shanghai United Imaging Healthcare Co., Ltd. | Systems and methods for image processing |
| CN116188483A (en) * | 2021-11-26 | 2023-05-30 | 深圳迈瑞生物医疗电子股份有限公司 | Method for processing myocardial reperfusion data and ultrasound imaging system |
| CN116580007A (en) * | 2023-05-16 | 2023-08-11 | 西安工程大学 | Whole-breast information analysis method for predicting the efficacy of neoadjuvant therapy for breast cancer |
| CN117496277B (en) * | 2024-01-02 | 2024-03-12 | 达州市中心医院(达州市人民医院) | Rectal cancer image data modeling processing method and system based on artificial intelligence |
| CN118392646B (en) * | 2024-04-16 | 2024-11-22 | 中国科学院力学研究所 | A method for evaluating the impact energy release of active materials based on image processing |
Family Cites Families (29)
| Publication number | Priority date | Publication date | Assignee | Title |
|---|---|---|---|---|
| US7106892B2 (en) * | 2002-09-19 | 2006-09-12 | Koninklijke Philips Electronics, N.V. | Display of image data information |
| DE602005011515D1 (en) | 2004-03-31 | 2009-01-22 | Toshiba Kk | Apparatus and method for processing medical images |
| US7599542B2 (en) * | 2005-04-08 | 2009-10-06 | John Philip Brockway | System and method for detection and display of diseases and abnormalities using confidence imaging |
| JP2007301181A (en) | 2006-05-11 | 2007-11-22 | Ge Medical Systems Global Technology Co Llc | Ultrasonic diagnostic apparatus and image display method |
| CN101626726B (en) * | 2007-02-02 | 2013-01-09 | 阿波罗医学影像技术控股有限公司 | Identification and analysis of lesions in medical imaging |
| JP5398189B2 (en) * | 2008-07-23 | 2014-01-29 | 株式会社日立製作所 | Magnetic resonance imaging system |
| CA2732276A1 (en) * | 2008-07-29 | 2010-02-04 | Board Of Trustees Of Michigan State University | System and method for differentiating benign from malignant contrast-enhanced lesions |
| JP5455379B2 (en) * | 2009-01-07 | 2014-03-26 | 株式会社東芝 | Medical image processing apparatus, ultrasonic diagnostic apparatus, and medical image processing program |
| WO2010117025A1 (en) * | 2009-04-10 | 2010-10-14 | 株式会社 日立メディコ | Ultrasonic diagnosis apparatus and method for constructing distribution image of blood flow dynamic state |
| TWI387445B (en) * | 2009-09-17 | 2013-03-01 | 國立臺灣大學 | Method for obtaining image biological index, condition prediction method, condition prediction device and computer program product |
| TWI578977B (en) | 2011-04-07 | 2017-04-21 | 香港中文大學 | Device for retinal image analysis |
| CN102247144A (en) * | 2011-04-18 | 2011-11-23 | 大连理工大学 | Time intensity characteristic-based computer aided method for diagnosing benign and malignant breast lesions |
| WO2014024453A1 (en) * | 2012-08-07 | 2014-02-13 | パナソニック株式会社 | Medical data processing device, medical data processing method, and ultrasound diagnostic device |
| JP6208243B2 (en) * | 2013-08-27 | 2017-10-04 | 株式会社日立製作所 | Morbidity assessment device, morbidity assessment method, and morbidity assessment program |
| CN103514607A (en) * | 2013-10-18 | 2014-01-15 | 南京信息工程大学 | Dynamic contrast enhancement magnetic resonance image detection method |
| CN103886576B (en) * | 2013-11-22 | 2017-06-06 | 沈阳东软医疗系统有限公司 | A kind of gland tissue signature grey scale detection method and device |
| WO2016060611A1 (en) * | 2014-10-13 | 2016-04-21 | Agency For Science, Technology And Research | Automatic region-of-interest segmentation and registration of dynamic contrast-enhanced images of colorectal tumors |
| JP6697261B2 (en) * | 2014-12-26 | 2020-05-20 | キヤノンメディカルシステムズ株式会社 | Magnetic resonance imaging apparatus, diffusion weighted image generation method, and image processing apparatus |
| HK1248112A1 (en) * | 2015-02-02 | 2018-10-12 | Novadaq Technologies ULC | Methods and systems for characterizing tissue of a subject |
| WO2016187656A1 (en) | 2015-05-22 | 2016-12-01 | La Trobe University | Method of diagnosis of breast cancer |
| JP6707320B2 (en) * | 2015-06-01 | 2020-06-10 | キヤノンメディカルシステムズ株式会社 | Image processing apparatus and X-ray diagnostic apparatus |
| CN105249990B (en) * | 2015-09-08 | 2016-08-17 | 西安交通大学 | A kind of ultrasonic contrast perfusion parameter fast imaging method |
| MX2018009566A (en) * | 2016-02-08 | 2019-05-30 | Imago Systems Inc | System and method for the visualization and characterization of objects in images. |
| CN105879064A (en) * | 2016-04-08 | 2016-08-24 | 江南大学 | Examination indexes of SonoVue ultrasonic contrast technology in diagnosis and treatment of tumor angiogenesis mimicry |
| JP6812815B2 (en) * | 2017-01-31 | 2021-01-13 | 株式会社島津製作所 | X-ray imaging device and X-ray image analysis method |
| CN107569248B (en) | 2017-08-07 | 2020-09-11 | 东软医疗系统股份有限公司 | Exposure method of mammary machine equipment and mammary machine equipment |
| CN108460748B (en) * | 2018-04-28 | 2020-04-14 | 东北大学 | Method, system and diagnosis system for acquiring characteristic training parameters for breast tumor analysis |
| CN109242866B (en) * | 2018-11-08 | 2021-11-09 | 中国科学院生物物理研究所 | Automatic auxiliary breast tumor detection system based on diffusion magnetic resonance image |
| CN110458834B (en) * | 2019-02-25 | 2021-02-09 | 腾讯科技(深圳)有限公司 | Breast tumor image processing system, method and device |
-
2019
- 2019-02-25 CN CN201910755538.6A patent/CN110458834B/en active Active
- 2019-02-25 CN CN201910138930.6A patent/CN109949274B/en active Active
-
2020
- 2020-02-18 TW TW109105166A patent/TWI788629B/en active
- 2020-02-25 EP EP20762231.7A patent/EP3933759B1/en active Active
- 2020-02-25 WO PCT/CN2020/076518 patent/WO2020173416A1/en not_active Ceased
-
2021
- 2021-07-22 US US17/383,359 patent/US11928816B2/en active Active
Also Published As
| Publication number | Publication date |
|---|---|
| CN110458834B (en) | 2021-02-09 |
| CN109949274B (en) | 2020-12-25 |
| US11928816B2 (en) | 2024-03-12 |
| EP3933759B1 (en) | 2025-02-12 |
| WO2020173416A1 (en) | 2020-09-03 |
| TWI788629B (en) | 2023-01-01 |
| US20210350537A1 (en) | 2021-11-11 |
| TW202033159A (en) | 2020-09-16 |
| CN110458834A (en) | 2019-11-15 |
| EP3933759A4 (en) | 2022-04-20 |
| CN109949274A (en) | 2019-06-28 |
Similar Documents
| Publication | Publication Date | Title |
|---|---|---|
| US11928816B2 (en) | Image processing method, apparatus, and system, electronic device, and storage medium | |
| US11715202B2 (en) | Analyzing apparatus and analyzing method | |
| US8423124B2 (en) | Method and system for spine visualization in 3D medical images | |
| CN104504687B (en) | A kind of ultrasonic contrast image analysis method and its system | |
| US9390546B2 (en) | Methods and systems for removing occlusions in 3D ultrasound images | |
| CN111161216A (en) | Intravascular ultrasound image processing method, device, equipment and storage medium based on deep learning | |
| KR101728044B1 (en) | Method and apparatus for displaying medical image | |
| CN111127430A (en) | Method and device for determining medical image display parameters | |
| US20140355863A1 (en) | Image processing apparatus, method and medical image device | |
| CN120859544A (en) | Ultrasonic image acquisition quality evaluation method and ultrasonic imaging equipment | |
| JP2018524071A (en) | Selection of transfer function for displaying medical images | |
| JP2020131019A (en) | Image processing equipment, image processing methods, and programs | |
| CN113538352B (en) | Method and device for obtaining stroke tissue window evaluation value, and storage medium | |
| US11561273B2 (en) | Medical image processing apparatus and method | |
| CN116777837A (en) | A quality control system and method for thyroid ultrasound imaging scanning standards | |
| JP7408381B2 (en) | Image processing device, program and method | |
| HK40009633A (en) | Method, apparatus, and system for processing image | |
| HK40009633B (en) | Method, apparatus, and system for processing image | |
| US20260041401A1 (en) | Ultrasound imaging system and method for volumetric parametric imaging in contrast enhanced ultrasound imaging | |
| CN113764072B (en) | Medical image reconstruction method, device, equipment and storage medium | |
| US7609854B2 (en) | Method for displaying medical image information dependent on a detected position of the observer | |
| CN120827399A (en) | A quantitative analysis method for super-resolution angiography and an ultrasound imaging system | |
| EP4159109A1 (en) | Image generating device, program, and image generating method | |
| US20200098109A1 (en) | Image processing device, image processing method, and image processing program | |
| CN113764072A (en) | Medical image reconstruction method, device, equipment and storage medium |
Legal Events
| Date | Code | Title | Description |
|---|---|---|---|
| STAA | Information on the status of an ep patent application or granted ep patent |
Free format text: STATUS: THE INTERNATIONAL PUBLICATION HAS BEEN MADE |
|
| PUAI | Public reference made under article 153(3) epc to a published international application that has entered the european phase |
Free format text: ORIGINAL CODE: 0009012 |
|
| STAA | Information on the status of an ep patent application or granted ep patent |
Free format text: STATUS: REQUEST FOR EXAMINATION WAS MADE |
|
| 17P | Request for examination filed |
Effective date: 20210423 |
|
| AK | Designated contracting states |
Kind code of ref document: A1 Designated state(s): AL AT BE BG CH CY CZ DE DK EE ES FI FR GB GR HR HU IE IS IT LI LT LU LV MC MK MT NL NO PL PT RO RS SE SI SK SM TR |
|
| A4 | Supplementary search report drawn up and despatched |
Effective date: 20220317 |
|
| RIC1 | Information provided on ipc code assigned before grant |
Ipc: G01R 33/563 20060101ALI20220311BHEP Ipc: G01R 33/56 20060101ALI20220311BHEP Ipc: A61B 5/055 20060101ALI20220311BHEP Ipc: A61B 5/026 20060101ALI20220311BHEP Ipc: A61B 5/00 20060101ALI20220311BHEP Ipc: G06T 7/00 20170101AFI20220311BHEP |
|
| DAV | Request for validation of the european patent (deleted) | ||
| DAX | Request for extension of the european patent (deleted) | ||
| RAP3 | Party data changed (applicant data changed or rights of an application transferred) |
Owner name: TENCENT TECHNOLOGY (SHENZHEN) COMPANY LIMITED |
|
| GRAP | Despatch of communication of intention to grant a patent |
Free format text: ORIGINAL CODE: EPIDOSNIGR1 |
|
| STAA | Information on the status of an ep patent application or granted ep patent |
Free format text: STATUS: GRANT OF PATENT IS INTENDED |
|
| INTG | Intention to grant announced |
Effective date: 20241118 |
|
| GRAS | Grant fee paid |
Free format text: ORIGINAL CODE: EPIDOSNIGR3 |
|
| GRAA | (expected) grant |
Free format text: ORIGINAL CODE: 0009210 |
|
| STAA | Information on the status of an ep patent application or granted ep patent |
Free format text: STATUS: THE PATENT HAS BEEN GRANTED |
|
| AK | Designated contracting states |
Kind code of ref document: B1 Designated state(s): AL AT BE BG CH CY CZ DE DK EE ES FI FR GB GR HR HU IE IS IT LI LT LU LV MC MK MT NL NO PL PT RO RS SE SI SK SM TR |
|
| REG | Reference to a national code |
Ref country code: GB Ref legal event code: FG4D |
|
| REG | Reference to a national code |
Ref country code: CH Ref legal event code: EP |
|
| REG | Reference to a national code |
Ref country code: DE Ref legal event code: R096 Ref document number: 602020045942 Country of ref document: DE |
|
| REG | Reference to a national code |
Ref country code: IE Ref legal event code: FG4D |
|
| REG | Reference to a national code |
Ref country code: NL Ref legal event code: MP Effective date: 20250212 |
|
| PG25 | Lapsed in a contracting state [announced via postgrant information from national office to epo] |
Ref country code: RS Free format text: LAPSE BECAUSE OF FAILURE TO SUBMIT A TRANSLATION OF THE DESCRIPTION OR TO PAY THE FEE WITHIN THE PRESCRIBED TIME-LIMIT Effective date: 20250512 |
|
| PG25 | Lapsed in a contracting state [announced via postgrant information from national office to epo] |
Ref country code: FI Free format text: LAPSE BECAUSE OF FAILURE TO SUBMIT A TRANSLATION OF THE DESCRIPTION OR TO PAY THE FEE WITHIN THE PRESCRIBED TIME-LIMIT Effective date: 20250212 |
|
| PG25 | Lapsed in a contracting state [announced via postgrant information from national office to epo] |
Ref country code: PL Free format text: LAPSE BECAUSE OF FAILURE TO SUBMIT A TRANSLATION OF THE DESCRIPTION OR TO PAY THE FEE WITHIN THE PRESCRIBED TIME-LIMIT Effective date: 20250212 |
|
| PG25 | Lapsed in a contracting state [announced via postgrant information from national office to epo] |
Ref country code: ES Free format text: LAPSE BECAUSE OF FAILURE TO SUBMIT A TRANSLATION OF THE DESCRIPTION OR TO PAY THE FEE WITHIN THE PRESCRIBED TIME-LIMIT Effective date: 20250212 |
|
| REG | Reference to a national code |
Ref country code: LT Ref legal event code: MG9D |
|
| PG25 | Lapsed in a contracting state [announced via postgrant information from national office to epo] |
Ref country code: IS Free format text: LAPSE BECAUSE OF FAILURE TO SUBMIT A TRANSLATION OF THE DESCRIPTION OR TO PAY THE FEE WITHIN THE PRESCRIBED TIME-LIMIT Effective date: 20250612 Ref country code: NO Free format text: LAPSE BECAUSE OF FAILURE TO SUBMIT A TRANSLATION OF THE DESCRIPTION OR TO PAY THE FEE WITHIN THE PRESCRIBED TIME-LIMIT Effective date: 20250512 |
|
| PG25 | Lapsed in a contracting state [announced via postgrant information from national office to epo] |
Ref country code: NL Free format text: LAPSE BECAUSE OF FAILURE TO SUBMIT A TRANSLATION OF THE DESCRIPTION OR TO PAY THE FEE WITHIN THE PRESCRIBED TIME-LIMIT Effective date: 20250212 |
|
| PG25 | Lapsed in a contracting state [announced via postgrant information from national office to epo] |
Ref country code: HR Free format text: LAPSE BECAUSE OF FAILURE TO SUBMIT A TRANSLATION OF THE DESCRIPTION OR TO PAY THE FEE WITHIN THE PRESCRIBED TIME-LIMIT Effective date: 20250212 |
|
| PG25 | Lapsed in a contracting state [announced via postgrant information from national office to epo] |
Ref country code: PT Free format text: LAPSE BECAUSE OF FAILURE TO SUBMIT A TRANSLATION OF THE DESCRIPTION OR TO PAY THE FEE WITHIN THE PRESCRIBED TIME-LIMIT Effective date: 20250612 Ref country code: LV Free format text: LAPSE BECAUSE OF FAILURE TO SUBMIT A TRANSLATION OF THE DESCRIPTION OR TO PAY THE FEE WITHIN THE PRESCRIBED TIME-LIMIT Effective date: 20250212 |
|
| PG25 | Lapsed in a contracting state [announced via postgrant information from national office to epo] |
Ref country code: GR Free format text: LAPSE BECAUSE OF FAILURE TO SUBMIT A TRANSLATION OF THE DESCRIPTION OR TO PAY THE FEE WITHIN THE PRESCRIBED TIME-LIMIT Effective date: 20250513 Ref country code: BG Free format text: LAPSE BECAUSE OF FAILURE TO SUBMIT A TRANSLATION OF THE DESCRIPTION OR TO PAY THE FEE WITHIN THE PRESCRIBED TIME-LIMIT Effective date: 20250212 |
|
| REG | Reference to a national code |
Ref country code: AT Ref legal event code: MK05 Ref document number: 1766803 Country of ref document: AT Kind code of ref document: T Effective date: 20250212 |
|
| PG25 | Lapsed in a contracting state [announced via postgrant information from national office to epo] |
Ref country code: SE Free format text: LAPSE BECAUSE OF FAILURE TO SUBMIT A TRANSLATION OF THE DESCRIPTION OR TO PAY THE FEE WITHIN THE PRESCRIBED TIME-LIMIT Effective date: 20250212 |
|
| REG | Reference to a national code |
Ref country code: CH Ref legal event code: PL |
|
| PG25 | Lapsed in a contracting state [announced via postgrant information from national office to epo] |
Ref country code: SM Free format text: LAPSE BECAUSE OF FAILURE TO SUBMIT A TRANSLATION OF THE DESCRIPTION OR TO PAY THE FEE WITHIN THE PRESCRIBED TIME-LIMIT Effective date: 20250212 |
|
| PG25 | Lapsed in a contracting state [announced via postgrant information from national office to epo] |
Ref country code: DK Free format text: LAPSE BECAUSE OF FAILURE TO SUBMIT A TRANSLATION OF THE DESCRIPTION OR TO PAY THE FEE WITHIN THE PRESCRIBED TIME-LIMIT Effective date: 20250212 |
|
| PG25 | Lapsed in a contracting state [announced via postgrant information from national office to epo] |
Ref country code: IT Free format text: LAPSE BECAUSE OF FAILURE TO SUBMIT A TRANSLATION OF THE DESCRIPTION OR TO PAY THE FEE WITHIN THE PRESCRIBED TIME-LIMIT Effective date: 20250212 Ref country code: LU Free format text: LAPSE BECAUSE OF NON-PAYMENT OF DUE FEES Effective date: 20250225 |
|
| PG25 | Lapsed in a contracting state [announced via postgrant information from national office to epo] |
Ref country code: AT Free format text: LAPSE BECAUSE OF FAILURE TO SUBMIT A TRANSLATION OF THE DESCRIPTION OR TO PAY THE FEE WITHIN THE PRESCRIBED TIME-LIMIT Effective date: 20250212 |
|
| PG25 | Lapsed in a contracting state [announced via postgrant information from national office to epo] |
Ref country code: CH Free format text: LAPSE BECAUSE OF NON-PAYMENT OF DUE FEES Effective date: 20250228 |
|
| PG25 | Lapsed in a contracting state [announced via postgrant information from national office to epo] |
Ref country code: EE Free format text: LAPSE BECAUSE OF FAILURE TO SUBMIT A TRANSLATION OF THE DESCRIPTION OR TO PAY THE FEE WITHIN THE PRESCRIBED TIME-LIMIT Effective date: 20250212 Ref country code: CZ Free format text: LAPSE BECAUSE OF FAILURE TO SUBMIT A TRANSLATION OF THE DESCRIPTION OR TO PAY THE FEE WITHIN THE PRESCRIBED TIME-LIMIT Effective date: 20250212 |
|
| PG25 | Lapsed in a contracting state [announced via postgrant information from national office to epo] |
Ref country code: RO Free format text: LAPSE BECAUSE OF FAILURE TO SUBMIT A TRANSLATION OF THE DESCRIPTION OR TO PAY THE FEE WITHIN THE PRESCRIBED TIME-LIMIT Effective date: 20250212 |
|
| PG25 | Lapsed in a contracting state [announced via postgrant information from national office to epo] |
Ref country code: SK Free format text: LAPSE BECAUSE OF FAILURE TO SUBMIT A TRANSLATION OF THE DESCRIPTION OR TO PAY THE FEE WITHIN THE PRESCRIBED TIME-LIMIT Effective date: 20250212 |
|
| REG | Reference to a national code |
Ref country code: DE Ref legal event code: R097 Ref document number: 602020045942 Country of ref document: DE |
|
| REG | Reference to a national code |
Ref country code: BE Ref legal event code: MM Effective date: 20250228 |
|
| PLBE | No opposition filed within time limit |
Free format text: ORIGINAL CODE: 0009261 |
|
| STAA | Information on the status of an ep patent application or granted ep patent |
Free format text: STATUS: NO OPPOSITION FILED WITHIN TIME LIMIT |
|
| PG25 | Lapsed in a contracting state [announced via postgrant information from national office to epo] |
Ref country code: MC Free format text: LAPSE BECAUSE OF FAILURE TO SUBMIT A TRANSLATION OF THE DESCRIPTION OR TO PAY THE FEE WITHIN THE PRESCRIBED TIME-LIMIT Effective date: 20250212 |
|
| PG25 | Lapsed in a contracting state [announced via postgrant information from national office to epo] |
Ref country code: BE Free format text: LAPSE BECAUSE OF NON-PAYMENT OF DUE FEES Effective date: 20250228 |
|
| PG25 | Lapsed in a contracting state [announced via postgrant information from national office to epo] |
Ref country code: IE Free format text: LAPSE BECAUSE OF NON-PAYMENT OF DUE FEES Effective date: 20250225 |
|
| 26N | No opposition filed |
Effective date: 20251113 |
|
| PGFP | Annual fee paid to national office [announced via postgrant information from national office to epo] |
Ref country code: GB Payment date: 20260219 Year of fee payment: 7 |
|
| PGFP | Annual fee paid to national office [announced via postgrant information from national office to epo] |
Ref country code: DE Payment date: 20260217 Year of fee payment: 7 |
|
| PGFP | Annual fee paid to national office [announced via postgrant information from national office to epo] |
Ref country code: FR Payment date: 20260219 Year of fee payment: 7 |