EP3910649A1 - Virus risk prediction - Google Patents
Virus risk prediction Download PDFInfo
- Publication number
- EP3910649A1 EP3910649A1 EP21164208.7A EP21164208A EP3910649A1 EP 3910649 A1 EP3910649 A1 EP 3910649A1 EP 21164208 A EP21164208 A EP 21164208A EP 3910649 A1 EP3910649 A1 EP 3910649A1
- Authority
- EP
- European Patent Office
- Prior art keywords
- objects
- virus
- data
- spatial
- user
- Prior art date
- Legal status (The legal status is an assumption and is not a legal conclusion. Google has not performed a legal analysis and makes no representation as to the accuracy of the status listed.)
- Granted
Links
Images






Classifications
-
- G—PHYSICS
- G16—INFORMATION AND COMMUNICATION TECHNOLOGY [ICT] SPECIALLY ADAPTED FOR SPECIFIC APPLICATION FIELDS
- G16H—HEALTHCARE INFORMATICS, i.e. INFORMATION AND COMMUNICATION TECHNOLOGY [ICT] SPECIALLY ADAPTED FOR THE HANDLING OR PROCESSING OF MEDICAL OR HEALTHCARE DATA
- G16H50/00—ICT specially adapted for medical diagnosis, medical simulation or medical data mining; ICT specially adapted for detecting, monitoring or modelling epidemics or pandemics
- G16H50/30—ICT specially adapted for medical diagnosis, medical simulation or medical data mining; ICT specially adapted for detecting, monitoring or modelling epidemics or pandemics for calculating health indices; for individual health risk assessment
-
- G—PHYSICS
- G06—COMPUTING OR CALCULATING; COUNTING
- G06F—ELECTRIC DIGITAL DATA PROCESSING
- G06F16/00—Information retrieval; Database structures therefor; File system structures therefor
- G06F16/50—Information retrieval; Database structures therefor; File system structures therefor of still image data
- G06F16/55—Clustering; Classification
-
- G—PHYSICS
- G06—COMPUTING OR CALCULATING; COUNTING
- G06F—ELECTRIC DIGITAL DATA PROCESSING
- G06F16/00—Information retrieval; Database structures therefor; File system structures therefor
- G06F16/50—Information retrieval; Database structures therefor; File system structures therefor of still image data
- G06F16/58—Retrieval characterised by using metadata, e.g. metadata not derived from the content or metadata generated manually
- G06F16/583—Retrieval characterised by using metadata, e.g. metadata not derived from the content or metadata generated manually using metadata automatically derived from the content
- G06F16/5854—Retrieval characterised by using metadata, e.g. metadata not derived from the content or metadata generated manually using metadata automatically derived from the content using shape and object relationship
-
- G—PHYSICS
- G06—COMPUTING OR CALCULATING; COUNTING
- G06F—ELECTRIC DIGITAL DATA PROCESSING
- G06F16/00—Information retrieval; Database structures therefor; File system structures therefor
- G06F16/50—Information retrieval; Database structures therefor; File system structures therefor of still image data
- G06F16/58—Retrieval characterised by using metadata, e.g. metadata not derived from the content or metadata generated manually
- G06F16/587—Retrieval characterised by using metadata, e.g. metadata not derived from the content or metadata generated manually using geographical or spatial information, e.g. location
-
- G—PHYSICS
- G06—COMPUTING OR CALCULATING; COUNTING
- G06F—ELECTRIC DIGITAL DATA PROCESSING
- G06F16/00—Information retrieval; Database structures therefor; File system structures therefor
- G06F16/70—Information retrieval; Database structures therefor; File system structures therefor of video data
- G06F16/75—Clustering; Classification
-
- G—PHYSICS
- G06—COMPUTING OR CALCULATING; COUNTING
- G06F—ELECTRIC DIGITAL DATA PROCESSING
- G06F16/00—Information retrieval; Database structures therefor; File system structures therefor
- G06F16/70—Information retrieval; Database structures therefor; File system structures therefor of video data
- G06F16/78—Retrieval characterised by using metadata, e.g. metadata not derived from the content or metadata generated manually
- G06F16/783—Retrieval characterised by using metadata, e.g. metadata not derived from the content or metadata generated manually using metadata automatically derived from the content
- G06F16/7837—Retrieval characterised by using metadata, e.g. metadata not derived from the content or metadata generated manually using metadata automatically derived from the content using objects detected or recognised in the video content
-
- G—PHYSICS
- G06—COMPUTING OR CALCULATING; COUNTING
- G06F—ELECTRIC DIGITAL DATA PROCESSING
- G06F16/00—Information retrieval; Database structures therefor; File system structures therefor
- G06F16/70—Information retrieval; Database structures therefor; File system structures therefor of video data
- G06F16/78—Retrieval characterised by using metadata, e.g. metadata not derived from the content or metadata generated manually
- G06F16/787—Retrieval characterised by using metadata, e.g. metadata not derived from the content or metadata generated manually using geographical or spatial information, e.g. location
-
- G—PHYSICS
- G06—COMPUTING OR CALCULATING; COUNTING
- G06N—COMPUTING ARRANGEMENTS BASED ON SPECIFIC COMPUTATIONAL MODELS
- G06N3/00—Computing arrangements based on biological models
- G06N3/02—Neural networks
- G06N3/04—Architecture, e.g. interconnection topology
- G06N3/0464—Convolutional networks [CNN, ConvNet]
-
- G—PHYSICS
- G06—COMPUTING OR CALCULATING; COUNTING
- G06N—COMPUTING ARRANGEMENTS BASED ON SPECIFIC COMPUTATIONAL MODELS
- G06N3/00—Computing arrangements based on biological models
- G06N3/02—Neural networks
- G06N3/08—Learning methods
-
- G—PHYSICS
- G06—COMPUTING OR CALCULATING; COUNTING
- G06N—COMPUTING ARRANGEMENTS BASED ON SPECIFIC COMPUTATIONAL MODELS
- G06N3/00—Computing arrangements based on biological models
- G06N3/02—Neural networks
- G06N3/08—Learning methods
- G06N3/09—Supervised learning
-
- G—PHYSICS
- G16—INFORMATION AND COMMUNICATION TECHNOLOGY [ICT] SPECIALLY ADAPTED FOR SPECIFIC APPLICATION FIELDS
- G16H—HEALTHCARE INFORMATICS, i.e. INFORMATION AND COMMUNICATION TECHNOLOGY [ICT] SPECIALLY ADAPTED FOR THE HANDLING OR PROCESSING OF MEDICAL OR HEALTHCARE DATA
- G16H50/00—ICT specially adapted for medical diagnosis, medical simulation or medical data mining; ICT specially adapted for detecting, monitoring or modelling epidemics or pandemics
- G16H50/20—ICT specially adapted for medical diagnosis, medical simulation or medical data mining; ICT specially adapted for detecting, monitoring or modelling epidemics or pandemics for computer-aided diagnosis, e.g. based on medical expert systems
-
- G—PHYSICS
- G16—INFORMATION AND COMMUNICATION TECHNOLOGY [ICT] SPECIALLY ADAPTED FOR SPECIFIC APPLICATION FIELDS
- G16H—HEALTHCARE INFORMATICS, i.e. INFORMATION AND COMMUNICATION TECHNOLOGY [ICT] SPECIALLY ADAPTED FOR THE HANDLING OR PROCESSING OF MEDICAL OR HEALTHCARE DATA
- G16H50/00—ICT specially adapted for medical diagnosis, medical simulation or medical data mining; ICT specially adapted for detecting, monitoring or modelling epidemics or pandemics
- G16H50/80—ICT specially adapted for medical diagnosis, medical simulation or medical data mining; ICT specially adapted for detecting, monitoring or modelling epidemics or pandemics for detecting, monitoring or modelling epidemics or pandemics, e.g. flu
Definitions
- the data analyzer may determine a usage frequency indicator for each of the plurality of objects based on the identification of a plurality of usage parameters associated with each of the plurality of objects.
- the data analyzer may create a material assessment database by populating details pertaining to a lifespan of a virus retrieved from the viral disease data with respect to a surface material for each of the plurality of objects.
- the data analyzer may create a virus spatial-temporal matrix based on mapping the lifespan of the virus corresponding to each surface material for each of the plurality of objects with the spatial-temporal features for each of the plurality of objects.
- the threshold risk assessment score may be determined using data that may be collected by the data collector 130 and analyzed by the data analyzer 140, such as survival rate or time of a virus on different surfaces, known mobility reports for the virus, local weather information and the like.
- the system 110 may include a pre-configured recommendation scale that may facilitate the determination of a threshold limit for the risk assessment score based on the virus spatial-temporal matrix and the viral disease data.
- the data analyzer 140 may determine a usage frequency indicator 216 for each of the objects 208 based on the identification of a plurality of usage parameters 218 associated with each of the objects 208.
- the plurality of usage parameters 218 may be measurable factors for the object to be evaluated.
- the plurality of usage parameters 218 may include a user touch propensity, a user accessibility, a user interest in interaction, and the like.
- the plurality of usage parameters 218 may classify the objects as a "high user touch propensity" and as a "low user touch propensity". For example, if an object may be positioned where several people can touch it or interact with it, then the object may be determined to be high user touch propensity.
- Fig. 6 illustrates a box representation 600 of the objects 208 detected across a geographical location for virus risk prediction using a virus risk prediction system, according to an example embodiment of the present disclosure. Any of the components described above may be referred to hereinafter.
- the box representation 600 illustrates an object 1 602, an object 2 604, and an object 3 606.
- the object 2 604 may be overlapping the object 1 602.
- the data collector 130 may detect the overlap with object 2 604 in the coordinates for the object 1 602.
- the data collector 130 may detect X, Y coordinates for the object 1 - 602, object 2 - 604, and the object 3 - 606.
Landscapes
- Engineering & Computer Science (AREA)
- Theoretical Computer Science (AREA)
- Data Mining & Analysis (AREA)
- Health & Medical Sciences (AREA)
- Physics & Mathematics (AREA)
- Databases & Information Systems (AREA)
- Public Health (AREA)
- General Physics & Mathematics (AREA)
- General Engineering & Computer Science (AREA)
- Medical Informatics (AREA)
- Biomedical Technology (AREA)
- General Health & Medical Sciences (AREA)
- Library & Information Science (AREA)
- Multimedia (AREA)
- Epidemiology (AREA)
- Pathology (AREA)
- Primary Health Care (AREA)
- Life Sciences & Earth Sciences (AREA)
- Artificial Intelligence (AREA)
- Molecular Biology (AREA)
- Computing Systems (AREA)
- Mathematical Physics (AREA)
- Computational Linguistics (AREA)
- Software Systems (AREA)
- Evolutionary Computation (AREA)
- Biophysics (AREA)
- Management, Administration, Business Operations System, And Electronic Commerce (AREA)
- Image Analysis (AREA)
Abstract
Description
- Mankind has been struggling with epidemics and infectious diseases since prehistoric times. The infectious diseases caused by various microscopic organisms such as, for example, a virus, a bacteria, a protozoa, and the like have consistently given rise to pandemics. As healthcare facilities across various countries continue to assist the general population assiduously in fighting pandemics and urging the general population to practice home quarantine measures during a pandemic, there has been an increasing concern amongst various sections of society regarding a requirement to be better prepared to handle such pandemics. Specifically, there is a growing concern about protecting oneself during a pandemic and from such experiences in the future.
- Presently, there is a dearth of systems that may accurately predict the risk of contracting an infectious disease in an accessible and non-invasive manner. However, there is a scarcity of systems that may digitally analyze an environment and assess the risk potential of contracting an infectious disease therefrom. Accordingly, there is a requirement for an infectious disease prediction system that may be capable of assessing the risk of contracting an infectious disease in an accessible and non-invasive manner. Furthermore, there is a need for a system that may account for the various factors mentioned above, amongst others, to efficiently and accurately predict the presence of disease-causing agents, such as viruses in an environment.
-
-
Fig. 1 illustrates a virus risk prediction system, according to an example embodiment of the present disclosure. -
Fig. 2 illustrates various components of the virus risk prediction system, according to an example embodiment of the present disclosure. -
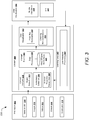
Fig. 3 illustrates an architectural flow diagram for virus risk prediction using the virus risk prediction system, according to an example embodiment of the present disclosure. -
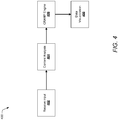
Fig. 4 illustrates a workflow diagram for the virus risk prediction using the virus risk prediction system, according to an example embodiment of the present disclosure. -
Fig. 5 illustrates a pictorial representation for vision-based tracking for the virus risk prediction using the virus risk prediction system, according to an example embodiment of the present disclosure. -
Fig. 6 schematically illustrates a plurality of objects detected across a geographical location for the virus risk prediction using the virus risk prediction system, according to an example embodiment of the present disclosure. -
Fig. 7 illustrates a diagrammatic representation of a plurality of material categories for classifying a plurality of objects for the virus risk prediction using the virus risk prediction system, according to an example embodiment of the present disclosure. -
Fig. 8 illustrates heat map generation for the virus risk prediction using the virus risk prediction system, according to an example embodiment of the present disclosure. -
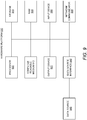
Fig. 9 illustrates a hardware platform for the implementation of the virus risk prediction system, according to an example embodiment of the present disclosure. -
Figs. 10A and10B illustrate a process flowchart for the virus risk prediction, according to an example embodiment of the present disclosure. - For simplicity and illustrative purposes, the present disclosure is described by referring mainly to examples thereof. The examples of the present disclosure described herein may be used together in different combinations. In the following description, details are set forth in order to provide an understanding of the present disclosure. It will be readily apparent, however, that the present disclosure may be practiced without limitation to all these details. Also, throughout the present disclosure, the terms "a" and "an" are intended to denote at least one of a particular element. The terms "a" and "an" may also denote more than one of a particular element. As used herein, the term "includes" means includes but not limited to, the term "including" means including but not limited to. The term "based on" means based at least in part on, the term "based upon" means based at least in part upon, and the term "such as" means such as but not limited to. The term "relevant" means closely connected or appropriate to what is being done or considered.
- The present disclosure describes systems and methods for virus risk prediction including a Virus Risk Prediction System (VRPS). In an example embodiment, the system may include a Coronavirus Risk Assessment Map (CRAMP). The system may determine the extent of potential exposure for a particular virus on various objects in the vicinity of a user. In order to mitigate a growing concern about protecting a user during a pandemic or post-pandemic, such as for example, during the current severe acute respiratory syndrome coronavirus 2 ("SARS-CoV-2") pandemic and in the future, the system may provide a demarcation to identify various objects in the vicinity of a user where the user may potentially contract a contagious disease, such as a viral disease. For example, the system may determine and predict an extent of exposure for a particular virus inside a pharmacy, a grocery store, a public bench, a train station, an airport, a vehicle, and the like.
- The system may implement various computer vision technologies along with geolocation data to recognize and then identify potentially contaminated surfaces. The system may implement various image-based surface material detection and analysis techniques to determine a surface material associated with the identified risk spots. The system may determine a virus's lifespan on the surface material. The system may further determine a frequency of usage of various risk spots by a user. Furthermore, a heat map of various risk spots, where a virus may be most likely to survive longer and where a likelihood of a user contracting the virus may be higher, such as public benches, metro station accesses, pharmacies, and the like, may be created.
- The system may include a processor coupled to a data collector, a data analyzer, and a modeler. The data collector may receive a query associated with a virus risk assessment for a viral disease across a geographic location. The data collector may obtain viral disease data associated with the viral disease from a plurality of data sources. The data collector may detect a plurality of objects associated with the geographical location. The plurality of objects may be potentially contaminated with a virus associated with the viral disease. The data collector may extract spatial-temporal features for each of the plurality of objects. The spatial-temporal features may comprise one or more of geospatial data, temporal data, and temperature data associated with each of the plurality of objects. The data collector may classify the plurality of objects in a material category from amongst a plurality of material categories. The material category may indicate a surface material associated with each of the plurality of objects.
- The data analyzer may determine a usage frequency indicator for each of the plurality of objects based on the identification of a plurality of usage parameters associated with each of the plurality of objects. The data analyzer may create a material assessment database by populating details pertaining to a lifespan of a virus retrieved from the viral disease data with respect to a surface material for each of the plurality of objects. The data analyzer may create a virus spatial-temporal matrix based on mapping the lifespan of the virus corresponding to each surface material for each of the plurality of objects with the spatial-temporal features for each of the plurality of objects.
- The modeler may create a viral risk prediction model associated with each of the plurality of objects based on mapping the virus spatial-temporal matrix with the usage frequency indicator for each of the plurality of objects. The modeler may determine a risk assessment score for each of the plurality of objects based on the implementation of a cognitive learning operation on the viral risk prediction model associated with each of the plurality of objects. The risk assessment score may be indicative of the extent of virus exposure associated with each of the plurality of objects. The modeler may create a heat map for the geographic location based on the spatial-temporal features for each of the plurality of objects and the risk assessment score for each of the plurality of objects. The heat map may be indicative of the extent of the virus exposure associated with each of the plurality of objects detected for the geographic location. Accordingly, using the heat map, a user may easily identify probable contaminated surfaces and/or objects to avoid getting infected and spreading the associated disease further.
-
Fig. 1 illustrates asystem 110 for virus risk prediction (referred to assystem 110 hereinafter), according to an example implementation of the present disclosure. For the sake brevity and ease of explanation, the present disclosure is explained in detail with respect to a viral infection; however, it will be appreciated that the concepts described herein may be extended to systems for determining risk prediction by other agents, such as bacteria, a protozoa, and the like. - In an example, the
system 110 may include aprocessor 120. Theprocessor 120 may be coupled to adata collector 130, adata analyzer 140, and amodeler 150. - The
data collector 130 may receive a query associated with a virus risk assessment for a viral disease across a geographic location. In an example embodiment, the viral disease associated with the query is a severe acute respiratory syndrome coronavirus 2 ( "SARS-CoV-2"). One of ordinary skill in the art will appreciate that in the alternative embodiments a viral disease may include any disease that may be caused by pathogenic agents. The geographic location may be an environment in the vicinity of a user. For example, the geographic location may be a location such as a pharmacy, a grocery store, a public bench, a train station, an airport, a vehicle, and the like. The geographic location may be part of a route that a user may wish to follow to reach a destination. - The
data collector 130 may obtain viral disease data associated with the viral disease from a plurality of data sources. The plurality of data sources may include various databases maintained by various organizations across the world. The viral disease data may include various details pertaining to a virus, such as the life cycle of a virus on various types of surfaces, materials, and the like. The viral disease data may also include statistics related to survival and sustenance of the virus in various environments, geological conditions, temperature conditions, pH conditions, and the like. The viral disease data may also include mobility data associated with the virus. In addition, the viral disease data may include results from various data monitoring initiatives and national policies associated with the virus. The viral disease data may also include viral cluster prediction data such as data related to the spreading of the virus in various geographical clusters. The viral disease data may also include survival data for a virus. Furthermore, the viral disease data may include information on infections caused by a virus. In an example embodiment, the viral disease data may include specified research such as for example, artificial intelligence-based research service around SARS-CoV-2, studies on surfaces for SARS-CoV-2, and the like. One of ordinary skill in the art will appreciate that the viral disease data may include any other type of data associated with a virus. - The
data collector 130 may detect a plurality of objects associated with the geographical location. The plurality of objects may be potentially contaminated with a virus associated with the viral disease. The plurality of objects may include various vehicles in the vicinity of a user, a signboard, a platform for keeping various objects, a public bench, a public drinking water facility, various items and access areas in and around various locations such as a grocery store, a pharmacy, a train access, and the like (an exemplary image for the plurality of objects illustrated by way ofFig. 5 ). Thedata collector 130 may detect the plurality of objects from an image, a video-based medium, a uniform resource locator (URL), a geolocation, and a data stream associated with the geographic location. For the purpose of this document, the image, the video-based medium, the URL, the geolocation, and the data stream associated with the geographic location may be collectively referred to by using the term "media". Thedata collector 130 may extract a plurality of image frames from the media (described in detail with respect to description ofFig. 2 ). - The
data collector 130 may extract spatial-temporal features for each of the plurality of objects. The spatial-temporal features may comprise geospatial data, temporal data, and temperature data associated with each of the plurality of objects. The spatial-temporal features may describe a phenomenon in a certain location and time. The spatial-temporal features of the plurality of objects may include one or more spatial features of each of the plurality of objects and one or more temporal features of each of the plurality of objects. Thedata collector 130 may extract the spatial-temporal features for each of the plurality of objects based on neural network-based feature extraction layers implemented on the plurality of image frames. The neural network-based feature extraction layers may implement a semantic segmentation on the plurality of image frames to extract the spatial-temporal features. Thedata collector 130 may receive the media comprising the plurality of image frames. - The
data collector 130 may classify the plurality of objects in a material category from amongst a plurality of material categories. Each of the plurality of material categories may comprise a surface material associated with each of the plurality of objects. The plurality of material categories may be, for example, a metal, an alloy, a plastic, a cloth, a canvas, a rubber, a glass, wood, water, soil, and the like. The surface material may be a material on a surface of an object such as metal may be the surface material for a car, the cloth may be the surface material for a human being, and the like. - The
data collector 130 may determine the plurality of material categories based on an analysis of a reflectance attribute associated with the surface material associated with each of the plurality of objects. The reflectance attribute may refer to a measure of light or other radiation that may be striking a surface and is reflected off it. Thedata collector 130 may determine the plurality of material categories based on an analysis of a plurality of material attributes associated with the surface material associated with each of the plurality of objects. Thedata collector 130 may identify the plurality of objects based on a semantic segmentation technique. - The data analyzer 140 may determine a usage frequency indicator for each of the plurality of objects based on the identification of a plurality of usage parameters associated with each of the plurality of objects. The plurality of usage parameters may be measurable factors for the object to be evaluated. For example, the plurality of usage parameters may include a user touch propensity, a user accessibility, a user interest in interaction, and the like. The plurality of usage parameters may classify the objects as a "high user touch propensity" and as a "low user touch propensity". For example, if an object may be positioned where several people can touch it or interact with it, then the object may be determined to be high user touch propensity. Additionally, if an object is on a table it might be more accessible than an object on a shelf, and hence may be classified as having a high user touch propensity. Furthermore, a natural object such as a stream of water, a boulder, and the like may be less likely to be touched by a user and hence may be classified by the data analyzer 140 as having low user touch propensity.
- The data analyzer 140 may create a material assessment database by mapping the lifecycle of a virus retrieved from the viral disease data with the surface material for each of the plurality of objects. The material assessment database may comprise a lifespan of the virus corresponding to each of the surface materials.
- The data analyzer 140 may create a virus spatial-temporal matrix based on mapping the lifespan of the virus corresponding to each of the surface material for each of the plurality of objects with the spatial-temporal features for each of the plurality of objects. For example, the
data analyzer 140 may map the lifespan of a virus on a glass surface in a cold temperature environment, during a time period of, for example, 6 AM-12 Noon to create the virus spatial-temporal matrix. - The
modeler 150 may create a viral risk prediction model associated with each of the plurality of objects based on mapping the virus spatial-temporal matrix with the usage frequency indicator for each of the plurality of objects. After thedata analyzer 140 has determined the virus spatial-temporal matrix for each object, and the usage frequency indicator for each object, themodeler 150 may map the usage frequency indicator with the virus spatial-temporal matrix to create the viral risk prediction model. The viral risk prediction model may include a prediction for contracting a virus when coming in contact with a particular object - The
modeler 150 may determine a risk assessment score for each of the plurality of objects based on the implementation of a cognitive learning operation on the viral risk prediction model associated with each of the plurality of objects. The risk assessment score may be indicative of the extent of virus exposure associated with each of the plurality of objects as explained in detail with respect to description ofFig. 2 . - Based on the spatial-temporal features for each of the plurality of objects and the risk assessment score for each of the plurality of objects, the
modeler 150 may create a heat map of the geographic location (described in detail with respect to description ofFig.8 ). The heat map may be indicative of the extent of the virus exposure associated with each of the plurality of objects detected for the geographic location. For an object, from among the plurality of objects, having the risk assessment score above a threshold risk assessment score, a cleaning alert for a user may be generated by themodeler 150. The threshold risk assessment score may be pre-defined by an authorized personnel or may be dynamically configurable. In an example embodiment, the threshold risk assessment score may be determined using data that may be collected by thedata collector 130 and analyzed by thedata analyzer 140, such as survival rate or time of a virus on different surfaces, known mobility reports for the virus, local weather information and the like. Further, thesystem 110 may include a pre-configured recommendation scale that may facilitate the determination of a threshold limit for the risk assessment score based on the virus spatial-temporal matrix and the viral disease data. -
Fig. 2 illustrates various components of a virusrisk prediction system 110, according to an example embodiment of the present disclosure. As illustrated, thesystem 110 may include theprocessor 120 coupled to thedata collector 130, thedata analyzer 140, and themodeler 150. - The
data collector 130 may receive aquery 202 associated with a virus risk assessment for aviral disease 204 across ageographic location 206. In an example embodiment, theviral disease 204 associated with thequery 202 is SARS-CoV-2. One of ordinary skill in the art will appreciate that in alternative embodiments theviral disease 204 may include any disease that may be caused by pathogenic agents. Thegeographic location 206 may be an environment in the vicinity of a user. For example, thegeographic location 206 may be a location, such as a pharmacy, a grocery store, a public bench, a train station, an airport, a vehicle, and the like. Thegeographic location 206 may be part of a route that a user may wish to follow to reach a destination. - The
data collector 130 may obtain viral disease data associated with theviral disease 204 from a plurality of data sources. As discussed above, the viral disease data may include various details pertaining to a virus, such as a lifespan of the virus on various surfaces, and survival and sustenance rate of the virus in various environments. - The data sources may include various databases maintained by various organizations across the world. The data sources may include databases such as Google community mobility report®, Apple mobility data®, European Crisis Management Laboratory®, New England Journal of Medicine®, The Lancet Infectious Diseases®, World Health Organization® Questions and Answers, WebMD®, IBM Deep search®, Wikipedia®, Coronaisrael, and the like. The
system 110 may provide access to a user for allowing entry of any update in the viral disease data for a particular geographical location. In an example, thesystem 110 may be configured to automatically retrieve relevant viral disease data from the data sources. In another example, thesystem 110 may require manual intervention for retrieving relevant viral details from some of the data sources. - The
data collector 130 may detect a plurality ofobjects 208 associated with the geographical location. Theobjects 208 may be potentially contaminated with a pathogenic agent such as a virus associated with theviral disease 204. Theobjects 208 may include various vehicles in the vicinity of a user, a signboard, a platform for keeping various objects, a public bench, a public drinking water facility, various items and access areas in and around various public places such as a grocery store, a pharmacy, a train access, and the like (an exemplary image for theobjects 208 illustrated by way ofFig. 5 ). Thedata collector 130 may detect theobjects 208 from an object identification media providing details pertaining to the objects. Examples of the object identification media include, but are not limited to, an image, a video-based medium, a uniform resource locator, a geolocation, and a data stream associated with thegeographic location 206. - To detect the
objects 208, thedata collector 130 may extract a plurality of image frames from the media of the geographic location where theobjects 208 are located. In an example, thedata collector 130 may implement computer vision-based object detection techniques for detecting theobjects 208 associated with the geographical location from the object identifying media. In an example embodiment, the computer vision-based object detection techniques may include a You Only Look Once (YOLO) object detection technique. YOLO is a computer vision object detection technique that may enable the processing of an image straight from image pixels to bounding box coordinates and class probabilities. - The object detection technique deployed by the
system 110 may extract various image pixels for the object identifying media. The object detection technique may analyze the pixels and extract various features of a pixel. The technique may define bounding boxes for defining coordinates of various objects (illustrated byFig. 5 ). The image pixels and the bounding boxes may be analyzed to predict objects within a bounding box. The bounding box may be an image boundary within which an object may be present in an image. For example, an input image may be classified into an "X" bounding boxes (x, y, w, h). The (x, y) coordinates may represent edges of the box relative to the input image and width (w) and height (h) may be predicted relative to the input image. The technique may analyze all the pixels from each bounding box and join features for all pixels therein to predict object(s) present in each bounding box. In an example, the bounding boxes for multiple objects may overlap such as a motorbike and a bike rider may overlap over the same coordinates (x, y). The data collector may detect multiple objects for the same bounding box. One of ordinary skill in the art will appreciate that any other computer vision-based object detection technique may also be trained and implemented to extract and analyze the image pixels and to predict and analyze the bounding boxes. - The
data collector 130 may extract spatial-temporal features 210 for each of theobjects 208. The spatial-temporal features 210 may comprise geospatial data, temporal data, and temperature data associated with each of theobjects 208. The spatial-temporal features 210 may describe a particular phenomenon in a certain location and time. The spatial-temporal features 210 of theobjects 208 may include one or more spatial features of each of theobjects 208 and one or more temporal features of each of theobjects 208. In an example, the one or more spatial features of each of theobjects 208 may include one or more of color features, texture features, shape features, and size features. Furthermore, the one or more temporal features of theobjects 208 include one or more of motion features, trajectory features, time of a day identifying features, and flicker features. - The
data collector 130 may extract the spatial-temporal features 210 for each of theobjects 208 based on neural network-based feature extraction layers implemented on the plurality of image frames. The neural network-based feature extraction layers may implement a semantic segmentation on the plurality of image frames to extract the spatial-temporal features 210. Thedata collector 130 may receive the media comprising the plurality of image frames. - The
data collector 130 may segment the image frames into multiple media objects based on semantically meaningful parts of the media such as vehicles, people, trolleys, consumables, and the like. Subsequently, thedata collector 130 may select one or more media objects from amongst the media objects based on pre-defined conditions. In an example embodiment, the pre-defined conditions may include conditions that may be related to an area and shape of the media objects. For example, for a pharmacy, the pre-defined conditions may be the detection of consumables, and for a train station, the pre-defined conditions may include detection of various people, train surfaces, screens, and the like. The temperature data may include average temperature predicted for thegeographic location 206. Based on various factors mentioned above, theobjects 208 may be identified from the media. For example, theobjects 208 may include a shelf in a grocery store, a medicine counter, a car, a bicycle, and the like. - The
data collector 130 may classify theobjects 208 in a material category from amongst a plurality ofmaterial categories 212. Each of thematerial categories 212 may comprise asurface material 214 associated with each of theobjects 208. Thematerial categories 212 may be, for example, a metal, an alloy, a plastic, a cloth, a canvas, a rubber, a glass, wood, water, soil, and the like. Thesurface material 214 may be a material on a surface of an object such as metal may be thesurface material 214 for a car, the cloth may be thesurface material 214 for a human being, and the like. - The
data collector 130 may determine thematerial categories 212 based on an analysis of a reflectance attribute associated with thesurface material 214 associated with each of theobjects 208. The reflectance attribute may refer to a measure of light or other radiation that may strike a surface and is reflected off it. Thedata collector 130 may determine thematerial categories 212 based on an analysis of a plurality of material attributes associated with thesurface material 214 associated with each of theobjects 208. The plurality of material attributes may refer to various physical qualities of a material such as a color, a texture, a shape, and the like. - The
data collector 130 may identify theobjects 208 based on the semantic segmentation technique. The semantic segmentation may be implemented on the image pixels extracted from the image frames as mentioned above. Thedata collector 130 may identify thesurface material 214 based on the semantic testing of theobjects 208. Thedata collector 130 may implement various image pixel classification based techniques for material detection other than those mentioned herein. Thedata collector 130 may implement the image-based material detection so that there may be no overlap amongst various materials detected for an image pixel, unlike object detection wherein an overlap may be detected. The material detection may detect thesurface material 214 in a continuous manner with no overlapping surface materials. Such techniques may improve the accuracy of the detection and may also enhance the efficiency of thesystem 110 in performing virus risk prediction. For example, if an object is a car, then thesurface material 214 may be determined as a combination of metal, glass, and plastic. If an object is a table, then thesurface material 214 may be determined as one of a metal, a wood piece, a polymer, and the like. Thedata collector 130 may further implement image-based reflectance testing and image-based material detection to identify the reflectance attribute and the material attributes to identify the material category. For example, thedata collector 130 may identify the position of thesurface material 214 such as the metal, the glass, and the plastic over an image of a car based on image-based reflectance detection. Thedata collector 130 may create a database for storing the reflectance attributes and the plurality of material attributes associated with each of theobjects 208. - The data analyzer 140 may determine a usage frequency indicator 216 for each of the
objects 208 based on the identification of a plurality of usage parameters 218 associated with each of theobjects 208. The plurality of usage parameters 218 may be measurable factors for the object to be evaluated. For example, the plurality of usage parameters 218 may include a user touch propensity, a user accessibility, a user interest in interaction, and the like. The plurality of usage parameters 218 may classify the objects as a "high user touch propensity" and as a "low user touch propensity". For example, if an object may be positioned where several people can touch it or interact with it, then the object may be determined to be high user touch propensity. Additionally, if an object is on a table it might be more accessible than an object on a shelf, and hence may be determined to have a higher user touch propensity. Further, a natural object such as a boulder, mountain cliff, treetop, and the like may be less likely to be touched by a user and hence may be classified by the data analyzer 140 as having a low user touch propensity. - According to an example, objects may be captured in media such as, for example, a wall, a building, a house, a window, a door, a table, a painting, a bulletin board, a poster, a TV, a screen, a table, a bus, a car, an airplane, sky, a tree, grass, flowers, rocks, sand, a boulder, mountains, hill, a stream, and a river. Then the wall, the house, the window, the door, the painting, the bulletin board, the table, the poster, the TV, the screen, the table, the bus, and the car may be considered as high user touch propensity. On the other hand, one or more of the natural objects, such as one or more of the sky, the tree, the grass, the flowers, the rocks, the sand, the boulder, the mountains, the airplane, the hill, the building, the stream, and the river may be considered low user touch propensity. Similarly, the
data analyzer 140 may determine the usage frequency indicator 216 for each of theobjects 208 detected across thegeographic location 206. - The data analyzer 140 determines a unique usage frequency indicator 216 for a user based on the identification of the plurality of usage parameters 218 unique to the user. For example, the
data analyzer 140 may require input from each user about how frequently they are in direct interaction with an object, such as for example, a book, a car, a screen, and the like. If for example, a user may never touch books they may be given a low user touch propensity for books every time a book may be detected as an object for the user. If for example, a user may always touch the screen they may be given a high user touch propensity for screens every time a screen may be detected as an object for the user. - The data analyzer 140 may create a
material assessment database 220 by mapping the lifecycle of a virus retrieved from the viral disease data with thesurface material 214 for each of theobjects 208. Thematerial assessment database 220 may comprise of a lifespan of the virus corresponding to each of thesurface material 214. The data analyzer 140 may retrieve lifecycle data for a virus on various surfaces and map the same with thesurface material 214 identified for theobjects 208. For example, thedata analyzer 140 may retrieve the lifespan of the virus on a glass surface, a metal surface, a wooden surface and the like to create thematerial assessment database 220. - The data analyzer 140 may create a virus spatial-temporal matrix 226 based on mapping the lifespan of the virus corresponding to each of the
surface material 214 for each of theobjects 208 with the spatial-temporal features 210 for each of theobjects 208. For example, thedata analyzer 140 may map the lifespan of the virus on a glass surface in a cold temperature environment, during a time period of, for example, 6 AM-12 Noon. As mentioned above, the spatial-temporal features 210 may include geospatial data. The data analyzer 140 may retrieve geospatial data such as the spread of a virus in a particulargeographic location 206 such as, a country and use the same to create the virus spatial-temporal matrix 226 for a location in that country. Therefore, thedata analyzer 140 may create the virus spatial-temporal matrix 226 for each of theobjects 208 by considering the virus lifespan on thesurface material 214 for that object, the geospatial data for thegeographic location 206 associated with the object, and the temperature of the environment associated with that object. The temperature of the environment may affect various viruses, which may not be able to survive above or below a certain temperature. In an example embodiment, thedata analyzer 140 may create the virus spatial-temporal matrix 226 for each object by considering the virus lifespan on thesurface material 214 for that object, the geospatial data for thegeographic location 206 associated with the object, the temperature of the environment associated with that object, and a distance between that object and a user of the system. In an example, thedata analyzer 140 may determine the distance between that object and a user of the system by implementing an image-based depth calculation. - The
modeler 150 may create a viral risk prediction model 228 associated with each of theobjects 208 based on mapping the virus spatial-temporal matrix 226 with the usage frequency indicator 216 for each of theobjects 208. After thedata analyzer 140 has determined the virus spatial-temporal matrix 226 for each object, and the usage frequency indicator 216 for each object, themodeler 150 may map the usage frequency indicator 216 with the virus spatial-temporal matrix 226 to create the viral risk prediction model 228. The viral risk prediction model 228 may include a prediction for contracting a virus when a user may come in contact with a particular object. For example, the virus spatial-temporal matrix 226 may be created for a wooden table in a grocery store of a country with an epidemic occurrence recent past. The usage frequency indicator 216 for the table may be determined as a high user touch propensity (as mentioned above). Themodeler 150 may map the virus spatial-temporal matrix 226 and the usage frequency indicator 216 for the wooden table and present the viral risk prediction model 228 associated with the wooden table in a grocery store of a country with an epidemic occurrence in recent past to a user of thesystem 110. - The
modeler 150 may determine arisk assessment score 230 for each of theobjects 208 based on the implementation of acognitive learning operation 232 on the viral risk prediction model 228 associated with each of the plurality ofobjects 208. Therisk assessment score 230 may be indicative of the extent of contracting the virus on exposure to each of theobjects 208. In an example embodiment, therisk assessment score 230 may be calculated based on the following equation:
risk assessment score 230 may be calculated based on the following equation:
- Virus α = The virus selected by a user associated with the
viral disease 204, - M= Number of objects detected for a
geographic location 206, - X, Y = Coordinates for the
geographic location 206 associated with thequery 202, ObjX,Y = "1", if the object detected may be present in the coordinates X, Y and "0" of the object detected may not be present in the coordinates X, Y, - Fobj i = The frequency of use of the object (the usage frequency indicator 216 mentioned above), the value may range from 0 - 1, wherein 0 may be low frequency and 1 may be high frequency. Alternatively, 0 may be a low user touch propensity indicator, and 1 may be a high user touch propensity indicator.
- MatX,Y = The
surface material 214 detected for the object present in the coordinates X, Y, - LS Virus α = Coefficient of risk of virus presence based on the lifespan of the virus on the material. The value may be from zero-one (0 - 1), wherein zero (0) may denote a low chance of survival and one (1) may denote a high chance of survival. This value may be determined by the virus spatial-temporal matrix 226. For example, the virus spatial-temporal matrix 226 may indicate that a virus may be able to sustain itself on a metal surface for a duration of twelve (12) hours and the same virus may be able to sustain itself on a wooden surface for a duration of 10 minutes. The
modeler 150 may determine the value of LS Virus α to be closer to zero (0) for the wooden surface and the value of LS Virus α to be closer to one (1) for the metal surface. - In an example embodiment, the aforementioned calculations may be performed at the pixel level of an image for each object. In an example embodiment, the risk assessment score may be calculated at a pixel level, wherein the
modeler 150 may analyze theobjects 208 pixel by pixel. As mentioned above, the data collector may identify multiple objects on one pixel. The modeler may analyze all the objects present on the same pixel and multiply the result with the usage frequency indicator 216 for each of those objects present on that same pixel. For example, if a pixel may include a motorbike and a bike rider, themodeler 150 may consider both the motorbike and the bike rider for calculation of therisk assessment score 230. Themodeler 150 may implement the equation presented above for both the motorbike and the bike rider and determine therisk assessment score 230 therefrom. The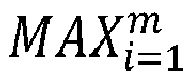
risk assessment score 230 for multiple objects in the same pixel based on a maximum risk value amongst those objects detected in the same pixel. - In an example embodiment, the
modeler 150 may deploy various machine learning techniques such as for example, a learning loop-based technique that may adjust the equations mentioned above for determining therisk assessment score 230 based on feedback from a user. Themodeler 150 may include various other coefficients in the aforementioned calculations other than those mentioned above for the determination of therisk assessment score 230. In an example embodiment, these calculations are performed at the pixel level of an image for each object. One of ordinary skill in the art will appreciate that the calculations described above are examples only. Other techniques may be used for calculating a risk assessment score without departing from the scope of the disclosure. For example, coefficients other than those pertaining to a lifespan of the virus on a material may be used to calculate therisk assessment score 230. - Based on the spatial-
temporal features 210 for each of theobjects 208 and therisk assessment score 230 for each of theobjects 208, themodeler 150 may create aheat map 234 for the geographic location 206 (described in detail with respect to description ofFig.8 ). Theheat map 234 may be indicative of the extent of the virus exposure associated with each of theobjects 208 detected for thegeographic location 206. In an example embodiment, themodeler 150 may implement a Spatial-Temporal Convolution Neural Network (CNN) model to create theheat map 234. The CNN model may be pre-trained based on a training dataset. The training dataset may include, but not limited to, training images, theobjects 208 detected from the training images, the surface material detection for the training images, and spatial-temporal features 210 of the training images. It can be appreciated that the heatmap may be rendered in two or three dimensions as may be appropriate for user consumption. For example, an overhead two-dimensional representation may be appropriate for a route planning application, while a three-dimensional representation may be useful in an augmented reality application. - For an object, from among the
objects 208, having therisk assessment score 230 above a threshold risk assessment score, a cleaning alert for a user may be generated by themodeler 150. In an example, a user of the system may provide a value for the threshold risk assessment score. The cleaning alert may be used to generate a recommendation for a cleaner to clean a surface of the object if therisk assessment score 230 may be above the threshold risk assessment score. The cleaning alert may facilitate the cleaning of areas with the highest contamination on priority. For example, the cleaning alert may indicate that the wooden table in a grocery store may be cleaned on a priority basis, because it may be an object with a highrisk assessment score 230. - In an example embodiment, the
heat map 234 may be displayed to a user or provided as an input to an application for further analysis regarding risk assessment. For example, theheat map 234 may be provided as a visualization that is overlaid on a live camera view on a display of the user's mobile device. In another example embodiment, theheat map 234 may be provided as an input to a routing application on the user's mobile device. Based on theheat map 234, a route, from a plurality of routes, may be recommended to the user. The recommended route may minimize potential virus exposure and/or may have the least likely virus exposure potential as explained in detail in the following paragraphs. - In an example embodiment, a cumulative risk assessment score for each location spot on a route may be determined. The cumulative risk assessment score for a location spot may be determined based on a cumulative total of the
risk assessment score 230 for theobjects 208 in the location spot on the route. Furthermore, it may be ascertained whether the cumulative risk assessment score may be above a pre-defined limit for the location spot to assess the risk associated with the corresponding location spot. The pre-defined limit for the location spot may be determined by analyzing data collected by thedata collector 130, such as survival and sustenance rate of a virus on various surfaces, known mobility reports for the virus, local weather information, and the like. In an example embodiment, the pre-defined limit may be determined by authorized personnel and/or may be dynamically configurable. - The
heat map 234 may include the cumulative risk assessment score corresponding to each location spot on the route. In an example embodiment, the routing application may collect details pertaining to the location spots, where the cumulative risk assessment score may be above the pre-defined limit over a route starting from a departure spot to an arrival spot. The routing application may identify one or more location spots with the cumulative risk assessment score above the pre-defined limit on theheat map 234, for example, similar to a traffic congestion situation, and may present alternate routes to a user. Further, a route risk assessment score for the route may be determined by adding the cumulative risk assessment score for each location spot on that route from the departure spot to the arrival spot. The routing application may determine a route amongst the plurality of routes with a lowest value of the route risk assessment score. Accordingly, a route that minimizes virus exposure potential based on the route risk assessment score may be recommended to a user. -
Fig. 3 illustrates an architectural flow diagram 300 for virus risk prediction using the virusrisk prediction system 110, according to an example embodiment of the present disclosure. Any of the components described above may be referred to hereinafter. The flow diagram 300 illustrates a workflow diagram for the CRAMP mentioned above as an exemplary embodiment of the present disclosure. The flow diagram 300 may include araw input component 302, aCRAMP processor 304, and adata visualization 306. Theraw input component 302 may include awebsite URL 308, animage set 310, avideo set 312, adata stream 314, and ageolocation 316. Thewebsite URL 308, the image set 310, the video set 312, thedata stream 314, and thegeolocation 316 have been described above as the media. - The
raw input component 302 may provide input to theCRAMP engine 304. TheCRAMP processor 304 may include acontent analysis component 318, aCRAMP engine 320, and adata visualization component 322. Thecontent analysis component 318 may further include an object detection 324 (described in detail with respect to description ofFig. 2 ). Thecontent analysis component 318 may further include a reflectance detection 326 (described in detail with respect to description ofFig. 2 ). Thecontent analysis component 318 may further include a material property recognition 328 (described in detail with respect to description ofFig. 2 ). TheCRAMP engine 320 may include adata processing component 330 and a virus lifespan on surface database 332. database 332 may be the virus spatial-temporal matrix 226. Thedata processing component 330 may determine the usage frequency indicator 216 and create thematerial assessment database 220 mentioned above. Thedata visualization component 322 may include aheat map generation 334 and acleaning recommendation 336. Theheat map generation 334 may include the creation of theheat map 234. Thecleaning recommendation 336 may be the cleaning alert described by way ofFig. 1 andFig. 2 . TheCRAMP processor 304 may further include alearning loop 342. Thelearning loop 342 may include a user feedback processing component 344. - The
CRAMP processor 304 may provide an output to a user through thedata visualization 306. Thedata visualization 306 may include amobile application 338 and an application programming interface (API) 340. Themobile application 338 and theAPI 340 may be used by a user to interact with thesystem 110. Thedata visualization 306 may be used by the user to provide a user feedback to thesystem 110. As mentioned above, themodeler 150 may determine therisk assessment score 230 for each of theobjects 208 based on the implementation of thecognitive learning operation 232 on the viral risk prediction model 228 associated with each of theobjects 208. Thedata visualization 306 may facilitate a learning loop function of thecognitive learning operation 232 by providing the user feedback to theCRAMP processor 304. TheCRAMP processor 304 may process the user feedback using the user feedback processing component 344 and provide input to thelearning loop 342. Thelearning loop 342 may update thecognitive learning operation 232 based on the user feedback. - The
CRAMP processor 304 may process the user feedback using the user feedback processing component 344 and provide input to thelearning loop 342. Thelearning loop 342 may update thecognitive learning operation 232 based on the user feedback to determine a unique usage frequency indicator 216 for a user. -
Fig. 4 illustrates a workflow diagram 400 for virus risk prediction using a virus risk prediction system, according to an example embodiment of the present disclosure. Any of the components described above may be referred to hereinafter. The workflow diagram 400 may receive an input atblock 402. The input may be received from theraw input component 302. The workflow diagram 400 may perform a content analysis atblock 404. The content analysis may be implemented by thecontent analysis component 318 described above. The workflow diagram 400 may further include a CRAMP engine processing atblock 406. Theblock 406 may represent theCRAMP engine 320. The workflow diagram 400 may include a data visualization ofblock 408. The data visualization atblock 408 may represent thedata visualization 322 mentioned above. -
Fig. 5 illustrates apictorial representation 500 for vision-based tracking for virus risk prediction using a virus risk prediction system, according to an example embodiment of the present disclosure. Any of the components described above may be referred to hereinafter. Thepictorial representation 500 illustrates apicture 502 with various objects detected therein. As mentioned above, thedata collector 130 may detect objects for ageographic location 206. The objects identified from thepicture 502 may be a car, a truck, a bicycle, a traffic light, a person, and the like. Thepicture 502 may further include abox 504 demarcating an object 506 (a person), abox 510 demarcating an object 508 (a person), and abox 514 demarcating an object 512 (a car).) Thebox 504, thebox 510, and thebox 514 may be a bounding box. Thebox 504, thebox 510, and thebox 514 may mark the coordinates X, Y mentioned above of the calculation of therisk assessment score 230 for theobject 506, theobject 508, and theobject 512. The extraction of spatial-temporal features for each of theobjects 208 based on neural network-based feature extraction layers may be implemented on thebox 504, thebox 510, and thebox 514. Thedata collector 130 may create thebox 504, thebox 510, and thebox 514 so that to identify a single object through each box from the media. Thedata collector 130 may create multiple boxes like thebox 504, thebox 510, and thebox 514 as illustrated to identify theobjects 208. In an example, as illustrated thebox 504 may coincide with thebox 514 and include a part of theobject 512 along with themain object 506 identified by thebox 504. For example, in thepicture 502, thebox 504 may include theobject 506 and a part of theobject 512. Thesystem 110 may not consider the part of theobject 512 included in thebox 504 as objects present in the coordinates X, Y. -
Fig. 6 illustrates abox representation 600 of theobjects 208 detected across a geographical location for virus risk prediction using a virus risk prediction system, according to an example embodiment of the present disclosure. Any of the components described above may be referred to hereinafter. Thebox representation 600 illustrates anobject 1 602, anobject 2 604, and anobject 3 606. Theobject 2 604 may be overlapping theobject 1 602. Thedata collector 130 may detect the overlap withobject 2 604 in the coordinates for theobject 1 602. Thedata collector 130 may detect X, Y coordinates for the object 1 - 602, object 2 - 604, and the object 3 - 606. -
Fig. 7 illustrates adiagrammatic representation 700 of thematerial categories 212 for classifying theobjects 208 for virus risk prediction using a virus risk prediction system, according to an example embodiment of the present disclosure. Any of the components described above may be referred to hereinafter. As mentioned above thematerial categories 212 may include thesurface material 214 associated with theobjects 208. Thedata collector 130 may implement techniques mentioned above for the detection ofvarious surface material 214 associated with theobjects 208. - The
material categories 212 may be detected by thedata collector 130 as mentioned by way ofFig. 2 in a continuous and integrated manner so that there may be no overlaps amongst thesurface material 214 for multiple objects detected for the same image pixel. For example, a motorbike and a bike rider may be detected as objects present in the same image pixel. The image-based material detection techniques may detect thesurface material 214 for each of the multiple objects in the same pixel by demarcating amaterial boundary 714 for each surface material. Thematerial boundary 714 may detect the surface material for a part of the object present in the pixel frame. Thematerial boundary 714 may provide integration and continuity of material detection across the image frame for the detection ofvarious surface materials 214 present therein.material categories 212. For example, amaterial 1 702, a material 2 - 704, a material 3 - 706, a material 4 - 708, a material 5 - 710, and a material 6 - 712 may be detected in continuance with each other by thedata collector 130. -
Fig. 8 illustrates a heatmap generation workflow 800 for virus risk prediction using the virusrisk prediction system 110, according to an example embodiment of the present disclosure. - The heat
map generation workflow 800 may be deployed by thesystem 110 as an exemplary embodiment to generate theheat map 234. The heat map generation may include receiving an input from amedia component 802. Themedia component 802 may include the media mentioned by way ofFigs. 1 -3 . Theheat map generation 800 may further includetraining data 804. Thetraining data 804 may include data for training a neural network model, such as the CNN model mentioned above. The training dataset may include, but is not limited to, training images, training image frames, theobjects 208 detected from the training images, the surface material detection, and spatial-temporal features of the training images. Theheat map generation 800 may include extraction of a set of spatial-temporal features 808 from thetraining data 804. Themedia 802 may comprise a set ofmulti-frames 806 that may be fed into a spatial-temporal model 810. The set ofmulti-frames 806 may be the plurality of image frames mentioned above. The set ofmulti-frames 806 may include a target frame for which theheat map 234 may need to be generated and a set of neighboring frames (as illustrated byFig. 5 ). The spatial-temporal model 810 may also receive input from the set of spatial-temporal features 808. The spatial-temporal model 810 may extract one or more spatial-temporal features 210 of the set ofmulti-frames 806 based on the set of spatial-temporal features 808 and create aheat map 812 for the target frame based on the spatial-temporal features 210. -
Fig. 9 illustrates ahardware platform 900 for implementation of thesystem 110, according to an example embodiment of the present disclosure. For the sake of brevity, construction and operational features of thesystem 110 which are explained in detail above are not explained in detail herein. Particularly, computing machines such as but not limited to internal/external server clusters, quantum computers, desktops, laptops, smartphones, tablets, and wearables which may be used to execute thesystem 110 or may have the structure of thehardware platform 900. Thehardware platform 900 may include additional components not shown and that some of the components described may be removed and/or modified. In another example, a computer system with multiple GPUs can sit on external-cloud platforms including Amazon Web Services, or internal corporate cloud computing clusters, or organizational computing resources, etc. -
Figure 9 depicts ahardware platform 900.Hardware platform 900 may be a computer system that may be used with the examples described herein. Thecomputer system 900 may represent a computational platform that includes components that may be in a server or another computer system. Thecomputer system 900 may execute, by a processor (e.g., a single or multiple processors) or other hardware processing circuit, the methods, functions and other processes described herein. These methods, functions and other processes may be embodied as machine-readable instructions stored on a computer-readable medium, which may be non-transitory, such as hardware storage devices (e.g., RAM (random access memory), ROM (read-only memory), EPROM (erasable, programmable ROM), EEPROM (electrically erasable, programmable ROM), hard drives, and flash memory). Thecomputer system 900 may include aprocessor 905 that executes software instructions or code stored on a non-transitory computer-readable storage medium 910 to perform methods of the present disclosure. The software code includes, for example, instructions to gather data and documents and analyze documents. In an example, thedata collector 130, thedata analyzer 140, and themodeler 150 may be software codes or components performing these steps. - The instructions on the computer-
readable storage medium 910 are read and stored the instructions in storage 99 or in random access memory (RAM) 920. The storage 99 provides a large space for keeping static data where at least some instructions could be stored for later execution. The stored instructions may be further compiled to generate other representations of the instructions and dynamically stored in theRAM 920. Theprocessor 905 reads instructions from theRAM 920 and performs actions as instructed. - The
computer system 900 further includes anoutput device 925 to provide at least some of the results of the execution as output including, but not limited to, visual information to users, such as external agents. The output device can include a display on computing devices and virtual reality glasses. For example, the display can be a mobile phone screen or a laptop screen. GUIs and/or text are presented as an output on the display screen. Thecomputer system 900 further includesinput device 930 to provide a user or another device with mechanisms for entering data and/or otherwise interact with thecomputer system 900. The input device may include, for example, a keyboard, a keypad, a mouse, or a touchscreen. Each of theseoutput devices 925 andinput devices 930 could be joined by one or more additional peripherals. In an example, theoutput device 925 may be used to display the results of thequery 202. Theoutput device 925 may be used to display theheat map 234 for thegeographic location 206 based on the spatial-temporal features 210 for each of theobjects 208 and therisk assessment score 230 for each of theobjects 208. - A
network communicator 935 may be provided to connect thecomputer system 900 to a network and in turn to other devices connected to the network including other clients, servers, data stores, and interfaces, for instance. Anetwork communicator 935 may include, for example, a network adapter such as a LAN adapter or a wireless adapter. Thecomputer system 900 includes adata source interface 940 to accessdata source 945. A data source is an information resource. As an example, a database of exceptions and rules may be a data source. Moreover, knowledge repositories and curated data may be other examples of data sources. -
Figs. 10A and10B illustrate a process flowchart for virus risk prediction using the virusrisk prediction system 110, according to an example embodiment of the present disclosure. It should be understood that method steps are shown here for reference only and other combinations of the steps may be possible. Further, themethod 1000 may contain some steps in addition to the steps shown inFigs. 10A and10B . For the sake of brevity, construction, and operational features of thesystem 110 which are explained in detail in the description ofFigs. 1 - 9 are not explained in detail in the description ofFigs. 10A and10B . Themethod 1000 may be performed by a component of thesystem 110. - At block 1002, a
query 202 may be received associated with a virus risk assessment for aviral disease 204 across ageographic location 206. In an example embodiment, theviral disease 204 associated with thequery 202 may be a severe acute respiratory syndrome coronavirus 2 (SARS-CoV-2). - At
block 1004, viral disease data may be obtained associated with theviral disease 204 from a plurality of data sources. - At block 1006, the plurality of
objects 208 may be detected associated with the geographical location. The plurality ofobjects 208 may be potentially contaminated with a virus associated with theviral disease 204. - At
block 1008, spatial-temporal features 210 may be extracted for each of the plurality ofobjects 208. The spatial-temporal features 210 may comprise one or more of geospatial data, temporal data, and temperature data associated with each of the plurality ofobjects 208. - At
block 1010, the plurality ofobjects 208 may be classified in a material category from amongst amaterial categories 212. Each of thematerial categories 212 may comprise asurface material 214 associated with each of the plurality ofobjects 208. Themethod 1000 may determine thematerial categories 212 based on an analysis of a reflectance attribute associated with thesurface material 214 associated with each of the plurality ofobjects 208. Themethod 1000 may include an analysis of a plurality of material attributes associated with thesurface material 214 associated with each of the plurality ofobjects 208 for determining thematerial categories 212. - At block 1012, the usage frequency indicator 216 may be determined for each of the plurality of
objects 208 based on the identification of a plurality of usage parameters 218 associated with each of the plurality ofobjects 208. In an example embodiment, themethod 1000 may include determining a unique usage frequency indicator 216 for a user based on the identification of the plurality of usage parameters 218 unique to the user. - At block 1014, the
material assessment database 220 may be created, the material assessment database may include details pertaining to a lifespan of the virus with respect to each of the plurality of material categories. - At
block 1016, the virus spatial-temporal matrix 226 may be created based on mapping the lifespan of the virus corresponding to each of thesurface material 214 for each of the plurality ofobjects 208 with the spatial-temporal features 210 for each of the plurality ofobjects 208. - At block 1018, the viral risk prediction model 228 may be created associated with each of the plurality of
objects 208 based on mapping the virus spatial-temporal matrix 226 with the usage frequency indicator 216 for each of the plurality ofobjects 208. - At block 1020, the
risk assessment score 230 may be determined for each of the plurality ofobjects 208 based on the implementation of acognitive learning operation 232 on the viral risk prediction model 228 associated with each of the plurality ofobjects 208. Therisk assessment score 230 may be indicative of an extent of virus exposure associated with each of the plurality ofobjects 208. - At block 1022, the
heat map 234 may be created for thegeographic location 206 based on the spatial-temporal features 210 for each of the plurality ofobjects 208 and therisk assessment score 230 for each of the plurality ofobjects 208 Theheat map 234 may be indicative of the extent of the virus exposure associated with each of the plurality ofobjects 208 detected for thegeographic location 206. - Following the creation of the
heat map 234, at block 1024, theheat map 234 may be displayed to a user or provided as an input to an application for consumption by a user. For example, theheat map 234 may be provided as a visualization to the user that is overlaid on a live camera view on a display of the user's mobile device. In another example embodiment,heat map 234 may be provided as an input to a routing application on the user's mobile device that may select from a plurality of routes and recommend to the user, based on theheat map 234, a route that minimizes potential virus exposure and/or has a least likely virus exposure potential. In an example embodiment, themethod 1000 may further comprise detecting the plurality ofobjects 208 from an image, a video-based medium, a uniform resource locator, a geolocation, and a data stream associated with thegeographic location 206. Themethod 1000 may comprise extracting a plurality of image frames from the image, the video-based medium, the uniform resource locator, the geolocation, and the data stream associated with thegeographic location 206. Themethod 1000 may comprise extracting the spatial-temporal features 210 for each of the plurality ofobjects 208 based on neural network-based feature extraction layers implemented on the plurality of image frames. - The
method 1000 may further comprise generating the cleaning alert for a user for an object, from among the plurality ofobjects 208, having therisk assessment score 230 above a threshold risk assessment score. - In an example, the
method 1000 may be practiced using a non-transitory computer-readable medium. In an example, themethod 1000 may be computer-implemented. - The present disclosure provides for the virus
risk prediction system 110 that may generate key insights related to virus risk prediction with minimal human intervention. - One of ordinary skill in the art will appreciate that techniques consistent with the present disclosure are applicable in other contexts as well without departing from the scope of the disclosure.
- What has been described and illustrated herein are examples of the present disclosure. The terms, descriptions, and figures used herein are set forth by way of illustration only and are not meant as limitations. Many variations are possible within the spirit and scope of the subject matter, which is intended to be defined by the following claims and their equivalents in which all terms are meant in their broadest reasonable sense unless otherwise indicated.
Claims (8)
- A system comprising:a processor;a data collector coupled to the processor, the data collector to:receive a query associated with a virus risk assessment for a viral disease across a geographic location;obtain viral disease data associated with the viral disease from a plurality of data sources;detect a plurality of objects associated with the geographical location, the plurality of objects being potentially contaminated with a virus associated with the viral disease;extract spatial-temporal features for each of the plurality of objects, the spatial-temporal features comprising geospatial data, temporal data, and temperature data associated with each of the plurality of objects; andclassify the plurality of objects in a material category from amongst a plurality of material categories, the material category indicative of a surface material associated with each of the plurality of objects;a data analyzer coupled to the processor, the data analyzer to:determine a usage frequency indicator for each of the plurality of objects based on identification of a plurality of usage parameters associated with each of the plurality of objects;create a material assessment database including details pertaining to a lifespan of the virus with respect to each of the plurality of material categories; andcreate a virus spatial-temporal matrix based on mapping the lifespan of the virus corresponding to each of the surface materials for the plurality of objects with the spatial-temporal features for each of the plurality of objects; anda modeler coupled to the processor, the modeler to:create a viral risk prediction model associated with each of the plurality of objects based on mapping the virus spatial-temporal matrix with the usage frequency indicator for each of the plurality of objects;determine a risk assessment score for each of the plurality of objects based on implementation of a cognitive learning operation on the viral risk prediction model associated with each of the plurality of objects, wherein the risk assessment score is indicative of an extent of virus exposure associated with each of the plurality of objects; andcreate a heat map for the geographic location based on the spatial-temporal features for each of the plurality of objects and the risk assessment score for each of the plurality of objects, the heat map being indicative of the extent of the virus exposure associated with each of the plurality of objects detected for the geographic location.
- The system as claimed in claim 1, wherein the data collector detects the plurality of objects from an image, a video-based medium, a uniform resource locator, a geolocation, and a data stream associated with the geographic location.
- The system as claimed in claim 2, wherein the data collector:extracts a plurality of image frames from at least one of the image, the video-based medium, the uniform resource locator, the geolocation, and the data stream associated with the geographic location; andobtains the spatial-temporal features for each of the plurality of objects based on neural network-based feature extraction layers implemented on the plurality of image frames.
- The system as claimed in claim 1, 2 or 3, wherein the modeler generates a cleaning alert for a user for an object, from among the plurality of objects, having the risk assessment score above a threshold risk assessment score.
- The system as claimed in any of the preceding claims, wherein the viral disease associated with the query is a severe acute respiratory syndrome coronavirus 2 (SARS-COV-2).
- The system as claimed in any of the preceding claims, wherein the data collector determines the plurality of material categories based on:an analysis of a reflectance attribute associated with the surface material associated with each of the plurality of objects; andan analysis of a plurality of material attributes associated with the surface material associated with each of the plurality of objects.
- The system as claimed in any of the preceding claims, wherein the data analyzer determines a unique usage frequency indicator for a user based on identification of the plurality of usage parameters unique to the user.
- The system as claimed in any of the preceding claims, wherein the modeler is further to provide the heat map as an input to a routing application to provide a user of the routing application a route that minimizes virus exposure potential.
Applications Claiming Priority (1)
| Application Number | Priority Date | Filing Date | Title |
|---|---|---|---|
| EP20305500 | 2020-05-15 |
Publications (2)
| Publication Number | Publication Date |
|---|---|
| EP3910649A1 true EP3910649A1 (en) | 2021-11-17 |
| EP3910649B1 EP3910649B1 (en) | 2025-03-26 |
Family
ID=71108542
Family Applications (1)
| Application Number | Title | Priority Date | Filing Date |
|---|---|---|---|
| EP21164208.7A Active EP3910649B1 (en) | 2020-05-15 | 2021-03-23 | Virus risk prediction |
Country Status (2)
| Country | Link |
|---|---|
| US (1) | US11837366B2 (en) |
| EP (1) | EP3910649B1 (en) |
Families Citing this family (6)
| Publication number | Priority date | Publication date | Assignee | Title |
|---|---|---|---|---|
| US12322099B2 (en) * | 2020-06-05 | 2025-06-03 | Nec Corporation | Image processing apparatus, image processing method, and non-transitory computer-readable medium |
| US12249431B2 (en) * | 2020-10-09 | 2025-03-11 | Optum Services (Ireland) Limited | Predictive data analysis techniques for optimal traversal of infection networks |
| US20230147096A1 (en) * | 2021-11-08 | 2023-05-11 | Nvidia Corporation | Unstructured data storage and retrieval in conversational artificial intelligence applications |
| US12106568B2 (en) * | 2022-02-22 | 2024-10-01 | Tyco Fire & Security Gmbh | Method and system for crowd counting |
| CN118116615A (en) * | 2024-03-07 | 2024-05-31 | 深圳市疾病预防控制中心(深圳市卫生检验中心、深圳市预防医学研究所) | A method for predicting infectious disease risk based on detection sharing network |
| CN121306592B (en) * | 2025-12-15 | 2026-03-17 | 福州金域医学检验实验室有限公司 | A method for predicting the risk of respiratory infections in children based on multi-source medical data |
Citations (1)
| Publication number | Priority date | Publication date | Assignee | Title |
|---|---|---|---|---|
| US20180276735A1 (en) * | 2017-03-25 | 2018-09-27 | JEER, Inc. | System and Method for Providing Location-Based and Activity-Centric Recommendations for Cleaning Products and Other Services |
Family Cites Families (10)
| Publication number | Priority date | Publication date | Assignee | Title |
|---|---|---|---|---|
| WO2008013553A2 (en) * | 2006-07-25 | 2008-01-31 | Northrop Grumman Corporation | Global disease surveillance platform, and corresponding system and method |
| WO2013120199A1 (en) * | 2012-02-13 | 2013-08-22 | Kamran Khan | Warning system for infectious diseases and method therefor |
| US20160171179A1 (en) * | 2014-12-10 | 2016-06-16 | NSF International | System and method for investigating the spread of pathogens at a site |
| WO2017079938A1 (en) * | 2015-11-12 | 2017-05-18 | Coyote Bioscience Co., Ltd. | Methods and systems for disease monitoring and assessment |
| US11087888B2 (en) * | 2017-07-28 | 2021-08-10 | Koninklijke Philips N.V. | Monitoring direct and indirect transmission of infections in a healthcare facility using a real-time locating system |
| US20190252078A1 (en) * | 2018-02-15 | 2019-08-15 | X Development Llc | Predicting the spread of contagions |
| JP6955118B2 (en) * | 2018-03-30 | 2021-10-27 | ユーブイ パートナーズ,インコーポレイティド | Disinfection behavior tracking and rating |
| US20200051696A1 (en) * | 2018-08-08 | 2020-02-13 | Koninklijke Philips N.V. | Method for transforming patient data into images for infection prediction |
| US11529434B1 (en) * | 2019-08-20 | 2022-12-20 | Michael Gurin | Dynamic reconfigurable contamination reduction control system |
| US20210310070A1 (en) * | 2020-04-04 | 2021-10-07 | Phylagen, Inc. | Assessing infection risk to humans |
-
2021
- 2021-03-23 EP EP21164208.7A patent/EP3910649B1/en active Active
- 2021-04-12 US US17/228,331 patent/US11837366B2/en active Active
Patent Citations (1)
| Publication number | Priority date | Publication date | Assignee | Title |
|---|---|---|---|---|
| US20180276735A1 (en) * | 2017-03-25 | 2018-09-27 | JEER, Inc. | System and Method for Providing Location-Based and Activity-Centric Recommendations for Cleaning Products and Other Services |
Non-Patent Citations (3)
| Title |
|---|
| CAO DANYANG ET AL: "An improved object detection algorithm based onmulti-scaled anddeformable convolutional neural networks", 11 April 2020 (2020-04-11), XP055833195, Retrieved from the Internet <URL:https://hcis-journal.springeropen.com/track/pdf/10.1186/s13673-020-00219-9.pdf> [retrieved on 20210819], DOI: 10.1186/s13673-020-00219-9 * |
| HANG ZHANG ET AL: "Reflectance hashing for material recognition", 2015 IEEE CONFERENCE ON COMPUTER VISION AND PATTERN RECOGNITION (CVPR), IEEE, 7 June 2015 (2015-06-07), pages 3071 - 3080, XP032793755, DOI: 10.1109/CVPR.2015.7298926 * |
| KAMPF G ET AL: "Persistence of coronaviruses on inanimate surfaces and their inactivation with biocidal agents", JOURNAL OF HOSPITAL INFECTION, ELSEVIER, AMSTERDAM, NL, vol. 104, no. 3, 6 February 2020 (2020-02-06), pages 246 - 251, XP086070327, ISSN: 0195-6701, [retrieved on 20200206], DOI: 10.1016/J.JHIN.2020.01.022 * |
Also Published As
| Publication number | Publication date |
|---|---|
| US20210358632A1 (en) | 2021-11-18 |
| US11837366B2 (en) | 2023-12-05 |
| EP3910649B1 (en) | 2025-03-26 |
Similar Documents
| Publication | Publication Date | Title |
|---|---|---|
| US11837366B2 (en) | Infection risk prediction | |
| Ye et al. | $\alpha $-Satellite: An AI-driven System and Benchmark Datasets for Hierarchical Community-level Risk Assessment to Help Combat COVID-19 | |
| US10614316B2 (en) | Anomalous event retriever | |
| Huang et al. | Uncertainties in the assessment of COVID-19 risk: A study of people’s exposure to high-risk environments using individual-level activity data | |
| US9934447B2 (en) | Object detection and classification | |
| Yang et al. | Automated extraction of street-scene objects from mobile lidar point clouds | |
| US9922271B2 (en) | Object detection and classification | |
| US10244060B2 (en) | Determining seeds for targeted notifications through online social networks in conjunction with user mobility data | |
| Moral et al. | Towards automatic waste containers management in cities via computer vision: containers localization and geo-positioning in city maps | |
| Ahn et al. | A digital twin city model for age-friendly communities: Capturing environmental distress from multimodal sensory data | |
| Liu et al. | Enhancing fine-grained intra-urban dengue forecasting by integrating spatial interactions of human movements between urban regions | |
| Negri et al. | Image-based social sensing: Combining AI and the crowd to mine policy-adherence indicators from twitter | |
| CN109697392A (en) | Draw the method and device of target object thermodynamic chart | |
| Pierce Jr | Accuracy optimization for high resolution object-based change detection: An example mapping regional urbanization with 1-m aerial imagery | |
| Li et al. | A personalized activity-based spatiotemporal risk mapping approach to the COVID-19 pandemic | |
| Li et al. | Direct generation of level of service maps from images using convolutional and long short-term memory networks | |
| Sengupta et al. | HRNET: AI-on-edge for mask detection and social distancing calculation | |
| Ahuja et al. | COVID-19: Social distancing monitoring using faster-RCNN and YOLOv3 algorithms | |
| Hou et al. | Sensing urban physical environment with geoai and street-level imagery | |
| Singh et al. | Chaotic whale-atom search optimization-based deep stacked auto encoder for crowd behaviour recognition | |
| Sabouri et al. | U-Net-based integrated framework for pavement crack detection and zone-based scoring | |
| CN114692593A (en) | Network information safety monitoring and early warning method | |
| Song | The street space planning and design of artificial intelligence-assisted deep learning neural network in the Internet of Things | |
| CN112287243B (en) | Service information recommendation device and method based on collaborative filtering algorithm | |
| CN114463700A (en) | Seat state management method, device, equipment and storage medium |
Legal Events
| Date | Code | Title | Description |
|---|---|---|---|
| PUAI | Public reference made under article 153(3) epc to a published international application that has entered the european phase |
Free format text: ORIGINAL CODE: 0009012 |
|
| STAA | Information on the status of an ep patent application or granted ep patent |
Free format text: STATUS: THE APPLICATION HAS BEEN PUBLISHED |
|
| AK | Designated contracting states |
Kind code of ref document: A1 Designated state(s): AL AT BE BG CH CY CZ DE DK EE ES FI FR GB GR HR HU IE IS IT LI LT LU LV MC MK MT NL NO PL PT RO RS SE SI SK SM TR |
|
| B565 | Issuance of search results under rule 164(2) epc |
Effective date: 20210831 |
|
| STAA | Information on the status of an ep patent application or granted ep patent |
Free format text: STATUS: REQUEST FOR EXAMINATION WAS MADE |
|
| 17P | Request for examination filed |
Effective date: 20220516 |
|
| RBV | Designated contracting states (corrected) |
Designated state(s): AL AT BE BG CH CY CZ DE DK EE ES FI FR GB GR HR HU IE IS IT LI LT LU LV MC MK MT NL NO PL PT RO RS SE SI SK SM TR |
|
| GRAP | Despatch of communication of intention to grant a patent |
Free format text: ORIGINAL CODE: EPIDOSNIGR1 |
|
| STAA | Information on the status of an ep patent application or granted ep patent |
Free format text: STATUS: GRANT OF PATENT IS INTENDED |
|
| RIC1 | Information provided on ipc code assigned before grant |
Ipc: G16H 50/80 20180101ALN20241112BHEP Ipc: G16H 50/30 20180101AFI20241112BHEP |
|
| RIC1 | Information provided on ipc code assigned before grant |
Ipc: G16H 50/80 20180101ALN20241121BHEP Ipc: G16H 50/30 20180101AFI20241121BHEP |
|
| INTG | Intention to grant announced |
Effective date: 20241217 |
|
| P01 | Opt-out of the competence of the unified patent court (upc) registered |
Free format text: CASE NUMBER: APP_67320/2024 Effective date: 20241219 |
|
| GRAS | Grant fee paid |
Free format text: ORIGINAL CODE: EPIDOSNIGR3 |
|
| GRAA | (expected) grant |
Free format text: ORIGINAL CODE: 0009210 |
|
| STAA | Information on the status of an ep patent application or granted ep patent |
Free format text: STATUS: THE PATENT HAS BEEN GRANTED |
|
| AK | Designated contracting states |
Kind code of ref document: B1 Designated state(s): AL AT BE BG CH CY CZ DE DK EE ES FI FR GB GR HR HU IE IS IT LI LT LU LV MC MK MT NL NO PL PT RO RS SE SI SK SM TR |
|
| REG | Reference to a national code |
Ref country code: GB Ref legal event code: FG4D |
|
| REG | Reference to a national code |
Ref country code: CH Ref legal event code: EP |
|
| REG | Reference to a national code |
Ref country code: DE Ref legal event code: R096 Ref document number: 602021028007 Country of ref document: DE |
|
| REG | Reference to a national code |
Ref country code: IE Ref legal event code: FG4D |
|
| PG25 | Lapsed in a contracting state [announced via postgrant information from national office to epo] |
Ref country code: RS Free format text: LAPSE BECAUSE OF FAILURE TO SUBMIT A TRANSLATION OF THE DESCRIPTION OR TO PAY THE FEE WITHIN THE PRESCRIBED TIME-LIMIT Effective date: 20250626 |
|
| PG25 | Lapsed in a contracting state [announced via postgrant information from national office to epo] |
Ref country code: FI Free format text: LAPSE BECAUSE OF FAILURE TO SUBMIT A TRANSLATION OF THE DESCRIPTION OR TO PAY THE FEE WITHIN THE PRESCRIBED TIME-LIMIT Effective date: 20250326 |
|
| REG | Reference to a national code |
Ref country code: LT Ref legal event code: MG9D |
|
| PG25 | Lapsed in a contracting state [announced via postgrant information from national office to epo] |
Ref country code: NO Free format text: LAPSE BECAUSE OF FAILURE TO SUBMIT A TRANSLATION OF THE DESCRIPTION OR TO PAY THE FEE WITHIN THE PRESCRIBED TIME-LIMIT Effective date: 20250626 |
|
| PG25 | Lapsed in a contracting state [announced via postgrant information from national office to epo] |
Ref country code: HR Free format text: LAPSE BECAUSE OF FAILURE TO SUBMIT A TRANSLATION OF THE DESCRIPTION OR TO PAY THE FEE WITHIN THE PRESCRIBED TIME-LIMIT Effective date: 20250326 |
|
| PG25 | Lapsed in a contracting state [announced via postgrant information from national office to epo] |
Ref country code: LV Free format text: LAPSE BECAUSE OF FAILURE TO SUBMIT A TRANSLATION OF THE DESCRIPTION OR TO PAY THE FEE WITHIN THE PRESCRIBED TIME-LIMIT Effective date: 20250326 |
|
| PG25 | Lapsed in a contracting state [announced via postgrant information from national office to epo] |
Ref country code: GR Free format text: LAPSE BECAUSE OF FAILURE TO SUBMIT A TRANSLATION OF THE DESCRIPTION OR TO PAY THE FEE WITHIN THE PRESCRIBED TIME-LIMIT Effective date: 20250627 Ref country code: BG Free format text: LAPSE BECAUSE OF FAILURE TO SUBMIT A TRANSLATION OF THE DESCRIPTION OR TO PAY THE FEE WITHIN THE PRESCRIBED TIME-LIMIT Effective date: 20250326 |
|
| REG | Reference to a national code |
Ref country code: NL Ref legal event code: MP Effective date: 20250326 |
|
| PG25 | Lapsed in a contracting state [announced via postgrant information from national office to epo] |
Ref country code: NL Free format text: LAPSE BECAUSE OF FAILURE TO SUBMIT A TRANSLATION OF THE DESCRIPTION OR TO PAY THE FEE WITHIN THE PRESCRIBED TIME-LIMIT Effective date: 20250326 |
|
| PG25 | Lapsed in a contracting state [announced via postgrant information from national office to epo] |
Ref country code: SE Free format text: LAPSE BECAUSE OF FAILURE TO SUBMIT A TRANSLATION OF THE DESCRIPTION OR TO PAY THE FEE WITHIN THE PRESCRIBED TIME-LIMIT Effective date: 20250326 |
|
| REG | Reference to a national code |
Ref country code: AT Ref legal event code: MK05 Ref document number: 1779804 Country of ref document: AT Kind code of ref document: T Effective date: 20250326 |
|
| PG25 | Lapsed in a contracting state [announced via postgrant information from national office to epo] |
Ref country code: SM Free format text: LAPSE BECAUSE OF FAILURE TO SUBMIT A TRANSLATION OF THE DESCRIPTION OR TO PAY THE FEE WITHIN THE PRESCRIBED TIME-LIMIT Effective date: 20250326 |
|
| PG25 | Lapsed in a contracting state [announced via postgrant information from national office to epo] |
Ref country code: PT Free format text: LAPSE BECAUSE OF FAILURE TO SUBMIT A TRANSLATION OF THE DESCRIPTION OR TO PAY THE FEE WITHIN THE PRESCRIBED TIME-LIMIT Effective date: 20250728 Ref country code: ES Free format text: LAPSE BECAUSE OF FAILURE TO SUBMIT A TRANSLATION OF THE DESCRIPTION OR TO PAY THE FEE WITHIN THE PRESCRIBED TIME-LIMIT Effective date: 20250326 |
|
| PG25 | Lapsed in a contracting state [announced via postgrant information from national office to epo] |
Ref country code: IT Free format text: LAPSE BECAUSE OF FAILURE TO SUBMIT A TRANSLATION OF THE DESCRIPTION OR TO PAY THE FEE WITHIN THE PRESCRIBED TIME-LIMIT Effective date: 20250326 Ref country code: PL Free format text: LAPSE BECAUSE OF FAILURE TO SUBMIT A TRANSLATION OF THE DESCRIPTION OR TO PAY THE FEE WITHIN THE PRESCRIBED TIME-LIMIT Effective date: 20250326 |
|
| PG25 | Lapsed in a contracting state [announced via postgrant information from national office to epo] |
Ref country code: AT Free format text: LAPSE BECAUSE OF FAILURE TO SUBMIT A TRANSLATION OF THE DESCRIPTION OR TO PAY THE FEE WITHIN THE PRESCRIBED TIME-LIMIT Effective date: 20250326 |
|
| PG25 | Lapsed in a contracting state [announced via postgrant information from national office to epo] |
Ref country code: EE Free format text: LAPSE BECAUSE OF FAILURE TO SUBMIT A TRANSLATION OF THE DESCRIPTION OR TO PAY THE FEE WITHIN THE PRESCRIBED TIME-LIMIT Effective date: 20250326 |
|
| PG25 | Lapsed in a contracting state [announced via postgrant information from national office to epo] |
Ref country code: RO Free format text: LAPSE BECAUSE OF FAILURE TO SUBMIT A TRANSLATION OF THE DESCRIPTION OR TO PAY THE FEE WITHIN THE PRESCRIBED TIME-LIMIT Effective date: 20250326 |
|
| PG25 | Lapsed in a contracting state [announced via postgrant information from national office to epo] |
Ref country code: SK Free format text: LAPSE BECAUSE OF FAILURE TO SUBMIT A TRANSLATION OF THE DESCRIPTION OR TO PAY THE FEE WITHIN THE PRESCRIBED TIME-LIMIT Effective date: 20250326 |
|
| PG25 | Lapsed in a contracting state [announced via postgrant information from national office to epo] |
Ref country code: IS Free format text: LAPSE BECAUSE OF FAILURE TO SUBMIT A TRANSLATION OF THE DESCRIPTION OR TO PAY THE FEE WITHIN THE PRESCRIBED TIME-LIMIT Effective date: 20250726 |
|
| REG | Reference to a national code |
Ref country code: DE Ref legal event code: R097 Ref document number: 602021028007 Country of ref document: DE |
|
| PG25 | Lapsed in a contracting state [announced via postgrant information from national office to epo] |
Ref country code: DK Free format text: LAPSE BECAUSE OF FAILURE TO SUBMIT A TRANSLATION OF THE DESCRIPTION OR TO PAY THE FEE WITHIN THE PRESCRIBED TIME-LIMIT Effective date: 20250326 |
|
| PGFP | Annual fee paid to national office [announced via postgrant information from national office to epo] |
Ref country code: FR Payment date: 20251231 Year of fee payment: 6 |
|
| PG25 | Lapsed in a contracting state [announced via postgrant information from national office to epo] |
Ref country code: CZ Free format text: LAPSE BECAUSE OF FAILURE TO SUBMIT A TRANSLATION OF THE DESCRIPTION OR TO PAY THE FEE WITHIN THE PRESCRIBED TIME-LIMIT Effective date: 20250326 |
|
| PLBE | No opposition filed within time limit |
Free format text: ORIGINAL CODE: 0009261 |
|
| STAA | Information on the status of an ep patent application or granted ep patent |
Free format text: STATUS: NO OPPOSITION FILED WITHIN TIME LIMIT |
|
| REG | Reference to a national code |
Ref country code: CH Ref legal event code: L10 Free format text: ST27 STATUS EVENT CODE: U-0-0-L10-L00 (AS PROVIDED BY THE NATIONAL OFFICE) Effective date: 20260211 |
|
| 26N | No opposition filed |
Effective date: 20260105 |
|
| PGFP | Annual fee paid to national office [announced via postgrant information from national office to epo] |
Ref country code: GB Payment date: 20260106 Year of fee payment: 6 |
|
| PGFP | Annual fee paid to national office [announced via postgrant information from national office to epo] |
Ref country code: IE Payment date: 20260102 Year of fee payment: 6 Ref country code: DE Payment date: 20260102 Year of fee payment: 6 |