EP3910381A1 - Characterizing fracture orientations in orthorhombic adjacent layers using the phase of azimuthal fourier coefficients - Google Patents
Characterizing fracture orientations in orthorhombic adjacent layers using the phase of azimuthal fourier coefficients Download PDFInfo
- Publication number
- EP3910381A1 EP3910381A1 EP21305495.0A EP21305495A EP3910381A1 EP 3910381 A1 EP3910381 A1 EP 3910381A1 EP 21305495 A EP21305495 A EP 21305495A EP 3910381 A1 EP3910381 A1 EP 3910381A1
- Authority
- EP
- European Patent Office
- Prior art keywords
- orthorhombic
- azimuthal
- fcs
- adjacent layers
- phases
- Prior art date
- Legal status (The legal status is an assumption and is not a legal conclusion. Google has not performed a legal analysis and makes no representation as to the accuracy of the status listed.)
- Withdrawn
Links
Images




Classifications
-
- G—PHYSICS
- G01—MEASURING; TESTING
- G01V—GEOPHYSICS; GRAVITATIONAL MEASUREMENTS; DETECTING MASSES OR OBJECTS; TAGS
- G01V1/00—Seismology; Seismic or acoustic prospecting or detecting
- G01V1/28—Processing seismic data, e.g. for interpretation or for event detection
- G01V1/30—Analysis
- G01V1/306—Analysis for determining physical properties of the subsurface, e.g. impedance, porosity or attenuation profiles
-
- G—PHYSICS
- G01—MEASURING; TESTING
- G01V—GEOPHYSICS; GRAVITATIONAL MEASUREMENTS; DETECTING MASSES OR OBJECTS; TAGS
- G01V1/00—Seismology; Seismic or acoustic prospecting or detecting
- G01V1/28—Processing seismic data, e.g. for interpretation or for event detection
- G01V1/30—Analysis
- G01V1/301—Analysis for determining seismic cross-sections or geostructures
-
- G—PHYSICS
- G06—COMPUTING OR CALCULATING; COUNTING
- G06F—ELECTRIC DIGITAL DATA PROCESSING
- G06F17/00—Digital computing or data processing equipment or methods, specially adapted for specific functions
- G06F17/10—Complex mathematical operations
- G06F17/14—Fourier, Walsh or analogous domain transformations, e.g. Laplace, Hilbert, Karhunen-Loeve, transforms
-
- G—PHYSICS
- G01—MEASURING; TESTING
- G01V—GEOPHYSICS; GRAVITATIONAL MEASUREMENTS; DETECTING MASSES OR OBJECTS; TAGS
- G01V2210/00—Details of seismic processing or analysis
- G01V2210/50—Corrections or adjustments related to wave propagation
- G01V2210/58—Media-related
- G01V2210/586—Anisotropic media
-
- G—PHYSICS
- G01—MEASURING; TESTING
- G01V—GEOPHYSICS; GRAVITATIONAL MEASUREMENTS; DETECTING MASSES OR OBJECTS; TAGS
- G01V2210/00—Details of seismic processing or analysis
- G01V2210/60—Analysis
- G01V2210/63—Seismic attributes, e.g. amplitude, polarity, instant phase
- G01V2210/632—Amplitude variation versus offset or angle of incidence [AVA, AVO, AVI]
-
- G—PHYSICS
- G01—MEASURING; TESTING
- G01V—GEOPHYSICS; GRAVITATIONAL MEASUREMENTS; DETECTING MASSES OR OBJECTS; TAGS
- G01V2210/00—Details of seismic processing or analysis
- G01V2210/60—Analysis
- G01V2210/64—Geostructures, e.g. in 3D data cubes
- G01V2210/646—Fractures
-
- G—PHYSICS
- G01—MEASURING; TESTING
- G01V—GEOPHYSICS; GRAVITATIONAL MEASUREMENTS; DETECTING MASSES OR OBJECTS; TAGS
- G01V2210/00—Details of seismic processing or analysis
- G01V2210/70—Other details related to processing
Definitions
- Embodiments of the subject matter disclosed herein generally relate to methods and systems for seismic exploration, and, in particular, to methods and systems for investigating fracture orientations in orthorhombic media/layers.
- Seismic exploration is frequently used in oil and gas exploration and recovery for locating hydrocarbon reservoirs and designing exploitation (drilling) plans. Analysis of seismic data obtained during seismic surveys provides valuable information about structure and physical parameters of subterranean rock formations.
- a source In a seismic survey, a source generates a seismic signal that propagates into the explored formation and is, at least partially, reflected at interfaces between a formation's layer having different acoustic impedances.
- the source typically generates compressional seismic signals, that is, pressure variations along the propagation direction (i.e., P-waves), but both P-waves and S-waves (i.e., shear/secondary waves) may be generated at layer interfaces.
- Seismic detectors record seismic data which may represent both P- and S-waves.
- the recorded seismic data includes a convolution of the source wavelet (i.e., the signal's signature) and the formation's response function.
- Seismic data processing aims to extract the formation's response function, and various parameters related to the explored formation.
- One way of expressing the response function is by using reflectivity, R, which for detected P-waves is R pp .
- Reflectivity depends on the incidence angle, ⁇ , (which is defined in a vertical plane) and the azimuth angle, ⁇ (which is defined in a horizontal plane). Reflectivity characterizes subterranean properties and can serve as input to other inversion algorithms. For example, reflectivity can provide useful information regarding the anisotropy parameters of the subterranean formation, such as subsurface fractures.
- anisotropy parameters may reveal shale plays, tight gas sands and coal bed methane, as well as carbonates in naturally fractured reservoirs. These characteristics and parameters are used to design and manage underground transportation systems, foundations of major structures, cavities for storage of liquids, gases or solids, etc.
- this kind of information is used for determining optimal locations and orientations of wells (which may be vertical, inclined or deviated, and horizontal), to minimize wellbore instability and formation break-out.
- This information may also be used for stimulating the production of hydrocarbons by applying hydraulic pressure on the formation from the wellbore.
- geothermal exploration such information is used to better determine location/orientation while tapping into geothermal resources.
- Another area where such information is usedful is in carbon capture and storage.
- the data inversions yield estimates of the elastic stiffnesses (velocities and anisotropic parameters) that can be used to predict lithology, porosity and the fluid content of the subsurface, as well as intensity and orientation of fractures in subterranean formations. This kind of information is important when designing drilling paths, particularly when fracking is used.
- Adjacent layers e.g., 110 and 120
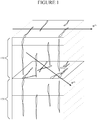
- Adjacent layers generally have different symmetry axes, e.g., ⁇ (1) and ⁇ (2) drawn on respective layer's top surface in Figure 1 .
- Methods and devices according to various embodiments determine fracture orientation from seismic data using the phases of azimuthal Fourier coefficients (FCs).
- FCs azimuthal Fourier coefficients
- a seismic exploration method characterizing fracture orientations in orthorhombic adjacent layers.
- the method includes obtaining seismic data with azimuthal coverage enabling calculating azimuthal FCs of reflectivity at an interface between the orthorhombic adjacent layers, calculating phases of 2 nd and 4 th azimuthal FCs for different incidence angles, and characterizing the fracture orientations in the orthorhombic adjacent layers based on the phases of 2 nd and 4 th azimuthal FCs, for a drilling and/or fracking plan.
- a seismic data processing apparatus including an interface and a data processing unit connected to the interface.
- the interface is configured to obtain seismic data with azimuthal coverage enabling calculating azimuthal FCs of reflectivity at an interface between the orthorhombic adjacent layers.
- the data processing unit is configured to calculate phases of 2 nd and 4 th azimuthal FCs for different incidence angles, and to characterize the fracture orientations in the orthorhombic adjacent layers based on the phases of 2 nd and 4 th azimuthal FCs, for a drilling and/or fracking plan.
- a computer-readable recording medium non-transitorily storing executable codes which, when executed by a computer, make the computer perform a seismic exploration method.
- the method includes obtaining seismic data with azimuthal coverage enabling calculating azimuthal FCs of reflectivity at an interface between the orthorhombic adjacent layers, calculating phases of 2 nd and 4 th azimuthal FCs for different incidence angles, and characterizing the fracture orientations in the orthorhombic adjacent layers based on the phases of 2 nd and 4 th azimuthal FCs, for a drilling and/or fracking plan.
- Embodiments described hereinafter obtain fracture orientation characterization using seismic data. More specifically, this approach uses the phase of azimuthal FCs to characterize a change of fracture orientation between two adjacent orthorhombic layers (each with substantial parallel vertical fractures embedded in a transverse isotropic media, but their parallel fractures having different symmetry axes).
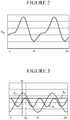
- the reflectivity R pp varies with azimuth ⁇ at this interface as illustrated in Figure 2 , exhibiting peaks and troughs.
- FC azimuthal Fourier coefficients
- Figure 4 illustrates the steps in establishing the theoretical basis of relating phases of FCs to fracture orientations.
- the orthorhombic stiffness matrices are defined for both top and bottom layers.
- Orthorhombic media Modeling elastic wave behavior in a vertically fractured earth
- each density-normalized stiffness matrix is rotated relative to its symmetry axis using a Bond transformation at step 420.
- Bond transformation which is described in the 1990 article " Velocity anisotropy terminology for geophysicists" by Winterstein, D. F., published in Geophysics, Vol. 55, No. 8, pp.
- the weak anisotropy parameters and their contrasts for general anisotropy are calculated in the manner introduced in the 1998 article " Polarization, phase velocity, and NMO velocity of qP-waves in arbitrary weakly anisotropic media" by P ⁇ en ⁇ ik, I. and Gajewski, D., published in Geophysics, Vol. 63, No. 5, pp. 1754-1766 , and the 2001 article " Properties of weak contrast PP reflection/transmission coefficients for weakly anisotropic elastic media" by P ⁇ en ⁇ ik, I. and Martins, J.L., published in Studia Geophysica et Geodaetica, No. 45, pp.
- ⁇ ⁇ x a ⁇ 11 ⁇ ⁇ 2 2 ⁇ 2
- ⁇ y a ⁇ 22 ⁇ ⁇ 2 2 ⁇ 2
- ⁇ y a ⁇ 23 + 2 a ⁇ 44 ⁇ ⁇ 2 ⁇ 2
- ⁇ y a ⁇ 25 + 2 a ⁇ 46 ⁇ 2
- ⁇ 16 a ⁇ 16 ⁇ 2
- ⁇ 24 a ⁇
- the phase of the 2 nd FC varies with the incidence angle, whereas the phase of the 4 th FC does not.
- B S 2 / C S 2 B C 2 / C C 2
- the 2 nd FC loses its incidence angle dependency too.
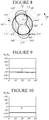
- Figures 5 and 6 represent equation (16) in nuances of gray with ⁇ (1) and ⁇ (2) along the axes.
- Figure 5 is a linear scale and Figure 6 a logarithmic scale making particular solutions more visible, such as when fractures on top and bottom layers are aligned and when they are orthogonal.
- Figure 7 is a flowchart of a method 700 for characterizing fracture orientations in orthorhombic adjacent layers according to an embodiment.
- Method 700 includes obtaining seismic data with azimuthal coverage enabling calculating FCs at 710.
- seismic data may be azimuthal angle stacks or any other processed land or marine data allowing the computation of FCs.
- Figure 8 illustrates amplitude-versus-azimuth data usable to calculate FCs for incidence angles 0°, 10°, 20°, 30° and 40°; that is, curves 800, 810, 820, 830 and 840, respectively.
- the circles mark amplitude magnitudes of 0.1, 0.2, etc. and data azimuth ⁇ (e.g., between source and receiver) varies counterclockwise as marked on the circumference.
- FIGs 9 and 10 are graphs illustrating phases of the 2 nd FC (the continuous line) and of the 4 th FC as functions of the incidence angle.
- the fractures in the two orthorhombic media for which phases of the FCs are shown in Figure 9 are not aligned, while the fractures in the two orthorhombic media for which phases of the FCs are shown in Figure 10 are aligned.
- the phase of the 2 nd FC no longer depends on the incident angle and it is equal to the phase of the 4 th FC and the fracture orientation in both layers.
- the fracture orientations in the orthorhombic adjacent layers are characterized based on the phases of the 2 nd and 4 th FCs. This characterization can be approached from different points of view.
- phase of an FC is the phase of the sum of two signals whose respective phases are the symmetry axes of the two orthorhombic layers.
- Figure 11 illustrates these signals as functions of azimuth ⁇ .
- the intersections of S 2 1 , S 2 and S 2 2 with the x axis yield ⁇ (1) , ⁇ 2 and ⁇ (2) , respectively.
- Figure 12 illustrates S 4 1 , S 4 and S 4 2 as functions of azimuth ⁇ .
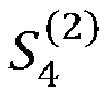
- the intersections of S 4 1 , S 4 and S 4 2 with the x axis yield ⁇ (1) , ⁇ 4 and ⁇ (2) , respectively.
- FC phases are graphically illustrated in Figure 13 .
- the phase of the Fourier coefficients is geometrically related to the symmetry axes, scaled by the periodicity (or order) of the Fourier coefficients and the anisotropy of each orthorhombic medium.
- n ⁇ (1) and n ⁇ (2) are sin(n ⁇ (1) ), cos(n ⁇ (1) ), sin(n ⁇ (2) ) and cos(n ⁇ (2) ), respectively. Then, on the y axis are drawn points corresponding to x (1) sin(n ⁇ (1) ) and to x (2) sin(n ⁇ (2) ) and on the x axis are drawn points corresponding to x (1) cos(n ⁇ (1) ) and to x (2) cos(n ⁇ (2) ).
- Point A of coordinates ( x ( 2 )cos(n ⁇ (2) ), x (2) sin(n ⁇ (2) )) is at angle n ⁇ (2) and point B of coordinates ( x (1) cos(n ⁇ (1) ), x (1) sin(n ⁇ (1) )) is at angle n ⁇ (1) .
- the difference between the projection of point A on the y axis and the projection of point B on the y axis is equal to segment CA and represents the numerator in formula (23).
- segment B 1 C -BC and represents the denominator in formula (23).
- angle AB 1 C is n ⁇ n its tan function being equal to formula (23).
- the phases of the FCs are weighted averages of the symmetry axes angles, weighted by the anisotropy in each layer.
- phase of the 2 nd FC does not depend on the incident angle.
- phase of the 4 th FC is only sensitive to the anisotropy (anellipticity) in the far angles
- Exemplary computing device 1400 suitable for performing the activities described in the exemplary embodiments may include a server 1401.
- Server 1401 may include a central processor (CPU) 1402 coupled to a random-access memory (RAM) 1404 and to a read-only memory (ROM) 1406.
- ROM 1406 may also be other types of storage media to store programs, such as programmable ROM (PROM), erasable PROM (EPROM), etc.
- Processor 1402 may communicate with other internal and external components through input/output (I/O) circuitry 1408 and bussing 1410 to provide control signals and the like.
- I/O input/output
- Processor 1402 carries out a variety of functions as are known in the art, as dictated by software and/or firmware instructions.
- Server 1401 may also include one or more data storage devices, including hard drives 1412, CD-ROM drives 1414 and other hardware capable of reading and/or storing information, such as DVD, etc.
- software for carrying out the above-discussed steps may be stored and distributed on a CD-ROM or DVD 1416, a USB storage device 1418 or other form of media capable of portably storing information. These storage media may be inserted into, and read by, devices such as CD-ROM drive 1414, disk drive 1412, etc.
- Server 1401 may be coupled to a display 1420, which may be any type of known display or presentation screen, such as LCD, plasma display, cathode ray tube (CRT), etc.
- a user input interface 1422 is provided, including one or more user interface mechanisms such as a mouse, keyboard, microphone, touchpad, touch screen, voice-recognition system, etc.
- Server 1401 may be coupled to other devices, such as sources, detectors, etc.
- the server may be part of a larger network configuration as in a global area network (GAN) such as the internet 1428, which allows ultimate connection to various computing devices.
- GAN global area network
- I/O circuitry 1408 is configured to obtain seismic data with azimuthal coverage enabling calculating FCs of reflectivity at an interface between the orthorhombic adjacent layers, and processor 1402 is configured to calculate phases of 2 nd and 4 th azimuthal FCs for different incidence angles and to characterize the fracture orientations in the orthorhombic adjacent layers based on the phases of 2 nd and 4 th azimuthal FCs, for a drilling and/or fracking plan.
- RAM 1404 stores executable codes that, when executed, make the I/O circuitry 1408 obtain seismic data with azimuthal coverage enabling calculation of FCs of reflectivity at an interface between the orthorhombic adjacent layers, and processor 1402 to calculate phases of the 2 nd and 4 th azimuthal FCs for different incidence angles and to characterize the fracture orientations in the orthorhombic adjacent layers based on the phases of the 2 nd and 4 th azimuthal FCs, for a drilling and/or fracking plan.
- the disclosed embodiments provide methods and apparatuses for characterizing fracture orientations in orthorhombic adjacent layers based on azimuthal Fourier coefficients of reflectivity at an interface between the orthorhombic adjacent layers. It should be understood that this description is not intended to limit the invention. On the contrary, the exemplary embodiments are intended to cover alternatives, modifications and equivalents, which are included in the spirit and scope of the invention as defined by the appended claims. Further, in the detailed description of the exemplary embodiments, numerous specific details are set forth in order to provide a comprehensive understanding of the claimed invention. However, one skilled in the art would understand that various embodiments may be practiced without such specific details.
Landscapes
- Engineering & Computer Science (AREA)
- Physics & Mathematics (AREA)
- General Physics & Mathematics (AREA)
- Remote Sensing (AREA)
- Life Sciences & Earth Sciences (AREA)
- Mathematical Physics (AREA)
- Theoretical Computer Science (AREA)
- Mathematical Optimization (AREA)
- Pure & Applied Mathematics (AREA)
- Data Mining & Analysis (AREA)
- Computational Mathematics (AREA)
- Mathematical Analysis (AREA)
- Geology (AREA)
- Acoustics & Sound (AREA)
- Environmental & Geological Engineering (AREA)
- General Life Sciences & Earth Sciences (AREA)
- Geophysics (AREA)
- General Engineering & Computer Science (AREA)
- Software Systems (AREA)
- Databases & Information Systems (AREA)
- Algebra (AREA)
- Geophysics And Detection Of Objects (AREA)
- Prostheses (AREA)
Abstract
Description
- Embodiments of the subject matter disclosed herein generally relate to methods and systems for seismic exploration, and, in particular, to methods and systems for investigating fracture orientations in orthorhombic media/layers.
- Seismic exploration is frequently used in oil and gas exploration and recovery for locating hydrocarbon reservoirs and designing exploitation (drilling) plans. Analysis of seismic data obtained during seismic surveys provides valuable information about structure and physical parameters of subterranean rock formations. In a seismic survey, a source generates a seismic signal that propagates into the explored formation and is, at least partially, reflected at interfaces between a formation's layer having different acoustic impedances. The source typically generates compressional seismic signals, that is, pressure variations along the propagation direction (i.e., P-waves), but both P-waves and S-waves (i.e., shear/secondary waves) may be generated at layer interfaces. Seismic detectors record seismic data which may represent both P- and S-waves.
- The recorded seismic data includes a convolution of the source wavelet (i.e., the signal's signature) and the formation's response function. Seismic data processing aims to extract the formation's response function, and various parameters related to the explored formation. One way of expressing the response function is by using reflectivity, R, which for detected P-waves is Rpp. Reflectivity depends on the incidence angle, θ, (which is defined in a vertical plane) and the azimuth angle, Φ (which is defined in a horizontal plane). Reflectivity characterizes subterranean properties and can serve as input to other inversion algorithms. For example, reflectivity can provide useful information regarding the anisotropy parameters of the subterranean formation, such as subsurface fractures. These anisotropy parameters may reveal shale plays, tight gas sands and coal bed methane, as well as carbonates in naturally fractured reservoirs. These characteristics and parameters are used to design and manage underground transportation systems, foundations of major structures, cavities for storage of liquids, gases or solids, etc.
- In oil and gas exploration, this kind of information is used for determining optimal locations and orientations of wells (which may be vertical, inclined or deviated, and horizontal), to minimize wellbore instability and formation break-out. This information may also be used for stimulating the production of hydrocarbons by applying hydraulic pressure on the formation from the wellbore. Also, in geothermal exploration, such information is used to better determine location/orientation while tapping into geothermal resources. Another area where such information is usedful is in carbon capture and storage. The data inversions yield estimates of the elastic stiffnesses (velocities and anisotropic parameters) that can be used to predict lithology, porosity and the fluid content of the subsurface, as well as intensity and orientation of fractures in subterranean formations. This kind of information is important when designing drilling paths, particularly when fracking is used.
- Anisotropy in orthorhombic layers (or media) is frequently due to vertical fractures parallel to one direction and, thus, perpendicular to a symmetry axis and horizontal fine layering as illustrated in
Figure 1 . Adjacent layers (e.g., 110 and 120) generally have different symmetry axes, e.g., Φ(1) and Φ(2) drawn on respective layer's top surface inFigure 1 . - It is desirable to determine the fractures' orientation from seismic data in order to better design drilling paths and/or determine locations of fracking stages.
- Methods and devices according to various embodiments determine fracture orientation from seismic data using the phases of azimuthal Fourier coefficients (FCs).
- According to an embodiment, there is a seismic exploration method characterizing fracture orientations in orthorhombic adjacent layers. The method includes obtaining seismic data with azimuthal coverage enabling calculating azimuthal FCs of reflectivity at an interface between the orthorhombic adjacent layers, calculating phases of 2nd and 4th azimuthal FCs for different incidence angles, and characterizing the fracture orientations in the orthorhombic adjacent layers based on the phases of 2nd and 4th azimuthal FCs, for a drilling and/or fracking plan.
- According to another embodiment, there is a seismic data processing apparatus including an interface and a data processing unit connected to the interface. The interface is configured to obtain seismic data with azimuthal coverage enabling calculating azimuthal FCs of reflectivity at an interface between the orthorhombic adjacent layers. The data processing unit is configured to calculate phases of 2nd and 4th azimuthal FCs for different incidence angles, and to characterize the fracture orientations in the orthorhombic adjacent layers based on the phases of 2nd and 4th azimuthal FCs, for a drilling and/or fracking plan.
- According to yet another embodiment, there is a computer-readable recording medium non-transitorily storing executable codes which, when executed by a computer, make the computer perform a seismic exploration method. The method includes obtaining seismic data with azimuthal coverage enabling calculating azimuthal FCs of reflectivity at an interface between the orthorhombic adjacent layers, calculating phases of 2nd and 4th azimuthal FCs for different incidence angles, and characterizing the fracture orientations in the orthorhombic adjacent layers based on the phases of 2nd and 4th azimuthal FCs, for a drilling and/or fracking plan.
- The accompanying drawings, which are incorporated in and constitute a part of the specification, illustrate one or more embodiments and, together with the description, explain these embodiments. In the drawings:
-
Figure 1 shows two adjacent orthorhombic layers with different symmetry axes of the vertical fractures; -
Figure 2 is a graph of reflectivity at an interface between two orthorhombic layers with fractures having different symmetry axes as a function of azimuth in a horizontal plane; -
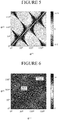
Figure 3 illustrates Fourier components of reflectivity for a fixed incidence angle; -
Figure 4 illustrates the steps in relating phases of FCs to fracture orientations; -
Figures 5 and 6 are graphical solutions for fracture orientations; -
Figure 7 is a flowchart of a method according to an embodiment; -
Figure 8 illustrates amplitude-versus-azimuth data usable to calculate FCs; -
Figure 9 is a graph illustrating phases of the 2nd FC and of the 4th FC as a function of the incidence angle for two orthorhombic layers not having their respective fractures aligned; -
Figure 10 is a graph illustrating phases of the 2nd FC and of the 4th FC as a function of the incidence angle for two orthorhombic layers with their respective fractures aligned; -
Figure 11 illustrates harmonic addition for the phase of the 2nd FC; -
Figure 12 illustrates harmonic addition for the phase of the 4th FC; -
Figure 13 is a graphic representation of phases; and -
Figure 14 is a schematic diagram of a computing device according to an embodiment. - The following description of the exemplary embodiments refers to the accompanying drawings. The same reference numbers in different drawings identify the same or similar elements. The following detailed description does not limit the invention. Reference throughout the specification to "one embodiment" or "an embodiment" means that a particular feature, structure or characteristic described in connection with an embodiment is included in at least one embodiment of the subject matter disclosed. Thus, the appearance of the phrases "in one embodiment" or "in an embodiment" in various places is not necessarily referring to the same embodiment. Further, the particular features, structures or characteristics may be combined in any suitable manner in one or more embodiments.
- Embodiments described hereinafter obtain fracture orientation characterization using seismic data. More specifically, this approach uses the phase of azimuthal FCs to characterize a change of fracture orientation between two adjacent orthorhombic layers (each with substantial parallel vertical fractures embedded in a transverse isotropic media, but their parallel fractures having different symmetry axes).
- Considering two adjacent orthorhombic layers as illustrated in
Figure 1 , the reflectivity Rpp varies with azimuth φ at this interface as illustrated inFigure 2 , exhibiting peaks and troughs. Reflectivity may be decomposed in a Fourier series

Figure 3 illustrates Fourier components of reflectivity R 0, R 2 and R 4 for a fixed value of the incident angle, that is: R 0 = r 0; R 2(Φ) = r2 cos 2(Φ - Φ2); and
- Evaluating anisotropy has lately been included in most workflows for seismic processing and reservoir characterization. The gain over workflows considering media isotropic is undeniable but the increased complexity associated with taking into consideration anisotropy remains a challenge. Lowering the symmetry of the anisotropy from transverse isotropic (TI) to orthorhombic to monoclinic implies increasing the number of parameters. Therefore, simplifying the problem by reducing the dimensionality of the parameterization is important.
- A powerful tool to simplify the complexity of anisotropic reflection coefficients are azimuthal Fourier coefficients, FC, (described, e.g., in "Amplitude variations with azimuths (AVAZ) inversion based on Linearized inversion of common azimuthal sections" by L. Ikelle, included in "Seismic Anisotropy" edited by E. Fjær et al., SEG 1996, pp. 601-644; the 2001 article "Azimuth-dependent AVO in reservoirs containing non-orthogonal fracture sets" by Sayers, C. and Dean, S. published in Geophysical Prospecting, No. 49, pp. 100-106; and the article "Azimuthal Fourier Coefficients" by Downton, J., Roure, B. and Hunt, L. published in CSEG Reporter of December 2011, pp. 22-36, all of which are incorporated herewith by reference in their entirety). In the 2015 article "Interpreting azimuthal FCs for anisotropic and fracture parameters" by Downton, J. and Roure, B. published in Interpretation of August 2015, pp.ST9-ST27 (incorporated herewith by reference in its entirety), it is shown that azimuthal FCs allow decoupling anisotropic reflection coefficients into sub-problems associated with different types of anisotropy, hence reducing cross-talk between parameters.
- Sayers and Dean' article (already specified) interprets the phase of FC for monoclinic anisotropy in terms of linear slip theory thereby enabling to relate changes of phase to differences of compliance ratio between the various fracture sets. The issue is relating phases of FCs to fracture orientations and vice versa.
-
Figure 4 illustrates the steps in establishing the theoretical basis of relating phases of FCs to fracture orientations. At 410, the orthorhombic stiffness matrices are defined for both top and bottom layers. As shown in the 1997 article "Orthorhombic media: Modeling elastic wave behavior in a vertically fractured earth" by Schoenberg, M. and Helbig, K., published in Geophysics, Vol. 62, No. 6, pp. 1954-1974 (which is incorporated herewith by reference in its entirety), a density-normalized stiffness matrix for a single set of parallel vertical fractures perpendicular to the x-axis in a background transverse isotropic (TI) media is given by
- Initially, the horizontal symmetry axis is chosen along the x-axis. In order to consider the actual orientation of the symmetry axis for each layer (i.e., Φ(1) for the top and Φ(2) for the bottom layer as illustrated in
Figure 1 ), each density-normalized stiffness matrix is rotated relative to its symmetry axis using a Bond transformation atstep 420. Bond transformation, which is described in the 1990 article "Velocity anisotropy terminology for geophysicists" by Winterstein, D. F., published in Geophysics, Vol. 55, No. 8, pp. 1070-1088 (incorporated herewith by reference in its entirety), is a counter-clockwise rotation about the z-axis yielding 6x6 matrices a' for each layer with the following non-zero elements (in the following formula Φ is Φ(1) or Φ(2) as appropriate):
- Then, at 430, the weak anisotropy parameters and their contrasts for general anisotropy are calculated in the manner introduced in the 1998 article "Polarization, phase velocity, and NMO velocity of qP-waves in arbitrary weakly anisotropic media" by Pšenčik, I. and Gajewski, D., published in Geophysics, Vol. 63, No. 5, pp. 1754-1766, and the 2001 article "Properties of weak contrast PP reflection/transmission coefficients for weakly anisotropic elastic media" by Pšenčik, I. and Martins, J.L., published in Studia Geophysica et Geodaetica, No. 45, pp. 176-199 (which are incorporated herewith by reference in their entirety). The weak anisotropy parameters for both layers are:


- Further, at 440, FCs are calculated using the weak anisotropy contrasts as follows (see formulas in the 2015 article by Downton):


- At 450, the phases of the 2nd and the 4th FCs are expressed as function or the symmetry axes angles φ(1) and φ(2). By replacing formula (9) into (10), the following equations are obtained for the phases of the 2nd and the 4th FCs:

- The phase of the 2nd FC varies with the incidence angle, whereas the phase of the 4th FC does not. In the special case where B S2/C S2=B C2/C C2, the 2nd FC loses its incidence angle dependency too. If formulas (5) to (11) are combined, the phases of the 2nd and the 4th FCs can be expressed directly as functions of the orthorhombic media parameters and their horizontal symmetry axes angles φ(i):



- For orthorhombic media, X (i), Y (i) and Z (i) are typically non-zero. The phase of the 2nd FC does not depend on the incidence angle if equations (16) using notations (15) are satisfied:


- The symmetry axes φ(1) and φ(2) that solve equation (16) are sought for known values of X (i), Y (i) and Z (i) (i = 1,2).
Figures 5 and 6 represent equation (16) in nuances of gray with φ(1) and φ(2) along the axes.Figure 5 is a linear scale andFigure 6 a logarithmic scale making particular solutions more visible, such as when fractures on top and bottom layers are aligned and when they are orthogonal. - Thus, if the fractures on the top and the bottom layers are aligned, that is, φ(1) = φ(2) then

- If the fractures on the top layer are orthogonal on the ones in the bottom layer, i.e., φ(1) = φ(2) + 90°, then

- Both in the case of aligned and in the case of orthogonal fractures, equation (11) becomes

- If C S2 = C C2 = 0, then the phase of the 2nd FC no longer depends on the incidence angle, that is:

- If, besides C S2 = C C2 = 0, the fractures are aligned or orthogonal, then φ 2 = φ 4 = φ(2).
- In view of these formulas,
Figure 7 is a flowchart of amethod 700 for characterizing fracture orientations in orthorhombic adjacent layers according to an embodiment.Method 700 includes obtaining seismic data with azimuthal coverage enabling calculating FCs at 710. For example, seismic data may be azimuthal angle stacks or any other processed land or marine data allowing the computation of FCs.Figure 8 illustrates amplitude-versus-azimuth data usable to calculate FCs forincidence angles 0°, 10°, 20°, 30° and 40°; that is, curves 800, 810, 820, 830 and 840, respectively. InFigure 8 , the circles mark amplitude magnitudes of 0.1, 0.2, etc. and data azimuth φ (e.g., between source and receiver) varies counterclockwise as marked on the circumference. - Thus, the FCs and their phases are calculated at 720.
Figures 9 and 10 are graphs illustrating phases of the 2nd FC (the continuous line) and of the 4th FC as functions of the incidence angle. The fractures in the two orthorhombic media for which phases of the FCs are shown inFigure 9 are not aligned, while the fractures in the two orthorhombic media for which phases of the FCs are shown inFigure 10 are aligned. Thus, when the fractures are aligned, the phase of the 2nd FC no longer depends on the incident angle and it is equal to the phase of the 4th FC and the fracture orientation in both layers. - Returning now to
Figure 7 , at 730, the fracture orientations in the orthorhombic adjacent layers are characterized based on the phases of the 2nd and 4th FCs. This characterization can be approached from different points of view. - One way to approach this characterization is by using a signal interpretation of the phases. Based on the harmonic addition theorem, the phase of an FC is the phase of the sum of two signals whose respective phases are the symmetry axes of the two orthorhombic layers. The phase of the 2nd FC is the phase of a signal S 2 that is a sum of signals


-
Figure 11 illustrates these signals as functions of azimuth Φ. The intersections of

- Similarly, the phase of the 4th FC is the phase of a signal S 4 that is a sum of signals


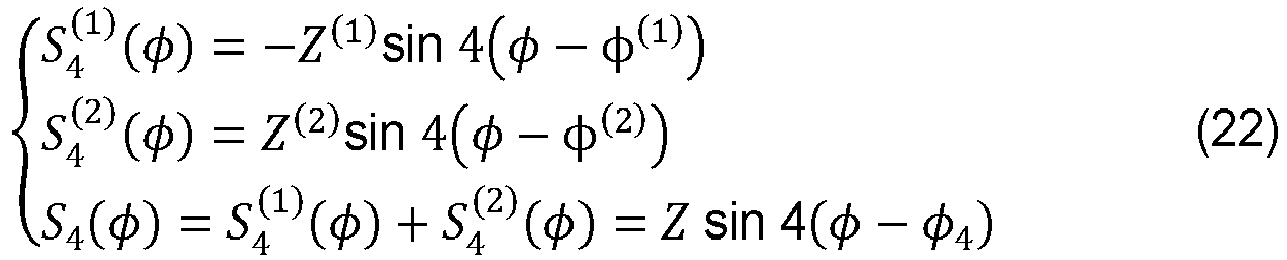
Z 2 = Z (1)2 + Z (2)2 - 2Z (1) Z (2) cos 4 (φ(2) - φ(1)). -
Figure 12 illustrates


- Another way to relate FC phases to symmetry axes is graphically illustrated in
Figure 13 . The phase of the Fourier coefficients is geometrically related to the symmetry axes, scaled by the periodicity (or order) of the Fourier coefficients and the anisotropy of each orthorhombic medium. Formulas (12) and (13) can be generically re-written as
- If the symmetry axes angles and the phases of FCs are small enough (e.g., less than 30° not valid in many cases), then a first order Taylor approximation of (23) yields:


- Thus, in this case, the phases of the FCs are weighted averages of the symmetry axes angles, weighted by the anisotropy in each layer.
- In the case one layer is isotropic and the other is orthorhombic, the incidence angle dependency of the phase of the 2nd FC is controlled by the ratios BS2/CS2 and BC2/CC2:

- If one of the top or bottom layer is isotropic and the other orthorhombic, then BS2/CS2=BC2/CC2=X(2)/Y(2) and the phase of the 2nd FC does not depend on the incident angle, the phases of the 2nd and 4th FCs being equal to the orthorhombic symmetry axis angle.
- If there are the same properties in both layers except for the fracture orientations, then the phase of the 2nd FC does not depend on the incident angle. Using the properties of the inverse trigonometric functions, the phases are the average of the symmetry axes shifted by a constant:

- While the phase of the 4th FC is only sensitive to the anisotropy (anellipticity) in the far angles, the phase of the 2nd FC is sensitive to anisotropy both in the mid and far angles, giving rise to its incident angle dependency. If there is no anisotropy in the far angles (i.e., Y(i)=0) or if the anisotropy is the same in the mid and far angles (i.e. X(i)=Y(i)), then the angle dependency of the phase of the 2nd FC disappears:

- If the fracture orientations are 45° apart, then the phase of the 2nd FC remains dependent on incidence angle, but the phase of the 4th FC is equal to the symmetry axes (which are the same modulo 45°):

- The above-discussed methods may be implemented in a
computing device 1400 as illustrated inFigure 14 . Hardware, firmware, software or a combination thereof may be used to perform the various steps and operations described herein. -
Exemplary computing device 1400 suitable for performing the activities described in the exemplary embodiments may include aserver 1401.Server 1401 may include a central processor (CPU) 1402 coupled to a random-access memory (RAM) 1404 and to a read-only memory (ROM) 1406. ROM 1406 may also be other types of storage media to store programs, such as programmable ROM (PROM), erasable PROM (EPROM), etc.Processor 1402 may communicate with other internal and external components through input/output (I/O)circuitry 1408 and bussing 1410 to provide control signals and the like.Processor 1402 carries out a variety of functions as are known in the art, as dictated by software and/or firmware instructions. -
Server 1401 may also include one or more data storage devices, includinghard drives 1412, CD-ROM drives 1414 and other hardware capable of reading and/or storing information, such as DVD, etc. In one embodiment, software for carrying out the above-discussed steps may be stored and distributed on a CD-ROM orDVD 1416, aUSB storage device 1418 or other form of media capable of portably storing information. These storage media may be inserted into, and read by, devices such as CD-ROM drive 1414,disk drive 1412, etc.Server 1401 may be coupled to adisplay 1420, which may be any type of known display or presentation screen, such as LCD, plasma display, cathode ray tube (CRT), etc. Auser input interface 1422 is provided, including one or more user interface mechanisms such as a mouse, keyboard, microphone, touchpad, touch screen, voice-recognition system, etc. -
Server 1401 may be coupled to other devices, such as sources, detectors, etc. The server may be part of a larger network configuration as in a global area network (GAN) such as theinternet 1428, which allows ultimate connection to various computing devices. - According to one embodiment, I/
O circuitry 1408 is configured to obtain seismic data with azimuthal coverage enabling calculating FCs of reflectivity at an interface between the orthorhombic adjacent layers, andprocessor 1402 is configured to calculate phases of 2nd and 4th azimuthal FCs for different incidence angles and to characterize the fracture orientations in the orthorhombic adjacent layers based on the phases of 2nd and 4th azimuthal FCs, for a drilling and/or fracking plan. - In yet another embodiment,
RAM 1404 stores executable codes that, when executed, make the I/O circuitry 1408 obtain seismic data with azimuthal coverage enabling calculation of FCs of reflectivity at an interface between the orthorhombic adjacent layers, andprocessor 1402 to calculate phases of the 2nd and 4th azimuthal FCs for different incidence angles and to characterize the fracture orientations in the orthorhombic adjacent layers based on the phases of the 2nd and 4th azimuthal FCs, for a drilling and/or fracking plan. - The disclosed embodiments provide methods and apparatuses for characterizing fracture orientations in orthorhombic adjacent layers based on azimuthal Fourier coefficients of reflectivity at an interface between the orthorhombic adjacent layers. It should be understood that this description is not intended to limit the invention. On the contrary, the exemplary embodiments are intended to cover alternatives, modifications and equivalents, which are included in the spirit and scope of the invention as defined by the appended claims. Further, in the detailed description of the exemplary embodiments, numerous specific details are set forth in order to provide a comprehensive understanding of the claimed invention. However, one skilled in the art would understand that various embodiments may be practiced without such specific details.
- Although the features and elements of the present embodiments are described in the embodiments in particular combinations, each feature or element can be used alone without the other features and elements of the embodiments or in various combinations with or without other features and elements disclosed herein. The methods or flowcharts provided in the present application may be implemented in a computer program, software or firmware tangibly embodied in a computer-readable storage medium for execution by a general-purpose computer or a processor.
- This written description uses examples of the subject matter disclosed to enable any person skilled in the art to practice the same, including making and using any devices or systems and performing any incorporated methods. The patentable scope of the subject matter is defined by the claims, and may include other examples that occur to those skilled in the art. Such other examples are intended to be within the scope of the claims.
Claims (15)
- A seismic exploration method (700) characterizing fracture orientations in orthorhombic adjacent layers, the method comprising:obtaining (710) seismic data with azimuthal coverage enabling calculating azimuthal Fourier Coefficients, FCs, of reflectivity at an interface between the orthorhombic adjacent layers;calculating (720) phases of 2nd and 4th azimuthal FCs for different incidence angles; andcharacterizing (730) the fracture orientations in the orthorhombic adjacent layers based on the phases of 2nd and 4th azimuthal FCs, for a drilling and/or fracking plan.
- The method of claim 1, wherein the phases of 2nd and 4th azimuthal FCs indicate whether the fracture orientations in the orthorhombic adjacent layers are aligned.
- The method of claim 1, wherein the phases of 2nd and 4th azimuthal FCs indicate whether the fracture orientations in the orthorhombic adjacent layers are orthogonal on each other.
- The method of claim 1, wherein azimuth angle dependences of the phases of 2nd and 4th azimuthal FCs are used to infer the fracture orientations in the orthorhombic adjacent layers.
- The method of claim 1, wherein if one of the orthorhombic adjacent layers is an isotropic layer, the phases of 2nd and 4th azimuthal FCs are substantially equal, independent of the incidence angle and substantially equal to an angle of a symmetry axis of other among the orthorhombic adjacent layers.
- The method of claim 1, wherein if the orthorhombic adjacent layers have same properties except the fracture orientations, then the phases of the azimuthal FCs are averages of the fracture orientations shifted by respective constants.
- The method of claim 1, wherein, if the fracture orientations are 45° apart, the phase of the 2nd FC remains dependent on incidence angle but the phase of the 4th FC is equal to the symmetry axes which are same if expressed modulo 45°.
- The method of claim 1, wherein the seismic data is made of azimuthal angle stacks for at least two incident angles.
- A seismic data processing apparatus (1400), comprising:an interface (1408) configured to obtain seismic data with azimuthal coverage enabling calculating azimuthal Fourier Coefficients, FCs, of reflectivity at an interface between the orthorhombic adjacent layers; anda data processing unit (1402) connected to the interface and configuredto calculate phases of 2nd and 4th azimuthal FCs for different incidence angles; andto characterize the fracture orientations in the orthorhombic adjacent layers based on the phases of 2nd and 4th azimuthal FCs, for a drilling and/or fracking plan.
- The seismic data processing apparatus of claim 9, wherein the phases of 2nd and 4th azimuthal FCs indicate whether the fracture orientations in the orthorhombic adjacent layers are aligned.
- The seismic data processing apparatus of claim 9, wherein the phases of 2nd and 4th azimuthal FCs indicate whether the fracture orientations in the orthorhombic adjacent layers are orthogonal on each other.
- The seismic data processing apparatus of claim 9, wherein azimuth angle dependence of the phases of 2nd and/or 4th azimuthal FCs are used to infer the fracture orientations in the orthorhombic adjacent layers.
- The seismic data processing apparatus of claim 9, wherein if one of the orthorhombic adjacent layers is an isotropic layer, the phases of 2nd and 4th azimuthal FCs are substantially equal, independent of the incidence angle and substantially equal to an angle of a symmetry axis of other among the orthorhombic adjacent layers.
- The seismic data processing apparatus of claim 9, wherein if the orthorhombic adjacent layers have same properties except the fracture orientations, then the phases of the 2nd and 4th azimuthal FCs are averages of the fracture orientations shifted by respective constants.
- The seismic data processing apparatus of claim 9, wherein the seismic data is made of azimuthal angle stacks for at least two incident angles.
Applications Claiming Priority (1)
| Application Number | Priority Date | Filing Date | Title |
|---|---|---|---|
| US202063025299P | 2020-05-15 | 2020-05-15 |
Publications (1)
| Publication Number | Publication Date |
|---|---|
| EP3910381A1 true EP3910381A1 (en) | 2021-11-17 |
Family
ID=75801525
Family Applications (1)
| Application Number | Title | Priority Date | Filing Date |
|---|---|---|---|
| EP21305495.0A Withdrawn EP3910381A1 (en) | 2020-05-15 | 2021-04-15 | Characterizing fracture orientations in orthorhombic adjacent layers using the phase of azimuthal fourier coefficients |
Country Status (4)
| Country | Link |
|---|---|
| US (1) | US11360227B2 (en) |
| EP (1) | EP3910381A1 (en) |
| CA (1) | CA3116677A1 (en) |
| MX (1) | MX2021005514A (en) |
Families Citing this family (2)
| Publication number | Priority date | Publication date | Assignee | Title |
|---|---|---|---|---|
| CN115184996B (en) * | 2022-06-23 | 2023-07-04 | 吉林大学 | Crack prediction method based on seismic reflection amplitude azimuth anisotropy difference |
| CN119001844B (en) * | 2023-05-18 | 2025-09-09 | 中国石油天然气集团有限公司 | Crack prediction method and device |
Citations (2)
| Publication number | Priority date | Publication date | Assignee | Title |
|---|---|---|---|---|
| EP3182165A1 (en) * | 2015-12-04 | 2017-06-21 | CGG Services SAS | Method and apparatus for analyzing fractures using avoaz inversion |
| US10379243B2 (en) * | 2014-03-28 | 2019-08-13 | Cgg Services Sas | Method and apparatus for characterizing azimuthal anisotropy using statistical moments |
Family Cites Families (1)
| Publication number | Priority date | Publication date | Assignee | Title |
|---|---|---|---|---|
| US11243318B2 (en) * | 2017-01-13 | 2022-02-08 | Cgg Services Sas | Method and apparatus for unambiguously estimating seismic anisotropy parameters |
-
2020
- 2020-07-13 US US16/927,364 patent/US11360227B2/en active Active
-
2021
- 2021-04-15 EP EP21305495.0A patent/EP3910381A1/en not_active Withdrawn
- 2021-04-30 CA CA3116677A patent/CA3116677A1/en active Pending
- 2021-05-11 MX MX2021005514A patent/MX2021005514A/en unknown
Patent Citations (2)
| Publication number | Priority date | Publication date | Assignee | Title |
|---|---|---|---|---|
| US10379243B2 (en) * | 2014-03-28 | 2019-08-13 | Cgg Services Sas | Method and apparatus for characterizing azimuthal anisotropy using statistical moments |
| EP3182165A1 (en) * | 2015-12-04 | 2017-06-21 | CGG Services SAS | Method and apparatus for analyzing fractures using avoaz inversion |
Non-Patent Citations (13)
| Title |
|---|
| DOWNTON, J.ROURE, B.: "Interpreting azimuthal FCs for anisotropic and fracture parameters", INTERPRETATION, August 2015 (2015-08-01), pages ST9 - ST27, XP055367666, DOI: 10.1190/INT-2014-0235.1 |
| DOWNTON, J.ROURE, B.HUNT, L.: "Azimuthal Fourier Coefficients", CSEG REPORTER, December 2011 (2011-12-01), pages 22 - 36 |
| JON DOWNTON ET AL: "Azimuthal Fourier coefficients: a simple method to estimate fracture parameters", GEOCONVENTION 2012: VISION, 14 May 2012 (2012-05-14), Calgary, Canada, pages 1 - 9, XP055205551 * |
| JONATHAN E. DOWNTON ET AL: "Interpreting azimuthal Fourier coefficients for anisotropic and fracture parameters", INTERPRETATION, vol. 3, no. 3, 1 August 2015 (2015-08-01), US, pages ST9 - ST27, XP055367666, ISSN: 2324-8858, DOI: 10.1190/INT-2014-0235.1 * |
| L. IKELLE ET AL.: "Seismic Anisotropy", 1996, SEG, article "Amplitude variations with azimuths (AVAZ) inversion based on Linearized inversion of common azimuthal sections", pages: 601 - 644 |
| PSENCIK, I.GAJEWSKI, D.: "Polarization, phase velocity, and NMO velocity of qP-waves in arbitrary weakly anisotropic media", GEOPHYSICS, vol. 63, no. 5, 1998, pages 1754 - 1766 |
| PSENCIK, I.MARTINS, J.L.: "Properties of weak contrast PP reflection/transmission coefficients for weakly anisotropic elastic media", STUDIA GEOPHYSICA ET GEODAETICA, vol. 45, 2001, pages 176 - 199 |
| RÜGER A: "Variation of P-wave reflectivity with offset and azimuth in anisotropic media", GEOPHYSICS, SOCIETY OF EXPLORATION GEOPHYSICISTS, US, vol. 63, no. 3, 1 May 1998 (1998-05-01), pages 935 - 947, XP002326797, ISSN: 0016-8033, DOI: 10.1190/1.1444405 * |
| SAYERS C M ET AL: "Azimuth-dependent AVO in reservoirs containing non-orthogonal fracture sets", GEOPHYSICAL PROSPECTING, OXFORD, GB, vol. 49, no. 1, 1 January 2001 (2001-01-01), pages 100 - 106, XP002217617, DOI: 10.1046/J.1365-2478.2001.00236.X * |
| SAYERS, C.DEAN, S.: "Azimuth-dependent AVO in reservoirs containing non-orthogonal fracture sets", GEOPHYSICAL PROSPECTING, vol. 49, 2001, pages 100 - 106, XP002217617, DOI: 10.1046/j.1365-2478.2001.00236.x |
| SCHOENBERG, M.HELBIG, K.: "Orthorhombic media: Modeling elastic wave behavior in a vertically fractured earth", GEOPHYSICS, vol. 62, no. 6, 1997, pages 1954 - 1974, XP055591356, DOI: 10.1190/1.1444297 |
| WINTERSTEIN, D. F.: "Velocity anisotropy terminology for geophysicists", GEOPHYSICS, vol. 55, no. 8, 1990, pages 1070 - 1088 |
| XU SHIBO: "Seismic data processing in orthorhombic anisotropic media", 1 August 2018 (2018-08-01), XP093026730, Retrieved from the Internet <URL:https://ntnuopen.ntnu.no/ntnu-xmlui/bitstream/handle/11250/2564736/Shibo%20Xu_PhD.pdf?sequence=1> [retrieved on 20230224] * |
Also Published As
| Publication number | Publication date |
|---|---|
| MX2021005514A (en) | 2022-02-10 |
| US20210356614A1 (en) | 2021-11-18 |
| US11360227B2 (en) | 2022-06-14 |
| CA3116677A1 (en) | 2021-11-15 |
Similar Documents
| Publication | Publication Date | Title |
|---|---|---|
| Thomsen | Understanding seismic anisotropy in exploration and exploitation | |
| CN112904430B (en) | Computer-implemented method for nonlinear direct pre-stack seismic Poisson impedance inversion | |
| Dutta | Geopressure prediction using seismic data: Current status and the road ahead | |
| Rutherford et al. | Amplitude-versus-offset variations in gas sands | |
| US6901333B2 (en) | Method and device for the generation and application of anisotropic elastic parameters | |
| Russell | Introduction to seismic inversion methods | |
| US20220236439A1 (en) | Rock physics model for shale volume estimation in subsurface reservoirs | |
| Tsvankin | Anisotropic parameters and P-wave velocity for orthorhombic media | |
| EP3358376B1 (en) | Method and apparatus for unambiguously estimating seismic anisotropy parameters | |
| Castagna et al. | Offset-dependent reflectivity—Theory and practice of AVO analysis | |
| US6714873B2 (en) | System and method for estimating subsurface principal stresses from seismic reflection data | |
| CN109563736B (en) | Systems and methods for characterizing formations | |
| US7526385B2 (en) | Method, system and apparatus for determining rock strength using sonic logging | |
| US10436921B2 (en) | Multi-well anisotropy inversion | |
| CA2943589C (en) | Method and apparatus for characterizing azimuthal anisotropy using statistical moments | |
| US20140293745A1 (en) | Methods and systems for performing azimuthal simultaneous elastic inversion | |
| Li et al. | Anisotropic poroelasticity and AVAZ inversion for in situ stress estimate in fractured shale-gas reservoirs | |
| US11360227B2 (en) | Characterizing fracture orientations in orthorhombic adjacent layers using the phase of azimuthal fourier coefficients | |
| US8885440B2 (en) | Constructing velocity models near salt bodies | |
| Hu et al. | Estimation of rock physics properties via full waveform inversion of vertical seismic profile data recorded by accelerometer and fibre-optic sensors | |
| Arsalan et al. | Application of extended elastic impedance: A case study from Krishna-Godavari Basin, India | |
| Sinha et al. | Analyses of sonic data in an Indonesian well for formation damage, stresses, and bedding | |
| Heller et al. | Integrated workflows for drilling optimization and enhanced production | |
| Li et al. | Simultaneous seismic inversion for fluid indicator and brittleness index in the gas-bearing shale reservoir | |
| Durrani et al. | Azimuthal Prestack Seismic Anisotropic Inversion on a Deep and Tight Carbonate Reservoir From the North Potwar Basin of Pakistan |
Legal Events
| Date | Code | Title | Description |
|---|---|---|---|
| PUAI | Public reference made under article 153(3) epc to a published international application that has entered the european phase |
Free format text: ORIGINAL CODE: 0009012 |
|
| STAA | Information on the status of an ep patent application or granted ep patent |
Free format text: STATUS: THE APPLICATION HAS BEEN PUBLISHED |
|
| AK | Designated contracting states |
Kind code of ref document: A1 Designated state(s): AL AT BE BG CH CY CZ DE DK EE ES FI FR GB GR HR HU IE IS IT LI LT LU LV MC MK MT NL NO PL PT RO RS SE SI SK SM TR |
|
| B565 | Issuance of search results under rule 164(2) epc |
Effective date: 20210924 |
|
| STAA | Information on the status of an ep patent application or granted ep patent |
Free format text: STATUS: REQUEST FOR EXAMINATION WAS MADE |
|
| 17P | Request for examination filed |
Effective date: 20220516 |
|
| RBV | Designated contracting states (corrected) |
Designated state(s): AL AT BE BG CH CY CZ DE DK EE ES FI FR GB GR HR HU IE IS IT LI LT LU LV MC MK MT NL NO PL PT RO RS SE SI SK SM TR |
|
| GRAP | Despatch of communication of intention to grant a patent |
Free format text: ORIGINAL CODE: EPIDOSNIGR1 |
|
| STAA | Information on the status of an ep patent application or granted ep patent |
Free format text: STATUS: GRANT OF PATENT IS INTENDED |
|
| INTG | Intention to grant announced |
Effective date: 20230613 |
|
| P01 | Opt-out of the competence of the unified patent court (upc) registered |
Effective date: 20230530 |
|
| STAA | Information on the status of an ep patent application or granted ep patent |
Free format text: STATUS: THE APPLICATION IS DEEMED TO BE WITHDRAWN |
|
| 18D | Application deemed to be withdrawn |
Effective date: 20231024 |