EP3907675A1 - Computer implemented method for calculating a travel time distribution of a vehicle path for a driver assistance function of the vehicle, system, computer program and computer-readable data carrier - Google Patents
Computer implemented method for calculating a travel time distribution of a vehicle path for a driver assistance function of the vehicle, system, computer program and computer-readable data carrier Download PDFInfo
- Publication number
- EP3907675A1 EP3907675A1 EP20173176.7A EP20173176A EP3907675A1 EP 3907675 A1 EP3907675 A1 EP 3907675A1 EP 20173176 A EP20173176 A EP 20173176A EP 3907675 A1 EP3907675 A1 EP 3907675A1
- Authority
- EP
- European Patent Office
- Prior art keywords
- road segment
- vehicle
- travel time
- segment
- path
- Prior art date
- Legal status (The legal status is an assumption and is not a legal conclusion. Google has not performed a legal analysis and makes no representation as to the accuracy of the status listed.)
- Granted
Links
Images



Classifications
-
- G—PHYSICS
- G06—COMPUTING OR CALCULATING; COUNTING
- G06Q—INFORMATION AND COMMUNICATION TECHNOLOGY [ICT] SPECIALLY ADAPTED FOR ADMINISTRATIVE, COMMERCIAL, FINANCIAL, MANAGERIAL OR SUPERVISORY PURPOSES; SYSTEMS OR METHODS SPECIALLY ADAPTED FOR ADMINISTRATIVE, COMMERCIAL, FINANCIAL, MANAGERIAL OR SUPERVISORY PURPOSES, NOT OTHERWISE PROVIDED FOR
- G06Q10/00—Administration; Management
- G06Q10/04—Forecasting or optimisation specially adapted for administrative or management purposes, e.g. linear programming or "cutting stock problem"
Definitions
- the invention relates to a computer implemented method for calculating a travel time distribution of a vehicle path for a driver assistance function of the vehicle.
- the invention further relates to a system for calculating a travel time distribution of a vehicle path for a driver assistance function of the vehicle.
- the invention relates to a computer program and a computer-readable data carrier.
- Travel time reliability is one of the key indicators for the performance of transportation systems. It has been increasingly recognized as an important measure for assessing the operation efficiency of road facilities, evaluating alternative traffic management strategies and providing travelers with timely and reliable route guidance.
- Travel time reliability is defined as the consistency or dependability in travel times, as measured from day to day and/or across different times of the day. The analysis of travel time reliability is as important, if not even more important, than the traditional analysis of average travel time. In order to assess travel time reliability, travel time distribution needs to be determined first. Travel time distribution is necessary for measuring the probability of arriving on time and finding a reliable path for risk-averse travelers.
- the object is solved by the computer implemented method for calculating a travel time distribution of a vehicle path for a driver assistance function of the vehicle of claim 1, the system for calculating a travel time distribution of a vehicle path for a driver assistance function of the vehicle of claim 8, the computer program of claim 9 and the computer-readable data carrier of claim 10. Further developments and advantageous embodiments are defined in the dependent claims.
- the computer implemented method for calculating a travel time distribution of a vehicle path for a driver assistance function of the vehicle comprises receiving, in particular by a server via a wireless connection, travel time data of a plurality of other vehicles for a plurality of road segments along the selected path of the vehicle.
- the method further comprises selecting travel time data of at least a neighboring first road segment and second road segment along the selected path of the vehicle.
- the method comprises discretizing travel time distributions for the neighboring at least first road segment and second road segment along the selected path of the vehicle.
- the method comprises calculating a dependence-factor of a dependency between the first road segment and the second road segment, wherein the dependence-factor incorporates a copula-based correlation between the first road segment and the second road segment, and performing a discrete convolution dependent upon the dependence-factor to calculate the travel time distribution of the vehicle path.
- the system for calculating a travel time distribution of a vehicle path for a driver assistance function of the vehicle comprises means for receiving, in particular by a server via a wireless connection, travel time data of a plurality of other vehicles for a plurality of road segments along the selected path of the vehicle.
- the system further comprises means for selecting travel time data of at least a neighboring first road segment and second road segment along the selected path of the vehicle and means for discretizing travel time distributions for the neighboring at least first road segment and second road segment along the selected path of the vehicle.
- the system comprises means for calculating a dependence-factor of a dependency between the first road segment and second road segment, wherein the dependence-factor incorporates a copula-based correlation between the first road segment and the second road segment, and means for performing a discrete convolution dependent upon the dependence-factor to calculate the travel time distribution of the vehicle path.
- the computer program comprises program code to perform the method according to the present invention when the computer program is executed on a computer.
- the computer-readable data carrier contains program code of a computer program for performing the method according to the present invention when the computer program is executed on a computer.
- the path travel time distribution estimated by the dependent discrete convolution is accurate and allows for the calculation of the path travel time distribution in a reasonable time thus making it feasible for real world application.
- the dependence-factor of the dependency between the first road segment and the second road segment is calculated using a copula function and a rank-based correlation between the first road segment and the second road segment.
- the copula function is estimated by estimating segment travel time distributions from the received travel time data of the plurality of other vehicles for the plurality of road segments along the selected path of the vehicle.
- segment travel time distributions By using historical travel time data of other vehicles of a vehicle fleet sufficient data can advantageously be provided for the copula function to estimate segment travel time distributions.
- copula parameters of the copula function are estimated using a finite Gaussian Mixture Model. Said copula parameters are thus advantageously estimated using non-parametric estimators.
- the rank-based correlation between the first road segment and the second road segment is calculated using rank-based correlation coefficient Kendall's tau. Said calculation is thus performed advantageously using scale-invariant measures of association which are more flexible in characterizing the dependence of different road segments.
- a probability density function of the path travel time distribution of the vehicle is calculated from a joint probability density function with a cumulative distribution function and the probability density function of the first road segment and second road segment along the selected path of the vehicle.
- the dependency and correlation of different segment travel time distributions can be effectively modeled.
- a conditional mean and variants of a particular segment travel time given the observation of the other can be estimated.
- the here described features of the computer implemented method for calculating a travel time distribution of the vehicle path for the driver assistance function of the vehicle are also disclosed for the system for calculating the travel time distribution of the vehicle path for the driver assistance function of the vehicle and vice versa.
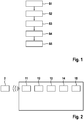
- Fig. 1 shows a flowchart of a computer implemented method for calculating a travel time distribution of a vehicle path for a driver assistance function of the vehicle according to an embodiment of the invention.
- the method comprises the step of receiving S1, in particular by a server 2 via a wireless connection, travel time data of a plurality of other vehicles for a plurality of road segments along the selected path of the vehicle 3.
- the method further comprises the steps of selecting S2 travel time data of at least a neighboring first road segment ⁇ and second road segment ⁇ along the selected path of the vehicle 3 and discretizing S3 travel time distributions TTD for the neighboring at least first road segment ⁇ and second road segment ⁇ along the selected path of the vehicle 3.
- the method comprises the steps of calculating S4 a dependence-factor of a dependency between the first road segment ⁇ and the second road segment ⁇ , wherein the dependence-factor incorporates a copula-based correlation between the first road segment ⁇ and the second road segment ⁇ , and performing S5 a discrete convolution dependent upon the dependence-factor to calculate the travel time distribution TTD of the vehicle path 1.
- the dependence-factor of the dependency between the first road segment ⁇ and second road segment ⁇ is calculated using a copula function and a rank-based correlation between the first road segment ⁇ and the second road segment ⁇ .
- the copula function is estimated by estimating segment travel time distributions TTD from the received travel time data of the plurality of other vehicles for the plurality of road segments along the selected path of the vehicle 3.
- Copula parameters of the copula function are estimated using a finite Gaussian Mixture Model.
- the rank-based correlation between the first road segment ⁇ and the second road segment ⁇ is calculated using rank-based correlation coefficient Kendall's tau.
- a probability density function of the path travel time distribution TTD of the vehicle 3 is calculated from a joint probability density function with a cumulative distribution function and the probability density function of the first road segment ⁇ and second road segment ⁇ along the selected path of the vehicle 3.
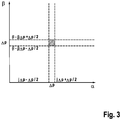
- Fig. 2 shows a system for calculating the travel time distribution of the vehicle path for a driver assistance function of the vehicle according to the embodiment of the invention.
- the system comprises means 11 for receiving, in particular by a server 2 via a wireless connection, travel time data of a plurality of other vehicles for a plurality of road segments along the selected path of the vehicle 3.
- the system further comprises means 12 for selecting travel time data of at least a neighboring first road segment ⁇ and second road segment ⁇ along the selected path of the vehicle 3 and means 13 for discretizing travel time distributions TTD for the neighboring at least first road segment ⁇ and second road segment ⁇ along the selected path of the vehicle 3.
- the system moreover comprises means 14 for calculating a dependence-factor of a dependency between the first road segment ⁇ and second road segment ⁇ , wherein the dependence-factor incorporates a copula-based correlation between the first road segment ⁇ and the second road segment ⁇ , and means 15 for performing a discrete convolution dependent upon the dependence-factor to calculate the travel time distribution TTD of the vehicle path 1.
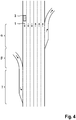
- Fig. 3 shows a graph of a discretization of the two-dimensional plane for dependent discrete convolution.
- An edge e ⁇ E comprises a pair of two vertices V 1 , V 2 ⁇ V.
- o , d ⁇ V representing the origin and the destination, respectively.
- the travel time for each segment is represented as a random variable x , which is derived from historical data.
- empirical segment TTD is discrete.
- segment TTD For characterizing segment TTD as continuous probability density function f ( x ) with distribution function F ( x ), both parametric and nonparametric estimators can be used. Examples for parametric estimators are Normal, Lognormal, Gamma, and Weibull, while Kernel Density Estimation and Gaussian Mixture Model are examples for nonparametric estimators.
- a path from o to d is comprised of several successive segments. As historical data for entire paths are not available, path TTD is obtained by aggregating segment TTD, which is explained below. Copulas are functions that relate multivariate distribution functions of random variables to their one-dimensional marginal distribution functions.
- Kendall's tau produces values ranging from -1 to 1, with a positive correlation indicating that the ranks of both variables increase at the same time while a negative correlation indicates that as the rank of one variable increases, that of the other one decreases.
- Archimedean copulas are very popular because they are easily derived and they are capable of capturing wide ranges of dependence.
- the definition of the Archimedean copula is based on the generator function ⁇ .
- a copula model for estimating path TTD is estimated in two steps. First segment TTDs are estimated from empirical GPS data. Next, the copula parameters are estimated. Segment TTDs need to be characterized using continuous marginal distributions.
- a finite Gaussian Mixture Model with three components can be used as it showed an accurate fit.
- the finite GMM with k components is represented as p y
- the parameters of the GMM are obtained by the Expectation-Maximization algorithm.
- DDC is illustrated for calculating path TTD comprised of two segment TTDs, where travel time for segment 1 is denoted as a random variable ⁇ , and travel time for segment 2 is denoted as 6.
- an N-dimensional space is discretized with a step of ⁇ p , as shown in Figures 5 to 7 .
- ⁇ p may differ, however, for simplicity reasons the same ⁇ p was chosen for every dimension.
- f ⁇ , ⁇ x y f ⁇ x f ⁇ y , does not hold.
- c ( F ⁇ ( x ), F ⁇ ( y )) can be approximated as a constant over the 2-dimensional interval of [ j ⁇ p - ⁇ p /2 ,j ⁇ p + ⁇ p /2] ⁇ [( i - j ) ⁇ p - ⁇ p /2,( i - j) ⁇ p + ⁇ p /2] and is denoted as C j ⁇ p ,( i - j ) ⁇ p .
- this factor incorporates the copula based correlation between the segments. Compared to the copula framework this approach allows for a simplified and fast computation of the TTD.
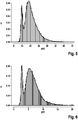
- Fig. 4 shows a schematic illustration of a freeway arterial on which the vehicle is traveling according to the embodiment of the invention.
- Said freeway arterial comprises three lanes in each direction, an on-ramp and an off-ramp as well as road segments ⁇ , ⁇ and ⁇ .
- the vehicle 3 is shown to travel along the vehicle path 1 leading through segments ⁇ , ⁇ and ⁇ .
- the travel time data is collected from probe vehicles.
- the setup includes a fleet of probe vehicles, which has a module that reports GPS data and a central server, which collects all data in a database.
- Each vehicle samples the current GPS positions in intervals of 10s to 30s, which are stored in in the local memory of the vehicle together with the according timestamp. After sampling a few positions, a filter mechanism decides whether sampled GPS positions are transmitted to the central server.
- This filter continuously compares the velocity of the vehicle with the velocity given by a traffic provider. If the velocity at one of the sampled data points deviates more than 10% to 30% (depending on the software version on the module) from the provided velocity, the recently samples positions and according timestamps are transmitted to the central server.
- Each transmitted position is linked to an alias, which is randomly generated by the vehicle and changes over time due to protection of driver's privacy.
- alias which is randomly generated by the vehicle and changes over time due to protection of driver's privacy.
- single transmitted positions of the same alias can be connected in order to reconstruct vehicle trajectories.
- the collected raw data is then matched to the segments of the road network. Velocities are derived from the difference of time and location, respectively, between two GPS points. Travel times are then obtained using the velocity and the length of the segment.
- Fig. 5, 6 and 7 show a freeway segment travel time STT distribution and Gaussian Mixture Model for segment ⁇ , ⁇ and ⁇ respectively according to the embodiment of the invention.
- Freeway travel time are comprised of four states.
- the first state is the free flow state, where median travel times are low and the spreads of the distribution is small.
- the distribution is approximately symmetric.
- the second state is the congestion onset, where median travel times are still low.
- the third phase is congested traffic, where median travel times are high, while the distribution is wide. In these periods congestion can be expected in different degrees of severity, resulting in a wide range of possible travel times.
- the fourth phase is the congestion dissolve, where median travel times are low, but the distribution is skewed to the left, resembling that in most cases congestion has dissolved but in a decreasing number of cases still congestion occurred.
- Figures 5, 6 , and 7 show segment TTD for Segment 1, Segment 2, and Segment 3 of the freeway arterial, respectively.
- the parameters of the GMM can be found in table 1.
- the five components can be interpreted as follows
- the first GMM component resembles the free flow phase.
- the second component reflects the phase of congestion onset, as well as the congestion dissolve.
- the third and fourth components reflect the congested traffic with different levels of congestion, respectively.
- the fifth component denotes the range of extremely heavy congestion with a large standard deviation resembling the tail of the distribution which happens rarely, thus, the very small mixture weight.
- Fig. 8 shows a scatter diagram for freeway segment travel time distributions of segment ⁇ and segment ⁇ according to the embodiment of the invention
- Fig. 9 shows a scatter diagram for freeway segment travel time distributions of segment ⁇ and segment ⁇ according to the embodiment of the invention. This shows segment correlation.
- a three-dimensional Clayton Copula with copula parameter 5.324 showed the best fit. Therefore, it was used for path TTD estimation and comparison with the DDC.
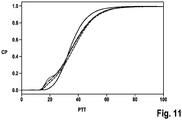
- Fig. 10 shows various probability density functions for the freeway arterial according to the embodiment of the invention and Fig. 11 shows a cumulative density function for the freeway travel path according to the embodiment of the invention.
- Figures 10 and 11 show PDF and CDF for the travel time of a path comprised of the three freeway segments estimated by the various models and the empirical data, respectively.
- Kolmogorov-Smirnov and Cramer-von-Mises statistics can be found in table 2.
- a lower value for the KS and CVM statistic, respectively, indicates a better fit.
- path TTD is analogous to the ones of segment TTDs with the same states, which were defined above.
- the convolution treats the successive segments as independent. Path TTD obtained by the convolution does not resemble any states. Instead we obtain a unimodal distribution.
- the DDC and the Copula Model account for segment correlation. Path TTD obtained by DDC and Copula Model show an accurate resemblance of the TTD states. While there is only a small underestimation for the free flow peak, and a small overestimation for the state denoting both congestion onset and congestion dissolve, path TTD obtained the two models accounting for segment correlation fit the empirical distribution accurately.
- the Copula Model performs slightly better than the DDC.
- Fig. 12 shows a schematic illustration of an urban arterial comprising a travel path of a vehicle in accordance with the embodiment of the invention.
- the urban arterial comprises a plurality of roads including a main road comprising road segments 101, 102, 103, 104, 105, 106, 107, 108, 109, 110.
- a plurality of streets 131, 132, 133, 134, 135, 140, 141, 142, 143, 144, 145 meet the main road at right angles at either intersections 121, 122 or between respective intersections.
- said urban arterial comprises a number of traffic lights 111, 112, 113, 114.
- the vehicle 3 is shown traveling along travel path 1 on the main road of the urban arterial.
- the calculation of the travel time distribution TTD for the urban arterial is analogous to the afore-mentioned calculation of the travel time distribution of the freeway arterial.
- the individual segments 101 to 110 are analogous to the segments ⁇ , ⁇ and ⁇ of the freeway arterial.
- the method for calculating a travel time distribution TTD of a vehicle path 1 for the driver assistance function of the vehicle in the context of the urban arterial can thus be performed in the same way as described in the context of the freeway arterial.
- the parameters of the GGM are listed in table 3.
- the first component of GMM denotes the situation when vehicle travel with free flow speed.
- the second component implies partially delayed vehicles, while the third component denotes the congested situation.
- Segment 101 For the longest segment, Segment 101, with a length of 105m, three peaks can be observed.
- the observable distinction is not that clear, however GMM still shows an accurate fit.
- Kendall's tau for each segment pair is given ranging from values between 0.318 and 0.835, showing that segment correlation exists.
- the correlation structure is complex and differs for each segment pair. The values of individual travel times for each segment scatter in a wide range of the joint distribution space.
- segments 104, 106 and 108 which are relatively short and do not have signal control nor turning lanes show a strong lower tail dependence. This is also resembled by a high value for Kendall's tau, with 0.639, 0.835, and 0.748, respectively.
- the line through the origin is caused by the estimation of the velocities of probe vehicle described above. If one GPS point is located before Segment i and the next GPS point is located behind Segment j , the velocity for both segments is equal. Therefore, travel time of Segment i and Segment j are proportional, causing the line through origin, where the corresponding samples lie.
- both DDC and Copula Model perform better than the convolution due to their ability to incorporate segment correlation.
- DDC and Copula Model model the tails as well as the bulk of the distribution more accurately than the convolution. Goodness of fit tests show that the Copula Model estimates path TTD more accurately than the DDC, while the path TTD estimate of the DDC is more accurate than convolution by far.
- the power of the DDC is unveiled.
- a path comprised of 100 segments is realistic. While the DDC takes approximately 3 seconds, which is feasible for applications, the Copula Model takes approximately 20 seconds, which is unfeasible for real world applications.
Landscapes
- Engineering & Computer Science (AREA)
- Business, Economics & Management (AREA)
- Human Resources & Organizations (AREA)
- Economics (AREA)
- Strategic Management (AREA)
- Marketing (AREA)
- Game Theory and Decision Science (AREA)
- Entrepreneurship & Innovation (AREA)
- Development Economics (AREA)
- Operations Research (AREA)
- Quality & Reliability (AREA)
- Tourism & Hospitality (AREA)
- Physics & Mathematics (AREA)
- General Business, Economics & Management (AREA)
- General Physics & Mathematics (AREA)
- Theoretical Computer Science (AREA)
- Traffic Control Systems (AREA)
Abstract
Description
- The invention relates to a computer implemented method for calculating a travel time distribution of a vehicle path for a driver assistance function of the vehicle. The invention further relates to a system for calculating a travel time distribution of a vehicle path for a driver assistance function of the vehicle. In addition, the invention relates to a computer program and a computer-readable data carrier.
- Travel time reliability is one of the key indicators for the performance of transportation systems. It has been increasingly recognized as an important measure for assessing the operation efficiency of road facilities, evaluating alternative traffic management strategies and providing travelers with timely and reliable route guidance.
- Travel time reliability is defined as the consistency or dependability in travel times, as measured from day to day and/or across different times of the day. The analysis of travel time reliability is as important, if not even more important, than the traditional analysis of average travel time. In order to assess travel time reliability, travel time distribution needs to be determined first. Travel time distribution is necessary for measuring the probability of arriving on time and finding a reliable path for risk-averse travelers.
- It is therefore an object of the present invention to provide a computer implemented method for calculating a travel time distribution of a vehicle path for a driver assistance function of the vehicle capable of calculating said travel time distribution accurately and in reasonable time, making it feasible for real world application.
- The object is solved by the computer implemented method for calculating a travel time distribution of a vehicle path for a driver assistance function of the vehicle of
claim 1, the system for calculating a travel time distribution of a vehicle path for a driver assistance function of the vehicle ofclaim 8, the computer program of claim 9 and the computer-readable data carrier ofclaim 10. Further developments and advantageous embodiments are defined in the dependent claims. - The computer implemented method for calculating a travel time distribution of a vehicle path for a driver assistance function of the vehicle comprises receiving, in particular by a server via a wireless connection, travel time data of a plurality of other vehicles for a plurality of road segments along the selected path of the vehicle.
- The method further comprises selecting travel time data of at least a neighboring first road segment and second road segment along the selected path of the vehicle. In addition, the method comprises discretizing travel time distributions for the neighboring at least first road segment and second road segment along the selected path of the vehicle.
- Moreover, the method comprises calculating a dependence-factor of a dependency between the first road segment and the second road segment, wherein the dependence-factor incorporates a copula-based correlation between the first road segment and the second road segment, and performing a discrete convolution dependent upon the dependence-factor to calculate the travel time distribution of the vehicle path.
- The system for calculating a travel time distribution of a vehicle path for a driver assistance function of the vehicle comprises means for receiving, in particular by a server via a wireless connection, travel time data of a plurality of other vehicles for a plurality of road segments along the selected path of the vehicle.
- The system further comprises means for selecting travel time data of at least a neighboring first road segment and second road segment along the selected path of the vehicle and means for discretizing travel time distributions for the neighboring at least first road segment and second road segment along the selected path of the vehicle.
- In addition, the system comprises means for calculating a dependence-factor of a dependency between the first road segment and second road segment, wherein the dependence-factor incorporates a copula-based correlation between the first road segment and the second road segment, and means for performing a discrete convolution dependent upon the dependence-factor to calculate the travel time distribution of the vehicle path.
- In addition, the computer program comprises program code to perform the method according to the present invention when the computer program is executed on a computer.
- Moreover, the computer-readable data carrier contains program code of a computer program for performing the method according to the present invention when the computer program is executed on a computer.
- It is an idea of the present invention to use dependent discrete convolution for estimating a path travel time distribution from individual segment travel time distributions by using copulas to characterize the correlation between segments. The path travel time distribution estimated by the dependent discrete convolution is accurate and allows for the calculation of the path travel time distribution in a reasonable time thus making it feasible for real world application.
- According to a further aspect of the invention, the dependence-factor of the dependency between the first road segment and the second road segment is calculated using a copula function and a rank-based correlation between the first road segment and the second road segment. This combination advantageously allows for a fast and accurate calculation of the path travel time distribution of the vehicle path.
- According to a further aspect of the invention, the copula function is estimated by estimating segment travel time distributions from the received travel time data of the plurality of other vehicles for the plurality of road segments along the selected path of the vehicle. By using historical travel time data of other vehicles of a vehicle fleet sufficient data can advantageously be provided for the copula function to estimate segment travel time distributions.
In accordance with a further aspect of the invention, copula parameters of the copula function are estimated using a finite Gaussian Mixture Model. Said copula parameters are thus advantageously estimated using non-parametric estimators. - According to a further aspect of the invention, the rank-based correlation between the first road segment and the second road segment is calculated using rank-based correlation coefficient Kendall's tau. Said calculation is thus performed advantageously using scale-invariant measures of association which are more flexible in characterizing the dependence of different road segments.
- According to a further aspect of the invention, the dependence factor is given by

- According to a further aspect of the invention, a probability density function of the path travel time distribution of the vehicle is calculated from a joint probability density function with a cumulative distribution function and the probability density function of the first road segment and second road segment along the selected path of the vehicle. In doing so, the dependency and correlation of different segment travel time distributions can be effectively modeled. Furthermore, a conditional mean and variants of a particular segment travel time given the observation of the other can be estimated.
- The here described features of the computer implemented method for calculating a travel time distribution of the vehicle path for the driver assistance function of the vehicle are also disclosed for the system for calculating the travel time distribution of the vehicle path for the driver assistance function of the vehicle and vice versa.
- For a more complete understanding of the present invention and advantages thereof, reference is now made to the following description taken in conjunction with the accompanying drawings. The invention is explained in more detail below using exemplary embodiments, which are specified in the schematic figures of the drawings, in which:
- Fig. 1
- shows a flowchart of a computer implemented method for calculating a travel time distribution of a vehicle path for a driver assistance function of the vehicle according to an embodiment of the invention;
- Fig. 2
- shows a system for calculating the travel time distribution of the vehicle path for a driver assistance function of the vehicle according to the embodiment of the invention;
- Fig. 3
- shows a graph of a discretization of the two-dimensional plane for dependent discrete convolution;
- Fig. 4
- shows a schematic illustration of a freeway arterial on which the vehicle is traveling according to the embodiment of the invention;
- Fig. 5
- shows a freeway segment travel time distribution and Gaussian Mixture Model for segment α according to the embodiment of the invention;
- Fig. 6
- shows a freeway segment travel time distribution and Gaussian Mixture Model for segment β according to the embodiment of the invention;
- Fig. 7
- shows a freeway segment travel time distribution and Gaussian Mixture Model for segment γ according to the embodiment of the invention;
- Fig. 8
- shows a scatter diagram for freeway segment travel time distributions of segment α and segment β according to the embodiment of the invention;
- Fig. 9
- shows a scatter diagram for freeway segment travel time distributions of segment β and segment γ according to the embodiment of the invention;
- Fig. 10
- shows various probability density functions for the freeway arterial according to the embodiment of the invention;
- Fig. 11
- shows a cumulative density function for the freeway travel path according to the embodiment of the invention; and
- Fig. 12
- shows a schematic illustration of an urban arterial comprising a travel path of a vehicle in accordance with the embodiment of the invention.
- Unless indicated otherwise, like reference numbers or signs to the figures indicate like elements.
-
Fig. 1 shows a flowchart of a computer implemented method for calculating a travel time distribution of a vehicle path for a driver assistance function of the vehicle according to an embodiment of the invention. - The method comprises the step of receiving S1, in particular by a
server 2 via a wireless connection, travel time data of a plurality of other vehicles for a plurality of road segments along the selected path of thevehicle 3. - The method further comprises the steps of selecting S2 travel time data of at least a neighboring first road segment α and second road segment β along the selected path of the
vehicle 3 and discretizing S3 travel time distributions TTD for the neighboring at least first road segment α and second road segment β along the selected path of thevehicle 3. - In addition, the method comprises the steps of calculating S4 a dependence-factor of a dependency between the first road segment α and the second road segment β, wherein the dependence-factor incorporates a copula-based correlation between the first road segment α and the second road segment β, and performing S5 a discrete convolution dependent upon the dependence-factor to calculate the travel time distribution TTD of the
vehicle path 1. - The dependence-factor of the dependency between the first road segment α and second road segment β is calculated using a copula function and a rank-based correlation between the first road segment α and the second road segment β.
- The copula function is estimated by estimating segment travel time distributions TTD from the received travel time data of the plurality of other vehicles for the plurality of road segments along the selected path of the
vehicle 3. Copula parameters of the copula function are estimated using a finite Gaussian Mixture Model. - The rank-based correlation between the first road segment α and the second road segment β is calculated using rank-based correlation coefficient Kendall's tau. A probability density function of the path travel time distribution TTD of the
vehicle 3 is calculated from a joint probability density function with a cumulative distribution function and the probability density function of the first road segment α and second road segment β along the selected path of thevehicle 3. -
Fig. 2 shows a system for calculating the travel time distribution of the vehicle path for a driver assistance function of the vehicle according to the embodiment of the invention. - The system comprises means 11 for receiving, in particular by a
server 2 via a wireless connection, travel time data of a plurality of other vehicles for a plurality of road segments along the selected path of thevehicle 3. - The system further comprises means 12 for selecting travel time data of at least a neighboring first road segment α and second road segment β along the selected path of the
vehicle 3 and means 13 for discretizing travel time distributions TTD for the neighboring at least first road segment α and second road segment β along the selected path of thevehicle 3. - The system moreover comprises means 14 for calculating a dependence-factor of a dependency between the first road segment α and second road segment β, wherein the dependence-factor incorporates a copula-based correlation between the first road segment α and the second road segment β, and means 15 for performing a discrete convolution dependent upon the dependence-factor to calculate the travel time distribution TTD of the
vehicle path 1. -
Fig. 3 shows a graph of a discretization of the two-dimensional plane for dependent discrete convolution. - A road network can be represented as a directed graph G = (V,E) which is an ordered pair of a (finite) set of vertices V and a set of edges E, representing geolocations and road segments connecting these locations, respectively. An edge e ∈ E comprises a pair of two vertices V 1,V 2 ∈ V. Besides we have o,d ∈ V, representing the origin and the destination, respectively. The travel time for each segment is represented as a random variable x, which is derived from historical data. Thus, empirical segment TTD is discrete.
- For characterizing segment TTD as continuous probability density function f(x) with distribution function F(x), both parametric and nonparametric estimators can be used. Examples for parametric estimators are Normal, Lognormal, Gamma, and Weibull, while Kernel Density Estimation and Gaussian Mixture Model are examples for nonparametric estimators.
A path from o to d is comprised of several successive segments. As historical data for entire paths are not available, path TTD is obtained by aggregating segment TTD, which is explained below.
Copulas are functions that relate multivariate distribution functions of random variables to their one-dimensional marginal distribution functions. According to Sklar's theorem, for an n-variate distribution function F(x1 ,...,xn ) with marginal distribution functions F 1(x 1),...Fn (xn ), there exists a certain copula function C which meets the relationship
- If marginal distributions are all continuous, C is unique. Based on Sklar's theorem the concept of copula provides an efficient way of modeling dependent variables. The joint distribution f(x1 ,...,xn ) of probability density functions f 1(x 1),...,fn (xn ) can be obtained by


- There are different measures of dependence. The most commonly used one for two random variables X, Y, is Pearson's linear correlation coefficient, defined by

- Pearson's linear correlation coefficient has the deficiency that it is not invariant under nonlinear strictly increasing transformations. Scale-invariant measures of association are more flexible in characterizing the dependence, such as rank-based correlation coefficient Kendall's tau. For two independent and identically distributed random vectors (X 1, Y 1) and (X 2, Y 2) Kendall's tau is defined as the probability of concordance minus the probability of discordance,

- Kendall's tau produces values ranging from -1 to 1, with a positive correlation indicating that the ranks of both variables increase at the same time while a negative correlation indicates that as the rank of one variable increases, that of the other one decreases.
- Archimedean copulas are very popular because they are easily derived and they are capable of capturing wide ranges of dependence. The definition of the Archimedean copula is based on the generator function φ. Archimedean copulas take the
form 

- If the generator function is definite, its corresponding copula function is also explicit. Hence, different generator functions result in different types of copulas. One frequently used archimedian copula is the Clayton copula, which has the generation function


- A copula model for estimating path TTD is estimated in two steps. First segment TTDs are estimated from empirical GPS data. Next, the copula parameters are estimated. Segment TTDs need to be characterized using continuous marginal distributions.
- A finite Gaussian Mixture Model (GMM) with three components can be used as it showed an accurate fit. The finite GMM with k components is represented as


- The parameters of the GMM are obtained by the Expectation-Maximization algorithm. For the second stage of the estimation process, the copula parameters are estimated using:

- As there is no analytical method for obtaining the distribution of the sum of travel times using the copula model, samples need be generated from the copula model to estimate path TTD.
- As path TTD estimation using convolution has a strong precondition that the segment TTDs being convolved must be independent, we propose a formulation of convolution for dependent segment TTDs. DDC is illustrated for calculating path TTD comprised of two segment TTDs, where travel time for
segment 1 is denoted as a random variable α, and travel time forsegment 2 is denoted as 6. The PDF for path TTD denoted as fα+ß can be calculated from the joint PDF fα,ß with CDFs F α and Fβ and PDFs fα and fβ respectively:
,α ] is the domain of α and [β,β] is the domain of β. If α and β are independent, f α,β (x,y) can be obtained by the product of its marginal PDFs:


Figures 5 to 7 . For each dimension Δp may differ, however, for simplicity reasons the same Δp was chosen for every dimension. Then the discrete approximation of fα (·) is defined as follows:
- The discrete approximation Pβ (i) of fβ (·) is defined analogously.
- Now we consider the case, where α and β are dependent.
- Then


- Using



- Then the DDC can be formulated as

- If Δp is small enough, c(Fα (x),Fβ (y)) can be approximated as a constant over the 2-dimensional interval of [jΔp - Δp/2,jΔp + Δp/2] × [(i - j)Δp - Δp/2,(i - j)Δp + Δp/2] and is denoted as C jΔp,(i-j)Δp .
- It can be calculated by

- Then


- Compared to the traditional convolution the DDC has similar form as

- When α and β are independent, C jΔp,(i-j)Δp := 1 and equation


- In case of dependent segments, this factor incorporates the copula based correlation between the segments. Compared to the copula framework this approach allows for a simplified and fast computation of the TTD.
-
Fig. 4 shows a schematic illustration of a freeway arterial on which the vehicle is traveling according to the embodiment of the invention. - Said freeway arterial comprises three lanes in each direction, an on-ramp and an off-ramp as well as road segments α, β and γ. The
vehicle 3 is shown to travel along thevehicle path 1 leading through segments α, β and γ. - The travel time data is collected from probe vehicles. The setup includes a fleet of probe vehicles, which has a module that reports GPS data and a central server, which collects all data in a database. Each vehicle samples the current GPS positions in intervals of 10s to 30s, which are stored in in the local memory of the vehicle together with the according timestamp. After sampling a few positions, a filter mechanism decides whether sampled GPS positions are transmitted to the central server.
- This filter continuously compares the velocity of the vehicle with the velocity given by a traffic provider. If the velocity at one of the sampled data points deviates more than 10% to 30% (depending on the software version on the module) from the provided velocity, the recently samples positions and according timestamps are transmitted to the central server.
- Each transmitted position is linked to an alias, which is randomly generated by the vehicle and changes over time due to protection of driver's privacy. At the server, single transmitted positions of the same alias can be connected in order to reconstruct vehicle trajectories.
- The collected raw data is then matched to the segments of the road network. Velocities are derived from the difference of time and location, respectively, between two GPS points. Travel times are then obtained using the velocity and the length of the segment.
-
Fig. 5, 6 and7 show a freeway segment travel time STT distribution and Gaussian Mixture Model for segment α, β and γ respectively according to the embodiment of the invention. - In order to understand the correlation between segments we investigate the individual segment TTDs. For the DDC no estimation of marginal distribution is necessary, as it can directly work with discrete histogram data. For the copula model marginal distribution needs to be estimated. Freeway travel time are comprised of four states. The first state is the free flow state, where median travel times are low and the spreads of the distribution is small. The distribution is approximately symmetric.
- The second state is the congestion onset, where median travel times are still low. The third phase is congested traffic, where median travel times are high, while the distribution is wide. In these periods congestion can be expected in different degrees of severity, resulting in a wide range of possible travel times.
- The fourth phase is the congestion dissolve, where median travel times are low, but the distribution is skewed to the left, resembling that in most cases congestion has dissolved but in a decreasing number of cases still congestion occurred.
Figures 5, 6 , and7 show segment TTD forSegment 1,Segment 2, andSegment 3 of the freeway arterial, respectively. - For estimation of marginal distribution, a GMM with five components was found as best fitting. The parameters of the GMM can be found in table 1. The five components can be interpreted as follows The first GMM component resembles the free flow phase. The second component reflects the phase of congestion onset, as well as the congestion dissolve. The third and fourth components reflect the congested traffic with different levels of congestion, respectively. The fifth component denotes the range of extremely heavy congestion with a large standard deviation resembling the tail of the distribution which happens rarely, thus, the very small mixture weight.
Table 1: GMM Parameters with five components for highway segment TTD estimation Segment Mean (µ) Sigma (σ) Weight (π) Segment 1 (9.70, 17.06, 23.06, 32.16, 61.59) (0.96, 3.24, 5.28, 8.46, 26.12) (0.12, 0.37, 0.36, 0.11, 0.01) Segment 2 (2.79, 5.03, 7.00, 10.16, 20.15) (0.27, 1.01, 1.60, 2.84, 9.26) (0.12, 0.32, 0.41, 0.11, 0.01) Segment 3 (4.72, 9.22, 12.32, 17.70, 31.49) (0.47, 1.97, 2.80, 4.80, 13.35) (0.13, 0.35, 0.40, 0.08, 0.01) -
Fig. 8 shows a scatter diagram for freeway segment travel time distributions of segment α and segment β according to the embodiment of the invention andFig. 9 shows a scatter diagram for freeway segment travel time distributions of segment β and segment γ according to the embodiment of the invention. This shows segment correlation. - In addition, Kendall's tau

- A three-dimensional Clayton Copula with copula parameter 5.324 showed the best fit. Therefore, it was used for path TTD estimation and comparison with the DDC.
-
Fig. 10 shows various probability density functions for the freeway arterial according to the embodiment of the invention andFig. 11 shows a cumulative density function for the freeway travel path according to the embodiment of the invention. - For estimating path TTD we compare the performance of the proposed DDC methodology with the copula model, convolution, and the empirical distribution. The number of samples generated from the Copula Model was set to the same number as original data samples. For the DDC a discretization step of one second was found suitable, and, thus, is chosen.
-
Figures 10 and11 show PDF and CDF for the travel time of a path comprised of the three freeway segments estimated by the various models and the empirical data, respectively. Kolmogorov-Smirnov and Cramer-von-Mises statistics can be found in table 2. A lower value for the KS and CVM statistic, respectively, indicates a better fit. - As one could expect, the shape of path TTD is analogous to the ones of segment TTDs with the same states, which were defined above. The convolution treats the successive segments as independent. Path TTD obtained by the convolution does not resemble any states. Instead we obtain a unimodal distribution. The DDC and the Copula Model account for segment correlation. Path TTD obtained by DDC and Copula Model show an accurate resemblance of the TTD states. While there is only a small underestimation for the free flow peak, and a small overestimation for the state denoting both congestion onset and congestion dissolve, path TTD obtained the two models accounting for segment correlation fit the empirical distribution accurately. The Copula Model performs slightly better than the DDC.
- In order to test the eligibility for real world applications, we estimate path TTD for an increasing number of segments and compare computational times in the next section. Compared to the uninterrupted travel flow on freeway facilities, the interrupted nature of travel flows on urban arterials make TTD estimation much more challenging. For that reason we use a data set of an urban arterial with several road features resulting in an interrupted travel flow, in order to investigate the potential for real world application of the proposed DDC methodology and the Copula Model.
Table 2: gof highway all Convolution Copula Model DDC KS 0.1197 0.0313 0.0596 CVM 0.2447 0.0051 0.0382 -
Fig. 12 shows a schematic illustration of an urban arterial comprising a travel path of a vehicle in accordance with the embodiment of the invention. - The urban arterial comprises a plurality of roads including a main road comprising
road segments streets intersections traffic lights vehicle 3 is shown traveling alongtravel path 1 on the main road of the urban arterial. - The calculation of the travel time distribution TTD for the urban arterial is analogous to the afore-mentioned calculation of the travel time distribution of the freeway arterial. The
individual segments 101 to 110 are analogous to the segments α, β and γ of the freeway arterial. Thus, the method for calculating a travel time distribution TTD of avehicle path 1 for the driver assistance function of the vehicle in the context of the urban arterial can thus be performed in the same way as described in the context of the freeway arterial. - The parameters of the GGM are listed in table 3. The first component of GMM denotes the situation when vehicle travel with free flow speed. The second component implies partially delayed vehicles, while the third component denotes the congested situation. For the longest segment,
Segment 101, with a length of 105m, three peaks can be observed. For the segments with a shorter length, the observable distinction is not that clear, however GMM still shows an accurate fit. - In addition, Kendall's tau for each segment pair is given ranging from values between 0.318 and 0.835, showing that segment correlation exists. However, as there are several factors affecting the travel time of each segment and the correlation in between segments, such as signal control, parking lane, turning lane, congestion, and weather, the correlation structure is complex and differs for each segment pair. The values of individual travel times for each segment scatter in a wide range of the joint distribution space.
-
Only segments Table 3: GMM Parameters for segment TTD estimation Segment Mean (µ) Sigma (σ) Weight (π) Segment 101 (16.08, 31.41, 62.92) (5.25, 9.79, 12.65) (0.31, 0.34, 0.34) Segment 102 (5.41, 8.86, 16.31) (1.44, 2.68, 5.58) (0.52, 0.38, 0.09) Segment 103 (8.92, 14.55, 29.37) (2.03, 4.06, 9.55) (0.43, 0.34, 0.22) Segment 104 (3.11, 5.72, 10.33) (0.72, 1.69, 3.26) (0.43, 0.38, 0.17) Segment 105 (9.46, 17.58, 36.01) (2.18, 5.26, 10.38) (0.33, 0.38, 0.28) Segment 106 (6.43, 12.26, 29.55) (1.53, 3.94, 5.36) (0.46, 0.35, 0.17) Segment 107 (8.24, 13.30, 27.82) (1.68, 3.75, 10.94) (0.54, 0.37, 0.07) Segment 108 (2.76, 3.97, 7.09) (0.48, 0.91, 2.69) (0.48, 0.38, 0.12) Segment 109 (3.59, 5.42, 10.17) (0.64, 1.34, 3.94) (0.52, 0.35, 0.11) Segment 110 (6.67, 11.29, 22.46) (1.32, 3.22, 8.64) (0.52, 0.35, 0.11) - For estimating path TTD we compare the performance of the proposed DDC methodology with the copula model, convolution, and the empirical distribution. For the copula model, the two-stage estimation procedure described above was used. The number of samples generated from the Copula Model was set to the same number as original data samples. For the DDC a discretization step of one second was used.
- A lower value for the KS and CVM statistic, respectively, indicates a better fit.
- both DDC and Copula Model perform better than the convolution due to their ability to incorporate segment correlation. DDC and Copula Model model the tails as well as the bulk of the distribution more accurately than the convolution. Goodness of fit tests show that the Copula Model estimates path TTD more accurately than the DDC, while the path TTD estimate of the DDC is more accurate than convolution by far.
- However, when comparing computing time, the power of the DDC is unveiled. For application in route guidance systems, a path comprised of 100 segments is realistic. While the DDC takes approximately 3 seconds, which is feasible for applications, the Copula Model takes approximately 20 seconds, which is unfeasible for real world applications.
- Although specific embodiments have been illustrated and described herein, it will be appreciated by those of ordinary skill in the art that a variety of alternate and/or equivalent implementations exist. It should be appreciated that the exemplary embodiment or exemplary embodiments are only examples, and are not intended to limit the scope, applicability or configuration in any way. Rather, the foregoing summary and detailed description will provide those skilled in the art with a convenient roadmap for implementing at least one exemplary embodiment, it being understood that various changes may be made in the function and arrangement of elements described in an exemplary embodiment without departing from the scope as set forth in the appended claims and their legal equivalents. Generally, this application is intended to cover any adaptations or variations of the specific embodiments discussed therein.
Claims (10)
- Computer implemented method for calculating a travel time distribution (TTD) of a vehicle path (1) for a driver assistance function of the vehicle (3), comprising the steps of:Receiving (S1), in particular by a server (2) via a wireless connection, travel time data of a plurality of other vehicles for a plurality of road segments along the selected path of the vehicle (3);selecting (S2) travel time data of at least a neighboring first road segment (α) and second road segment (β) along the selected path of the vehicle (3);discretizing (S3) travel time distributions (TTD) for the neighboring at least first road segment (α) and second road segment (β) along the selected path of the vehicle (3);calculating (S4) a dependence-factor of a dependency between the first road segment (α) and the second road segment (β), wherein the dependence-factor incorporates a copula-based correlation between the first road segment (α) and the second road segment (β); andperforming (S5) a discrete convolution dependent upon the dependence-factor to calculate the travel time distribution (TTD) of the vehicle path (1).
- Computer implemented method of claim 1, wherein the dependence-factor of the dependency between the first road segment (α) and second road segment (β) is calculated using a copula function and a rank-based correlation between the first road segment (α) and the second road segment (β).
- Computer implemented method of claim 2, wherein the copula function is estimated by estimating segment travel time distributions (TTD) from the received travel time data of the plurality of other vehicles for the plurality of road segments along the selected path of the vehicle (3).
- Computer implemented method of claim 2 or 3, wherein copula parameters of the copula function are estimated using a finite Gaussian Mixture Model.
- Computer implemented method of one of claims 2 to 4, wherein the rank-based correlation between the first road segment (α) and the second road segment (β) is calculated using rank-based correlation coefficient Kendall's tau.
- Computer implemented method of any one of the preceding claims, wherein the dependence factor is given by

- Computer implemented method of one of claims 1 to 6, wherein a probability density function of the path travel time distribution (TTD) of the vehicle (3) is calculated from a joint probability density function with a cumulative distribution function and the probability density function of the first road segment (α) and second road segment (β) along the selected path of the vehicle (3).
- System (10) for calculating a travel time distribution (TTD) of a vehicle path (1) for a driver assistance function of the vehicle (3), comprising:means (11) for receiving, in particular by a server (2) via a wireless connection, travel time data of a plurality of other vehicles for a plurality of road segments along the selected path of the vehicle (3);means (12) for selecting travel time data of at least a neighboring first road segment (α) and second road segment (β) along the selected path of the vehicle (3);means (13) for discretizing travel time distributions (TTD) for the neighboring at least first road segment (α) and second road segment (β) along the selected path of the vehicle (3);means (14) for calculating a dependence-factor of a dependency between the first road segment (α) and second road segment (β), wherein the dependence-factor incorporates a copula-based correlation between the first road segment (α) and the second road segment (β); andmeans (15) for performing a discrete convolution dependent upon the dependence-factor to calculate the travel time distribution (TTD) of the vehicle path (1).
- Computer program with program code to perform the method of any one of claims 1 to 6 when the computer program is executed on a computer.
- Computer-readable data carrier containing program code of a computer program for performing the method of to any one of claims 1 to 7 when the computer program is executed on a computer.
Priority Applications (1)
| Application Number | Priority Date | Filing Date | Title |
|---|---|---|---|
| EP20173176.7A EP3907675B1 (en) | 2020-05-06 | 2020-05-06 | Computer implemented method for calculating a travel time distribution of a vehicle path for a driver assistance function of the vehicle, system, computer program and computer-readable data carrier |
Applications Claiming Priority (1)
| Application Number | Priority Date | Filing Date | Title |
|---|---|---|---|
| EP20173176.7A EP3907675B1 (en) | 2020-05-06 | 2020-05-06 | Computer implemented method for calculating a travel time distribution of a vehicle path for a driver assistance function of the vehicle, system, computer program and computer-readable data carrier |
Publications (2)
| Publication Number | Publication Date |
|---|---|
| EP3907675A1 true EP3907675A1 (en) | 2021-11-10 |
| EP3907675B1 EP3907675B1 (en) | 2025-07-23 |
Family
ID=70613593
Family Applications (1)
| Application Number | Title | Priority Date | Filing Date |
|---|---|---|---|
| EP20173176.7A Active EP3907675B1 (en) | 2020-05-06 | 2020-05-06 | Computer implemented method for calculating a travel time distribution of a vehicle path for a driver assistance function of the vehicle, system, computer program and computer-readable data carrier |
Country Status (1)
| Country | Link |
|---|---|
| EP (1) | EP3907675B1 (en) |
Cited By (1)
| Publication number | Priority date | Publication date | Assignee | Title |
|---|---|---|---|---|
| CN120161819A (en) * | 2025-05-19 | 2025-06-17 | 北京航空航天大学 | A control system reliability assessment method based on multi-level nested Copula functions |
-
2020
- 2020-05-06 EP EP20173176.7A patent/EP3907675B1/en active Active
Non-Patent Citations (3)
| Title |
|---|
| ADAM SAMARA ET AL: "Modelling arterial travel time distribution using copulas", ARXIV.ORG, CORNELL UNIVERSITY LIBRARY, 201 OLIN LIBRARY CORNELL UNIVERSITY ITHACA, NY 14853, 7 May 2020 (2020-05-07), XP081670525 * |
| MIN CHEN ET AL: "A copula-based approach for estimating the travel time reliability of urban arterial", TRANSPORTATION RESEARCH PART C:EMERGING TECHNOLOGIES, vol. 82, 1 September 2017 (2017-09-01), GB, pages 1 - 23, XP055730571, ISSN: 0968-090X, DOI: 10.1016/j.trc.2017.06.007 * |
| WANG YI ET AL: "Dependent Discrete Convolution Based Probabilistic Load Flow for the Active Distribution System", IEEE TRANSACTIONS ON SUSTAINABLE ENERGY, IEEE, USA, vol. 8, no. 3, 1 July 2017 (2017-07-01), pages 1000 - 1009, XP011653322, ISSN: 1949-3029, [retrieved on 20170619], DOI: 10.1109/TSTE.2016.2640340 * |
Cited By (1)
| Publication number | Priority date | Publication date | Assignee | Title |
|---|---|---|---|---|
| CN120161819A (en) * | 2025-05-19 | 2025-06-17 | 北京航空航天大学 | A control system reliability assessment method based on multi-level nested Copula functions |
Also Published As
| Publication number | Publication date |
|---|---|
| EP3907675B1 (en) | 2025-07-23 |
Similar Documents
| Publication | Publication Date | Title |
|---|---|---|
| Abdel-Aty et al. | Crash estimation at signalized intersections along corridors: analyzing spatial effect and identifying significant factors | |
| US9111442B2 (en) | Estimating incident duration | |
| Chen et al. | Effect of information quality on compliance behavior of commuters under real-time traffic information | |
| Du et al. | Artificial neural network model for estimating temporal and spatial freeway work zone delay using probe-vehicle data | |
| WO2010107394A1 (en) | Determining a traffic route using predicted traffic congestion | |
| Farid et al. | A new approach for calibrating safety performance functions | |
| Sandt et al. | Identifying wrong-way driving hotspots by modeling crash risk and assessing duration of wrong-way driving events | |
| Kukkapalli et al. | Modeling the effect of a freeway road construction project on link-level travel times | |
| Lian et al. | Cost of travel delays caused by traffic crashes | |
| Habtemichael et al. | Methodology for quantifying incident-induced delays on freeways by grouping similar traffic patterns | |
| Habtemichael et al. | Incident-induced delays on freeways: quantification method by grouping similar traffic patterns | |
| Salek et al. | Assessing the likelihood of secondary crashes on freeways with Adaptive Signal Control System deployed on alternate routes | |
| EP3907675B1 (en) | Computer implemented method for calculating a travel time distribution of a vehicle path for a driver assistance function of the vehicle, system, computer program and computer-readable data carrier | |
| Xiong et al. | The tolerable waiting time: A generalized Pareto distribution model with empirical investigation | |
| Mahendra et al. | Prediction of road accidents in the different states of India using machine learning algorithms | |
| Ghanim et al. | Operational performance of signalized intersections: HCM and microsimulation comparison | |
| Hadi et al. | Estimation of Diversion Rate During Incidents on Basis of Main-Line Detector Data | |
| US20250035449A1 (en) | Method and system of lane-level road congestion identification and forecasting for navigation application | |
| Shen et al. | Traffic velocity prediction using GPS data: IEEE ICDM contest task 3 report | |
| Adu-Gyamfi et al. | A comprehensive data driven evaluation of wide area probe data: opportunities and challenges | |
| Zakaria et al. | Distribution model of motorcycle speed on divided roadway in Makassar | |
| Saha et al. | Applicability of enhanced Interchange Safety Analysis Tool (ISATe) for local applications: a Florida case study. | |
| Sarker et al. | Identification of secondary crashes in large-scale highway networks | |
| Samara | Stochastic routing optimized for autonomous driving | |
| Hage et al. | Link travel time estimation in urban areas by detectors and probe vehicles fusion |
Legal Events
| Date | Code | Title | Description |
|---|---|---|---|
| PUAI | Public reference made under article 153(3) epc to a published international application that has entered the european phase |
Free format text: ORIGINAL CODE: 0009012 |
|
| STAA | Information on the status of an ep patent application or granted ep patent |
Free format text: STATUS: THE APPLICATION HAS BEEN PUBLISHED |
|
| AK | Designated contracting states |
Kind code of ref document: A1 Designated state(s): AL AT BE BG CH CY CZ DE DK EE ES FI FR GB GR HR HU IE IS IT LI LT LU LV MC MK MT NL NO PL PT RO RS SE SI SK SM TR |
|
| B565 | Issuance of search results under rule 164(2) epc |
Effective date: 20200924 |
|
| STAA | Information on the status of an ep patent application or granted ep patent |
Free format text: STATUS: REQUEST FOR EXAMINATION WAS MADE |
|
| 17P | Request for examination filed |
Effective date: 20220204 |
|
| RBV | Designated contracting states (corrected) |
Designated state(s): AL AT BE BG CH CY CZ DE DK EE ES FI FR GB GR HR HU IE IS IT LI LT LU LV MC MK MT NL NO PL PT RO RS SE SI SK SM TR |
|
| STAA | Information on the status of an ep patent application or granted ep patent |
Free format text: STATUS: EXAMINATION IS IN PROGRESS |
|
| 17Q | First examination report despatched |
Effective date: 20220609 |
|
| P01 | Opt-out of the competence of the unified patent court (upc) registered |
Effective date: 20230502 |
|
| GRAP | Despatch of communication of intention to grant a patent |
Free format text: ORIGINAL CODE: EPIDOSNIGR1 |
|
| STAA | Information on the status of an ep patent application or granted ep patent |
Free format text: STATUS: GRANT OF PATENT IS INTENDED |
|
| INTG | Intention to grant announced |
Effective date: 20250219 |
|
| GRAS | Grant fee paid |
Free format text: ORIGINAL CODE: EPIDOSNIGR3 |
|
| GRAA | (expected) grant |
Free format text: ORIGINAL CODE: 0009210 |
|
| STAA | Information on the status of an ep patent application or granted ep patent |
Free format text: STATUS: THE PATENT HAS BEEN GRANTED |
|
| AK | Designated contracting states |
Kind code of ref document: B1 Designated state(s): AL AT BE BG CH CY CZ DE DK EE ES FI FR GB GR HR HU IE IS IT LI LT LU LV MC MK MT NL NO PL PT RO RS SE SI SK SM TR |
|
| REG | Reference to a national code |
Ref country code: GB Ref legal event code: FG4D |
|
| REG | Reference to a national code |
Ref country code: CH Ref legal event code: EP |
|
| REG | Reference to a national code |
Ref country code: IE Ref legal event code: FG4D |
|
| REG | Reference to a national code |
Ref country code: DE Ref legal event code: R096 Ref document number: 602020054887 Country of ref document: DE |
|
| REG | Reference to a national code |
Ref country code: NL Ref legal event code: MP Effective date: 20250723 |
|
| PG25 | Lapsed in a contracting state [announced via postgrant information from national office to epo] |
Ref country code: PT Free format text: LAPSE BECAUSE OF FAILURE TO SUBMIT A TRANSLATION OF THE DESCRIPTION OR TO PAY THE FEE WITHIN THE PRESCRIBED TIME-LIMIT Effective date: 20251124 |
|
| PG25 | Lapsed in a contracting state [announced via postgrant information from national office to epo] |
Ref country code: NL Free format text: LAPSE BECAUSE OF FAILURE TO SUBMIT A TRANSLATION OF THE DESCRIPTION OR TO PAY THE FEE WITHIN THE PRESCRIBED TIME-LIMIT Effective date: 20250723 |
|
| REG | Reference to a national code |
Ref country code: AT Ref legal event code: MK05 Ref document number: 1817189 Country of ref document: AT Kind code of ref document: T Effective date: 20250723 |
|
| PG25 | Lapsed in a contracting state [announced via postgrant information from national office to epo] |
Ref country code: IS Free format text: LAPSE BECAUSE OF FAILURE TO SUBMIT A TRANSLATION OF THE DESCRIPTION OR TO PAY THE FEE WITHIN THE PRESCRIBED TIME-LIMIT Effective date: 20251123 |
|
| PG25 | Lapsed in a contracting state [announced via postgrant information from national office to epo] |
Ref country code: NO Free format text: LAPSE BECAUSE OF FAILURE TO SUBMIT A TRANSLATION OF THE DESCRIPTION OR TO PAY THE FEE WITHIN THE PRESCRIBED TIME-LIMIT Effective date: 20251023 |
|
| REG | Reference to a national code |
Ref country code: LT Ref legal event code: MG9D |
|
| PG25 | Lapsed in a contracting state [announced via postgrant information from national office to epo] |
Ref country code: AT Free format text: LAPSE BECAUSE OF FAILURE TO SUBMIT A TRANSLATION OF THE DESCRIPTION OR TO PAY THE FEE WITHIN THE PRESCRIBED TIME-LIMIT Effective date: 20250723 |
|
| PG25 | Lapsed in a contracting state [announced via postgrant information from national office to epo] |
Ref country code: FI Free format text: LAPSE BECAUSE OF FAILURE TO SUBMIT A TRANSLATION OF THE DESCRIPTION OR TO PAY THE FEE WITHIN THE PRESCRIBED TIME-LIMIT Effective date: 20250723 |
|
| PG25 | Lapsed in a contracting state [announced via postgrant information from national office to epo] |
Ref country code: HR Free format text: LAPSE BECAUSE OF FAILURE TO SUBMIT A TRANSLATION OF THE DESCRIPTION OR TO PAY THE FEE WITHIN THE PRESCRIBED TIME-LIMIT Effective date: 20250723 |
|
| PG25 | Lapsed in a contracting state [announced via postgrant information from national office to epo] |
Ref country code: GR Free format text: LAPSE BECAUSE OF FAILURE TO SUBMIT A TRANSLATION OF THE DESCRIPTION OR TO PAY THE FEE WITHIN THE PRESCRIBED TIME-LIMIT Effective date: 20251024 |
|
| PG25 | Lapsed in a contracting state [announced via postgrant information from national office to epo] |
Ref country code: SE Free format text: LAPSE BECAUSE OF FAILURE TO SUBMIT A TRANSLATION OF THE DESCRIPTION OR TO PAY THE FEE WITHIN THE PRESCRIBED TIME-LIMIT Effective date: 20250723 |
|
| PG25 | Lapsed in a contracting state [announced via postgrant information from national office to epo] |
Ref country code: LV Free format text: LAPSE BECAUSE OF FAILURE TO SUBMIT A TRANSLATION OF THE DESCRIPTION OR TO PAY THE FEE WITHIN THE PRESCRIBED TIME-LIMIT Effective date: 20250723 |
|
| PG25 | Lapsed in a contracting state [announced via postgrant information from national office to epo] |
Ref country code: PL Free format text: LAPSE BECAUSE OF FAILURE TO SUBMIT A TRANSLATION OF THE DESCRIPTION OR TO PAY THE FEE WITHIN THE PRESCRIBED TIME-LIMIT Effective date: 20250723 Ref country code: BG Free format text: LAPSE BECAUSE OF FAILURE TO SUBMIT A TRANSLATION OF THE DESCRIPTION OR TO PAY THE FEE WITHIN THE PRESCRIBED TIME-LIMIT Effective date: 20250723 |
|
| PG25 | Lapsed in a contracting state [announced via postgrant information from national office to epo] |
Ref country code: RS Free format text: LAPSE BECAUSE OF FAILURE TO SUBMIT A TRANSLATION OF THE DESCRIPTION OR TO PAY THE FEE WITHIN THE PRESCRIBED TIME-LIMIT Effective date: 20251023 |
|
| PG25 | Lapsed in a contracting state [announced via postgrant information from national office to epo] |
Ref country code: ES Free format text: LAPSE BECAUSE OF FAILURE TO SUBMIT A TRANSLATION OF THE DESCRIPTION OR TO PAY THE FEE WITHIN THE PRESCRIBED TIME-LIMIT Effective date: 20250723 |
|
| PG25 | Lapsed in a contracting state [announced via postgrant information from national office to epo] |
Ref country code: SM Free format text: LAPSE BECAUSE OF FAILURE TO SUBMIT A TRANSLATION OF THE DESCRIPTION OR TO PAY THE FEE WITHIN THE PRESCRIBED TIME-LIMIT Effective date: 20250723 |
|
| PG25 | Lapsed in a contracting state [announced via postgrant information from national office to epo] |
Ref country code: DK Free format text: LAPSE BECAUSE OF FAILURE TO SUBMIT A TRANSLATION OF THE DESCRIPTION OR TO PAY THE FEE WITHIN THE PRESCRIBED TIME-LIMIT Effective date: 20250723 |
|
| PG25 | Lapsed in a contracting state [announced via postgrant information from national office to epo] |
Ref country code: IT Free format text: LAPSE BECAUSE OF FAILURE TO SUBMIT A TRANSLATION OF THE DESCRIPTION OR TO PAY THE FEE WITHIN THE PRESCRIBED TIME-LIMIT Effective date: 20250723 |
|
| PG25 | Lapsed in a contracting state [announced via postgrant information from national office to epo] |
Ref country code: CZ Free format text: LAPSE BECAUSE OF FAILURE TO SUBMIT A TRANSLATION OF THE DESCRIPTION OR TO PAY THE FEE WITHIN THE PRESCRIBED TIME-LIMIT Effective date: 20250723 |
|
| PG25 | Lapsed in a contracting state [announced via postgrant information from national office to epo] |
Ref country code: SK Free format text: LAPSE BECAUSE OF FAILURE TO SUBMIT A TRANSLATION OF THE DESCRIPTION OR TO PAY THE FEE WITHIN THE PRESCRIBED TIME-LIMIT Effective date: 20250723 Ref country code: EE Free format text: LAPSE BECAUSE OF FAILURE TO SUBMIT A TRANSLATION OF THE DESCRIPTION OR TO PAY THE FEE WITHIN THE PRESCRIBED TIME-LIMIT Effective date: 20250723 |