EP3907658A1 - Hyperspectral demixing using foveated compressive projections - Google Patents
Hyperspectral demixing using foveated compressive projections Download PDFInfo
- Publication number
- EP3907658A1 EP3907658A1 EP21181003.1A EP21181003A EP3907658A1 EP 3907658 A1 EP3907658 A1 EP 3907658A1 EP 21181003 A EP21181003 A EP 21181003A EP 3907658 A1 EP3907658 A1 EP 3907658A1
- Authority
- EP
- European Patent Office
- Prior art keywords
- spectral
- spectroscopic data
- hierarchal
- foveated
- demixing
- Prior art date
- Legal status (The legal status is an assumption and is not a legal conclusion. Google has not performed a legal analysis and makes no representation as to the accuracy of the status listed.)
- Granted
Links
Images




Classifications
-
- G—PHYSICS
- G06—COMPUTING OR CALCULATING; COUNTING
- G06V—IMAGE OR VIDEO RECOGNITION OR UNDERSTANDING
- G06V20/00—Scenes; Scene-specific elements
- G06V20/60—Type of objects
- G06V20/69—Microscopic objects, e.g. biological cells or cellular parts
-
- G—PHYSICS
- G01—MEASURING; TESTING
- G01J—MEASUREMENT OF INTENSITY, VELOCITY, SPECTRAL CONTENT, POLARISATION, PHASE OR PULSE CHARACTERISTICS OF INFRARED, VISIBLE OR ULTRAVIOLET LIGHT; COLORIMETRY; RADIATION PYROMETRY
- G01J3/00—Spectrometry; Spectrophotometry; Monochromators; Measuring colours
- G01J3/28—Investigating the spectrum
- G01J3/2823—Imaging spectrometer
-
- G—PHYSICS
- G06—COMPUTING OR CALCULATING; COUNTING
- G06F—ELECTRIC DIGITAL DATA PROCESSING
- G06F18/00—Pattern recognition
- G06F18/20—Analysing
- G06F18/23—Clustering techniques
- G06F18/231—Hierarchical techniques, i.e. dividing or merging pattern sets so as to obtain a dendrogram
-
- G—PHYSICS
- G06—COMPUTING OR CALCULATING; COUNTING
- G06V—IMAGE OR VIDEO RECOGNITION OR UNDERSTANDING
- G06V10/00—Arrangements for image or video recognition or understanding
- G06V10/70—Arrangements for image or video recognition or understanding using pattern recognition or machine learning
- G06V10/762—Arrangements for image or video recognition or understanding using pattern recognition or machine learning using clustering, e.g. of similar faces in social networks
- G06V10/7625—Hierarchical techniques, i.e. dividing or merging patterns to obtain a tree-like representation; Dendograms
-
- G—PHYSICS
- G01—MEASURING; TESTING
- G01J—MEASUREMENT OF INTENSITY, VELOCITY, SPECTRAL CONTENT, POLARISATION, PHASE OR PULSE CHARACTERISTICS OF INFRARED, VISIBLE OR ULTRAVIOLET LIGHT; COLORIMETRY; RADIATION PYROMETRY
- G01J3/00—Spectrometry; Spectrophotometry; Monochromators; Measuring colours
- G01J3/28—Investigating the spectrum
- G01J2003/283—Investigating the spectrum computer-interfaced
-
- G—PHYSICS
- G06—COMPUTING OR CALCULATING; COUNTING
- G06V—IMAGE OR VIDEO RECOGNITION OR UNDERSTANDING
- G06V10/00—Arrangements for image or video recognition or understanding
- G06V10/40—Extraction of image or video features
- G06V10/58—Extraction of image or video features relating to hyperspectral data
Definitions
- the present disclosure relates generally to hyperspectral imaging and spectroscopy.
- Hyperspectral cameras image a scene in both spatial and spectral dimensions. Unlike conventional color cameras, which have three broad overlapping color channels over the visible band, hyperspectral cameras have hundreds or thousands of narrow contiguous wavelength channels over the range from visible to long-wave infrared. Hyperspectral cameras may capture images that include millions of pixels, each pixel representing a reflected spectrum.
- Hyperspectral imaging has become a core area in the geoscience and remote sensing community.
- new applications in object detection, road surface analysis, autonomous navigation, and automatic target recognition are being explored as the size, weight, power requirements, and cost of hyperspectral imaging cameras are reduced.
- the spectral demixing problem in hyperspectral data analysis is central to determining the composition of material mixtures based on a reflectivity spectrum.
- a measured reflectivity spectrum is normally composed of a mixture of spectra arising from different pure materials, or "endmembers", in the material mixture.
- Spectral demixing is the process of identifying the endmembers in the material mixture and estimating their abundances.
- a method of spectral demixing includes obtaining empirical spectroscopic data representing a plurality of frequencies of electromagnetic energy that has interacted with a specimen, accessing a computer readable representation of a hierarchal spectral cluster tree representing a spectral library, demixing, with data on each of a plurality of levels of the hierarchal spectral cluster tree, foveated spectroscopic data derived from the empirical spectroscopic data, identifying at least one node in the hierarchal spectral cluster tree as corresponding to the empirical spectroscopic data, and outputting an endmember abundance assessment of the specimen corresponding to at least the at least one node.
- the empirical spectroscopic data may represent a plurality of frequencies of electromagnetic energy reflected off of the specimen.
- the empirical spectroscopic data may represent a pixel.
- the hierarchal spectral cluster tree may include a plurality of levels includes at least one terminal level including nodes representing individual endmembers.
- the hierarchal spectral cluster tree may include a plurality of prototype nodes, where a respective prototype node may represent a plurality of endmembers.
- the method may include hierarchical clustering the spectral library.
- the demixing foveated spectroscopic data may include performing foveated compressive projection.
- the demixing foveated spectroscopic data may include sparse reconstruction.
- the method may include using the endmember abundance assessment for at least one of geospatial analysis, target recognition, surveillance, chemical identification, remote sensing, and combinations thereof.
- the outputting may include causing a display in a human readable format.
- a system for spectral demixing includes an interface configured to obtain empirical spectroscopic data representing a plurality of frequencies of electromagnetic energy that has interacted with a specimen, at least one electronic processor communicatively coupled to a computer readable representation of a hierarchal spectral cluster tree representing a spectral library, at least one electronic processor configured to demix, with data on each of a plurality of levels of the hierarchal spectral cluster tree, foveated spectroscopic data derived from the empirical spectroscopic data, at least one electronic processor configured to identify at least one node in the hierarchal spectral cluster tree as corresponding to the empirical spectroscopic data, and at least one electronic processor configured to output an endmember abundance assessment of the specimen corresponding to at least the at least one node.
- the empirical spectroscopic data may represent a plurality of frequencies of electromagnetic energy reflected off of the specimen.
- the empirical spectroscopic data may represent a pixel.
- the hierarchal spectral cluster tree may include a plurality of levels including at least one terminal level including nodes representing individual endmembers.
- the hierarchal spectral cluster tree may include a plurality of prototype nodes, where a respective prototype node represents a plurality of endmembers.
- the system may include at least one electronic processor configured to hierarchically cluster the spectral library.
- the at least one electronic processor configured to demix foveated spectroscopic data may be further configured to perform foveated compressive projection.
- the at least one electronic processor configured to demix foveated spectroscopic data may be further configured to perform sparse reconstruction.
- the system may include at least one electronic processor configured to provide the endmember abundance assessment for at least one of geospatial analysis, target recognition, surveillance, chemical identification, remote sensing, and combinations thereof.
- the at least one electronic processor configured to output may be further configured to cause a display in a human readable format.
- Some examples utilize foveated compressive projection for performing hyperspectral demixing based on a variable resolution, or "foveated", representation of a spectral library of representations of spectra of many different materials organized as a hierarchical tree, combined with nonlinear-compressive-sensing-based sparsity maximization and oversampling.
- Foveated compressive projection allows endmembers to be determined with high accuracy, robustness against noise, and computational efficiency.
- some examples described herein can measure the abundances of endmembers in a hyperspectral mixture without assuming a pure material pixel exists in the data for each endmember and without human guidance, which makes it suitable for automated hyperspectral analysis applications.
- Some examples enable the use of very large spectral libraries and do not require estimation (e.g., by a human) of endmembers from the input data.
- some examples described herein use foveated projections, over-sampling, and a tree-organized multi-resolution spectral library to improve the accuracy and noise robustness of the demixing.
- the combination of tree-based clustering of the spectral library with foveation enables endmembers to be identified very quickly by moving down the best matching branch at each level. This greatly reduces the number of spectral prototypes that have to be examined to make a match, which reduces computational complexity. Reduced computational complexity, in turn, provides for faster processing time for the demixing operation, reduced computer hardware requirements, and reduced power consumption. Further, unlike some prior art demixing approaches, the computational complexity of foveated compressive projection is logarithmic in the size of the spectral library. In addition, in some examples the resolution of the demixing process in abundance space increases as the processing continues. Therefore, if a coarse classification of the mixture components is sufficient, then the processing can be halted before reaching the bottom of the tree (i.e., the terminal tree level), thereby further reducing processing time.
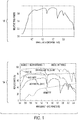
- Fig. 1 schematically depicts example spectra for pure materials and a mixture.
- spectrum graph 102 depicts measured relative intensities of a number of wavelengths of electromagnetic energy.
- the measurements may represent a single pixel from an image taken by a hyperspectral camera consisting of thousands or millions (or more) of pixels.
- materials have characteristic reflectivity variations across wavelengths, which can be used for remote measurement of a scene's composition.
- a pixel will cover an area with multiple materials or endmembers, which results in an additive mixture of spectra.
- the objective of the hyperspectral demixing problem is to estimate the endmember abundances from a single measured mixture of spectra.
- Graph 104 graphically depicts a number of spectra that, when additively combined, form the spectrum of a material sample as depicted in graph 102. Thus, graph 104 depicts hyperspectral demixing applied to the sample's spectrum depicted in graph 102.
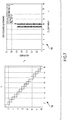
- Fig. 2 schematically depicts a spectral library in two ways.
- Fig. 2 depicts an example spectral library in terms of shading as an indication of amplitude in matrix 202 and in terms of component spectra 204.
- the measured spectrum vector x for a pixel can be modeled as a linear mixture of N endmember (pure material) spectra contained in a spectral library represented by matrix ⁇ .
- a discussion of the hyperspectral mixing problem in terms of such a spectral library follows.
- the hyperspectral demixing problem can be formalized in part using Equation 1, by way of non-limiting example, below.
- Equation 1 ⁇ ⁇
- Equation 1 the symbol x represents a measured Qx1 spectrum vector, the symbol ⁇ represents the Nx1 endmember abundance vector to be solved for, and the symbol ⁇ represents a spectral library formalized in matrix form.
- x is modeled as a mixture of endmembers with mixing coefficients from ⁇ .
- a goal of hyperspectral demixing is to estimate ⁇ , given x and ⁇ .
- the hyperspectral demixing problem is made difficult by the need to have a large spectral library, the similarity of many spectra, and noise in the measured spectrum.
- the number of different materials covered by a pixel is usually small, so ⁇ may be sparse and the number K of nonzero ⁇ elements may be small relative to N. This means a least squares solution using a pseudo-inverse of ⁇ will have many false detections and low accuracy.
- Compressive sensing has been developed as a method for reducing the number of physical sensors or pixels needed in a camera or other sensing hardware without reducing the output data resolution by taking advantage of sparsity in the physical signal being sensed in some representation domain. In other words, it utilizes the sparse structure of the signal. To date, its usage in hyperspectral imaging has been limited to the design and construction of new optical hardware with reduced sensor counts.
- technology from the field of compressive sensing is used to improve sparsity-based demixing by reducing the mutual coherence of ⁇ using a known M xQ random measurement matrix A that multiplies x to form an M x1 measurement vector y .
- Compressive sensing techniques can then be used to estimate ⁇ using the L1 norm and least squares error minimization according to, by way of non-limiting example, Equations 2 and 3 below.
- Compressive sensing techniques have shown that a lower bound for the number of measurements M needed to estimate ⁇ is given by Equation (4), for example, below.
- Equation 4 the term K represents the number of nonzero elements in the N x1 vector ⁇ (a measure of sparsity), ⁇ is a small constant, and the mutual coherence function ⁇ is specified by Equation 5, by way of non-limiting example, below.
- ⁇ A ⁇ N max i , j ⁇ A i , ⁇ j ⁇
- Equation 5 the term
- Fig. 3 schematically depicts a spectral library arranged as a hierarchal spectral cluster tree according to some examples.
- each cluster e.g., 302
- b 3 branches.
- the branching may be different for each cluster and will depend on the library structure. The more independent or less overlapping the paths, the more parallelization is possible for implementations.
- Each cluster above the final level represents a spectral prototype.
- a cluster at Level L is composed of subclusters from Level L -1.
- Each prototype cluster can be an average (e.g., mean or median) of its constituent subclusters.
- clusters are formed as convex hulls enclosing their constituent subclusters. Other clustering algorithms may be employed in the alternative.
- the mixture spectrum is modeled with increasing accuracy along each tree branch.
- reducing the mutual coherence ⁇ in order to reduce the bound on M can be achieved not only by reducing ⁇ A i , ⁇ j > through proper choice of A for a given ⁇ , but also by reducing N, the size of the abundance vector ⁇ .
- Pursuing this approach naively would reduce the number of endmembers in the spectral library.
- N can be reduced without reducing the number of endmembers that can be detected.
- some examples proceed down the levels of a hierarchal spectral cluster tree and perform demixing and identification of cluster prototypes at each level using foveated compressive projections and sparse reconstruction methods, e.g., according to Equations 2-5.
- the identification of subcluster prototypes in a cluster at one level as corresponding to a measured spectrum determines which branches of the tree to proceed down to perform the next level of demixing. This process may continue until the bottom endmember level of the tree (e.g., the level of the "leaves") is reached, or until sufficient accuracy is obtained.
- proceeding to terminal nodes will result in following K tree branches, where K is the number of endmembers in the mixture.
- Using a hierarchal spectral cluster tree as depicted in Fig. 3 has many advantages.
- the computational complexity for solving the hyperspectral demixing problem using such a tree is logarithmic in the spectral library size N, due to the tree search structure. Proceeding down the tree and solving smaller demixing problems at each level is orders of magnitude less complex than solving a single large demixing problem without foveation.
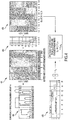
- Fig. 4 depicts an example usage of a foveation matrix according to some examples.
- Foveation e.g. reduction of N to a smaller number N C by organizing both the spectral library and the corresponding coefficients in the abundance vector into multiple hierarchical clusters
- F F C T F C (406, 410)
- F C (410) operates on the abundance vector ⁇ (412) to form ⁇ c and reduce its size from N ⁇ 1 to N C ⁇ 1 by grouping and adding rows.
- F C T (406) performs a similar operation on the columns of the endmember library ⁇ (404), forming ⁇ C (408) and reducing its size from Q x N to Q ⁇ N C .
- the form of F (406, 410) and value of N C is determined using hierarchical tree clustering of ⁇ , as illustrated by the dendrogram 402, which groups endmembers into clusters and clusters into bigger clusters on higher levels of the tree.
- Each cluster in a level is represented by a prototype spectrum, which may be an average or other function of the spectra in the cluster.
- the prototypes form the columns of ⁇ C .
- Each level of clustering is represented by its own ⁇ C and ⁇ c . In general, any known clustering technique may be used.
- a hyperspectral demixing process includes proceeding down the levels of the tree and performing demixing and identification of cluster prototypes at each level using compressive projections and sparse reconstruction methods.
- the identification of prototypes in the mixture at one level determines which branches of the tree to proceed down to perform the next level of demixing.
- the resolution of the spectral mixture model in endmember space increases at each lower level, but the resolution in wavelength stays constant. It is possible that more than one cluster will be selected in a level, depending on the similarity of the endmember spectra in the mixture. This will lead to more than one demixing process in each of the subsequent levels.
- the process may proceed with increasing mixture modeling accuracy until the bottom endmember level of the tree is reached.
- This multiresolution process can be stopped before the bottom is reached if high discrimination between endmembers is not required and identification of endmember classes or categories is sufficient, which will further reduce the computational complexity.
- the computational complexity of proceeding down the tree and solving small demixing problems at each level is logarithmic in the spectral library size and orders of magnitude less than solving a single large demixing problem without foveation.
- y c is the measured projection vector and ⁇ represents sensor noise.
- M C ⁇ ⁇ C 2 A ⁇ C K log N C ⁇ C A ⁇ F C N C max i , j ⁇ A i , ⁇ F C ⁇
- Equation 10 makes use of the observation depicted by Equation 11, below.
- foveation can be used not only to reduce N, but also to increase the range of M over which the foveated compressive projection reconstruction is stable.
- Fig. 5 is a flow diagram illustrating a method according to some examples. The method of Fig. 5 may be implemented all or partially in a properly configured computing apparatus.
- the method obtains empirical spectroscopic data.
- the spectroscopic data may be obtained, by way of non-limiting examples, by measurement using appropriate sensors and optical elements, by retrieval from electronic storage (e.g., of previously measured data), or by acquisition over an electronic network (e.g., of previously measured data).
- the method may obtain the data by electronic transmission, for example.
- the spectroscopic data may have been previously acquired by any conventional technique for acquiring spectroscopic data, e.g., using appropriate sensors coupled to classical Newtonian optics, such as a microscope, telescope, or other optical lens arrangement.
- the spectroscopic data may represent a plurality of frequencies and associated amplitudes, which may be relative. More particularly, the spectroscopic data may represent measured electromagnetic energy that has been reflected by, fluoresced from, or undergone any other type of interaction with a specimen suitable for spectroscopy purposes.
- the method accesses a hierarchal spectral cluster tree.
- the accessing may be accessing electronically, and the hierarchal spectral cluster tree may represent a spectral library of stored spectra for many different materials, as described in detail herein in reference to Figs. 2-4 , for example.
- the method performs demixing of foveated spectroscopic data at at least one level of the hierarchal spectral cluster tree.
- the techniques of this block may be performed as described herein in reference to Figs. 3 and 4 , for example.
- the actions of block 506 may include foveated compressive projection and/or sparse reconstruction as described in detail herein, e.g., in reference to Figs. 3 and 4 .
- the method determines whether to stop traversing the branches of the hierarchal spectral cluster tree. According to some examples, the method may terminate on or before one or more branches of the hierarchal spectral cluster tree are traversed to the end (leaf) nodes. Alternately, or in addition, the method may terminate prior to the level of the leaf nodes if a user determines that the current results are sufficiently accurate. If the method continues at block 512, control passes back to block 506. Otherwise, control passes to block 514.
- the method identifies at least one node in the hierarchal spectral cluster tree.
- the identified node may correspond to the closest matching node traversed by the method at this point.
- the method outputs an endmember abundance assessment.
- the endmember abundance assessment may be based on the identified node of block 514.
- the endmember abundance assessment may be in human-readable format, e.g., with spectra replaced by chemical descriptions.
- the output may be in any of a variety of forms, e.g., output to a computer monitor, output to a video processor, output to a targeting mechanism, etc.
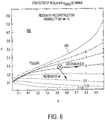
- Fig. 6 illustrates the effects of foveation on compressive sensing reconstruction stability and accuracy according to some examples.
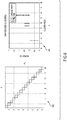
- Fig. 6 shows contours of the minimax noise sensitivity M* ( ⁇ , ⁇ ) in the ( ⁇ , ⁇ ) phase plane 602.
- the demixing noise or error is equal to M * times the noise in the measured mixture.
- Dotted curve 604 marks the phase boundary ( ⁇ , ⁇ MSE ( ⁇ )). Above this curve, M* ( ⁇ , ⁇ ) approaches infinity and reconstruction (e.g., demixing) will fail.
- the colored lines represent contour lines of M* ( ⁇ , ⁇ ).
- Increasing the number of projections (measurements) M reduces ⁇ and increases ⁇ , which improves the demixing accuracy by moving the previous operating point down the gradient of M *.
- Foveation provides an additional degree of freedom for shifting the operating point in phase space in order to, e.g., ensure the stability of the demixing.
- some examples cluster spectra in the library ⁇ according to similarity using hierarchical tree clustering and perform a multi-resolution tree-based search to find the endmember abundances using a separate sparse reconstruction step at each level of the tree. Since N is reduced at each level, the reconstruction accuracy is improved at each level. The total number of operations across the levels will be much smaller and the final accuracy higher than would be the case if a single reconstruction with large N that searches across all endmember simultaneously were performed. This observation is illustrated using an example demixing problem as shown and described in reference to Figs. 7-10 below.
- the computations complexity of some examples will, in general, depend in part on the form of the library tree and how the endmembers are clustered.
- the computational complexity according to some examples is logarithmic in the size N E of the spectral library ⁇ .
- N E b L
- the complexity of examples employing foveated compressive projection is O (LK 2 b 2 ) and the complexity of compressive sensing is O (K b 2L ).
- Figs. 7-10 depict various test cases comparing prior art techniques to various examples. These figures utilize data represented by Fig. 2 .
- the N 16 mineral spectra from the collection depicted by Fig. 2 were used to form a spectral library ⁇ to test various examples and contrast with prior art techniques.
- the abundances ⁇ were estimated using publicly available compressive sensing code.
- Fig. 7 the compressive sensing result for F equal to the N x N identity matrix (702), i.e., with no foveation, are shown.
- M 13 projections with 5% noise
- compressive sensing (704) had an error of 6.31%, while the pseudo-inverse error was 634%.
- the pseudo-inverse generated false alarms or nonzero values for endmembers not in the mixture.
- Compressive sensing without foveation had no false alarms.
- the MATLAB's CoSamp running time was 7.5 msec.
- Fig. 8 depicts results for an input spectrum consisting of endmembers not in the library.
- F (802) is the identity matrix because there is no foveation.
- the measurement noise value was 5%.
- the compressive sensing residual was 10.1, an indication that compressive sensing could not converge due to the spectrum not being in the library. Thus, when the input spectrum consisted of endmembers not in the library, this could be detected from the large value of the residual error in reconstructing the measured spectrum 804.
- Fig. 9 depicts example results 904, 906 for foveation in Cluster Level 1.
- Foveated compressive sensing successfully detected that the mixture endmembers are in Cluster 2 with zero abundances for the other clusters.
- the foveated compressive sensing error was 6.0% while the pseudo-inverse error was 115%.
- F (902) was used to foveate on the Cluster 2 that was determined in Cluster Level 1 to contain the mixture endmembers.
- Foveated compressive sensing successfully detected the correct two endmembers in the second cluster with zero abundances for the other three endmembers in the cluster.
- the pseudo-inverse generated nonzero abundances (false alarms) for all five endmembers.
- the foveated compressive sensing error was 5.9% while the pseudo-inverse error was 143%.
- Fig. 10 depicts the same test case as in Fig. 9 , but with F (1002) modified to foveate on the second cluster with higher resolution. Results 1004, 1006 are depicted.
- Cluster 2 was determined to contain the endmembers in Cluster Level 1.
- Foveated compressive projection successfully demixed the two endmembers in Cluster 2 with no false alarms.
- the foveated compressive projection error was 0.16%, while the pseudo-inverse error was 143%. Note the improved accuracy of reconstruction relative to Cluster Level 1 in Fig. 9 .
- Table below summarizes the results for the test problem described herein in reference to Figs. 7-10 .
- Foveated compressive projection achieved noise-limited accuracy in determining the mixture endmember abundances and in accurately modeling the input spectrum.
- the foveated compressive projection demixing error was reduced by 2.25 times and the number of operations was reduced by 3.85 times relative to compressive sensing.
- the foveated compressive projection demixing error of 0.16% was virtually equal to the oracle demixer, which had pre-knowledge of which endmembers are in the data and simply did a least squares fit to determine their abundances.
- Fig. 11 depicts a system according to some examples.
- apparatus 1106 can include a processor 1110 coupled to a random access memory operating under control of or in conjunction with an operating system.
- the processor 1110 in examples can be incorporated in one or more servers, clusters, or other computers or hardware resources, or can be implemented using cloud-based resources.
- Processor 1110 can communicate with the data store 1112, such as a database stored on a local hard drive or drive array, to access or store data.
- Processor 1110 can further communicate with a network interface 1108, such as an Ethernet or wireless data connection, which in turn communicates with the one or more networks 1104, such as the Internet or other public or private networks, via which spectroscopic data can be obtained from spectroscopic data acquisition device 1102.
- Device 1102 may be, for example, a spectroscope, a stand-off detector, a targeting system, or a remote or local persistent or dynamic storage device.
- Processor 1110 is further coupled to math co-processor 1114, which can parallelize operations as described herein.
- Processor 1110 can, in general, be programmed or configured to execute control logic and control demixing operations. Other configurations of apparatus 1106, associated network connections, and other hardware, software, and resources are possible.
- Hierarchical clustering may be performed on the spectral library, and the resulting tree may be organized into a decision tree with multiple levels. Each cluster in a level may represent subcluster prototypes from the previous layer. The same clustering may be performed on both the library and the mixture endmember abundances using foveation operators F C T and F C .
- Foveated compressive projection and sparse reconstruction may be performed at each level of the tree to reconstruct and model the mixture spectrum with increasing accuracy as the tree is traversed from top to bottom until the endmembers and their abundances are determined. Oversampling, or using a larger number of projections than there are members of the cluster, may increase the accuracy of the demixing in the presence of noise.
- the prototypes selected at each level may determine how the tree is traversed in order to determine the endmembers in the mixture and their abundances.
- the tree clustering and foveation greatly reduces the overall computational complexity and improves scaling for large libraries by using multiple small sparse reconstructions arranged in a decision tree instead of performing one large reconstruction.
- examples are not limited to specific spectra of portions of the spectrum. Thus, some examples perform spectral demixing using foveated compressive projections. Some examples perform hyperspectral demixing using foveated compressive projections.
- the computer program can exist in a variety of forms, both active and inactive.
- the computer program can exist as one or more software programs, software modules, or both, that can be comprised of program instructions in source code, object code, executable code or other formats, firmware program(s), or hardware description language (HDL) files.
- Any of the above can be embodied on a computer readable medium, which can include computer readable storage devices and media in compressed or uncompressed form.
- Exemplary computer readable storage devices and media include conventional computer system RAM (random access memory), ROM (read-only memory), EPROM (erasable, programmable ROM), EEPROM (electrically erasable, programmable ROM), and magnetic or optical disks or tapes.
- RAM random access memory
- ROM read-only memory
- EPROM erasable, programmable ROM
- EEPROM electrically erasable, programmable ROM
Landscapes
- Engineering & Computer Science (AREA)
- Theoretical Computer Science (AREA)
- Physics & Mathematics (AREA)
- General Physics & Mathematics (AREA)
- Data Mining & Analysis (AREA)
- Artificial Intelligence (AREA)
- Evolutionary Computation (AREA)
- General Health & Medical Sciences (AREA)
- Health & Medical Sciences (AREA)
- Life Sciences & Earth Sciences (AREA)
- Multimedia (AREA)
- Computer Vision & Pattern Recognition (AREA)
- Spectroscopy & Molecular Physics (AREA)
- Computing Systems (AREA)
- Software Systems (AREA)
- Biomedical Technology (AREA)
- Molecular Biology (AREA)
- Databases & Information Systems (AREA)
- Medical Informatics (AREA)
- Bioinformatics & Cheminformatics (AREA)
- Bioinformatics & Computational Biology (AREA)
- Evolutionary Biology (AREA)
- General Engineering & Computer Science (AREA)
- Investigating Or Analysing Materials By Optical Means (AREA)
Abstract
Description
- The present disclosure relates generally to hyperspectral imaging and spectroscopy.
- Hyperspectral cameras image a scene in both spatial and spectral dimensions. Unlike conventional color cameras, which have three broad overlapping color channels over the visible band, hyperspectral cameras have hundreds or thousands of narrow contiguous wavelength channels over the range from visible to long-wave infrared. Hyperspectral cameras may capture images that include millions of pixels, each pixel representing a reflected spectrum.
- Hyperspectral imaging has become a core area in the geoscience and remote sensing community. In addition, new applications in object detection, road surface analysis, autonomous navigation, and automatic target recognition are being explored as the size, weight, power requirements, and cost of hyperspectral imaging cameras are reduced.
- The spectral demixing problem in hyperspectral data analysis is central to determining the composition of material mixtures based on a reflectivity spectrum. A measured reflectivity spectrum is normally composed of a mixture of spectra arising from different pure materials, or "endmembers", in the material mixture. Spectral demixing is the process of identifying the endmembers in the material mixture and estimating their abundances.
- According to various examples, a method of spectral demixing is disclosed. The method includes obtaining empirical spectroscopic data representing a plurality of frequencies of electromagnetic energy that has interacted with a specimen, accessing a computer readable representation of a hierarchal spectral cluster tree representing a spectral library, demixing, with data on each of a plurality of levels of the hierarchal spectral cluster tree, foveated spectroscopic data derived from the empirical spectroscopic data, identifying at least one node in the hierarchal spectral cluster tree as corresponding to the empirical spectroscopic data, and outputting an endmember abundance assessment of the specimen corresponding to at least the at least one node.
- Various optional features of the above method examples include the following. The empirical spectroscopic data may represent a plurality of frequencies of electromagnetic energy reflected off of the specimen. The empirical spectroscopic data may represent a pixel. The hierarchal spectral cluster tree may include a plurality of levels includes at least one terminal level including nodes representing individual endmembers. The hierarchal spectral cluster tree may include a plurality of prototype nodes, where a respective prototype node may represent a plurality of endmembers. The method may include hierarchical clustering the spectral library. The demixing foveated spectroscopic data may include performing foveated compressive projection. The demixing foveated spectroscopic data may include sparse reconstruction. The method may include using the endmember abundance assessment for at least one of geospatial analysis, target recognition, surveillance, chemical identification, remote sensing, and combinations thereof. The outputting may include causing a display in a human readable format.
- According to various examples, a system for spectral demixing is disclosed. The system includes an interface configured to obtain empirical spectroscopic data representing a plurality of frequencies of electromagnetic energy that has interacted with a specimen, at least one electronic processor communicatively coupled to a computer readable representation of a hierarchal spectral cluster tree representing a spectral library, at least one electronic processor configured to demix, with data on each of a plurality of levels of the hierarchal spectral cluster tree, foveated spectroscopic data derived from the empirical spectroscopic data, at least one electronic processor configured to identify at least one node in the hierarchal spectral cluster tree as corresponding to the empirical spectroscopic data, and at least one electronic processor configured to output an endmember abundance assessment of the specimen corresponding to at least the at least one node.
- Various optional features of the above system examples include the following. The empirical spectroscopic data may represent a plurality of frequencies of electromagnetic energy reflected off of the specimen. The empirical spectroscopic data may represent a pixel. The hierarchal spectral cluster tree may include a plurality of levels including at least one terminal level including nodes representing individual endmembers. The hierarchal spectral cluster tree may include a plurality of prototype nodes, where a respective prototype node represents a plurality of endmembers. The system may include at least one electronic processor configured to hierarchically cluster the spectral library. The at least one electronic processor configured to demix foveated spectroscopic data may be further configured to perform foveated compressive projection. The at least one electronic processor configured to demix foveated spectroscopic data may be further configured to perform sparse reconstruction. The system may include at least one electronic processor configured to provide the endmember abundance assessment for at least one of geospatial analysis, target recognition, surveillance, chemical identification, remote sensing, and combinations thereof. The at least one electronic processor configured to output may be further configured to cause a display in a human readable format.
- Various features of the present disclosure can be more fully appreciated, as the examples become better understood with reference to the following detailed description, when considered in connection with the accompanying figures, in which:
-
Fig. 1 schematically depicts example spectra for pure materials and a mixture; -
Fig. 2 schematically depicts a spectral library in two ways; -
Fig. 3 schematically depicts a spectral library arranged as a spectral cluster tree according to some examples; -
Fig. 4 depicts a usage of a foveation matrix according to some examples; -
Fig. 5 is a flow diagram illustrating a method according to some examples; -
Fig. 6 illustrates the effects of foveation on compressive sensing reconstruction stability and accuracy according to some examples; -
Figs. 7-10 depict various test cases comparing prior art techniques to various examples; and -
Fig. 11 depicts a system according to some examples. - Reference will now be made in detail to the present examples of the present disclosure, examples of which are illustrated in the accompanying drawings. Wherever possible, the same reference numbers will be used throughout the drawings to refer to the same or like parts. In the following description, reference is made to the accompanying drawings that form a part thereof, and in which is shown by way of illustration specific exemplary implementations. These examples are described in sufficient detail to enable those skilled in the art to practice the disclosed subject matter and it is to be understood that other examples may be utilized and that changes may be made without departing from the scope of the present disclosure. The following description is, therefore, merely exemplary.
- Some examples utilize foveated compressive projection for performing hyperspectral demixing based on a variable resolution, or "foveated", representation of a spectral library of representations of spectra of many different materials organized as a hierarchical tree, combined with nonlinear-compressive-sensing-based sparsity maximization and oversampling. Foveated compressive projection allows endmembers to be determined with high accuracy, robustness against noise, and computational efficiency.
- Unlike certain prior art linear and heuristic demixing methods, some examples described herein can measure the abundances of endmembers in a hyperspectral mixture without assuming a pure material pixel exists in the data for each endmember and without human guidance, which makes it suitable for automated hyperspectral analysis applications. Some examples enable the use of very large spectral libraries and do not require estimation (e.g., by a human) of endmembers from the input data. Unlike prior art sparsity-based methods, some examples described herein use foveated projections, over-sampling, and a tree-organized multi-resolution spectral library to improve the accuracy and noise robustness of the demixing. In addition, the combination of tree-based clustering of the spectral library with foveation enables endmembers to be identified very quickly by moving down the best matching branch at each level. This greatly reduces the number of spectral prototypes that have to be examined to make a match, which reduces computational complexity. Reduced computational complexity, in turn, provides for faster processing time for the demixing operation, reduced computer hardware requirements, and reduced power consumption. Further, unlike some prior art demixing approaches, the computational complexity of foveated compressive projection is logarithmic in the size of the spectral library. In addition, in some examples the resolution of the demixing process in abundance space increases as the processing continues. Therefore, if a coarse classification of the mixture components is sufficient, then the processing can be halted before reaching the bottom of the tree (i.e., the terminal tree level), thereby further reducing processing time.
-
Fig. 1 schematically depicts example spectra for pure materials and a mixture. In particular,spectrum graph 102 depicts measured relative intensities of a number of wavelengths of electromagnetic energy. The measurements may represent a single pixel from an image taken by a hyperspectral camera consisting of thousands or millions (or more) of pixels. In general, materials have characteristic reflectivity variations across wavelengths, which can be used for remote measurement of a scene's composition. - In many cases, a pixel will cover an area with multiple materials or endmembers, which results in an additive mixture of spectra. The objective of the hyperspectral demixing problem is to estimate the endmember abundances from a single measured mixture of spectra.
Graph 104 graphically depicts a number of spectra that, when additively combined, form the spectrum of a material sample as depicted ingraph 102. Thus,graph 104 depicts hyperspectral demixing applied to the sample's spectrum depicted ingraph 102. -
Fig. 2 schematically depicts a spectral library in two ways. In particular,Fig. 2 depicts an example spectral library in terms of shading as an indication of amplitude in matrix 202 and in terms ofcomponent spectra 204. As shown inFig. 2 , the measured spectrum vector x for a pixel can be modeled as a linear mixture of N endmember (pure material) spectra contained in a spectral library represented by matrix Φ. The example spectral library Φ is formed using N=16 mineral spectra endmembers. The N columns of Φ consist of the endmember spectra and the Q rows represent the wavelength channels, where Q=480 in this example. A discussion of the hyperspectral mixing problem in terms of such a spectral library follows. - The hyperspectral demixing problem can be formalized in
part using Equation 1, by way of non-limiting example, below.
- In
Equation 1, the symbol x represents a measured Qx1 spectrum vector, the symbol α represents the Nx1 endmember abundance vector to be solved for, and the symbol Φ represents a spectral library formalized in matrix form. In terms ofEquation 1, x is modeled as a mixture of endmembers with mixing coefficients from α. In terms of these conventions, a goal of hyperspectral demixing is to estimate α, given x and Φ. - The hyperspectral demixing problem is made difficult by the need to have a large spectral library, the similarity of many spectra, and noise in the measured spectrum. In addition, the number of different materials covered by a pixel is usually small, so α may be sparse and the number K of nonzero α elements may be small relative to N. This means a least squares solution using a pseudo-inverse of Φ will have many false detections and low accuracy.
- Compressive sensing has been developed as a method for reducing the number of physical sensors or pixels needed in a camera or other sensing hardware without reducing the output data resolution by taking advantage of sparsity in the physical signal being sensed in some representation domain. In other words, it utilizes the sparse structure of the signal. To date, its usage in hyperspectral imaging has been limited to the design and construction of new optical hardware with reduced sensor counts.
- According to some examples, technology from the field of compressive sensing is used to improve sparsity-based demixing by reducing the mutual coherence of Φ using a known MxQ random measurement matrix A that multiplies x to form an Mx1 measurement vector y. Compressive sensing techniques can then be used to estimate α using the L1 norm and least squares error minimization according to, by way of non-limiting example,
Equations 

- In Equations (2) and (3) above, the noise term ξ = Aζ takes into account the measurement noise ζ in the original sensor data. Compressive sensing techniques have shown that a lower bound for the number of measurements M needed to estimate α is given by Equation (4), for example, below.

- In
Equation 4 above, the term K represents the number of nonzero elements in the Nx1 vector α (a measure of sparsity), γ is a small constant, and the mutual coherence function µ is specified byEquation 5, by way of non-limiting example, below.
- In
Equation 5 above, the term |〈Ai , Φ j 〉| is the inner product between row i of A and column j of Φ. According to some examples, the number of measurements required for successful convergence and estimation of α can therefore be reduced by reducing the coherence µ between A and Φ. Random A matrices have been found to be a general purpose solution for reducing µ. Further, known methods exist for adapting A to the library Φ to further reduce M for specialized applications. -
Fig. 3 schematically depicts a spectral library arranged as a hierarchal spectral cluster tree according to some examples. For simplicity, each cluster (e.g., 302) is depicted with b=3 branches. However, in general, the branching may be different for each cluster and will depend on the library structure. The more independent or less overlapping the paths, the more parallelization is possible for implementations. - Each cluster above the final level represents a spectral prototype. In general, a cluster at Level L is composed of subclusters from Level L-1. Each prototype cluster can be an average (e.g., mean or median) of its constituent subclusters. Alternately, according to some examples, clusters are formed as convex hulls enclosing their constituent subclusters. Other clustering algorithms may be employed in the alternative. Thus, the mixture spectrum is modeled with increasing accuracy along each tree branch.
- In general, reducing the mutual coherence µ in order to reduce the bound on M (and therefore improve reconstruction stability, noise robustness, and accuracy) can be achieved not only by reducing <A i,Φj> through proper choice of A for a given Φ, but also by reducing N, the size of the abundance vector α. Pursuing this approach naively would reduce the number of endmembers in the spectral library. However, by using foveation or multi-level resolution in both α and Φ, and by clustering the library endmembers in a hierarchical tree structure based on their similarity as shown in
Fig. 3 and as is done in some examples, N can be reduced without reducing the number of endmembers that can be detected. - In general, some examples proceed down the levels of a hierarchal spectral cluster tree and perform demixing and identification of cluster prototypes at each level using foveated compressive projections and sparse reconstruction methods, e.g., according to Equations 2-5. The identification of subcluster prototypes in a cluster at one level as corresponding to a measured spectrum determines which branches of the tree to proceed down to perform the next level of demixing. This process may continue until the bottom endmember level of the tree (e.g., the level of the "leaves") is reached, or until sufficient accuracy is obtained. In general, proceeding to terminal nodes will result in following K tree branches, where K is the number of endmembers in the mixture.
- Using a hierarchal spectral cluster tree as depicted in
Fig. 3 has many advantages. The computational complexity for solving the hyperspectral demixing problem using such a tree is logarithmic in the spectral library size N, due to the tree search structure. Proceeding down the tree and solving smaller demixing problems at each level is orders of magnitude less complex than solving a single large demixing problem without foveation. -
Fig. 4 depicts an example usage of a foveation matrix according to some examples. Foveation, e.g. reduction of N to a smaller number NC by organizing both the spectral library and the corresponding coefficients in the abundance vector into multiple hierarchical clusters, can be implemented adaptively by modifying α (412) and Φ (402) using the separable foveation matrix operator F=FC TFC (406, 410) as shown inFig. 4 . In particular,Fig. 4 schematically illustrates how the N×N foveation operator F=FC TFC (406, 410) implements hierarchical clustering and foveation in both the spectral library and the endmember abundances. FC (410) operates on the abundance vector α (412) to form αc and reduce its size from N×1 to NC ×1 by grouping and adding rows. Likewise, FC T (406) performs a similar operation on the columns of the endmember library Φ (404), forming ΦC (408) and reducing its size from QxN to Q×NC . - The form of F (406, 410) and value of NC is determined using hierarchical tree clustering of Φ, as illustrated by the
dendrogram 402, which groups endmembers into clusters and clusters into bigger clusters on higher levels of the tree. Each cluster in a level is represented by a prototype spectrum, which may be an average or other function of the spectra in the cluster. The prototypes form the clustered library Φ C =ΦFC T. In this example for one level of the tree, F implements a clustering of α and Φ with N=16 into NC =5 clusters. The prototypes form the columns of ΦC. Each level of clustering is represented by its own ΦC and αc. In general, any known clustering technique may be used. - A hyperspectral demixing process according to some examples includes proceeding down the levels of the tree and performing demixing and identification of cluster prototypes at each level using compressive projections and sparse reconstruction methods. The identification of prototypes in the mixture at one level determines which branches of the tree to proceed down to perform the next level of demixing. The resolution of the spectral mixture model in endmember space increases at each lower level, but the resolution in wavelength stays constant. It is possible that more than one cluster will be selected in a level, depending on the similarity of the endmember spectra in the mixture. This will lead to more than one demixing process in each of the subsequent levels. The process may proceed with increasing mixture modeling accuracy until the bottom endmember level of the tree is reached. This multiresolution process can be stopped before the bottom is reached if high discrimination between endmembers is not required and identification of endmember classes or categories is sufficient, which will further reduce the computational complexity. The computational complexity of proceeding down the tree and solving small demixing problems at each level is logarithmic in the spectral library size and orders of magnitude less than solving a single large demixing problem without foveation.
- An example algorithm for reconstructing the foveated abundance vector αc is given by the following equations, by way of non-limiting example.


- In the above equations, yc is is the measured projection vector and ξ represents sensor noise. The reduced lower bound on the number of measurements MC required for reconstructing α c is given by the following equations, by way of non-limiting example.


- The reduction factor of MC compared with M is given, by way of non-limiting example, as follows.

- Note that
Equation 10 makes use of the observation depicted byEquation 11, below.
- Thus, foveation can be used not only to reduce N, but also to increase the range of M over which the foveated compressive projection reconstruction is stable.
-
Fig. 5 is a flow diagram illustrating a method according to some examples. The method ofFig. 5 may be implemented all or partially in a properly configured computing apparatus. - At
block 502, the method obtains empirical spectroscopic data. The spectroscopic data may be obtained, by way of non-limiting examples, by measurement using appropriate sensors and optical elements, by retrieval from electronic storage (e.g., of previously measured data), or by acquisition over an electronic network (e.g., of previously measured data). Thus, the method may obtain the data by electronic transmission, for example. The spectroscopic data may have been previously acquired by any conventional technique for acquiring spectroscopic data, e.g., using appropriate sensors coupled to classical Newtonian optics, such as a microscope, telescope, or other optical lens arrangement. The spectroscopic data may represent a plurality of frequencies and associated amplitudes, which may be relative. More particularly, the spectroscopic data may represent measured electromagnetic energy that has been reflected by, fluoresced from, or undergone any other type of interaction with a specimen suitable for spectroscopy purposes. - At
block 504, the method accesses a hierarchal spectral cluster tree. The accessing may be accessing electronically, and the hierarchal spectral cluster tree may represent a spectral library of stored spectra for many different materials, as described in detail herein in reference toFigs. 2-4 , for example. - At
block 506, the method performs demixing of foveated spectroscopic data at at least one level of the hierarchal spectral cluster tree. The techniques of this block may be performed as described herein in reference toFigs. 3 and4 , for example. The actions ofblock 506 may include foveated compressive projection and/or sparse reconstruction as described in detail herein, e.g., in reference toFigs. 3 and4 . - At
block 512, the method determines whether to stop traversing the branches of the hierarchal spectral cluster tree. According to some examples, the method may terminate on or before one or more branches of the hierarchal spectral cluster tree are traversed to the end (leaf) nodes. Alternately, or in addition, the method may terminate prior to the level of the leaf nodes if a user determines that the current results are sufficiently accurate. If the method continues atblock 512, control passes back to block 506. Otherwise, control passes to block 514. - At
block 514, the method identifies at least one node in the hierarchal spectral cluster tree. The identified node may correspond to the closest matching node traversed by the method at this point. - At
block 516, the method outputs an endmember abundance assessment. The endmember abundance assessment may be based on the identified node ofblock 514. The endmember abundance assessment may be in human-readable format, e.g., with spectra replaced by chemical descriptions. The output may be in any of a variety of forms, e.g., output to a computer monitor, output to a video processor, output to a targeting mechanism, etc. -
Fig. 6 illustrates the effects of foveation on compressive sensing reconstruction stability and accuracy according to some examples. In particular,Fig. 6 shows contours of the minimax noise sensitivity M*(δ,ρ) in the (δ,ρ)phase plane 602. The term δ=M/N is the subsampling rate and ρ=K/M is the sparsity. (M* should not be confused with the number of measurements M.) On average, the demixing noise or error is equal to M* times the noise in the measured mixture.Dotted curve 604 marks the phase boundary (δ,ρ MSE(δ)). Above this curve, M*(δ,ρ) approaches infinity and reconstruction (e.g., demixing) will fail. The colored lines represent contour lines of M*(δ,ρ). Increasing the number of projections (measurements) M reduces ρ and increases δ, which improves the demixing accuracy by moving the previous operating point down the gradient of M*. Foveation provides an additional degree of freedom for shifting the operating point in phase space in order to, e.g., ensure the stability of the demixing. - Thus, some examples cluster spectra in the library Φ according to similarity using hierarchical tree clustering and perform a multi-resolution tree-based search to find the endmember abundances using a separate sparse reconstruction step at each level of the tree. Since N is reduced at each level, the reconstruction accuracy is improved at each level. The total number of operations across the levels will be much smaller and the final accuracy higher than would be the case if a single reconstruction with large N that searches across all endmember simultaneously were performed. This observation is illustrated using an example demixing problem as shown and described in reference to
Figs. 7-10 below. - The computations complexity of some examples will, in general, depend in part on the form of the library tree and how the endmembers are clustered. An upper bound on the computational complexity can be estimated by making worst-case assumptions (e.g., maximal branching at each node, all branches reach the terminal level) about the spectral library cluster tree and the paths down the tree. Toward such an estimate, assume for simplicity that all clusters have b branches and the paths to the K mixture endmembers do not overlap. Then the number of endmember candidates (library size) at the bottom of the tree is N=NE=b L, where L is the number of levels, and such examples must solve KL=Klog(NE)/log(b) demixing problems, each with N=NC=b. Therefore the computational complexity according to some examples is logarithmic in the size NE of the spectral library Φ. In the case of compressive sensing without foveation or tree-based clustering, an example would need to perform one large sparse reconstruction with N=NE=b L. Using MATLAB's CoSamp algorithm for sparse reconstruction, which has complexity of O(KMN) where K is the number of endmembers in the mixture, and assuming M=N, the complexity of examples employing foveated compressive projection is O(LK2 b 2) and the complexity of compressive sensing is O(Kb 2L). Therefore, the computational complexity of examples that utilize foveated compressive projection is a factor of KLb 2(1-L) less than that of examples utilizing compressive sensing alone. The complexity of an alternative Moore-Penrose matrix pseudo-inverse solution is O(QNE) = O(QbL), where Q is the number of hyperspectral channels. Proceeding down the tree using multi-level foveation and solving a small demixing problem at each level is therefore orders of magnitude less complex than solving a single large demixing problem without foveation.
- For example, for NE=103, K=2, b=10, and L=3, examples that employ foveated compressive projection may use a factor of 6x10⁻⁴ fewer operations than examples that employ compressive sensing without foveation, and 1.3x10⁻³ fewer operations than the Moore-Penrose matrix pseudo-inverse for this example (assuming Q=480 for the number of spectral channels).
-
Figs. 7-10 depict various test cases comparing prior art techniques to various examples. These figures utilize data represented byFig. 2 . The N=16 mineral spectra from the collection depicted byFig. 2 were used to form a spectral library Φ to test various examples and contrast with prior art techniques. The number of wavelength bands was Q=480. A mixture x of two of the spectra plus 1% additive noise was then formed to be a test spectrum input with K=2. The abundances α were estimated using publicly available compressive sensing code. - In
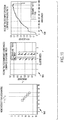
Fig. 7 , the compressive sensing result for F equal to the NxN identity matrix (702), i.e., with no foveation, are shown. For M=13 projections with 5% noise, compressive sensing (704) had an error of 6.31%, while the pseudo-inverse error was 634%. In addition, the pseudo-inverse generated false alarms or nonzero values for endmembers not in the mixture. Compressive sensing without foveation had no false alarms. The MATLAB's CoSamp running time was 7.5 msec. -
Fig. 8 depicts results for an input spectrum consisting of endmembers not in the library. F (802) is the identity matrix because there is no foveation. The measurement noise value was 5%. The compressive sensing residual was 10.1, an indication that compressive sensing could not converge due to the spectrum not being in the library. Thus, when the input spectrum consisted of endmembers not in the library, this could be detected from the large value of the residual error in reconstructing the measuredspectrum 804. -
Fig. 9 depicts example results 904, 906 for foveation inCluster Level 1. Foveated compressive sensing successfully detected that the mixture endmembers are inCluster 2 with zero abundances for the other clusters. The pseudo-inverse generated nonzero abundances for all 5 clusters. For 5% measurement noise, the foveated compressive sensing error was 6.0% while the pseudo-inverse error was 115%. InFig. 10 , F (902) was used to foveate on theCluster 2 that was determined inCluster Level 1 to contain the mixture endmembers. Foveated compressive sensing successfully detected the correct two endmembers in the second cluster with zero abundances for the other three endmembers in the cluster. The pseudo-inverse generated nonzero abundances (false alarms) for all five endmembers. For 5% measurement noise, the foveated compressive sensing error was 5.9% while the pseudo-inverse error was 143%. -
Fig. 10 depicts the same test case as inFig. 9 , but with F (1002) modified to foveate on the second cluster with higher resolution.Results Cluster 2 was determined to contain the endmembers inCluster Level 1. The measurement noise value was 5% and MC=16. Foveated compressive projection successfully demixed the two endmembers inCluster 2 with no false alarms. The foveated compressive projection error was 0.16%, while the pseudo-inverse error was 143%. Note the improved accuracy of reconstruction relative to ClusterLevel 1 inFig. 9 . - The Table below summarizes the results for the test problem described herein in reference to
Figs. 7-10 .Table Pseudo-Inverse Compressive Sensing Two-Level Foveated Compressive Projection Oracle with Prior Knowledge of Mixture Endmembers Demixing Error 143% 29.1% 0.16% 0.16% Computation Complexity (Number of Operations) 7680 416 200 Not Applicable Measured Running Time in MATLAB 0.35 msec (Optimized Internal MATLAB Function) 10.9 msec 13.2 msec (Dominated by MATLAB Overhead) Not Applicable - Foveated compressive projection achieved noise-limited accuracy in determining the mixture endmember abundances and in accurately modeling the input spectrum. The compression factor for both compressive sensing and foveated compressive projection was equal to Q/K=480/2=240 times for this test example. The foveated compressive projection demixing error was reduced by 2.25 times and the number of operations was reduced by 3.85 times relative to compressive sensing. The foveated compressive projection demixing error of 0.16% was virtually equal to the oracle demixer, which had pre-knowledge of which endmembers are in the data and simply did a least squares fit to determine their abundances. Both compressive sensing and foveated compressive projection did not have any false alarms; in other words, the estimated abundances were zero for all end-members that were not in the input data. The pseudo-inverse method had a very large demixing error of 143% and showed nonzero abundances for almost all the end-members that were not in the input data. These results support the use of foveated compressive projection as a tool for automation of hyperspectral data analysis that achieves high accuracy, low false alarm rates, and low computational complexity by adapting to the data.
-
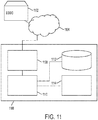
Fig. 11 depicts a system according to some examples. In particular,Fig. 11 illustrates various hardware, software, and other resources that can be used in implementations ofapparatus 1106 in systems and methods according to disclosed examples. In examples as shown,apparatus 1106 can include aprocessor 1110 coupled to a random access memory operating under control of or in conjunction with an operating system. Theprocessor 1110 in examples can be incorporated in one or more servers, clusters, or other computers or hardware resources, or can be implemented using cloud-based resources.Processor 1110 can communicate with thedata store 1112, such as a database stored on a local hard drive or drive array, to access or store data.Processor 1110 can further communicate with anetwork interface 1108, such as an Ethernet or wireless data connection, which in turn communicates with the one ormore networks 1104, such as the Internet or other public or private networks, via which spectroscopic data can be obtained from spectroscopicdata acquisition device 1102.Device 1102 may be, for example, a spectroscope, a stand-off detector, a targeting system, or a remote or local persistent or dynamic storage device.Processor 1110 is further coupled tomath co-processor 1114, which can parallelize operations as described herein.Processor 1110 can, in general, be programmed or configured to execute control logic and control demixing operations. Other configurations ofapparatus 1106, associated network connections, and other hardware, software, and resources are possible. - The following are properties of some examples. Hierarchical clustering may be performed on the spectral library, and the resulting tree may be organized into a decision tree with multiple levels. Each cluster in a level may represent subcluster prototypes from the previous layer. The same clustering may be performed on both the library and the mixture endmember abundances using foveation operators FC T and FC. Foveated compressive projection and sparse reconstruction may be performed at each level of the tree to reconstruct and model the mixture spectrum with increasing accuracy as the tree is traversed from top to bottom until the endmembers and their abundances are determined. Oversampling, or using a larger number of projections than there are members of the cluster, may increase the accuracy of the demixing in the presence of noise. The prototypes selected at each level may determine how the tree is traversed in order to determine the endmembers in the mixture and their abundances. The tree clustering and foveation greatly reduces the overall computational complexity and improves scaling for large libraries by using multiple small sparse reconstructions arranged in a decision tree instead of performing one large reconstruction.
- Further, the disclosure comprises aspects according to the following clauses:
- 1. A method for spectral demixing, the method comprising: obtaining empirical spectroscopic data representing a plurality of frequencies of electromagnetic energy that has interacted with a specimen; accessing a computer readable representation of a hierarchal spectral cluster tree representing a spectral library; demixing, with data on each of a plurality of levels of the hierarchal spectral cluster tree, foveated spectroscopic data derived from the empirical spectroscopic data; identifying at least one node in the hierarchal spectral cluster tree as corresponding to the empirical spectroscopic data; and outputting an endmember abundance assessment of the specimen corresponding to at least the at least one node.
- 2. The method of
clause 1, wherein the empirical spectroscopic data represents a plurality of frequencies of electromagnetic energy reflected off of the specimen. - 3. The method of
clause 1, wherein the empirical spectroscopic data represents a pixel. - 4. The method of any one of the preceding clauses, wherein the hierarchal spectral cluster tree comprises a plurality of levels comprising at least one terminal level comprising nodes representing individual endmembers.
- 5. The method of any one of the preceding clauses, wherein the hierarchal spectral cluster tree comprises a plurality of prototype nodes, wherein a respective prototype node represents a plurality of endmembers.
- 6. The method of any one of the preceding clauses, further comprising hierarchical clustering the spectral library.
- 7. The method of any one of clauses 1-6, wherein the demixing foveated spectroscopic data comprises performing foveated compressive projection.
- 8. The method of any one of clauses 1-7, wherein the demixing foveated spectroscopic data comprises sparse reconstruction.
- 9. The method of any one of clauses 1-8, further comprising using the endmember abundance assessment for at least one of geospatial analysis, target recognition, surveillance, chemical identification, remote sensing, and combinations thereof.
- 10. The method of any one of the preceding clauses, wherein the outputting comprises causing a display in a human readable format.
- 11. A system for spectral demixing, the system comprising: an interface configured to obtain empirical spectroscopic data representing a plurality of frequencies of electromagnetic energy that has interacted with a specimen; at least one electronic processor communicatively coupled to a computer readable representation of a hierarchal spectral cluster tree representing a spectral library; at least one electronic processor configured to demix, with data on each of a plurality of levels of the hierarchal spectral cluster tree, foveated spectroscopic data derived from the empirical spectroscopic data; at least one electronic processor configured to identify at least one node in the hierarchal spectral cluster tree as corresponding to the empirical spectroscopic data; and at least one electronic processor configured to output an endmember abundance assessment of the specimen corresponding to at least the at least one node.
- 12. The system of
clause 11, wherein the empirical spectroscopic data represents a plurality of frequencies of electromagnetic energy reflected off of the specimen. - 13. The system of
clause 11, wherein the empirical spectroscopic data represents a pixel. - 14. The system of any one of clauses 11-13, wherein the hierarchal spectral cluster tree comprises a plurality of levels comprising at least one terminal level comprising nodes representing individual endmembers.
- 15. The system of any one of clauses 11-14, wherein the hierarchal spectral cluster tree comprises a plurality of prototype nodes, wherein a respective prototype node represents a plurality of endmembers.
- 16. The system of any one of clauses 11-15, further comprising at least one electronic processor configured to hierarchically cluster the spectral library.
- 17. The system of
clause 11, wherein the at least one electronic processor configured to demix foveated spectroscopic data is further configured to perform foveated compressive projection. - 18. The system of
clause 11, wherein the at least one electronic processor configured to demix foveated spectroscopic data is further configured to perform sparse reconstruction. - 19. The system of any one of clauses 11-18, further comprising at least one electronic processor configured to provide the endmember abundance assessment for at least one of geospatial analysis, target recognition, surveillance, chemical identification, remote sensing, and combinations thereof.
- 20. The system of
clause 11, wherein the at least one electronic processor configured to output is further configured to cause a display in a human readable format. - 21. The method of
clause 1, wherein the empirical spectroscopic data represents a plurality of frequencies of electromagnetic energy reflected off of the specimen and/or wherein the empirical spectroscopic data represents a pixel. - 22. The system of
clause 11, wherein the empirical spectroscopic data represents a plurality of frequencies of electromagnetic energy reflected off of the specimen; and/or wherein the empirical spectroscopic data represents a pixel. - Note that examples are not limited to specific spectra of portions of the spectrum. Thus, some examples perform spectral demixing using foveated compressive projections. Some examples perform hyperspectral demixing using foveated compressive projections.
- Certain examples described above can be performed in part using a computer application or program. The computer program can exist in a variety of forms, both active and inactive. For example, the computer program can exist as one or more software programs, software modules, or both, that can be comprised of program instructions in source code, object code, executable code or other formats, firmware program(s), or hardware description language (HDL) files. Any of the above can be embodied on a computer readable medium, which can include computer readable storage devices and media in compressed or uncompressed form. Exemplary computer readable storage devices and media include conventional computer system RAM (random access memory), ROM (read-only memory), EPROM (erasable, programmable ROM), EEPROM (electrically erasable, programmable ROM), and magnetic or optical disks or tapes.
- Those skilled in the art will be able to make various modifications to the described examples without departing from the true spirit and scope. The terms and descriptions used herein are set forth by way of illustration only and are not meant as limitations. In particular, although the method has been described by examples, the steps of the method can be performed in a different order than illustrated or simultaneously. Those skilled in the art will recognize that these and other variations are possible within the spirit and scope as defined in the following claims and their equivalents.
- Below follows a list of numbered items. These items may be combined with any other features described herein in any combination beyond those expressly stated below:
- 1. A method for spectral demixing, the method comprising:
- obtaining empirical spectroscopic data representing a plurality of frequencies of electromagnetic energy that has interacted with a specimen (502);
- accessing a computer readable representation of a hierarchal spectral cluster tree representing a spectral library (504);
- demixing, with data on each of a plurality of levels of the hierarchal spectral cluster tree, foveated spectroscopic data derived from the empirical spectroscopic data (506);
- identifying at least one node in the hierarchal spectral cluster tree as corresponding to the empirical spectroscopic data (514); and
- outputting an endmember abundance assessment of the specimen corresponding to at least the at least one node (516).
- 2. The method of
item 1, wherein the empirical spectroscopic data represents a plurality of frequencies of electromagnetic energy reflected off of the specimen or
a pixel. - 3. The method of
item 1, wherein the hierarchal spectral cluster tree comprises a plurality of levels comprising at least one terminal level comprising nodes representing individual endmembers or
wherein the hierarchal spectral cluster tree comprises a plurality of prototype nodes, wherein a respective prototype node represents a plurality of endmembers. - 4. The method of any one of
items 1--3, further comprising hierarchical clustering the spectral library. - 5. The method of
item 1, wherein the demixing foveated spectroscopic data comprises performing foveated compressive projection (508) and/or wherein the demixing foveated spectroscopic data comprises sparse reconstruction (510). - 6. The method of any one of items 1-5, further comprising using the endmember abundance assessment for at least one of geospatial analysis, target recognition, surveillance, chemical identification, remote sensing, and combinations thereof.
- 7. The method of
item 1, wherein the outputting comprises causing a display in a human readable format. - 8. A system for spectral demixing, the system comprising:
- an interface configured to obtain empirical spectroscopic data representing a plurality of frequencies of electromagnetic energy that has interacted with a specimen;
- at least one electronic processor communicatively coupled to a computer readable representation of a hierarchal spectral cluster tree representing a spectral library;
- at least one electronic processor configured to demix, with data on each of a plurality of levels of the hierarchal spectral cluster tree, foveated spectroscopic data derived from the empirical spectroscopic data;
- at least one electronic processor configured to identify at least one node in the hierarchal spectral cluster tree as corresponding to the empirical spectroscopic data; and
- at least one electronic processor configured to output an endmember abundance assessment of the specimen corresponding to at least the at least one node.
- 9. The system of
item 8, wherein the empirical spectroscopic data represents a plurality of frequencies of electromagnetic energy reflected off of the specimen or a pixel. - 10. The system of
item 8, wherein the hierarchal spectral cluster tree comprises a plurality of levels comprising at least one terminal level comprising nodes representing individual endmembers; or wherein the hierarchal spectral cluster tree comprises a plurality of prototype nodes, wherein a respective prototype node represents a plurality of endmembers. - 11. The system of item any one of items 8-10, further comprising at least one electronic processor configured to hierarchically cluster the spectral library.
- 12. The system of
item 8, wherein the at least one electronic processor configured to demix foveated spectroscopic data is further configured to perform foveated compressive projection and/or wherein the at least one electronic processor configured to demix foveated spectroscopic data is further configured to perform sparse reconstruction. - 13. The system of any one of items 8-12, further comprising at least one electronic processor configured to provide the endmember abundance assessment for at least one of geospatial analysis, target recognition, surveillance, chemical identification, remote sensing, and combinations thereof.
- 14. The system of
item 8, wherein the at least one electronic processor configured to output is further configured to cause a display in a human readable format.
Claims (14)
- A method for spectral demixing, the method comprising:obtaining empirical spectroscopic data representing a plurality of frequencies of electromagnetic energy that has interacted with a specimen (502);accessing a computer readable representation of a hierarchal spectral cluster tree representing a spectral library (504);demixing, with data on each of a plurality of levels of the hierarchal spectral cluster tree, foveated spectroscopic data derived from the empirical spectroscopic data (506);identifying at least one node in the hierarchal spectral cluster tree as corresponding to the empirical spectroscopic data (514); andoutputting an endmember abundance assessment of the specimen corresponding to at least the at least one node (516).
- The method of claim 1, wherein the empirical spectroscopic data represents a plurality of frequencies of electromagnetic energy reflected off of the specimen or
a pixel. - The method of claim 1, wherein the hierarchal spectral cluster tree comprises a plurality of levels comprising at least one terminal level comprising nodes representing individual endmembers or
wherein the hierarchal spectral cluster tree comprises a plurality of prototype nodes, wherein a respective prototype node represents a plurality of endmembers. - The method of any one of claims 1--3, further comprising hierarchical clustering the spectral library.
- The method of claim 1, wherein the demixing foveated spectroscopic data comprises performing foveated compressive projection (508) and/or wherein the demixing foveated spectroscopic data comprises sparse reconstruction (510).
- The method of any one of claims 1-5, further comprising using the endmember abundance assessment for at least one of geospatial analysis, target recognition, surveillance, chemical identification, remote sensing, and combinations thereof.
- The method of claim 1, wherein the outputting comprises causing a display in a human readable format.
- A system for spectral demixing, the system comprising:an interface configured to obtain empirical spectroscopic data representing a plurality of frequencies of electromagnetic energy that has interacted with a specimen;at least one electronic processor communicatively coupled to a computer readable representation of a hierarchal spectral cluster tree representing a spectral library;at least one electronic processor configured to demix, with data on each of a plurality of levels of the hierarchal spectral cluster tree, foveated spectroscopic data derived from the empirical spectroscopic data;at least one electronic processor configured to identify at least one node in the hierarchal spectral cluster tree as corresponding to the empirical spectroscopic data; andat least one electronic processor configured to output an endmember abundance assessment of the specimen corresponding to at least the at least one node.
- The system of claim 8, wherein the empirical spectroscopic data represents a plurality of frequencies of electromagnetic energy reflected off of the specimen or a pixel.
- The system of claim 8, wherein the hierarchal spectral cluster tree comprises a plurality of levels comprising at least one terminal level comprising nodes representing individual endmembers; or wherein the hierarchal spectral cluster tree comprises a plurality of prototype nodes, wherein a respective prototype node represents a plurality of endmembers.
- The system of claim any one of claims 8-10, further comprising at least one electronic processor configured to hierarchically cluster the spectral library.
- The system of claim 8, wherein the at least one electronic processor configured to demix foveated spectroscopic data is further configured to perform foveated compressive projection and/or wherein the at least one electronic processor configured to demix foveated spectroscopic data is further configured to perform sparse reconstruction.
- The system of any one of claims 8-12, further comprising at least one electronic processor configured to provide the endmember abundance assessment for at least one of geospatial analysis, target recognition, surveillance, chemical identification, remote sensing, and combinations thereof.
- The system of claim 8, wherein the at least one electronic processor configured to output is further configured to cause a display in a human readable format.
Applications Claiming Priority (2)
| Application Number | Priority Date | Filing Date | Title |
|---|---|---|---|
| US14/693,401 US10094713B2 (en) | 2015-04-22 | 2015-04-22 | Hyperspectral demixing using foveated compressive projections |
| EP16162300.4A EP3089074B1 (en) | 2015-04-22 | 2016-03-24 | Hyperspectral demixing using foveated compressive projections |
Related Parent Applications (2)
| Application Number | Title | Priority Date | Filing Date |
|---|---|---|---|
| EP16162300.4A Division EP3089074B1 (en) | 2015-04-22 | 2016-03-24 | Hyperspectral demixing using foveated compressive projections |
| EP16162300.4A Division-Into EP3089074B1 (en) | 2015-04-22 | 2016-03-24 | Hyperspectral demixing using foveated compressive projections |
Publications (2)
| Publication Number | Publication Date |
|---|---|
| EP3907658A1 true EP3907658A1 (en) | 2021-11-10 |
| EP3907658B1 EP3907658B1 (en) | 2025-11-12 |
Family
ID=55637244
Family Applications (2)
| Application Number | Title | Priority Date | Filing Date |
|---|---|---|---|
| EP16162300.4A Active EP3089074B1 (en) | 2015-04-22 | 2016-03-24 | Hyperspectral demixing using foveated compressive projections |
| EP21181003.1A Active EP3907658B1 (en) | 2015-04-22 | 2016-03-24 | Hyperspectral demixing using foveated compressive projections |
Family Applications Before (1)
| Application Number | Title | Priority Date | Filing Date |
|---|---|---|---|
| EP16162300.4A Active EP3089074B1 (en) | 2015-04-22 | 2016-03-24 | Hyperspectral demixing using foveated compressive projections |
Country Status (3)
| Country | Link |
|---|---|
| US (1) | US10094713B2 (en) |
| EP (2) | EP3089074B1 (en) |
| JP (1) | JP6636845B2 (en) |
Families Citing this family (27)
| Publication number | Priority date | Publication date | Assignee | Title |
|---|---|---|---|---|
| GB2510777A (en) | 2011-11-03 | 2014-08-13 | Verifood Ltd | Low - cost spectrometry system for end - user analysis |
| GB2543655B (en) | 2013-08-02 | 2017-11-01 | Verifood Ltd | Compact spectrometer comprising a diffuser, filter matrix, lens array and multiple sensor detector |
| CN106461461A (en) | 2014-01-03 | 2017-02-22 | 威利食品有限公司 | Spectrometry systems, methods, and applications |
| EP3209983A4 (en) | 2014-10-23 | 2018-06-27 | Verifood Ltd. | Accessories for handheld spectrometer |
| WO2016125165A2 (en) | 2015-02-05 | 2016-08-11 | Verifood, Ltd. | Spectrometry system with visible aiming beam |
| WO2016125164A2 (en) | 2015-02-05 | 2016-08-11 | Verifood, Ltd. | Spectrometry system applications |
| WO2016162865A1 (en) | 2015-04-07 | 2016-10-13 | Verifood, Ltd. | Detector for spectrometry system |
| US10066990B2 (en) | 2015-07-09 | 2018-09-04 | Verifood, Ltd. | Spatially variable filter systems and methods |
| US10203246B2 (en) | 2015-11-20 | 2019-02-12 | Verifood, Ltd. | Systems and methods for calibration of a handheld spectrometer |
| US10268914B1 (en) * | 2016-01-07 | 2019-04-23 | Hrl Laboratories, Llc | Blind sensing for hyperspectral surveillance |
| US10254215B2 (en) | 2016-04-07 | 2019-04-09 | Verifood, Ltd. | Spectrometry system applications |
| WO2018015951A1 (en) | 2016-07-20 | 2018-01-25 | Verifood, Ltd. | Accessories for handheld spectrometer |
| US10791933B2 (en) | 2016-07-27 | 2020-10-06 | Verifood, Ltd. | Spectrometry systems, methods, and applications |
| CN106875413B (en) * | 2017-02-13 | 2019-05-17 | 华东师范大学 | A method for automatic counting of adherent red blood cells based on hyperspectral imaging |
| US11456059B2 (en) * | 2017-08-22 | 2022-09-27 | Geospatial Technology Associates Llc | System, apparatus and method for hierarchical identification, multi-tier target library processing, and two-stage identification |
| JP7018297B2 (en) * | 2017-11-16 | 2022-02-10 | 日本電子株式会社 | Spectrum analyzer and method |
| WO2019150453A1 (en) * | 2018-01-31 | 2019-08-08 | Nec Corporation | Image processing device, image processing method and storage medium |
| CN108917930B (en) * | 2018-06-21 | 2019-09-20 | 中国科学院西安光学精密机械研究所 | Hyperspectral unmixing optical implementation method based on spectral imaging technology |
| EP3864384A4 (en) | 2018-10-08 | 2022-06-29 | Verifood Ltd. | Accessories for optical spectrometers |
| CN109785305B (en) * | 2018-12-28 | 2021-01-12 | 国网浙江省电力有限公司嘉兴供电公司 | End member variable hyperspectral image spectrum hybrid analysis method and device |
| US11676367B1 (en) * | 2019-02-07 | 2023-06-13 | Hrl Laboratories, Llc | System and method for anomaly detection using anomaly cueing |
| KR102172914B1 (en) * | 2019-06-07 | 2020-11-03 | 한국생산기술연구원 | Fast searching method and apparatus for raman spectrum identification |
| KR102582407B1 (en) * | 2019-07-28 | 2023-09-26 | 구글 엘엘씨 | Methods, systems, and media for rendering immersive video content with foveated meshes |
| GB202001065D0 (en) * | 2020-01-24 | 2020-03-11 | Secr Defence | Computer implemented method of spectral un-mixing |
| JP7828141B2 (en) * | 2021-04-30 | 2026-03-11 | 株式会社キーエンス | Analysis device, analysis method, analysis program, and storage medium |
| CN115170960B (en) * | 2022-07-01 | 2025-12-30 | 南京理工大学 | Hyperspectral sparse unmixing method for learnable implicit variable iterative expansion networks |
| US20240273678A1 (en) * | 2023-01-30 | 2024-08-15 | The Research Foundation For The State University Of New York | Unmixing image data |
Family Cites Families (4)
| Publication number | Priority date | Publication date | Assignee | Title |
|---|---|---|---|---|
| WO2003031031A1 (en) * | 2000-11-16 | 2003-04-17 | Ciphergen Biosystems, Inc. | Method for analyzing mass spectra |
| US20110052019A1 (en) * | 2009-09-03 | 2011-03-03 | Green Vision Systems Ltd. | Analyzing Objects Via Hyper-Spectral Imaging and Analysis |
| US8429153B2 (en) * | 2010-06-25 | 2013-04-23 | The United States Of America As Represented By The Secretary Of The Army | Method and apparatus for classifying known specimens and media using spectral properties and identifying unknown specimens and media |
| CN105492878B (en) * | 2013-06-18 | 2017-10-31 | 拉莫特艾特特拉维夫大学有限公司 | Apparatus and method for snapshot light spectrum image-forming |
-
2015
- 2015-04-22 US US14/693,401 patent/US10094713B2/en active Active
-
2016
- 2016-03-24 EP EP16162300.4A patent/EP3089074B1/en active Active
- 2016-03-24 EP EP21181003.1A patent/EP3907658B1/en active Active
- 2016-04-14 JP JP2016080785A patent/JP6636845B2/en active Active
Non-Patent Citations (1)
| Title |
|---|
| LAURENT TITS ET AL: "The Potential and Limitations of a Clustering Approach for the Improved Efficiency of Multiple Endmember Spectral Mixture Analysis in Plant Production System Monitoring", IEEE TRANSACTIONS ON GEOSCIENCE AND REMOTE SENSING, IEEE SERVICE CENTER, PISCATAWAY, NJ, US, vol. 50, no. 6, 1 June 2012 (2012-06-01), pages 2273 - 2286, XP011444368, ISSN: 0196-2892, DOI: 10.1109/TGRS.2011.2173696 * |
Also Published As
| Publication number | Publication date |
|---|---|
| JP2016224031A (en) | 2016-12-28 |
| JP6636845B2 (en) | 2020-01-29 |
| US10094713B2 (en) | 2018-10-09 |
| EP3907658B1 (en) | 2025-11-12 |
| EP3089074B1 (en) | 2023-06-07 |
| US20160313184A1 (en) | 2016-10-27 |
| EP3089074A1 (en) | 2016-11-02 |
Similar Documents
| Publication | Publication Date | Title |
|---|---|---|
| EP3089074B1 (en) | Hyperspectral demixing using foveated compressive projections | |
| US20240290008A1 (en) | Method and apparatus for image processing | |
| Jin et al. | TANet: An unsupervised two-stream autoencoder network for hyperspectral unmixing | |
| Zhang et al. | Sparse transfer manifold embedding for hyperspectral target detection | |
| Shakya et al. | Deep learning algorithm for satellite imaging based cyclone detection | |
| Pan et al. | R-VCANet: A new deep-learning-based hyperspectral image classification method | |
| Wei et al. | Bayesian fusion of multi-band images | |
| Roscher et al. | Detection of disease symptoms on hyperspectral 3D plant models | |
| Olson et al. | Manifold learning techniques for unsupervised anomaly detection | |
| Drumetz et al. | Variability of the endmembers in spectral unmixing: recent advances | |
| US20220020110A1 (en) | Unmanned aircraft system (uas) detection and assessment via temporal intensity aliasing | |
| Benouis et al. | Food tray sealing fault detection using hyperspectral imaging and PCANet | |
| Yaman et al. | Image processing and machine learning‐based classification method for hyperspectral images | |
| Nakhostin et al. | Supervised planetary unmixing with optimal transport | |
| Vargas et al. | A low-rank model for compressive spectral image classification | |
| Pant et al. | Hyperspectral anomaly detection methods: A survey and comparative study | |
| Cohrs et al. | A distribution-dependent mumford–shah model for unsupervised hyperspectral image segmentation | |
| Taghipour et al. | Hyperspectral anomaly detection using spectral–spatial features based on the human visual system | |
| Kishore et al. | Approches and challenges in classification for hyperspectral data: A review | |
| Dong et al. | Symmetric information–theoretic metric learning for target detection in hyperspectral imagery | |
| Halimi et al. | Robust unmixing algorithms for hyperspectral imagery | |
| Kishore et al. | Hyperspectral imaging technique for plant leaf identification | |
| Gundersen et al. | An improved adaptive weighted deep belief network autoencoder for hyperspectral images | |
| Xiaorui et al. | Robust nonnegative matrix factorization based background reconstruction for hyperspectral image anomaly detection | |
| Ammanouil et al. | GLUP: Yet another algorithm for blind unmixing of hyperspectral data |
Legal Events
| Date | Code | Title | Description |
|---|---|---|---|
| PUAI | Public reference made under article 153(3) epc to a published international application that has entered the european phase |
Free format text: ORIGINAL CODE: 0009012 |
|
| STAA | Information on the status of an ep patent application or granted ep patent |
Free format text: STATUS: THE APPLICATION HAS BEEN PUBLISHED |
|
| AC | Divisional application: reference to earlier application |
Ref document number: 3089074 Country of ref document: EP Kind code of ref document: P |
|
| AK | Designated contracting states |
Kind code of ref document: A1 Designated state(s): AL AT BE BG CH CY CZ DE DK EE ES FI FR GB GR HR HU IE IS IT LI LT LU LV MC MK MT NL NO PL PT RO RS SE SI SK SM TR |
|
| B565 | Issuance of search results under rule 164(2) epc |
Effective date: 20211007 |
|
| STAA | Information on the status of an ep patent application or granted ep patent |
Free format text: STATUS: REQUEST FOR EXAMINATION WAS MADE |
|
| 17P | Request for examination filed |
Effective date: 20211207 |
|
| RBV | Designated contracting states (corrected) |
Designated state(s): AL AT BE BG CH CY CZ DE DK EE ES FI FR GB GR HR HU IE IS IT LI LT LU LV MC MK MT NL NO PL PT RO RS SE SI SK SM TR |
|
| RAP3 | Party data changed (applicant data changed or rights of an application transferred) |
Owner name: THE BOEING COMPANY |
|
| REG | Reference to a national code |
Ref country code: DE Ref legal event code: R079 Free format text: PREVIOUS MAIN CLASS: G06K0009000000 Ipc: G06V0010762000 Ref country code: DE Ref legal event code: R079 Ref document number: 602016094107 Country of ref document: DE Free format text: PREVIOUS MAIN CLASS: G06K0009000000 Ipc: G06V0010762000 |
|
| GRAP | Despatch of communication of intention to grant a patent |
Free format text: ORIGINAL CODE: EPIDOSNIGR1 |
|
| STAA | Information on the status of an ep patent application or granted ep patent |
Free format text: STATUS: GRANT OF PATENT IS INTENDED |
|
| RIC1 | Information provided on ipc code assigned before grant |
Ipc: G06F 18/231 20230101ALI20230404BHEP Ipc: G06V 10/58 20220101ALI20230404BHEP Ipc: G06V 20/69 20220101ALI20230404BHEP Ipc: G06V 10/762 20220101AFI20230404BHEP |
|
| INTG | Intention to grant announced |
Effective date: 20230421 |
|
| GRAJ | Information related to disapproval of communication of intention to grant by the applicant or resumption of examination proceedings by the epo deleted |
Free format text: ORIGINAL CODE: EPIDOSDIGR1 |
|
| STAA | Information on the status of an ep patent application or granted ep patent |
Free format text: STATUS: REQUEST FOR EXAMINATION WAS MADE |
|
| INTC | Intention to grant announced (deleted) | ||
| STAA | Information on the status of an ep patent application or granted ep patent |
Free format text: STATUS: EXAMINATION IS IN PROGRESS |
|
| P01 | Opt-out of the competence of the unified patent court (upc) registered |
Effective date: 20230808 |
|
| 17Q | First examination report despatched |
Effective date: 20230823 |
|
| GRAP | Despatch of communication of intention to grant a patent |
Free format text: ORIGINAL CODE: EPIDOSNIGR1 |
|
| STAA | Information on the status of an ep patent application or granted ep patent |
Free format text: STATUS: GRANT OF PATENT IS INTENDED |
|
| INTG | Intention to grant announced |
Effective date: 20250606 |
|
| GRAS | Grant fee paid |
Free format text: ORIGINAL CODE: EPIDOSNIGR3 |
|
| GRAA | (expected) grant |
Free format text: ORIGINAL CODE: 0009210 |
|
| STAA | Information on the status of an ep patent application or granted ep patent |
Free format text: STATUS: THE PATENT HAS BEEN GRANTED |
|
| AC | Divisional application: reference to earlier application |
Ref document number: 3089074 Country of ref document: EP Kind code of ref document: P |
|
| AK | Designated contracting states |
Kind code of ref document: B1 Designated state(s): AL AT BE BG CH CY CZ DE DK EE ES FI FR GB GR HR HU IE IS IT LI LT LU LV MC MK MT NL NO PL PT RO RS SE SI SK SM TR |
|
| REG | Reference to a national code |
Ref country code: CH Ref legal event code: F10 Free format text: ST27 STATUS EVENT CODE: U-0-0-F10-F00 (AS PROVIDED BY THE NATIONAL OFFICE) Effective date: 20251112 Ref country code: GB Ref legal event code: FG4D |
|
| REG | Reference to a national code |
Ref country code: IE Ref legal event code: FG4D |
|
| REG | Reference to a national code |
Ref country code: DE Ref legal event code: R096 Ref document number: 602016094107 Country of ref document: DE |
|
| REG | Reference to a national code |
Ref country code: NL Ref legal event code: MP Effective date: 20251112 |
|
| PGFP | Annual fee paid to national office [announced via postgrant information from national office to epo] |
Ref country code: GB Payment date: 20260327 Year of fee payment: 11 |
|
| PG25 | Lapsed in a contracting state [announced via postgrant information from national office to epo] |
Ref country code: ES Free format text: LAPSE BECAUSE OF FAILURE TO SUBMIT A TRANSLATION OF THE DESCRIPTION OR TO PAY THE FEE WITHIN THE PRESCRIBED TIME-LIMIT Effective date: 20251112 |
|
| REG | Reference to a national code |
Ref country code: LT Ref legal event code: MG9D |
|
| PG25 | Lapsed in a contracting state [announced via postgrant information from national office to epo] |
Ref country code: NO Free format text: LAPSE BECAUSE OF FAILURE TO SUBMIT A TRANSLATION OF THE DESCRIPTION OR TO PAY THE FEE WITHIN THE PRESCRIBED TIME-LIMIT Effective date: 20260212 |
|
| PGFP | Annual fee paid to national office [announced via postgrant information from national office to epo] |
Ref country code: DE Payment date: 20260327 Year of fee payment: 11 |
|
| PG25 | Lapsed in a contracting state [announced via postgrant information from national office to epo] |
Ref country code: AT Free format text: LAPSE BECAUSE OF FAILURE TO SUBMIT A TRANSLATION OF THE DESCRIPTION OR TO PAY THE FEE WITHIN THE PRESCRIBED TIME-LIMIT Effective date: 20251112 Ref country code: HR Free format text: LAPSE BECAUSE OF FAILURE TO SUBMIT A TRANSLATION OF THE DESCRIPTION OR TO PAY THE FEE WITHIN THE PRESCRIBED TIME-LIMIT Effective date: 20251112 Ref country code: FI Free format text: LAPSE BECAUSE OF FAILURE TO SUBMIT A TRANSLATION OF THE DESCRIPTION OR TO PAY THE FEE WITHIN THE PRESCRIBED TIME-LIMIT Effective date: 20251112 |
|
| REG | Reference to a national code |
Ref country code: AT Ref legal event code: MK05 Ref document number: 1857453 Country of ref document: AT Kind code of ref document: T Effective date: 20251112 |
|
| PG25 | Lapsed in a contracting state [announced via postgrant information from national office to epo] |
Ref country code: NL Free format text: LAPSE BECAUSE OF FAILURE TO SUBMIT A TRANSLATION OF THE DESCRIPTION OR TO PAY THE FEE WITHIN THE PRESCRIBED TIME-LIMIT Effective date: 20251112 |
|
| PG25 | Lapsed in a contracting state [announced via postgrant information from national office to epo] |
Ref country code: RS Free format text: LAPSE BECAUSE OF FAILURE TO SUBMIT A TRANSLATION OF THE DESCRIPTION OR TO PAY THE FEE WITHIN THE PRESCRIBED TIME-LIMIT Effective date: 20260212 |
|
| PG25 | Lapsed in a contracting state [announced via postgrant information from national office to epo] |
Ref country code: IS Free format text: LAPSE BECAUSE OF FAILURE TO SUBMIT A TRANSLATION OF THE DESCRIPTION OR TO PAY THE FEE WITHIN THE PRESCRIBED TIME-LIMIT Effective date: 20260312 |
|
| PGFP | Annual fee paid to national office [announced via postgrant information from national office to epo] |
Ref country code: FR Payment date: 20260325 Year of fee payment: 11 |
|
| PG25 | Lapsed in a contracting state [announced via postgrant information from national office to epo] |
Ref country code: PT Free format text: LAPSE BECAUSE OF FAILURE TO SUBMIT A TRANSLATION OF THE DESCRIPTION OR TO PAY THE FEE WITHIN THE PRESCRIBED TIME-LIMIT Effective date: 20260312 |
|
| PG25 | Lapsed in a contracting state [announced via postgrant information from national office to epo] |
Ref country code: PL Free format text: LAPSE BECAUSE OF FAILURE TO SUBMIT A TRANSLATION OF THE DESCRIPTION OR TO PAY THE FEE WITHIN THE PRESCRIBED TIME-LIMIT Effective date: 20251112 |
|
| PG25 | Lapsed in a contracting state [announced via postgrant information from national office to epo] |
Ref country code: LV Free format text: LAPSE BECAUSE OF FAILURE TO SUBMIT A TRANSLATION OF THE DESCRIPTION OR TO PAY THE FEE WITHIN THE PRESCRIBED TIME-LIMIT Effective date: 20251112 |
|
| PG25 | Lapsed in a contracting state [announced via postgrant information from national office to epo] |
Ref country code: BG Free format text: LAPSE BECAUSE OF FAILURE TO SUBMIT A TRANSLATION OF THE DESCRIPTION OR TO PAY THE FEE WITHIN THE PRESCRIBED TIME-LIMIT Effective date: 20251112 |
|
| PG25 | Lapsed in a contracting state [announced via postgrant information from national office to epo] |
Ref country code: LT Free format text: LAPSE BECAUSE OF FAILURE TO SUBMIT A TRANSLATION OF THE DESCRIPTION OR TO PAY THE FEE WITHIN THE PRESCRIBED TIME-LIMIT Effective date: 20251112 |
|
| PG25 | Lapsed in a contracting state [announced via postgrant information from national office to epo] |
Ref country code: SM Free format text: LAPSE BECAUSE OF FAILURE TO SUBMIT A TRANSLATION OF THE DESCRIPTION OR TO PAY THE FEE WITHIN THE PRESCRIBED TIME-LIMIT Effective date: 20251112 |
|
| PG25 | Lapsed in a contracting state [announced via postgrant information from national office to epo] |
Ref country code: DK Free format text: LAPSE BECAUSE OF FAILURE TO SUBMIT A TRANSLATION OF THE DESCRIPTION OR TO PAY THE FEE WITHIN THE PRESCRIBED TIME-LIMIT Effective date: 20251112 |
|
| PG25 | Lapsed in a contracting state [announced via postgrant information from national office to epo] |
Ref country code: IT Free format text: LAPSE BECAUSE OF FAILURE TO SUBMIT A TRANSLATION OF THE DESCRIPTION OR TO PAY THE FEE WITHIN THE PRESCRIBED TIME-LIMIT Effective date: 20251112 |
|
| PG25 | Lapsed in a contracting state [announced via postgrant information from national office to epo] |
Ref country code: EE Free format text: LAPSE BECAUSE OF FAILURE TO SUBMIT A TRANSLATION OF THE DESCRIPTION OR TO PAY THE FEE WITHIN THE PRESCRIBED TIME-LIMIT Effective date: 20251112 |
|
| PG25 | Lapsed in a contracting state [announced via postgrant information from national office to epo] |
Ref country code: CZ Free format text: LAPSE BECAUSE OF FAILURE TO SUBMIT A TRANSLATION OF THE DESCRIPTION OR TO PAY THE FEE WITHIN THE PRESCRIBED TIME-LIMIT Effective date: 20251112 |
|
| PG25 | Lapsed in a contracting state [announced via postgrant information from national office to epo] |
Ref country code: SK Free format text: LAPSE BECAUSE OF FAILURE TO SUBMIT A TRANSLATION OF THE DESCRIPTION OR TO PAY THE FEE WITHIN THE PRESCRIBED TIME-LIMIT Effective date: 20251112 |
|
| PG25 | Lapsed in a contracting state [announced via postgrant information from national office to epo] |
Ref country code: SE Free format text: LAPSE BECAUSE OF FAILURE TO SUBMIT A TRANSLATION OF THE DESCRIPTION OR TO PAY THE FEE WITHIN THE PRESCRIBED TIME-LIMIT Effective date: 20251112 |