EP3892190A1 - Method for analyzing electrocardiography signal - Google Patents
Method for analyzing electrocardiography signal Download PDFInfo
- Publication number
- EP3892190A1 EP3892190A1 EP20176624.3A EP20176624A EP3892190A1 EP 3892190 A1 EP3892190 A1 EP 3892190A1 EP 20176624 A EP20176624 A EP 20176624A EP 3892190 A1 EP3892190 A1 EP 3892190A1
- Authority
- EP
- European Patent Office
- Prior art keywords
- wave
- ecg signal
- ecg
- signal
- spacing
- Prior art date
- Legal status (The legal status is an assumption and is not a legal conclusion. Google has not performed a legal analysis and makes no representation as to the accuracy of the status listed.)
- Pending
Links
Images


Classifications
-
- A—HUMAN NECESSITIES
- A61—MEDICAL OR VETERINARY SCIENCE; HYGIENE
- A61B—DIAGNOSIS; SURGERY; IDENTIFICATION
- A61B5/00—Measuring for diagnostic purposes; Identification of persons
- A61B5/02—Detecting, measuring or recording for evaluating the cardiovascular system, e.g. pulse, heart rate, blood pressure or blood flow
- A61B5/024—Measuring pulse rate or heart rate
- A61B5/0245—Measuring pulse rate or heart rate by using sensing means generating electric signals, i.e. ECG signals
-
- A—HUMAN NECESSITIES
- A61—MEDICAL OR VETERINARY SCIENCE; HYGIENE
- A61B—DIAGNOSIS; SURGERY; IDENTIFICATION
- A61B5/00—Measuring for diagnostic purposes; Identification of persons
- A61B5/24—Detecting, measuring or recording bioelectric or biomagnetic signals of the body or parts thereof
- A61B5/316—Modalities, i.e. specific diagnostic methods
- A61B5/318—Heart-related electrical modalities, e.g. electrocardiography [ECG]
- A61B5/346—Analysis of electrocardiograms
-
- A—HUMAN NECESSITIES
- A61—MEDICAL OR VETERINARY SCIENCE; HYGIENE
- A61B—DIAGNOSIS; SURGERY; IDENTIFICATION
- A61B5/00—Measuring for diagnostic purposes; Identification of persons
- A61B5/24—Detecting, measuring or recording bioelectric or biomagnetic signals of the body or parts thereof
- A61B5/316—Modalities, i.e. specific diagnostic methods
- A61B5/318—Heart-related electrical modalities, e.g. electrocardiography [ECG]
- A61B5/346—Analysis of electrocardiograms
- A61B5/349—Detecting specific parameters of the electrocardiograph cycle
- A61B5/352—Detecting R peaks, e.g. for synchronising diagnostic apparatus; Estimating R-R interval
-
- A—HUMAN NECESSITIES
- A61—MEDICAL OR VETERINARY SCIENCE; HYGIENE
- A61B—DIAGNOSIS; SURGERY; IDENTIFICATION
- A61B5/00—Measuring for diagnostic purposes; Identification of persons
- A61B5/24—Detecting, measuring or recording bioelectric or biomagnetic signals of the body or parts thereof
- A61B5/316—Modalities, i.e. specific diagnostic methods
- A61B5/318—Heart-related electrical modalities, e.g. electrocardiography [ECG]
- A61B5/346—Analysis of electrocardiograms
- A61B5/349—Detecting specific parameters of the electrocardiograph cycle
- A61B5/366—Detecting abnormal QRS complex, e.g. widening
-
- A—HUMAN NECESSITIES
- A61—MEDICAL OR VETERINARY SCIENCE; HYGIENE
- A61B—DIAGNOSIS; SURGERY; IDENTIFICATION
- A61B5/00—Measuring for diagnostic purposes; Identification of persons
- A61B5/72—Signal processing specially adapted for physiological signals or for diagnostic purposes
- A61B5/7235—Details of waveform analysis
- A61B5/7253—Details of waveform analysis characterised by using transforms
- A61B5/7257—Details of waveform analysis characterised by using transforms using Fourier transforms
-
- A—HUMAN NECESSITIES
- A61—MEDICAL OR VETERINARY SCIENCE; HYGIENE
- A61B—DIAGNOSIS; SURGERY; IDENTIFICATION
- A61B5/00—Measuring for diagnostic purposes; Identification of persons
- A61B5/72—Signal processing specially adapted for physiological signals or for diagnostic purposes
- A61B5/7235—Details of waveform analysis
- A61B5/7253—Details of waveform analysis characterised by using transforms
- A61B5/726—Details of waveform analysis characterised by using transforms using Wavelet transforms
-
- A—HUMAN NECESSITIES
- A61—MEDICAL OR VETERINARY SCIENCE; HYGIENE
- A61B—DIAGNOSIS; SURGERY; IDENTIFICATION
- A61B5/00—Measuring for diagnostic purposes; Identification of persons
- A61B5/72—Signal processing specially adapted for physiological signals or for diagnostic purposes
- A61B5/7235—Details of waveform analysis
- A61B5/7264—Classification of physiological signals or data, e.g. using neural networks, statistical classifiers, expert systems or fuzzy systems
-
- A—HUMAN NECESSITIES
- A61—MEDICAL OR VETERINARY SCIENCE; HYGIENE
- A61B—DIAGNOSIS; SURGERY; IDENTIFICATION
- A61B5/00—Measuring for diagnostic purposes; Identification of persons
- A61B5/72—Signal processing specially adapted for physiological signals or for diagnostic purposes
- A61B5/7271—Specific aspects of physiological measurement analysis
- A61B5/7275—Determining trends in physiological measurement data; Predicting development of a medical condition based on physiological measurements, e.g. determining a risk factor
Definitions
- the disclosure relates to a disease prediction method, and in particular to a method for analyzing an electrocardiography (ECG) signal.
- ECG electrocardiography
- the disclosure provides a method for analyzing an electrocardiography (ECG) signal, which can replace the use of risk factors to establish a model for prediction.
- ECG electrocardiography
- the method for analyzing the ECG signal of the disclosure includes the following steps.
- the ECG signal is measured through a sensor.
- One or more specified waveforms in the ECG signal are detected.
- Multiple ECG features from each specified waveform are captured.
- the ECG features are input into multiple candidate models to obtain multiple candidate scores.
- Each candidate score is compared with a standard value to obtain an ideal score among the candidate scores.
- One of the candidate models corresponding to the ideal score is selected as a risk prediction model to predict disease risk through the risk prediction model.
- the step of comparing each candidate score with the standard value includes the following steps. A mean absolute percentage error between each candidate score and the standard value is calculated. The candidate score corresponding to a smallest among the mean absolute percentage error is used as the ideal score.
- the method for analyzing the ECG signal further includes the following step.
- the standard value is obtained through a proportional risk model.
- the specified waveform includes a first wave, a second wave, and a third wave, wherein an amplitude of the third wave is greater than amplitudes of the first wave and the second wave.
- the step of detecting the specified waveform in the ECG signal includes the following steps.
- a first spacing mean, a first spacing standard deviation, and a root mean square of first spacing sum of squares between the third waves of two adjacent specified waveforms are calculated.
- a second spacing mean, a second spacing standard deviation, and a root mean square of second spacing sum of squares between the first wave and the second wave of each specified waveform are calculated.
- the first spacing mean, the first spacing standard deviation, the root mean square of first spacing sum of squares, the second spacing mean, the second spacing standard deviation, and the root mean square of second spacing sum of squares are used as ECG features.
- the step of inputting the ECG features into the candidate models to obtain the candidate scores includes the following step.
- Multiple basic feature and ECG features are input into the candidate models, wherein the basic feature includes basic features such as gender, age, body mass index, blood pressure value, smoking index, etc.
- the method for analyzing the ECG signal further includes the following step. Whether the ECG signal is saturated is determined; and the ECG signal is abandoned if the ECG signal is saturated.
- the step of determining whether the ECG signal is saturated includes the following step. Whether a signal value in the ECG signal exceeds a preset value is determined; and the ECG signal is judged as saturated if the signal value exceeds the preset value.
- the method for analyzing the ECG signal further includes the following step.
- the ECG signal is cut into multiple signal segments to detect the specified waveform in each signal segment.
- a pre-processing is performed on an original ECG signal.
- the pre-processing includes the following steps. An interpolation is used to add one or more missing values, when the original ECG signal is judged as having a missing signal, to obtain a first pre-processing signal.
- the first pre-processing signal is adjusted to a fixed length to obtain a second pre-processing signal.
- a smoothing process is performed, after removing displacement of the second pre-processing signal, to obtain an ECG signal after pre-processing.
- the disclosure is combined with the ECG signal to capture features from the ECG signal to predict the risk of heart disease, so as to replace the use of risk factors to establish a model for prediction as in the past.
- the time taken for people to go to the hospital for examination can be saved without limitation to live while taking care of health.
- FIG. 1 is a block diagram of an electronic device according to an embodiment of the disclosure.
- an electronic device 100 includes a sensor 110, a processor 120, and a storage device 130.
- the processor 120 is coupled to the sensor 110 and the storage device 130.
- the electronic device 100 may be a wearable device and the sensor 110 is, for example, an electrocardiography (ECG) instrument.
- ECG electrocardiography
- the processor 120 is, for example, a central processing unit (CPU), a physics processing unit (PPU), a programmable microprocessor, an embedded control chip, a digital signal processor (DSP), an application specific integrated circuits (ASIC), or other similar devices.
- CPU central processing unit
- PPU physics processing unit
- DSP digital signal processor
- ASIC application specific integrated circuits
- the storage device 130 is, for example, any type of fixed or removable random access memory (RAM), read-only memory (ROM), flash memory, hard disk, other similar devices, or a combination of the aforementioned devices. Multiple code snippets are stored in the storage device 130. The code snippets are performed by the processor 120 after being installed to implement the following method for analyzing the ECG signal.
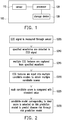
- FIG. 2 is a flowchart of a method for analyzing an ECG signal according to an embodiment of the disclosure.
- the ECG signal is measured through the sensor 110.
- the processor 120 may first determine whether the ECG signal is saturated. If the ECG signal is saturated, the ECG signal is abandoned. For example, whether a signal value in the ECG signal exceeds a preset value and remains constant is determined. If the signal value exceeds the preset value and remains constant, the ECG signal is judged as saturated.
- the processor 120 detects a specified waveform in the ECG signal.
- the specified waveform includes a first wave, a second wave, and a third wave, wherein an amplitude of the third wave is greater than amplitudes of the first wave and the second wave.
- the specified waveform is a QRS wave
- the third wave is an R wave
- the first wave and the second wave are respectively a Q wave and an S wave.
- the ECG signal has three types of more significant waveforms, that is, a P wave, the QRS wave, and a T wave.
- the ECG signal is formed from the three types of waves continuously appearing.
- the P wave represents the depolarization of the atrium
- the QRS wave represents the depolarization of the ventricle
- the T wave represents the repolarization of the ventricle.
- the QRS wave is a waveform formed from the Q wave, the R wave, and the S wave.
- the ECG signal may be first cut into multiple signal segments to respectively detect the specified waveforms in the signal segments. For example, a signal region is cut every 6 seconds.
- the processor 120 may first reduce the interference of capturing waveform features through the algorithm of signal time-frequency conversion.
- the processor 120 will further perform a pre-processing on an original ECG signal.
- the pre-processing includes: determining whether there is a missing signal in the original ECG signal. If there is a missing signal, one or more missing values are first added by an interpolation to obtain a first pre-processing signal. After that, the first pre-processing signal is adjusted to a fixed length to obtain a second pre-processing signal.
- the smoothing cubic spline is used on the second pre-processing signal to remove displacement of the second pre-processing signal and a smoothing process is performed to obtain an ECG signal after pre-processing.
- the smoothing process eliminates signal noise so that the signal is smooth by using, for example, the fast Fourier transform and the Butterworth filter.
- the wavelet transform may be used on the ECG signal after the pre-processing to analyze the waveform of the normal cardiac cycle and capture the position of the specified waveform in the ECG signal. That is, the processor 120 performs the wavelet transform on the ECG signal, thereby increasing the intensity of the QRS wave to be detected.
- the Q wave and the S wave are medically defined as lowest points respectively found within a range of 0.01 ⁇ sampling rate on the left and right sides of the R wave position (that is, the respective widths of the Q wave and the S wave with the R wave is within 0.01s).
- FIG. 3 is a schematic diagram of an original ECG signal according to an embodiment of the disclosure.
- FIG. 4 is a schematic diagram of an ECG signal after pre-processing according to an embodiment of the disclosure. It can be clearly seen from FIG. 3 and FIG. 4 that the position of the specified waveform in the ECG signal after pre-processing (as shown in FIG. 4 ) may more easily detected.
- the QRS wave detected may be further used to determine whether the ECG signal is abnormal. That is, after the specified waveform is detected, the specified waveform is analyzed to determine whether the ECG signal is abnormal.
- the processor 120 determines whether a relative positional relationship between the first wave and the second wave of each specified waveform is the same as the relative positional relationship between the first wave and the second wave of other specified waveforms, so that the ECG signal is judged as abnormal when relative positions of the first wave and the second wave of one of the specified waveforms are different from the relative positions of the first wave and the second wave of other specified waveforms.
- the Q waves of other sets of QRS waves will also be higher than the S waves; conversely, if the Q wave of one set of the QRS wave is lower than the S wave, the Q waves of other sets of QRS waves will also be lower than the S waves.
- the R wave may be further used to convert the heart rate to determine whether the heart rate is within a preset range (for example, 40 to 180 bpm). If the heart rate falls within the preset range, the ECG signal is judged as normal. If the heart rate does not fall within the preset range, the ECG signal is judged as abnormal.
- a preset range for example, 40 to 180 bpm
- the processor 120 captures multiple ECG features from each specified waveform.
- the processor 120 calculates a first spacing mean, a first spacing standard deviation, and a root mean square of first spacing sum of squares between the third waves of two adjacent specified waveforms.
- the processor 120 calculates a second spacing mean, a second spacing standard deviation, and a root mean square of second spacing sum of squares between the first wave and the second wave of each specified waveform.
- the processor 120 uses the first spacing mean, the first spacing standard deviation, the root mean square of first spacing sum of squares, the second spacing mean, the second spacing standard deviation, and the root mean square of second spacing sum of squares as the ECG features.
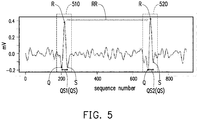
- FIG. 5 is a schematic diagram of QRS waves according to an embodiment of the disclosure.
- FIG. 5 shows a QRS wave 510 and a QRS wave 520 as examples for illustration.
- the QRS wave 510 and the QRS wave 520 respectively have three points, Q, R, and S (hereinafter referred to as Q wave, R wave, and S wave).
- the processor 120 After detecting the positions of the QRS wave 510 and the QRS wave 520, the processor 120 further calculates a first spacing RR between the R waves of the two adjacent QRS wave 510 and QRS wave 520, a second spacing QS1 between the Q wave and the S wave of the QRS wave 510, and a second spacing QS2 (second spacings are collectively referred to as QS hereinafter) between the Q wave and the S wave of the QRS wave 520
- the first spacing mean, the first spacing standard deviation, and the root mean square of first spacing sum of squares respectively are, for example, the mean, standard deviation, and root mean square of sum of squares between the first spacings RR of multiple QRS waves.
- the second spacing mean, the second spacing standard deviation, and the root mean square of second spacing sum of squares respectively are, for example, the mean, standard deviation, and root mean square of sum of squares between the Q wave and the S wave of each of the multiple QRS waves.
- the normal time limit of the first spacing RR is about 0.6 to 1.0 seconds to see whether the mean heart rate is within a reasonable range.
- the normal time limit of the second spacing QS is about 0.08 to 0.10 seconds to see whether the Q wave and the S wave are within a reasonable range.
- the remaining standard deviation, root mean square, etc. are all indicators to determine whether the ECG signal is stable.
- Step S220 the processor 120 inputs the ECG features into multiple candidate models to obtain multiple candidate scores.
- a machine learning model two types of methods, a machine learning model and a deep learning model, are adopted.
- a basic feature is also adopted.
- the basic feature includes at least one of gender, age, body mass index (BMI), blood pressure value, and smoking index.
- the smoking index represents whether the patient has a habit of smoking.
- the machine learning model and the deep learning model there are two ways, that is, the machine learning model and the deep learning model, which will be exemplified in the following.
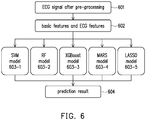
- FIG. 6 is a flowchart of a machine learning model according to an embodiment of the disclosure.
- machine learning models such as a support vector machine (SVM) model 603-1, a random forest (RF) model 603-2, an eXtreme gradient boosting (XGBoost) model 603-3, a multivariate adaptive regression splines (MARS) model 603-4, a least absolute shrinkage and selection operator (LASSO) model 603-5, etc. are adopted.
- the ECG features are captured from an ECG signal after pre-processing 601. After that, a basic feature and ECG features 602 are input into the respective machine learning models (603-1 to 603-5), thereby obtaining multiple prediction results (candidate scores) 604.
- the differences from the machine learning model method are that in addition to putting the basic feature and ECG features 602, the sequence of the ECG signal may also be directly put in the deep learning model, so that in addition to learning the ECG features captured, the deep learning model may also automatically capture important signal features from the ECG signal.
- the ECG signal after pre-processing 601 is put in a one-dimensional convolutional neural network (CNN) model 701 before putting in a long-short term memory (LSTM) model 702 to establish features relevant to sequence order.
- CNN convolutional neural network
- LSTM long-short term memory
- the features relevant to the sequence are connected with the basic feature and ECG features 602 through a full connected layer 703 to obtain a feature sequence 704.
- the feature sequence 704 is input into a deep neural networks (DNN) model 705, thereby obtaining a prediction result (candidate score) 706.
- DNN deep neural networks
- Step S225 the processor 120 compares each candidate score with a standard value to obtain an ideal score from the candidate scores. For example, the mean absolute percentage error (MAPE) between each candidate score and the standard value is calculated and the candidate score corresponding to a smallest among the MAPE is used as the ideal score.
- the standard value is obtained through a conventional model, such as a proportional risk model. Then, a cross-validation is performed multiple times (for example, 10 times) to validate the stability of the model before selecting the candidate model with a smaller MAPE.
- the ideal score may also be determined by calculating the candidate scores multiple times.
- Step S230 the processor 120 selects the candidate model corresponding to the ideal score as the risk prediction model to predict disease risk through the risk prediction model.
- the disclosure is combined with the ECG signal to capture features from the ECG signal to predict the risk of heart disease, so as to replace the use of risk factors to establish a model for prediction as in the past.
- the time taken for people to go to the hospital for examination can be saved without limitation to live while taking care of health.
- a wearable device may be used to measure the ECG, instantly monitor the health condition of the heart, and predict the future risk of heart disease using the method, so as to warn the user of early treatment in the case where a high risk is predicted.
Landscapes
- Health & Medical Sciences (AREA)
- Life Sciences & Earth Sciences (AREA)
- Engineering & Computer Science (AREA)
- Cardiology (AREA)
- Physics & Mathematics (AREA)
- Animal Behavior & Ethology (AREA)
- Public Health (AREA)
- Biomedical Technology (AREA)
- Heart & Thoracic Surgery (AREA)
- Medical Informatics (AREA)
- Molecular Biology (AREA)
- Surgery (AREA)
- Biophysics (AREA)
- General Health & Medical Sciences (AREA)
- Pathology (AREA)
- Veterinary Medicine (AREA)
- Signal Processing (AREA)
- Physiology (AREA)
- Artificial Intelligence (AREA)
- Computer Vision & Pattern Recognition (AREA)
- Psychiatry (AREA)
- Mathematical Physics (AREA)
- Evolutionary Computation (AREA)
- Fuzzy Systems (AREA)
- Measurement And Recording Of Electrical Phenomena And Electrical Characteristics Of The Living Body (AREA)
Abstract
Description
- The disclosure relates to a disease prediction method, and in particular to a method for analyzing an electrocardiography (ECG) signal.
- In modern life, the prevention of heart disease is becoming more and more important. If the heart disease can be detected and treated early, there will be better effects. Therefore, predicting the risk of heart disease has become an important issue. In the prior art, most predictions of heart disease risk use risk factors to establish models, such as using age, total cholesterol, high-density cholesterol, blood pressure, smoking or non-smoking, diabetes, etc. to establish the Cox proportional hazards model to predict the risk of heart disease. However, obtaining the risk factors of the condition inside the body using certain invasive methods is resisted by some people, thereby rejecting going to the hospital for examination.
- In the past, doctors usually use changes in the ECG to help identify the type of heart disease from different waveform features. The sources for collecting ECG data are all from equipment in the hospital, but the ECG examined in the hospital can only determine the condition at that moment and cannot be instantly measured when people are feeling unwell.
- The disclosure provides a method for analyzing an electrocardiography (ECG) signal, which can replace the use of risk factors to establish a model for prediction.
- The method for analyzing the ECG signal of the disclosure includes the following steps. The ECG signal is measured through a sensor. One or more specified waveforms in the ECG signal are detected. Multiple ECG features from each specified waveform are captured. The ECG features are input into multiple candidate models to obtain multiple candidate scores. Each candidate score is compared with a standard value to obtain an ideal score among the candidate scores. One of the candidate models corresponding to the ideal score is selected as a risk prediction model to predict disease risk through the risk prediction model.
- In an embodiment of the disclosure, the step of comparing each candidate score with the standard value includes the following steps. A mean absolute percentage error between each candidate score and the standard value is calculated. The candidate score corresponding to a smallest among the mean absolute percentage error is used as the ideal score.
- In an embodiment of the disclosure, the method for analyzing the ECG signal further includes the following step. The standard value is obtained through a proportional risk model.
- In an embodiment of the disclosure, the specified waveform includes a first wave, a second wave, and a third wave, wherein an amplitude of the third wave is greater than amplitudes of the first wave and the second wave. After the specified waveform in the ECG signal is detected, whether a relative positional relationship between the first wave and the second wave of each specified waveform is the same as the relative positional relationship between the first wave and the second wave of other specified waveforms is determined to judge the ECG signal as abnormal when relative positions of the first wave and the second wave of one of the specified waveforms are different from the relative positions of the first wave and the second wave of other specified waveforms.
- In an embodiment of the disclosure, the step of detecting the specified waveform in the ECG signal includes the following steps. A first spacing mean, a first spacing standard deviation, and a root mean square of first spacing sum of squares between the third waves of two adjacent specified waveforms are calculated. A second spacing mean, a second spacing standard deviation, and a root mean square of second spacing sum of squares between the first wave and the second wave of each specified waveform are calculated. The first spacing mean, the first spacing standard deviation, the root mean square of first spacing sum of squares, the second spacing mean, the second spacing standard deviation, and the root mean square of second spacing sum of squares are used as ECG features.
- In an embodiment of the disclosure, the step of inputting the ECG features into the candidate models to obtain the candidate scores includes the following step. Multiple basic feature and ECG features are input into the candidate models, wherein the basic feature includes basic features such as gender, age, body mass index, blood pressure value, smoking index, etc.
- In an embodiment of the disclosure, the method for analyzing the ECG signal further includes the following step. Whether the ECG signal is saturated is determined; and the ECG signal is abandoned if the ECG signal is saturated.
- In an embodiment of the disclosure, the step of determining whether the ECG signal is saturated includes the following step. Whether a signal value in the ECG signal exceeds a preset value is determined; and the ECG signal is judged as saturated if the signal value exceeds the preset value.
- In an embodiment of the disclosure, the method for analyzing the ECG signal further includes the following step. The ECG signal is cut into multiple signal segments to detect the specified waveform in each signal segment.
- In an embodiment of the disclosure, after the ECG signal is measured through the sensor, a pre-processing is performed on an original ECG signal. The pre-processing includes the following steps. An interpolation is used to add one or more missing values, when the original ECG signal is judged as having a missing signal, to obtain a first pre-processing signal. The first pre-processing signal is adjusted to a fixed length to obtain a second pre-processing signal. A smoothing process is performed, after removing displacement of the second pre-processing signal, to obtain an ECG signal after pre-processing.
- Based on the above, the disclosure is combined with the ECG signal to capture features from the ECG signal to predict the risk of heart disease, so as to replace the use of risk factors to establish a model for prediction as in the past. As such, the time taken for people to go to the hospital for examination can be saved without limitation to live while taking care of health.
- To make the aforementioned and other features of the disclosure more comprehensible, several embodiments accompanied with drawings are described in detail as follows.
-
-
FIG. 1 is a block diagram of an electronic device according to an embodiment of the disclosure. -
FIG. 2 is a flowchart of a method for analyzing an electrocardiography (ECG) signal according to an embodiment of the disclosure. -
FIG. 3 is a schematic diagram of an original ECG signal according to an embodiment of the disclosure. -
FIG. 4 is a schematic diagram of an ECG signal after pre-processing according to an embodiment of the disclosure. -
FIG. 5 is a schematic diagram of QRS waves according to an embodiment of the disclosure. -
FIG. 6 is a flowchart of a machine learning model according to an embodiment of the disclosure. -
FIG. 7 is a flowchart of a deep learning model according to an embodiment of the disclosure. -
FIG. 1 is a block diagram of an electronic device according to an embodiment of the disclosure. Referring toFIG. 1 , anelectronic device 100 includes asensor 110, aprocessor 120, and astorage device 130. Theprocessor 120 is coupled to thesensor 110 and thestorage device 130. Here, theelectronic device 100 may be a wearable device and thesensor 110 is, for example, an electrocardiography (ECG) instrument. The user wears theelectronic device 100 on the body for thesensor 110 to measure the position of an ECG signal. - The
processor 120 is, for example, a central processing unit (CPU), a physics processing unit (PPU), a programmable microprocessor, an embedded control chip, a digital signal processor (DSP), an application specific integrated circuits (ASIC), or other similar devices. - The
storage device 130 is, for example, any type of fixed or removable random access memory (RAM), read-only memory (ROM), flash memory, hard disk, other similar devices, or a combination of the aforementioned devices. Multiple code snippets are stored in thestorage device 130. The code snippets are performed by theprocessor 120 after being installed to implement the following method for analyzing the ECG signal. -
FIG. 2 is a flowchart of a method for analyzing an ECG signal according to an embodiment of the disclosure. Referring toFIG. 2 , in Step S205, the ECG signal is measured through thesensor 110. Theprocessor 120 may first determine whether the ECG signal is saturated. If the ECG signal is saturated, the ECG signal is abandoned. For example, whether a signal value in the ECG signal exceeds a preset value and remains constant is determined. If the signal value exceeds the preset value and remains constant, the ECG signal is judged as saturated. - Next, in Step S210, the
processor 120 detects a specified waveform in the ECG signal. The specified waveform includes a first wave, a second wave, and a third wave, wherein an amplitude of the third wave is greater than amplitudes of the first wave and the second wave. Here, the specified waveform is a QRS wave, the third wave is an R wave, and the first wave and the second wave are respectively a Q wave and an S wave. - Generally speaking, in a normal cardiac cycle, the ECG signal has three types of more significant waveforms, that is, a P wave, the QRS wave, and a T wave. The ECG signal is formed from the three types of waves continuously appearing. The P wave represents the depolarization of the atrium, the QRS wave represents the depolarization of the ventricle, and the T wave represents the repolarization of the ventricle. The QRS wave is a waveform formed from the Q wave, the R wave, and the S wave.
- Here, after the
processor 120 receives the ECG signal from thesensor 110, in order to facilitate processing, the ECG signal may be first cut into multiple signal segments to respectively detect the specified waveforms in the signal segments. For example, a signal region is cut every 6 seconds. - In the embodiment, the ECG signal obtained will have more noise. Therefore, the
processor 120 may first reduce the interference of capturing waveform features through the algorithm of signal time-frequency conversion. In addition, theprocessor 120 will further perform a pre-processing on an original ECG signal. The pre-processing includes: determining whether there is a missing signal in the original ECG signal. If there is a missing signal, one or more missing values are first added by an interpolation to obtain a first pre-processing signal. After that, the first pre-processing signal is adjusted to a fixed length to obtain a second pre-processing signal. Next, the smoothing cubic spline is used on the second pre-processing signal to remove displacement of the second pre-processing signal and a smoothing process is performed to obtain an ECG signal after pre-processing. The smoothing process eliminates signal noise so that the signal is smooth by using, for example, the fast Fourier transform and the Butterworth filter. Then, the wavelet transform may be used on the ECG signal after the pre-processing to analyze the waveform of the normal cardiac cycle and capture the position of the specified waveform in the ECG signal. That is, theprocessor 120 performs the wavelet transform on the ECG signal, thereby increasing the intensity of the QRS wave to be detected. Then, a threshold value is defined, signals below the threshold value are eliminated, and a highest point in the uneliminated signals is found as the position of the R wave. The Q wave and the S wave are medically defined as lowest points respectively found within a range of 0.01×sampling rate on the left and right sides of the R wave position (that is, the respective widths of the Q wave and the S wave with the R wave is within 0.01s). -
FIG. 3 is a schematic diagram of an original ECG signal according to an embodiment of the disclosure.FIG. 4 is a schematic diagram of an ECG signal after pre-processing according to an embodiment of the disclosure. It can be clearly seen fromFIG. 3 and FIG. 4 that the position of the specified waveform in the ECG signal after pre-processing (as shown inFIG. 4 ) may more easily detected. - In addition, since it is impossible to ensure whether the operating or recording environment of the
electronic device 100 will affect the quality of signal measurement, causing the signal to be an abnormal ECG signal, thereby affecting the subsequent analysis results, the QRS wave detected may be further used to determine whether the ECG signal is abnormal. That is, after the specified waveform is detected, the specified waveform is analyzed to determine whether the ECG signal is abnormal. Here, theprocessor 120 determines whether a relative positional relationship between the first wave and the second wave of each specified waveform is the same as the relative positional relationship between the first wave and the second wave of other specified waveforms, so that the ECG signal is judged as abnormal when relative positions of the first wave and the second wave of one of the specified waveforms are different from the relative positions of the first wave and the second wave of other specified waveforms. - Specifically, under normal circumstances, if the Q wave of one set of the QRS wave is higher than the S wave, the Q waves of other sets of QRS waves will also be higher than the S waves; conversely, if the Q wave of one set of the QRS wave is lower than the S wave, the Q waves of other sets of QRS waves will also be lower than the S waves.
- In addition, the R wave may be further used to convert the heart rate to determine whether the heart rate is within a preset range (for example, 40 to 180 bpm). If the heart rate falls within the preset range, the ECG signal is judged as normal. If the heart rate does not fall within the preset range, the ECG signal is judged as abnormal.
- Returning to
FIG. 2 , after the specified waveform is found, in Step S215, theprocessor 120 captures multiple ECG features from each specified waveform. In the embodiment, theprocessor 120 calculates a first spacing mean, a first spacing standard deviation, and a root mean square of first spacing sum of squares between the third waves of two adjacent specified waveforms. Also, theprocessor 120 calculates a second spacing mean, a second spacing standard deviation, and a root mean square of second spacing sum of squares between the first wave and the second wave of each specified waveform. Theprocessor 120 uses the first spacing mean, the first spacing standard deviation, the root mean square of first spacing sum of squares, the second spacing mean, the second spacing standard deviation, and the root mean square of second spacing sum of squares as the ECG features. -
FIG. 5 is a schematic diagram of QRS waves according to an embodiment of the disclosure.FIG. 5 shows aQRS wave 510 and aQRS wave 520 as examples for illustration. TheQRS wave 510 and theQRS wave 520 respectively have three points, Q, R, and S (hereinafter referred to as Q wave, R wave, and S wave). - After detecting the positions of the
QRS wave 510 and theQRS wave 520, theprocessor 120 further calculates a first spacing RR between the R waves of the twoadjacent QRS wave 510 andQRS wave 520, a second spacing QS1 between the Q wave and the S wave of theQRS wave 510, and a second spacing QS2 (second spacings are collectively referred to as QS hereinafter) between the Q wave and the S wave of theQRS wave 520 The first spacing mean, the first spacing standard deviation, and the root mean square of first spacing sum of squares respectively are, for example, the mean, standard deviation, and root mean square of sum of squares between the first spacings RR of multiple QRS waves. The second spacing mean, the second spacing standard deviation, and the root mean square of second spacing sum of squares respectively are, for example, the mean, standard deviation, and root mean square of sum of squares between the Q wave and the S wave of each of the multiple QRS waves. Here, the normal time limit of the first spacing RR is about 0.6 to 1.0 seconds to see whether the mean heart rate is within a reasonable range. The normal time limit of the second spacing QS is about 0.08 to 0.10 seconds to see whether the Q wave and the S wave are within a reasonable range. The remaining standard deviation, root mean square, etc. are all indicators to determine whether the ECG signal is stable. - After that, in Step S220, the
processor 120 inputs the ECG features into multiple candidate models to obtain multiple candidate scores. In the process of establishing a risk prediction model, two types of methods, a machine learning model and a deep learning model, are adopted. In addition to the ECG features captured from the ECG signal after pre-processing, a basic feature is also adopted. The basic feature includes at least one of gender, age, body mass index (BMI), blood pressure value, and smoking index. The smoking index represents whether the patient has a habit of smoking. In establishing the future risk prediction model, there are two ways, that is, the machine learning model and the deep learning model, which will be exemplified in the following. -
FIG. 6 is a flowchart of a machine learning model according to an embodiment of the disclosure. InFIG. 6 , machine learning models such as a support vector machine (SVM) model 603-1, a random forest (RF) model 603-2, an eXtreme gradient boosting (XGBoost) model 603-3, a multivariate adaptive regression splines (MARS) model 603-4, a least absolute shrinkage and selection operator (LASSO) model 603-5, etc. are adopted. The ECG features are captured from an ECG signal after pre-processing 601. After that, a basic feature and ECG features 602 are input into the respective machine learning models (603-1 to 603-5), thereby obtaining multiple prediction results (candidate scores) 604. - In the deep learning method, the differences from the machine learning model method are that in addition to putting the basic feature and ECG features 602, the sequence of the ECG signal may also be directly put in the deep learning model, so that in addition to learning the ECG features captured, the deep learning model may also automatically capture important signal features from the ECG signal. Referring to
FIG. 7 , the ECG signal after pre-processing 601 is put in a one-dimensional convolutional neural network (CNN)model 701 before putting in a long-short term memory (LSTM)model 702 to establish features relevant to sequence order. Next, the features relevant to the sequence are connected with the basic feature and ECG features 602 through a fullconnected layer 703 to obtain afeature sequence 704. After that, thefeature sequence 704 is input into a deep neural networks (DNN)model 705, thereby obtaining a prediction result (candidate score) 706. - Returning to
FIG. 2 , in Step S225, theprocessor 120 compares each candidate score with a standard value to obtain an ideal score from the candidate scores. For example, the mean absolute percentage error (MAPE) between each candidate score and the standard value is calculated and the candidate score corresponding to a smallest among the MAPE is used as the ideal score. The standard value is obtained through a conventional model, such as a proportional risk model. Then, a cross-validation is performed multiple times (for example, 10 times) to validate the stability of the model before selecting the candidate model with a smaller MAPE. In addition, the ideal score may also be determined by calculating the candidate scores multiple times. - After that, in Step S230, the
processor 120 selects the candidate model corresponding to the ideal score as the risk prediction model to predict disease risk through the risk prediction model. - In summary, the disclosure is combined with the ECG signal to capture features from the ECG signal to predict the risk of heart disease, so as to replace the use of risk factors to establish a model for prediction as in the past. As such, the time taken for people to go to the hospital for examination can be saved without limitation to live while taking care of health. Moreover, a wearable device may be used to measure the ECG, instantly monitor the health condition of the heart, and predict the future risk of heart disease using the method, so as to warn the user of early treatment in the case where a high risk is predicted.
-
- 100: electronic device
- 110: sensor
- 120: processor
- 130: storage device
- S205-S230: Steps of method for analyzing ECG signal
- 510, 520: QRS wave
- 601: ECG signal after pre-processing
- 602: basic feature and ECG features
- 603-1: SVM model
- 603-2: RF model
- 603-3: XGBoost model
- 603-4: MARS model
- 603-5: LASSO model
- 701: CNN model
- 702: LSTM model
- 703: full connected layer
- 704: feature sequence
- Q, R, S: wave
- RR: first spacing
- QS, QS1, QS2: second spacing
Claims (10)
- A method for analyzing an electrocardiography (ECG) signal, comprising:measuring an ECG signal through a sensor (110);detecting one or more specified waveforms in the ECG signal;capturing a plurality of ECG features from each of the specified waveforms;inputting the plurality of ECG features into a plurality of candidate models to obtain a plurality of candidate scores;comparing each of the candidate scores with a standard value to obtain an ideal score among the plurality of candidate scores; andselecting one of the candidate models corresponding to the ideal score as a risk prediction model to predict disease risk through the risk prediction model.
- The method for analyzing an ECG signal according to claim 1, wherein the step of comparing each of the candidate scores with the standard value comprises:calculating a mean absolute percentage error between each of the candidate scores and the standard value; andusing a candidate score corresponding to a smallest among the mean absolute percentage error as the ideal score.
- The method for analyzing an ECG signal according to claim 2, further comprising:
obtaining the standard value through a proportional risk model. - The method for analyzing an ECG signal according to one of the preceding claims, wherein each of the specified waveforms comprises a first wave, a second wave, and a third wave, wherein an amplitude of the third wave is greater than amplitudes of the first wave and the second wave, and
after detecting the specified waveform in the ECG signal, the method further comprises:
determining whether a relative positional relationship between the first wave and the second wave of each of the specified waveforms is the same as the relative positional relationship between the first wave and the second wave of other specified waveforms, so that the ECG signal is judged as abnormal when relative positions of the first wave and the second wave of one of the specified waveforms are different from the relative positions of the first wave and the second wave of other specified waveforms. - The method for analyzing an ECG signal according to claim 4, wherein the step of detecting the specified waveform in the ECG signal comprises:calculating a first spacing (RR) mean, a first spacing (RR) standard deviation, and a root mean square of first spacing (RR) sum of squares between the third waves of two adjacent specified waveforms;calculating a second spacing (QS, QS1, QS2) mean, a second spacing (QS, QS1, QS2) standard deviation, and a root mean square of second spacing (QS, QS1, QS2) sum of squares between the first wave and the second wave of each of the specified waveforms; andusing the first spacing (RR) mean, the first spacing (RR) standard deviation, the root mean square of first spacing (RR) sum of squares, the second spacing (QS, QS1, QS2) mean, the second spacing (QS, QS1, QS2) standard deviation, and the root mean square of second spacing (QS, QS1, QS2) sum of squares as the plurality of ECG features.
- The method for analyzing an ECG signal according to one of the preceding claims, wherein the step of inputting the plurality of ECG features into the plurality of candidate models to obtain the plurality of candidate scores comprises:
inputting a basic feature and the plurality of ECG features into the plurality of candidate models, wherein the basic feature comprises at least one of a gender, an age, a body mass index, a blood pressure value, and a smoking index. - The method for analyzing an ECG signal according to one of the preceding claims, further comprising:determining whether the ECG signal is saturated; andabandoning the ECG signal if the ECG signal is saturated.
- The method for analyzing an ECG signal according to one of the preceding claims, wherein the step of determining whether the ECG signal is saturated comprises:determine whether a signal value in the ECG signal exceeds a preset value; andjudging the ECG signal as saturated if the signal value exceeds the preset value.
- The method for analyzing an ECG signal according to one of the preceding claims, further comprising:
cutting the ECG signal into a plurality of signal segments to detect the specified waveform in each of the signal segments. - The method for analyzing an ECG signal according to one of the preceding claims, wherein the step of measuring the ECG signal through the sensor (110) comprises:
performing a pre-processing on an original ECG signal, the pre-processing comprising:using an interpolation to add one or more missing values, when the original ECG signal is judged to have a missing signal, to obtain a first pre-processing signal;adjusting the first pre-processing signal to a fixed length to obtain a second pre-processing signal; andperforming a smoothing process, after removing displacement of the second pre-processing signal, to obtain an ECG signal after pre-processing (601).
Applications Claiming Priority (1)
| Application Number | Priority Date | Filing Date | Title |
|---|---|---|---|
| TW109112203A TWI784256B (en) | 2020-04-10 | 2020-04-10 | Method for analyzing electrocardiography signal |
Publications (1)
| Publication Number | Publication Date |
|---|---|
| EP3892190A1 true EP3892190A1 (en) | 2021-10-13 |
Family
ID=70861222
Family Applications (1)
| Application Number | Title | Priority Date | Filing Date |
|---|---|---|---|
| EP20176624.3A Pending EP3892190A1 (en) | 2020-04-10 | 2020-05-26 | Method for analyzing electrocardiography signal |
Country Status (3)
| Country | Link |
|---|---|
| US (1) | US12042305B2 (en) |
| EP (1) | EP3892190A1 (en) |
| TW (1) | TWI784256B (en) |
Families Citing this family (4)
| Publication number | Priority date | Publication date | Assignee | Title |
|---|---|---|---|---|
| KR102430779B1 (en) * | 2020-09-04 | 2022-08-09 | 주식회사 뷰노 | Disease judgement method |
| TWI790479B (en) * | 2020-09-17 | 2023-01-21 | 宏碁股份有限公司 | Physiological status evaluation method and physiological status evaluation device |
| US12257060B2 (en) | 2021-03-29 | 2025-03-25 | Pacesetter, Inc. | Methods and systems for predicting arrhythmia risk utilizing machine learning models |
| CN114366466B (en) * | 2021-12-10 | 2023-11-24 | 上海工程技术大学 | Walking-assist nursing robot integrating health information monitoring and prediction |
Citations (1)
| Publication number | Priority date | Publication date | Assignee | Title |
|---|---|---|---|---|
| US20140371610A1 (en) * | 2013-06-14 | 2014-12-18 | Massachusetts Institute Of Technology | Method and apparatus for beat-space frequency domain prediction of cardiovascular death after acute coronary event |
Family Cites Families (8)
| Publication number | Priority date | Publication date | Assignee | Title |
|---|---|---|---|---|
| US8244338B2 (en) * | 2003-11-26 | 2012-08-14 | Angel Medical Systems, Inc. | Cardiac event detection over varying time scale |
| US20120123232A1 (en) * | 2008-12-16 | 2012-05-17 | Kayvan Najarian | Method and apparatus for determining heart rate variability using wavelet transformation |
| US8787638B2 (en) * | 2011-04-07 | 2014-07-22 | The Chinese University Of Hong Kong | Method and device for retinal image analysis |
| US10806374B2 (en) * | 2014-08-25 | 2020-10-20 | Georgia Tech Research Corporation | Noninvasive systems and methods for monitoring health characteristics |
| EP3204881B1 (en) * | 2014-11-14 | 2021-05-26 | Zoll Medical Corporation | Medical premonitory event estimation |
| WO2016201130A1 (en) | 2015-06-09 | 2016-12-15 | University Of Connecticut | Method and apparatus for heart rate monitoring using an electrocardiogram sensor |
| WO2019046854A1 (en) | 2017-09-01 | 2019-03-07 | University Of Cincinnati | System, method, computer program product and apparatus for dynamic predictive monitoring in the critical health assessment and outcomes study/score/(chaos) |
| TWI663958B (en) * | 2017-12-28 | 2019-07-01 | 映泰股份有限公司 | Apparatus for electrocardiography |
-
2020
- 2020-04-10 TW TW109112203A patent/TWI784256B/en active
- 2020-05-13 US US15/930,453 patent/US12042305B2/en active Active
- 2020-05-26 EP EP20176624.3A patent/EP3892190A1/en active Pending
Patent Citations (1)
| Publication number | Priority date | Publication date | Assignee | Title |
|---|---|---|---|---|
| US20140371610A1 (en) * | 2013-06-14 | 2014-12-18 | Massachusetts Institute Of Technology | Method and apparatus for beat-space frequency domain prediction of cardiovascular death after acute coronary event |
Non-Patent Citations (4)
| Title |
|---|
| ADITYA KHOSLA ET AL: "An integrated machine learning approach to stroke prediction", PROCEEDINGS OF THE 16TH ACM SIGKDD INTERNATIONAL CONFERENCE ON KNOWLEDGE DISCOVERY AND DATA MINING, KDD '10, ACM PRESS, NEW YORK, NEW YORK, USA, 25 July 2010 (2010-07-25), pages 183 - 192, XP058270576, ISBN: 978-1-4503-0055-1, DOI: 10.1145/1835804.1835830 * |
| DIVYA SHANMUGAM ET AL: "Multiple Instance Learning for ECG Risk Stratification", ARXIV.ORG, CORNELL UNIVERSITY LIBRARY, 201 OLIN LIBRARY CORNELL UNIVERSITY ITHACA, NY 14853, 2 December 2018 (2018-12-02), XP081626061 * |
| RAJABI SHISHVAN OMID ET AL: "Machine Intelligence in Healthcare and Medical Cyber Physical Systems: A Survey", IEEE ACCESS, vol. 6, 20 August 2018 (2018-08-20) - 7 September 2018 (2018-09-07), pages 46419 - 46494, XP011689933, DOI: 10.1109/ACCESS.2018.2866049 * |
| SUSHRAVYA RAGHUNATH ET AL: "Deep neural networks can predict mortality from 12-lead electrocardiogram voltage data", ARXIV.ORG, CORNELL UNIVERSITY LIBRARY, 201 OLIN LIBRARY CORNELL UNIVERSITY ITHACA, NY 14853, 15 April 2019 (2019-04-15), XP081663347, DOI: 10.1038/S41591-020-0870-Z * |
Also Published As
| Publication number | Publication date |
|---|---|
| US20210315473A1 (en) | 2021-10-14 |
| US12042305B2 (en) | 2024-07-23 |
| TWI784256B (en) | 2022-11-21 |
| TW202139210A (en) | 2021-10-16 |
Similar Documents
| Publication | Publication Date | Title |
|---|---|---|
| Atal et al. | Arrhythmia classification with ECG signals based on the optimization-enabled deep convolutional neural network | |
| US12042305B2 (en) | Method for analyzing electrocardiography signal | |
| Satija et al. | A new automated signal quality-aware ECG beat classification method for unsupervised ECG diagnosis environments | |
| JP6072005B2 (en) | Signal averaging | |
| KR20190066332A (en) | Apparatus for generating of Potassium level determination model using ECG and method thereof | |
| CN110037668B (en) | System for judging age, health state and malignant arrhythmia identification by combining pulse signal time-space domain with model | |
| Kumar et al. | Ischemia detection using isoelectric energy function | |
| KR101366101B1 (en) | System and method for classificating normal signal of personalized ecg | |
| WO2019161611A1 (en) | Ecg information processing method and ecg workstation | |
| JP2002512831A (en) | Apparatus and method for detecting symptoms associated with acute cardiac ischemia | |
| Mateo et al. | An efficient method for ECG beat classification and correction of ectopic beats | |
| JP2019084343A (en) | Method and apparatus for high accuracy photoplethysmogram based atrial fibrillation detection using wearable device | |
| CN103501694A (en) | Apparatus and method for measuring physiological signal quality | |
| Diker et al. | A diagnostic model for identification of myocardial infarction from electrocardiography signals | |
| Varisco et al. | Central apnea detection in premature infants using machine learning | |
| CN115868940A (en) | A method and device for evaluating the quality of physiological signals based on IABP | |
| Papadogiorgaki et al. | Heart rate classification using ECG signal processing and machine learning methods | |
| Mandal et al. | Arrhythmia diagnosis from ECG signal analysis using statistical features and novel classification method | |
| Abderahman et al. | Adaptive r-peak detector in extreme noise using emd selective analyzer | |
| CN113545787B (en) | Method for analyzing electrocardiogram signals | |
| US20140276156A1 (en) | Patient signal analysis and characterization | |
| Van Manh et al. | An innovative method based on Shannon energy envelope and summit navigation for detecting R peaks of noise stress test signals | |
| Bhanja et al. | A design of machine learning-based adaptive signal processing strategy for ECG signal analysis | |
| CN117547237A (en) | Method, device, medium and equipment for detecting premature beat based on PPG waveform area characteristics | |
| Szczepański et al. | A new method for ECG signal feature extraction |
Legal Events
| Date | Code | Title | Description |
|---|---|---|---|
| PUAI | Public reference made under article 153(3) epc to a published international application that has entered the european phase |
Free format text: ORIGINAL CODE: 0009012 |
|
| STAA | Information on the status of an ep patent application or granted ep patent |
Free format text: STATUS: REQUEST FOR EXAMINATION WAS MADE |
|
| 17P | Request for examination filed |
Effective date: 20210305 |
|
| AK | Designated contracting states |
Kind code of ref document: A1 Designated state(s): AL AT BE BG CH CY CZ DE DK EE ES FI FR GB GR HR HU IE IS IT LI LT LU LV MC MK MT NL NO PL PT RO RS SE SI SK SM TR |
|
| STAA | Information on the status of an ep patent application or granted ep patent |
Free format text: STATUS: EXAMINATION IS IN PROGRESS |
|
| 17Q | First examination report despatched |
Effective date: 20230705 |
|
| STAA | Information on the status of an ep patent application or granted ep patent |
Free format text: STATUS: THE APPLICATION HAS BEEN REFUSED |