EP3889652A1 - Performance-level seismic motion hazard analysis method based on three-layer dataset neural network - Google Patents
Performance-level seismic motion hazard analysis method based on three-layer dataset neural network Download PDFInfo
- Publication number
- EP3889652A1 EP3889652A1 EP21166049.3A EP21166049A EP3889652A1 EP 3889652 A1 EP3889652 A1 EP 3889652A1 EP 21166049 A EP21166049 A EP 21166049A EP 3889652 A1 EP3889652 A1 EP 3889652A1
- Authority
- EP
- European Patent Office
- Prior art keywords
- seismic
- performance
- magnitude
- level
- data
- Prior art date
- Legal status (The legal status is an assumption and is not a legal conclusion. Google has not performed a legal analysis and makes no representation as to the accuracy of the status listed.)
- Withdrawn
Links
Images


Classifications
-
- G—PHYSICS
- G01—MEASURING; TESTING
- G01V—GEOPHYSICS; GRAVITATIONAL MEASUREMENTS; DETECTING MASSES OR OBJECTS; TAGS
- G01V1/00—Seismology; Seismic or acoustic prospecting or detecting
- G01V1/01—Measuring or predicting earthquakes
-
- G—PHYSICS
- G01—MEASURING; TESTING
- G01V—GEOPHYSICS; GRAVITATIONAL MEASUREMENTS; DETECTING MASSES OR OBJECTS; TAGS
- G01V1/00—Seismology; Seismic or acoustic prospecting or detecting
- G01V1/28—Processing seismic data, e.g. for interpretation or for event detection
- G01V1/30—Analysis
- G01V1/306—Analysis for determining physical properties of the subsurface, e.g. impedance, porosity or attenuation profiles
-
- G—PHYSICS
- G01—MEASURING; TESTING
- G01V—GEOPHYSICS; GRAVITATIONAL MEASUREMENTS; DETECTING MASSES OR OBJECTS; TAGS
- G01V1/00—Seismology; Seismic or acoustic prospecting or detecting
- G01V1/28—Processing seismic data, e.g. for interpretation or for event detection
- G01V1/30—Analysis
- G01V1/307—Analysis for determining seismic attributes, e.g. amplitude, instantaneous phase or frequency, reflection strength or polarity
-
- G—PHYSICS
- G06—COMPUTING OR CALCULATING; COUNTING
- G06F—ELECTRIC DIGITAL DATA PROCESSING
- G06F17/00—Digital computing or data processing equipment or methods, specially adapted for specific functions
- G06F17/10—Complex mathematical operations
- G06F17/18—Complex mathematical operations for evaluating statistical data, e.g. average values, frequency distributions, probability functions, regression analysis
-
- G—PHYSICS
- G06—COMPUTING OR CALCULATING; COUNTING
- G06F—ELECTRIC DIGITAL DATA PROCESSING
- G06F18/00—Pattern recognition
- G06F18/20—Analysing
- G06F18/21—Design or setup of recognition systems or techniques; Extraction of features in feature space; Blind source separation
- G06F18/214—Generating training patterns; Bootstrap methods, e.g. bagging or boosting
-
- G—PHYSICS
- G06—COMPUTING OR CALCULATING; COUNTING
- G06N—COMPUTING ARRANGEMENTS BASED ON SPECIFIC COMPUTATIONAL MODELS
- G06N3/00—Computing arrangements based on biological models
- G06N3/02—Neural networks
- G06N3/04—Architecture, e.g. interconnection topology
-
- G—PHYSICS
- G06—COMPUTING OR CALCULATING; COUNTING
- G06N—COMPUTING ARRANGEMENTS BASED ON SPECIFIC COMPUTATIONAL MODELS
- G06N3/00—Computing arrangements based on biological models
- G06N3/02—Neural networks
- G06N3/04—Architecture, e.g. interconnection topology
- G06N3/045—Combinations of networks
-
- G—PHYSICS
- G06—COMPUTING OR CALCULATING; COUNTING
- G06N—COMPUTING ARRANGEMENTS BASED ON SPECIFIC COMPUTATIONAL MODELS
- G06N3/00—Computing arrangements based on biological models
- G06N3/02—Neural networks
- G06N3/04—Architecture, e.g. interconnection topology
- G06N3/0499—Feedforward networks
-
- G—PHYSICS
- G06—COMPUTING OR CALCULATING; COUNTING
- G06N—COMPUTING ARRANGEMENTS BASED ON SPECIFIC COMPUTATIONAL MODELS
- G06N3/00—Computing arrangements based on biological models
- G06N3/02—Neural networks
- G06N3/08—Learning methods
- G06N3/084—Backpropagation, e.g. using gradient descent
-
- G—PHYSICS
- G06—COMPUTING OR CALCULATING; COUNTING
- G06N—COMPUTING ARRANGEMENTS BASED ON SPECIFIC COMPUTATIONAL MODELS
- G06N3/00—Computing arrangements based on biological models
- G06N3/02—Neural networks
- G06N3/08—Learning methods
- G06N3/09—Supervised learning
-
- G—PHYSICS
- G06—COMPUTING OR CALCULATING; COUNTING
- G06N—COMPUTING ARRANGEMENTS BASED ON SPECIFIC COMPUTATIONAL MODELS
- G06N7/00—Computing arrangements based on specific mathematical models
- G06N7/01—Probabilistic graphical models, e.g. probabilistic networks
-
- G—PHYSICS
- G01—MEASURING; TESTING
- G01V—GEOPHYSICS; GRAVITATIONAL MEASUREMENTS; DETECTING MASSES OR OBJECTS; TAGS
- G01V2210/00—Details of seismic processing or analysis
- G01V2210/30—Noise handling
- G01V2210/32—Noise reduction
- G01V2210/324—Filtering
-
- G—PHYSICS
- G01—MEASURING; TESTING
- G01V—GEOPHYSICS; GRAVITATIONAL MEASUREMENTS; DETECTING MASSES OR OBJECTS; TAGS
- G01V2210/00—Details of seismic processing or analysis
- G01V2210/60—Analysis
- G01V2210/62—Physical property of subsurface
-
- G—PHYSICS
- G01—MEASURING; TESTING
- G01V—GEOPHYSICS; GRAVITATIONAL MEASUREMENTS; DETECTING MASSES OR OBJECTS; TAGS
- G01V2210/00—Details of seismic processing or analysis
- G01V2210/60—Analysis
- G01V2210/63—Seismic attributes, e.g. amplitude, polarity, instant phase
-
- G—PHYSICS
- G06—COMPUTING OR CALCULATING; COUNTING
- G06N—COMPUTING ARRANGEMENTS BASED ON SPECIFIC COMPUTATIONAL MODELS
- G06N3/00—Computing arrangements based on biological models
- G06N3/02—Neural networks
- G06N3/08—Learning methods
Definitions
- the invention relates to an anti-seismic technique analysis method, in particular to a performance-level seismic motion hazard analysis method based on a three-layer dataset neural network.
- Seismic hazard analysis typically includes deterministic hazard analysis and probabilistic seismic hazard analysis.
- the deterministic hazard analysis provides a deterministic estimation of a seismic event based on the seismogeology, the seismic activity, the maximum historical earthquake and the like.
- the probabilistic seismic hazard analysis cannot realize an objective and quantitative expression due to the uncertainty of a future earthquake in time, space and magnitude.
- the probabilistic seismic hazard analysis is a method for analyzing the probability that a seismic parameter (intensity, acceleration, velocity, response spectrum or the like) of a specific zone exceeds a given value within a design reference period in the future and can provide a quantitative probability index under the condition where the time, space and magnitude of a future earthquake are uncertain.
- a seismic parameter intensity, acceleration, velocity, response spectrum or the like
- the seismic hazard analysis methods have been applied to actual engineering, but they still have the following technical difficulties to be overcome: the rationality of the power law form of b value of the G-R relation in a small zone, the objectivity of determining the activity and spatial distribution function of a potential seismic source zone based on the activity of a seismic belt, the hyper-validity of a prediction result of probabilistic seismic hazard analysis in a large-scale time sequence, the limitation of the empirical statistics method in regional applicability, and the uncertainty of a complicated seismic theoretical calculation model of the random vibration method based on a seismic source spectrum and the seismological method based on an empirical green function.
- it is a novel technique to improve the seismic hazard analysis effect by big data-drive seismic hazard prediction directly based on actual seismic parameters.
- the seismic motion attenuation relation has a most outstanding and direct influence on seismic hazard analysis results.
- the seismic motion attenuation relation is restrained by the expression form and only includes three parameters: the seismic motion (including the intensity), the magnitude and the epicentral distance, and thus cannot comprehensively reflect the seismic complicity and is only suitable for attenuation simulation of regional seismic motions.
- To technical effect to be realized by the invention is to overcome the above-mentioned defects by providing a performance-level seismic motion hazard analysis method based on a three-layer dataset neural network.
- a performance-level seismic motion hazard analysis method based on a three-layer dataset neural network multiple parameters are input to a neural network by means of big data recorded in earthquakes, and a novel neural network training method is used to predict the seismic motion attenuation relation, thus improving the universality and flexibility of the attenuation relation.
- a performance-level seismic motion hazard analysis method based on a three-layer dataset neural network comprises the following steps:
- the patent adopts a training set + interval set + test set training structural model, which is different from the existing training structural model and improves the robustness of deep learning based on the neural network.
- the patent adopts a deep neural network based on three layers of datasets to predict the seismic motion attenuation relation, adopts a probabilistic seismic hazard analysis method to predict the annual exceeding probability and return period of a performance-level seismic motion, and determines the magnitude and epicentral distance of a set earthquake based on the performance-level seismic motion and the consistent probability.
- the invention provides a performance-level seismic motion hazard analysis method based on a three-layer dataset neural network, comprising the following steps S1-S8 (as shown in FIG. 1 ).
- Extracting feature parameters from the data and carrying out initialization input feature parameters x of a neural network are extracted from the ground motion records, and correlation verification and data initialization are carried out.
- the feature parameters include: logarithm LnY of a performance-level seismic motion, magnitude M, focal distance R, focal depth H, fault type F, fault dip ⁇ 1 , fault strike ⁇ 2 , fault tendency ⁇ 3 , slide angle ⁇ 4 , record longitude ⁇ 0X , dimensionality ⁇ 0Y and field V 30 .
- the degree of correlation should be less than 10%; if the degree of correlation is greater than 10%, corresponding features should be removed to form a new data list, and the finally feature parameter is x .
- x i min is a minimum value of a feature parameter x i in a dataset
- x i max is a maximum value of the feature parameter x i in the dataset.
- the magnitude M is taken as the last column of the data list, and initialized data are ranked by the magnitude from small to large to establish a new input list.
- Data for the training set, data for the interval set and data for the test set account for 60%, 20% and 20% of a total data size, respectively.
- a multi-layer neural network (MLP) is trained in the training set through a conventional neural network training method.
- Data in the test set are input to the neural network trained in Step (S4) to acquire an output M h * of each piece of data
- a relative error ⁇ M between the relative error obtained in Step (S5) and a true label M h is calculated based on the mean ⁇ and the standard deviation ⁇ of the relative errors obtained in Step (S5)
- the confidence is set to 95%, on the principle that 95% of M h fall within the interval M h * 1 + ⁇ + l ⁇ M h * 1 + ⁇ ⁇ l ⁇
- a minimum value meeting the confidence requirement is calculated
- M h * 1 + ⁇ + l ⁇ M h * 1 + ⁇ ⁇ l ⁇ is a magnitude interval meeting the confidence requirement
- M hmin * and M hmax * are a minimum magnitude and a maximum magnitude in the magnitude interval, respectively.
- the magnitude M i and the epicentral distance R i of a set earthquake reaching the performance-level seismic motion Y i and meeting the consistent probability are determined.
- the seismic motion attenuation relation is constructed by means of data drive and based on a deep neural network; a probabilistic seismic hazard analysis method is adopted to predict the annual exceeding probability and return period of a performance-level seismic motion; and the magnitude and epicentral distance of a set earthquake are determined based on the performance-level seismic motion and the consistent probability.
- the deep neural network of the patent is essentially the seismic motion attenuation relation, and traditional statistical analysis can also obtain the seismic motion attenuation relation and provide an error range.
- Step (S7) and Step (S8) of the invention the exceeding probability and return period of the performance-level seismic motion and the magnitude and epicentral distance of a corresponding set earthquake can also be obtained, and details will not be given anymore.
Landscapes
- Engineering & Computer Science (AREA)
- Physics & Mathematics (AREA)
- Life Sciences & Earth Sciences (AREA)
- Theoretical Computer Science (AREA)
- General Physics & Mathematics (AREA)
- Data Mining & Analysis (AREA)
- Remote Sensing (AREA)
- Mathematical Physics (AREA)
- General Engineering & Computer Science (AREA)
- Evolutionary Computation (AREA)
- Artificial Intelligence (AREA)
- Software Systems (AREA)
- Computing Systems (AREA)
- Environmental & Geological Engineering (AREA)
- Molecular Biology (AREA)
- Biophysics (AREA)
- General Health & Medical Sciences (AREA)
- Computational Linguistics (AREA)
- Health & Medical Sciences (AREA)
- Biomedical Technology (AREA)
- Acoustics & Sound (AREA)
- General Life Sciences & Earth Sciences (AREA)
- Geophysics (AREA)
- Geology (AREA)
- Mathematical Analysis (AREA)
- Pure & Applied Mathematics (AREA)
- Computational Mathematics (AREA)
- Mathematical Optimization (AREA)
- Bioinformatics & Cheminformatics (AREA)
- Evolutionary Biology (AREA)
- Bioinformatics & Computational Biology (AREA)
- Algebra (AREA)
- Probability & Statistics with Applications (AREA)
- Computer Vision & Pattern Recognition (AREA)
- Operations Research (AREA)
- Databases & Information Systems (AREA)
- Geophysics And Detection Of Objects (AREA)
- Business, Economics & Management (AREA)
- Emergency Management (AREA)
Abstract
Description
- The invention relates to an anti-seismic technique analysis method, in particular to a performance-level seismic motion hazard analysis method based on a three-layer dataset neural network.
- The "time, space and magnitude" of earthquakes are three key factors of seismic hazard analysis. In 1968, Cornell put forward, in 1968, probabilistic seismic hazard analysis which reflects the distribution requirements of earthquake magnitudes by a magnitude-frequency function relation; Poisson distribution reflects the probability of earthquake occurrence with the variation of time; and the uniform seismic distribution of all points in a potential seismic source zone reflects the seismic spatial distribution requirements. To correct an assumed proximity of the uniform distribution in a potential seismic source zone, Earthquake Intensity Zoning Map of China, 1990 , sets forth a comprehensive probabilistic seismic hazard analysis method which constructs a potential seismic source zone by two levels, and Seismic Motion Parameters Zoning Map of China, 2015 , constructs a potential seismic source zone by three levels.
- Seismic hazard analysis typically includes deterministic hazard analysis and probabilistic seismic hazard analysis. The deterministic hazard analysis provides a deterministic estimation of a seismic event based on the seismogeology, the seismic activity, the maximum historical earthquake and the like. In spite of the explicit engineering significance and the simple and intuitive expression form, the probabilistic seismic hazard analysis cannot realize an objective and quantitative expression due to the uncertainty of a future earthquake in time, space and magnitude. The probabilistic seismic hazard analysis is a method for analyzing the probability that a seismic parameter (intensity, acceleration, velocity, response spectrum or the like) of a specific zone exceeds a given value within a design reference period in the future and can provide a quantitative probability index under the condition where the time, space and magnitude of a future earthquake are uncertain. There are mainly three methods, namely the empirical statistics method, the random vibration method based on a seismic source spectrum, and the seismological method based on an empirical green function. The seismic hazard analysis methods have been applied to actual engineering, but they still have the following technical difficulties to be overcome: the rationality of the power law form of b value of the G-R relation in a small zone, the objectivity of determining the activity and spatial distribution function of a potential seismic source zone based on the activity of a seismic belt, the hyper-validity of a prediction result of probabilistic seismic hazard analysis in a large-scale time sequence, the limitation of the empirical statistics method in regional applicability, and the uncertainty of a complicated seismic theoretical calculation model of the random vibration method based on a seismic source spectrum and the seismological method based on an empirical green function. Thus, it is a novel technique to improve the seismic hazard analysis effect by big data-drive seismic hazard prediction directly based on actual seismic parameters.
- In the aspect of deep learning based on a neural network, there are two training structural models at present, one is training set + test set, and the other is training set + verification set + test set. The verification set involved in the latter method is used to correct and improve a neural network model of the training set. From this point of view, these two methods are essentially identical. However, in case of a small data size, there will be difficulties that cannot be overcome in the test set. The most common method is to evaluate the generalization ability of a learning method by error testing. However, such an evaluation depends on test datasets which are limited, so it is quite likely that an invalid evaluation result is obtained. Thus, how to change the training structural models to improve the robustness of the deep learning based on the neural network is also a crucial technique of machining learning.
- In the aspect of seismic hazard analysis, all existing methods determine seismic parameters from the hazards caused by the occurrence of an earthquake, that is, from the initial point of the occurrence of the earthquake. However, performance (behavior)-based anti-seismic design considers problems from the performance (behaviors) of a structural earthquake, that is, from structural behavior results resulting from the occurrence of an earthquake. Existing documents and patents have put forward performance-level anti-seismic design methods, but none of these documents and patents involves a performance-level seismic motion hazard analysis method.
- The seismic motion attenuation relation has a most outstanding and direct influence on seismic hazard analysis results. At present, the seismic motion attenuation relation is restrained by the expression form and only includes three parameters: the seismic motion (including the intensity), the magnitude and the epicentral distance, and thus cannot comprehensively reflect the seismic complicity and is only suitable for attenuation simulation of regional seismic motions.
- To technical effect to be realized by the invention is to overcome the above-mentioned defects by providing a performance-level seismic motion hazard analysis method based on a three-layer dataset neural network. According to the performance-level seismic motion hazard analysis method based on a three-layer dataset neural network, multiple parameters are input to a neural network by means of big data recorded in earthquakes, and a novel neural network training method is used to predict the seismic motion attenuation relation, thus improving the universality and flexibility of the attenuation relation.
- To fulfill the aforesaid objective, the invention adopts the following technical solution: a performance-level seismic motion hazard analysis method based on a three-layer dataset neural network comprises the following steps:
- (S1) Acquiring seismic motion data and denoising the data;
- (S2) Extracting feature parameters from the data, and carrying out initialization;
- (S3) Generating a training set, an interval set and a test set;
- (S4) Training a multi-layer neural network based on the training set;
- (S5) Training output values of the neural network based on the interval set, and calculating a mean and a standard deviation of relative errors of the output values;
- (S6) Training the neural network based on the test set to determine output values, and calculating a magnitude interval based on an interval confidence;
- (S7) Carrying out probabilistic seismic hazard analysis to determine an annual exceeding probability and a return period of a performance-level seismic motion; and
- (S8) Determining a magnitude and an epicentral distance reaching the performance-level seismic motion based on the performance-level seismic motion and a consistent probability.
- At present, million-level or ten million-level big data based on earthquake records are not available yet, and when deep learning based on an existing neural network is used to predict the seismic motion attenuation relation, there will be some difficulties that cannot be overcome in the test set. To overcome this defect, the patent adopts a training set + interval set + test set training structural model, which is different from the existing training structural model and improves the robustness of deep learning based on the neural network. To overcome the defect of no performance-based seismic motion hazard analysis method at present, the patent adopts a deep neural network based on three layers of datasets to predict the seismic motion attenuation relation, adopts a probabilistic seismic hazard analysis method to predict the annual exceeding probability and return period of a performance-level seismic motion, and determines the magnitude and epicentral distance of a set earthquake based on the performance-level seismic motion and the consistent probability.
-
-
FIG. 1 is a flow diagram of a method. -
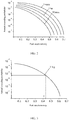
FIG. 2 is a seismic hazard curve of performance-level seismic motion-exceeding probability. -
FIG. 3 illustrates a method for determining the exceeding probability of a performance-level seismic motion. -
FIG. 4 illustrates a set earthquake magnitude of the performance-level seismic motion determined according to a consistent exceeding probability. - The invention provides a performance-level seismic motion hazard analysis method based on a three-layer dataset neural network, comprising the following steps S1-S8 (as shown in
FIG. 1 ). - S1. Acquiring seismic motion data and denoising the data: a great deal of ground motion records (including the acceleration, velocity and displacement of ground motions) are collected, base-line correction, band-pass filtering and other cleaning work are carried out, and data formats of the ground motion records are unified.
- S2. Extracting feature parameters from the data and carrying out initialization: input feature parameters x of a neural network are extracted from the ground motion records, and correlation verification and data initialization are carried out.
- The feature parameters include: logarithm LnY of a performance-level seismic motion, magnitude M, focal distance R, focal depth H, fault type F, fault dip θ1, fault strike θ2, fault tendency θ3, slide angle θ4, record longitude θ0X, dimensionality θ0Y and field V30.
- The correlation of the feature parameters x is verified, specifically, information gain Gain (A, B) = H(A)- H(A|B) of every two features is calculated, wherein A is a feature parameter, Gain(A,B) is the reduction of the uncertainty of an exceeding probability B under the condition where the feature parameter A of the information gain is constant, and H(A/B) is a condition entropy when the feature parameters x are fixed. The degree of correlation should be less than 10%; if the degree of correlation is greater than 10%, corresponding features should be removed to form a new data list, and the finally feature parameter is x.
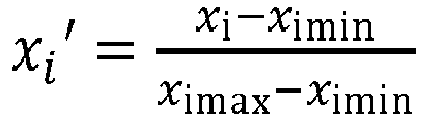
- The final feature x is initialized. For example, all features are scaled to 0-1 through the MinMaxScaler algorithm, and a transfer function is:

- In this function, xi min is a minimum value of a feature parameter xi in a dataset, and xi max is a maximum value of the feature parameter xi in the dataset.
- The magnitude M is taken as the last column of the data list, and initialized data are ranked by the magnitude from small to large to establish a new input list.
- S3. Data for the training set, data for the interval set and data for the test set account for 60%, 20% and 20% of a total data size, respectively.
- S4. A multi-layer neural network (MLP) is trained in the training set through a conventional neural network training method.
- ① The MPL is constructed by an input layer, a hidden layer and an output layer through a feed-forward BP algorithm. With an MLP developed by Python as an example, an MLPClassfier() function in a Scikit-Learn machine learning library is called to input external parameters such as hidden_layer_sizes (sizes of the hidden layer), activation (activation function), slover (optimizer), alpha (regularization parameter) and max_iter (iteration depth), so that a neural network object is constructed. All or part of these user-defined parameters are determined to give value lists, respectively, such as activation: {'identity', 'logistic', 'tanh', 'relu'}, grid search objects for cross validation are constructed, and the training set is converted into an object ndarray in a Python Numpy operation library, and the object ndarray is input to the grid search object to determine an optimal parameter combination of the model.
- ②The MLP is defined according to the optimal parameter combination obtained in the previous step, the object ndarray of a training set tag is input to a network, a difference between an output value of the current neural network and the data label is calculated, an error function is fed backward to each node through the BP algorithm to calculate the gradient, the weight and deviation value of each node are updated gradually, and the MLP is trained.
- S5. Outputting a magnitude from the interval set based on the trained neural network, and calculating a mean and a standard deviation of relative errors of values output from the interval set.
- Data in the interval set are input to the neural network trained in Step (S4) to obtain an output


- S6. Outputting a magnitude

- Data in the test set are input to the neural network trained in Step (S4) to acquire an output


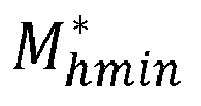

- S7. Carrying out probabilistic seismic hazard analysis to determine and an annual exceeding probability and a return period of a performance-level seismic motion.
- ① A field building reaching the performance-level seismic motion Y is determined with reference to a method in a granted or disclosed invention patent of the inventor.
- ② A potential seismic source is determined in terms of the three-level zoning principle in Seismic Motion Parameters Zoning Map of China GB18306-2015.
- ③ An initial magnitude M 0 and a magnitude upper limit Muz of the potential seismic source zone are determined, and n magnitude levels Mj (j=1,2, ..., n) are determined from the initial magnitude M 0 to the magnitude upper limit Muz.
- ④ In terms of a G-R magnitude-frequency relation formula lgN = a - bM, statistics is carried out on actual earthquake magnitudes M and frequencies N to determine values of a and b, an intermediate parameter β=b1n10 is set, and an annual occurrence rate v 0 of the initial magnitude and magnitudes above in the potential seismic source zone is calculated.
- ⑤ According to the determined seismic motion Y reaching a performance level and a hypocentral distance R of the potential seismic zone, q M*Yhp reaching the performance-level seismic motion Y are obtained between M*Yhmin and M*Yhmax, that reach the performance-level seismic motion Y as verified in Step (S6), by a step length 0.1 of the magnitude levels, wherein M*Yhmin is a minimum magnitude value corresponding to the performance-level seismic motion Y, and M*Yhmax is a maximum magnitude value corresponding to the performance-level seismic motion Y
- ⑥ In any one potential seismic source zone k, M imin and M imax are a maximum value and a maximum value within the magnitude level Mi respectively,



In this formula, S α is a seismic motion parameter which may be the acceleration, the velocity, the response spectrum or the like; v 0 is an annual average rate of earthquake occurrence in the potential seismic source zone; fk,Mj is a spatial distribution coefficient of the potential seismic source zone k and the magnitude level Mj and is determined according to the factors such as the seismic activity feature, the zoning map occurrence rate, the seismotectonic condition, the seismicity, the grid activity, the occurrence rate of a major earthquake, the medium and long term risk, and the elapsed time. - ⑦ The exceeding probability of occurrence of an earthquake reaching the performance level in the potential seismic source zone k in t years is:

- ⑧ There are m potential seismic source zones in the field, and the exceeding probability of occurrence of an earthquake reaching the performance level in the field in t years is:

- ⑨ The return period of the earthquake reaching the performance level in the field in t years is:

FIG. 2 . - S8. Determining a set magnitude and a set epicentral distance based on the performance-level seismic motion and a consistent probability.
- ① Any one seismic hazard curve Yhp of performance-level seismic motion-exceeding probability is selected, and a corresponding exceeding probability is determined according to the performance seismic motion Yi, as shown in
FIG. 3 ; and a set earthquake magnitude Mi reaching the performance-level seismic motion Yi is determined according to the consistent exceeding probability, as shown inFIG. 4 . - ② The m potential seismic source zones are equally divided into small seismic source zones at equal intervals, and a corresponding number of epicentral distances Ri from a field point to the small seismic source zones of the m potential seismic source zones are obtained.
- ③ The epicentral distances Ri are traversed, parameters such as Yi and Ri are substituted into the trained deep neural network to calculate

- Wherein, the screening rule of Ri is as follows:
- 1) In any one potential seismic source zone, M imin ≤Mi≤M imax ;
- 2)

- 3) Ri is within the corresponding seismic source zone;
- The magnitude Mi and the epicentral distance Ri of a set earthquake reaching the performance-level seismic motion Yi and meeting the consistent probability are determined.
- In the patent, the seismic motion attenuation relation is constructed by means of data drive and based on a deep neural network; a probabilistic seismic hazard analysis method is adopted to predict the annual exceeding probability and return period of a performance-level seismic motion; and the magnitude and epicentral distance of a set earthquake are determined based on the performance-level seismic motion and the consistent probability.
- It should be noted that the deep neural network of the patent is essentially the seismic motion attenuation relation, and traditional statistical analysis can also obtain the seismic motion attenuation relation and provide an error range. By adoption of the performance-level motion hazard analysis method implemented in Step (S7) and Step (S8) of the invention, the exceeding probability and return period of the performance-level seismic motion and the magnitude and epicentral distance of a corresponding set earthquake can also be obtained, and details will not be given anymore.
Claims (6)
- A performance-level seismic motion hazard analysis method based on a three-layer dataset neural network, comprising the following steps:(S1) extracting seismic motion data and denoising the data;(S2) extracting feature data from the data, and carrying out initialization;(S3) generating a training set, an interval set and a test set;(S4) training a multi-layer neural network based on the training set;(S5) training output values of the neural network based on the interval set, and calculating a mean and a standard deviation of relative errors of the output values, wherein in this step, data in the interval set are input to the neural network trained in Step (S4) to obtain an output


 (S6) training the neural network based on the test set to determine output values, and calculating a magnitude interval based on an interval confidence, wherein in this step, data in the test set are input to the neural network trained in Step (S4) to obtain an output


 (S7) carrying out probability probabilistic seismic hazard analysis to determine an annual exceeding probability and a return period of a performance seismic motion, wherein this step comprises the following sub-steps:(S7.1) determining that a field building reaches a performance seismic motion Y;(S7.2) determining a potential seismic source zone based on a three-level zoning principle;(S7.3) determining an initial magnitude M 0 and a magnitude upper limit Muz of the potential seismic source zone, determining n magnitude levels Mj from the initial magnitude M 0 to the magnitude upper limit Muz, wherein j=1, 2, ..., n;(S7.4) in terms of a G-R magnitude-frequency relation formula lgN = a - bM, carrying out statistics on actual earthquake magnitudes M and frequencies N to determine values of a and b, setting an intermediate parameter β=bln10, and calculating an annual occurrence rate v 0 of the initial magnitude and magnitudes above in the potential seismic source zone;(S7.5) according to the determined seismic motion Y reaching a performance level and a hypocentral distance R of the potential seismic zone, obtaining q M*Yhp reaching the performance-level seismic motion Y between M*Yhmin and M*Yhmax, that reach the performance-level seismic motion Y as verified in Step (S6), by a step length 0.1 of the magnitude levels, wherein M*Yhmin is a minimum magnitude value corresponding to the performance-level seismic motion Y, and M*Yhmax is a maximum magnitude value corresponding to the performance-level seismic motion Y;(S7.6) in any potential seismic source zone k, setting M imin and M imax as a minimum value and a maximum value in a magnitude level Mi , wherein
 (S7.7) calculating an exceeding probability of occurrence of an earthquake reaching the performance level in the potential seismic source zone k in t years:
 (S7.8) if there are m potential seismic source zones in the field, calculating the exceeding probability of occurrence of an earthquake reaching the performance level in the field in t years:
 (S7.9) calculating the return period of the earthquake reaching the performance level in the field in t years:
 (S8) determining a magnitude and an epicentral distance that reach the performance-level seismic motion based on the performance seismic motion and a consistent probability, comprising the following sub-steps:wherein, the screening rule of Ri is as follows:(S8.1) selecting one seismic hazard curve of performance-level seismic motion-exceeding probability, and determining a corresponding exceeding probability according to any one performance seismic motion Yi; determining a set earthquake magnitude Mi reaching the performance-level seismic motion Yi according to the consistent exceeding probability;(S8.2) equally dividing the m potential seismic source zones into small seismic source zones at equal intervals, and obtaining a corresponding number of epicentral distances Ri from a field point to the small seismic source zones of the m potential seismic source zones;(S8.3) traversing epicentral distances Ri, substituting parameters Yi and Ri into the trained deep neural network to calculate
 1) in any one potential seismic source zone, M imin≤Mi≤M imax;2)
 3) Ri is within the corresponding seismic source zone;the magnitude Mi and the epicentral distance Ri of a set earthquake reaching the performance-level seismic motion Yi and meeting the consistent probability are determined.
 - The analysis method according to Claim 1, wherein the seismic motion data in Step (S1) include an acceleration, velocity and displacement of ground motions.
- The analysis method according to Claim 1 or 2, wherein the feature parameters include: logarithm LnY of the performance-level seismic motion, magnitude M, focal distance R, focal depth H, fault type F, fault dip θ1, fault strike θ2, fault tendency θ3, slide angle θ4, record longitude θ0X, dimensionality θ0Y and field V30.
- The analysis method according to Claim 3, wherein the correlation of the feature parameters is verified, specifically, information gain Gain(A,B) = H(A) - H(A|B) of every two features is calculated, wherein A is a feature parameter, Gain(A,B) is a reduction of the uncertainty of an exceeding probability B under the condition where the feature parameter A of the information gain is constant, and H(A/B) is a condition entropy when the feature parameters are fixed; the degree of correlation is less than 10%; if the degree of correlation is greater than 10%, corresponding features need to be removed to form a new data list, and a finally feature parameter is X.
- The analysis method according to Claim 4, wherein the final feature X is initialized, all final features X are scaled to 0-1, and a transfer function is:
- The analysis method according to Claim 5, wherein data for the training set, data for the interval set and data for the test set account for 60%, 20% and 20% of a total data size, respectively.
Applications Claiming Priority (1)
| Application Number | Priority Date | Filing Date | Title |
|---|---|---|---|
| CN202010236208.9A CN111458748B (en) | 2020-03-30 | 2020-03-30 | A performance ground motion hazard analysis method based on three-layer dataset neural network |
Publications (1)
| Publication Number | Publication Date |
|---|---|
| EP3889652A1 true EP3889652A1 (en) | 2021-10-06 |
Family
ID=71685019
Family Applications (1)
| Application Number | Title | Priority Date | Filing Date |
|---|---|---|---|
| EP21166049.3A Withdrawn EP3889652A1 (en) | 2020-03-30 | 2021-03-30 | Performance-level seismic motion hazard analysis method based on three-layer dataset neural network |
Country Status (5)
| Country | Link |
|---|---|
| US (1) | US11215719B2 (en) |
| EP (1) | EP3889652A1 (en) |
| JP (1) | JP6948740B2 (en) |
| CN (1) | CN111458748B (en) |
| WO (1) | WO2021196367A1 (en) |
Families Citing this family (32)
| Publication number | Priority date | Publication date | Assignee | Title |
|---|---|---|---|---|
| CN110751399B (en) * | 2019-10-22 | 2023-02-24 | 中国地震局地球物理研究所 | Earthquake danger parallel analysis method, device and equipment |
| CN112883348A (en) * | 2021-02-05 | 2021-06-01 | 西安电子科技大学 | Identity verification method, device and equipment based on motion characteristics and computer storage medium |
| CN113009553A (en) * | 2021-03-02 | 2021-06-22 | 电子科技大学 | Interpretable seismic motion parameter probability density distribution prediction method based on NGboost and SHAP values |
| CN112946318A (en) * | 2021-03-24 | 2021-06-11 | 苏州康旺聚贤智能科技有限公司 | Calibration algorithm of acceleration sensor |
| CN113268852B (en) * | 2021-04-14 | 2022-02-22 | 西南交通大学 | Monte Carlo simulation-based earthquake landslide probability risk analysis method |
| CN113379105B (en) | 2021-05-21 | 2022-05-31 | 浙江大学 | Site earthquake liquefaction disaster rapid evaluation method based on artificial intelligence |
| US11200788B1 (en) * | 2021-06-28 | 2021-12-14 | 1st Street Foundation, Inc. | Systems and methods for forecasting and assessing hazard-resultant effects |
| CN113484913B (en) * | 2021-08-16 | 2023-06-16 | 成都理工大学 | Seismic data denoising method for multi-granularity feature fusion convolutional neural network |
| CN114329974B (en) * | 2021-12-29 | 2023-07-18 | 武汉大学 | Earthquake damage assessment method for urban water supply pipe network based on Monte Carlo simulation |
| CN114693066B (en) * | 2022-02-28 | 2024-03-15 | 哈尔滨工业大学(深圳) | Seismic risk analysis methods, devices, equipment and storage media |
| CN114675325A (en) * | 2022-03-13 | 2022-06-28 | 中国地震台网中心 | Mindlin solution-based method for estimating permanent displacement of seismic surface fracture |
| CN114659516A (en) * | 2022-03-23 | 2022-06-24 | 浪潮软件科技有限公司 | Application method and device in earthquake |
| CN114779329B (en) * | 2022-04-24 | 2023-05-23 | 福州大学 | Near-fault sea area earthquake motion response spectrum calibration method |
| CN114966860A (en) * | 2022-05-13 | 2022-08-30 | 重庆科技学院 | Seismic data denoising method based on convolutional neural network |
| CN117518246A (en) * | 2022-07-27 | 2024-02-06 | 中国石油天然气集团有限公司 | A seismic data denoising model establishment method, denoising method and related devices |
| CN115343751A (en) * | 2022-08-04 | 2022-11-15 | 中国地震局地震预测研究所 | Method and system for determining fault seismic level of boundary zone of movable land parcel |
| CN115291281B (en) * | 2022-09-30 | 2022-12-20 | 中国科学院地质与地球物理研究所 | Real-time microseismic magnitude calculation method and device based on deep learning |
| CN115826039B (en) * | 2022-11-09 | 2023-07-14 | 中国地质科学院 | A time slice classification model training method, system and application method, system |
| CN115932946B (en) * | 2022-11-18 | 2025-05-30 | 西安交通大学 | Training method of magnitude estimation model, magnitude estimation method and magnitude estimation model |
| CN116256803B (en) * | 2023-03-09 | 2024-01-19 | 中国矿业大学 | A coal mine microseismic area positioning method that integrates mining information and geological information |
| CN116299703B (en) * | 2023-03-16 | 2025-07-22 | 中国地震局地球物理研究所 | Seismic attenuation relation model finding method and device based on symbol learning |
| CN117169955A (en) * | 2023-08-17 | 2023-12-05 | 叙镇铁路有限责任公司 | A pulse-type ground motion synthesis method based on LSTM-GAN |
| CN116956046B (en) * | 2023-09-07 | 2023-12-29 | 西南交通大学 | An earthquake landslide risk analysis method and device based on recurrent neural network |
| CN117289334B (en) * | 2023-09-12 | 2026-01-30 | 昆明理工大学 | A novel method for constructing earthquake prediction models |
| CN117233828A (en) * | 2023-09-15 | 2023-12-15 | 中国地震局成都青藏高原地震研究所(中国地震科学实验场成都基地) | Earthquake hazard tracking method and system based on earthquake source parameters and fault structure |
| CN118090107A (en) * | 2024-04-24 | 2024-05-28 | 华侨大学 | An intelligent prediction method for multi-structure seismic response considering the influence of ground motion |
| CN118426042B (en) * | 2024-05-09 | 2024-11-12 | 北京科技大学 | A method and device for quickly constructing a precise seismic field |
| CN118259350B (en) * | 2024-05-31 | 2024-08-23 | 四川安信科创科技有限公司 | Image processing method based on space-time sequence prediction |
| CN119087515B (en) * | 2024-08-31 | 2025-05-02 | 重庆大学 | Full-period natural earthquake motion record selection method |
| CN119323111B (en) * | 2024-09-26 | 2025-11-14 | 雅江清洁能源科学技术研究(北京)有限公司 | A Probabilistic Analysis-Based Method for Assessing the Risk of Dam Foundation Liquefaction Damage |
| CN119940038A (en) * | 2025-04-07 | 2025-05-06 | 石家庄铁道大学 | Method, device and terminal for analyzing seismic performance of structures considering cross-fault ground motion |
| CN121613502A (en) * | 2026-02-03 | 2026-03-06 | 清华大学 | Prediction method and device for site earthquake response |
Citations (2)
| Publication number | Priority date | Publication date | Assignee | Title |
|---|---|---|---|---|
| CN106019359A (en) * | 2016-05-17 | 2016-10-12 | 浪潮集团有限公司 | Earthquake prediction system based on neural network |
| CN106154309A (en) * | 2016-06-29 | 2016-11-23 | 合肥民众亿兴软件开发有限公司 | Short term prediction method in a kind of network earthquake December |
Family Cites Families (15)
| Publication number | Priority date | Publication date | Assignee | Title |
|---|---|---|---|---|
| US5490062A (en) * | 1994-05-11 | 1996-02-06 | The Regents Of The University Of California | Real-time neural network earthquake profile predictor |
| US6928367B2 (en) * | 2002-09-27 | 2005-08-09 | Veritas Dgc Inc. | Reservoir fracture characterization |
| US7280920B1 (en) * | 2005-06-29 | 2007-10-09 | Whiteside Lowell S | Method and apparatus for forecasting earthquakes and making informed risk management decisions |
| CN101699317A (en) * | 2009-11-09 | 2010-04-28 | 东南大学 | Neural network method for performing short-term earthquake prediction by using earthquake parameters |
| CN102200588B (en) * | 2011-03-22 | 2012-08-22 | 成都理工大学 | Method for analyzing waveform similarity body curvature of seismic data |
| CN102787676B (en) * | 2011-05-20 | 2014-07-16 | 青岛理工大学 | Multi-objective performance anti-seismic design method for engineering structure |
| KR102044041B1 (en) * | 2013-09-27 | 2019-12-03 | 한국전력공사 | Apparatus for measuring earthquake intensity and method for the same |
| CN103926621A (en) * | 2014-05-06 | 2014-07-16 | 中国地震局工程力学研究所 | Method for building seismic oscillation attenuation relation based on two-stage residual analysis |
| KR20160114804A (en) * | 2015-03-24 | 2016-10-06 | 현대자동차주식회사 | Analytical performance evaluation method |
| CN105005079B (en) * | 2015-07-14 | 2017-12-01 | 北京博达瑞恒科技有限公司 | A kind of well log inversion method |
| CN109635461B (en) * | 2018-12-18 | 2022-04-29 | 中国铁建重工集团股份有限公司 | Method and system for automatically identifying surrounding rock grade by using while-drilling parameters |
| CN109799533B (en) * | 2018-12-28 | 2021-07-27 | 中国石油化工股份有限公司 | Reservoir prediction method based on bidirectional circulation neural network |
| JP7180946B2 (en) * | 2019-01-11 | 2022-11-30 | 株式会社竹中工務店 | Earthquake information processing equipment |
| JP2020193935A (en) * | 2019-05-30 | 2020-12-03 | 新医療リアルワールドデータ研究機構株式会社 | Evaluation system and evaluation program |
| JP7258682B2 (en) * | 2019-07-16 | 2023-04-17 | 株式会社東芝 | Plant evaluation system and plant evaluation method |
-
2020
- 2020-03-30 CN CN202010236208.9A patent/CN111458748B/en not_active Expired - Fee Related
- 2020-05-21 WO PCT/CN2020/091544 patent/WO2021196367A1/en not_active Ceased
-
2021
- 2021-03-25 US US17/211,891 patent/US11215719B2/en not_active Expired - Fee Related
- 2021-03-26 JP JP2021053294A patent/JP6948740B2/en not_active Expired - Fee Related
- 2021-03-30 EP EP21166049.3A patent/EP3889652A1/en not_active Withdrawn
Patent Citations (2)
| Publication number | Priority date | Publication date | Assignee | Title |
|---|---|---|---|---|
| CN106019359A (en) * | 2016-05-17 | 2016-10-12 | 浪潮集团有限公司 | Earthquake prediction system based on neural network |
| CN106154309A (en) * | 2016-06-29 | 2016-11-23 | 合肥民众亿兴软件开发有限公司 | Short term prediction method in a kind of network earthquake December |
Non-Patent Citations (4)
| Title |
|---|
| ADELI H ET AL: "A probabilistic neural network for earthquake magnitude prediction", NEURAL NETWORKS, ELSEVIER SCIENCE PUBLISHERS, BARKING, GB, vol. 22, no. 7, 1 September 2009 (2009-09-01), pages 1018 - 1024, XP026564810, ISSN: 0893-6080, [retrieved on 20090521], DOI: 10.1016/J.NEUNET.2009.05.003 * |
| LIN JYH-WOEI ET AL: "Active Probability Backpropagation Neural Network Model for Monthly Prediction of Probabilistic Seismic Hazard Analysis in Taiwan", IEEE ACCESS, vol. 7, 5 August 2019 (2019-08-05), pages 108990 - 109014, XP011740763, DOI: 10.1109/ACCESS.2019.2932991 * |
| MEI SAI ET AL: "Influencing factors and evaluation application of regional crustal stability in the Bohai Strait", CHINA GEOLOGY, vol. 2, no. 3, 1 January 2019 (2019-01-01), pages 352 - 361, XP055828376, ISSN: 2096-5192, Retrieved from the Internet <URL:https://www.sciencedirect.com/science/article/pii/S2096519219301867/pdfft?md5=43fb93970812d77b8fdd76cf737f4489&pid=1-s2.0-S2096519219301867-main.pdf> [retrieved on 20210728], DOI: 10.31035/cg2018075 * |
| R. CONSOLE ET AL: "Probabilistic approach to earthquake prediction.", ANNALS OF GEOPHYSICS, vol. 45, no. 6, 18 December 2009 (2009-12-18), XP055828119, Retrieved from the Internet <URL:https://www.sciencedirect.com/science/article/pii/S0893608009000926/pdfft?md5=2d60c02329a672ee743071fa0408bbf1&pid=1-s2.0-S0893608009000926-main.pdf> [retrieved on 20210728], DOI: 10.4401/ag-3546 * |
Also Published As
| Publication number | Publication date |
|---|---|
| CN111458748B (en) | 2021-03-05 |
| WO2021196367A1 (en) | 2021-10-07 |
| US11215719B2 (en) | 2022-01-04 |
| JP6948740B2 (en) | 2021-10-13 |
| JP2021162591A (en) | 2021-10-11 |
| CN111458748A (en) | 2020-07-28 |
| US20210302603A1 (en) | 2021-09-30 |
Similar Documents
| Publication | Publication Date | Title |
|---|---|---|
| US11215719B2 (en) | Performance-level seismic motion hazard analysis method based on three-layer dataset neural network | |
| CN118247108B (en) | A regional earthquake safety assessment method and system based on database technology | |
| Lu et al. | A deep learning approach to rapid regional post‐event seismic damage assessment using time‐frequency distributions of ground motions | |
| Sajedi et al. | A data‐driven framework for near real‐time and robust damage diagnosis of building structures | |
| CN112529341B (en) | A Prediction Method of Drilling Loss Probability Based on Naive Bayesian Algorithm | |
| Alimoradi et al. | Machine-learning methods for earthquake ground motion analysis and simulation | |
| RU2012152447A (en) | WINDOW STATISTICAL ANALYSIS FOR DETECTING ANOMALIES IN GEOPHYSICAL DATA SETS | |
| Zhang et al. | A real‐time seismic damage prediction framework based on machine learning for earthquake early warning | |
| CN113009553A (en) | Interpretable seismic motion parameter probability density distribution prediction method based on NGboost and SHAP values | |
| CN104200284A (en) | Mine fault structure prediction method | |
| Tsuchimoto et al. | Rapid postearthquake safety evaluation of buildings using sparse acceleration measurements | |
| CN118033729A (en) | The most unfavorable ground motion selection method and system based on big data and random forest | |
| Sajedi et al. | Intensity-based feature selection for near real-time damage diagnosis of building structures | |
| Wang | PCA-LSTM: An impulsive ground-Shaking identification method based on combined deep learning | |
| Li et al. | Generalized deep neural network for seismic site response prediction with transfer learning | |
| CN119830647B (en) | Damage prediction method for seismic isolation structure designed by direct displacement method | |
| CN120468936B (en) | Seismic waveform classification detection method | |
| CN115892039A (en) | A method for predicting scene adaptability of self-driving cars | |
| CN118642170A (en) | A shear wave time difference prediction method and system based on integrated machine learning | |
| Vrochidou et al. | Structural damage estimation in mid‐rise reinforced concrete structure based on time–frequency analysis of seismic accelerograms | |
| CN120276019A (en) | Earthquake continuous monitoring prediction system | |
| Sun | A data-driven building seismic response prediction framework: From simulation and recordings to statistical learning | |
| Othman et al. | Data mining approaches in business intelligence: Postgraduate data analytic | |
| CN119089996B (en) | A knowledge tracking deep debiasing method, electronic device and storage medium | |
| CN121562927B (en) | Geothermal resource prediction methods, devices, systems, and storage media |
Legal Events
| Date | Code | Title | Description |
|---|---|---|---|
| PUAI | Public reference made under article 153(3) epc to a published international application that has entered the european phase |
Free format text: ORIGINAL CODE: 0009012 |
|
| STAA | Information on the status of an ep patent application or granted ep patent |
Free format text: STATUS: THE APPLICATION HAS BEEN PUBLISHED |
|
| AK | Designated contracting states |
Kind code of ref document: A1 Designated state(s): AL AT BE BG CH CY CZ DE DK EE ES FI FR GB GR HR HU IE IS IT LI LT LU LV MC MK MT NL NO PL PT RO RS SE SI SK SM TR |
|
| STAA | Information on the status of an ep patent application or granted ep patent |
Free format text: STATUS: REQUEST FOR EXAMINATION WAS MADE |
|
| 17P | Request for examination filed |
Effective date: 20220406 |
|
| RBV | Designated contracting states (corrected) |
Designated state(s): AL AT BE BG CH CY CZ DE DK EE ES FI FR GB GR HR HU IE IS IT LI LT LU LV MC MK MT NL NO PL PT RO RS SE SI SK SM TR |
|
| GRAP | Despatch of communication of intention to grant a patent |
Free format text: ORIGINAL CODE: EPIDOSNIGR1 |
|
| STAA | Information on the status of an ep patent application or granted ep patent |
Free format text: STATUS: GRANT OF PATENT IS INTENDED |
|
| INTG | Intention to grant announced |
Effective date: 20220915 |
|
| STAA | Information on the status of an ep patent application or granted ep patent |
Free format text: STATUS: THE APPLICATION IS DEEMED TO BE WITHDRAWN |
|
| 18D | Application deemed to be withdrawn |
Effective date: 20230126 |