EP3887799B1 - Automated method of identifying a structure - Google Patents
Automated method of identifying a structure Download PDFInfo
- Publication number
- EP3887799B1 EP3887799B1 EP19890518.4A EP19890518A EP3887799B1 EP 3887799 B1 EP3887799 B1 EP 3887799B1 EP 19890518 A EP19890518 A EP 19890518A EP 3887799 B1 EP3887799 B1 EP 3887799B1
- Authority
- EP
- European Patent Office
- Prior art keywords
- image
- colour
- sample
- received
- images
- Prior art date
- Legal status (The legal status is an assumption and is not a legal conclusion. Google has not performed a legal analysis and makes no representation as to the accuracy of the status listed.)
- Active
Links
Images





Classifications
-
- G—PHYSICS
- G06—COMPUTING OR CALCULATING; COUNTING
- G06T—IMAGE DATA PROCESSING OR GENERATION, IN GENERAL
- G06T7/00—Image analysis
- G06T7/0002—Inspection of images, e.g. flaw detection
- G06T7/0012—Biomedical image inspection
-
- G—PHYSICS
- G06—COMPUTING OR CALCULATING; COUNTING
- G06T—IMAGE DATA PROCESSING OR GENERATION, IN GENERAL
- G06T7/00—Image analysis
- G06T7/90—Determination of colour characteristics
-
- G—PHYSICS
- G01—MEASURING; TESTING
- G01N—INVESTIGATING OR ANALYSING MATERIALS BY DETERMINING THEIR CHEMICAL OR PHYSICAL PROPERTIES
- G01N21/00—Investigating or analysing materials by the use of optical means, i.e. using sub-millimetre waves, infrared, visible or ultraviolet light
- G01N21/17—Systems in which incident light is modified in accordance with the properties of the material investigated
- G01N21/25—Colour; Spectral properties, i.e. comparison of effect of material on the light at two or more different wavelengths or wavelength bands
- G01N21/255—Details, e.g. use of specially adapted sources, lighting or optical systems
-
- G—PHYSICS
- G01—MEASURING; TESTING
- G01N—INVESTIGATING OR ANALYSING MATERIALS BY DETERMINING THEIR CHEMICAL OR PHYSICAL PROPERTIES
- G01N33/00—Investigating or analysing materials by specific methods not covered by groups G01N1/00 - G01N31/00
- G01N33/48—Biological material, e.g. blood, urine; Haemocytometers
- G01N33/483—Physical analysis of biological material
- G01N33/4833—Physical analysis of biological material of solid biological material, e.g. tissue samples, cell cultures
-
- G—PHYSICS
- G06—COMPUTING OR CALCULATING; COUNTING
- G06N—COMPUTING ARRANGEMENTS BASED ON SPECIFIC COMPUTATIONAL MODELS
- G06N3/00—Computing arrangements based on biological models
- G06N3/02—Neural networks
- G06N3/04—Architecture, e.g. interconnection topology
- G06N3/0464—Convolutional networks [CNN, ConvNet]
-
- G—PHYSICS
- G06—COMPUTING OR CALCULATING; COUNTING
- G06N—COMPUTING ARRANGEMENTS BASED ON SPECIFIC COMPUTATIONAL MODELS
- G06N3/00—Computing arrangements based on biological models
- G06N3/02—Neural networks
- G06N3/08—Learning methods
- G06N3/09—Supervised learning
-
- G—PHYSICS
- G06—COMPUTING OR CALCULATING; COUNTING
- G06V—IMAGE OR VIDEO RECOGNITION OR UNDERSTANDING
- G06V20/00—Scenes; Scene-specific elements
- G06V20/60—Type of objects
- G06V20/69—Microscopic objects, e.g. biological cells or cellular parts
-
- G—PHYSICS
- G16—INFORMATION AND COMMUNICATION TECHNOLOGY [ICT] SPECIALLY ADAPTED FOR SPECIFIC APPLICATION FIELDS
- G16H—HEALTHCARE INFORMATICS, i.e. INFORMATION AND COMMUNICATION TECHNOLOGY [ICT] SPECIALLY ADAPTED FOR THE HANDLING OR PROCESSING OF MEDICAL OR HEALTHCARE DATA
- G16H30/00—ICT specially adapted for the handling or processing of medical images
- G16H30/40—ICT specially adapted for the handling or processing of medical images for processing medical images, e.g. editing
-
- G—PHYSICS
- G01—MEASURING; TESTING
- G01N—INVESTIGATING OR ANALYSING MATERIALS BY DETERMINING THEIR CHEMICAL OR PHYSICAL PROPERTIES
- G01N21/00—Investigating or analysing materials by the use of optical means, i.e. using sub-millimetre waves, infrared, visible or ultraviolet light
- G01N21/17—Systems in which incident light is modified in accordance with the properties of the material investigated
- G01N21/25—Colour; Spectral properties, i.e. comparison of effect of material on the light at two or more different wavelengths or wavelength bands
- G01N2021/258—Surface plasmon spectroscopy, e.g. micro- or nanoparticles in suspension
-
- G—PHYSICS
- G06—COMPUTING OR CALCULATING; COUNTING
- G06N—COMPUTING ARRANGEMENTS BASED ON SPECIFIC COMPUTATIONAL MODELS
- G06N3/00—Computing arrangements based on biological models
- G06N3/02—Neural networks
- G06N3/08—Learning methods
-
- G—PHYSICS
- G06—COMPUTING OR CALCULATING; COUNTING
- G06T—IMAGE DATA PROCESSING OR GENERATION, IN GENERAL
- G06T2207/00—Indexing scheme for image analysis or image enhancement
- G06T2207/10—Image acquisition modality
- G06T2207/10024—Color image
-
- G—PHYSICS
- G06—COMPUTING OR CALCULATING; COUNTING
- G06T—IMAGE DATA PROCESSING OR GENERATION, IN GENERAL
- G06T2207/00—Indexing scheme for image analysis or image enhancement
- G06T2207/10—Image acquisition modality
- G06T2207/10056—Microscopic image
-
- G—PHYSICS
- G06—COMPUTING OR CALCULATING; COUNTING
- G06T—IMAGE DATA PROCESSING OR GENERATION, IN GENERAL
- G06T2207/00—Indexing scheme for image analysis or image enhancement
- G06T2207/20—Special algorithmic details
- G06T2207/20084—Artificial neural networks [ANN]
-
- G—PHYSICS
- G06—COMPUTING OR CALCULATING; COUNTING
- G06T—IMAGE DATA PROCESSING OR GENERATION, IN GENERAL
- G06T2207/00—Indexing scheme for image analysis or image enhancement
- G06T2207/30—Subject of image; Context of image processing
- G06T2207/30004—Biomedical image processing
- G06T2207/30024—Cell structures in vitro; Tissue sections in vitro
-
- G—PHYSICS
- G06—COMPUTING OR CALCULATING; COUNTING
- G06T—IMAGE DATA PROCESSING OR GENERATION, IN GENERAL
- G06T2207/00—Indexing scheme for image analysis or image enhancement
- G06T2207/30—Subject of image; Context of image processing
- G06T2207/30004—Biomedical image processing
- G06T2207/30068—Mammography; Breast
-
- G—PHYSICS
- G06—COMPUTING OR CALCULATING; COUNTING
- G06T—IMAGE DATA PROCESSING OR GENERATION, IN GENERAL
- G06T2207/00—Indexing scheme for image analysis or image enhancement
- G06T2207/30—Subject of image; Context of image processing
- G06T2207/30004—Biomedical image processing
- G06T2207/30096—Tumor; Lesion
-
- G—PHYSICS
- G06—COMPUTING OR CALCULATING; COUNTING
- G06V—IMAGE OR VIDEO RECOGNITION OR UNDERSTANDING
- G06V2201/00—Indexing scheme relating to image or video recognition or understanding
- G06V2201/03—Recognition of patterns in medical or anatomical images
- G06V2201/032—Recognition of patterns in medical or anatomical images of protuberances, polyps nodules, etc.
Definitions
- the present disclosure relates to the field of optical microscopy.
- the disclosure provides systems, methods and computer readable media of automated analysis of digital images captured from an optical microscope.
- PCT/AU2018/050496 in the name of La Trobe University discloses systems and methods of optical microscopy which provide enhanced image contrast through use of a sample holder having a plasmonic layer including a periodic array of sub-micron structures.
- the sample is placed on the sample holder adjacent the plasmonic layer.
- the sample and sample holder are illuminated and an image of the sample is created.
- the inventors have observed that through interaction of the light with the sample and the plasmonic layer, a colour contrast is exhibited in the received image. In particular, areas of the sample having different dielectric constant appear in the image with different colours. Intensity contrast is also achieved.
- a method according to claim 1 In a first aspect there is provided a method according to claim 1. Most preferably the sample is a biological sample.
- the method can include providing an output indicating the identification of the structure.
- the localised structural property of the sample can be a localised refractive index. Accordingly a structure in the sample with a given refractive index appears as a corresponding colour or colour range in the image.
- the method includes performing spectral analysis of at least a part of the received digital image.
- the image recognition system can be an artificial neural network or other suitable recognition system
- the features can be identified on the basis of one or more of colour differentiation; and morphology differentiation.
- colour differentiation Preferably a combination of colour differentiation and morphology differentiation is used.
- the images can be images captured with any one or more of the following differences: Different illumination characteristics (e.g. spectrum, polarisation), different magnification.
- the method also includes: Providing a sample holder having a plasmonic layer including a periodic array of sub-micron structures.
- a digital image used in the above aspects can be captured/generated using an embodiment of an aspect of any one of:
- the methods herein can include generating an output indicating the presence of one or more features.
- the methods herein can be used to determine a state of at least one cell in a sample, wherein determining a state of at least one cell is performed by identifying a structure based at least partially on the colour of the at least one cell in the image.
- the method can include, determining a disease state of at least one cell.
- the sample can contain a plurality of cells of the same type and the method can include distinguishing at least one cell from cells of the same type based on based a colour contrast between the at least one cell and cells in the plurality of cells.
- the sample can contain a plurality of cells of different types and the method can include distinguishing at least one cell of one or more types within the plurality of cells based a colour contrast between the at least one cell and cells in the plurality of cells.
- the method includes distinguishing at least one cell that is abnormal within the plurality of cells.
- the abnormal state can include cancer, benign abnormalities or infection.
- the method can include distinguishing at least one cell having in a benign abnormal state within the plurality of cells.
- the method can provide a method of distinguishing normal breast tissue from a benign abnormality/state, such as hyperplasia, or ductal carcinoma in situ (DCIS) within a population containing a plurality of breast epithelial cells.
- DCIS ductal carcinoma in situ
- the structure can be, without limitation a cell, a cancer cell, part of a cancer cell, group of cancer cells, neoplastic cell, healthy cell, cell of a given type, indicator of cell state, parasite, group of cells, abnormal cell, infected cell, tissue of a given type.
- the method can further include filtering the image to selectively process a portion of the image on the basis of colour information contained in the received image.
- the method can include segmenting the at least one image based on a colour of received light captured in the image.
- Segmenting the at least one image can include one or more of:
- the method can include any one or more of:
- the present disclosure further relates to a method of imaging a sample and automatically generating an indication of a presence of at least one structure in the sample, which method , not covered by the appended claims, includes:
- the present disclosure further relates to a computer readable medium storing thereon instructions, which when executed by a data processing system cause the data processing system to perform a method as described herein above.
- the present disclosure further relates to a system comprising a data processing system, said data processing system being programmed to perform a method as described herein above.
- the present inventors have realised that the colour contrast exhibited in the images obtained using CCM can enhance the ability to perform automated image analysis techniques on such images, e.g. to identify one or more structures within the sample, identify one or more properties of the sample in the image.
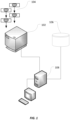
- FIG. 1 is an exemplary schematic representation of a system 100 configured to perform methods according to the present disclosure.
- the system 100 includes an image capture sub-system and an image analysis sub-system.
- the image capture sub subsystem includes a slide scanner 102 adapted to capture images of a sample mounted on a sample holder 104.
- the slide scanner 102 can be replaced with a manual image capture means (e.g. digital camera) arranged to capture an image formed by an optical microscope.
- the sample holder 104 is a sample holder made in accordance with an aspect of PCT/AU2018/050496 .
- the images captured in this fashion are then stored on a data storage system 106.
- the data storage system 106 can form part of (or be connected to) the slide scanner 102, a computing device 108 which controls the slide scanner 102, or be standalone data storage system.
- the image analysis subsystem comprises a computing device 108.
- the computing device is configured to control the operation of the slide scanner 102, receive images captured by the slide scanner, store these images, and perform analysis of them.
- a user terminal 110 is also provided to enable a user to interact with the computing device 108.
- the present embodiment illustrates direct network connections between the elements of the system 100.
- the network connections may be wired or wireless, and may include a plurality of networks.
- two or more of the elements of the system 100 may not be collocated, and thus may be connected via the internet or other network adapted to enable remote communications between devices.
- two or more elements of the system may be combined into a single device or split into separate devices.
- the functions of the computer system 108 which operate to control the slide scanner 102 may be performed by an on-board control system computer of the slide scanner 102, or a dedicated control computer, whereas the image analysis functionality may be performed by a separate computer running suitable analysis software.
- Figure 2 shows the general scheme of operation of the system 100 in an embodiment of the present disclosure.
- the first phase 202 of the method 200 includes image generation.
- First 204 samples are prepared and placed on sample holders in accordance with an embodiment of PCT/AU2018/050496 in the name of La Trobe University .
- the sample holders each have a plasmonic layer including a periodic array of sub-micron structures, as set out in figure 4.
- Fig. 4a shows a cross section through a sample holder suitable for use in the present invention.
- the sample holder 104 includes a substrate 400, in which is deposited a plasmonic layer 402.
- Figure 4ba and 4c show the two types of plasmonic layer 402 with sub-micron arrays that have been fabricated and may be used in an embodiment.
- the layers are each 150 nm thick silver films.
- Figure 4b has sub-micron arrays in the form of circular shaped nanoapertures with a 450 nm period arranged in a hexagonal pattern.
- Figure 4c has cross-shaped nanoapertures on a rectangular pattern.
- the cross-shaped nanoapertures have a 450 nm period in one direction (defined here as the 0° direction) and a 400 nm period in the orthogonal direction (defined as the 90° direction).
- These arrays have an SPP resonance mode in the 470-550 nm range, (which is within the visible region of the electromagnetic spectrum).
- HSQ hydrogen silsesquioxane
- a metal oxide capping layer e.g. SiO 2 can be used in place of HSQ.
- the sample holder After capping with HSQ, the sample holder has an upper surface similar to that of a conventional microscope slide on which a sample may be supported. It should be noted that the term upper surface and lower surface are not intended to reference a specific orientation of the sample holder either during sample preparation or use.
- a sample typically a slice of tissue, which need not be stained in the preferred embodiment of the present invention, is placed on the sample holder adjacent the plasmonic layer.
- the sample and sample holder are loaded into the slide scanner 102.
- the sample scanner illuminates (at step 206) the sample and sample holder and forms as image thereof (step 208).
- the slide scanner 102 is a microscope that illuminates the sample holder and captures an image thereof.
- a suitable slide scanner could for example be a member of the Aperio slide scanners from Leica Biosystems or any other slide scanner capable of capturing colour images of a microscope slide or similar sample holder.
- the microscope can capture images in transmission or reflection mode.
- the end result of the image generation phase 202 is one or more colour images of the sample, which can then be analysed in subsequent steps of the method.
- the samples are imaged at high resolution (e.g., 240 nm per pixel).
- the images may be of the whole sample holder, essentially a "whole-slide image".
- the image of the sample holder can be stored in a multi-resolution pyramid structure including a plurality of individual images providing multiple down-sampled versions of an original image. Each down sampled version is stored as a series of tiles, to facilitate rapid retrieval of sub-regions of the image.
- a typical whole-slide image may be approximately 200000 ⁇ 100000 pixels.
- each image can be saved in RGB colour format with one byte per colour channel colour depth, although lesser or greater colour depth, or a different colour space may be used in some embodiments.
- the images are stored in the data storage system 106.
- the image data of the whole slide or part of the slide are received (e.g. retrieved from data storage or received via a network connection, email etc.) and analysed to identify one or more structures (214) contained in the sample, and an output generated (216).
- the output can take a wide variety of forms. For example it may be, without limitation, one or more of the following:
- FIG. 3 illustrates an example process for the image processing phase 210.
- the image processing phase 210 may include an optional initial pre-processing phase 220.
- the pre-processing phase 220 can include a range of processes that may be needed prior to feature analysis. For example this could include one or more of the following:
- pre-processing steps may be omitted if the received image data is ready for image analysis without it.
- the image (or multiple images together) are processed to identify one or more features contained in the image.
- colour-based image analysis is performed.
- the colour at a particular location in the image is representative of a local physical property of the sample.
- a colour contrast is exhibited in the received image.
- areas of the sample having a different dielectric constant appear in the image with different colours.
- the underlying mechanism for the extraordinary optical contrast in the images is the resonant interaction of light with the collective oscillations of free electrons at a metal surface in the plasmonic layer of the sample holder, known as Surface Plasmon Polaritons (SPPs).
- SPPs Surface Plasmon Polaritons
- the SPP modes are characterised by peaks in the transmission spectra, the corresponding wavelength shift relative to air when a sample of thickness t is placed on top of the nanoapertures is given by: ⁇ ⁇ ⁇ ⁇ ⁇ SPP , s ⁇ ⁇ ⁇ SPP , a 1 ⁇ exp ⁇ 2 t / l d , where l d ⁇ /2 ⁇ ⁇ d is the characteristic decay length of the SPP electromagnetic field, which is itself a function of ⁇ d , the dielectric constant of the sample. It should be noted however that in the preferred embodiments the sample is significantly thicker than the characteristic decay length of the sample.
- the transmission SPP resonance peak is increasingly red-shifted until it equals ⁇ ⁇ SPP , after which no more colour change occurs. It follows that, when using a standard transmission bright-field microscope, or reflection microscope, a spatially resolved distribution of colours will result that relates directly to changes in the local dielectric constant in the sample. With the local dielectric constant encoded in the optical spectrum, a remarkable chromatic contrast effect is produced. This means that any structure within optically transparent samples, which previously was difficult to detect due to a lack of contrast, is detectable in the visible-light image, by virtue of the colour contrast captured in the images.
- an image is analysed to identify features in the image (or two or more images) that are representative of one or more structures of interest in the sample.
- a structure of interest can, for example include, a cell, group of cells, part of a cell, interstitial space between cells, void in a cell, the morphology of any of the above.
- the method can include any one or more of the following processing steps or sub-steps:
- step 222 can be grouped into two general types of processes:
- An exemplary colour-based differentiation process 222 is shown in figure 5 .
- the method 222 begins by choosing a colour space in which to perform processing.
- a colour space In the present example a HSL colour space (Hue, Saturation, Lightness) is used.
- each pixel in the received image(s) are represented by value corresponding to each parameter. Conversion between the colour space of the received image(s) and the chosen colour space may be needed.
- step 504 local feature extraction is performed. This process involves analysis of the received image(s) based on colour to identify pixels that may correspond to the structure of interest. The correlation between the structure of interest and its colour in the received image(s) may be known, or determined from preliminary analysis of the image(s).
- colour correlations between structures of interest were determined by inspection of a plurality of images by experts.
- images of slides were compared to a ground truth standard for the PyMT model.
- Adjacent breast tissue sections were independently classified by examination of the morphology by a breast cancer expert following a protocols similar to that established in the literature for automated segmentation of Ki67 images on the basis of hue (e.g. Shi et al., Scientific Reports, 2016 ). The same process was performed on corresponding (adjacent sections) for Ki67 images to enable comparison with the present methodology.
- the mean RGB and HSL channel values for positive cancer cells in Ki67 and nanoslide are summarised in Table 1 below.
- the RGB values for Ki67 positivity determined by the inventors are close to the published values from ( Shi et al., Scientific Reports, 2016 ).
- Table 1 Mean RGB space values Mean HSL space values Values R G B H S L Ki67 (brown) 123 51 7 23 89 26 Nanoslide (blue) 23 69 86 196 58 21
- pixels of the image(s) having HSL values corresponding with cancer positivity are selected.
- pixels having colour values in the selected range are further analysed to identify groups or subsets of pixels that may represent the structure of interest (e.g. nucleus of a cancer cell).
- the subsequent analysis can include analyzing the pixels to identify correlation between a pixel and at least one neighbouring pixel.
- the mean intensity and standard deviation at a pixel site can be calculated based on a 3x3 group of pixels centred on the pixel, and can be used as a measure of signal strength and local variance on signal strength in the neighbourhood of the pixel site.
- the skewness and kurtosis of pixel and its surrounding 3x3 neighbourhood of pixels can be calculated.
- the skewness measures symmetry of local intensity and whether the intensity is more peaked or flat than a normal distribution.
- These measures of local pixel correlation can be used to cluster similar pixels or separate dis-similar pixels into clusters (representing structures of interest) in step 508. Grouping can be performed using kmeans clustering or other suitable techniques, as part of a structure identification step 506. It may be necessary to more accurately define the boundary of a structure of interest.
- clusters representing touching or overlapping features can be separated into individual clusters. This can be performed, e.g. using the watershed method.
- step 228 the output of the differentiation processes are used to make a decision on the presence or absence of one or more features in the image which indicate the presence or absence of a structure in the sample.
- a combination of colour differentiation in addition to sample morphology differentiation enables more accurate identification of a structure.
- a spatial correlation between the output form colour differentiation and morphology differentiation could be used to distinguish between features that are indistinguishable by one process alone.
- the image recognition system can be an artificial neural network.
- the image recognition system can be trained on a suitable training set of images containing known structures.
- An exemplary image recognition method and system that could be used in embodiments of the present invention is described in " An Advanced Deep Learning Approach for Ki-67 Stained Hotspot Detection and Proliferation Rate Scoring for Prognostic Evaluation of Breast Cancer" Scientific Reports; 7: 3213 DOI:10.1038/s41598-017-03405-5, (2017 ) describes a deep learning methodology using an ANN system to detect breast cancer cells for Ki67 stained samples. Such a methodology could be applied to images taken with a nanoslide to identify similar structures as taught herein.
- an output is generated at 232.
- the output can take a wide variety of forms. For example it may be, without limitation, one or more of the following:
- Feature enhancement can include showing the boundary of the structure or structures which have been identified in the image(s) in an augmented image.
- the boundary can include drawing a bounding box or other outline around the identified features. This can be of use to a user of the system to rapidly enable identification and human investigation and verification of the presence or absence of the structure.
- sample holders having a plasmonic layer with a periodic array of sub-micron structures were fabricated using displacement Talbot lithography to produce devices on the scale of whole microscope slides (e.g. 75 mm ⁇ 25 mm).
- the nanoslides were used in conventional brightfield imaging of samples and histological tissue sections of corresponding samples were scored by two reference pathologists. The properties of the brightfield images were analysed based on the measured hue, saturation, and lightness in the image.
- Figure 7a and 7b together illustrate, schematically the pathology workflow for small-animal, MMTV-PyMT mouse model study including, showing how serial sections were taken in order for a direct comparison of nanoslide, H&E, and Ki67.
- mice develop pre-invasive and invasive neoplasms within 50 days of age.
- Pre-invasive and invasive neoplasms have previously been shown to be distinguishable from benign epithelial cells using IHC staining for the proliferative marker Ki67.
- the workflow for the study design is shown in Fig. 7a and 7b .
- step 700 For the nanoslide and Ki67 stained samples automated image analysis as set out above was performed in step 700 to identify the presence or absence of neoplastic cells.
- Figure 8 shows large field-of-view (3.8 mm) sections of corresponding slices of H&E, Ki67, and nanoslide images (top to bottom); each slice is 4 ⁇ m thick (>> I d for the nanoslide). These sections cover a range of different tissues types (e.g. lymph nodes, collagen, muscle tissue, ligament etc.) and also include regions of pre-invasive and neoplastic breast tissue. Using the ground truth pathology assessment and the comparative Ki67 staining the HSL values associated with cancer cells were identified for nanoslide. A total of 64 regions were examined across the cohort of 24 mice. In the bottom row of figure 8 the regions with HSL values consistent with neoplastic MMTV-PyMT breast cancer cells are shown in light blue (nanoslide) and bright green (Ki67).
- tissue types e.g. lymph nodes, collagen, muscle tissue, ligament etc.
- tissue as identified by the automated image analysis of the nanoslide images was classified as True Positive (TP), True Negative (TN), False Positive (FP), and False Negative (FN) as compared to human analysis.
- pathology annotations when a cancer containing region has been identified, high-resolution H&E stained slides were used to identify the stage of the cancer and the margins.
- O'Toole human breast and murine mammary gland pathologist
- Breast cancer researcher Parker
- the second piece of information came from the image pixel HSL colour space values which were compared against the reference values from the training data (as set out for the nanoslide in figure 6 ). Regions containing normal, hyperplasia, DCIS (ductal carcinoma in situ), and invasive neoplastic breast tissue were independently analysed for both nanoslide and Ki67 staining. Some example images of each type of region and resulting tissue classification are shown in Fig. 9 . Classification was applied according to the following descriptions. Classification Description of classification method for Ki67 and Nanoslide True Positive (TP) TP was assigned when the HSL colour space values were consistent with cancer cells established by 'training' the segmentation algorithm.
- TP Nanoslide True Positive
- False Positive (FP) FP was assigned when the HSL colour space values were consistent with cancer cells but the identified region was outside of the area manually identified as containing cancer cells by the expert pathologists.
- False Negative (FN) FN was assigned when the HSL colour space values were not consistent with either cancer cells or with non-cancerous tissue and when the identified region was within the area manually identified as containing cancer cells by the expert pathologists.
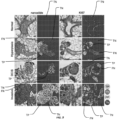
- Figure 9 illustrates high-resolution images taken across 24 MMTV-PyMT mice were sub-categorised (as set out under the heading "Pathology assessment” below) into four different stages (normal, hyperplasia, DCIS, and invasive) for both nanoslide (1st coloumn) and Ki67 (4th coloumn) based on annotations from the pathologist.
- the automated analysis based on HSL colour space values for each image were compared against ground truth annotations by a pathologist, the evaluation results are classified in terms of TP (green), FN (red), FP (yellow), and TN (blue) regions.
- the images (1st and 3rd columns) are presented as they appear under the microscope.
- Neoplastic cells in pre-invasive and invasive neoplastic tissues were easily distinguished from surrounding cells in the same tissue and benign tissues via a colorimetric differential interaction as a result of either staining (Ki67 - brown colour) or as a result of variations in the local dielectric constant (nanoslide - blue/purple colour).
- adipose and other types of non-cancerous tissue observed across the slides have a characteristically different colour (HSL) on both the nanoslide and Ki67, supporting this association.
- HSL characteristically different colour
- the normal cells on the nanoslide appear to be almost uniformly categorised as TN.
- the invasive cells image on the nanoslide image was categorised as a large majority of TP regions surrounded by TN areas, showing accurate categorisation by the automated image analysis.
- the DCIS and Hyperplasia images include a region of majority TP towards the centre of the neoplastic regions surrounded by areas of mixed FN, TP, TN regions.
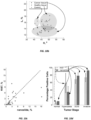
- FIG. 10A illustrates the received colour spectrum of benign and neoplastic breast tissue, giving rise to colour contrast in nanoslide images.
- the spectral output of cancer cells appears to be distinct from other types of non-cancerous tissue providing a novel mechanism for performing digital pathology.
- the inventors used an established scoring matrix for discriminating 'normal', hyperplasia, DCIS and invasive lesions.
- both approaches identify a similar percentage of neoplastic cells in a randomised preclinical study.
- DCIS comprises lesions which are heterogeneous with highly variable morphology; whereas at the extremes of normal and invasive, breast cancer is easy to discern, DCIS is subtle and consequently suffers from misdiagnosis based on H&E alone particularly at large fields-of-view.
- Fig. 10b shows how the automated method described herein using a nanoslide sample holder discriminates between structures in a sample.
- 'healthy' and invasive cancer tissue can be identified based in the hue (H,°) and luminosity (L, %) of the images.
- the 'healthy' tissue sections are taken from MMTV-PyMT mice, 90% of which will eventually develop pre-invasive and invasive neoplasms, hence a small amount of overlap may be expected when comparing to invasive cancer regions.
- the difference between normal and cancer mammary tissue is further validated by the clear discrimination between normal/benign tissue in wildtype animals and neoplastic tissue.
- Figure 10 d shows pathology scoring of Ki67 and nanoslide images for data collected from 24 mice, the percentage of cells identified as cancerous is indicative of the tumour stage.
- the positive correlation between Ki67 and nanoslide supports the breast cancer pathologists manual scoring ( Fig. 10d ) and concurs with Figure 10e , that shows the Sorensen-Dice coefficient (DSC) coefficients for nanoslide and Ki67 for three different classes of neoplastic region.
- Figure 11 shows an example implementation of an embodiment of the present invention used to detect a structure in human cells.
- the structures are cancerous cells.
- Figure 11a shows the image illustrating DCIS in breast tissue imaged with CCM
- 11b shows the image illustrating DCIS in breast tissue imaged with IHC staining.
- the right hand panel shows a segmented image that identifies portions of each captured image having a colour within 15% of the mean colour of cancer for the sample (see Figure 6 for the CCM colour range, and table 1).
- Figure 6 for the CCM colour range, and table 1
- FIG. 11a left The human tissue sample was imaged on a nanoslide ( Figure 11a left) and by Ki67 IHC staining ( Figure 11b left).
- the images were processed using the automated image processing method described herein, in the same way as the mouse samples in the previous example.
- Figure 11a right illustrates the segmented nanoslide image, illustrating those portions of the image determined to represent the structure of interest, namely breast cancer cells.
- each blue "blob" represents a pixel cluster determined by the image processing to represent a cancer cell imaged on the Ki67 stained slide.
- mammary glands of C57 BI/6 MMTV-PyMT mice at different stages were taken and morphologically evaluated by H&E and Ki67 by an expert human breast and murine mammary gland pathologist (O'Toole) and breast cancer researcher (Parker).
- Nanoslide samples were randomized and independently scored and then compared post-analysis to the results of Ki67 and nanoslide.
- the benchmark for the pathology assessment was a trained pathologist analyzing the H&E stained tissue sections at high-resolution and without any time constraints. As this was a control study the cancer stage for the mice was already known by the pathologist. In addition, the pathologist could refer back to the IHC staining to confirm that no neoplastic tissue regions were missed during the assessment. When looking at a tumor region or duct containing cancer at high resolution the pathologist counts the number of cancer cells.
- the pathologist then compared the number of individual positive cells (as determined by a colour change - 'brown' for Ki67 and 'green' for nanoslide) using either Ki67 or nanoslide and divided this number by the total number of cancer cells identified from pathological assessment of the H&E images to arrive at the final figure for "percentage positive cells".
- This analysis was conducted on 24 cancer containing regions across the 24 mice used in this study. Based on the knowledge of the cancer stage the results could be classified into 4 stages: 'normal', 'hyperplasia', 'DCIS', and 'invasive'.
- the mean value of the percentage of positive cancer cells as determined by the pathologist was calculated within each category, it is this mean value, averaged between the two independent sets of scores, which is represented by the height of the bars in the bar chart.
- the range e.g. minimum and maximum percentages over the different samples used to generate the error bars shown in Fig. 10d .
- the scoring matrix for discriminating normal, DCIS, and invasive lesions is shown in the following table. Normal DCIS Invasive Appearance of lumen Empty Lumen Filled Lumen No Lumen Epithelial Ki67 positivity (95% confidence interval) 0-28% 44-66% 48-96%
Landscapes
- Engineering & Computer Science (AREA)
- Health & Medical Sciences (AREA)
- Physics & Mathematics (AREA)
- Life Sciences & Earth Sciences (AREA)
- General Physics & Mathematics (AREA)
- Biomedical Technology (AREA)
- General Health & Medical Sciences (AREA)
- Theoretical Computer Science (AREA)
- Molecular Biology (AREA)
- Chemical & Material Sciences (AREA)
- Computer Vision & Pattern Recognition (AREA)
- Biophysics (AREA)
- Pathology (AREA)
- Immunology (AREA)
- Biochemistry (AREA)
- Analytical Chemistry (AREA)
- Radiology & Medical Imaging (AREA)
- Medical Informatics (AREA)
- Nuclear Medicine, Radiotherapy & Molecular Imaging (AREA)
- Hematology (AREA)
- Medicinal Chemistry (AREA)
- Urology & Nephrology (AREA)
- Optics & Photonics (AREA)
- Food Science & Technology (AREA)
- Multimedia (AREA)
- Data Mining & Analysis (AREA)
- General Engineering & Computer Science (AREA)
- Computing Systems (AREA)
- Evolutionary Computation (AREA)
- Quality & Reliability (AREA)
- Software Systems (AREA)
- Mathematical Physics (AREA)
- Computational Linguistics (AREA)
- Artificial Intelligence (AREA)
- Spectroscopy & Molecular Physics (AREA)
- Epidemiology (AREA)
- Primary Health Care (AREA)
- Public Health (AREA)
- Investigating Or Analysing Materials By Optical Means (AREA)
- Image Analysis (AREA)
Description
- The present disclosure relates to the field of optical microscopy. In one form, the disclosure provides systems, methods and computer readable media of automated analysis of digital images captured from an optical microscope.
-
PCT/AU2018/050496 in the name of La Trobe University PCT/AU2018/050496 Australian patent application 2018904553, filed on 29 November 2018 AU2018904553 - In a first aspect there is provided a method according to claim 1. Most preferably the sample is a biological sample.
- The method can include providing an output indicating the identification of the structure.
- In the digital image received, the localised structural property of the sample can be a localised refractive index. Accordingly a structure in the sample with a given refractive index appears as a corresponding colour or colour range in the image.
- In some embodiments the method includes performing spectral analysis of at least a part of the received digital image.
- In some embodiments the method can include any one or more of the following processing steps or sub-steps:
- Colour filtering the image to selectively process colour band of the received image;
- Determining a colour distribution or colour histogram of the received image;
- Performing a feature extraction method to identify one or more structures in the image;
- Processing the digital image with an image recognition system.
- Processing the digital image with an image recognition system to recognise one or more features in the image corresponding to one or more structures.
- The image recognition system can be an artificial neural network or other suitable recognition system
- In some forms the features can be identified on the basis of one or more of colour differentiation; and morphology differentiation. Preferably a combination of colour differentiation and morphology differentiation is used.
- In embodiments that use more than one image of the sample the images can be images captured with any one or more of the following differences:
Different illumination characteristics (e.g. spectrum, polarisation), different magnification. - The method also includes:
Providing a sample holder having a plasmonic layer including a periodic array of sub-micron structures. - Placing the sample on the sample holder adjacent the plasmonic layer.
- Illuminating the sample and sample holder and capturing a colour digital image thereof.
- In some forms, a digital image used in the above aspects can be captured/generated using an embodiment of an aspect of any one of:
-
PCT/AU2018/050496 - the applicant's co-pending
Australian patent application 2018904553 , filed on 29 November 2018 AU2018904553 - the applicant's co-pending
Australian patent application 2018904552, filed on 29 November 2018 AU 2018904552 - The methods herein can include generating an output indicating the presence of one or more features. The methods herein can be used to determine a state of at least one cell in a sample, wherein determining a state of at least one cell is performed by identifying a structure based at least partially on the colour of the at least one cell in the image.
- This can be performed in accordance with the teaching of the applicant's co-pending
Australian patent application 2018904550, filed on 29 November 2018 AU 2018904550 - The method can include, determining a disease state of at least one cell.
- In some embodiments the sample can contain a plurality of cells of the same type and the method can include distinguishing at least one cell from cells of the same type based on based a colour contrast between the at least one cell and cells in the plurality of cells. In some embodiments the sample can contain a plurality of cells of different types and the method can include distinguishing at least one cell of one or more types within the plurality of cells based a colour contrast between the at least one cell and cells in the plurality of cells. Preferably the method includes distinguishing at least one cell that is abnormal within the plurality of cells. In some cases the abnormal state can include cancer, benign abnormalities or infection. The method can include distinguishing at least one cell having in a benign abnormal state within the plurality of cells. For example the method can provide a method of distinguishing normal breast tissue from a benign abnormality/state, such as hyperplasia, or ductal carcinoma in situ (DCIS) within a population containing a plurality of breast epithelial cells.
- In embodiments of all aspects disclosed herein the structure can be, without limitation a cell, a cancer cell, part of a cancer cell, group of cancer cells, neoplastic cell, healthy cell, cell of a given type, indicator of cell state, parasite, group of cells, abnormal cell, infected cell, tissue of a given type.
- The method can further include filtering the image to selectively process a portion of the image on the basis of colour information contained in the received image.
- The method can include segmenting the at least one image based on a colour of received light captured in the image.
- Segmenting the at least one image can include one or more of:
- Identifying one or more subsets of pixels within an image based at least partly on colour;
- Grouping pixels into features representing a structure on the sample based on correlation between a pixel and at least one neighbouring pixel.
- Furthermore, the method can include any one or more of:
- Determining a colour distribution of the received image;
- Determining a colour histogram of the received image;
- Performing spectral analysis of at least part of the received digital image.
- The present disclosure further relates to a method of imaging a sample and automatically generating an indication of a presence of at least one structure in the sample, which method, not covered by the appended claims, includes:
- Providing a sample holder having a plasmonic layer including a periodic array of sub-micron structures;
- Placing the sample on the sample holder adjacent the plasmonic layer;
- Illuminating the sample and sample holder and capturing at least one colour digital image thereof;
- Performing a method of identifying a structure in the sample as described herein above.
- The present disclosure further relates to a computer readable medium storing thereon instructions, which when executed by a data processing system cause the data processing system to perform a method as described herein above.
- The present disclosure further relates to a system comprising a data processing system, said data processing system being programmed to perform a method as described herein above.
- Illustrative embodiments of the present invention will be described by way of nonlimiting examples with reference to the accompanying drawings. The drawings filed with the present international application include colour images used in, and arising from use of embodiments of the present invention. The colour information forms part of the disclosure of the embodiments. Should black and white or greyscale reproduction of the images occur, colour disclosure can be obtained from the originally filed documents. In the drawings:
-
Figure 1 is a schematic diagram of a system adapted to perform automated scanning of samples and analysis of images according to an embodiment of the present invention. -
Figure 2 illustrates a method performed by an embodiment of the present invention. -
Figure 3 illustrates details of an analysis method performed by an embodiment of the present invention. -
Figure 4 illustrates details of an exemplary sample holder used in embodiments of the present disclosure. The present invention should not be considered to be limited to use of sample holders with the particular microstructure array illustrated infigure 4 . -
Figure 5 is a flowchart showing steps in a colour-based structure identification method usable in an embodiment of the present invention. -
Figure 6 illustrates an example range of HSL colour space values corresponding to cancer positivity in PyMT models using nanoslide. -
Figure 7a and 7b illustrate schematically the pathology workflow for small-animal, MMTV-PyMT mouse model study. -
Figure 8 shows large field-of-view (3.8 mm) sections of corresponding slices of H&E, Ki67, and nanoslide images (top to bottom), with the bottom row showing portions of the images identified by an automated image analysis method based on their respective HSL colour space values to be positive for neoplastic cells. Regions with HSL values consistent with neoplastic MMTV-PyMT breast cancer cells are shown in light blue (nanoslide) and bright green (Ki67). -
Figure 9 shows an example output indicating the identification of a structure the automated segmentation of small-animal data based on HSL colour space and assessment by a breast-cancer pathologist. -
Figure 10a shows the spectral characteristics of healthy and cancerous tissue.Figure 10b , shows the output of regions evaluated by an expert breast cancer pathologist plotted as a function of luminosity (L) versus hue (H).Figure 10c , shows the percentage of cells positively identified as being cancerous on the basis of HSL colour space values.Figure 10d , shows pathology scoring of Ki67 and nanoslide images for data collected from 24 mice, the percentage of cells identified as cancerous is indicative of the tumour stage.Figure 10e , shows the agreement of Dice coefficients for nanoslide and Ki67 for three different classes of neoplastic region. -
Figure 11 shows an example implementation of an embodiment of the present invention used to detect a structure in human cells. In this case the structure are cancerous cells. - The present inventors have realised that the colour contrast exhibited in the images obtained using CCM can enhance the ability to perform automated image analysis techniques on such images, e.g. to identify one or more structures within the sample, identify one or more properties of the sample in the image.
-
Figure 1 is an exemplary schematic representation of a system 100 configured to perform methods according to the present disclosure. In overview the system 100 includes an image capture sub-system and an image analysis sub-system. The image capture sub subsystem includes aslide scanner 102 adapted to capture images of a sample mounted on asample holder 104. In other embodiments theslide scanner 102 can be replaced with a manual image capture means (e.g. digital camera) arranged to capture an image formed by an optical microscope. Thesample holder 104 is a sample holder made in accordance with an aspect ofPCT/AU2018/050496 data storage system 106. Thedata storage system 106 can form part of (or be connected to) theslide scanner 102, acomputing device 108 which controls theslide scanner 102, or be standalone data storage system. The image analysis subsystem comprises acomputing device 108. The computing device is configured to control the operation of theslide scanner 102, receive images captured by the slide scanner, store these images, and perform analysis of them. A user terminal 110 is also provided to enable a user to interact with thecomputing device 108. - The present embodiment illustrates direct network connections between the elements of the system 100. The network connections may be wired or wireless, and may include a plurality of networks. In some embodiments two or more of the elements of the system 100 may not be collocated, and thus may be connected via the internet or other network adapted to enable remote communications between devices. Moreover two or more elements of the system may be combined into a single device or split into separate devices. For example the functions of the
computer system 108 which operate to control theslide scanner 102 may be performed by an on-board control system computer of theslide scanner 102, or a dedicated control computer, whereas the image analysis functionality may be performed by a separate computer running suitable analysis software. -
Figure 2 shows the general scheme of operation of the system 100 in an embodiment of the present disclosure. Thefirst phase 202 of the method 200 includes image generation. First 204 samples are prepared and placed on sample holders in accordance with an embodiment ofPCT/AU2018/050496 in the name of La Trobe University figure 4. Fig. 4a shows a cross section through a sample holder suitable for use in the present invention. Thesample holder 104 includes asubstrate 400, in which is deposited a plasmonic layer 402.Figure 4ba and 4c show the two types of plasmonic layer 402 with sub-micron arrays that have been fabricated and may be used in an embodiment. The layers are each 150 nm thick silver films.Figure 4b has sub-micron arrays in the form of circular shaped nanoapertures with a 450 nm period arranged in a hexagonal pattern.Figure 4c has cross-shaped nanoapertures on a rectangular pattern. The cross-shaped nanoapertures have a 450 nm period in one direction (defined here as the 0° direction) and a 400 nm period in the orthogonal direction (defined as the 90° direction). These arrays have an SPP resonance mode in the 470-550 nm range, (which is within the visible region of the electromagnetic spectrum). To protect the surface of the plasmonic layer, a layer (10nm ± 1nm) of hydrogen silsesquioxane (HSQ), a glass-like material, is deposited after fabrication of the plasmonic layer. In other embodiments a metal oxide capping layer e.g. SiO2 can be used in place of HSQ. After capping with HSQ, the sample holder has an upper surface similar to that of a conventional microscope slide on which a sample may be supported. It should be noted that the term upper surface and lower surface are not intended to reference a specific orientation of the sample holder either during sample preparation or use. - A sample, typically a slice of tissue, which need not be stained in the preferred embodiment of the present invention, is placed on the sample holder adjacent the plasmonic layer. The sample and sample holder are loaded into the
slide scanner 102. The sample scanner illuminates (at step 206) the sample and sample holder and forms as image thereof (step 208). In essence theslide scanner 102 is a microscope that illuminates the sample holder and captures an image thereof. A suitable slide scanner could for example be a member of the Aperio slide scanners from Leica Biosystems or any other slide scanner capable of capturing colour images of a microscope slide or similar sample holder. The microscope can capture images in transmission or reflection mode. - The end result of the
image generation phase 202 is one or more colour images of the sample, which can then be analysed in subsequent steps of the method. In an exemplary form the samples are imaged at high resolution (e.g., 240 nm per pixel). - The images may be of the whole sample holder, essentially a "whole-slide image". The image of the sample holder can be stored in a multi-resolution pyramid structure including a plurality of individual images providing multiple down-sampled versions of an original image. Each down sampled version is stored as a series of tiles, to facilitate rapid retrieval of sub-regions of the image. A typical whole-slide image may be approximately 200000 × 100000 pixels. In one form each image can be saved in RGB colour format with one byte per colour channel colour depth, although lesser or greater colour depth, or a different colour space may be used in some embodiments. The images are stored in the
data storage system 106. - In the
image processing phase 210 the image data of the whole slide or part of the slide are received (e.g. retrieved from data storage or received via a network connection, email etc.) and analysed to identify one or more structures (214) contained in the sample, and an output generated (216). The output can take a wide variety of forms. For example it may be, without limitation, one or more of the following: - Issuance of a notification message or alert; respect or after data reflecting the outcome of acid analysis;
- Generation of an augmented image, (e.g. see
figure 11 ) e.g. on which an identified structure or candidate feature which may be an identified structure is emphasised, rendered more visible or rendered identifiable to a user; - Generation of an image with metadata indicating the identification of a structure or one or more analysis steps performed thereon.
-
Figure 3 illustrates an example process for theimage processing phase 210. Theimage processing phase 210 may include an optional initialpre-processing phase 220. Thepre-processing phase 220 can include a range of processes that may be needed prior to feature analysis. For example this could include one or more of the following: - Generation of a plurality of individual images from a single image, e.g. generating multiple down-sampled versions of an original image, subdivision of an image into a series of spatial tiles.
- Colour correction, balancing colour response of different colour planes in the image;
- Noise removal or noise equalisation.
- It should be noted that the pre-processing steps may be omitted if the received image data is ready for image analysis without it.
- Next, the image (or multiple images together) are processed to identify one or more features contained in the image. In a primary processing step colour-based image analysis is performed. In the present invention, the colour at a particular location in the image is representative of a local physical property of the sample. In particular by using a sample holder having a plasmonic layer including a periodic array of sub-micron structures a colour contrast is exhibited in the received image. In particular, areas of the sample having a different dielectric constant appear in the image with different colours.
- The underlying mechanism for the extraordinary optical contrast in the images is the resonant interaction of light with the collective oscillations of free electrons at a metal surface in the plasmonic layer of the sample holder, known as Surface Plasmon Polaritons (SPPs). The spectral change in transmitted light through an array of sub-wavelength apertures in contact with a dielectric specimen is a function of the wavelength shift, Δλ of the SPP resonant modes λθ SPP , where superscript θ denotes the incident polarisation angle (the symbol is removed for unpolarised light) and the subscript indicates whether the dielectric constant is for the sample (d = s) or for air (d = a). The SPP modes are characterised by peaks in the transmission spectra, the corresponding wavelength shift relative to air when a sample of thickness t is placed on top of the nanoapertures is given by:

- Next in
step 222 an image (or two or more images) is analysed to identify features in the image (or two or more images) that are representative of one or more structures of interest in the sample. A structure of interest can, for example include, a cell, group of cells, part of a cell, interstitial space between cells, void in a cell, the morphology of any of the above. In some embodiments the method can include any one or more of the following processing steps or sub-steps: - Colour filtering the image to selectively process (e.g. perform feature differentiation) on one or more colour bands of the received image, or an image generated from one or more colour bands;
- Determining a colour distribution or colour histogram of the received image;
- Performing a feature extraction method to identify one or more structures in the image;
- Processing the digital image with an image recognition system.
- The analysis in
step 222 can be grouped into two general types of processes: - Colour differentiation (224), which encompasses differentiation methods based on the localised colour of the image of the sample, relative colour of more than two locations in the image, overall colour/spectral content of the image or portion thereof. Colour differentiation can be based on a CIE plot which mimics sensitivity of the human eye. In some embodiments a spectral 'fingerprint' can be generated for an image or portion thereof. The spectral fingerprint can enable either a coarse analysis based on e.g. where the spectral fingerprint in the form of an RGB ratio is compared to values in a look up table to determine if a sample is 'healthy' or not. Alternatively a more detailed spectral fingerprint can be compared against a higher resolution spectrum e.g. collected using a spectrometer. As will be appreciated in analysing any one image (or set of two or more images) multiple colour differentiation techniques can be used. An exemplary colour-based
analysis method 222 is described below in relation tofigure 5 . - Morphology differentiation (226), which uses the shape characteristics of one or more structures in an image to identify the structure. In some the forms morphology process can include contour analysis to identify the shape of a given structure(s) in an image. Further examples of morphology differentiation methods that could be applied in an embodiment is described in Peng H, Zhou X, Li F, Xia X, Wong ST. INTEGRATING MULTI-SCALE BLOB/CURVILINEAR DETECTOR TECHNIQUES AND MULTI-LEVEL SETS FOR AUTOMATED SEGMENTATION OF STEM CELL IMAGES. Proc IEEE Int Symp Biomed Imaging. 2009; 2009:1362-1365. Other morphology differentiation methods could be used. In some forms morphology differentiation can be performed on a colour filtered representation of the image (e.g. performed on one colour plane in the image) or on a pre-processed image that combines multiple colour planes (e.g. a luminance image) derived from the captured images.
- An exemplary colour-based
differentiation process 222 is shown infigure 5 . Themethod 222 begins by choosing a colour space in which to perform processing. In the present example a HSL colour space (Hue, Saturation, Lightness) is used. As such each pixel in the received image(s) are represented by value corresponding to each parameter. Conversion between the colour space of the received image(s) and the chosen colour space may be needed. Next instep 504 local feature extraction is performed. This process involves analysis of the received image(s) based on colour to identify pixels that may correspond to the structure of interest. The correlation between the structure of interest and its colour in the received image(s) may be known, or determined from preliminary analysis of the image(s). For example in experiments performed by the inventors, colour correlations between structures of interest (cancer cell nuclei, in samples from a PyMT model) were determined by inspection of a plurality of images by experts. In particular, to establish the HSL range for cancer cell identification using the nanoslide, images of slides were compared to a ground truth standard for the PyMT model. Adjacent breast tissue sections were independently classified by examination of the morphology by a breast cancer expert following a protocols similar to that established in the literature for automated segmentation of Ki67 images on the basis of hue (e.g. Shi et al., Scientific Reports, 2016). The same process was performed on corresponding (adjacent sections) for Ki67 images to enable comparison with the present methodology. - Both methods generally follow the process of Shi, P. et al. Automated Ki-67 Quantification of Immunohistochemical Staining Image of Human Nasopharyngeal Carcinoma Xenografts. Scientific Reports 6, 32127, doi:10.1038/srep32127 (2016).
- For both the nanoslide images and Ki67 images the mean RGB space and HSL space values for the cancer cells were determined from the ground truth standard. Cancer cells when imaged on the nanoslide manifest themselves as generally blue in hue, whereas, Ki-67 positive nuclei manifest themselves as brown hue in images of breast tissues.
- The mean RGB and HSL channel values for positive cancer cells in Ki67 and nanoslide are summarised in Table 1 below. The RGB values for Ki67 positivity determined by the inventors are close to the published values from (Shi et al., Scientific Reports, 2016).
Table 1 Mean RGB space values Mean HSL space values Values R G B H S L Ki67 (brown) 123 51 7 23 89 26 Nanoslide (blue) 23 69 86 196 58 21 - Based on the variability of the colour change associated with cell positivity in nanoslide and Ki67 a ±15% threshold centred around the mean HSL colour space values (in each of H, S and L) was used for segmentation of positive cancer cells - that is, within this range cells were considered to be 'positive' for cancer. An example range of HSL colour space values corresponding to cancer positivity using nanoslide is shown in
figure 6 . - In the local
feature extraction step 504 pixels of the image(s) having HSL values corresponding with cancer positivity are selected. In the present example using the nanoslide only a single colour range is considered, but other embodiments may perform multiple segmentations based on different colour ranges to attempt to identify respective structures in the image(s). Pixels having colour values in the selected range are further analysed to identify groups or subsets of pixels that may represent the structure of interest (e.g. nucleus of a cancer cell). The subsequent analysis can include analyzing the pixels to identify correlation between a pixel and at least one neighbouring pixel. In some examples, the mean intensity and standard deviation at a pixel site can be calculated based on a 3x3 group of pixels centred on the pixel, and can be used as a measure of signal strength and local variance on signal strength in the neighbourhood of the pixel site. The skewness and kurtosis of pixel and its surrounding 3x3 neighbourhood of pixels can be calculated. The skewness measures symmetry of local intensity and whether the intensity is more peaked or flat than a normal distribution. These measures of local pixel correlation can be used to cluster similar pixels or separate dis-similar pixels into clusters (representing structures of interest) instep 508. Grouping can be performed using kmeans clustering or other suitable techniques, as part of astructure identification step 506. It may be necessary to more accurately define the boundary of a structure of interest. Instep 510, clusters representing touching or overlapping features can be separated into individual clusters. This can be performed, e.g. using the watershed method. - In
step 228 the output of the differentiation processes are used to make a decision on the presence or absence of one or more features in the image which indicate the presence or absence of a structure in the sample. - In some embodiments a combination of colour differentiation in addition to sample morphology differentiation enables more accurate identification of a structure. For example a spatial correlation between the output form colour differentiation and morphology differentiation could be used to distinguish between features that are indistinguishable by one process alone.
- The image recognition system can be an artificial neural network. The image recognition system can be trained on a suitable training set of images containing known structures. An exemplary image recognition method and system that could be used in embodiments of the present invention is described in "An Advanced Deep Learning Approach for Ki-67 Stained Hotspot Detection and Proliferation Rate Scoring for Prognostic Evaluation of Breast Cancer" Scientific Reports; 7: 3213 DOI:10.1038/s41598-017-03405-5, (2017) describes a deep learning methodology using an ANN system to detect breast cancer cells for Ki67 stained samples. Such a methodology could be applied to images taken with a nanoslide to identify similar structures as taught herein.
- In the event that one or more features are identified in
step 228 the one or more images, an output is generated at 232. The output can take a wide variety of forms. For example it may be, without limitation, one or more of the following: - Issuance of a notification message or alert;
- Generation of an augmented image (in step 230), e.g. on which an identified structure or candidate feature which may be an identified structure is enhanced e.g. it can be emphasised, rendered more visible or rendered identifiable to a user;
- Generation of an image with metadata indicating the identification of a structure or one or more analysis steps performed thereon.
- Feature enhancement can include showing the boundary of the structure or structures which have been identified in the image(s) in an augmented image. The boundary can include drawing a bounding box or other outline around the identified features. This can be of use to a user of the system to rapidly enable identification and human investigation and verification of the presence or absence of the structure.
- Methods disclosed herein can be used in an implementation an embodiment of an aspect of the applicant's co-pending
Australian patent application 2018904550, filed on 29 November 2018 AU 2018904550 - To illustrate the usefulness of the present method, automated image processing is performed using nanoslide images on the basis of the HSL (hue, saturation, lightness) of the image pixels. The results were compared to those obtained from analysis of samples stained using proliferative markers (Ki67) and illustrate the technique can distinguish a structure, which in this example is distinguishing neoplastic cells, as compared to normal breast epithelium.
- In the present example sample holders having a plasmonic layer with a periodic array of sub-micron structures (e.g. circular holes) were fabricated using displacement Talbot lithography to produce devices on the scale of whole microscope slides (e.g. 75 mm × 25 mm). The nanoslides were used in conventional brightfield imaging of samples and histological tissue sections of corresponding samples were scored by two reference pathologists. The properties of the brightfield images were analysed based on the measured hue, saturation, and lightness in the image.
-
Figure 7a and 7b together illustrate, schematically the pathology workflow for small-animal, MMTV-PyMT mouse model study including, showing how serial sections were taken in order for a direct comparison of nanoslide, H&E, and Ki67. - In the study the images made use of the MMTV-PyMT model of spontaneous breast tumorigenesis, where mice develop pre-invasive and invasive neoplasms within 50 days of age. Pre-invasive and invasive neoplasms have previously been shown to be distinguishable from benign epithelial cells using IHC staining for the proliferative marker Ki67. In total 24 mice were used for this study. The workflow for the study design is shown in
Fig. 7a and 7b . For each slice of tissue sectioned and placed on a nanoslide the neighbouring section was H&E stained (for use as the ground truth analysis by expert human analysis) whilst the next two sections were treated with IHC staining (one section with the proliferative marker and the other with control IgG. - For the nanoslide and Ki67 stained samples automated image analysis as set out above was performed in
step 700 to identify the presence or absence of neoplastic cells. -
Figure 8 shows large field-of-view (3.8 mm) sections of corresponding slices of H&E, Ki67, and nanoslide images (top to bottom); each slice is 4µm thick (>> Id for the nanoslide). These sections cover a range of different tissues types (e.g. lymph nodes, collagen, muscle tissue, ligament etc.) and also include regions of pre-invasive and neoplastic breast tissue. Using the ground truth pathology assessment and the comparative Ki67 staining the HSL values associated with cancer cells were identified for nanoslide. A total of 64 regions were examined across the cohort of 24 mice. In the bottom row offigure 8 the regions with HSL values consistent with neoplastic MMTV-PyMT breast cancer cells are shown in light blue (nanoslide) and bright green (Ki67). - Following established protocols tissue (as identified by the automated image analysis of the nanoslide images) was classified as True Positive (TP), True Negative (TN), False Positive (FP), and False Negative (FN) as compared to human analysis. In the human classification, pathology annotations, when a cancer containing region has been identified, high-resolution H&E stained slides were used to identify the stage of the cancer and the margins. A morphological assessment of the tissues was conducted by an expert human breast and murine mammary gland pathologist (O'Toole) and breast cancer researcher (Parker) and formed the 'ground truth' for the analysis. The second piece of information came from the image pixel HSL colour space values which were compared against the reference values from the training data (as set out for the nanoslide in
figure 6 ). Regions containing normal, hyperplasia, DCIS (ductal carcinoma in situ), and invasive neoplastic breast tissue were independently analysed for both nanoslide and Ki67 staining. Some example images of each type of region and resulting tissue classification are shown inFig. 9 . Classification was applied according to the following descriptions.Classification Description of classification method for Ki67 and Nanoslide True Positive (TP) TP was assigned when the HSL colour space values were consistent with cancer cells established by 'training' the segmentation algorithm. This 'training' was conducted based on the identification and correlation of cancerous tissue in Ki67 and nanoslide images by the expert pathologist with reference to the H&E slides (e.g. Shi et al, Scientific Reports, 2016). To be classified as TP also required that the identified region was within the area manually identified as containing cancer cells by the expert pathologists. True Negative (TN) TN was assigned when the HSL colour space values were consistent with one of the sub-types of non-cancerous tissues (e.g. adipose tissue, collagen, lymph nodes, blood vessels etc.). To be classified as TN also required that the identified region was outside of the area manually identified as containing cancerous tissue by the expert pathologists. False Positive (FP) FP was assigned when the HSL colour space values were consistent with cancer cells but the identified region was outside of the area manually identified as containing cancer cells by the expert pathologists. False Negative (FN) FN was assigned when the HSL colour space values were not consistent with either cancer cells or with non-cancerous tissue and when the identified region was within the area manually identified as containing cancer cells by the expert pathologists. -
Figure 9 illustrates high-resolution images taken across 24 MMTV-PyMT mice were sub-categorised (as set out under the heading "Pathology assessment" below) into four different stages (normal, hyperplasia, DCIS, and invasive) for both nanoslide (1st coloumn) and Ki67 (4th coloumn) based on annotations from the pathologist. The automated analysis based on HSL colour space values for each image were compared against ground truth annotations by a pathologist, the evaluation results are classified in terms of TP (green), FN (red), FP (yellow), and TN (blue) regions. The images (1st and 3rd columns) are presented as they appear under the microscope. Neoplastic cells in pre-invasive and invasive neoplastic tissues were easily distinguished from surrounding cells in the same tissue and benign tissues via a colorimetric differential interaction as a result of either staining (Ki67 - brown colour) or as a result of variations in the local dielectric constant (nanoslide - blue/purple colour). As seen, adipose and other types of non-cancerous tissue observed across the slides have a characteristically different colour (HSL) on both the nanoslide and Ki67, supporting this association. As can be seen the normal cells on the nanoslide appear to be almost uniformly categorised as TN. The invasive cells image on the nanoslide image was categorised as a large majority of TP regions surrounded by TN areas, showing accurate categorisation by the automated image analysis. The DCIS and Hyperplasia images include a region of majority TP towards the centre of the neoplastic regions surrounded by areas of mixed FN, TP, TN regions. - The methods disclosed herein utilise the differences in the spectral output between structures to identify those structures.
Figure 10A , illustrates the received colour spectrum of benign and neoplastic breast tissue, giving rise to colour contrast in nanoslide images. On the basis of the 24 MMTV-PyMT mice studies the spectral output of cancer cells appears to be distinct from other types of non-cancerous tissue providing a novel mechanism for performing digital pathology. To further validate the results against published standards the inventors used an established scoring matrix for discriminating 'normal', hyperplasia, DCIS and invasive lesions. As revealed in results presented inFig. 10b , both approaches (nanoslide and Ki67) identify a similar percentage of neoplastic cells in a randomised preclinical study. DCIS comprises lesions which are heterogeneous with highly variable morphology; whereas at the extremes of normal and invasive, breast cancer is easy to discern, DCIS is subtle and consequently suffers from misdiagnosis based on H&E alone particularly at large fields-of-view. -
Fig. 10b shows how the automated method described herein using a nanoslide sample holder discriminates between structures in a sample. In this case it has been shown that 'healthy' and invasive cancer tissue can be identified based in the hue (H,°) and luminosity (L, %) of the images. Note that the 'healthy' tissue sections are taken from MMTV-PyMT mice, 90% of which will eventually develop pre-invasive and invasive neoplasms, hence a small amount of overlap may be expected when comparing to invasive cancer regions. The difference between normal and cancer mammary tissue is further validated by the clear discrimination between normal/benign tissue in wildtype animals and neoplastic tissue. - To test the concordance of Ki67 and nanoslide we compared the percentage (by area) of tissue identified by the two pathologists as containing neoplastic cells according to the image pixel HSL colour space values; the results are summarised in
Figure 10c . For the regions examined (N=30) nanoslide and Ki67 exhibit highly positively correlated performance metrics. The Pearson correlation coefficient, r, and corresponding p-value for the Ki67 and nanoslide results confirm a positive correlation: r(28)= .62, p<.001. Of the cancer bearing tissues examined none had both non-zero Ki67 positivity and zero nanoslide positivity and only two had non-zero nanoslide positivity but zero Ki67 positivity.Figure 10 d, shows pathology scoring of Ki67 and nanoslide images for data collected from 24 mice, the percentage of cells identified as cancerous is indicative of the tumour stage. The positive correlation between Ki67 and nanoslide supports the breast cancer pathologists manual scoring (Fig. 10d ) and concurs withFigure 10e , that shows the Sorensen-Dice coefficient (DSC) coefficients for nanoslide and Ki67 for three different classes of neoplastic region. The DSC is defined as:
- Calculated for both nanoslide and Ki67 (
Fig. 10e ) based on the analysis of 64 high-resolution (200 × magnification) images from both Ki67 and nanoslide data. -
Figure 11 shows an example implementation of an embodiment of the present invention used to detect a structure in human cells. In this case, the structures are cancerous cells.Figure 11a shows the image illustrating DCIS in breast tissue imaged with CCM, whereas 11b shows the image illustrating DCIS in breast tissue imaged with IHC staining. In each image the right hand panel shows a segmented image that identifies portions of each captured image having a colour within 15% of the mean colour of cancer for the sample (seeFigure 6 for the CCM colour range, and table 1). As can be easily observed significant numbers of differentiated cells can be observed in the CCM image. This compares favourably in to IHC staining based on proliferative markers (Figure 18b) which positively identifies few cancer cells. The human tissue sample was imaged on a nanoslide (Figure 11a left) and by Ki67 IHC staining (Figure 11b left). The images were processed using the automated image processing method described herein, in the same way as the mouse samples in the previous example.Figure 11a right illustrates the segmented nanoslide image, illustrating those portions of the image determined to represent the structure of interest, namely breast cancer cells. InFigure 11b (right panel) each each blue "blob" represents a pixel cluster determined by the image processing to represent a cancer cell imaged on the Ki67 stained slide. - In the example to confirm the timing of spontaneous development of mammary gland tumours in the C57 BI/6 MMTV-PyMT model, mammary glands of C57 BI/6 MMTV-PyMT mice at different stages were taken and morphologically evaluated by H&E and Ki67 by an expert human breast and murine mammary gland pathologist (O'Toole) and breast cancer researcher (Parker). Nanoslide samples were randomized and independently scored and then compared post-analysis to the results of Ki67 and nanoslide. The benchmark for the pathology assessment was a trained pathologist analyzing the H&E stained tissue sections at high-resolution and without any time constraints. As this was a control study the cancer stage for the mice was already known by the pathologist. In addition, the pathologist could refer back to the IHC staining to confirm that no neoplastic tissue regions were missed during the assessment. When looking at a tumor region or duct containing cancer at high resolution the pathologist counts the number of cancer cells.
- Once this has been done for all samples the pathologist then compared the number of individual positive cells (as determined by a colour change - 'brown' for Ki67 and 'green' for nanoslide) using either Ki67 or nanoslide and divided this number by the total number of cancer cells identified from pathological assessment of the H&E images to arrive at the final figure for "percentage positive cells". This analysis was conducted on 24 cancer containing regions across the 24 mice used in this study. Based on the knowledge of the cancer stage the results could be classified into 4 stages: 'normal', 'hyperplasia', 'DCIS', and 'invasive'. The mean value of the percentage of positive cancer cells as determined by the pathologist was calculated within each category, it is this mean value, averaged between the two independent sets of scores, which is represented by the height of the bars in the bar chart. The range (e.g. minimum and maximum percentages) over the different samples used to generate the error bars shown in
Fig. 10d . The scoring matrix for discriminating normal, DCIS, and invasive lesions is shown in the following table.Normal DCIS Invasive Appearance of lumen Empty Lumen Filled Lumen No Lumen Epithelial Ki67 positivity (95% confidence interval) 0-28% 44-66% 48-96%
Claims (14)
- A method of imaging a sample and automatically identifying the presence of a structure in the sample, characterized by:providing a sample holder (104) having a plasmonic layer (402) including a periodic array of sub-micron structures;placing the sample on the sample holder (104) adjacent the plasmonic layer (402);illuminating the sample and sample holder (104) and capturing at least one colour digital image thereof with an optical microscope, the illumination stimulating surface plasmon resonance and the sample positioned at least partially within the associated evanescent sensing field, the at least one digital image comprising a plurality of pixels which represent a two dimensional region of the sample, wherein at least one localised structural property of the sample is visible in the image based on the colour of received light captured in the at least one digital image;processing the at least one digital image, based on the received colour information to selectively identify said structure on the basis of colour differentiation (224) and/or morphology differentiation (226).
- The method of claim, 1 wherein processing the at least one image includes providing an output indicating the identification of the structure.
- The method of claim 1 or claim 2, including filtering the image to selectively process a portion of the image on the basis of colour information contained in the received image.
- The method of any one of the preceding claims, wherein the at least one image includes a plurality of pixels, and said method includes segmenting the at least one image based on a colour of received light captured in the image.
- The method of claim 4, wherein segmenting the at least one image includes one or more of:identifying one or more subsets of pixels within an image based at least partly on colour;grouping pixels into features representing a structure on the sample based on correlation between a pixel and at least one neighbouring pixel.
- The method of any one of the preceding claims, including any one or more of: determining a colour distribution of the received image; determining a colour histogram of the received image; performing spectral analysis of at least part of the received digital image.
- The method of any one of the preceding claims, including performing a feature extraction method to identify one or more structures in the image.
- The method of any one of the preceding claims, including processing the digital image with an image recognition system.
- The method of claim 8, wherein the image recognition system is an artificial neural network.
- The method of any one of the preceding claims, wherein in the received digital image, the localised structural property of the sample is a localised refractive index.
- The method of claim 10, wherein a structure in the sample with a given refractive index appears as a corresponding colour or colour range in the image.
- The method of any one of the preceding claims, wherein receiving at least one digital image of a sample, includes receiving more than one image of the sample captured with any one or more of the following differences:different illumination spectrum;different illumination polarisation;different magnification.
- A computer readable medium storing thereon instructions which, when executed by a system comprising a data processing system cause the system to perform a method as claimed in any one of claims 1 to 12.
- A system comprising a data processing system, said system being adapted to perform a method as claimed in any one of claims 1 to 12.
Applications Claiming Priority (2)
| Application Number | Priority Date | Filing Date | Title |
|---|---|---|---|
| AU2018904551A AU2018904551A0 (en) | 2018-11-29 | Automated method of identifying a structure | |
| PCT/IB2019/060310 WO2020110072A1 (en) | 2018-11-29 | 2019-11-29 | Automated method of identifying a structure |
Publications (3)
| Publication Number | Publication Date |
|---|---|
| EP3887799A1 EP3887799A1 (en) | 2021-10-06 |
| EP3887799A4 EP3887799A4 (en) | 2022-09-07 |
| EP3887799B1 true EP3887799B1 (en) | 2024-04-24 |
Family
ID=70852264
Family Applications (1)
| Application Number | Title | Priority Date | Filing Date |
|---|---|---|---|
| EP19890518.4A Active EP3887799B1 (en) | 2018-11-29 | 2019-11-29 | Automated method of identifying a structure |
Country Status (8)
| Country | Link |
|---|---|
| US (2) | US12315201B2 (en) |
| EP (1) | EP3887799B1 (en) |
| JP (1) | JP7538797B2 (en) |
| CN (1) | CN113454439B (en) |
| AU (1) | AU2019390733B9 (en) |
| CA (1) | CA3121425A1 (en) |
| SG (1) | SG11202105294PA (en) |
| WO (1) | WO2020110072A1 (en) |
Families Citing this family (4)
| Publication number | Priority date | Publication date | Assignee | Title |
|---|---|---|---|---|
| SG11202105294PA (en) | 2018-11-29 | 2021-06-29 | Univ La Trobe | Automated method of identifying a structure |
| AU2019389304B2 (en) | 2018-11-29 | 2025-07-31 | La Trobe University | Method of identifying a structure |
| CA3121423A1 (en) | 2018-11-29 | 2020-06-04 | La Trobe University | Method of identifying a structure |
| AU2019387397B2 (en) * | 2018-11-29 | 2024-11-28 | La Trobe University | Microscopy method and system |
Family Cites Families (120)
| Publication number | Priority date | Publication date | Assignee | Title |
|---|---|---|---|---|
| US5016173A (en) * | 1989-04-13 | 1991-05-14 | Vanguard Imaging Ltd. | Apparatus and method for monitoring visually accessible surfaces of the body |
| US5241468A (en) * | 1989-04-13 | 1993-08-31 | Vanguard Imaging Ltd. | Apparatus and method for spectral enhancement of body-surface images to improve sensitivity of detecting subtle color features |
| DE69627183T2 (en) * | 1995-11-30 | 2004-01-29 | Chromavision Med Sys Inc | PROCESS FOR THE AUTOMATIC IMAGE ANALYSIS OF BIOLOGICAL SAMPLES |
| US6650357B1 (en) | 1997-04-09 | 2003-11-18 | Richardson Technologies, Inc. | Color translating UV microscope |
| AU6521700A (en) | 1999-08-04 | 2001-03-05 | Chromavision Medical Systems, Inc. | Method and apparatus for applying color thresholds in light microscopy |
| US6285020B1 (en) | 1999-11-05 | 2001-09-04 | Nec Research Institute, Inc. | Enhanced optical transmission apparatus with improved inter-surface coupling |
| US20020115224A1 (en) | 2001-02-16 | 2002-08-22 | Ulrich Rudel | Method for the preparation of optical (bio)chemical sensor devices |
| JP2005507489A (en) * | 2001-02-23 | 2005-03-17 | ジェニコン サイエンスィズ コーポレーション | How to provide extended dynamic range in sample analysis |
| US20080099667A1 (en) * | 2001-08-14 | 2008-05-01 | President And Fellows Of Harvard College | Methods and apparatus for sensing a physical substance |
| CA2459320C (en) | 2001-09-06 | 2016-07-05 | Genomic Profiling Systems, Inc. | Rapid detection of replicating cells |
| US7122384B2 (en) * | 2002-11-06 | 2006-10-17 | E. I. Du Pont De Nemours And Company | Resonant light scattering microparticle methods |
| US7460224B2 (en) | 2005-12-19 | 2008-12-02 | Opto Trace Technologies, Inc. | Arrays of nano structures for surface-enhanced Raman scattering |
| DE10329195A1 (en) | 2003-06-28 | 2005-01-13 | Carl Zeiss Jena Gmbh | Slide for fluorescence-based analytical apparatus employing bio-specific sensor chips, comprises a dielectric substrate with a layer containing metallic particles on the surface |
| KR20060130543A (en) | 2003-08-06 | 2006-12-19 | 유니버시티 오브 피츠버그 오브 더 커먼웰쓰 시스템 오브 하이어 에듀케이션 | Surface Plasmon-Reinforced Nano-Optical Devices and Methods for Manufacturing the Same |
| US20050136549A1 (en) * | 2003-10-30 | 2005-06-23 | Bioimagene, Inc. | Method and system for automatically determining diagnostic saliency of digital images |
| US8298780B2 (en) | 2003-09-22 | 2012-10-30 | X-Body, Inc. | Methods of detection of changes in cells |
| MXPA06013440A (en) | 2004-05-19 | 2007-06-12 | Vp Holding Llc | Optical sensor with layered plasmon structure for enhanced detection of chemical groups by sers. |
| FR2872910B1 (en) | 2004-07-07 | 2006-10-13 | Nanoraptor Sa | OPTICAL COMPONENT FOR OBSERVING A NANOMETRIC SAMPLE, SYSTEM COMPRISING SUCH A COMPONENT, ANALYSIS METHOD USING THE SAME, AND APPLICATIONS THEREOF |
| US8039368B2 (en) | 2005-03-21 | 2011-10-18 | The Trustees Of The University Of Pennsylvania | Nanogaps: methods and devices containing same |
| JP4838626B2 (en) | 2005-04-28 | 2011-12-14 | キヤノン株式会社 | Substrate for target substance detection element used in apparatus for detecting target substance using plasmon resonance, detection element and detection apparatus using the same |
| US20160355869A1 (en) | 2005-08-02 | 2016-12-08 | University Of Utah Research Foundation | Biosensors including metallic nanocavities |
| WO2007041340A2 (en) | 2005-09-30 | 2007-04-12 | The Trustees Of Columbia University In The City Of New York | Microfluidic cells with parallel arrays of individual dna molecules |
| US8094314B2 (en) | 2005-10-21 | 2012-01-10 | The Regents Of The University Of California | Optical sensing based on surface plasmon resonances in nanostructures |
| JP2007192806A (en) | 2005-12-22 | 2007-08-02 | Canon Inc | Target substance detection element substrate, target substance detection element, target substance detection apparatus and method using the same, and kit for the same |
| US8154722B2 (en) | 2006-03-03 | 2012-04-10 | Canon Kabushiki Kaisha | Sensor element structure, sensor element array, and manufacturing method of sensor element array |
| US7943908B2 (en) * | 2007-01-22 | 2011-05-17 | University Of Maryland | Sensor system with surface-plasmon-polariton (SPP) enhanced selective fluorescence excitation and method |
| KR100905241B1 (en) | 2007-04-13 | 2009-07-01 | 엘지전자 주식회사 | Optical film including a plurality of structures and a backlight unit comprising the same |
| US8027039B2 (en) | 2007-04-16 | 2011-09-27 | University Of Maryland, Baltimore | Subwavelength resolution optical microscopy |
| JP2008275526A (en) * | 2007-05-02 | 2008-11-13 | Sony Corp | Sensor chip for surface plasmon resonance measurement, surface plasmon resonance measurement device, and measurement method thereof |
| US8559693B2 (en) * | 2007-10-11 | 2013-10-15 | British Columbia Cancer Agency Branch | Systems and methods for automated characterization of genetic heterogeneity in tissue samples |
| CN101952697B (en) | 2007-11-02 | 2014-08-13 | 加利福尼亚大学董事会 | Real-time single-step bioassays using nanoplasmon resonators with ultrahigh sensitivity |
| WO2009061843A2 (en) | 2007-11-07 | 2009-05-14 | Massachusetts Institute Of Technology | Induced-charge electrokinetics with high-slip polarizable surfaces |
| US8116551B2 (en) * | 2007-12-04 | 2012-02-14 | University College, Dublin, National University of Ireland | Method and system for image analysis |
| CN101470219B (en) | 2007-12-27 | 2010-09-01 | 上海科学院 | Nano lens and scanning microscope using the same |
| RU2440603C1 (en) * | 2008-01-07 | 2012-01-20 | Майскин, Инк. | System and method for analysing light-material interaction based on spectral convolution |
| AU2009204227B2 (en) * | 2008-01-07 | 2012-03-08 | Myskin, Inc. | System and method for analysis of light-matter interaction based on spectral convolution |
| JP5175584B2 (en) | 2008-03-13 | 2013-04-03 | 地方独立行政法人 東京都立産業技術研究センター | Local surface plasmon resonance imaging system |
| JP5010511B2 (en) | 2008-03-18 | 2012-08-29 | 株式会社リコー | Polarization control element, polarization control device |
| JP4995231B2 (en) | 2008-05-30 | 2012-08-08 | キヤノン株式会社 | Optical filter |
| JP5195112B2 (en) | 2008-07-18 | 2013-05-08 | 株式会社リコー | Refractive index sensor, refractive index sensor array and biosensor |
| JP5621983B2 (en) | 2008-09-01 | 2014-11-12 | 日立化成株式会社 | SPR sensor |
| US20100291575A1 (en) * | 2009-05-15 | 2010-11-18 | Sru Biosystems, Inc. | Detection of Changes in Cell Populations and Mixed Cell Populations |
| JP5452140B2 (en) | 2009-09-03 | 2014-03-26 | 日本航空電子工業株式会社 | Surface plasmon resonance element for hydrogen detection, surface plasmon resonance optical hydrogen detector, and method for optically detecting hydrogen using surface plasmon resonance |
| JP2013509618A (en) | 2009-10-28 | 2013-03-14 | アレンティック マイクロサイエンス インコーポレイテッド | Microscopic imaging |
| WO2011106057A2 (en) | 2009-12-04 | 2011-09-01 | Trustees Of Boston University | Nanostructure biosensors and systems and methods of use thereof |
| BR112012033200A2 (en) * | 2010-06-25 | 2016-12-06 | Cellmark Theranostics Llc | method for analyzing biological specimens by spectral imaging |
| WO2012033957A2 (en) | 2010-09-09 | 2012-03-15 | California Institute Of Technology | Delayed emission detection devices and methods |
| DE102010063965A1 (en) * | 2010-12-22 | 2012-06-28 | Fraunhofer-Gesellschaft zur Förderung der angewandten Forschung e.V. | Apparatus and method for determining objects of a color photograph |
| KR101211092B1 (en) | 2010-12-28 | 2012-12-12 | 한국과학기술연구원 | Bio channel system |
| JP2012159792A (en) | 2011-02-02 | 2012-08-23 | Ricoh Co Ltd | Wavelength selective element |
| US9304234B2 (en) | 2011-03-10 | 2016-04-05 | The Regents Of The University Of California | Plasmonic dark field and fluorescence microscopy |
| FR2973917B1 (en) | 2011-04-08 | 2014-01-10 | Hologram Ind | OPTICAL SECURITY COMPONENT WITH TRANSMISSIVE EFFECT, MANUFACTURE OF SUCH A COMPONENT AND SECURE DOCUMENT EQUIPPED WITH SUCH A COMPONENT |
| US20230266291A1 (en) | 2011-06-17 | 2023-08-24 | James J. Myrick | Sensors and sensing methods |
| CN103018167A (en) | 2011-09-23 | 2013-04-03 | 中国科学院微电子研究所 | Surface plasmon resonance sample stage and preparation method thereof |
| US9285314B2 (en) * | 2011-10-12 | 2016-03-15 | Brown University | Systems and methods enabling high-throughput, real time detection of analytes |
| WO2013089996A1 (en) | 2011-12-13 | 2013-06-20 | Konica Minolta Laboratory U.S.A., Inc. | Nanohole sensor chip with reference sections |
| JP2013142546A (en) | 2012-01-06 | 2013-07-22 | Panasonic Corp | Method of measuring density of biogenic substances and measuring device |
| CN104380084A (en) | 2012-04-10 | 2015-02-25 | 普林斯顿大学理事会 | Ultra-sensitive sensor |
| EP2653903A1 (en) * | 2012-04-20 | 2013-10-23 | FOM Institute for Atomic and Molecular Physics | Plasmonic microscopy |
| JP2013231682A (en) | 2012-05-01 | 2013-11-14 | Seiko Epson Corp | Optical device and detection apparatus |
| US8687180B2 (en) | 2012-06-07 | 2014-04-01 | Molecular Devices, Llc | System, method, and device for determining a focal position of an objective in a microscopy imaging system |
| DE102012214932B4 (en) | 2012-08-22 | 2023-08-24 | Carl Zeiss Microscopy Gmbh | Test sample apparatus and test method for a sub-wavelength optical microscope |
| CN113406077A (en) | 2012-10-03 | 2021-09-17 | 皇家飞利浦有限公司 | Combined sample inspection |
| TWI497056B (en) | 2012-11-14 | 2015-08-21 | Nat Univ Tsing Hua | An imaging metamaterial |
| US8976359B2 (en) | 2012-12-15 | 2015-03-10 | Board Of Trustees Of The University Of Alabama, For And On Behalf Of The University Of Alabama In Huntsville | Nanostructure diffraction gratings for integrated spectroscopy and sensing |
| US9464985B2 (en) | 2013-01-16 | 2016-10-11 | The Board Of Trustees Of The University Of Illinois | Plasmon resonance imaging apparatus having nano-lycurgus-cup arrays and methods of use |
| US9675288B2 (en) | 2013-01-29 | 2017-06-13 | Hewlett-Packard Development Company, L.P. | Apparatus having surface-enhanced spectroscopy elements on an exterior surface |
| EP2971110A2 (en) * | 2013-03-15 | 2016-01-20 | Metamark Genetics, Inc. | Compositions and methods for cancer prognosis |
| CN103106645B (en) * | 2013-03-15 | 2015-08-12 | 天津工业大学 | A method for identifying the weave structure of woven fabrics |
| GB201305171D0 (en) * | 2013-03-21 | 2013-05-01 | Univ Nottingham | Measurement of tissue structures |
| JP2015012128A (en) | 2013-06-28 | 2015-01-19 | ソニー株式会社 | Imaging apparatus and electronic apparatus |
| US10247662B2 (en) | 2013-07-09 | 2019-04-02 | Halliburton Energy Services, Inc. | Integrated computational elements with frequency selective surface |
| JP2016212126A (en) | 2013-10-18 | 2016-12-15 | シャープ株式会社 | Photoelectric conversion device |
| AU2014346305B2 (en) | 2013-11-08 | 2019-08-15 | Bank Of Canada | Optically variable devices, their production and use |
| US10557847B2 (en) * | 2013-12-02 | 2020-02-11 | The General Hospital Corporation | Nano-plasmonic sensor for exosome detection |
| EP3121587A1 (en) | 2014-03-21 | 2017-01-25 | Universidad De Cantabria | Device and method for detecting biomarkers |
| EP3943915A3 (en) * | 2014-05-12 | 2022-05-25 | Cellomics, Inc | Automated imaging of chromophore labeled samples |
| WO2015199976A1 (en) | 2014-06-24 | 2015-12-30 | The United States Of America, As Represented By The Secretary, Department Of Health & Human Services | Target activated microdissection |
| AU2015331579A1 (en) * | 2014-10-17 | 2017-05-25 | Cireca Theranostics, Llc | Methods and systems for classifying biological samples, including optimization of analyses and use of correlation |
| US11111396B2 (en) | 2014-10-17 | 2021-09-07 | C3 Nano, Inc. | Transparent films with control of light hue using nanoscale colorants |
| WO2016148951A1 (en) | 2015-03-13 | 2016-09-22 | Plasmonix, Inc. | Microarray slides that enhance fluorescent signals via plasmonic interaction |
| KR101704584B1 (en) | 2015-04-16 | 2017-02-22 | 포항공과대학교 산학협력단 | Microscopic apparatus for super-resolution imaging organisms or biomatter and method for super-resolution imaging organisms or biomatter using the same |
| US9836839B2 (en) * | 2015-05-28 | 2017-12-05 | Tokitae Llc | Image analysis systems and related methods |
| US9835870B2 (en) | 2015-06-05 | 2017-12-05 | Vasily N. Astratov | Super-resolution microscopy methods and systems enhanced by dielectric microspheres or microcylinders used in combination with metallic nanostructures |
| ES2862905T3 (en) | 2015-06-19 | 2021-10-08 | Us Gov Sec Navy | Determination of the extracellular concentration of analytes with nanoplasmonic sensors |
| US10161797B2 (en) * | 2015-07-05 | 2018-12-25 | Purdue Research Foundation | Sub-millimeter real-time circular dichroism spectrometer with metasurfaces |
| WO2017010411A1 (en) | 2015-07-13 | 2017-01-19 | 国立研究開発法人理化学研究所 | Structure for use in infrared spectroscopy and infrared spectroscopy method using same |
| RU2718427C2 (en) | 2015-07-16 | 2020-04-02 | Конинклейке Филипс Н.В. | Digital pathology system |
| US10867443B2 (en) | 2015-07-16 | 2020-12-15 | Koninklijke Philips N.V. | Information transformation in digital pathology |
| GB2543030A (en) * | 2015-09-23 | 2017-04-12 | Pathxl Ltd | Pattern driven image processing method & apparatus for tissue recognition |
| US9964494B1 (en) | 2015-09-28 | 2018-05-08 | U.S. Department Of Energy | Thermally emissive sensing materials for chemical spectroscopy analysis |
| RU2734097C2 (en) | 2015-12-23 | 2020-10-12 | Конинклейке Филипс Н.В. | Calibration slide for digital pathology |
| WO2017135430A1 (en) | 2016-02-03 | 2017-08-10 | 国立大学法人大阪大学 | Plasmonic structure, color generation structure, and recording medium |
| WO2017161097A1 (en) | 2016-03-16 | 2017-09-21 | Ohio State Innovation Foundation | System and method for the discrimination of tissues using a fast infrared cancer probe |
| CN105700262B (en) | 2016-04-13 | 2019-04-30 | 深圳市华星光电技术有限公司 | Liquid crystal display device and preparation method thereof |
| CN205691505U (en) | 2016-05-17 | 2016-11-16 | 南京信息工程大学 | Nanometer annular chamber SERS substrate based on surface phasmon effect |
| CN109564617B (en) | 2016-06-13 | 2023-09-26 | 纳诺利弗股份有限公司 | Methods for characterizing and imaging microscopic objects |
| US10768105B1 (en) | 2016-07-29 | 2020-09-08 | Labrador Diagnostics Llc | Image analysis and measurement of biological samples |
| JP6794727B2 (en) * | 2016-09-06 | 2020-12-02 | コニカミノルタ株式会社 | Structural color change type material and strain detector |
| AU2017374052B2 (en) | 2016-12-08 | 2022-10-27 | Drinksavvy, Inc. | Surface plasmon resonance sensor comprising metal coated nanostructures and a molecularly imprinted polymer layer |
| CN106896489B (en) | 2017-02-13 | 2019-11-22 | 清华大学 | Frequency Domain Collage Microscopy System and Its Method Based on Wavelength Multiplexing |
| TWI756365B (en) * | 2017-02-15 | 2022-03-01 | 美商脫其泰有限責任公司 | Image analysis systems and related methods |
| WO2018204712A1 (en) | 2017-05-04 | 2018-11-08 | The Regents Of The University Of California | Waveguide-based side-illumination technique for muse microscopy and associated histology cassettes |
| JP7189621B2 (en) | 2017-05-22 | 2022-12-14 | ラ トローブ ユニバーシティ | Image contrast enhancement for optical microscopy |
| DE102017113683A1 (en) | 2017-06-21 | 2018-12-27 | Carl Zeiss Microscopy Gmbh | High-resolution scanning microscopy with the distinction of at least two wavelength ranges |
| US11236426B2 (en) * | 2017-09-06 | 2022-02-01 | Wisconsin Alumni Research Foundation | Plasmonic diamond films and related methods |
| WO2019067557A1 (en) | 2017-09-26 | 2019-04-04 | Visiongate, Inc. | Morphometric genotyping of cells in liquid biopsy using optical tomography |
| EP3707537A4 (en) | 2017-11-06 | 2021-08-11 | Xfold Imaging Oy | A field-enhancing device |
| US11351760B2 (en) | 2017-11-27 | 2022-06-07 | Washington University | Plasmonic patch as a universal fluorescence enhancer |
| WO2019126543A1 (en) | 2017-12-20 | 2019-06-27 | The Regents Of The University Of Michigan | Plasmonic lithography for patterning high aspect-ratio nanostructures |
| US11099136B2 (en) | 2017-12-22 | 2021-08-24 | Regents Of The University Of Minnesota | 3D graphene optical sensors and methods of manufacture |
| AU2019387397B2 (en) | 2018-11-29 | 2024-11-28 | La Trobe University | Microscopy method and system |
| SG11202105294PA (en) | 2018-11-29 | 2021-06-29 | Univ La Trobe | Automated method of identifying a structure |
| CA3121423A1 (en) * | 2018-11-29 | 2020-06-04 | La Trobe University | Method of identifying a structure |
| AU2019389304B2 (en) | 2018-11-29 | 2025-07-31 | La Trobe University | Method of identifying a structure |
| US10859436B2 (en) | 2019-02-19 | 2020-12-08 | Renesas Electronics America Inc. | Spectrometer on a chip |
| US11733507B2 (en) | 2019-02-19 | 2023-08-22 | Purdue Research Foundation | Optical device, method of using the same, and method of making the same |
| KR20240035622A (en) | 2019-03-08 | 2024-03-15 | 알심 에너지, 인크. | Aqueous aluminum ion batteries, hybrid battery-capacitors, compositions of said batteries and battery-capacitors, and associated methods of manufacture and use |
| CN113874524A (en) | 2019-04-30 | 2021-12-31 | 根特罗玛有限公司 | Graphene nanopore device for nucleic acid sequencing |
| US20220381984A1 (en) | 2021-05-31 | 2022-12-01 | Jinan University | Fiber optic sensing apparatus and system |
-
2019
- 2019-11-29 SG SG11202105294PA patent/SG11202105294PA/en unknown
- 2019-11-29 CA CA3121425A patent/CA3121425A1/en active Pending
- 2019-11-29 CN CN201980090293.8A patent/CN113454439B/en active Active
- 2019-11-29 JP JP2021530112A patent/JP7538797B2/en active Active
- 2019-11-29 WO PCT/IB2019/060310 patent/WO2020110072A1/en not_active Ceased
- 2019-11-29 EP EP19890518.4A patent/EP3887799B1/en active Active
- 2019-11-29 AU AU2019390733A patent/AU2019390733B9/en active Active
- 2019-11-29 US US17/297,980 patent/US12315201B2/en active Active
-
2025
- 2025-05-23 US US19/217,556 patent/US20250285334A1/en active Pending
Also Published As
| Publication number | Publication date |
|---|---|
| WO2020110072A1 (en) | 2020-06-04 |
| US20250285334A1 (en) | 2025-09-11 |
| SG11202105294PA (en) | 2021-06-29 |
| CN113454439B (en) | 2025-03-07 |
| AU2019390733A1 (en) | 2021-06-10 |
| JP7538797B2 (en) | 2024-08-22 |
| JP2022510203A (en) | 2022-01-26 |
| EP3887799A1 (en) | 2021-10-06 |
| CN113454439A (en) | 2021-09-28 |
| US20220092824A1 (en) | 2022-03-24 |
| US12315201B2 (en) | 2025-05-27 |
| AU2019390733B9 (en) | 2025-07-24 |
| EP3887799A4 (en) | 2022-09-07 |
| CA3121425A1 (en) | 2020-06-04 |
| AU2019390733B2 (en) | 2025-07-10 |
Similar Documents
| Publication | Publication Date | Title |
|---|---|---|
| US20250285334A1 (en) | Automated method of identifying a structure | |
| US12530912B2 (en) | Image analysis method, apparatus, program, and learned deep learning algorithm | |
| Diamond et al. | The use of morphological characteristics and texture analysis in the identification of tissue composition in prostatic neoplasia | |
| JP7076698B2 (en) | Image analysis method, image analysis device, program, learned deep learning algorithm manufacturing method and learned deep learning algorithm | |
| US5848177A (en) | Method and system for detection of biological materials using fractal dimensions | |
| US7826650B2 (en) | Method for quantitative video-microscopy and associated system and computer software program product | |
| US5625705A (en) | Intensity texture based classification system and method | |
| US12608793B2 (en) | Method of identifying a structure | |
| EP3053138B1 (en) | Systems and methods for adaptive histopathology image unmixing | |
| US8611620B2 (en) | Advanced digital pathology and provisions for remote diagnostics | |
| Pilling et al. | Infrared spectral histopathology using haematoxylin and eosin (H&E) stained glass slides: a major step forward towards clinical translation | |
| Wang et al. | Assisted diagnosis of cervical intraepithelial neoplasia (CIN) | |
| CN105027165A (en) | Tissue object-based machine learning system for automated scoring of digital whole slides | |
| US20150213601A1 (en) | Method of Reconstituting Cellular Spectra Useful for Detecting Cellular Disorders | |
| KR20170128577A (en) | Tissue sample analysis technology | |
| JP2007516428A (en) | A system for determining the staining quality of slides using a scatter plot distribution | |
| EP0595506A2 (en) | Automated detection of cancerous or precancerous tissue by measuring malignancy associated changes | |
| HK40062106A (en) | Automated method of identifying a structure | |
| Das et al. | A texture based approach for automatic identification of benign and malignant tumor from FNAC images | |
| CN122049472A (en) | Lymphocyte image recognition method, system, terminal and storage medium based on multi-scale convolutional neural network | |
| HK40062105A (en) | Method of identifying a structure |
Legal Events
| Date | Code | Title | Description |
|---|---|---|---|
| STAA | Information on the status of an ep patent application or granted ep patent |
Free format text: STATUS: THE INTERNATIONAL PUBLICATION HAS BEEN MADE |
|
| PUAI | Public reference made under article 153(3) epc to a published international application that has entered the european phase |
Free format text: ORIGINAL CODE: 0009012 |
|
| STAA | Information on the status of an ep patent application or granted ep patent |
Free format text: STATUS: REQUEST FOR EXAMINATION WAS MADE |
|
| 17P | Request for examination filed |
Effective date: 20210624 |
|
| AK | Designated contracting states |
Kind code of ref document: A1 Designated state(s): AL AT BE BG CH CY CZ DE DK EE ES FI FR GB GR HR HU IE IS IT LI LT LU LV MC MK MT NL NO PL PT RO RS SE SI SK SM TR |
|
| DAV | Request for validation of the european patent (deleted) | ||
| DAX | Request for extension of the european patent (deleted) | ||
| A4 | Supplementary search report drawn up and despatched |
Effective date: 20220804 |
|
| RIC1 | Information provided on ipc code assigned before grant |
Ipc: G06N 3/02 20060101ALI20220729BHEP Ipc: G06T 7/00 20170101ALI20220729BHEP Ipc: G01N 33/48 20060101ALI20220729BHEP Ipc: G01N 21/62 20060101ALI20220729BHEP Ipc: G01N 21/59 20060101ALI20220729BHEP Ipc: G01N 21/25 20060101AFI20220729BHEP |
|
| GRAP | Despatch of communication of intention to grant a patent |
Free format text: ORIGINAL CODE: EPIDOSNIGR1 |
|
| STAA | Information on the status of an ep patent application or granted ep patent |
Free format text: STATUS: GRANT OF PATENT IS INTENDED |
|
| INTG | Intention to grant announced |
Effective date: 20230523 |
|
| GRAJ | Information related to disapproval of communication of intention to grant by the applicant or resumption of examination proceedings by the epo deleted |
Free format text: ORIGINAL CODE: EPIDOSDIGR1 |
|
| STAA | Information on the status of an ep patent application or granted ep patent |
Free format text: STATUS: REQUEST FOR EXAMINATION WAS MADE |
|
| INTC | Intention to grant announced (deleted) | ||
| GRAP | Despatch of communication of intention to grant a patent |
Free format text: ORIGINAL CODE: EPIDOSNIGR1 |
|
| STAA | Information on the status of an ep patent application or granted ep patent |
Free format text: STATUS: GRANT OF PATENT IS INTENDED |
|
| INTG | Intention to grant announced |
Effective date: 20231222 |
|
| GRAS | Grant fee paid |
Free format text: ORIGINAL CODE: EPIDOSNIGR3 |
|
| GRAA | (expected) grant |
Free format text: ORIGINAL CODE: 0009210 |
|
| STAA | Information on the status of an ep patent application or granted ep patent |
Free format text: STATUS: THE PATENT HAS BEEN GRANTED |
|
| AK | Designated contracting states |
Kind code of ref document: B1 Designated state(s): AL AT BE BG CH CY CZ DE DK EE ES FI FR GB GR HR HU IE IS IT LI LT LU LV MC MK MT NL NO PL PT RO RS SE SI SK SM TR |
|
| REG | Reference to a national code |
Ref country code: GB Ref legal event code: FG4D |
|
| REG | Reference to a national code |
Ref country code: CH Ref legal event code: EP |
|
| REG | Reference to a national code |
Ref country code: DE Ref legal event code: R096 Ref document number: 602019051101 Country of ref document: DE |
|
| REG | Reference to a national code |
Ref country code: IE Ref legal event code: FG4D |
|
| REG | Reference to a national code |
Ref country code: SE Ref legal event code: TRGR |
|
| REG | Reference to a national code |
Ref country code: NL Ref legal event code: FP |
|
| REG | Reference to a national code |
Ref country code: LT Ref legal event code: MG9D |
|
| REG | Reference to a national code |
Ref country code: AT Ref legal event code: MK05 Ref document number: 1680081 Country of ref document: AT Kind code of ref document: T Effective date: 20240424 |
|
| PG25 | Lapsed in a contracting state [announced via postgrant information from national office to epo] |
Ref country code: IS Free format text: LAPSE BECAUSE OF FAILURE TO SUBMIT A TRANSLATION OF THE DESCRIPTION OR TO PAY THE FEE WITHIN THE PRESCRIBED TIME-LIMIT Effective date: 20240824 |
|
| PG25 | Lapsed in a contracting state [announced via postgrant information from national office to epo] |
Ref country code: BG Free format text: LAPSE BECAUSE OF FAILURE TO SUBMIT A TRANSLATION OF THE DESCRIPTION OR TO PAY THE FEE WITHIN THE PRESCRIBED TIME-LIMIT Effective date: 20240424 |
|
| PG25 | Lapsed in a contracting state [announced via postgrant information from national office to epo] |
Ref country code: HR Free format text: LAPSE BECAUSE OF FAILURE TO SUBMIT A TRANSLATION OF THE DESCRIPTION OR TO PAY THE FEE WITHIN THE PRESCRIBED TIME-LIMIT Effective date: 20240424 Ref country code: FI Free format text: LAPSE BECAUSE OF FAILURE TO SUBMIT A TRANSLATION OF THE DESCRIPTION OR TO PAY THE FEE WITHIN THE PRESCRIBED TIME-LIMIT Effective date: 20240424 |
|
| PG25 | Lapsed in a contracting state [announced via postgrant information from national office to epo] |
Ref country code: GR Free format text: LAPSE BECAUSE OF FAILURE TO SUBMIT A TRANSLATION OF THE DESCRIPTION OR TO PAY THE FEE WITHIN THE PRESCRIBED TIME-LIMIT Effective date: 20240725 |
|
| PG25 | Lapsed in a contracting state [announced via postgrant information from national office to epo] |
Ref country code: PT Free format text: LAPSE BECAUSE OF FAILURE TO SUBMIT A TRANSLATION OF THE DESCRIPTION OR TO PAY THE FEE WITHIN THE PRESCRIBED TIME-LIMIT Effective date: 20240826 |
|
| PG25 | Lapsed in a contracting state [announced via postgrant information from national office to epo] |
Ref country code: ES Free format text: LAPSE BECAUSE OF FAILURE TO SUBMIT A TRANSLATION OF THE DESCRIPTION OR TO PAY THE FEE WITHIN THE PRESCRIBED TIME-LIMIT Effective date: 20240424 |
|
| PG25 | Lapsed in a contracting state [announced via postgrant information from national office to epo] |
Ref country code: AT Free format text: LAPSE BECAUSE OF FAILURE TO SUBMIT A TRANSLATION OF THE DESCRIPTION OR TO PAY THE FEE WITHIN THE PRESCRIBED TIME-LIMIT Effective date: 20240424 |
|
| PG25 | Lapsed in a contracting state [announced via postgrant information from national office to epo] |
Ref country code: PL Free format text: LAPSE BECAUSE OF FAILURE TO SUBMIT A TRANSLATION OF THE DESCRIPTION OR TO PAY THE FEE WITHIN THE PRESCRIBED TIME-LIMIT Effective date: 20240424 |
|
| PG25 | Lapsed in a contracting state [announced via postgrant information from national office to epo] |
Ref country code: LV Free format text: LAPSE BECAUSE OF FAILURE TO SUBMIT A TRANSLATION OF THE DESCRIPTION OR TO PAY THE FEE WITHIN THE PRESCRIBED TIME-LIMIT Effective date: 20240424 |
|
| PG25 | Lapsed in a contracting state [announced via postgrant information from national office to epo] |
Ref country code: PT Free format text: LAPSE BECAUSE OF FAILURE TO SUBMIT A TRANSLATION OF THE DESCRIPTION OR TO PAY THE FEE WITHIN THE PRESCRIBED TIME-LIMIT Effective date: 20240826 Ref country code: PL Free format text: LAPSE BECAUSE OF FAILURE TO SUBMIT A TRANSLATION OF THE DESCRIPTION OR TO PAY THE FEE WITHIN THE PRESCRIBED TIME-LIMIT Effective date: 20240424 Ref country code: NO Free format text: LAPSE BECAUSE OF FAILURE TO SUBMIT A TRANSLATION OF THE DESCRIPTION OR TO PAY THE FEE WITHIN THE PRESCRIBED TIME-LIMIT Effective date: 20240724 Ref country code: LV Free format text: LAPSE BECAUSE OF FAILURE TO SUBMIT A TRANSLATION OF THE DESCRIPTION OR TO PAY THE FEE WITHIN THE PRESCRIBED TIME-LIMIT Effective date: 20240424 Ref country code: IS Free format text: LAPSE BECAUSE OF FAILURE TO SUBMIT A TRANSLATION OF THE DESCRIPTION OR TO PAY THE FEE WITHIN THE PRESCRIBED TIME-LIMIT Effective date: 20240824 Ref country code: HR Free format text: LAPSE BECAUSE OF FAILURE TO SUBMIT A TRANSLATION OF THE DESCRIPTION OR TO PAY THE FEE WITHIN THE PRESCRIBED TIME-LIMIT Effective date: 20240424 Ref country code: GR Free format text: LAPSE BECAUSE OF FAILURE TO SUBMIT A TRANSLATION OF THE DESCRIPTION OR TO PAY THE FEE WITHIN THE PRESCRIBED TIME-LIMIT Effective date: 20240725 Ref country code: FI Free format text: LAPSE BECAUSE OF FAILURE TO SUBMIT A TRANSLATION OF THE DESCRIPTION OR TO PAY THE FEE WITHIN THE PRESCRIBED TIME-LIMIT Effective date: 20240424 Ref country code: ES Free format text: LAPSE BECAUSE OF FAILURE TO SUBMIT A TRANSLATION OF THE DESCRIPTION OR TO PAY THE FEE WITHIN THE PRESCRIBED TIME-LIMIT Effective date: 20240424 Ref country code: BG Free format text: LAPSE BECAUSE OF FAILURE TO SUBMIT A TRANSLATION OF THE DESCRIPTION OR TO PAY THE FEE WITHIN THE PRESCRIBED TIME-LIMIT Effective date: 20240424 Ref country code: AT Free format text: LAPSE BECAUSE OF FAILURE TO SUBMIT A TRANSLATION OF THE DESCRIPTION OR TO PAY THE FEE WITHIN THE PRESCRIBED TIME-LIMIT Effective date: 20240424 Ref country code: RS Free format text: LAPSE BECAUSE OF FAILURE TO SUBMIT A TRANSLATION OF THE DESCRIPTION OR TO PAY THE FEE WITHIN THE PRESCRIBED TIME-LIMIT Effective date: 20240724 |
|
| PG25 | Lapsed in a contracting state [announced via postgrant information from national office to epo] |
Ref country code: DK Free format text: LAPSE BECAUSE OF FAILURE TO SUBMIT A TRANSLATION OF THE DESCRIPTION OR TO PAY THE FEE WITHIN THE PRESCRIBED TIME-LIMIT Effective date: 20240424 |
|
| PG25 | Lapsed in a contracting state [announced via postgrant information from national office to epo] |
Ref country code: EE Free format text: LAPSE BECAUSE OF FAILURE TO SUBMIT A TRANSLATION OF THE DESCRIPTION OR TO PAY THE FEE WITHIN THE PRESCRIBED TIME-LIMIT Effective date: 20240424 |
|
| PG25 | Lapsed in a contracting state [announced via postgrant information from national office to epo] |
Ref country code: CZ Free format text: LAPSE BECAUSE OF FAILURE TO SUBMIT A TRANSLATION OF THE DESCRIPTION OR TO PAY THE FEE WITHIN THE PRESCRIBED TIME-LIMIT Effective date: 20240424 |
|
| PG25 | Lapsed in a contracting state [announced via postgrant information from national office to epo] |
Ref country code: RO Free format text: LAPSE BECAUSE OF FAILURE TO SUBMIT A TRANSLATION OF THE DESCRIPTION OR TO PAY THE FEE WITHIN THE PRESCRIBED TIME-LIMIT Effective date: 20240424 Ref country code: SK Free format text: LAPSE BECAUSE OF FAILURE TO SUBMIT A TRANSLATION OF THE DESCRIPTION OR TO PAY THE FEE WITHIN THE PRESCRIBED TIME-LIMIT Effective date: 20240424 |
|
| REG | Reference to a national code |
Ref country code: DE Ref legal event code: R097 Ref document number: 602019051101 Country of ref document: DE |
|
| PG25 | Lapsed in a contracting state [announced via postgrant information from national office to epo] |
Ref country code: SM Free format text: LAPSE BECAUSE OF FAILURE TO SUBMIT A TRANSLATION OF THE DESCRIPTION OR TO PAY THE FEE WITHIN THE PRESCRIBED TIME-LIMIT Effective date: 20240424 |
|
| PG25 | Lapsed in a contracting state [announced via postgrant information from national office to epo] |
Ref country code: SM Free format text: LAPSE BECAUSE OF FAILURE TO SUBMIT A TRANSLATION OF THE DESCRIPTION OR TO PAY THE FEE WITHIN THE PRESCRIBED TIME-LIMIT Effective date: 20240424 Ref country code: SK Free format text: LAPSE BECAUSE OF FAILURE TO SUBMIT A TRANSLATION OF THE DESCRIPTION OR TO PAY THE FEE WITHIN THE PRESCRIBED TIME-LIMIT Effective date: 20240424 Ref country code: RO Free format text: LAPSE BECAUSE OF FAILURE TO SUBMIT A TRANSLATION OF THE DESCRIPTION OR TO PAY THE FEE WITHIN THE PRESCRIBED TIME-LIMIT Effective date: 20240424 Ref country code: EE Free format text: LAPSE BECAUSE OF FAILURE TO SUBMIT A TRANSLATION OF THE DESCRIPTION OR TO PAY THE FEE WITHIN THE PRESCRIBED TIME-LIMIT Effective date: 20240424 Ref country code: DK Free format text: LAPSE BECAUSE OF FAILURE TO SUBMIT A TRANSLATION OF THE DESCRIPTION OR TO PAY THE FEE WITHIN THE PRESCRIBED TIME-LIMIT Effective date: 20240424 Ref country code: CZ Free format text: LAPSE BECAUSE OF FAILURE TO SUBMIT A TRANSLATION OF THE DESCRIPTION OR TO PAY THE FEE WITHIN THE PRESCRIBED TIME-LIMIT Effective date: 20240424 |
|
| PLBE | No opposition filed within time limit |
Free format text: ORIGINAL CODE: 0009261 |
|
| STAA | Information on the status of an ep patent application or granted ep patent |
Free format text: STATUS: NO OPPOSITION FILED WITHIN TIME LIMIT |
|
| 26N | No opposition filed |
Effective date: 20250127 |
|
| PG25 | Lapsed in a contracting state [announced via postgrant information from national office to epo] |
Ref country code: SI Free format text: LAPSE BECAUSE OF FAILURE TO SUBMIT A TRANSLATION OF THE DESCRIPTION OR TO PAY THE FEE WITHIN THE PRESCRIBED TIME-LIMIT Effective date: 20240424 |
|
| PG25 | Lapsed in a contracting state [announced via postgrant information from national office to epo] |
Ref country code: MC Free format text: LAPSE BECAUSE OF FAILURE TO SUBMIT A TRANSLATION OF THE DESCRIPTION OR TO PAY THE FEE WITHIN THE PRESCRIBED TIME-LIMIT Effective date: 20240424 |
|
| REG | Reference to a national code |
Ref country code: CH Ref legal event code: U11 Free format text: ST27 STATUS EVENT CODE: U-0-0-U10-U11 (AS PROVIDED BY THE NATIONAL OFFICE) Effective date: 20251201 |
|
| PGFP | Annual fee paid to national office [announced via postgrant information from national office to epo] |
Ref country code: NL Payment date: 20251112 Year of fee payment: 7 Ref country code: LU Payment date: 20251113 Year of fee payment: 7 |
|
| PGFP | Annual fee paid to national office [announced via postgrant information from national office to epo] |
Ref country code: DE Payment date: 20251028 Year of fee payment: 7 |
|
| PGFP | Annual fee paid to national office [announced via postgrant information from national office to epo] |
Ref country code: GB Payment date: 20251023 Year of fee payment: 7 |
|
| PGFP | Annual fee paid to national office [announced via postgrant information from national office to epo] |
Ref country code: FR Payment date: 20251110 Year of fee payment: 7 |
|
| PGFP | Annual fee paid to national office [announced via postgrant information from national office to epo] |
Ref country code: BE Payment date: 20251024 Year of fee payment: 7 |
|
| PGFP | Annual fee paid to national office [announced via postgrant information from national office to epo] |
Ref country code: CH Payment date: 20251201 Year of fee payment: 7 Ref country code: SE Payment date: 20251028 Year of fee payment: 7 |
|
| PGFP | Annual fee paid to national office [announced via postgrant information from national office to epo] |
Ref country code: IE Payment date: 20251024 Year of fee payment: 7 |
|
| PG25 | Lapsed in a contracting state [announced via postgrant information from national office to epo] |
Ref country code: IT Free format text: LAPSE BECAUSE OF FAILURE TO SUBMIT A TRANSLATION OF THE DESCRIPTION OR TO PAY THE FEE WITHIN THE PRESCRIBED TIME-LIMIT Effective date: 20240424 |
|
| PG25 | Lapsed in a contracting state [announced via postgrant information from national office to epo] |
Ref country code: HU Free format text: LAPSE BECAUSE OF FAILURE TO SUBMIT A TRANSLATION OF THE DESCRIPTION OR TO PAY THE FEE WITHIN THE PRESCRIBED TIME-LIMIT; INVALID AB INITIO Effective date: 20191129 |
|
| PG25 | Lapsed in a contracting state [announced via postgrant information from national office to epo] |
Ref country code: CY Free format text: LAPSE BECAUSE OF FAILURE TO SUBMIT A TRANSLATION OF THE DESCRIPTION OR TO PAY THE FEE WITHIN THE PRESCRIBED TIME-LIMIT; INVALID AB INITIO Effective date: 20191129 |