EP3865851A1 - Photoacoustic dual comb spectrometer - Google Patents
Photoacoustic dual comb spectrometer Download PDFInfo
- Publication number
- EP3865851A1 EP3865851A1 EP20156763.3A EP20156763A EP3865851A1 EP 3865851 A1 EP3865851 A1 EP 3865851A1 EP 20156763 A EP20156763 A EP 20156763A EP 3865851 A1 EP3865851 A1 EP 3865851A1
- Authority
- EP
- European Patent Office
- Prior art keywords
- optical
- optical frequency
- frequency combs
- rep
- combs
- Prior art date
- Legal status (The legal status is an assumption and is not a legal conclusion. Google has not performed a legal analysis and makes no representation as to the accuracy of the status listed.)
- Withdrawn
Links
Images


Classifications
-
- G—PHYSICS
- G01—MEASURING; TESTING
- G01N—INVESTIGATING OR ANALYSING MATERIALS BY DETERMINING THEIR CHEMICAL OR PHYSICAL PROPERTIES
- G01N21/00—Investigating or analysing materials by the use of optical means, i.e. using sub-millimetre waves, infrared, visible or ultraviolet light
- G01N21/17—Systems in which incident light is modified in accordance with the properties of the material investigated
- G01N21/1702—Systems in which incident light is modified in accordance with the properties of the material investigated with opto-acoustic detection, e.g. for gases or analysing solids
-
- G—PHYSICS
- G01—MEASURING; TESTING
- G01N—INVESTIGATING OR ANALYSING MATERIALS BY DETERMINING THEIR CHEMICAL OR PHYSICAL PROPERTIES
- G01N29/00—Investigating or analysing materials by the use of ultrasonic, sonic or infrasonic waves; Visualisation of the interior of objects by transmitting ultrasonic or sonic waves through the object
- G01N29/22—Details, e.g. general constructional or apparatus details
- G01N29/24—Probes
- G01N29/2418—Probes using optoacoustic interaction with the material, e.g. laser radiation, photoacoustics
-
- G—PHYSICS
- G01—MEASURING; TESTING
- G01N—INVESTIGATING OR ANALYSING MATERIALS BY DETERMINING THEIR CHEMICAL OR PHYSICAL PROPERTIES
- G01N29/00—Investigating or analysing materials by the use of ultrasonic, sonic or infrasonic waves; Visualisation of the interior of objects by transmitting ultrasonic or sonic waves through the object
- G01N29/22—Details, e.g. general constructional or apparatus details
- G01N29/24—Probes
- G01N29/2418—Probes using optoacoustic interaction with the material, e.g. laser radiation, photoacoustics
- G01N29/2425—Probes using optoacoustic interaction with the material, e.g. laser radiation, photoacoustics optoacoustic fluid cells therefor
Definitions
- the invention is in the field of photoacoustic spectroscopy, i.e., optical spectroscopy based on the acoustic detection of light absorption by the sample.
- the invention concerns a device implementing two optical frequency combs, with spatial overlap in a region of a sample of interest, and comprising optical frequencies adapted to produce a modulation signal that is detected by an acoustic detector such as a microphone.
- the invention further concerns a method of using said device for spectroscopy applications.
- Photoacoustic spectroscopy is an absorption-based spectroscopy technique that involves absorption of a modulated or pulsed light beam, at a wavelength that overlaps with an absorption feature of molecules of interest, or more generally any material with characteristic light absorption features in which acoustic waves can propagate.
- the optical energy absorbed by the studied molecules (or material) is converted into periodic local heating at the modulation frequency and produces an acoustic wave in the sample that can be detected with an acoustic detector such as a microphone, piezo-electric transducers, cantilevers or any other sensor of mechanic pressure waves.
- the absorbance of the specimen is deduced from the attenuation of the incident light after passing through the sample.
- the attenuation signal must be extracted from a large background of detected transmitted light. This limits the sensitivity of traditional transmission-based techniques.
- the measured signal corresponds exclusively to the absorbed light, as non-absorbed light simply crosses the sample without producing an acoustic wave. This makes PAS particularly well-suited for weak absorption signals, for example, in gas spectroscopy, to determine the presence or concentration of target trace molecules.
- Using a laser as light source for PAS has several advantages as compared to incoherent sources. This includes: high brilliance, enabling high optical fields in a small sample volume, and high energy density in a narrow spectral bandwidth, all of which contributes to producing a larger photoacoustic signal.
- laser sources often provide a reduced accessible range of wavelengths, which can be an important disadvantage for spectroscopy systems.
- the use of frequency combs as broad-spectrum laser sources has been proposed in order to overcome this problem, for example, in I. Sadiek et al. "Optical Frequency Comb Photoacoustic Spectroscopy", Conference Proceedings, CLEO 2019 .
- Sadiek et al. used an optical comb centered at 3.3 ⁇ m wavelength, with a spectral width of 255 nm, corresponding to 230 cm -1 , as the light source of a PAS system to measure the absorption lines of gaseous methane (100 ppm in N 2 at 1 bar).
- Sadiek et al. implemented a Fourier Transform interferometer.
- a general disadvantage of FTIR systems is the need of mechanical moving parts to scan the optical path difference between the two interferometer arms.
- the spectral resolution expressed in cm -1 is determined by the inverse of the scanning length. For example, in order to achieve 1 GHz spectral resolution (corresponding to 0.033 cm -1 ) the optical path difference must be at least 30cm. Such long scanning ranges often limit the acquisition speed and result in bulky systems, prone to misalignment issues due to mechanical failure and vibration sensitivity.
- FTIR spectroscopy is hardly compatible with miniaturized systems and in particular with emerging technology platforms for photonics integrated circuits.
- DCS dual comb spectroscopy
- DCS does not include any mechanical moving part and has a technical potential for implementation in a miniaturized system.
- the general principle of DCS has been described in US5748309 .
- the similarity of DCS and FTIR is well known to the person skilled in the art.
- DCS is not an obvious off-the-shelf substitute for all existing FTIR applications.
- DCS is a complex technique facing technical challenges which has to be specifically addressed for each implementation.
- One aspect of the invention relates to a photoacoustic spectrometer comprising an acoustic detector adapted to detect an acoustic wave generated in a sample of interest and a light source consisting in two optical frequency combs, presenting at least a partial overlap of their optical spectra across an optical frequency range of width W, and spatially arranged to co-propagate with significant spatial overlap in a region of the sample.
- Said optical frequency combs feature a small difference ⁇ f rep between their characteristic repetition rates, which is adapted to the response bandwidth BW det of the acoustic detector according to the relation ⁇ f rep ⁇ BW det f rep / W where f rep corresponds to the average repetition rate of the two optical frequency combs.
- the optical frequency combs implemented in the photoacoustic spectrometer may advantageously cover substantially the same optical spectrum.
- the optical frequency combs implemented in the photoacoustic spectrometer may be advantageously generated from a single cw-laser source, split in two independent channels, with each of said channels comprising an electro-optic modulator.
- the optical frequency combs implemented in the photoacoustic spectrometer may be advantageously generated from a single cw-laser source, split in two independent channels, with each of said channels comprising an electro-optic modulator, wherein at least one of the channels further comprises an acousto-optic modulator.
- the optical frequency combs implemented in the photoacoustic spectrometer may be advantageously generated from a single cw-laser source, split in two independent channels, with each of said channels comprising both, an electro-optic modulator and an acousto-optic modulator.
- the optical frequency combs implemented in the photoacoustic spectrometer may be advantageously generated from two mode-locked laser oscillators.
- the optical frequency combs implemented in the photoacoustic spectrometer may be advantageously generated in micro-optical resonators.
- the optical frequency combs implemented in the photoacoustic spectrometer may be advantageously stabilized by active feedback loops.
- the optical frequency combs implemented in the photoacoustic spectrometer may be initially generated in a first region of the optical spectrum, then broadened or shifted into a different region of the optical spectrum by means of non-linear optical elements.
- the optical frequency combs implemented in the photoacoustic spectrometer may be spatially overlapped by combining them in a fiber-based coupler.
- the optical frequency combs implemented in the photoacoustic spectrometer may be spatially overlapped by combining them in free space, by means of a beam splitter.
- the photoacoustic spectrometer may further comprise a photodetector arranged to detect fractions of power of the optical frequency combs, spatially overlapped on the photodetector.
- the repetition rates of the optical frequency combs implemented in the photoacoustic spectrometer may be comprised in a range from 10 MHz to 100 GHz, and more advantageously, in a range from 500 MHz to 100 GHz.
- the invention also concerns a method of photoacoustic spectroscopy comprising the steps of
- the method of the invention may further comprise additional steps between b) and c), said additional steps comprising:
- Figure 1 shows a schematic representation of the frequency spectra of two optical frequency combs 10a, 10b, adapted for DCS.
- the frequency combs of Figure 1 conveniently extend across the same range of the optical spectrum W, and present similar spectral envelopes E(a), E(b).
- Each comb is composed of discrete equidistant optical modes M(a), M(b), each mode separated by a characteristic frequency interval f rep a, f rep b, which corresponds to the repetition rate of the optical pulses generated by each frequency comb 10a, 10b.
- each pair of neighbouring modes fa i , fb i will produce a modulation signal at a specific frequency ⁇ f i , which is characteristic and unique to that pair of modes and therefore, to their corresponding optical wavelength.
- the frequency combs are overlapped and the modulation signals with frequency components ⁇ f i are detected with a photodetector.
- the modulation frequencies ⁇ f i are in the order of MHz, or hundreds or tens of kHz.
- the photodetector acquires a time dependent intensity signal at an acquisition rate which at least doubles the largest value of ⁇ f i in the modulation spectrum.
- the spectral components at different ⁇ f i are determined.
- Different calibration methods may further be used to transpose the frequency axis from the measured radio-frequency signals ⁇ f i to the corresponding optical frequencies fa i ⁇ fb i .
- the detector is an acoustic detector, which is generally limited to a response bandwidth much lower than the photodetectors traditionally used in DCS. There is thus a need to adapt the repetition rates of the combs so as to have all modulation frequencies ⁇ f i comprised in the bandwidth of the acoustic detector.
- the acoustic detector of the invention can be in general any sensor of mechanic pressure waves.
- a microphone for example, a microphone, a piezo-electric sensor or a cantilever with an optical read-out of its mechanic deformation under a pressure wave.
- Acoustic sensors of different types may have response bandwidths going from a few Hz, up to the MHz range for some very-fast detectors.
- the acoustic detector may be disposed in direct mechanical contact to a solid sample, or inserted in a gas or liquid sample, or be integrated in a sample cell or sample carrier adapted to receive the sample of interest and exposed to the combined optical field of the two frequency combs.
- the frequency combs need not be identical as shown in Figure 1 . Having frequency combs with substantially identical spectral envelopes is clearly advantageous, but the device of the invention may as well be realized with heterogeneous frequency combs overlapping only within a limited region of their respective spectra. In that case, the implementation condition already described ( ⁇ f rep ⁇ BW det f rep / W) applies as well, since W has been defined as the frequency width of the optical spectrum shared by the two combs and giving rise to a sensible contribution to a modulated absorption signal in the sample.
- the limited response bandwidth of acoustic detectors result in relatively low data acquisition rates. This imposes rather stringent requirements on the mutual coherence time of the frequency combs 10a, 10b, which also has to be considered in respect of the response bandwidth of the acoustic detector.
- Figure 2 shows a preferred embodiment of the photoacoustic spectrometer of the invention 100, featuring optical frequency combs, which can be conveniently provided with seconds-long or practically unlimited mutual-coherence.
- the components can be assumed to be fibered elements for simplicity.
- a person skilled in the art would know how to implement the equivalent elements in a free-space configuration or in a photonic integrated circuit (PIC) device without departing from the scope of the present invention.
- PIC photonic integrated circuit
- a continues-wave (cw) laser 101 is split by means of a fibred beam combiner 102 into two independent channels A, B.
- Each channel is provided with an optional acousto-optic modulator 103a, 103b, allowing to shift the optical frequency of the laser as will be later described in connection with Figure 3 .
- the acousto-optic modulators 103a, 103b are driven by respective signal generators 104a, 104b at the frequencies f off a, f off b that will be applied to shift the optical frequency of the laser.
- An electro-optic modulator (EOM) 105a, 105b is used to induce a strong phase modulation in each channel.
- the EOMs 105a, 105b are driven by respective signal generators 106a, 106b, at the frequencies f rep a, f rep b.
- the phase modulation of the cw laser produces side-bands in its optical spectrum which get coherently amplified and mixed in a non-linear optical parametric process to generate further side modes at the same frequency intervals, thus generating an optical frequency comb 10a, 10b.
- the frequency interval of the resulting comb corresponds precisely to the modulation frequency f rep a, f rep b.
- phase relation between the different modes of the resulting frequency comb is intrinsically maintained by the nature of the parametric process at its origin.
- the mutual coherence of the combs 10a, 10b can further be guaranteed by referencing the signal generators 106a, 106b, to a common RF reference.
- the EOMs 105a, 105b can be modulated at frequencies up to tens of GHz or even few hundreds of GHz, which can result in very-high repetition rate combs.
- High repetition rates in the range of 500 MHz to 10 GHz are particularly convenient in regard to the density of modes in the frequency spectrum.
- a large number of modes within a defined spectral band result in low energy per mode, as well as in the impossibility of resolving single discrete modes in the signal.
- too high repetition rates in the tens of GHz might provide insufficient sampling points to un-ambiguously detect the amplitude of absorption lines from a low-pressure gaseous sample.
- a sampling interval of 100 GHz would be sufficient to study the large absorption bands typical of liquid phase samples.
- the optical frequency combs 10a, 10b are combined in a fibered beam combiner 107.
- One of the outputs of the beam combiner 107 is directed into the sample, which in the example of Figure 2 is a gas or liquid sample 110, contained in a sample cell 108, provided with an acoustic detector 109, adapted to detect the photoacoustic signals generated in the sample 110.
- a sample cell 108 is advantageous but not mandatory. Indeed, a simple system for environmental monitoring may be implemented in open air, by placing a microphone 109 close to a point in the air where the combined frequency combs 10a, 10b, are focused together.
- the implementation of a cell 108 has the advantages of: isolating the acoustic detector from external acoustic noise, or enabling resonant acoustic schemes to enhance the amplitude of the photoacoustic signals recorded by the acoustic detector 109 as known from the prior art.
- a signal acquisition and data processing setup 111 records and performs the necessary numerical treatment of the data registered by the acoustic detector 109.
- the data processing setup 111 may generally comprise recording means, analogue to digital convertors (if the acoustic detector 109 produces an analogue output) and standard computing means.
- a convenient optional feature of the embodiment of Figure 2 is the provision of a photodetector 112, adapted to receive a second output of the beam combiner 107.
- the photodetector 112 detects optically the beating components of the interfering frequency combs 10a, 10b, just like in a standard DCS scheme. Since, in general, the envelope of the combs E(a), E(b) is not a flat spectral function, it is convenient to normalize the spectrum of the photoacoustic signal by the amplitude of the spectrum of the optical modulation signal. This is particularly necessary when there is an interest to compare the relative absorption depths of several peaks distributed across the spectrum.
- this spectral weighting of the photoacoustic signal is not a mandatory step.
- the fraction of the frequency comb power that is directed to the photodetector 112 is not necessarily the conjugate output of the beam combiner 107.
- a small fraction of the frequency comb powers can be deviated towards the photodetector 112 by a beam sampler provided in the path of the combined beams that are used to interrogate the sample.
- the photodetector 112 is connected to the data processing setup 111 for a real time normalization of the acquired photoacoustic signals. Obviously, this step could also be conducted in post-processing.
- Figure 3A represents the optical combs 10a, 10b, that could be generated with a photoacoustic spectrometer 100 as described in Figure 2 without the acousto-optic modulators 103a, 103b.
- the central mode corresponding to the original cw-laser frequency f c can be identified as the main, central mode.
- the modulation combs generated by the EOM-scheme described above are symmetric around the central frequency f c .
- the modulation signals ⁇ f c+i and ⁇ f c-i have the same modulation frequencies although they correspond to different optical frequencies.
- This ambiguity can be resolved by offsetting the central frequency of one comb with respect to the other, as shown in Figure 3B , such as to have a unique correspondence between the detected modulation frequencies ⁇ f i and the optical spectrum across the whole region of spectral overlap W.
- the offset frequency ⁇ f off can be conveniently introduced by means of acousto-optic modulators, or electro-optic single sideband modulators.
- the frequency offset that needs to be introduced between the combs can be in the order of hundreds of Hz or a few kHz.
- An alternative implementation of this trick could consist in placing two acousto-optic modulators 103a, 103b in series in a single channel and oriented in opposite directions such as to have a sequential positive and negative shift of the optical frequency, resulting in a net small ⁇ f off shift.
- the position of the acousto-optic modulator 103a, 103b within the channels A or B, for example, before or after the EOMs 105a, 105b, is not fundamentally relevant and can be adapted according to the convenience of the specific components.
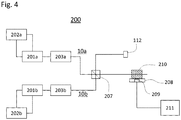
- Figure 4 shows an alternative embodiment of the photoacoustic spectrometer of the invention 200.
- the principal difference with respect to Figure 2 is the origin of the frequency combs 10a, 10b.
- two frequency combs are directly generated by mode-locked laser oscillators 201a, 201b.
- the combs can be conveniently stabilized by standard procedures through feedback loops 202a, 202b. These typically comprise repetition rate stabilization via actuators like e.g.
- intracavity piezo-mounted components temperature regulation, etc.
- carrier-envelope offset frequency (f ceo ) stabilization via the control of the current in a pump diode, or other techniques actuating on the intracavity dispersion known to a skilled person.
- Another alternative to generate optical frequency combs may comprise: pumping one or two micro-optical resonators with either cw or pulsed laser light, to create or broaden the spectrum of discrete optical modes by means of optical parametric processes.
- Micro-resonator combs typically present repetition rates in the tens to hundreds of GHz, which can be advantageous for specific applications of the spectrometer. Also, micro-resonator combs are ideal for miniaturization and integration in photonic circuits.
- the typical repetition rates of standard mode-locked laser oscillators is usually in the MHz range, e.g. 10 MHz and may reach up to the hundreds of MHz or even few GHz.
- a person skilled in the art may advantageously put in place stabilization strategies equivalent to the feedback loops 202a, 202b represented in Figure 4 , to improve the long term individual and mutual coherence of the combs 10a, 10b.
- the spectrometer of the invention may be realized for a range of repetition rates going from a few MHz, e.g. 10 MHz, to hundreds of GHz, e.g. 100 GHz.
- additional elements 203a, 203b can be provided in the setup to adapt the spectrum of the frequency combs 10a, 10b.
- the elements 203a, 203b may comprise: laser amplifiers to increase the power of the frequency combs, compressor schemes, non-linear spectral broadening arrangements and other nonlinear elements such as non-linear crystals, photonic crystal fibres, and other combinations known to a skilled person.
- the final frequency combs 10a, 10b which are represented here as free space beams, are combined in a free space beam splitter 207, providing two conjugate outputs, one of which is directed towards a photodetector 112 fulfilling the same mission described above in connection to the Figure 2 .
- the other output is equivalently directed onto a sample 210, which for the purpose of illustration is represented here as a solid sample, mounted on a sample carrier 208, comprising the acoustic detector 209.
- numeric methods can be implemented in order to extract the frequency components of the recorded time dependent acoustic signal, including classical calculation of the Fourier Transform or Fast Fourier Transform, or modern algorithms of trained neural networks.
Landscapes
- Physics & Mathematics (AREA)
- Biochemistry (AREA)
- Health & Medical Sciences (AREA)
- Life Sciences & Earth Sciences (AREA)
- Chemical & Material Sciences (AREA)
- Analytical Chemistry (AREA)
- General Health & Medical Sciences (AREA)
- General Physics & Mathematics (AREA)
- Immunology (AREA)
- Pathology (AREA)
- Optics & Photonics (AREA)
- Investigating Or Analysing Materials By Optical Means (AREA)
- Investigating Or Analyzing Materials By The Use Of Ultrasonic Waves (AREA)
Abstract
Disclosed is a photoacoustic spectrometer (100) comprising an acoustic detector (109) adapted to detect an acoustic wave generated in a sample of interest (110) and a light source (101) generating two optical frequency combs (10a, 10b), presenting at least a partial overlap of their optical spectra, spatially arranged to co-propagate with significant spatial overlap in a region of the sample (110) and featuring a small difference between their characteristic repetition rates, adapted to the low response bandwidth of the acoustic detector (109). Also disclosed is a method of photoacoustic spectroscopy using the photoacoustic spectrometer (100) .
Description
- The invention is in the field of photoacoustic spectroscopy, i.e., optical spectroscopy based on the acoustic detection of light absorption by the sample. In particular, the invention concerns a device implementing two optical frequency combs, with spatial overlap in a region of a sample of interest, and comprising optical frequencies adapted to produce a modulation signal that is detected by an acoustic detector such as a microphone.
- The invention further concerns a method of using said device for spectroscopy applications.
- Photoacoustic spectroscopy (PAS) is an absorption-based spectroscopy technique that involves absorption of a modulated or pulsed light beam, at a wavelength that overlaps with an absorption feature of molecules of interest, or more generally any material with characteristic light absorption features in which acoustic waves can propagate. The optical energy absorbed by the studied molecules (or material) is converted into periodic local heating at the modulation frequency and produces an acoustic wave in the sample that can be detected with an acoustic detector such as a microphone, piezo-electric transducers, cantilevers or any other sensor of mechanic pressure waves.
- In traditional transmission-based optical spectroscopy, the absorbance of the specimen is deduced from the attenuation of the incident light after passing through the sample. In case of weak absorption, the attenuation signal must be extracted from a large background of detected transmitted light. This limits the sensitivity of traditional transmission-based techniques. In contrast, in PAS, the measured signal corresponds exclusively to the absorbed light, as non-absorbed light simply crosses the sample without producing an acoustic wave. This makes PAS particularly well-suited for weak absorption signals, for example, in gas spectroscopy, to determine the presence or concentration of target trace molecules.
- Using a laser as light source for PAS has several advantages as compared to incoherent sources. This includes: high brilliance, enabling high optical fields in a small sample volume, and high energy density in a narrow spectral bandwidth, all of which contributes to producing a larger photoacoustic signal. On the other hand, laser sources often provide a reduced accessible range of wavelengths, which can be an important disadvantage for spectroscopy systems. The use of frequency combs as broad-spectrum laser sources has been proposed in order to overcome this problem, for example, in I. Sadiek et al. "Optical Frequency Comb Photoacoustic Spectroscopy", Conference Proceedings, CLEO 2019.
- Sadiek et al. used an optical comb centered at 3.3 µm wavelength, with a spectral width of 255 nm, corresponding to 230 cm-1, as the light source of a PAS system to measure the absorption lines of gaseous methane (100 ppm in N2 at 1 bar). In order to spectrally resolve the absorption signal from the sample, Sadiek et al. implemented a Fourier Transform interferometer.
- Fourier Transform spectroscopy had been combined before with photoacoustic detection, for example in J. Uotila et al., "Fourier transform infrared measurement of solid-, liquid-, and gas-phase samples with a single photoacoustic cell," Appl. Spectrosc. 62, 655-660 (2008), where a commercial FTIR spectrometer featuring an incoherent continuous broad-spectrum lamp was adapted for cantilever-enhanced photoacoustic detection.
- A general disadvantage of FTIR systems is the need of mechanical moving parts to scan the optical path difference between the two interferometer arms. The spectral resolution expressed in cm-1 is determined by the inverse of the scanning length. For example, in order to achieve 1 GHz spectral resolution (corresponding to 0.033 cm-1) the optical path difference must be at least 30cm. Such long scanning ranges often limit the acquisition speed and result in bulky systems, prone to misalignment issues due to mechanical failure and vibration sensitivity.
- Also, FTIR spectroscopy is hardly compatible with miniaturized systems and in particular with emerging technology platforms for photonics integrated circuits.
- In this sense, dual comb spectroscopy (DCS) may constitute a convenient alternative to FTIR spectroscopy. DCS does not include any mechanical moving part and has a technical potential for implementation in a miniaturized system. The general principle of DCS has been described in
US5748309 . The similarity of DCS and FTIR is well known to the person skilled in the art. However, DCS is not an obvious off-the-shelf substitute for all existing FTIR applications. DCS is a complex technique facing technical challenges which has to be specifically addressed for each implementation. - In particular Sadiek et al. has mentioned the possibility of using DCS instead of FTIR for their photoacoustic experiment, but the authors discourage this approach due to the mismatch between the slow detection bandwidth of their acoustic detector (hundreds of Hertz), and the high bandwidth required in DCS systems as known in the prior art, typically in the MHz range and based on photodetectors.
- There is thus a recognized need for a spectroscopy system that combines the high sensitivity of PAS, the high resolution and broad bandwidth of FTIR spectroscopy and the convenience of a system with no moving parts and high potential for miniaturization, like DCS.
- It is an aim of the present invention to propose a device combining the advantages of PAS, FTIR and DCS, overcoming the above-mentioned limitations of the prior art.
- One aspect of the invention relates to a photoacoustic spectrometer comprising an acoustic detector adapted to detect an acoustic wave generated in a sample of interest and a light source consisting in two optical frequency combs, presenting at least a partial overlap of their optical spectra across an optical frequency range of width W, and spatially arranged to co-propagate with significant spatial overlap in a region of the sample. Said optical frequency combs feature a small difference Δfrep between their characteristic repetition rates, which is adapted to the response bandwidth BWdet of the acoustic detector according to the relation

- According to another aspect of the invention, the optical frequency combs implemented in the photoacoustic spectrometer, may advantageously cover substantially the same optical spectrum.
- According to another aspect of the invention, the optical frequency combs implemented in the photoacoustic spectrometer, may be advantageously generated from a single cw-laser source, split in two independent channels, with each of said channels comprising an electro-optic modulator.
- According to another aspect of the invention, the optical frequency combs implemented in the photoacoustic spectrometer, may be advantageously generated from a single cw-laser source, split in two independent channels, with each of said channels comprising an electro-optic modulator, wherein at least one of the channels further comprises an acousto-optic modulator.
- According to another aspect of the invention, the optical frequency combs implemented in the photoacoustic spectrometer, may be advantageously generated from a single cw-laser source, split in two independent channels, with each of said channels comprising both, an electro-optic modulator and an acousto-optic modulator.
- According to yet another aspect of the invention, the optical frequency combs implemented in the photoacoustic spectrometer, may be advantageously generated from two mode-locked laser oscillators.
- According to yet another aspect of the invention, the optical frequency combs implemented in the photoacoustic spectrometer, may be advantageously generated in micro-optical resonators.
- According to yet another aspect of the invention, the optical frequency combs implemented in the photoacoustic spectrometer, may be advantageously stabilized by active feedback loops.
- According to yet another aspect of the invention, the optical frequency combs implemented in the photoacoustic spectrometer, may be initially generated in a first region of the optical spectrum, then broadened or shifted into a different region of the optical spectrum by means of non-linear optical elements.
- According to yet another aspect of the invention, the optical frequency combs implemented in the photoacoustic spectrometer, may be spatially overlapped by combining them in a fiber-based coupler.
- According to yet another aspect of the invention, the optical frequency combs implemented in the photoacoustic spectrometer, may be spatially overlapped by combining them in free space, by means of a beam splitter.
- According to another aspect of the invention, the photoacoustic spectrometer may further comprise a photodetector arranged to detect fractions of power of the optical frequency combs, spatially overlapped on the photodetector.
- According to yet another aspect of the invention, the repetition rates of the optical frequency combs implemented in the photoacoustic spectrometer, may be comprised in a range from 10 MHz to 100 GHz, and more advantageously, in a range from 500 MHz to 100 GHz.
- The invention also concerns a method of photoacoustic spectroscopy comprising the steps of
- a) generating two optical frequency combs presenting at least a partial overlap of their optical spectra across an optical frequency range of width W, and featuring a small difference Δfrep between their characteristic repetition rates, wherein Δfrep is adapted to the response bandwidth BWdet of an acoustic detector, according to the relation:

- b) spatially arranging the two optical frequency combs to co-propagate with significant spatial overlap in a region of a sample of interest,
- c) recording an acoustic wave generated at the sample of interest when the two optical frequency combs impinge on it, by means of the acoustic detector and
- d) determining the frequency components of the recorded acoustic wave.
- According to another aspect, the method of the invention may further comprise additional steps between b) and c), said additional steps comprising:
- b1) extracting fractions of power of the optical frequency combs and arranging them to spatially overlap on a photodetector,
- b2) recording a time-domain interferogram from the photodetector signal,
- b3) determining the frequency components of the recorded interferogram to obtain a spectrum of the optical heterodyne signal resulting from the interference of the two optical frequency combs and
- Further details of the invention will appear more clearly upon reading the description below, in connection with the following figures which illustrate:
-
Fig. 1 : schematic representation of the frequency spectra of two optical frequency combs according to the invention -
Fig. 2 : schematic illustration of a preferred embodiment of the invention; -
Fig. 3A and Fig. 3B : schematic representation of the frequency spectra of two optical frequency combs, as generated (A) and as shifted (B) according to one embodiment of the invention; -
Fig. 4 : schematic illustration of another possible embodiment of the invention -
Figure 1 shows a schematic representation of the frequency spectra of two optical frequency combs 10a, 10b, adapted for DCS. The frequency combs ofFigure 1 conveniently extend across the same range of the optical spectrum W, and present similar spectral envelopes E(a), E(b). Each comb is composed of discrete equidistant optical modes M(a), M(b), each mode separated by a characteristic frequency interval frepa, frepb, which corresponds to the repetition rate of the optical pulses generated by eachfrequency comb - The repetition rate of the two combs are similar but present a small difference: Δfrep.


- For each mode of the
comb 10a of a given frequency fai, there is a neighbouring mode of thecomb 10b with a similar frequency fbi. "i" is used here as an integer index identifying one of the discrete modes of a frequency comb. When the frequency combs 10a and 10b are spatially overlapped, their modes of similar frequencies fai and fbi interfere producing an amplitude modulation at a frequency Δfi = |fai - fbi| - Due to the slightly different spacing (frepa ≠ frepb) between the modes of the two combs, each pair of neighbouring modes fai, fbi, will produce a modulation signal at a specific frequency Δfi, which is characteristic and unique to that pair of modes and therefore, to their corresponding optical wavelength.
- In traditional DCS, the frequency combs are overlapped and the modulation signals with frequency components Δfi are detected with a photodetector. Typically the modulation frequencies Δfi are in the order of MHz, or hundreds or tens of kHz. The photodetector acquires a time dependent intensity signal at an acquisition rate which at least doubles the largest value of Δfi in the modulation spectrum. By applying a Fourier transform to the time dependent signal acquired by the photodiode, the spectral components at different Δfi are determined.
- Different calibration methods may further be used to transpose the frequency axis from the measured radio-frequency signals Δfi to the corresponding optical frequencies fai ≈ fbi.
- In the device of the present invention, the detector is an acoustic detector, which is generally limited to a response bandwidth much lower than the photodetectors traditionally used in DCS. There is thus a need to adapt the repetition rates of the combs so as to have all modulation frequencies Δfi comprised in the bandwidth of the acoustic detector.
- If W is the width of the optical spectrum shared by the two frequency combs and giving rise to a sensible contribution to a modulated absorption signal in the sample, and frep is the average repetition rate of the combs


- The acoustic detector of the invention can be in general any sensor of mechanic pressure waves. For example, a microphone, a piezo-electric sensor or a cantilever with an optical read-out of its mechanic deformation under a pressure wave. Acoustic sensors of different types, may have response bandwidths going from a few Hz, up to the MHz range for some very-fast detectors.
- The acoustic detector may be disposed in direct mechanical contact to a solid sample, or inserted in a gas or liquid sample, or be integrated in a sample cell or sample carrier adapted to receive the sample of interest and exposed to the combined optical field of the two frequency combs.
- It is worth mentioning that the frequency combs need not be identical as shown in
Figure 1 . Having frequency combs with substantially identical spectral envelopes is clearly advantageous, but the device of the invention may as well be realized with heterogeneous frequency combs overlapping only within a limited region of their respective spectra. In that case, the implementation condition already described (Δfrep < BWdet frep / W) applies as well, since W has been defined as the frequency width of the optical spectrum shared by the two combs and giving rise to a sensible contribution to a modulated absorption signal in the sample. - If only one of the frequency combs has spectral components that correspond to an absorption wavelength of the sample, this absorption will give rise to an acoustic signal at a frequency equal to the repetition rate of the corresponding comb. This frequency in general will be far beyond the response bandwidth of the acoustic detector and will not generate a signal that can be interpreted as a component of the dual-comb modulated signal.
- The limited response bandwidth of acoustic detectors result in relatively low data acquisition rates. This imposes rather stringent requirements on the mutual coherence time of the frequency combs 10a, 10b, which also has to be considered in respect of the response bandwidth of the acoustic detector.
-
Figure 2 shows a preferred embodiment of the photoacoustic spectrometer of theinvention 100, featuring optical frequency combs, which can be conveniently provided with seconds-long or practically unlimited mutual-coherence. InFigure 2 , the components can be assumed to be fibered elements for simplicity. However, a person skilled in the art would know how to implement the equivalent elements in a free-space configuration or in a photonic integrated circuit (PIC) device without departing from the scope of the present invention. - A continues-wave (cw)
laser 101 is split by means of afibred beam combiner 102 into two independent channels A, B. Each channel is provided with an optional acousto-optic modulator Figure 3 . The acousto-optic modulators respective signal generators - An electro-optic modulator (EOM) 105a, 105b is used to induce a strong phase modulation in each channel. The
EOMs respective signal generators optical frequency comb - The phase relation between the different modes of the resulting frequency comb is intrinsically maintained by the nature of the parametric process at its origin. The mutual coherence of the
combs signal generators - Starting from a common cw-
laser 101 as presented inFigure 2 presents the important advantage that any shift of the optical frequency of the cw-laser affects equally both frequency combs and gets cancelled in terms of frequency difference, i.e., there is no shift in the frequencies of the photoacoustic signal. Two independent lasers could also be provided as the starting point to generate thecombs - The
EOMs - In the embodiment of
Figure 2 , the optical frequency combs 10a, 10b, are combined in afibered beam combiner 107. - One of the outputs of the
beam combiner 107 is directed into the sample, which in the example ofFigure 2 is a gas orliquid sample 110, contained in asample cell 108, provided with anacoustic detector 109, adapted to detect the photoacoustic signals generated in thesample 110. The presence of asample cell 108 is advantageous but not mandatory. Indeed, a simple system for environmental monitoring may be implemented in open air, by placing amicrophone 109 close to a point in the air where the combined frequency combs 10a, 10b, are focused together. On the other hand, the implementation of acell 108 has the advantages of: isolating the acoustic detector from external acoustic noise, or enabling resonant acoustic schemes to enhance the amplitude of the photoacoustic signals recorded by theacoustic detector 109 as known from the prior art. - A signal acquisition and
data processing setup 111 records and performs the necessary numerical treatment of the data registered by theacoustic detector 109. Thedata processing setup 111 may generally comprise recording means, analogue to digital convertors (if theacoustic detector 109 produces an analogue output) and standard computing means. - A convenient optional feature of the embodiment of
Figure 2 is the provision of aphotodetector 112, adapted to receive a second output of thebeam combiner 107. Thephotodetector 112 detects optically the beating components of the interferingfrequency combs - It is obvious for a person skilled in the art, that the fraction of the frequency comb power that is directed to the
photodetector 112 is not necessarily the conjugate output of thebeam combiner 107. Alternatively, a small fraction of the frequency comb powers can be deviated towards thephotodetector 112 by a beam sampler provided in the path of the combined beams that are used to interrogate the sample. - In the embodiment of
Figure 2 , thephotodetector 112 is connected to thedata processing setup 111 for a real time normalization of the acquired photoacoustic signals. Obviously, this step could also be conducted in post-processing. - The advantage of implementing the acousto-
optic modulators Figure 2 will be now explained in connection toFigure 3 . -
Figure 3A represents theoptical combs photoacoustic spectrometer 100 as described inFigure 2 without the acousto-optic modulators Figure 3 , the central mode, corresponding to the original cw-laser frequency fc can be identified as the main, central mode. In general the modulation combs generated by the EOM-scheme described above are symmetric around the central frequency fc. For each mode of index i at the right of the central frequency (represented here by the sub-index c+i), there is a corresponding mode at the same frequency interval to the left of the centre (indexed c-i). Consequently, the modulation signals Δfc+i and Δfc-i have the same modulation frequencies although they correspond to different optical frequencies. - This ambiguity can be resolved by offsetting the central frequency of one comb with respect to the other, as shown in
Figure 3B , such as to have a unique correspondence between the detected modulation frequencies Δfi and the optical spectrum across the whole region of spectral overlap W. The offset frequency Δfoff can be conveniently introduced by means of acousto-optic modulators, or electro-optic single sideband modulators. - Obviously, in order to introduce a frequency offset Δfoff, it would be enough to shift one of the frequency combs. In practice, however, given the low response bandwidth of the detector and the consequently adapted low values of Δfi across the spectral range W, the frequency offset that needs to be introduced between the combs can be in the order of hundreds of Hz or a few kHz. Most commercial resonant acousto-optic modulators, which are preferred for their higher efficiency, operate however at MHz frequencies. This problem can be circumvented as shown in
Figure 2 , by implementing two acousto-optic modulators 
- An alternative implementation of this trick could consist in placing two acousto-
optic modulators - Also, as known by a person skilled in the art, the position of the acousto-
optic modulator EOMs -
Figure 4 shows an alternative embodiment of the photoacoustic spectrometer of theinvention 200. The principal difference with respect toFigure 2 is the origin of the frequency combs 10a, 10b. Here, two frequency combs are directly generated by mode-lockedlaser oscillators feedback loops - Another alternative to generate optical frequency combs that can be implemented in the photoacoustic spectrometer of the invention may comprise: pumping one or two micro-optical resonators with either cw or pulsed laser light, to create or broaden the spectrum of discrete optical modes by means of optical parametric processes.
- Micro-resonator combs typically present repetition rates in the tens to hundreds of GHz, which can be advantageous for specific applications of the spectrometer. Also, micro-resonator combs are ideal for miniaturization and integration in photonic circuits.
- The typical repetition rates of standard mode-locked laser oscillators is usually in the MHz range, e.g. 10 MHz and may reach up to the hundreds of MHz or even few GHz.
- Regardless of the means used to generate the optical frequency combs, a person skilled in the art may advantageously put in place stabilization strategies equivalent to the
feedback loops Figure 4 , to improve the long term individual and mutual coherence of thecombs - When the frequency combs generated by the mode-locked
laser oscillators additional elements elements - It is important to mention that, although this possibility of adapting the frequency combs 10a, 10b by means of
optional elements Figure 4 , it can also be implemented in a system like the one shown inFigure 2 or any other possible embodiment of the invention as defined by the appended claims. - Coming back to
Figure 4 , the final frequency combs 10a, 10b, which are represented here as free space beams, are combined in a freespace beam splitter 207, providing two conjugate outputs, one of which is directed towards aphotodetector 112 fulfilling the same mission described above in connection to theFigure 2 . The other output is equivalently directed onto asample 210, which for the purpose of illustration is represented here as a solid sample, mounted on asample carrier 208, comprising theacoustic detector 209. - It is obvious that the choice of solid, liquid or gaseous samples, as well as possible sample carriers or cells is totally independent of the choice of optical combs, free space, fibered or PIC design of the spectrometer according to the invention.
- In regard to the signal processing, several methods known to a person skilled in DCS can be advantageously implemented in order to improve the signal to noise ratio by averaging a large number of periodically repeated measurements. Since Fourier transformation of large data sets is a demanding operation in terms of computing time and resources, it is particularly interesting to perform the averaging directly on the periodically acquired signals instead of on their spectra. Small shifts of the comb spectra have however a strong incidence in the phase of the time dependent signal, hindering a direct averaging unless appropriate phase correction methods are introduced. These methods are generally described as coherent averaging methods, but may also include more complex experimental schemes as in the so called adaptive real-time approach.
- Also, different numeric methods can be implemented in order to extract the frequency components of the recorded time dependent acoustic signal, including classical calculation of the Fourier Transform or Fast Fourier Transform, or modern algorithms of trained neural networks.
- Although the invention has been described in terms of particular embodiments, various modifications are possible without departing from the scope of the invention as defined in the appended claims.
d1) using the spectrum of the optical heterodyne signal determined in b3) as an input to a weighting function to normalize the spectrum of the frequency components of the recorded acoustic wave determined in step d) of the method..
Claims (15)
- A photoacoustic spectrometer (100, 200) comprisingan acoustic detector (109, 209) configured to detect an acoustic wave generated in a sample of interest (110, 210) anda light sourcecharacterized in thatthe light source comprises two optical frequency combs (10a, 10b), the two optical frequency combs having at least a partial overlap of their optical spectra across an optical frequency range of width W and being spatially arranged to co-propagate with significant spatial overlap in a region of the sample (110, 210) andthe two optical frequency combs further featuring a small difference Δfrep between their characteristic repetition rates, Δfrep being adapted to the response bandwidth BWdet of the acoustic detector (109, 209), according to the relation:

- The photoacoustic spectrometer according to claim 1, wherein the two optical frequency combs (10a, 10b) cover substantially the same optical spectrum.
- The photoacoustic spectrometer according to claims 1 or 2, wherein the optical frequency combs (10a, 10b) are generated from a single cw-laser (101) source split in two independent channels (A, B), each channel comprising an electro-optic modulator (105a, 105b).
- The photoacoustic spectrometer according to claim 3, wherein at least one independent channel (A, B) further comprises an acousto-optic modulator (103a, 103b).
- The photoacoustic spectrometer according to claim 4, wherein each of the two independent channels (A, B) comprises an acousto-optic modulator (103a, 103b).
- The photoacoustic spectrometer according to claims 1 or 2, wherein the optical frequency combs (10a, 10b) are generated from two mode-locked laser oscillators (201a, 201b).
- The photoacoustic spectrometer according to claims 1 or 2, wherein the optical frequency combs (10a, 10b) are generated in micro-optical resonators.
- The photoacoustic spectrometer according to claims 1 or 2, wherein the optical frequency combs (10a, 10b) are stabilized by active feedback loops (202a, 202b).
- The photoacoustic spectrometer according to claims 1 or 2, wherein the optical frequency combs (10a, 10b) are generated in a first region of the optical spectrum, and broadened or shifted into a different region of the optical spectrum by means of non-linear optical elements (203a, 203b).
- The photoacoustic spectrometer according to claims 1 or 2, wherein the spatial overlap of the optical frequency combs (10a, 10b) is obtained by combining the optical frequency combs (10a, 10b) in a fiber-based coupler (107) or in free space, by means of a beam splitter (207).
- The photoacoustic spectrometer according to claims 1 or 2, further comprising a photodetector (112) arranged to detect fractions of the power of the optical frequency combs (10a, 10b), spatially overlapped on the photodetector (112).
- The photoacoustic spectrometer according to claims 1 or 2, wherein the repetition rate frep of the optical frequency combs (10a, 10b), is in a range from 10 MHz to 100 GHz.
- The photoacoustic spectrometer according to claim 12, wherein the repetition rate frep of the optical frequency combs (10a, 10b), is in a range from 500 MHz to 100 GHz.
- A method of using the photoacoustic spectrometer (100, 200) according to any one of claims 1 to 13 for performing photoacoustic spectroscopy, the method comprising the steps of:generating two optical frequency combs (10a, 10b) having at least a partial overlap of their optical spectra across an optical frequency range of width W, and featuring a small difference Δfrep between their characteristic repetition rates, wherein Δfrep is adapted to the response bandwidth BWdet of an acoustic detector (109, 209), according to the relation:
 spatially arranging the two optical frequency combs (10a, 10b) to co-propagate with significant spatial overlap in a region of a sample of interest (110, 210),recording an acoustic wave generated at the sample of interest (110, 210) when the two optical frequency combs impinge on it, by means of the acoustic detector (109, 209) anddetermining the frequency components of the recorded acoustic wave.
 - The method according to claim 14 comprising, between the steps of spatially arranging the two optical frequency combs and recording an acoustic wave , additional steps comprising:extracting power fractions of the optical frequency combs (10a, 10b) and arranging them to spatially overlap on a photodetector (112),recording a time-domain interferogram from the photodetector signal,determining the frequency components of the recorded interferogram to obtain a spectrum of the optical heterodyne signal resulting from the interference of the two optical frequency combs (10a, 10b) and performing an additional step after the step of determining the frequency components, comprising:using the obtained spectrum of the optical heterodyne signal as an input to a weighting function to normalize the spectrum of the determined frequency components of the recorded acoustic wave.
Priority Applications (1)
| Application Number | Priority Date | Filing Date | Title |
|---|---|---|---|
| EP20156763.3A EP3865851A1 (en) | 2020-02-11 | 2020-02-11 | Photoacoustic dual comb spectrometer |
Applications Claiming Priority (1)
| Application Number | Priority Date | Filing Date | Title |
|---|---|---|---|
| EP20156763.3A EP3865851A1 (en) | 2020-02-11 | 2020-02-11 | Photoacoustic dual comb spectrometer |
Publications (1)
| Publication Number | Publication Date |
|---|---|
| EP3865851A1 true EP3865851A1 (en) | 2021-08-18 |
Family
ID=69571884
Family Applications (1)
| Application Number | Title | Priority Date | Filing Date |
|---|---|---|---|
| EP20156763.3A Withdrawn EP3865851A1 (en) | 2020-02-11 | 2020-02-11 | Photoacoustic dual comb spectrometer |
Country Status (1)
| Country | Link |
|---|---|
| EP (1) | EP3865851A1 (en) |
Cited By (3)
| Publication number | Priority date | Publication date | Assignee | Title |
|---|---|---|---|---|
| CN113552071A (en) * | 2021-08-26 | 2021-10-26 | 天津大学 | A photoacoustic imaging system |
| CN114018829A (en) * | 2021-10-27 | 2022-02-08 | 国网四川省电力公司电力科学研究院 | Tuning fork resonance enhanced double-optical comb multi-component gas detection system |
| CN116678831A (en) * | 2023-06-01 | 2023-09-01 | 山西大学 | A resonant dual-comb photoacoustic spectroscopy system and method based on phase compensation |
Citations (2)
| Publication number | Priority date | Publication date | Assignee | Title |
|---|---|---|---|---|
| US5748309A (en) | 1994-10-20 | 1998-05-05 | Max-Planck-Gesellschaft Zur Forderung Der Wissenschaften | Coherent periodically pulsed radiation spectrometer |
| EP3361234A1 (en) * | 2017-02-14 | 2018-08-15 | Nokia Technologies Oy | A method and apparatus for spectroscopy |
-
2020
- 2020-02-11 EP EP20156763.3A patent/EP3865851A1/en not_active Withdrawn
Patent Citations (2)
| Publication number | Priority date | Publication date | Assignee | Title |
|---|---|---|---|---|
| US5748309A (en) | 1994-10-20 | 1998-05-05 | Max-Planck-Gesellschaft Zur Forderung Der Wissenschaften | Coherent periodically pulsed radiation spectrometer |
| EP3361234A1 (en) * | 2017-02-14 | 2018-08-15 | Nokia Technologies Oy | A method and apparatus for spectroscopy |
Non-Patent Citations (6)
| Title |
|---|
| I. SADIEK ET AL.: "Conference Proceedings", 2019, CLEO, article "Optical Frequency Comb Photoacoustic Spectroscopy" |
| J. UOTILA ET AL.: "Fourier transform infrared measurement of solid-, liquid-, and gas-phase samples with a single photoacoustic cell", APPL. SPECTROSC., vol. 62, 2008, pages 655 - 660 |
| MARTIN-MATEOS PEDRO ET AL: "Dual-Comb Architecture for Fast Spectroscopic Measurements and Spectral Characterization", IEEE PHOTONICS TECHNOLOGY LETTERS, IEEE SERVICE CENTER, PISCATAWAY, NJ, US, vol. 27, no. 12, 15 June 2015 (2015-06-15), pages 1309 - 1312, XP011582746, ISSN: 1041-1135, [retrieved on 20150527], DOI: 10.1109/LPT.2015.2421276 * |
| PEDRO MARTÍN-MATEOS ET AL: "Electro-Optic Dual Optical Frequency Combs: New Architectures and Opportunities Beyond Spectroscopy", LIGHT, ENERGY AND THE ENVIRONMENT, 2016, Washington, D.C., pages FM4D.3, XP055708294, ISBN: 978-0-9600380-4-6, DOI: 10.1364/FTS.2016.FM4D.3 * |
| PEDRO MARTÍN-MATEOS ET AL: "Frequency accurate coherent electro-optic dual-comb spectroscopy in real-time", OPTICS EXPRESS, vol. 26, no. 8, 16 April 2018 (2018-04-16), pages 9700 - 188, XP055643218, DOI: 10.1364/OE.26.009700 * |
| SADIEK IBRAHIM ET AL: "Optical Frequency Comb Photoacoustic Spectroscopy", 2019 CONFERENCE ON LASERS AND ELECTRO-OPTICS (CLEO), OSA, 5 May 2019 (2019-05-05), pages 1 - 2, XP033569776, DOI: 10.23919/CLEO.2019.8749688 * |
Cited By (4)
| Publication number | Priority date | Publication date | Assignee | Title |
|---|---|---|---|---|
| CN113552071A (en) * | 2021-08-26 | 2021-10-26 | 天津大学 | A photoacoustic imaging system |
| CN114018829A (en) * | 2021-10-27 | 2022-02-08 | 国网四川省电力公司电力科学研究院 | Tuning fork resonance enhanced double-optical comb multi-component gas detection system |
| CN114018829B (en) * | 2021-10-27 | 2024-05-10 | 国网四川省电力公司电力科学研究院 | Double-optical comb multicomponent gas detection system with tuning fork resonance enhancement |
| CN116678831A (en) * | 2023-06-01 | 2023-09-01 | 山西大学 | A resonant dual-comb photoacoustic spectroscopy system and method based on phase compensation |
Similar Documents
| Publication | Publication Date | Title |
|---|---|---|
| US10197442B2 (en) | Dual-comb spectroscopy with a free-running bidirectionally mode-locked fiber laser | |
| CN102246016B (en) | There is the Fourier transform spectrometer, of frequency comb light source | |
| US8642982B2 (en) | Fast switching arbitrary frequency light source for broadband spectroscopic applications | |
| CN102576971A (en) | Optical signal processing with modelocked lasers | |
| CN215339483U (en) | Gas molecule absorption signal enhancement system | |
| CN111829981B (en) | Gas heterodyne detection device and detection method based on TDLAS | |
| CN114136921B (en) | A laser photoacoustic spectroscopy gas detection device and method based on acousto-optic frequency shift locking technology | |
| WO2007092408A2 (en) | Method and apparatus for conducting heterodyne frequency-comb spectroscopy | |
| CN115615949B (en) | A trigger signal generating device and acquisition system for terahertz pulse acquisition | |
| GB2536187A (en) | Spectroscopic apparatus and method | |
| Chen et al. | Upconversion mid-infrared dual-comb spectroscopy | |
| Yang et al. | Dynamic spectroscopic characterization for fast spectral variations based on dual asynchronous undersampling with triple optical frequency combs | |
| WO2023112909A1 (en) | Time-stretch optical measurement instrument and time-stretch spectroscopy | |
| CN118783227B (en) | Ultrafast optical parametric oscillator cavity length locking device, laser and locking method | |
| Monroy et al. | Low-cost dual-comb spectrometer for CO2 monitoring based on gain-switched semiconductor lasers | |
| Bonilla-Manrique et al. | High-resolution optical thickness measurement based on electro-optic dual-optical frequency comb sources | |
| JP7731097B2 (en) | Single-comb spectrometer | |
| CN119845889B (en) | A frequency-shifted filtering spectrum measurement method and system based on modulated microcavity optical comb | |
| Othman et al. | MEMS-based Fourier transform spectrometer using pulsed infrared light source | |
| CN116698786B (en) | A dual-level modulation absorption spectroscopy gas detection system and method based on optical frequency comb | |
| Soundararajan et al. | Real-time TWOS spectroscopy with sub-GHz resolution and high sensitivity | |
| Olayemi et al. | Dual Optical Frequency Comb Interrogation of Long Period Grating Sensors | |
| Ruiz-Llata et al. | Dual-comb photoacoustic spectroscopy with electro-optic generation for the analysis of gaseous samples | |
| Chen et al. | Fast Infrared Imaging | |
| Preda et al. | Broadband fourier-transform pump-probe and stimulated Raman scattering at megahertz modulation frequencies |
Legal Events
| Date | Code | Title | Description |
|---|---|---|---|
| PUAI | Public reference made under article 153(3) epc to a published international application that has entered the european phase |
Free format text: ORIGINAL CODE: 0009012 |
|
| STAA | Information on the status of an ep patent application or granted ep patent |
Free format text: STATUS: THE APPLICATION HAS BEEN PUBLISHED |
|
| AK | Designated contracting states |
Kind code of ref document: A1 Designated state(s): AL AT BE BG CH CY CZ DE DK EE ES FI FR GB GR HR HU IE IS IT LI LT LU LV MC MK MT NL NO PL PT RO RS SE SI SK SM TR |
|
| STAA | Information on the status of an ep patent application or granted ep patent |
Free format text: STATUS: THE APPLICATION IS DEEMED TO BE WITHDRAWN |
|
| 18D | Application deemed to be withdrawn |
Effective date: 20220219 |