EP3859323A1 - Method, device, and program for detecting degree of hybridization of nucleic acid - Google Patents
Method, device, and program for detecting degree of hybridization of nucleic acid Download PDFInfo
- Publication number
- EP3859323A1 EP3859323A1 EP19867756.9A EP19867756A EP3859323A1 EP 3859323 A1 EP3859323 A1 EP 3859323A1 EP 19867756 A EP19867756 A EP 19867756A EP 3859323 A1 EP3859323 A1 EP 3859323A1
- Authority
- EP
- European Patent Office
- Prior art keywords
- current value
- oxidation wave
- potential
- nucleic acid
- degree
- Prior art date
- Legal status (The legal status is an assumption and is not a legal conclusion. Google has not performed a legal analysis and makes no representation as to the accuracy of the status listed.)
- Withdrawn
Links
- 238000009396 hybridization Methods 0.000 title claims description 31
- 238000000034 method Methods 0.000 title claims description 21
- 108020004707 nucleic acids Proteins 0.000 title claims description 11
- 102000039446 nucleic acids Human genes 0.000 title claims description 11
- 150000007523 nucleic acids Chemical class 0.000 title claims description 11
- 230000003647 oxidation Effects 0.000 claims abstract description 112
- 238000007254 oxidation reaction Methods 0.000 claims abstract description 112
- 238000007899 nucleic acid hybridization Methods 0.000 claims description 41
- 238000005259 measurement Methods 0.000 claims description 32
- 239000002679 microRNA Substances 0.000 claims description 19
- 108091070501 miRNA Proteins 0.000 claims 1
- 238000001075 voltammogram Methods 0.000 description 29
- 108700011259 MicroRNAs Proteins 0.000 description 18
- 238000010586 diagram Methods 0.000 description 18
- 239000000523 sample Substances 0.000 description 13
- 238000004445 quantitative analysis Methods 0.000 description 9
- 238000004458 analytical method Methods 0.000 description 4
- 238000002484 cyclic voltammetry Methods 0.000 description 4
- 230000006870 function Effects 0.000 description 4
- 108020004414 DNA Proteins 0.000 description 3
- 102000053602 DNA Human genes 0.000 description 3
- NRNCYVBFPDDJNE-UHFFFAOYSA-N pemoline Chemical compound O1C(N)=NC(=O)C1C1=CC=CC=C1 NRNCYVBFPDDJNE-UHFFFAOYSA-N 0.000 description 3
- 229920002477 rna polymer Polymers 0.000 description 3
- 108091093037 Peptide nucleic acid Proteins 0.000 description 2
- 238000013459 approach Methods 0.000 description 2
- 239000008280 blood Substances 0.000 description 2
- 210000004369 blood Anatomy 0.000 description 2
- 238000004891 communication Methods 0.000 description 2
- 239000000470 constituent Substances 0.000 description 2
- 239000003550 marker Substances 0.000 description 2
- 239000008363 phosphate buffer Substances 0.000 description 2
- 238000012545 processing Methods 0.000 description 2
- BAZAXWOYCMUHIX-UHFFFAOYSA-M sodium perchlorate Chemical compound [Na+].[O-]Cl(=O)(=O)=O BAZAXWOYCMUHIX-UHFFFAOYSA-M 0.000 description 2
- 229910001488 sodium perchlorate Inorganic materials 0.000 description 2
- 230000005540 biological transmission Effects 0.000 description 1
- 230000000295 complement effect Effects 0.000 description 1
- 238000010276 construction Methods 0.000 description 1
- 238000001903 differential pulse voltammetry Methods 0.000 description 1
- 230000000694 effects Effects 0.000 description 1
- 108090000623 proteins and genes Proteins 0.000 description 1
- 230000035945 sensitivity Effects 0.000 description 1
- 239000007787 solid Substances 0.000 description 1
Images



Classifications
-
- C—CHEMISTRY; METALLURGY
- C12—BIOCHEMISTRY; BEER; SPIRITS; WINE; VINEGAR; MICROBIOLOGY; ENZYMOLOGY; MUTATION OR GENETIC ENGINEERING
- C12Q—MEASURING OR TESTING PROCESSES INVOLVING ENZYMES, NUCLEIC ACIDS OR MICROORGANISMS; COMPOSITIONS OR TEST PAPERS THEREFOR; PROCESSES OF PREPARING SUCH COMPOSITIONS; CONDITION-RESPONSIVE CONTROL IN MICROBIOLOGICAL OR ENZYMOLOGICAL PROCESSES
- C12Q1/00—Measuring or testing processes involving enzymes, nucleic acids or microorganisms; Compositions therefor; Processes of preparing such compositions
- C12Q1/68—Measuring or testing processes involving enzymes, nucleic acids or microorganisms; Compositions therefor; Processes of preparing such compositions involving nucleic acids
- C12Q1/6813—Hybridisation assays
- C12Q1/6816—Hybridisation assays characterised by the detection means
- C12Q1/6825—Nucleic acid detection involving sensors
-
- G—PHYSICS
- G01—MEASURING; TESTING
- G01N—INVESTIGATING OR ANALYSING MATERIALS BY DETERMINING THEIR CHEMICAL OR PHYSICAL PROPERTIES
- G01N27/00—Investigating or analysing materials by the use of electric, electrochemical, or magnetic means
- G01N27/26—Investigating or analysing materials by the use of electric, electrochemical, or magnetic means by investigating electrochemical variables; by using electrolysis or electrophoresis
- G01N27/28—Electrolytic cell components
- G01N27/30—Electrodes, e.g. test electrodes; Half-cells
- G01N27/327—Biochemical electrodes, e.g. electrical or mechanical details for in vitro measurements
- G01N27/3275—Sensing specific biomolecules, e.g. nucleic acid strands, based on an electrode surface reaction
- G01N27/3276—Sensing specific biomolecules, e.g. nucleic acid strands, based on an electrode surface reaction being a hybridisation with immobilised receptors
-
- G—PHYSICS
- G01—MEASURING; TESTING
- G01N—INVESTIGATING OR ANALYSING MATERIALS BY DETERMINING THEIR CHEMICAL OR PHYSICAL PROPERTIES
- G01N27/00—Investigating or analysing materials by the use of electric, electrochemical, or magnetic means
- G01N27/26—Investigating or analysing materials by the use of electric, electrochemical, or magnetic means by investigating electrochemical variables; by using electrolysis or electrophoresis
- G01N27/28—Electrolytic cell components
- G01N27/30—Electrodes, e.g. test electrodes; Half-cells
- G01N27/327—Biochemical electrodes, e.g. electrical or mechanical details for in vitro measurements
- G01N27/3275—Sensing specific biomolecules, e.g. nucleic acid strands, based on an electrode surface reaction
- G01N27/3277—Sensing specific biomolecules, e.g. nucleic acid strands, based on an electrode surface reaction being a redox reaction, e.g. detection by cyclic voltammetry
-
- G—PHYSICS
- G01—MEASURING; TESTING
- G01N—INVESTIGATING OR ANALYSING MATERIALS BY DETERMINING THEIR CHEMICAL OR PHYSICAL PROPERTIES
- G01N27/00—Investigating or analysing materials by the use of electric, electrochemical, or magnetic means
- G01N27/26—Investigating or analysing materials by the use of electric, electrochemical, or magnetic means by investigating electrochemical variables; by using electrolysis or electrophoresis
- G01N27/416—Systems
- G01N27/48—Systems using polarography, i.e. measuring changes in current under a slowly-varying voltage
Definitions
- the present invention relates to a method, a device and a program for detecting a degree of nucleic acid hybridization.
- Hybridization is often used to detect nucleic acids (such as deoxyribonucleic acid (DNA) or ribonucleic acid (RNA)) that have specific sequences. Nucleic acids hybridize to probes that have sequences complementary to sequences of the nucleic acids. The degree of nucleic acid hybridization can be quantitatively analyzed using an electrochemical approach.
- nucleic acids such as deoxyribonucleic acid (DNA) or ribonucleic acid (RNA)
- RNA ribonucleic acid
- NPL 1 describes an example of a method for quantitatively analyzing a degree of nucleic acid hybridization using an electrochemical approach.
- a sample containing microRNA miRNA
- CV cyclic voltammetry
- the current value I 0 for the pre-hybridization voltammogram (a pre-hybridization oxidation wave voltammogram has a peak current value I 0 at potential Ep 0 ) and the current value I for the potential Ep 0 of the post-hybridization oxidation wave voltammogram are measured for identical work electrodes, the current value I is smaller than the peak current value I 0 . Therefore, the ratio I/I 0 of the current value I with respect to the peak current value I 0 can function as an indicator for quantitative analysis of a degree of nucleic acid hybridization.
- NPL 1 Gene sensors based on peptide nucleic acid (PNA) probes: Relationship between sensor sensitivity and probe/target duplex stability. Analyst, 2005, 130, 1478-82 .
- the present inventors have investigated methods of quantitatively analyzing a degree of nucleic acid hybridization using a novel indicator which is different from the indicator described in NPL 1 (the relationship between the peak current value I 0 and current value I).
- the peak current value I 0 and current value I are essentially equal (such as when the amounts of nucleic acids in each sample are very small or when virtually no hybridization has taken place), for example, it is difficult to accurately calculate the relationship (for example, the ratio or difference) between the peak current value I 0 and current value I, and it is difficult to use the relationship between the peak current value I 0 and current value I for high-precision quantitative analysis of a degree of nucleic acid hybridization.
- One object of the invention is to obtain a novel indicator for quantitative analysis of a degree of nucleic acid hybridization.
- Other objects of the invention will become apparent from the description throughout the present specification.
- One aspect of the invention is a method for detecting a degree of nucleic acid hybridization using a first oxidation wave and a second oxidation wave, wherein: the method includes calculating the potential difference between a first potential at which, in the first oxidation wave, a first current value is obtained in a range below the potential for the peak current value of the first oxidation wave, and a second potential at which, in the second oxidation wave, a first current value is obtained in a range below the potential for the peak current value of the second oxidation wave.
- Another aspect of the invention is a device for detecting a degree of nucleic acid hybridization using a first oxidation wave and a second oxidation wave, wherein: the device comprises a calculator which calculates the potential difference between a first potential at which, in the first oxidation wave, a first current value is obtained in a range below the potential for the peak current value of the first oxidation wave, and a second potential at which, in the second oxidation wave, a first current value is obtained in a range below the potential for the peak current value of the second oxidation wave.
- Yet another aspect of the invention is a program that causes a computer to function as a device for detecting a degree of nucleic acid hybridization using a first oxidation wave and a second oxidation wave, wherein: the program causes the computer to: calculate the potential difference between a first potential at which, in the first oxidation wave, a first current value is obtained in a range below the potential for the peak current value of the first oxidation wave, and a second potential at which, in the second oxidation wave, a first current value is obtained in a range below the potential for the peak current value of the second oxidation wave.
- the calculator 100, determiner 110 and memory 120 are shown not as hardware unit configurations but rather as functional unit blocks.
- the calculator 100, determiner 110 and memory 120 are provided by an optional combination of hardware and software, which may essentially be any type of computer CPU, a memory, a program that forms the constituent elements in the diagram that are loaded into the memory, a storage medium such as a hard disk that stores the program, and a network connection interface.
- a variety of different modified examples for the method and device are possible.
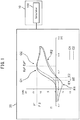
- Fig. 1 is a diagram illustrating a device 10 according to embodiment 1.
- the ordinate represents the current (nA) for the voltammogram and the abscissa represents potential (V) for the voltammogram.
- the device 10 uses a first oxidation wave O1 and a second oxidation wave O2 to detect the degree of nucleic acid hybridization.
- the device 10 includes a calculator 100.
- the calculator 100 calculates the potential difference ⁇ E between the first potential E1 of the first oxidation wave O1 and the second potential E2 of the second oxidation wave O2.
- the first potential E1 has a first current value I1 in a range of less than the potential Ep 0 at the peak current value I 0 of the first oxidation wave O1.
- the second potential E2 has a first current value I1 in a range of less than the potential Ep 0' at the peak current value I 0' of the second oxidation wave O2.
- this configuration allows the potential difference ⁇ E to be calculated by the calculator 100. As explained below, the potential difference ⁇ E can serve as an indicator for quantitative analysis of the degree of nucleic acid hybridization.
- this configuration does not require calculation of the relationship (for example, the ratio or difference) between the peak current value I 0 and current value I, even when the peak current value I 0 of the first oxidation wave O1 and the current value I of the second oxidation wave O2 (the second oxidation wave O2 has a second current value (current value I) at the potential Ep 0 for the peak current value I 0 of the first oxidation wave O1), are essentially equal.
- the peak current value I 0 of the first oxidation wave O1 and the current value I of the second oxidation wave O2 are essentially equal, it is possible to quantitatively analyze the degree of nucleic acid hybridization to a high degree of precision.
- the potential difference ⁇ E can be calculated even when the peak current value I 0 of the first oxidation wave O1 and the current value I of the second oxidation wave O2 are essentially equal, such as when the current value I of the second oxidation wave O2 is 90% to 110% of the peak current value I 0 of the first oxidation wave O1.
- Fig. 1 will now be used for a more detailed explanation of the device 10.
- the measurement system 20 measures a voltammogram C1 and a voltammogram C2 by cyclic voltammetry (CV).
- the voltammogram C1 includes the first oxidation wave O1 and a first reduction wave R1.
- the voltammogram C2 includes the second oxidation wave O2 and a second reduction wave R2.
- the measurement system 20 may measure each voltammogram by a method other than CV, such as differential pulse voltammetry (DPV).
- each voltammogram includes an oxidation wave.
- the potential difference ⁇ E can therefore be calculated by the same method as explained using Fig. 1 .
- the measurement system 20 has an electrode (work electrode) for measurement of the voltammogram C1 and voltammogram C2.
- the measurement system 20 may also have multiple electrodes (multiple work electrodes).
- the calculator 100 will be able to calculate multiple potential differences ⁇ E respectively for the multiple electrodes.
- the calculator 100 may statistically process the multiple potential differences ⁇ E, by calculating the median or average for the multiple potential differences ⁇ E, for example.
- the first oxidation wave O1 represents the measurement results for a sample before hybridization while the second oxidation wave O2 represents the measurement results for the sample after the hybridization.
- the sample before hybridization may include a probe immobilized on the electrode (work electrode) of the measurement system (the sample before hybridization may or may not include nucleic acids), and the sample after the hybridization may include nucleic acids hybridized to the probe.
- the first oxidation wave O1 and the second oxidation wave O2 represent measurement results for microRNA (miRNA).
- the miRNA may be extracted from blood. It is generally difficult to obtain a sample which contains a large amount of miRNA from blood. Therefore, changes in the miRNA voltammogram (such as oxidation wave) due to hybridization can be extremely small. It may therefore be difficult to quantitatively analyze a degree of miRNA hybridization using the relationship (for example, the ratio or difference) between the peak current value I 0 and current value I. If the example shown in Fig. 1 is used, however, a clear potential difference ⁇ E can be produced even in the case of miRNA hybridization. It is thus possible to quantitative analyze the degree of miRNA hybridization to a high degree of precision.
- each oxidation wave may represent measurement results for other type of nucleic acid than miRNA.
- it may represent measurement results for DNA or it may represent measurement results for other RNA than miRNA.
- the user of the device 10 may appropriately determine the first current value I1 depending on different conditions (such as the first oxidation wave O1 and the second oxidation wave O2).
- the first current value I1 may be selected from a range of current values in which variation (such as standard deviation) in the potential difference ⁇ E is kept to within a fixed range, and for example, it may be 10% to 90% of the peak current value I 0 of the first oxidation wave O1 (a potential difference ⁇ E of within 10% to 90% of the peak current value I 0 of the first oxidation wave O1, for example, is kept to within a fixed range from the mean value for the potential difference ⁇ E at 10% to 90% of the peak current value I 0 of the first oxidation wave O1, at any current value).
- the calculator 100 may also calculate the potential difference ⁇ E for a plurality of current value ratios I1/I 0 (for example, current value ratios I1/I 0 of 0.20, 0.30 and 0.40).
- the calculator 100 may statistically process the multiple potential differences ⁇ E, such as calculating the median or average for the multiple potential differences ⁇ E.
- the potential of an electrode (work electrode) in a measurement system 20 can fall due to a negative overall charge ⁇ Q produced by the hybridized target nucleic acid.
- an electrical double layer of capacitance C is formed in the work electrode.
- the reduction in potential of the work electrode can be estimated as ⁇ Q/C. Therefore, the post-hybridization oxidation wave (the second oxidation wave O2 in the example shown in Fig. 1 ) can shift toward a higher potential by ⁇ Q/C from the pre-hybridization oxidation wave (the first oxidation wave O1 in the example shown in Fig. 1 ).
- the potential difference ⁇ E allows estimation of the amount of shift from the pre-hybridization oxidation wave (the first oxidation wave O1 in the example shown in Fig. 1 ) to the post-hybridization oxidation wave (the second oxidation wave O2 in the example shown in Fig. 1 ), which is approximately equal to ⁇ Q/C.
- the potential difference ⁇ E can thus serve as an indicator for quantitative analysis of the degree of nucleic acid hybridization.
- Fig. 2 is a diagram illustrating a device 10 according to embodiment 2.
- the device 10 of embodiment 2 is identical to the device 10 of embodiment 1, except for the following points.
- the ordinate represents the current (nA) of the voltammogram and the abscissa represents the potential (V) of the voltammogram.
- the device 10 includes a determiner 110.
- the determiner 110 determines the degree of nucleic acid hybridization based on the potential difference ⁇ E. As explained above regarding the reason for the potential difference ⁇ E, the degree of nucleic acid hybridization is greater with a larger potential difference ⁇ E and lower with a smaller potential difference ⁇ E. The determiner 110 therefore determines that the degree of nucleic acid hybridization is greater with a larger potential difference ⁇ E and the degree of nucleic acid hybridization is lower with a smaller potential difference ⁇ E.
- the device 10 also includes a memory 120. As explained below for Fig. 3 , the determiner 110 may determine the degree of nucleic acid hybridization by comparing data representing the potential difference ⁇ E with reference data stored in the memory 120.
- Fig. 3 is a diagram illustrating an example of reference data stored in the memory 120 shown in Fig. 2 .
- the reference data indicates degrees of nucleic acid hybridization ( ⁇ H1, ⁇ H2, ⁇ H3, ... in the right column of Fig. 3 ) and their matching potential differences ( ⁇ E1, ⁇ E2, ⁇ E3, ... in the left column of Fig. 3 ).
- the reference data can be generated beforehand by measurement using the measurement system 20 shown in Fig. 2 .
- the determiner 110 shown in Fig. 2 may also compare the potential difference ⁇ E obtained from the measurement system 20 with the reference data shown in Fig. 3 .
- the determiner 110 may determine the degree of nucleic acid hybridization based on this comparison.
- Fig. 4 is a diagram showing the hardware configuration of a device 10.
- the device 10 includes a bus 11, processor 12, memory 13, storage device 14 and network interface 15.
- the bus 11 is a data transmission line for sending and receiving of data between the processor 12, memory 13, storage device 14 and network interface 15.
- the method of connection between the processor 12, memory 13, storage device 14 and network interface 15 is not limited to being a bus connection.
- the processor 12 is a computing device such as a CPU (Central Processing Unit) or GPU (Graphics Processing Unit).
- the memory 13 is a main memory unit such as a RAM (Random Access Memory) or ROM (Read Only Memory).
- the storage device 14 is an auxiliary storage device such as an HDD (Hard Disk Drive), SSD (Solid State Drive) or memory card.
- the storage device 14 stores a program module that carries out the functions of the device 10 (for the calculator 100, determiner 110 or memory 120).
- the processor 12 executes each program module by reading from a memory 13, and carries out the function corresponding to each program module.
- the network interface 15 is an interface for connection of the device 10 with a communication network such as a LAN (Local Area Network) or WAN (Wide Area Network).
- the device 10 is able to communicate with the measurement system 20 by connection to the communication network via the network interface 15.
- the device 10 may be connected to the measurement system 20 through a wireless network or it may be connected to the measurement system 20 through a wired network.
- data obtained at the measurement system 20 may be stored in a storage device (for example, a USB flash drive), and the device 10 may analyze the data stored in the storage device.
- Fig. 5 is a diagram showing the first modified example of Fig. 1 .
- the ordinate represents the current (nA) of the voltammogram and the abscissa represents the potential (V) of the voltammogram.
- the device 10 may include a measurement system 20.
- the device 10 may not only analyze the potential difference ⁇ E but may also measure the voltammogram C1 and the voltammogram C2.
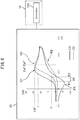
- Fig. 6 is a diagram showing the second modified example of Fig. 1 .
- the ordinate represents the current (nA) of the voltammogram and the abscissa represents the potential (V) of the voltammogram.
- the example shown in Fig. 6 differs from the example of Fig. 1 in terms of the graph in the measurement system 20.
- the calculator 100 is able to calculate the potential difference ⁇ E in the same manner as the method described in relation to Fig. 1 .
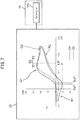
- Fig. 7 is a diagram showing the third modified example of Fig. 1 .
- the ordinate represents the current (nA) of the voltammogram and the abscissa represents the potential (V) of the voltammogram.
- the device 10 can also detect the degree of nucleic acid hybridization using the first reduction wave R1 and the second reduction wave R2 instead of the first oxidation wave O1 and the second oxidation wave O2.
- the device 10 includes a calculator 100.
- the calculator 100 calculates the potential difference ' ⁇ E between the first potential 'E1 of the first reduction wave R1 and the second potential 'E2 of the second reduction wave R2.
- the first reduction wave R1 the first potential 'E1 has a first current value 'I1 in a range of greater than the potential 'Ep 0 at the peak current value 'I 0 of the first reduction wave R1.
- the second potential 'E2 has a first current value 'I1 in a range of greater than the potential 'Ep 0' at the peak current value 'I 0' of the second reduction wave R2.
- the potential difference ' ⁇ E for the first reduction wave R1 and the second reduction wave R2 can be estimated as the degree of shift from the pre-hybridization reduction wave (the first reduction wave R1 in the example shown in Fig. 7 ) to the post-hybridization reduction wave (the second reduction wave R2 in the example shown in Fig. 7 ), similar to the potential difference ⁇ E for the first oxidation wave O1 and the second oxidation wave O2. Therefore, the potential difference ' ⁇ E for the first reduction wave R1 and the second reduction wave R2 can serve as an indicator for quantitative analysis of the degree of nucleic acid hybridization, similar to the potential difference ⁇ E for the first oxidation wave O1 and the second oxidation wave O2.
- the second reduction wave R2 has a current value 'I for the potential 'Ep 0 at the peak current value 'I 0 of the first reduction wave R1.
- Fig. 8 is a diagram showing the correlation between miRNA hybridization analysis using the current value ratio I/I 0 and miRNA hybridization analysis using the potential difference ⁇ E.
- the ordinate represents current value ratio I/I 0
- the abscissa represents potential difference ⁇ E.
- the peak current ratio I/I 0 and potential difference ⁇ E were calculated under the following conditions.
- the median of the current value ratio I/I 0 was 1.0205. This shows that the current value I of the second oxidation wave O2 was essentially equivalent to the peak current value I 0 of the first oxidation wave O1. It can therefore be difficult to quantitatively analyze the degree of nucleic acid hybridization to a high degree of precision using the current value ratio I/I 0 .
- the median of the potential difference ⁇ E was 35 mV. A potential difference ⁇ E on this level can be considered to be distinctly apparent. It is therefore concluded that the degree of nucleic acid hybridization can be quantitatively analyzed to high precision using the potential difference ⁇ E.
Landscapes
- Life Sciences & Earth Sciences (AREA)
- Chemical & Material Sciences (AREA)
- Health & Medical Sciences (AREA)
- Molecular Biology (AREA)
- Physics & Mathematics (AREA)
- Analytical Chemistry (AREA)
- Biochemistry (AREA)
- Immunology (AREA)
- General Health & Medical Sciences (AREA)
- Chemical Kinetics & Catalysis (AREA)
- General Physics & Mathematics (AREA)
- Pathology (AREA)
- Electrochemistry (AREA)
- Organic Chemistry (AREA)
- Spectroscopy & Molecular Physics (AREA)
- Zoology (AREA)
- Proteomics, Peptides & Aminoacids (AREA)
- Engineering & Computer Science (AREA)
- Wood Science & Technology (AREA)
- Microbiology (AREA)
- Biotechnology (AREA)
- Biophysics (AREA)
- Bioinformatics & Cheminformatics (AREA)
- General Engineering & Computer Science (AREA)
- Genetics & Genomics (AREA)
- Measuring Or Testing Involving Enzymes Or Micro-Organisms (AREA)
- Apparatus Associated With Microorganisms And Enzymes (AREA)
Abstract
Description
- The present invention relates to a method, a device and a program for detecting a degree of nucleic acid hybridization.
- Hybridization is often used to detect nucleic acids (such as deoxyribonucleic acid (DNA) or ribonucleic acid (RNA)) that have specific sequences. Nucleic acids hybridize to probes that have sequences complementary to sequences of the nucleic acids. The degree of nucleic acid hybridization can be quantitatively analyzed using an electrochemical approach.
- NPL 1 describes an example of a method for quantitatively analyzing a degree of nucleic acid hybridization using an electrochemical approach. In this case, a sample containing microRNA (miRNA) is used in cyclic voltammetry (CV) to obtain a pre-hybridization voltammogram (oxidation wave and reduction wave) and a post-hybridization voltammogram (oxidation wave and reduction wave). When the peak current value I0 for the pre-hybridization voltammogram (a pre-hybridization oxidation wave voltammogram has a peak current value I0 at potential Ep0) and the current value I for the potential Ep0 of the post-hybridization oxidation wave voltammogram are measured for identical work electrodes, the current value I is smaller than the peak current value I0. Therefore, the ratio I/I0 of the current value I with respect to the peak current value I0 can function as an indicator for quantitative analysis of a degree of nucleic acid hybridization.
- [NPL 1] Gene sensors based on peptide nucleic acid (PNA) probes: Relationship between sensor sensitivity and probe/target duplex stability. Analyst, 2005, 130, 1478-82.
- The present inventors have investigated methods of quantitatively analyzing a degree of nucleic acid hybridization using a novel indicator which is different from the indicator described in NPL 1 (the relationship between the peak current value I0 and current value I). When the peak current value I0 and current value I are essentially equal (such as when the amounts of nucleic acids in each sample are very small or when virtually no hybridization has taken place), for example, it is difficult to accurately calculate the relationship (for example, the ratio or difference) between the peak current value I0 and current value I, and it is difficult to use the relationship between the peak current value I0 and current value I for high-precision quantitative analysis of a degree of nucleic acid hybridization. Also, when it is difficult to accurately measure the peak current value I0 (such as when the voltammogram near the peak current value I0 is not steep, thus resulting in a wide range of potentials in which the peak current value I0 and current values near the peak current value I0 are obtained, and making it difficult to establish a unique potential Ep0), it becomes difficult to accurately calculate the relationship (for example, the ratio or difference) between the peak current value I0 and current value I, and it is difficult to use the relationship between the peak current value I0 and current value I for high-precision quantitative analysis of a degree of nucleic acid hybridization.
- One object of the invention is to obtain a novel indicator for quantitative analysis of a degree of nucleic acid hybridization. Other objects of the invention will become apparent from the description throughout the present specification.
- One aspect of the invention is a method for detecting a degree of nucleic acid hybridization using a first oxidation wave and a second oxidation wave, wherein:
the method includes calculating the potential difference between a first potential at which, in the first oxidation wave, a first current value is obtained in a range below the potential for the peak current value of the first oxidation wave, and a second potential at which, in the second oxidation wave, a first current value is obtained in a range below the potential for the peak current value of the second oxidation wave. - Another aspect of the invention is a device for detecting a degree of nucleic acid hybridization using a first oxidation wave and a second oxidation wave, wherein:
the device comprises a calculator which calculates the potential difference between a first potential at which, in the first oxidation wave, a first current value is obtained in a range below the potential for the peak current value of the first oxidation wave, and a second potential at which, in the second oxidation wave, a first current value is obtained in a range below the potential for the peak current value of the second oxidation wave. - Yet another aspect of the invention is a program that causes a computer to function as a device for detecting a degree of nucleic acid hybridization using a first oxidation wave and a second oxidation wave, wherein:
the program causes the computer to:
calculate the potential difference between a first potential at which, in the first oxidation wave, a first current value is obtained in a range below the potential for the peak current value of the first oxidation wave, and a second potential at which, in the second oxidation wave, a first current value is obtained in a range below the potential for the peak current value of the second oxidation wave. - According to the aforementioned aspects of the invention it is possible to obtain a novel indicator for quantitative analysis of a degree of nucleic acid hybridization.
-
-
Fig. 1 is a diagram illustrating a device according toembodiment 1. -
Fig. 2 is a diagram illustrating a device according to embodiment 2. -
Fig. 3 is a diagram illustrating an example of reference data stored in the memory shown inFig. 2 . -
Fig. 4 is a diagram showing the hardware configuration of a device. -
Fig. 5 is a diagram showing a first modified example ofFig. 1 . -
Fig. 6 is a diagram showing a second modified example ofFig. 1 . -
Fig. 7 is a diagram showing a third modified example ofFig. 1 . -
Fig. 8 is a diagram showing the correlation between miRNA hybridization analysis using the current value ratio I/I0 and miRNA hybridization analysis using the potential difference ΔE. - Embodiments of the invention will now be described with reference to the accompanying drawings. In all of the diagrams, corresponding constituent elements are indicated using like reference numerals and will not be redundantly explained.
- In the following explanation, the
calculator 100,determiner 110 andmemory 120 are shown not as hardware unit configurations but rather as functional unit blocks. Thecalculator 100,determiner 110 andmemory 120 are provided by an optional combination of hardware and software, which may essentially be any type of computer CPU, a memory, a program that forms the constituent elements in the diagram that are loaded into the memory, a storage medium such as a hard disk that stores the program, and a network connection interface. A variety of different modified examples for the method and device are possible. -
Fig. 1 is a diagram illustrating adevice 10 according toembodiment 1. In the graph in themeasurement system 20 ofFig. 1 , the ordinate represents the current (nA) for the voltammogram and the abscissa represents potential (V) for the voltammogram. -
Fig. 1 will now be used for general explanation of thedevice 10. Thedevice 10 uses a first oxidation wave O1 and a second oxidation wave O2 to detect the degree of nucleic acid hybridization. Thedevice 10 includes acalculator 100. Thecalculator 100 calculates the potential difference ΔE between the first potential E1 of the first oxidation wave O1 and the second potential E2 of the second oxidation wave O2. In the first oxidation wave O1, the first potential E1 has a first current value I1 in a range of less than the potential Ep0 at the peak current value I0 of the first oxidation wave O1. In the second oxidation wave O2, the second potential E2 has a first current value I1 in a range of less than the potential Ep0' at the peak current value I0' of the second oxidation wave O2. - With this configuration it is possible to obtain a novel indicator for quantitative analysis of the degree of nucleic acid hybridization. Specifically, this configuration allows the potential difference ΔE to be calculated by the
calculator 100. As explained below, the potential difference ΔE can serve as an indicator for quantitative analysis of the degree of nucleic acid hybridization. - Moreover, this configuration does not require calculation of the relationship (for example, the ratio or difference) between the peak current value I0 and current value I, even when the peak current value I0 of the first oxidation wave O1 and the current value I of the second oxidation wave O2 (the second oxidation wave O2 has a second current value (current value I) at the potential Ep0 for the peak current value I0 of the first oxidation wave O1), are essentially equal. Thus, even when the peak current value I0 of the first oxidation wave O1 and the current value I of the second oxidation wave O2 are essentially equal, it is possible to quantitatively analyze the degree of nucleic acid hybridization to a high degree of precision.
- According to one example, the potential difference ΔE can be calculated even when the peak current value I0 of the first oxidation wave O1 and the current value I of the second oxidation wave O2 are essentially equal, such as when the current value I of the second oxidation wave O2 is 90% to 110% of the peak current value I0 of the first oxidation wave O1.
- In addition, with the aforementioned configuration it is not necessary to calculate the relationship (for example, the ratio or difference) between the peak current value I0 and current value I, even when it is difficult to accurately measure the peak current value I0 of the first oxidation wave O1 (such as when the first oxidation wave O1 near the peak current value I0 is not steep, thus resulting in a wide range of potentials in which the peak current value I0 and current values near the peak current value I0 are obtained, and making it difficult to establish a unique potential Ep0). Thus, even when it is difficult to accurately measure the peak current value I0, it is still possible to quantitatively analyze the degree of nucleic acid hybridization to a high degree of precision.
-
Fig. 1 will now be used for a more detailed explanation of thedevice 10. - In the example shown in
Fig. 1 , themeasurement system 20 measures a voltammogram C1 and a voltammogram C2 by cyclic voltammetry (CV). The voltammogram C1 includes the first oxidation wave O1 and a first reduction wave R1. The voltammogram C2 includes the second oxidation wave O2 and a second reduction wave R2. - According to another example, the
measurement system 20 may measure each voltammogram by a method other than CV, such as differential pulse voltammetry (DPV). In this example as well, each voltammogram includes an oxidation wave. The potential difference ΔE can therefore be calculated by the same method as explained usingFig. 1 . - The
measurement system 20 has an electrode (work electrode) for measurement of the voltammogram C1 and voltammogram C2. Themeasurement system 20 may also have multiple electrodes (multiple work electrodes). In this case thecalculator 100 will be able to calculate multiple potential differences ΔE respectively for the multiple electrodes. Thecalculator 100 may statistically process the multiple potential differences ΔE, by calculating the median or average for the multiple potential differences ΔE, for example. - In the example shown in
Fig. 1 , the first oxidation wave O1 represents the measurement results for a sample before hybridization while the second oxidation wave O2 represents the measurement results for the sample after the hybridization. The sample before hybridization may include a probe immobilized on the electrode (work electrode) of the measurement system (the sample before hybridization may or may not include nucleic acids), and the sample after the hybridization may include nucleic acids hybridized to the probe. - In the example shown in
Fig. 1 , the first oxidation wave O1 and the second oxidation wave O2 represent measurement results for microRNA (miRNA). The miRNA may be extracted from blood. It is generally difficult to obtain a sample which contains a large amount of miRNA from blood. Therefore, changes in the miRNA voltammogram (such as oxidation wave) due to hybridization can be extremely small. It may therefore be difficult to quantitatively analyze a degree of miRNA hybridization using the relationship (for example, the ratio or difference) between the peak current value I0 and current value I. If the example shown inFig. 1 is used, however, a clear potential difference ΔE can be produced even in the case of miRNA hybridization. It is thus possible to quantitative analyze the degree of miRNA hybridization to a high degree of precision. - According to another example, each oxidation wave may represent measurement results for other type of nucleic acid than miRNA. For example, it may represent measurement results for DNA or it may represent measurement results for other RNA than miRNA.
- The user of the
device 10 may appropriately determine the first current value I1 depending on different conditions (such as the first oxidation wave O1 and the second oxidation wave O2). - According to one example, the first current value I1 may be selected from a range of current values in which variation (such as standard deviation) in the potential difference ΔE is kept to within a fixed range, and for example, it may be 10% to 90% of the peak current value I0 of the first oxidation wave O1 (a potential difference ΔE of within 10% to 90% of the peak current value I0 of the first oxidation wave O1, for example, is kept to within a fixed range from the mean value for the potential difference ΔE at 10% to 90% of the peak current value I0 of the first oxidation wave O1, at any current value). The
calculator 100 may also calculate the potential difference ΔE for a plurality of current value ratios I1/I0 (for example, current value ratios I1/I0 of 0.20, 0.30 and 0.40). Thecalculator 100 may statistically process the multiple potential differences ΔE, such as calculating the median or average for the multiple potential differences ΔE. - The reason for the potential difference ΔE produced in
Fig. 1 will now be explained. - The potential of an electrode (work electrode) in a
measurement system 20 can fall due to a negative overall charge ΔQ produced by the hybridized target nucleic acid. During measurement of the oxidation wave, an electrical double layer of capacitance C is formed in the work electrode. The reduction in potential of the work electrode can be estimated as ΔQ/C. Therefore, the post-hybridization oxidation wave (the second oxidation wave O2 in the example shown inFig. 1 ) can shift toward a higher potential by ΔQ/C from the pre-hybridization oxidation wave (the first oxidation wave O1 in the example shown inFig. 1 ). The potential difference ΔE allows estimation of the amount of shift from the pre-hybridization oxidation wave (the first oxidation wave O1 in the example shown inFig. 1 ) to the post-hybridization oxidation wave (the second oxidation wave O2 in the example shown inFig. 1 ), which is approximately equal to ΔQ/C. The potential difference ΔE can thus serve as an indicator for quantitative analysis of the degree of nucleic acid hybridization. -
Fig. 2 is a diagram illustrating adevice 10 according to embodiment 2. Thedevice 10 of embodiment 2 is identical to thedevice 10 ofembodiment 1, except for the following points. In the graph of themeasurement system 20 ofFig. 2 , the ordinate represents the current (nA) of the voltammogram and the abscissa represents the potential (V) of the voltammogram. - The
device 10 includes adeterminer 110. Thedeterminer 110 determines the degree of nucleic acid hybridization based on the potential difference ΔE. As explained above regarding the reason for the potential difference ΔE, the degree of nucleic acid hybridization is greater with a larger potential difference ΔE and lower with a smaller potential difference ΔE. Thedeterminer 110 therefore determines that the degree of nucleic acid hybridization is greater with a larger potential difference ΔE and the degree of nucleic acid hybridization is lower with a smaller potential difference ΔE. - The
device 10 also includes amemory 120. As explained below forFig. 3 , thedeterminer 110 may determine the degree of nucleic acid hybridization by comparing data representing the potential difference ΔE with reference data stored in thememory 120. -
Fig. 3 is a diagram illustrating an example of reference data stored in thememory 120 shown inFig. 2 . - The reference data indicates degrees of nucleic acid hybridization (ΔH1, ΔH2, ΔH3, ... in the right column of
Fig. 3 ) and their matching potential differences (ΔE1, ΔE2, ΔE3, ... in the left column ofFig. 3 ). The reference data can be generated beforehand by measurement using themeasurement system 20 shown inFig. 2 . Thedeterminer 110 shown inFig. 2 may also compare the potential difference ΔE obtained from themeasurement system 20 with the reference data shown inFig. 3 . Thedeterminer 110 may determine the degree of nucleic acid hybridization based on this comparison. -
Fig. 4 is a diagram showing the hardware configuration of adevice 10. Thedevice 10 includes abus 11,processor 12,memory 13,storage device 14 andnetwork interface 15. - The
bus 11 is a data transmission line for sending and receiving of data between theprocessor 12,memory 13,storage device 14 andnetwork interface 15. However, the method of connection between theprocessor 12,memory 13,storage device 14 andnetwork interface 15 is not limited to being a bus connection. - The
processor 12 is a computing device such as a CPU (Central Processing Unit) or GPU (Graphics Processing Unit). Thememory 13 is a main memory unit such as a RAM (Random Access Memory) or ROM (Read Only Memory). Thestorage device 14 is an auxiliary storage device such as an HDD (Hard Disk Drive), SSD (Solid State Drive) or memory card. - The
storage device 14 stores a program module that carries out the functions of the device 10 (for thecalculator 100,determiner 110 or memory 120). Theprocessor 12 executes each program module by reading from amemory 13, and carries out the function corresponding to each program module. - The
network interface 15 is an interface for connection of thedevice 10 with a communication network such as a LAN (Local Area Network) or WAN (Wide Area Network). Thedevice 10 is able to communicate with themeasurement system 20 by connection to the communication network via thenetwork interface 15. Thedevice 10 may be connected to themeasurement system 20 through a wireless network or it may be connected to themeasurement system 20 through a wired network. According to another example, data obtained at the measurement system 20 (for example, the voltammogram C1 and the voltammogram C2 shown inFig. 1 ) may be stored in a storage device (for example, a USB flash drive), and thedevice 10 may analyze the data stored in the storage device. -
Fig. 5 is a diagram showing the first modified example ofFig. 1 . In the graph of themeasurement system 20 ofFig. 5 , the ordinate represents the current (nA) of the voltammogram and the abscissa represents the potential (V) of the voltammogram. - As shown in
Fig. 5 , thedevice 10 may include ameasurement system 20. In the example shown inFig. 5 , thedevice 10 may not only analyze the potential difference ΔE but may also measure the voltammogram C1 and the voltammogram C2. -
Fig. 6 is a diagram showing the second modified example ofFig. 1 . In the graph of themeasurement system 20 ofFig. 6 , the ordinate represents the current (nA) of the voltammogram and the abscissa represents the potential (V) of the voltammogram. - The example shown in
Fig. 6 differs from the example ofFig. 1 in terms of the graph in themeasurement system 20. As shown inFig. 6 , even with a large difference between the peak current value I0 of the first oxidation wave O1 and the current value I of the second oxidation wave O2 (the second oxidation wave O2 has a current value I with potential Ep0 at the peak current value I0 of the first oxidation wave O1), thecalculator 100 is able to calculate the potential difference ΔE in the same manner as the method described in relation toFig. 1 . -
Fig. 7 is a diagram showing the third modified example ofFig. 1 . In the graph of themeasurement system 20 ofFig. 7 , the ordinate represents the current (nA) of the voltammogram and the abscissa represents the potential (V) of the voltammogram. - As shown in
Fig. 7 , thedevice 10 can also detect the degree of nucleic acid hybridization using the first reduction wave R1 and the second reduction wave R2 instead of the first oxidation wave O1 and the second oxidation wave O2. Thedevice 10 includes acalculator 100. Thecalculator 100 calculates the potential difference 'ΔE between the first potential 'E1 of the first reduction wave R1 and the second potential 'E2 of the second reduction wave R2. In the first reduction wave R1, the first potential 'E1 has a first current value 'I1 in a range of greater than the potential 'Ep0 at the peak current value 'I0 of the first reduction wave R1. In the second reduction wave R2, the second potential 'E2 has a first current value 'I1 in a range of greater than the potential 'Ep0' at the peak current value 'I0' of the second reduction wave R2. - The potential difference 'ΔE for the first reduction wave R1 and the second reduction wave R2 can be estimated as the degree of shift from the pre-hybridization reduction wave (the first reduction wave R1 in the example shown in
Fig. 7 ) to the post-hybridization reduction wave (the second reduction wave R2 in the example shown inFig. 7 ), similar to the potential difference ΔE for the first oxidation wave O1 and the second oxidation wave O2. Therefore, the potential difference 'ΔE for the first reduction wave R1 and the second reduction wave R2 can serve as an indicator for quantitative analysis of the degree of nucleic acid hybridization, similar to the potential difference ΔE for the first oxidation wave O1 and the second oxidation wave O2. - In the graph shown in
Fig. 7 , the second reduction wave R2 has a current value 'I for the potential 'Ep0 at the peak current value 'I0 of the first reduction wave R1. -
Fig. 8 is a diagram showing the correlation between miRNA hybridization analysis using the current value ratio I/I0 and miRNA hybridization analysis using the potential difference ΔE. In the graph ofFig. 8 , the ordinate represents current value ratio I/I0 and the abscissa represents potential difference ΔE. - For each of 74 different measurement systems 20 (work electrodes) in the example shown in
Fig. 8 , the peak current ratio I/I0 and potential difference ΔE were calculated under the following conditions. - First oxidation wave O1: Oxidation wave before miRNA hybridization (measuring solution: 0.25 mM phosphate buffer + 0.5 mM NaClO4, marker: 1 mM [Fe(CN)6]4-)
- Second oxidation wave O2: Oxidation wave after miRNA hybridization (measuring solution: 0.25 mM phosphate buffer + 0.5 mM NaClO4, marker: 1 mM [Fe(CN)6]4-)
- CV sweep rate: 500 mV/sec
- First current value I1: 3nA (approximately 20% of peak current value I0 for each first oxidation wave O1)
- The median of the current value ratio I/I0 was 1.0205. This shows that the current value I of the second oxidation wave O2 was essentially equivalent to the peak current value I0 of the first oxidation wave O1. It can therefore be difficult to quantitatively analyze the degree of nucleic acid hybridization to a high degree of precision using the current value ratio I/I0.
- The median of the potential difference ΔE was 35 mV. A potential difference ΔE on this level can be considered to be distinctly apparent. It is therefore concluded that the degree of nucleic acid hybridization can be quantitatively analyzed to high precision using the potential difference ΔE.
- Embodiments of the invention have been described above with reference to the accompanying drawings, but it is to be understood that these are merely examples of the invention, and that other constructions may be employed as well.
- The present application claims priority based on
Japanese Patent Application No. 2018-183439, which was filed on September 28, 2018 -
- 10 Device
- 11 Bus
- 12 Processor
- 13 Memory
- 14 Storage device
- 15 Network interface
- 20 Measurement system
- 100 Calculator
- 110 Determiner
- 120 Memory
Claims (9)
- A method for detecting a degree of nucleic acid hybridization using a first oxidation wave and a second oxidation wave, wherein: the method includes calculating the potential difference between a first potential at which, in the first oxidation wave, a first current value is obtained in a range below the potential for the peak current value of the first oxidation wave, and a second potential at which, in the second oxidation wave, the first current value is obtained in a range below the potential for the peak current value of the second oxidation wave.
- The method for detecting a degree of nucleic acid hybridization according to claim 1, which includes determining the degree of nucleic acid hybridization based on the potential difference.
- The method for detecting a degree of nucleic acid hybridization according to claim 2, wherein determining the degree of nucleic acid hybridization includes comparing data representing the potential difference with reference data representing potential differences associated with degrees of nucleic acid hybridizations.
- The method for detecting a degree of nucleic acid hybridization according to any one of claims 1 to 3, wherein:the first oxidation wave represents the measurement results for a sample before hybridization, andthe second oxidation wave represents the measurement results for the sample after the hybridization.
- The method for detecting a degree of nucleic acid hybridization according to any one of claims 1 to 4, wherein:the second oxidation wave has a second current value for the potential at the peak current value of the first oxidation wave, andthe second current value of the second oxidation wave is 90% to 110% of the peak current value of the first oxidation wave.
- The method for detecting a degree of nucleic acid hybridization according to any one of claims 1 to 5, wherein the nucleic acid is RNA or DNA.
- The method for detecting a degree of nucleic acid hybridization according to claim 6, wherein the nucleic acid is miRNA.
- A device for detecting a degree of nucleic acid hybridization using a first oxidation wave and a second oxidation wave, wherein:
the device comprises a calculator which calculates the potential difference between a first potential at which, in the first oxidation wave, a first current value is obtained in a range below the potential for the peak current value of the first oxidation wave, and a second potential at which, in the second oxidation wave, the first current value is obtained in a range below the potential for the peak current value of the second oxidation wave. - A program that causes a computer to function as a device for detecting a degree of nucleic acid hybridization using a first oxidation wave and a second oxidation wave, wherein:
the program causes the computer to:
calculate the potential difference between a first potential at which, in the first oxidation wave, a first current value is obtained in a range below the potential for the peak current value of the first oxidation wave, and a second potential at which, in the second oxidation wave, the first current value is obtained in a range below the potential for the peak current value of the second oxidation wave.
Applications Claiming Priority (2)
| Application Number | Priority Date | Filing Date | Title |
|---|---|---|---|
| JP2018183439 | 2018-09-28 | ||
| PCT/JP2019/034380 WO2020066474A1 (en) | 2018-09-28 | 2019-09-02 | Method, device, and program for detecting degree of hybridization of nucleic acid |
Publications (2)
| Publication Number | Publication Date |
|---|---|
| EP3859323A1 true EP3859323A1 (en) | 2021-08-04 |
| EP3859323A4 EP3859323A4 (en) | 2022-06-15 |
Family
ID=69950514
Family Applications (1)
| Application Number | Title | Priority Date | Filing Date |
|---|---|---|---|
| EP19867756.9A Withdrawn EP3859323A4 (en) | 2018-09-28 | 2019-09-02 | Method, device, and program for detecting degree of hybridization of nucleic acid |
Country Status (5)
| Country | Link |
|---|---|
| US (1) | US20210317512A1 (en) |
| EP (1) | EP3859323A4 (en) |
| JP (1) | JP7460528B2 (en) |
| CN (1) | CN112567239A (en) |
| WO (1) | WO2020066474A1 (en) |
Family Cites Families (10)
| Publication number | Priority date | Publication date | Assignee | Title |
|---|---|---|---|---|
| JP3233851B2 (en) * | 1996-04-24 | 2001-12-04 | 繁織 竹中 | Electrochemical detection method of gene and its device |
| EP2040068A3 (en) * | 2000-09-29 | 2010-09-22 | Kabushiki Kaisha Toshiba | Nucleic acid detection sensor |
| JP3956214B2 (en) * | 2001-03-13 | 2007-08-08 | 独立行政法人科学技術振興機構 | Method for electrochemical detection of nucleobase pair complementarity |
| JP2003083968A (en) * | 2001-09-14 | 2003-03-19 | Jsr Corp | DNA chip and assay method |
| US20040191801A1 (en) * | 2003-03-25 | 2004-09-30 | Heeger Alan J. | Reagentless, reusable bioelectronic detectors and their use as authentication devices |
| JP5286786B2 (en) * | 2005-11-16 | 2013-09-11 | 三菱瓦斯化学株式会社 | Method for measuring the amount of double-stranded DNA and kit for measurement |
| JP4941994B2 (en) * | 2008-01-25 | 2012-05-30 | 独立行政法人産業技術総合研究所 | Gene detection method |
| US8263411B2 (en) * | 2009-01-29 | 2012-09-11 | Polytechnic Institute Of Nyu | Capacitive morpholino diagnostics for analysis of nucleic acids |
| JP6891617B2 (en) | 2017-04-26 | 2021-06-18 | 株式会社三洋物産 | Pachinko machine |
| CN107988318B (en) * | 2017-11-24 | 2021-05-25 | 杭州电子科技大学 | Method and application of rapid detection of nucleic acid based on electrochemical potential pretreatment technology |
-
2019
- 2019-09-02 US US17/267,746 patent/US20210317512A1/en not_active Abandoned
- 2019-09-02 EP EP19867756.9A patent/EP3859323A4/en not_active Withdrawn
- 2019-09-02 WO PCT/JP2019/034380 patent/WO2020066474A1/en not_active Ceased
- 2019-09-02 JP JP2020548254A patent/JP7460528B2/en active Active
- 2019-09-02 CN CN201980051873.6A patent/CN112567239A/en active Pending
Also Published As
| Publication number | Publication date |
|---|---|
| CN112567239A (en) | 2021-03-26 |
| JPWO2020066474A1 (en) | 2021-09-09 |
| WO2020066474A1 (en) | 2020-04-02 |
| EP3859323A4 (en) | 2022-06-15 |
| US20210317512A1 (en) | 2021-10-14 |
| JP7460528B2 (en) | 2024-04-02 |
Similar Documents
| Publication | Publication Date | Title |
|---|---|---|
| US10060874B2 (en) | System and method for detecting used and dried sensors | |
| US11549935B2 (en) | Exporting measurements of nanopore arrays | |
| CA2795554A1 (en) | Gene-expression profiling with reduced numbers of transcript measurements | |
| CN106367512A (en) | Method and system for identifying tumor loads in samples | |
| RU2013119959A (en) | SYSTEMS AND METHODS OF DIFFERENCE BETWEEN THE CONTROL SAMPLE AND THE TESTED FLUID MEDIA USING CAPACITY RESISTANCE | |
| US20210317512A1 (en) | Method, device, and program for detecting degree of hybridization of nucleic acid | |
| US20120010821A1 (en) | Nucleic Acid Abundance Ratio Measurement Device, Method, and Program Storage Medium, Determination Method and Nucleic Acid Abundance Ratio Measurement Kit | |
| EP2977466B1 (en) | Detecting chromosomal aneuploidy | |
| CN110596219B (en) | Photoelectrochemical gene sensor for detecting lung cancer marker and preparation method and application thereof | |
| CN109192243B (en) | Method, apparatus and medium for correcting chromosome proportion | |
| KR20020047038A (en) | Mathematical Analysis for the Estimation of Changes in the Level of Gene Expression | |
| US8315820B2 (en) | Potentiometric titration method and potentiometric titration apparatus | |
| EP3326094B1 (en) | Method and system for estimating a gender of a foetus of a pregnant female | |
| CN115019881B (en) | Small molecule anti-tumor effect identification method and system based on gene protein activity | |
| EP1953541A1 (en) | Method for determination of amount of double-stranded dna and kit for the determination | |
| Molina et al. | Study of a catalytic mechanism in additive differential pulse techniques | |
| Echeveria et al. | A nucleic acid-based electrochemical detection method for post hoc sample analysis | |
| WO2024068399A1 (en) | Detection method, computer program product, data processing unit and detection system for detecting mutations of a polynucleotide in a biological sample | |
| CN119827606A (en) | Detection system and method for measuring chloride ion content | |
| CN117198404A (en) | Gene sequencing data processing methods, devices, equipment and storage media | |
| CN101103272A (en) | Normalization method, program and system for gene expression | |
| Mathur | A nonparametric Bayesian test for detecting the difference in location parameters | |
| HK1231138A (en) | A method and system for identifying tumor burden in samples | |
| HK1231138A1 (en) | A method and system for identifying tumor burden in samples |
Legal Events
| Date | Code | Title | Description |
|---|---|---|---|
| STAA | Information on the status of an ep patent application or granted ep patent |
Free format text: STATUS: THE INTERNATIONAL PUBLICATION HAS BEEN MADE |
|
| PUAI | Public reference made under article 153(3) epc to a published international application that has entered the european phase |
Free format text: ORIGINAL CODE: 0009012 |
|
| STAA | Information on the status of an ep patent application or granted ep patent |
Free format text: STATUS: REQUEST FOR EXAMINATION WAS MADE |
|
| 17P | Request for examination filed |
Effective date: 20210219 |
|
| AK | Designated contracting states |
Kind code of ref document: A1 Designated state(s): AL AT BE BG CH CY CZ DE DK EE ES FI FR GB GR HR HU IE IS IT LI LT LU LV MC MK MT NL NO PL PT RO RS SE SI SK SM TR |
|
| DAV | Request for validation of the european patent (deleted) | ||
| DAX | Request for extension of the european patent (deleted) | ||
| A4 | Supplementary search report drawn up and despatched |
Effective date: 20220513 |
|
| RIC1 | Information provided on ipc code assigned before grant |
Ipc: G01N 27/327 20060101ALI20220509BHEP Ipc: G01N 27/48 20060101ALI20220509BHEP Ipc: G01N 27/416 20060101AFI20220509BHEP |
|
| STAA | Information on the status of an ep patent application or granted ep patent |
Free format text: STATUS: EXAMINATION IS IN PROGRESS |
|
| STAA | Information on the status of an ep patent application or granted ep patent |
Free format text: STATUS: THE APPLICATION HAS BEEN WITHDRAWN |
|
| 17Q | First examination report despatched |
Effective date: 20240227 |
|
| 18W | Application withdrawn |
Effective date: 20240319 |