EP3824812A1 - Biometric information display device, biometric information display method, and display program - Google Patents
Biometric information display device, biometric information display method, and display program Download PDFInfo
- Publication number
- EP3824812A1 EP3824812A1 EP20208418.2A EP20208418A EP3824812A1 EP 3824812 A1 EP3824812 A1 EP 3824812A1 EP 20208418 A EP20208418 A EP 20208418A EP 3824812 A1 EP3824812 A1 EP 3824812A1
- Authority
- EP
- European Patent Office
- Prior art keywords
- virtual electrodes
- current
- virtual
- vec
- pathway
- Prior art date
- Legal status (The legal status is an assumption and is not a legal conclusion. Google has not performed a legal analysis and makes no representation as to the accuracy of the status listed.)
- Granted
Links
Images





Classifications
-
- A—HUMAN NECESSITIES
- A61—MEDICAL OR VETERINARY SCIENCE; HYGIENE
- A61B—DIAGNOSIS; SURGERY; IDENTIFICATION
- A61B5/00—Measuring for diagnostic purposes; Identification of persons
- A61B5/24—Detecting, measuring or recording bioelectric or biomagnetic signals of the body or parts thereof
- A61B5/242—Detecting biomagnetic fields, e.g. magnetic fields produced by bioelectric currents
- A61B5/248—Detecting biomagnetic fields, e.g. magnetic fields produced by bioelectric currents specially adapted for magnetoneurographic [MNG] signals, e.g. magnetospinographic [MSG] signals
-
- G—PHYSICS
- G09—EDUCATION; CRYPTOGRAPHY; DISPLAY; ADVERTISING; SEALS
- G09G—ARRANGEMENTS OR CIRCUITS FOR CONTROL OF INDICATING DEVICES USING STATIC MEANS TO PRESENT VARIABLE INFORMATION
- G09G5/00—Control arrangements or circuits for visual indicators common to cathode-ray tube indicators and other visual indicators
- G09G5/36—Control arrangements or circuits for visual indicators common to cathode-ray tube indicators and other visual indicators characterised by the display of a graphic pattern, e.g. using an all-points-addressable [APA] memory
- G09G5/37—Details of the operation on graphic patterns
-
- A—HUMAN NECESSITIES
- A61—MEDICAL OR VETERINARY SCIENCE; HYGIENE
- A61B—DIAGNOSIS; SURGERY; IDENTIFICATION
- A61B5/00—Measuring for diagnostic purposes; Identification of persons
- A61B5/0033—Features or image-related aspects of imaging apparatus, e.g. for MRI, optical tomography or impedance tomography apparatus; Arrangements of imaging apparatus in a room
- A61B5/0035—Features or image-related aspects of imaging apparatus, e.g. for MRI, optical tomography or impedance tomography apparatus; Arrangements of imaging apparatus in a room adapted for acquisition of images from more than one imaging mode, e.g. combining MRI and optical tomography
-
- A—HUMAN NECESSITIES
- A61—MEDICAL OR VETERINARY SCIENCE; HYGIENE
- A61B—DIAGNOSIS; SURGERY; IDENTIFICATION
- A61B5/00—Measuring for diagnostic purposes; Identification of persons
- A61B5/05—Detecting, measuring or recording for diagnosis by means of electric currents or magnetic fields; Measuring using microwaves or radio waves
- A61B5/055—Detecting, measuring or recording for diagnosis by means of electric currents or magnetic fields; Measuring using microwaves or radio waves involving electronic [EMR] or nuclear [NMR] magnetic resonance, e.g. magnetic resonance imaging
-
- A—HUMAN NECESSITIES
- A61—MEDICAL OR VETERINARY SCIENCE; HYGIENE
- A61B—DIAGNOSIS; SURGERY; IDENTIFICATION
- A61B5/00—Measuring for diagnostic purposes; Identification of persons
- A61B5/24—Detecting, measuring or recording bioelectric or biomagnetic signals of the body or parts thereof
- A61B5/316—Modalities, i.e. specific diagnostic methods
- A61B5/388—Nerve conduction study, e.g. detecting action potential of peripheral nerves
-
- A—HUMAN NECESSITIES
- A61—MEDICAL OR VETERINARY SCIENCE; HYGIENE
- A61B—DIAGNOSIS; SURGERY; IDENTIFICATION
- A61B5/00—Measuring for diagnostic purposes; Identification of persons
- A61B5/40—Detecting, measuring or recording for evaluating the nervous system
- A61B5/4029—Detecting, measuring or recording for evaluating the nervous system for evaluating the peripheral nervous systems
- A61B5/4041—Evaluating nerves condition
-
- A—HUMAN NECESSITIES
- A61—MEDICAL OR VETERINARY SCIENCE; HYGIENE
- A61B—DIAGNOSIS; SURGERY; IDENTIFICATION
- A61B5/00—Measuring for diagnostic purposes; Identification of persons
- A61B5/48—Other medical applications
- A61B5/4887—Locating particular structures in or on the body
- A61B5/4893—Nerves
-
- A—HUMAN NECESSITIES
- A61—MEDICAL OR VETERINARY SCIENCE; HYGIENE
- A61B—DIAGNOSIS; SURGERY; IDENTIFICATION
- A61B5/00—Measuring for diagnostic purposes; Identification of persons
- A61B5/72—Signal processing specially adapted for physiological signals or for diagnostic purposes
- A61B5/7271—Specific aspects of physiological measurement analysis
- A61B5/7278—Artificial waveform generation or derivation, e.g. synthesizing signals from measured signals
-
- A—HUMAN NECESSITIES
- A61—MEDICAL OR VETERINARY SCIENCE; HYGIENE
- A61B—DIAGNOSIS; SURGERY; IDENTIFICATION
- A61B5/00—Measuring for diagnostic purposes; Identification of persons
- A61B5/74—Details of notification to user or communication with user or patient; User input means
- A61B5/742—Details of notification to user or communication with user or patient; User input means using visual displays
-
- A—HUMAN NECESSITIES
- A61—MEDICAL OR VETERINARY SCIENCE; HYGIENE
- A61B—DIAGNOSIS; SURGERY; IDENTIFICATION
- A61B5/00—Measuring for diagnostic purposes; Identification of persons
- A61B5/74—Details of notification to user or communication with user or patient; User input means
- A61B5/742—Details of notification to user or communication with user or patient; User input means using visual displays
- A61B5/743—Displaying an image simultaneously with additional graphical information, e.g. symbols, charts, function plots
-
- A—HUMAN NECESSITIES
- A61—MEDICAL OR VETERINARY SCIENCE; HYGIENE
- A61B—DIAGNOSIS; SURGERY; IDENTIFICATION
- A61B6/00—Apparatus or devices for radiation diagnosis; Apparatus or devices for radiation diagnosis combined with radiation therapy equipment
- A61B6/02—Arrangements for diagnosis sequentially in different planes; Stereoscopic radiation diagnosis
- A61B6/03—Computed tomography [CT]
- A61B6/032—Transmission computed tomography [CT]
-
- A—HUMAN NECESSITIES
- A61—MEDICAL OR VETERINARY SCIENCE; HYGIENE
- A61B—DIAGNOSIS; SURGERY; IDENTIFICATION
- A61B6/00—Apparatus or devices for radiation diagnosis; Apparatus or devices for radiation diagnosis combined with radiation therapy equipment
- A61B6/12—Arrangements for detecting or locating foreign bodies
-
- A—HUMAN NECESSITIES
- A61—MEDICAL OR VETERINARY SCIENCE; HYGIENE
- A61B—DIAGNOSIS; SURGERY; IDENTIFICATION
- A61B6/00—Apparatus or devices for radiation diagnosis; Apparatus or devices for radiation diagnosis combined with radiation therapy equipment
- A61B6/46—Arrangements for interfacing with the operator or the patient
- A61B6/461—Displaying means of special interest
- A61B6/463—Displaying means of special interest characterised by displaying multiple images or images and diagnostic data on one display
-
- A—HUMAN NECESSITIES
- A61—MEDICAL OR VETERINARY SCIENCE; HYGIENE
- A61B—DIAGNOSIS; SURGERY; IDENTIFICATION
- A61B6/00—Apparatus or devices for radiation diagnosis; Apparatus or devices for radiation diagnosis combined with radiation therapy equipment
- A61B6/46—Arrangements for interfacing with the operator or the patient
- A61B6/467—Arrangements for interfacing with the operator or the patient characterised by special input means
-
- A—HUMAN NECESSITIES
- A61—MEDICAL OR VETERINARY SCIENCE; HYGIENE
- A61B—DIAGNOSIS; SURGERY; IDENTIFICATION
- A61B6/00—Apparatus or devices for radiation diagnosis; Apparatus or devices for radiation diagnosis combined with radiation therapy equipment
- A61B6/52—Devices using data or image processing specially adapted for radiation diagnosis
- A61B6/5211—Devices using data or image processing specially adapted for radiation diagnosis involving processing of medical diagnostic data
- A61B6/5229—Devices using data or image processing specially adapted for radiation diagnosis involving processing of medical diagnostic data combining image data of a patient, e.g. combining a functional image with an anatomical image
- A61B6/5247—Devices using data or image processing specially adapted for radiation diagnosis involving processing of medical diagnostic data combining image data of a patient, e.g. combining a functional image with an anatomical image combining images from an ionising-radiation diagnostic technique and a non-ionising radiation diagnostic technique, e.g. X-ray and ultrasound
-
- A—HUMAN NECESSITIES
- A61—MEDICAL OR VETERINARY SCIENCE; HYGIENE
- A61N—ELECTROTHERAPY; MAGNETOTHERAPY; RADIATION THERAPY; ULTRASOUND THERAPY
- A61N1/00—Electrotherapy; Circuits therefor
- A61N1/02—Details
- A61N1/04—Electrodes
- A61N1/0404—Electrodes for external use
- A61N1/0408—Use-related aspects
- A61N1/0456—Specially adapted for transcutaneous electrical nerve stimulation [TENS]
-
- G—PHYSICS
- G06—COMPUTING OR CALCULATING; COUNTING
- G06T—IMAGE DATA PROCESSING OR GENERATION, IN GENERAL
- G06T11/00—Two-dimensional [2D] image generation
-
- A—HUMAN NECESSITIES
- A61—MEDICAL OR VETERINARY SCIENCE; HYGIENE
- A61B—DIAGNOSIS; SURGERY; IDENTIFICATION
- A61B5/00—Measuring for diagnostic purposes; Identification of persons
- A61B5/0002—Remote monitoring of patients using telemetry, e.g. transmission of vital signals via a communication network
- A61B5/0015—Remote monitoring of patients using telemetry, e.g. transmission of vital signals via a communication network characterised by features of the telemetry system
- A61B5/0022—Monitoring a patient using a global network, e.g. telephone networks, internet
-
- A—HUMAN NECESSITIES
- A61—MEDICAL OR VETERINARY SCIENCE; HYGIENE
- A61B—DIAGNOSIS; SURGERY; IDENTIFICATION
- A61B5/00—Measuring for diagnostic purposes; Identification of persons
- A61B5/24—Detecting, measuring or recording bioelectric or biomagnetic signals of the body or parts thereof
- A61B5/242—Detecting biomagnetic fields, e.g. magnetic fields produced by bioelectric currents
- A61B5/243—Detecting biomagnetic fields, e.g. magnetic fields produced by bioelectric currents specially adapted for magnetocardiographic [MCG] signals
-
- A—HUMAN NECESSITIES
- A61—MEDICAL OR VETERINARY SCIENCE; HYGIENE
- A61B—DIAGNOSIS; SURGERY; IDENTIFICATION
- A61B5/00—Measuring for diagnostic purposes; Identification of persons
- A61B5/24—Detecting, measuring or recording bioelectric or biomagnetic signals of the body or parts thereof
- A61B5/242—Detecting biomagnetic fields, e.g. magnetic fields produced by bioelectric currents
- A61B5/245—Detecting biomagnetic fields, e.g. magnetic fields produced by bioelectric currents specially adapted for magnetoencephalographic [MEG] signals
-
- A—HUMAN NECESSITIES
- A61—MEDICAL OR VETERINARY SCIENCE; HYGIENE
- A61B—DIAGNOSIS; SURGERY; IDENTIFICATION
- A61B5/00—Measuring for diagnostic purposes; Identification of persons
- A61B5/68—Arrangements of detecting, measuring or recording means, e.g. sensors, in relation to patient
- A61B5/6801—Arrangements of detecting, measuring or recording means, e.g. sensors, in relation to patient specially adapted to be attached to or worn on the body surface
- A61B5/6813—Specially adapted to be attached to a specific body part
- A61B5/6824—Arm or wrist
-
- A—HUMAN NECESSITIES
- A61—MEDICAL OR VETERINARY SCIENCE; HYGIENE
- A61B—DIAGNOSIS; SURGERY; IDENTIFICATION
- A61B5/00—Measuring for diagnostic purposes; Identification of persons
- A61B5/68—Arrangements of detecting, measuring or recording means, e.g. sensors, in relation to patient
- A61B5/6801—Arrangements of detecting, measuring or recording means, e.g. sensors, in relation to patient specially adapted to be attached to or worn on the body surface
- A61B5/6813—Specially adapted to be attached to a specific body part
- A61B5/6825—Hand
-
- A—HUMAN NECESSITIES
- A61—MEDICAL OR VETERINARY SCIENCE; HYGIENE
- A61B—DIAGNOSIS; SURGERY; IDENTIFICATION
- A61B5/00—Measuring for diagnostic purposes; Identification of persons
- A61B5/72—Signal processing specially adapted for physiological signals or for diagnostic purposes
- A61B5/7235—Details of waveform analysis
- A61B5/7264—Classification of physiological signals or data, e.g. using neural networks, statistical classifiers, expert systems or fuzzy systems
- A61B5/7267—Classification of physiological signals or data, e.g. using neural networks, statistical classifiers, expert systems or fuzzy systems involving training the classification device
-
- G—PHYSICS
- G09—EDUCATION; CRYPTOGRAPHY; DISPLAY; ADVERTISING; SEALS
- G09G—ARRANGEMENTS OR CIRCUITS FOR CONTROL OF INDICATING DEVICES USING STATIC MEANS TO PRESENT VARIABLE INFORMATION
- G09G2380/00—Specific applications
- G09G2380/08—Biomedical applications
-
- G—PHYSICS
- G16—INFORMATION AND COMMUNICATION TECHNOLOGY [ICT] SPECIALLY ADAPTED FOR SPECIFIC APPLICATION FIELDS
- G16H—HEALTHCARE INFORMATICS, i.e. INFORMATION AND COMMUNICATION TECHNOLOGY [ICT] SPECIALLY ADAPTED FOR THE HANDLING OR PROCESSING OF MEDICAL OR HEALTHCARE DATA
- G16H30/00—ICT specially adapted for the handling or processing of medical images
- G16H30/20—ICT specially adapted for the handling or processing of medical images for handling medical images, e.g. DICOM, HL7 or PACS
-
- G—PHYSICS
- G16—INFORMATION AND COMMUNICATION TECHNOLOGY [ICT] SPECIALLY ADAPTED FOR SPECIFIC APPLICATION FIELDS
- G16H—HEALTHCARE INFORMATICS, i.e. INFORMATION AND COMMUNICATION TECHNOLOGY [ICT] SPECIALLY ADAPTED FOR THE HANDLING OR PROCESSING OF MEDICAL OR HEALTHCARE DATA
- G16H30/00—ICT specially adapted for the handling or processing of medical images
- G16H30/40—ICT specially adapted for the handling or processing of medical images for processing medical images, e.g. editing
-
- G—PHYSICS
- G16—INFORMATION AND COMMUNICATION TECHNOLOGY [ICT] SPECIALLY ADAPTED FOR SPECIFIC APPLICATION FIELDS
- G16H—HEALTHCARE INFORMATICS, i.e. INFORMATION AND COMMUNICATION TECHNOLOGY [ICT] SPECIALLY ADAPTED FOR THE HANDLING OR PROCESSING OF MEDICAL OR HEALTHCARE DATA
- G16H40/00—ICT specially adapted for the management or administration of healthcare resources or facilities; ICT specially adapted for the management or operation of medical equipment or devices
- G16H40/60—ICT specially adapted for the management or administration of healthcare resources or facilities; ICT specially adapted for the management or operation of medical equipment or devices for the operation of medical equipment or devices
- G16H40/63—ICT specially adapted for the management or administration of healthcare resources or facilities; ICT specially adapted for the management or operation of medical equipment or devices for the operation of medical equipment or devices for local operation
-
- G—PHYSICS
- G16—INFORMATION AND COMMUNICATION TECHNOLOGY [ICT] SPECIALLY ADAPTED FOR SPECIFIC APPLICATION FIELDS
- G16H—HEALTHCARE INFORMATICS, i.e. INFORMATION AND COMMUNICATION TECHNOLOGY [ICT] SPECIALLY ADAPTED FOR THE HANDLING OR PROCESSING OF MEDICAL OR HEALTHCARE DATA
- G16H50/00—ICT specially adapted for medical diagnosis, medical simulation or medical data mining; ICT specially adapted for detecting, monitoring or modelling epidemics or pandemics
- G16H50/20—ICT specially adapted for medical diagnosis, medical simulation or medical data mining; ICT specially adapted for detecting, monitoring or modelling epidemics or pandemics for computer-aided diagnosis, e.g. based on medical expert systems
-
- G—PHYSICS
- G16—INFORMATION AND COMMUNICATION TECHNOLOGY [ICT] SPECIALLY ADAPTED FOR SPECIFIC APPLICATION FIELDS
- G16H—HEALTHCARE INFORMATICS, i.e. INFORMATION AND COMMUNICATION TECHNOLOGY [ICT] SPECIALLY ADAPTED FOR THE HANDLING OR PROCESSING OF MEDICAL OR HEALTHCARE DATA
- G16H50/00—ICT specially adapted for medical diagnosis, medical simulation or medical data mining; ICT specially adapted for detecting, monitoring or modelling epidemics or pandemics
- G16H50/70—ICT specially adapted for medical diagnosis, medical simulation or medical data mining; ICT specially adapted for detecting, monitoring or modelling epidemics or pandemics for mining of medical data, e.g. analysing previous cases of other patients
Definitions
- the present invention relates to a biometric information display device, a biometric information display method, and a display program.
- a technique that estimates a current flowing through the living body based on the measured magnetic field, and displays the estimated current distribution, waveform, isocontour field distribution of the magnetic field, or the like in multiple windows of a single screen, is described in Japanese Unexamined Patent Application Publication No. 2008-178558 , for example.
- the current generated by a nerve activity includes an intra-axonal current component that flows through the nerve axon, and a volume current component that flows outside the nerve axon and returns back to a depolarization point.
- the intra-axonal current component and the volume current component estimated from the magnetic field data measured by the magnetic field measuring device, may be superimposed on a morphological image of a part of the living body to be measured.
- the superimposed image may be displayed on the display device, and a nerve function may be evaluated based on the displayed information.
- positions where the intra-axonal current component is to be extracted are required to be set according to the actual neural pathway, in order to extract the correct intra-axonal current component from the magnetic field data.
- the positions where the intra-axonal current component is to be extracted are required to be set according to the curved shape of the neural pathway.
- the correct intra-axonal current component cannot be obtained, and the nerve function cannot be correctly evaluated, if the positions where the intra-axonal current component is to be extracted are not set along the curved shape of the actual neural pathway. Similar to the intra-axonal current component, positions where the volume current component is to be extracted are required to be set according to the curved shape of the neural pathway, in order to estimate the correct volume current component.
- one object of the embodiments is to provide a biometric information display device, a biometric information display method, and a display program, which can generate a pathway from which a current component is to be extracted from a subject, using a morphological image of the subject.
- a biometric information display device includes a display controller configured to display a morphological image indicative of a morphology of a subject, on a display; an input controller configured to receive a designation of a specified position on the morphological image; a pathway generating section configured to generate a pathway based on the specified position on the morphological image; and a current extracting section configured to extract current components at a plurality of positions along the pathway, based on current information reconstructed based on magnetic field measurement data generated by the subject, wherein the display controller configured to display the current components extracted along the pathway on the display.
- a biometric information display method to be implemented in a biometric information display device that includes a display controller configured to display a morphological image indicative of the morphology of a subject, and an input controller configured to receive a designation of a specified position on the morphological image, the biometric information display method including generating a pathway based on the specified position on the morphological image; extracting current components at a plurality of positions along the pathway, based on current information reconstructed based on magnetic field measurement data generated by the subject; and displaying the current components extracted along the pathway on a display.
- a display program which, when executed by a computer of a biometric information display device that includes a display controller configured to display a morphological image indicative of the morphology of a subject, and an input controller configured to receive a designation of a specified position on the morphological image, causes the computer to perform a process including generating a pathway based on the specified position on the morphological image; extracting current components at a plurality of positions along the pathway, based on current information reconstructed based on magnetic field measurement data generated by the subject; and displaying the current components extracted along the pathway on a display.
- FIG. 1 is a block diagram illustrating an example of a biometric information measuring apparatus including a biometric information display device according to one embodiment of the present invention.
- a biometric information measuring apparatus 100 illustrated in FIG. 1 includes a magnetic sensor section 10, a signal acquiring section 20, a data processing device 30, an input device 80, and a display device 90.
- the data processing device 30 may be a computer, such as a personal computer (PC), a server, or the like, that functions as the biometric information display device.
- the display device 90 is capable of displaying a morphological image of a subject (or test subject), such as an X-ray image or the like. The morphological image of the subject is indicative of a morphology of the subject.
- the display device 90 is an example of a display or display means.
- the display device 90 may be included in the biometric information display device, or may be externally connected to the biometric information display device, as appropriate.
- the signal acquiring section 20 includes a flux locked loop (FLL) circuit 21, an analog signal processor 22, an analog-to-digital converter (ADC) 23, and a field programmable gate array (FPGA) 24.
- FLL flux locked loop
- ADC analog-to-digital converter
- FPGA field programmable gate array
- the magnetic sensor section 10 and the signal acquiring section 20 are provided inside a shielded enclosure that provides magnetic shielding, while the data processing device 30, the input device 80, and the display device 90 are provided outside the shielded enclosure.
- the magnetic sensor section 10 includes a plurality of superconducting quantum interference device (SQUID) magnetic sensors.
- the magnetic sensor section 10 may include other types of magnetic sensors, such as magneto resistive (MR) sensors, optically pumped atomic magnetometer (OPAM) sensors, or the like, in place of the SQUID magnetic sensors.
- MR magneto resistive
- OPAM optically pumped atomic magnetometer
- the data processing device 30 includes an input controller 40, a display controller 50, an operation controller 60, and a storage 70.
- functions of the input controller 40, the display controller 50, and the operation controller 60 may be performed by a processor, such as a central processing unit (CPU) or the like provided in the data processing device 30, that implements a biometric information display method by executing a display program while cooperating with hardware.
- the input controller 40 is an example of an input control circuit or means
- the display controller 50 is an example of a display control circuit or means.
- the biometric information measuring apparatus 100 may be used as a magnetoencephalograph (MEG), a magnetocardiograph (MCG), a magnetospinograph (MSG), or the like.
- the biometric information measuring apparatus 100 may be applied to measurements of a neural magnetic field, a muscular magnetic field, or the like, other than a spinal magnetic field.
- the magnetic sensor section 10 measures the magnetic field generated by the subject, and outputs the measured magnetic field as a voltage.
- the magnetic sensor 10 includes the plurality of SQUID magnetic sensors that are provided at positions opposing magnetic field measuring parts of the subject lying on a bed, for example.
- the FLL circuit 21 improves a dynamic range of the magnetic sensor section 10 by linearizing each of nonlinear magnetic field-voltage characteristics measured by the plurality of SQUID magnetic sensors.
- the analog signal processor 22 amplifies the linearized analog signal output from the FLL circuit 21, and performs a filter processing or the like on the amplified analog signal.
- the ADC 23 converts the filtered analog signal (magnetic field signal) into a digital value (magnetic field data).
- the FPGA 24 further performs a filtering process, a thinning process, or the like on the digitized magnetic field data from the ADC 23, and transmits the processed data to the data processing device 30.
- the input controller 40 includes a position input section 41 and a waveform region designating section 42, and performs an input process on various information input by an operator of the data processing device 30 via the input device 80, such as a mouse, a keyboard, or the like. Functions of the position input section 41 and the waveform region designating section 42 will be described later.
- the display controller 50 includes an image display section 51 and a waveform display section 52, and performs a control to display the X-ray image, a current waveform, or the like on the display device 90, such as a liquid crystal display (LCD) or the like. Functions of the image display section 51 and the waveform display section 52 will be described later.
- the input device 80 and the display device 90 may be included in the data processing device 30.
- an output device such as a printer or the like, may be connected to the data processing device 30.
- the operation controller 60 includes a pathway generating section 61, a virtual electrode generating section 62, a reconstruction analyzing section 63, a current component extracting section 64, and a conduction velocity calculating section 65.
- the pathway generating section 61 is an example of a pathway generating circuit or means
- the virtual electrode generating section 62 is an example of a virtual electrode generating circuit or means
- the current component extracting section 64 is an example of a current component extracting circuit or means.
- the conduction velocity calculating section 65 is an example of a conduction velocity calculating circuit or means. Functions of the pathway generating section 61, the virtual electrode generating section 62, the reconstruction analyzing section 63, the current component extracting section 64, and the conduction velocity calculating section 65 will be described later.
- the storage 70 may be formed by a storage device, such as a hard disk drive (HDD) or the like, and includes an area for storing biometric magnetic field data 71, morphological image data 72, and various analysis parameters 73.
- the biometric magnetic field data 71 include measurement data of the magnetic field measured by the magnetic sensor section 10 and processed by the signal acquiring section 20.
- the morphological image data 72 include X-ray image data captured by an X-ray machine, magnetic resonance (MR) image data captured by a magnetic resonance tomographic machine, or the like.
- an X-ray morphological image of the subject generated from the X-ray image data will be referred to as the X-ray image
- a morphological image of the subject generated from the MR image data will be referred to as the MR image
- a morphological image of the subject generated from the computed tomography (CT) scan image data will be referred to as a CT image.
- the analysis parameters 73 include setting values of a filter (highpass filter, lowpass filter, or the like) provided in the signal acquiring section 20, parameters required for measuring the biometric magnetic field, such as a time range, a number of elements, or the like for performing various signal processing, and parameters required for implementing the biometric information display method.
- a filter highpass filter, lowpass filter, or the like
- FIG. 2 is a diagram for explaining an example of a model of a nerve activity current.
- FIG. 2 illustrates a manner in which a current is generated by an activity of a nerve running linearly in an up-and-down (or vertical) direction in FIG. 2 , where a lower end in FIG. 2 corresponds to the side closer to a peripheral nerve, and an upper end in FIG. 2 corresponds to the side closer to a central nerve.
- the electrical stimulation is transferred, as the current, from the lower end toward the upper end of the nerve axon.
- the intra-axonal current includes an intra-axonal current component that flows toward the upper end (in a forward direction) in FIG. 2 , and an intra-axonal current component that flows toward the lower end (in a reverse direction) in FIG. 2 .
- the volume current includes a volume current component that flows outside the nerve axon and returns back to a depolarization point.
- the intra-axonal current component that flows toward the upper end in FIG. 2 will be referred to as a leading component
- the intra-axonal current component that flows toward the lower end in FIG. 2 will be referred to as a trailing component.
- the intra-axonal current flowing along the nerve axon and a current flowing perpendicularly into the nerve axon due to the volume current, and visually display the extracted currents on a screen or the like of the display device 90.
- FIG. 3 is a diagram for explaining an example of a method for calculating a motor nerve conduction velocity.
- the electrical stimulation is applied to each of a proximal end of a median nerve (for example, near an elbow) and a peripheral end (for example, near a wrist), currents generated in response to the electrical stimulation are measured by an electromyograph or the like via an electrode attached to a palm, and latencies of the currents are calculated from the measured current waveforms (time variations of current intensity).
- MCV motor nerve conduction velocity
- FIG. 4 is a diagram for explaining an example in which virtual electrodes VE (VEc, VEl, and VEr) are set by the data processing device 30 illustrated in FIG. 1 .
- virtual electrodes VE VEc, VEl, and VEr
- VEc virtual electrodes
- VEl virtual electrode
- VEr virtual electrodes
- the virtual electrode VE refers to an imaginary electrode that is virtually set on the X-ray image or the MR image of the subject, and indicates a current extraction point (current observation point) at which the current component is to be extracted (reconstructed) from magnetic field data, among the magnetic field measuring parts of the subject. Since the method for extracting the current is known, a detailed description thereof will be omitted.
- an X-Y plane is parallel to a sensing surface of an SQUID magnetic sensor array
- an X direction is the direction in which the SQUID magnetic sensor array is arranged
- a Y direction is perpendicular to the X direction
- a Z direction is perpendicular to the X-Y plane and toward the SQUID magnetic sensor array.
- a plurality of virtual electrodes VEc are set on a neural pathway (nerve axon) running linearly in the morphological image (X-ray image) of the subject.
- virtual electrodes VEl and VEr outside (left and right sides of) the nerve axon are set on both sides of the nerve axon (in a direction perpendicular to the neural pathway) at each virtual electrode VEc.
- rectangles illustrated in peripheries of the virtual electrodes VEc, VEl, and VEr indicate definitions of the symbols r c , s c , r l , s l , r r , and s r for facilitating the reader's understanding, and these rectangles are not displayed on the actual screen.
- a plurality of small arrows superimposed on the morphological image indicate directions of the currents extracted by reconstruction, and the length of each arrow indicates a current intensity.
- an end opposite the arrowhead indicates the position of a voxel that is the extraction unit of the current component.
- a contour-like curve indicates a current intensity distribution that is generated by connecting the positions where the current intensities are the same.
- the arrows and the current intensity distribution indicating the current components are also illustrated in the morphological images illustrated in FIG. 7 and FIG. 17 which will be described later.
- the neural pathway passing through the nerve axon is generated by the pathway generating section 61, by detecting, by the position input section 41, a plurality of positions designated on the morphological image via the input device 80, and making calculations in the pathway generating section 61 using coordinates of the plurality of detected positions.
- the positions indicating the neural pathway of the nerve axon may be input from the input device 80 by the operator who operates the data processing device 30 while viewing the nerve in the morphological image.
- the neural pathway of the nerve axon may be set by the data processing device 30 which infers (or derives) the position, running (or extending) direction, or the like of the nerve in the morphological image.
- a machine learning such as deep learning or the like, may be performed using a large number of morphological images in which the neural pathway is known in advance, and a neural network for setting the neural pathway may be constructed in the data processing device 30 as the pathway generating section 61.
- the neural network for setting the neural pathway may be constructed in a cloud (or cloud computing system) that is connected to the data processing device 30 via a network, and may be used by the data processing device 30.
- the pathway generating section 61 notifies information indicating the calculated neural pathway to the virtual electrode generating section 62.
- the calculated neural pathway may be represented by a formula or the like indicating a plurality of coordinate information or a curve.
- the virtual electrode generating section 62 generates a plurality of virtual electrodes VEc at equal spacing, for example, on the neural pathway notified from the pathway generating section 61.
- the spacing and the number of virtual electrodes VEc generated on the neural pathway are specified by the operator via the input device 80, and stored in the storage 70 by the input controller 40.
- the virtual electrode generating section 62 generates the virtual electrodes VEc on the neural pathway generated by the pathway generating section 61, according to the spacing and the number of virtual electrodes VEc stored in the storage 70.
- the virtual electrode generating section 62 sets the virtual electrode VEl and the virtual electrode VEr outside the nerve axon, on both sides of the virtual electrode VEc, that is, on the left side and the right side of the virtual electrode VEc, respectively.
- a distance from the virtual electrode VEc to the virtual electrodes VEl and VEr outside the nerve axon, may be specified by the operator via the input device 80, similar to the spacing between the virtual electrodes VEc.
- the virtual electrode generating section 62 may generate the virtual electrodes VE using preset default values.
- the image display section 51 displays the morphological image on the screen of the display device 90, and displays the virtual electrodes VEc, VEl, and VEr generated by the virtual electrode generating section 62 in a state superimposed on the morphological image, as illustrated in FIG. 4 .
- the virtual electrode generating section 62 generates the virtual electrodes VEc, VEl, and VEr
- the arrows indicating the currents and the current intensity distribution may be superimposed on the morphological image and displayed on the screen of the display device 90, or only the morphological image may be displayed on the screen of the display device 90, as appropriate.
- the reconstruction analyzing section 63 operates independently of the above described operations of the pathway generating section 61 and the virtual electrode generating section 62, and reconstructs the current component for each of the voxels that are virtual current extraction points arranged at a predetermined spacing, using the magnetic field data of the subject measured by the magnetic sensor section 10.
- the image display section 51 superimposes the arrow representing the direction and intensity of the current indicated by the reconstructed current component, on the morphological image and the virtual electrodes VEc, VEl, and VEr, to be displayed on the screen of the display device 90.
- the current component extracting section 64 extracts the current component (current density distribution) at each virtual electrode VE using the current component at each voxel, based on a positional relationship between the voxels and each of the virtual electrode VEc, VEl, and VEr. An example of the extraction of the current component will be described with reference to FIG. 5 .
- the current component extracting section 64 calculates the waveform for the intra-axonal current that conducts through the nerve axon, from the current component along the nerve axon, by regarding the head side of the arrow as being positive and the tail side of the arrow as being negative.
- the current component extracting section 64 calculates the waveform of the volume current, from the component perpendicular to the nerve axon, by regarding the direction toward the nerve axon as being positive.
- the component of the volume current, perpendicular to the nerve axon is preferably used to evaluate the nerve function.
- the estimated current of each virtual electrode VE can be calculated from the following formulas (1), (2), and (3), where /S c denotes the intra-axonal current from the virtual electrode VEc when the virtual electrode VEc is regarded as a base point, /S l denotes the left volume current from the virtual electrode VE1 when the virtual electrode VE1 is regarded as a base point, /S r denotes the right volume current from the virtual electrode VEr when the virtual electrode VEr is regarded as a base point, and a symbol "/" indicates an overbar.
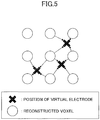
- FIG. 5 is a diagram illustrating an example of a method of calculating the current intensity at the virtual electrode VE.
- the current intensity at the virtual electrode VE is calculated from the intensity of the current reconstructed on the voxels that are arranged in a matrix arrangement, using a linear interpolation technique. By this operation, it is possible to calculate the estimated intensity of the current in the X direction and the Y direction in FIG. 4 , at the virtual electrode VE.
- the spacing of the voxels and the spacing of the virtual electrodes VE are approximately the same for the sake of convenience, to facilitate the reader's understanding thereof.
- the spacing of the virtual electrodes VE is several times the spacing of the voxels as illustrated in FIG. 4 , for example, and the spacing of the voxels and the spacing of the virtual electrodes VE may be set arbitrarily.
- the voxels are arranged at the spacing of several millimeters (mm).
- the current intensity at the virtual electrode VE may be calculated using the recursive null steering (RENS) filter method studied by the present inventors.
- the current intensity at each virtual electrode VE can be calculated accurately in a short period of time, compared to the case where the current intensity is calculated by the linear interpolation technique.
- FIG. 6 is a diagram for explaining a neural pathway running from a right foot to a lumbar part.
- FIG. 6 illustrates the X-ray image of the subject displayed on the display device 90.
- the neural pathway from a sciatic nerve to a spinal cord for example, when viewed from the front of the subject, has a curved shape and not a linear shape.
- the pathway generating section 61 can set the neural pathway as a curve.
- the spinal cord evoked potential measurement methods perform the measurements by inserting an electrode into a spinal canal, and measuring a potential of the spinal cord at an immediate vicinity of the spinal cord.
- a marker MK illustrated in FIG. 6 corresponds to an electrode that is captured together with the subject to align and coordinate the morphological image, such as the X-ray image or the like, with the measuring position where the magnetic field data are measured by the SQUID magnetic sensors, and this electrode is mounted at a position opposing (or facing) the body surface of the subject.
- a predetermined current is applied to the marker MK, in order to identify the position of the marker MK by the SQUID magnetic sensors.
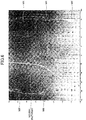
- FIG. 7 is a diagram for explaining an example of the nerve activity current generated along the neural pathway illustrated in FIG. 6 .
- FIG. 7 illustrates a time variation of the current distribution at parts of the subject to be measured. Images illustrated in FIG. 7 are displayed on the screen of the display device 90 by the image display section 51, based on current data, that is, current information of each of the voxels reconstructed by the reconstruction analyzing section 63. These images, displayed on the screen of the display device 90, are superimposed on the X-ray image.
- FIG. 7 illustrates four images 1 through 4 in which the current state varies with the lapse of time.
- the four images 1 through 4 may be displayed simultaneously on the screen, or one of the four images 1 through 4 may be displayed at one time. In the latter case, a slide bar or the like indicating the time and displayed on the screen, may be manipulated by the operator to successively switch the image that is displayed in a single window on the screen.
- Bold solid arrows representing the intra-axonal current, and bold dotted arrows representing the volume current are additionally illustrated in FIG. 7 for facilitating the reader's understanding, and these bold solid arrows and bold dotted arrows are not included in the image displayed on the screen.
- the intra-axonal current flows through the neural pathway illustrated in FIG. 6 . Accordingly, by setting the virtual electrodes VEc, VEl, and VEr along the neural pathway illustrated in FIG. 6 , it is possible to extract the intra-axonal current and the depolarization current (volume current) represented by the arrows in FIG. 7 , by the technique illustrated in FIG. 5 . As illustrated in FIG. 17 which will be described later, the neural pathway, the virtual electrodes VEc, VEl, VEr, or the like may further be superimposed on the image in which the arrows representing the currents and the current intensity distribution are superimposed on the morphological image.
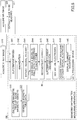
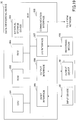
- FIG. 8 is a flow diagram illustrating an example of a process of displaying the current waveforms by the biometric information measuring apparatus 100 illustrated in FIG. 1 .
- the X-ray image of the subject is acquired using the X-ray machine, separately from measurement of the magnetic field signal of the subject.
- the MR image data of the subject is acquired using the magnetic resonance tomographic machine, and in step S21, a slice (MR image) to be measured is extracted from the MR image data.
- the process of step S21 may be performed by the data processing device 30.
- the CT image may be used in place of the MR image.
- the X-ray machine inside the shielded enclosure together with the SQUID magnetic sensors, it is possible to perform both radiography and measurement of the biometric magnetic field, in a state where the subject is lying on the bed inside the shielded enclosure. In this case, it is possible to accurately obtain the measuring positions of the magnetic field on the X-ray image, compared to the case where the X-ray image and the measurement of the biometric magnetic field are performed at different locations.
- step S41 to step S49 performed by the data processing device 30 the processes of steps other than step S41 may be performed by the biometric information display method that is implemented based on the display program executed by the data processing device 30.
- the process of step S41 may also be performed by the display program executed by the data processing device 30.
- step S41 a process of generating a new morphological image, by superimposing the X-ray image and a sliced MR image, is performed using the data processing device 30.
- the images may be superimposed by the operator of the data processing device 30, by moving and rotating one of the two images displayed on the display device 90 on the screen of the display device 90 using the input device 80, such as the mouse or the like.
- the input controller 40 accepts the operation performed by the operator, and the image display section 51 moves or rotates the image displayed on the display device 90 according to the accepted operation.
- the superimposed images are stored in the storage 70, as the morphological image data 72.
- the operator of the data processing device 30 may also be simply referred to as the operator.
- the process of superimposing the X-ray image and the MR image may be performed automatically using an image recognition technique. In this case, it is possible to utilize the machine learning technique, such as the deep learning or the like.
- the process of step S41 may be performed by a superimposing processor (not illustrated) provided in the operation controller 60.
- step S42 the data processing device 30 binarizes the MR image superimposed with the X-ray image, to generate a binary image, and stores the generated binary image in the storage 70, as the morphological image data 72.
- step S43 the pathway generating section 61 of the data processing device 30 automatically extracts the neural pathway using the binary image.
- the process of step S42 to binarize the image may be omitted.
- the pathway generating section 61 extracts the neural pathway by generating a curve (including a straight line) based on coordinates of a plurality of specified positions designated by the operator on the image while viewing the morphological image displayed on the display device 90.
- the pathway generating section 61 may generate a Bezier curve from the coordinates of the plurality of specified positions designated by the operator. By generating the Bezier curve, it is possible to easily and finely adjust (or control) the neural pathway while viewing the morphological image, and to easily generate a curve that indicates a neural pathway almost identical to the actual neural pathway.
- the pathway generating section 61 may utilize the machine learning technique, such as the deep learning or the like.
- the image display section 51 displays the neural pathway extracted by the pathway generating section 61, by superimposing the neural pathway on the morphological image displayed on the screen of the display device 90.
- the pathway generating section 61 stores the coordinates of the extracted neural pathway on the image, the formula of the curve, or the like, in the storage 70.
- the binarization process of step S42 may also be omitted in the case where the neural pathway is extracted automatically, and in this case, the pathway generating section 61 automatically extracts the neural pathway using the image superimposed in step S41.
- the MR image By using the MR image, it is possible to obtain detailed morphological information related to the manner in which the nerve of the subject runs. For this reason, by superimposing (aligning) the X-ray image and the MR image in step S41, the MR image can be utilized to easily determine the neural pathway matching the axon nerve. Accordingly, in step S48 and step S49 which will be described later, it is possible to acquire and display the current waveform at the exact position of the nerve of interest.
- step S30 the biometric information measuring apparatus 100 measures the biometric magnetic field of the subject by the SQUID magnetic sensors, for example, in synchronism with an electrical pulse stimulation applied to the peripheral nerve of the subject.
- step S31 the signal acquiring section 20 generates the digital magnetic field data based on the voltage output from the SQUID magnetic sensors in correspondence with the measured magnetic field, and stores the generated magnetic field data in the storage 70, as the biometric magnetic field data 71.
- Step S30 and step S31 are repeated. By the processes performed up to this point, preparations for acquiring the current waveform at the parts of the subject to be measured are completed.
- step S44 the operation controller 60 of the data processing device 30 uses the position of the marker MK illustrated in FIG. 6 as a reference, for example, and coordinates the measuring position of the magnetic field data within the image in which the neural pathway is extracted, so as to correspond to the position of the marker MK. More particularly, the operation controller 60 detects the positions of the plurality of SQUID magnetic sensors within the image in which the neural pathway is extracted, from the magnetic field data of the marker MK measured by the SQUID magnetic sensors, and the marker MK appearing in the X-ray image.
- the correspondence between the image and the measuring positions of the magnetic field data may be performed by the reconstruction analyzing section 63, or may be performed by a dedicated circuit or means (not illustrated).
- step S45 the reconstruction analyzing section 63 reconstructs the current component, based on the magnetic field data at each measurement time or timing.
- the current component is reconstructed for each of the voxels illustrated in FIG. 5 .
- the reconstruction analyzing section 63 stores the current information indicating the direction, intensity, coordinates, or the like of the current obtained by the reconstruction in the storage 70, as the morphological image data 72.
- step S46 the reconstruction analyzing section 63 instructs the image display section 51 to display the arrows representing the direction and intensity of the current for each of the voxels obtained by the reconstruction, on the image superimposed in step S41.
- the reconstruction analyzing section 63 extracts the positions having the same current intensity in the image, based on the intensity of the current for each of the voxels, and displays the extracted positions in a state superimposed on the image, as the current intensity distribution.
- the reconstruction analyzing section 63 stores information indicating the current intensity distribution in the storage 70, as morphological image data 72.
- FIG. 7 for example, the X-ray image or the like, and the current distribution (arrows of the current and the current intensity distribution) reconstructed at each measurement time or timing, are superimposed and displayed on the screen.
- the virtual electrode generating section 62 sets a predetermined number of virtual electrodes VEc, spaced apart from each other, on the neural pathway extracted in step S43.
- the number and the spacing of the virtual electrodes VEc may be preset by the operator, or the like.
- the virtual electrode generating section 62 sets the virtual electrodes VEl and VEr on both sides of each of the virtual electrodes VEc in the direction perpendicular to the neural pathway.
- the virtual electrode generating section 62 stores the coordinates of the set virtual electrodes VEc, VEl, and VEr on the image in the storage 70, as the morphological image data 72.
- the virtual electrode generating section 62 instructs the image display section 51 to superimpose and display the set virtual electrodes VEc and the set virtual electrodes VEl and VEr on the image displaying the neural pathway.
- the virtual electrodes VEc set on the neural pathway (nerve axon), and the virtual electrodes VE1, VEr, or the like set on both sides of each of the virtual electrodes VEc are superimposed on the X-ray image or the like and displayed on the display device 90.
- step S48 the current component extracting section 64 acquires the current data, varying with the lapse of time, at each of the virtual electrodes VEc, VE1, and VEr, as the current waveforms. Then, in step S49, the current component extracting section 64 instructs the waveform display section 52 to display the acquired current waveforms on the screen of the display device 90.
- the waveform display section 52 displays the time variation of the current component extracted by the current component extracting section 64 at each of the virtual electrodes VE, on the display device 90, as the current waveform.
- the current waveform may be displayed in a window of the screen, separate from the window in which the morphological image is displayed on the screen of the display device 90.
- FIG. 9 is a flow diagram illustrating another example of the process of displaying the current waveforms by the biometric information measuring apparatus 100 illustrated in FIG. 1 .
- a detailed description of steps that are same as the steps illustrated in FIG. 8 will be omitted.
- the process illustrated in FIG. 9 is similar to the process illustrated in FIG. 8 , except that in FIG. 9 , the neural pathway is extracted using only the X-ray image, and no binarization of the image is performed. In other words, steps S20, S21, S41, and S42 in FIG. 8 are deleted in the process illustrated in FIG. 9 .
- the pathway generating section 61 extracts the neural pathway using the X-ray image.
- the neural pathway may be extracted based on the coordinates of a plurality of specified positions on the image designated by the operator, or may be extracted automatically utilizing the machine learning technique, such as the deep learning or the like.
- the neural pathway may be extracted using only the MR image.
- step S20 and step S21 illustrated in FIG. 8 are performed in place of step S10 illustrated in FIG. 9 , and step S43 is performed thereafter.
- a process corresponding to step S42 that binarizes the MR image may be additionally performed before step S43.
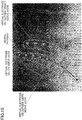
- FIG. 10 is a diagram for explaining an example in which the virtual electrodes VE are set along the neural pathway running from the right foot to the lumbar part.
- FIG. 10 illustrates an image in which the neural pathway and the virtual electrodes VEc, VEl, and VEr are superimposed on the X-ray image, and displayed on the screen of the display device 90 within an image display window for displaying an image.
- a lower left portion corresponds to the right foot
- a lower right portion corresponds to a left foot
- an upper portion corresponds to the lumbar part.
- the image illustrated in FIG. 10 is displayed on the screen of the display device 90 by the processes of step S43 and step S47 illustrated in FIG. 8 and FIG. 9 .
- arrows representing the current component of each of the voxels, and a current intensity distribution may be superimposed on the image illustrated in FIG. 10 .
- a curved neural pathway extracted in correspondence with the nerve axon running from the right foot to the lumbar part, is represented by a black bold solid line.
- the virtual electrode VEc set at a plurality of positions is displayed as a double circle, and the virtual electrodes VEl and VEr set at a plurality of positions are displayed as symbols X.
- the virtual electrodes VEc are set at a specified spacing designated by the operator, and are equally spaced in this example.
- the neural pathway may be represented by the Bezier curve. Both ends of the extracted neural pathway are represented by black circles with white bordering. Four small white rectangles arranged along the neural pathway represent specified positions designated by the operator to draw the Bezier curve.
- the neural pathway may be drawn freehand by the operator.
- Numbers displayed adjacent to the virtual electrodes VEr indicate electrode numbers that are assigned to identify each of the virtual electrodes VEc, and the virtual electrodes VEl and VEr corresponding to each of the virtual electrodes VEc.
- the virtual electrode VEc and each of the virtual electrodes VEl and VEr, assigned a common electrode number, are connected to each other by black bold solid lines. Since the actual screen may display the image in full color, various lines and marks may be displayed in different colors for easy identification.
- the neural pathway can be set to the curved shape of the actual nerve axon, and the virtual electrodes VEc, VEl, and VEr can be set to arbitrary positions. For this reason, it is possible to extract the current waveform at an arbitrary position along the shape of the nerve axon, thereby enabling correct evaluation of the intra-axonal current and the volume current.
- the shape of the neural pathway can be repeatedly varied, by accepting, by the position input section 41, an operation performed by the operator using the mouse or the like, to move the small white rectangles.
- the number of virtual electrodes VEc, VEl, and VEr, and the spacings of the virtual electrodes VEc, VEl, and VEr can be freely set and reset, by accepting, by the position input section 41, an operation performed by the operator using the input device 80, such as the mouse, the keyboard, or the like.
- the varied neural pathway and virtual electrodes VE are superimposed on the image, and displayed in a refreshed state.
- the position input section 41 accepts an instruction to vary the neural pathway and the virtual electrodes VE on the image
- the pathway generating section 61 varies the shape of the neural pathway based on the instruction
- the image display section 51 superimposes and displays the varied neural pathway together with the moved virtual electrodes VE on the image in the refreshed state.
- the current component extracting unit 64 reextracts the current component at the varied (or moved) virtual electrodes VE, and regenerates the current waveform based on the reextracted current component.
- the waveform display section 52 displays the regenerated current waveform on the screen of the display device 90 in the refreshed state.
- the virtual electrodes VE are set by extracting the neural pathway using only the X-ray image, it becomes possible to perform both the radiography and the measurement of the biometric magnetic field of the subject inside the shielded enclosure as described above, thereby enabling the measuring positions of the magnetic field in the X-ray image to be accurately obtained.
- FIG. 11 is a diagram for explaining an example of the current waveforms at the virtual electrodes VEc, VEl, and VEr illustrated in FIG. 10 .
- the current waveforms (time variations of the current intensities) are displayed for each of the virtual electrodes VEc, VE1, and VEr using a common time base for all of the electrode numbers.
- the current waveforms illustrated in FIG. 11 are displayed in waveform display windows that are different from the image display window of the screen of the display device 90, by the processes of step S48 and step S49 illustrated in FIG. 8 and FIG. 9 .
- Numerical values illustrated at the bottom right of each graph in FIG. 11 (in this example, 2nAm) indicate current dipoles.
- Variations in the current flowing through the nerve axon can be observed from the current waveform at the virtual electrode VEc, and variations in the volume current flowing into the nerve axon can be observed from the current waveforms at each of the virtual electrodes VEl and VEr.
- current may be evaluated by the latency, which is the time from the application of the electrical stimulation to the peripheral nerve of the subject until the current value varies greatly, and this latency can be detected from a peak value of the current waveform.
- the latency increases for the virtual electrode VEc having the larger electrode number, indicating that the electrical signal is transmitted from the side closer to the peripheral nerve to the side closer to the central nerve of the nerve axon.
- the graph of the current waveform may be one of the graph of the current waveform at the virtual electrode VEc illustrated at a center portion of FIG. 11 , the graph of the current waveform at the virtual electrode VEl illustrated at a left portion of FIG. 11 , and the graph of the current waveform at the virtual electrode VEr illustrated at a right portion of FIG. 11 .
- the current waveform at the virtual electrode VEl is small compared to the current waveforms at the virtual electrode VEc and VEr. This is because, when the virtual electrodes VEl are set from the right foot toward the lumbar part as illustrated in FIG. 10 , particularly the virtual electrode VEl on the side closer to the right foot is located at the end of the subject, thereby making the current component reconstructed from the magnetic field data small.
- the virtual electrodes VEl and VEr on both sides of each of the virtual electrodes VEc, it is possible to increase the possibility of detecting the waveform of the volume current flowing into the nerve axon at either the virtual electrode VEl or the virtual electrode VEr.
- FIG. 12 is a diagram for explaining an example in which the neural pathway is extracted using the MR image.
- step S20 and step S21 illustrated in FIG. 8 are performed instead of step S10 illustrated in FIG. 9 , and step S43 is performed thereafter.
- a left portion of FIG. 12 illustrates the MR image before the neural pathway is extracted, and a right portion of FIG. 12 illustrates the MR image after the neural pathway is extracted.
- both the neural pathway running from the right foot to the lumbar part, and the neural pathway running from the left foot to the lumbar part, are extracted, as represented by thick white lines in the right portion of FIG. 12 .
- the neural pathways may be extracted, based on the coordinates of the plurality of specified positions on the image designated by the operator, or may be extracted automatically utilizing the machine learning technique, such as the deep learning or the like.
- the MR image By using the MR image, it is possible to obtain the detailed morphological information related to the manner in which the nerve of the subject runs. For this reason, after the neural pathway is extracted using the MR image, for example, it is possible to align the extracted neural pathway (that is, superimpose the image of the extracted neural pathway) to the X-ray image. Further, the binary image may be used when automatically extracting the neural pathway using the MR image.
- FIG. 13 is a diagram for explaining an example (comparative example) in which the neural pathway is set linearly.
- the X-ray image illustrated in FIG. 13 is similar to that of FIG. 10 , and is a captured image, from the foot to the lumbar part of the subject.
- the virtual electrodes VEc set on the neural pathway is not aligned with the nerve axon, because the neural pathway is not aligned to the nerve axon when the neural pathway is set linearly.
- the virtual electrodes VEl and VEr which are set on both sides of each of the virtual electrodes VEc, do not extend along both sides of the nerve axon.
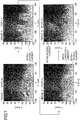
- FIG. 14 is a diagram for explaining an example of the current waveforms at the virtual electrodes VEc, VEl, and VEr illustrated in FIG. 13 .
- FIG. 14 a detailed description of the same elements as in FIG. 11 will be omitted.
- the actual neural pathway is curved. For this reason, when the virtual electrodes VE are set linearly, the current waveform flowing through the actual nerve axon becomes separated into the current waveform at the virtual electrode VEl and the current waveform at the virtual electrode VEc.
- FIG. 14 is a diagram for explaining an example of the current waveforms at the virtual electrodes VEc, VEl, and VEr illustrated in FIG. 13 .
- FIG. 14 a detailed description of the same elements as in FIG. 11 will be omitted.
- the actual neural pathway is curved. For this reason, when the virtual electrodes VE are set linearly, the current waveform flowing through the actual nerve axon becomes separated into the current waveform at the virtual electrode VEl and the current
- the current waveforms flowing through the nerve axon are separated and displayed separately as waveforms at the virtual electrodes VE1 having the electrode numbers No.0 through No.2 surrounded by a dotted oval and a latency of approximately 16.5 ms, and waveforms at the virtual electrodes VEl having the electrode numbers No.4 through No.6 surrounded by a dotted oval and a latency of approximately 22 ms.
- an evaluator such as a physician or the like, who evaluates the nerve function of the subject, is required to evaluate the state of the current flowing through the nerve axon, by adding the current waveforms at the virtual electrodes VEl and the current waveforms at the virtual electrodes VEc in the head of the evaluator.
- the positions of the virtual electrodes VEc are deviated from the neural pathway of the actual nerve axon, and the virtual electrodes VEl and VEr are not parallel to the neural pathway of the actual nerve axon. For this reason, the MCV calculated using the latencies of the current waveforms at the virtual electrodes VEc, for example, does not become the MCV of the actual nerve axon.
- the neural pathway by enabling the neural pathway to be set to the curve, as illustrated in FIG. 10 , it becomes possible to set the neural pathway and the virtual electrodes VE along the actual nerve axon. For this reason, it is possible to accurately and easily calculate the MCV of the actual nerve axon, using only the latencies of the current waveforms at the virtual electrodes VEc.
- the evaluator such as the physician or the like, can evaluate the manner in which the intra-axonal current and the volume current flow, by simply observing the current waveforms at the virtual electrodes VEc.
- the evaluator such as the physician or the like, can evaluate the manner in which the volume current flows, by simply observing the current waveforms at the virtual electrodes VEl or the virtual electrodes VEr.
- FIG. 15 is a diagram for explaining an example in which the virtual electrodes VE are set along the neural pathway of a carpal tunnel part. In FIG. 15 , a detailed description of the same elements as in FIG. 10 will be omitted.
- FIG. 15 illustrates an example that uses the X-ray image to set the virtual electrodes VEc, VEl, and VEr, similar to FIG. 10 .
- the X-ray image in a right portion of FIG. 15 illustrating the wrist and vicinities thereof captured from the front, and the X-ray image in a left portion of FIG. 15 illustrating the wrist and the vicinities thereof taken from the side, are displayed on the screen of the display device 90.
- the X-ray image in the left portion of FIG. 15 may or may not be displayed, as appropriate.
- the spacing of the virtual electrodes VEc is set smaller than in FIG. 10 .
- a suitable number of virtual electrodes VEc can be set according to the size of the part to be evaluated.
- FIG. 16 is a diagram for explaining an example of the current waveforms at the virtual electrodes VEc, VEl, and VEr illustrated in FIG. 15 .
- a window for detecting the latency is set in the graphs of the current waveforms at the virtual electrodes VEc, VEl, and VEr.
- the operator may input a window set command, or select a window set command from a menu screen, for example, using the input device 80, such as the mouse, the keyboard, or the like.
- the waveform region designating section 42 instructs the waveform display section 52 to display straight lines indicating the window, based on the window setting command accepted from the input device 80.
- the waveform display section 52 displays two straight lines, indicated by one-dot chain lines in FIG. 16 , and perpendicular to the time base, in a display region of each of the graphs, based on the instruction from the waveform region designating section 42.
- the waveform region designating section 42 accepts an operation performed by the operator to select the one-dot chain line and move the selected one-dot chain line along the direction of the time base, and instructs the waveform display section 52 to move the display position of the one-dot chain line based on the accepted operation.
- the window that selects the range of a portion of the current waveform, that is, a time range of an arbitrary region sandwiched between the two one-dot chain lines.
- the position input section 41 receives an instruction that selects the range of the portion of the current waveform displayed on the display device 90, as positions of the two straight lines indicated by the one-dot chain lines in FIG. 16 .
- the window may be displayed in the graph of each of the current waveforms illustrated in FIG. 11 .
- the window is set to exclude current waveforms affected by noise caused by factors other than the body function or activity (that is, avoid the influence of magnetic fields from and vicinities of the biometric information measuring apparatus 100).
- the conduction velocity calculating section 65 detects peaks of the current waveform within the window, as feature points, and regards an appearing duration (time) of the peaks as the latency.
- the waveform region designating section 42 accepts, from the operator via the input device 80, an instruction to select two current waveforms for calculating a conduction velocity CV of the nerve activity.
- the waveform region designating section 42 accepts, from the operator, the positions of the current waveforms extracted at the virtual electrodes VEr having the electrode numbers No.1 and No.3, from among the plurality of current waveforms extracted at the virtual electrodes VEr, and an instruction to calculate the conduction velocity CV.
- the conduction velocity calculating section 65 calculates the conduction velocity CV (55.582 m/s), based on the accepted instruction, and notifies the calculated conduction velocity CV to the waveform display section 52 together with information indicating the current waveforms used for the calculation of the conduction velocity CV. For example, the conduction velocity calculating section 65 calculates the conduction velocity CV, by dividing the distance between the two virtual electrodes VE from which the two current waveforms designated by the operator are extracted, by the latency difference between the latencies of the two current waveforms, as indicated by a formula illustrated in FIG. 3 .
- the waveform display section 52 displays the conduction velocity CV calculated by the conduction velocity calculating section 65, within the graph together with a line connecting the peaks of the current waveforms used for calculating the conduction velocity CV, for example.
- the waveform display section 52 displays the conduction velocity CV in correspondence with the current waveforms used for the calculating the conduction velocity CV. Accordingly, the evaluator, such as the physician or the like, can visually ascertain the conduction velocity CV, while viewing the displayed graph of the current waveforms.
- the example illustrated in FIG. 16 may be used for the diagnosis of whether the nerve in the carpal tunnel of the subject is pinched, compressed, or the like.
- the distance between the two virtual electrodes VE is not a linear distance, and is the length along the neural pathway.
- the neural pathway extracted in step S43 illustrated in FIG. 8 is formed by a plurality of line segments. Accordingly, even in a case where the conduction velocity CV is calculated by a simple division, it is possible to accurately calculate the conduction velocity CV according to the length of the actual neural pathway.
- the conduction velocity calculating section 65 can calculate the conduction velocity CV from the current waveform data by a simple calculation. Furthermore, by setting the virtual electrodes VE at equal spacing, the evaluator, such as the physician or the like, can ascertain the approximate conduction velocity CV by simply viewing the graphs of the current waveforms, even before the conduction velocity CV is displayed.
- the one-dot chain lines that are moved on the screen according to the instruction from the operator may be the peak values (indicating latency) of the current waveforms at the two virtual electrodes VE.
- the position input section 41 accepts the input of the two electrode numbers used for calculating the conduction velocity CV, and the changes in the positions of the one-dot chain lines.
- the conduction velocity calculating section 65 can calculate the conduction velocity CV, by dividing the distance between the two virtual electrodes VE corresponding to the two electrode numbers that are input, by a time difference of the two one-dot chain lines.
- the peak values that can detect the latency do not appear in the current waveforms at the virtual electrodes VEl illustrated in FIG. 16 . Even in this case, it is possible to calculate the conduction velocity CV, using the current waveforms at the virtual electrodes VEr on the opposite side from the virtual electrodes VE1.
- FIG. 17 is a diagram for explaining an example in which the virtual electrodes VE are set along the neural pathway running from the left foot to the lumbar part.
- FIG. 17 illustrates an example that uses the X-ray image to set the virtual electrodes VEc, VEl, and VEr along the neural pathway running from the left foot to the lower back, similar to FIG. 10 .
- the arrows indicating the current components and the current intensity distribution are superimposed and displayed on the screen, together with the X-ray image, the neural pathway, and the virtual electrodes VE.
- FIG. 18 is a diagram for explaining an example of the current waveforms at the virtual electrodes VEc, VEl, and VEr illustrated in FIG. 17 .
- the window for detecting the latency is set in the graphs of the current waveforms at the virtual electrodes VEc, VE1, and VEr, similar to FIG. 16 .
- the waveform region designating section 42 accepts from the operator, the positions of the current waveforms extracted at the virtual electrodes VEl having the electrode numbers No.2 and No. 4, from among the plurality of current waveforms extracted at the virtual electrode VE1, and the instruction to calculate the conduction velocity CV.
- the conduction velocity calculating section 65 calculates the conduction velocity CV (65.030 m/s), based on the accepted instruction.
- the waveform display section 52 displays the conduction velocity CV calculated by the conduction velocity calculating section 65, in the graph, together with the line connecting the peaks of the current waveforms used for calculating the conduction velocity CV, for example.
- the evaluator such as the physician or the like, can utilize the visualized nerve activity for the diagnosis of the nerve activity or the like of a patient with disc herniation, for example.
- FIG. 19 is a block diagram illustrating an example of a hardware configuration of the data processing device 30 illustrated in FIG. 1 .
- the data processing device 30 includes a CPU 301, a read only memory (ROM) 302, a random access memory (RAM) 303, and an external storage device 304.
- the data processing device 30 also includes an input interface 305, an output interface 306, an input-output (I/O) interface 307, and a communication interface 308.
- the CPU 301, the ROM 302, the RAM 303, the external storage device 304, the input interface 305, the output interface 306, the I/O interface 307, and the communication interface 308 are connected to each other through a bus BUS.
- the CPU 301 executes various programs, such as an operating system (OS), application programs, or the like, and controls the general operation of the data processing device 30.
- the ROM 302 stores basic programs, various parameters, or the like for enabling the various programs to be executed by the CPU 301.
- the RAM 303 stores the various programs executed by the CPU 301, data used by the various programs, or the like.
- the external storage device 304 may be formed by an HDD, a solid state drive (SSD), or the like, and stores the various programs loaded into the RAM 303.
- the various programs may include a display program for displaying the current waveforms, reconstructed from the magnetic field data, on display device 90.
- the input device 80 such as the keyboard, the mouse, a tablet, or the like, which accepts the input from the operator or the like who operates the data processing device 30, is connected to the input interface 305.
- An output device 92 such as a display device (the display device 90 illustrated in FIG. 1 , for example) that displays a screen (or display screen) or the like generated by the various programs executed by the CPU 301, a printer, or the like, is connected to the output interface 306.
- a recording medium 400 such as a universal serial bus (USB) memory or the like, is connected to the I/O interface 307.
- the recording medium 400 may store the various programs, such as the above described display program for displaying the current waveforms on the display device 90.
- the programs are transferred from the recording medium 400 to the RAM 303 through the I/O interface 307.
- the recording medium 400 may be formed by a compact disk-ROM (CD-ROM), a digital versatile disk (DVD, registered trademark), or the like.
- the I/O interface 307 includes an interface corresponding to the recording medium 400 connected thereto.
- the communication interface 308 connects the data processing device 30 to a network or the like.
- the ROM 302, the recording medium 400, or the like are examples of a non-transitory computer-readable recording medium that stores one or more programs executed by a computer, such as the CPU 301.
- the neural pathway from which the current components are to be extracted in the subject, by utilizing the morphological image of the subject.
- the neural pathway is curved, it is possible to extract the current waveforms at arbitrary positions along the shape of the neural pathway, and enable correct evaluation of the intra-axonal current and the volume current.
- a detailed evaluation of the nerve function becomes possible, without imposing strain on the subject.
- the plurality of virtual electrodes VEc can be set along the neural pathway, it becomes possible to evaluate the intra-axonal current, using only the current waveforms at the virtual electrodes VEc.
- the plurality of virtual electrodes VEl and the plurality of virtual electrodes VEr can be set along both sides of the neural pathway, it becomes possible to evaluate the volume current flowing into the nerve axon, using only the current waveforms at the virtual electrodes VEl, or using only the current waveforms at the virtual electrodes VEr.
- the shape of the neural pathway, and the number and the spacing of each of the virtual electrodes VEc, VEl, and VEr, may be reset repeatedly. Accordingly, the positions of the virtual electrodes VE may be varied repeatedly, until the current waveform that enables the evaluation, diagnosis, or the like is obtained.
- the pathway generating section 61 generates the Bezier curve as the curve representing the neural pathway, thereby enabling the operator to easily and finely adjust the neural pathway while viewing the morphological image, and thus, it is possible to easily generate the curve representing the neural pathway almost identical to the actual neural pathway.
- the conduction velocity CV can be calculated from the current waveform data without measuring the currents using the electromyograph or the like.
- the time range of the current waveforms used for the calculation of the conduction velocity CV it is possible to prevent the detection of the erroneous latency caused by the noise waveform or the like outside the window, and thus, it is possible to calculate the correct conduction velocity CV.
- the range in which the latency is to be detected as the window sandwiched by the straight lines, it is possible to calculate the conduction velocity CV using a simple technique.
- the conduction velocity calculating section 65 By superimposing the conduction velocity CV calculated by the conduction velocity calculating section 65 on the current waveforms, and displaying the superimposed image on the screen of the display device 90, it becomes possible for the evaluator, such as the physician or the like, to visually ascertain the conduction velocity CV while viewing the displayed graph of the current waveforms.
- the conduction velocity calculating section 65 can calculate the conduction velocity CV from the current waveform data by a simple calculation.
- the evaluator such as the physician or the like, can visually ascertain the approximate conduction velocity CV by simply viewing the graph of the current waveforms, even before the conduction velocity CV is displayed.
- the MR image that illustrates in detail the manner in which the nerve of the subject runs
- the X-ray image By superimposing the X-ray image with the MR image, it is possible to ascertain the part to be measured that is displayed in the image, with reference to a skeletal system, for example.
- each of the embodiments describes the example in which the current is reconstructed from the biometric magnetic field data of the subject, and the current waveforms at the virtual electrodes set along the neural pathway are displayed on the screen.
- the biometric magnetic field data of the subject may be used to measure the amount of magnetic field per magnetic sensor (per channel), and virtual measuring points for measuring the magnetic field may be set along the neural pathway, to display, on the screen, the magnetic field waveform at each of the virtual measuring points for measuring the magnetic field.
- the component of the waveforms displayed on the screen may be other than the current, provided that the component is a signal that can be expressed as a vector quantity.
Landscapes
- Health & Medical Sciences (AREA)
- Life Sciences & Earth Sciences (AREA)
- Engineering & Computer Science (AREA)
- Medical Informatics (AREA)
- Physics & Mathematics (AREA)
- Biomedical Technology (AREA)
- Veterinary Medicine (AREA)
- Public Health (AREA)
- General Health & Medical Sciences (AREA)
- Animal Behavior & Ethology (AREA)
- Surgery (AREA)
- Biophysics (AREA)
- Pathology (AREA)
- Heart & Thoracic Surgery (AREA)
- Molecular Biology (AREA)
- Nuclear Medicine, Radiotherapy & Molecular Imaging (AREA)
- Radiology & Medical Imaging (AREA)
- High Energy & Nuclear Physics (AREA)
- Neurology (AREA)
- Optics & Photonics (AREA)
- Theoretical Computer Science (AREA)
- Neurosurgery (AREA)
- General Physics & Mathematics (AREA)
- Pulmonology (AREA)
- Human Computer Interaction (AREA)
- Computer Vision & Pattern Recognition (AREA)
- Physiology (AREA)
- Computer Hardware Design (AREA)
- Artificial Intelligence (AREA)
- Psychiatry (AREA)
- Signal Processing (AREA)
- Measurement And Recording Of Electrical Phenomena And Electrical Characteristics Of The Living Body (AREA)
- Apparatus For Radiation Diagnosis (AREA)
- Magnetic Resonance Imaging Apparatus (AREA)
Abstract
Description
- The present invention relates to a biometric information display device, a biometric information display method, and a display program.
- In a magnetic field measuring device for measuring a magnetic field generated by a living body, a technique that estimates a current flowing through the living body based on the measured magnetic field, and displays the estimated current distribution, waveform, isocontour field distribution of the magnetic field, or the like in multiple windows of a single screen, is described in Japanese Unexamined Patent Application Publication No.
2008-178558 - In addition, in a magnetocardiograph, a technique that obtains an intramyocardial current distribution as an appropriate current value based on the measured magnetic field data, and displays the current distribution on a display device, is described in Japanese Unexamined Patent Application Publication No.
2007-125236 - The current generated by a nerve activity includes an intra-axonal current component that flows through the nerve axon, and a volume current component that flows outside the nerve axon and returns back to a depolarization point. For example, the intra-axonal current component and the volume current component, estimated from the magnetic field data measured by the magnetic field measuring device, may be superimposed on a morphological image of a part of the living body to be measured. The superimposed image may be displayed on the display device, and a nerve function may be evaluated based on the displayed information.
- Because the intra-axonal current component flows along a neural pathway, positions where the intra-axonal current component is to be extracted are required to be set according to the actual neural pathway, in order to extract the correct intra-axonal current component from the magnetic field data. For example, in a case where the neural pathway is curved, the positions where the intra-axonal current component is to be extracted are required to be set according to the curved shape of the neural pathway.
- The correct intra-axonal current component cannot be obtained, and the nerve function cannot be correctly evaluated, if the positions where the intra-axonal current component is to be extracted are not set along the curved shape of the actual neural pathway. Similar to the intra-axonal current component, positions where the volume current component is to be extracted are required to be set according to the curved shape of the neural pathway, in order to estimate the correct volume current component.
- Accordingly, one object of the embodiments is to provide a biometric information display device, a biometric information display method, and a display program, which can generate a pathway from which a current component is to be extracted from a subject, using a morphological image of the subject.
- According to one aspect of the embodiments, a biometric information display device includes a display controller configured to display a morphological image indicative of a morphology of a subject, on a display; an input controller configured to receive a designation of a specified position on the morphological image; a pathway generating section configured to generate a pathway based on the specified position on the morphological image; and a current extracting section configured to extract current components at a plurality of positions along the pathway, based on current information reconstructed based on magnetic field measurement data generated by the subject, wherein the display controller configured to display the current components extracted along the pathway on the display.
- According to another aspect of the embodiments, a biometric information display method to be implemented in a biometric information display device that includes a display controller configured to display a morphological image indicative of the morphology of a subject, and an input controller configured to receive a designation of a specified position on the morphological image, the biometric information display method including generating a pathway based on the specified position on the morphological image; extracting current components at a plurality of positions along the pathway, based on current information reconstructed based on magnetic field measurement data generated by the subject; and displaying the current components extracted along the pathway on a display.
- According to still another aspect of the embodiments, a display program which, when executed by a computer of a biometric information display device that includes a display controller configured to display a morphological image indicative of the morphology of a subject, and an input controller configured to receive a designation of a specified position on the morphological image, causes the computer to perform a process including generating a pathway based on the specified position on the morphological image; extracting current components at a plurality of positions along the pathway, based on current information reconstructed based on magnetic field measurement data generated by the subject; and displaying the current components extracted along the pathway on a display.
- Other features of the embodiments will be apparent from the following detailed description when read in conjunction with the accompanying drawings.
-
-
FIG. 1 is a block diagram illustrating an example of a biometric information measuring apparatus including a biometric information display device according to one embodiment of the present invention. -
FIG. 2 is a diagram for explaining an example of a model of a nerve activity current. -
FIG. 3 is a diagram for explaining an example of a method for calculating a motor nerve conduction velocity. -
FIG. 4 is a diagram for explaining an example in which virtual electrodes are set by a data processing apparatus illustrated inFIG. 1 . -
FIG. 5 is a diagram for explaining an example of a method for calculating a current intensity at the virtual electrode. -
FIG. 6 is a diagram for explaining a neural pathway running from a right foot to a lumbar part. -
FIG. 7 is a diagram for explaining an example of the nerve activity current generated along the neural pathway illustrated inFIG. 6 . -
FIG. 8 is a flow diagram illustrating an example of a process of displaying current waveforms by the biometric information measuring apparatus illustrated inFIG. 1 . -
FIG. 9 is a flow diagram illustrating another example of the process of displaying the current waveforms by the biometric information measuring apparatus illustrated inFIG. 1 . -
FIG. 10 is a diagram for explaining an example in which virtual electrodes are set along the neural pathway running from the right foot to the lumbar part. -
FIG. 11 is a diagram for explaining an example of the current waveforms at the virtual electrodes illustrated inFIG. 10 . -
FIG. 12 is a diagram for explaining an example in which the neural pathway is extracted using an MR image. -
FIG. 13 is a diagram for explaining an example (comparative example) in which the neural pathway is set linearly. -
FIG. 14 is a diagram for explaining an example of the current waveforms at the virtual electrodes illustrated inFIG. 13 . -
FIG. 15 is a diagram for explaining an example in which the virtual electrodes are set along the neural pathway of a carpal tunnel part. -
FIG. 16 is a diagram for explaining an example of the current waveforms at the virtual electrodes illustrated inFIG. 15 . -
FIG. 17 is a diagram for explaining an example in which the virtual electrodes are set along the neural pathway running from a left foot to the lumbar part. -
FIG. 18 is a diagram for explaining an example of the current waveforms at the virtual electrodes illustrated inFIG. 17 . -
FIG. 19 is a block diagram illustrating an example of a hardware configuration of a data processing device illustrated inFIG. 1 . - Embodiments will hereinafter be described with reference to the drawings. In drawings, the same constituent elements are designated by the same reference numerals, and a repeated description of the same constituent elements may be omitted.
-
FIG. 1 is a block diagram illustrating an example of a biometric information measuring apparatus including a biometric information display device according to one embodiment of the present invention. For example, a biometricinformation measuring apparatus 100 illustrated inFIG. 1 includes amagnetic sensor section 10, asignal acquiring section 20, adata processing device 30, aninput device 80, and adisplay device 90. Thedata processing device 30 may be a computer, such as a personal computer (PC), a server, or the like, that functions as the biometric information display device. Thedisplay device 90 is capable of displaying a morphological image of a subject (or test subject), such as an X-ray image or the like. The morphological image of the subject is indicative of a morphology of the subject. Thedisplay device 90 is an example of a display or display means. Thedisplay device 90 may be included in the biometric information display device, or may be externally connected to the biometric information display device, as appropriate. - The
signal acquiring section 20 includes a flux locked loop (FLL)circuit 21, ananalog signal processor 22, an analog-to-digital converter (ADC) 23, and a field programmable gate array (FPGA) 24. For example, themagnetic sensor section 10 and thesignal acquiring section 20 are provided inside a shielded enclosure that provides magnetic shielding, while thedata processing device 30, theinput device 80, and thedisplay device 90 are provided outside the shielded enclosure. For example, themagnetic sensor section 10 includes a plurality of superconducting quantum interference device (SQUID) magnetic sensors. Themagnetic sensor section 10 may include other types of magnetic sensors, such as magneto resistive (MR) sensors, optically pumped atomic magnetometer (OPAM) sensors, or the like, in place of the SQUID magnetic sensors. - The
data processing device 30 includes aninput controller 40, adisplay controller 50, anoperation controller 60, and astorage 70. For example, functions of theinput controller 40, thedisplay controller 50, and theoperation controller 60 may be performed by a processor, such as a central processing unit (CPU) or the like provided in thedata processing device 30, that implements a biometric information display method by executing a display program while cooperating with hardware. Theinput controller 40 is an example of an input control circuit or means, and thedisplay controller 50 is an example of a display control circuit or means. - The biometric
information measuring apparatus 100 may be used as a magnetoencephalograph (MEG), a magnetocardiograph (MCG), a magnetospinograph (MSG), or the like. The biometricinformation measuring apparatus 100 may be applied to measurements of a neural magnetic field, a muscular magnetic field, or the like, other than a spinal magnetic field. - The
magnetic sensor section 10 measures the magnetic field generated by the subject, and outputs the measured magnetic field as a voltage. Themagnetic sensor 10 includes the plurality of SQUID magnetic sensors that are provided at positions opposing magnetic field measuring parts of the subject lying on a bed, for example. TheFLL circuit 21 improves a dynamic range of themagnetic sensor section 10 by linearizing each of nonlinear magnetic field-voltage characteristics measured by the plurality of SQUID magnetic sensors. - The
analog signal processor 22 amplifies the linearized analog signal output from theFLL circuit 21, and performs a filter processing or the like on the amplified analog signal. TheADC 23 converts the filtered analog signal (magnetic field signal) into a digital value (magnetic field data). TheFPGA 24 further performs a filtering process, a thinning process, or the like on the digitized magnetic field data from theADC 23, and transmits the processed data to thedata processing device 30. - In the
data processing device 30, theinput controller 40 includes aposition input section 41 and a waveformregion designating section 42, and performs an input process on various information input by an operator of thedata processing device 30 via theinput device 80, such as a mouse, a keyboard, or the like. Functions of theposition input section 41 and the waveformregion designating section 42 will be described later. - The
display controller 50 includes animage display section 51 and awaveform display section 52, and performs a control to display the X-ray image, a current waveform, or the like on thedisplay device 90, such as a liquid crystal display (LCD) or the like. Functions of theimage display section 51 and thewaveform display section 52 will be described later. Theinput device 80 and thedisplay device 90 may be included in thedata processing device 30. In addition, an output device, such as a printer or the like, may be connected to thedata processing device 30. - The
operation controller 60 includes apathway generating section 61, a virtualelectrode generating section 62, areconstruction analyzing section 63, a currentcomponent extracting section 64, and a conductionvelocity calculating section 65. Thepathway generating section 61 is an example of a pathway generating circuit or means, the virtualelectrode generating section 62 is an example of a virtual electrode generating circuit or means, and the currentcomponent extracting section 64 is an example of a current component extracting circuit or means. The conductionvelocity calculating section 65 is an example of a conduction velocity calculating circuit or means. Functions of thepathway generating section 61, the virtualelectrode generating section 62, thereconstruction analyzing section 63, the currentcomponent extracting section 64, and the conductionvelocity calculating section 65 will be described later. - The
storage 70 may be formed by a storage device, such as a hard disk drive (HDD) or the like, and includes an area for storing biometricmagnetic field data 71,morphological image data 72, andvarious analysis parameters 73. The biometricmagnetic field data 71 include measurement data of the magnetic field measured by themagnetic sensor section 10 and processed by thesignal acquiring section 20. Themorphological image data 72 include X-ray image data captured by an X-ray machine, magnetic resonance (MR) image data captured by a magnetic resonance tomographic machine, or the like. In the following description, an X-ray morphological image of the subject generated from the X-ray image data will be referred to as the X-ray image, and a morphological image of the subject generated from the MR image data will be referred to as the MR image. In addition, a morphological image of the subject generated from the computed tomography (CT) scan image data will be referred to as a CT image. - The
analysis parameters 73 include setting values of a filter (highpass filter, lowpass filter, or the like) provided in thesignal acquiring section 20, parameters required for measuring the biometric magnetic field, such as a time range, a number of elements, or the like for performing various signal processing, and parameters required for implementing the biometric information display method. -
FIG. 2 is a diagram for explaining an example of a model of a nerve activity current.FIG. 2 illustrates a manner in which a current is generated by an activity of a nerve running linearly in an up-and-down (or vertical) direction inFIG. 2 , where a lower end inFIG. 2 corresponds to the side closer to a peripheral nerve, and an upper end inFIG. 2 corresponds to the side closer to a central nerve. For example, by applying an electrical stimulation to the peripheral nerve, the electrical stimulation is transferred, as the current, from the lower end toward the upper end of the nerve axon. - In this state, an intra-axonal current and a volume current are generated. The intra-axonal current includes an intra-axonal current component that flows toward the upper end (in a forward direction) in
FIG. 2 , and an intra-axonal current component that flows toward the lower end (in a reverse direction) inFIG. 2 . The volume current includes a volume current component that flows outside the nerve axon and returns back to a depolarization point. In the following description, the intra-axonal current component that flows toward the upper end inFIG. 2 will be referred to as a leading component, and the intra-axonal current component that flows toward the lower end inFIG. 2 will be referred to as a trailing component. - In order to evaluate the nerve function in detail, it is preferable to extract the intra-axonal current flowing along the nerve axon, and a current flowing perpendicularly into the nerve axon due to the volume current, and visually display the extracted currents on a screen or the like of the
display device 90. -
FIG. 3 is a diagram for explaining an example of a method for calculating a motor nerve conduction velocity. InFIG. 3 , the electrical stimulation is applied to each of a proximal end of a median nerve (for example, near an elbow) and a peripheral end (for example, near a wrist), currents generated in response to the electrical stimulation are measured by an electromyograph or the like via an electrode attached to a palm, and latencies of the currents are calculated from the measured current waveforms (time variations of current intensity). By dividing a distance between the stimulating points by a latency difference, a motor nerve conduction velocity (MCV), that is a conduction velocity of the stimulus inside the subject, can be obtained. As will be described later, by reconstructing (extracting) the current components from the magnetic field data, it is possible to calculate the MCV using the reconstructed current components, without having to measure the currents using the electromyograph or the like. -
FIG. 4 is a diagram for explaining an example in which virtual electrodes VE (VEc, VEl, and VEr) are set by thedata processing device 30 illustrated inFIG. 1 . In the following description, when describing the virtual electrodes VEc, VEl, and VEr without distinguishing these virtual electrodes from one another, these virtual electrodes may also be referred to as virtual electrodes VE. The virtual electrode VEc is an example of a first virtual electrode, the virtual electrode VEl is an example of a second virtual electrode, and the virtual electrode VEr is an example of a third virtual electrode. - Here, the virtual electrode VE refers to an imaginary electrode that is virtually set on the X-ray image or the MR image of the subject, and indicates a current extraction point (current observation point) at which the current component is to be extracted (reconstructed) from magnetic field data, among the magnetic field measuring parts of the subject. Since the method for extracting the current is known, a detailed description thereof will be omitted.
- In
FIG. 4 , an X-Y plane is parallel to a sensing surface of an SQUID magnetic sensor array, an X direction is the direction in which the SQUID magnetic sensor array is arranged, a Y direction is perpendicular to the X direction, and a Z direction is perpendicular to the X-Y plane and toward the SQUID magnetic sensor array. Symbols rc, sc, rl, sl, rr, and sr illustrated inFIG. 4 denote the following contents. - rc:
- Intra-axonal current acquiring position = (xc, yc)
- sc:
- Estimated current = (sxc, syc) at rc
- rl:
- Left volume current acquiring position = (xl, yl)
- s1:
- Estimated current = (sxl, syl) at rl
- rr:
- Right volume current acquiring position = (xr, yr)
- sr:
- Estimated current = (sxr, syr) at rr
- 0:
- Angle of the nerve axon (= angle of nerve axon direction with respect to X direction)
- In
FIG. 4 , a plurality of virtual electrodes VEc are set on a neural pathway (nerve axon) running linearly in the morphological image (X-ray image) of the subject. In addition, virtual electrodes VEl and VEr outside (left and right sides of) the nerve axon are set on both sides of the nerve axon (in a direction perpendicular to the neural pathway) at each virtual electrode VEc. InFIG. 4 , rectangles illustrated in peripheries of the virtual electrodes VEc, VEl, and VEr indicate definitions of the symbols rc, sc, rl, sl, rr, and sr for facilitating the reader's understanding, and these rectangles are not displayed on the actual screen. - In
FIG. 4 , a plurality of small arrows superimposed on the morphological image indicate directions of the currents extracted by reconstruction, and the length of each arrow indicates a current intensity. In the arrow, an end opposite the arrowhead indicates the position of a voxel that is the extraction unit of the current component. Further, a contour-like curve indicates a current intensity distribution that is generated by connecting the positions where the current intensities are the same. The arrows and the current intensity distribution indicating the current components are also illustrated in the morphological images illustrated inFIG. 7 andFIG. 17 which will be described later. - The neural pathway passing through the nerve axon is generated by the
pathway generating section 61, by detecting, by theposition input section 41, a plurality of positions designated on the morphological image via theinput device 80, and making calculations in thepathway generating section 61 using coordinates of the plurality of detected positions. For example, the positions indicating the neural pathway of the nerve axon may be input from theinput device 80 by the operator who operates thedata processing device 30 while viewing the nerve in the morphological image. - Alternatively, the neural pathway of the nerve axon may be set by the
data processing device 30 which infers (or derives) the position, running (or extending) direction, or the like of the nerve in the morphological image. In the case where the neural pathway of the nerve axon is set by inference, a machine learning, such as deep learning or the like, may be performed using a large number of morphological images in which the neural pathway is known in advance, and a neural network for setting the neural pathway may be constructed in thedata processing device 30 as thepathway generating section 61. The neural network for setting the neural pathway may be constructed in a cloud (or cloud computing system) that is connected to thedata processing device 30 via a network, and may be used by thedata processing device 30. - The
pathway generating section 61 notifies information indicating the calculated neural pathway to the virtualelectrode generating section 62. The calculated neural pathway may be represented by a formula or the like indicating a plurality of coordinate information or a curve. The virtualelectrode generating section 62 generates a plurality of virtual electrodes VEc at equal spacing, for example, on the neural pathway notified from thepathway generating section 61. The spacing and the number of virtual electrodes VEc generated on the neural pathway, are specified by the operator via theinput device 80, and stored in thestorage 70 by theinput controller 40. The virtualelectrode generating section 62 generates the virtual electrodes VEc on the neural pathway generated by thepathway generating section 61, according to the spacing and the number of virtual electrodes VEc stored in thestorage 70. - The virtual
electrode generating section 62 sets the virtual electrode VEl and the virtual electrode VEr outside the nerve axon, on both sides of the virtual electrode VEc, that is, on the left side and the right side of the virtual electrode VEc, respectively. A distance from the virtual electrode VEc to the virtual electrodes VEl and VEr outside the nerve axon, may be specified by the operator via theinput device 80, similar to the spacing between the virtual electrodes VEc. In a case where thestorage 70 does not store information indicating at least one of the spacing, the number, and the distance of the virtual electrodes VE, the virtualelectrode generating section 62 may generate the virtual electrodes VE using preset default values. - The
image display section 51 displays the morphological image on the screen of thedisplay device 90, and displays the virtual electrodes VEc, VEl, and VEr generated by the virtualelectrode generating section 62 in a state superimposed on the morphological image, as illustrated inFIG. 4 . When the virtualelectrode generating section 62 generates the virtual electrodes VEc, VEl, and VEr, the arrows indicating the currents and the current intensity distribution may be superimposed on the morphological image and displayed on the screen of thedisplay device 90, or only the morphological image may be displayed on the screen of thedisplay device 90, as appropriate. - The
reconstruction analyzing section 63 operates independently of the above described operations of thepathway generating section 61 and the virtualelectrode generating section 62, and reconstructs the current component for each of the voxels that are virtual current extraction points arranged at a predetermined spacing, using the magnetic field data of the subject measured by themagnetic sensor section 10. As illustrated inFIG. 4 , theimage display section 51 superimposes the arrow representing the direction and intensity of the current indicated by the reconstructed current component, on the morphological image and the virtual electrodes VEc, VEl, and VEr, to be displayed on the screen of thedisplay device 90. - The current
component extracting section 64 extracts the current component (current density distribution) at each virtual electrode VE using the current component at each voxel, based on a positional relationship between the voxels and each of the virtual electrode VEc, VEl, and VEr. An example of the extraction of the current component will be described with reference toFIG. 5 . - For example, the current
component extracting section 64 calculates the waveform for the intra-axonal current that conducts through the nerve axon, from the current component along the nerve axon, by regarding the head side of the arrow as being positive and the tail side of the arrow as being negative. The currentcomponent extracting section 64 calculates the waveform of the volume current, from the component perpendicular to the nerve axon, by regarding the direction toward the nerve axon as being positive. The component of the volume current, perpendicular to the nerve axon, is preferably used to evaluate the nerve function. - For example, the estimated current of each virtual electrode VE can be calculated from the following formulas (1), (2), and (3), where /Sc denotes the intra-axonal current from the virtual electrode VEc when the virtual electrode VEc is regarded as a base point, /Sl denotes the left volume current from the virtual electrode VE1 when the virtual electrode VE1 is regarded as a base point, /Sr denotes the right volume current from the virtual electrode VEr when the virtual electrode VEr is regarded as a base point, and a symbol "/" indicates an overbar.


- By calculating the formulas (1) through (3) with respect to the estimated current at all of the measured points in time, it is possible to acquire the current waveforms in which the values vary with the lapse of time.
-
FIG. 5 is a diagram illustrating an example of a method of calculating the current intensity at the virtual electrode VE. InFIG. 5 , the current intensity at the virtual electrode VE is calculated from the intensity of the current reconstructed on the voxels that are arranged in a matrix arrangement, using a linear interpolation technique. By this operation, it is possible to calculate the estimated intensity of the current in the X direction and the Y direction inFIG. 4 , at the virtual electrode VE. - In
FIG. 5 , the spacing of the voxels and the spacing of the virtual electrodes VE are approximately the same for the sake of convenience, to facilitate the reader's understanding thereof. However, in actual practice, the spacing of the virtual electrodes VE is several times the spacing of the voxels as illustrated inFIG. 4 , for example, and the spacing of the voxels and the spacing of the virtual electrodes VE may be set arbitrarily. In addition, with respect to the SQUID magnetic sensors that are arranged at a spacing that is several centimeters (cm), the voxels are arranged at the spacing of several millimeters (mm). - The current intensity at the virtual electrode VE may be calculated using the recursive null steering (RENS) filter method studied by the present inventors. In this case, the current intensity at each virtual electrode VE can be calculated accurately in a short period of time, compared to the case where the current intensity is calculated by the linear interpolation technique.
-
FIG. 6 is a diagram for explaining a neural pathway running from a right foot to a lumbar part.FIG. 6 illustrates the X-ray image of the subject displayed on thedisplay device 90. As represented by a thick white line inFIG. 6 , the neural pathway from a sciatic nerve to a spinal cord, for example, when viewed from the front of the subject, has a curved shape and not a linear shape. In this embodiment, thepathway generating section 61 can set the neural pathway as a curve. - By setting the neural pathway as the curve, measurements similar to those of spinal cord evoked potential measurement methods can be made from a body surface non-invasively using the virtual electrodes VE, and it is possible to evaluate the nerve function in detail without imposing strain on the subject. The spinal cord evoked potential measurement methods perform the measurements by inserting an electrode into a spinal canal, and measuring a potential of the spinal cord at an immediate vicinity of the spinal cord.
- A marker MK illustrated in
FIG. 6 corresponds to an electrode that is captured together with the subject to align and coordinate the morphological image, such as the X-ray image or the like, with the measuring position where the magnetic field data are measured by the SQUID magnetic sensors, and this electrode is mounted at a position opposing (or facing) the body surface of the subject. A predetermined current is applied to the marker MK, in order to identify the position of the marker MK by the SQUID magnetic sensors. -
FIG. 7 is a diagram for explaining an example of the nerve activity current generated along the neural pathway illustrated inFIG. 6 .FIG. 7 illustrates a time variation of the current distribution at parts of the subject to be measured. Images illustrated inFIG. 7 are displayed on the screen of thedisplay device 90 by theimage display section 51, based on current data, that is, current information of each of the voxels reconstructed by thereconstruction analyzing section 63. These images, displayed on the screen of thedisplay device 90, are superimposed on the X-ray image. -
FIG. 7 illustrates fourimages 1 through 4 in which the current state varies with the lapse of time. The fourimages 1 through 4 may be displayed simultaneously on the screen, or one of the fourimages 1 through 4 may be displayed at one time. In the latter case, a slide bar or the like indicating the time and displayed on the screen, may be manipulated by the operator to successively switch the image that is displayed in a single window on the screen. Bold solid arrows representing the intra-axonal current, and bold dotted arrows representing the volume current, are additionally illustrated inFIG. 7 for facilitating the reader's understanding, and these bold solid arrows and bold dotted arrows are not included in the image displayed on the screen. - In the image 1 (latency = 16.425 ms), the presence of the leading component of the current toward the spinal canal can be observed. In the image 2 (latency = 17.525 ms), a state of the leading component of the current conducting toward the head side can be confirmed. In the image 3 (latency = 18.650 ms) and the image 4 (latency = 20.125 ms), the trailing components behaving in the same manner as the leading component can be observed. In addition, in the
image 3, a component of a depolarization current toward the nerve axon can be observed together with the trailing component. - From the four
images 1 through 4 illustrated inFIG. 7 , it may be seen that the intra-axonal current flows through the neural pathway illustrated inFIG. 6 . Accordingly, by setting the virtual electrodes VEc, VEl, and VEr along the neural pathway illustrated inFIG. 6 , it is possible to extract the intra-axonal current and the depolarization current (volume current) represented by the arrows inFIG. 7 , by the technique illustrated inFIG. 5 . As illustrated inFIG. 17 which will be described later, the neural pathway, the virtual electrodes VEc, VEl, VEr, or the like may further be superimposed on the image in which the arrows representing the currents and the current intensity distribution are superimposed on the morphological image. -
FIG. 8 is a flow diagram illustrating an example of a process of displaying the current waveforms by the biometricinformation measuring apparatus 100 illustrated inFIG. 1 . In the example illustrated inFIG. 8 , in order to acquire the morphological image of the parts of the subject to be measured, in step S10, the X-ray image of the subject is acquired using the X-ray machine, separately from measurement of the magnetic field signal of the subject. Further, in step S20, the MR image data of the subject is acquired using the magnetic resonance tomographic machine, and in step S21, a slice (MR image) to be measured is extracted from the MR image data. The process of step S21 may be performed by thedata processing device 30. In step S20, the CT image may be used in place of the MR image. - By providing the X-ray machine inside the shielded enclosure together with the SQUID magnetic sensors, it is possible to perform both radiography and measurement of the biometric magnetic field, in a state where the subject is lying on the bed inside the shielded enclosure. In this case, it is possible to accurately obtain the measuring positions of the magnetic field on the X-ray image, compared to the case where the X-ray image and the measurement of the biometric magnetic field are performed at different locations.
- Among the processes from step S41 to step S49 performed by the
data processing device 30, the processes of steps other than step S41 may be performed by the biometric information display method that is implemented based on the display program executed by thedata processing device 30. The process of step S41 may also be performed by the display program executed by thedata processing device 30. - In step S41, a process of generating a new morphological image, by superimposing the X-ray image and a sliced MR image, is performed using the
data processing device 30. For example, the images may be superimposed by the operator of thedata processing device 30, by moving and rotating one of the two images displayed on thedisplay device 90 on the screen of thedisplay device 90 using theinput device 80, such as the mouse or the like. In this case, theinput controller 40 accepts the operation performed by the operator, and theimage display section 51 moves or rotates the image displayed on thedisplay device 90 according to the accepted operation. The superimposed images are stored in thestorage 70, as themorphological image data 72. In the following description, the operator of thedata processing device 30 may also be simply referred to as the operator. - The process of superimposing the X-ray image and the MR image may be performed automatically using an image recognition technique. In this case, it is possible to utilize the machine learning technique, such as the deep learning or the like. In the case where the images are superimposed automatically, the process of step S41 may be performed by a superimposing processor (not illustrated) provided in the
operation controller 60. - Next, in step S42, the
data processing device 30 binarizes the MR image superimposed with the X-ray image, to generate a binary image, and stores the generated binary image in thestorage 70, as themorphological image data 72. - Next, in step S43, the
pathway generating section 61 of thedata processing device 30 automatically extracts the neural pathway using the binary image. In the case where the neural pathway is extracted based on the operation performed by the operator, the process of step S42 to binarize the image may be omitted. In this case, thepathway generating section 61 extracts the neural pathway by generating a curve (including a straight line) based on coordinates of a plurality of specified positions designated by the operator on the image while viewing the morphological image displayed on thedisplay device 90. - In the case where the neural pathway is extracted based on the operation performed by the operator, the
pathway generating section 61 may generate a Bezier curve from the coordinates of the plurality of specified positions designated by the operator. By generating the Bezier curve, it is possible to easily and finely adjust (or control) the neural pathway while viewing the morphological image, and to easily generate a curve that indicates a neural pathway almost identical to the actual neural pathway. In the case where the neural pathway is extracted automatically, thepathway generating section 61 may utilize the machine learning technique, such as the deep learning or the like. - The
image display section 51 displays the neural pathway extracted by thepathway generating section 61, by superimposing the neural pathway on the morphological image displayed on the screen of thedisplay device 90. Thepathway generating section 61 stores the coordinates of the extracted neural pathway on the image, the formula of the curve, or the like, in thestorage 70. The binarization process of step S42 may also be omitted in the case where the neural pathway is extracted automatically, and in this case, thepathway generating section 61 automatically extracts the neural pathway using the image superimposed in step S41. - By using the MR image, it is possible to obtain detailed morphological information related to the manner in which the nerve of the subject runs. For this reason, by superimposing (aligning) the X-ray image and the MR image in step S41, the MR image can be utilized to easily determine the neural pathway matching the axon nerve. Accordingly, in step S48 and step S49 which will be described later, it is possible to acquire and display the current waveform at the exact position of the nerve of interest.
- On the other hand, in step S30, the biometric
information measuring apparatus 100 measures the biometric magnetic field of the subject by the SQUID magnetic sensors, for example, in synchronism with an electrical pulse stimulation applied to the peripheral nerve of the subject. In step S31, thesignal acquiring section 20 generates the digital magnetic field data based on the voltage output from the SQUID magnetic sensors in correspondence with the measured magnetic field, and stores the generated magnetic field data in thestorage 70, as the biometricmagnetic field data 71. Step S30 and step S31 are repeated. By the processes performed up to this point, preparations for acquiring the current waveform at the parts of the subject to be measured are completed. - In step S44, the
operation controller 60 of thedata processing device 30 uses the position of the marker MK illustrated inFIG. 6 as a reference, for example, and coordinates the measuring position of the magnetic field data within the image in which the neural pathway is extracted, so as to correspond to the position of the marker MK. More particularly, theoperation controller 60 detects the positions of the plurality of SQUID magnetic sensors within the image in which the neural pathway is extracted, from the magnetic field data of the marker MK measured by the SQUID magnetic sensors, and the marker MK appearing in the X-ray image. The correspondence between the image and the measuring positions of the magnetic field data, may be performed by thereconstruction analyzing section 63, or may be performed by a dedicated circuit or means (not illustrated). - Next, in step S45, the
reconstruction analyzing section 63 reconstructs the current component, based on the magnetic field data at each measurement time or timing. In this case, the current component is reconstructed for each of the voxels illustrated inFIG. 5 . Thereconstruction analyzing section 63 stores the current information indicating the direction, intensity, coordinates, or the like of the current obtained by the reconstruction in thestorage 70, as themorphological image data 72. - Next, in step S46, the
reconstruction analyzing section 63 instructs theimage display section 51 to display the arrows representing the direction and intensity of the current for each of the voxels obtained by the reconstruction, on the image superimposed in step S41. In addition, thereconstruction analyzing section 63 extracts the positions having the same current intensity in the image, based on the intensity of the current for each of the voxels, and displays the extracted positions in a state superimposed on the image, as the current intensity distribution. Thereconstruction analyzing section 63 stores information indicating the current intensity distribution in thestorage 70, asmorphological image data 72. Hence, as illustrated inFIG. 7 , for example, the X-ray image or the like, and the current distribution (arrows of the current and the current intensity distribution) reconstructed at each measurement time or timing, are superimposed and displayed on the screen. - Next, in step S47, the virtual
electrode generating section 62 sets a predetermined number of virtual electrodes VEc, spaced apart from each other, on the neural pathway extracted in step S43. The number and the spacing of the virtual electrodes VEc may be preset by the operator, or the like. In addition, the virtualelectrode generating section 62 sets the virtual electrodes VEl and VEr on both sides of each of the virtual electrodes VEc in the direction perpendicular to the neural pathway. The virtualelectrode generating section 62 stores the coordinates of the set virtual electrodes VEc, VEl, and VEr on the image in thestorage 70, as themorphological image data 72. - The virtual
electrode generating section 62 instructs theimage display section 51 to superimpose and display the set virtual electrodes VEc and the set virtual electrodes VEl and VEr on the image displaying the neural pathway. Hence, as illustrated inFIG. 10 ,FIG. 15 , andFIG. 17 which will be described later, the virtual electrodes VEc set on the neural pathway (nerve axon), and the virtual electrodes VE1, VEr, or the like set on both sides of each of the virtual electrodes VEc, are superimposed on the X-ray image or the like and displayed on thedisplay device 90. - Next, in step S48, the current
component extracting section 64 acquires the current data, varying with the lapse of time, at each of the virtual electrodes VEc, VE1, and VEr, as the current waveforms. Then, in step S49, the currentcomponent extracting section 64 instructs thewaveform display section 52 to display the acquired current waveforms on the screen of thedisplay device 90. - The
waveform display section 52 displays the time variation of the current component extracted by the currentcomponent extracting section 64 at each of the virtual electrodes VE, on thedisplay device 90, as the current waveform. For example, the current waveform may be displayed in a window of the screen, separate from the window in which the morphological image is displayed on the screen of thedisplay device 90. By displaying the current waveform at each of the virtual electrodes VE, it becomes possible to easily compare the current waveforms with potential measurement results obtained by the electromyograph or the like. By the processes performed up to this point, a series of processes for displaying the current waveforms is completed. An example of the display of the current waveforms is illustrated inFIG. 11 . -
FIG. 9 is a flow diagram illustrating another example of the process of displaying the current waveforms by the biometricinformation measuring apparatus 100 illustrated inFIG. 1 . A detailed description of steps that are same as the steps illustrated inFIG. 8 will be omitted. The process illustrated inFIG. 9 is similar to the process illustrated inFIG. 8 , except that inFIG. 9 , the neural pathway is extracted using only the X-ray image, and no binarization of the image is performed. In other words, steps S20, S21, S41, and S42 inFIG. 8 are deleted in the process illustrated inFIG. 9 . - In step S43, the
pathway generating section 61 extracts the neural pathway using the X-ray image. The neural pathway may be extracted based on the coordinates of a plurality of specified positions on the image designated by the operator, or may be extracted automatically utilizing the machine learning technique, such as the deep learning or the like. - The neural pathway may be extracted using only the MR image. In this case, step S20 and step S21 illustrated in
FIG. 8 are performed in place of step S10 illustrated inFIG. 9 , and step S43 is performed thereafter. In the case where the neural pathway is extracted automatically using only the MR image, a process corresponding to step S42 that binarizes the MR image, may be additionally performed before step S43. -
FIG. 10 is a diagram for explaining an example in which the virtual electrodes VE are set along the neural pathway running from the right foot to the lumbar part.FIG. 10 illustrates an image in which the neural pathway and the virtual electrodes VEc, VEl, and VEr are superimposed on the X-ray image, and displayed on the screen of thedisplay device 90 within an image display window for displaying an image. In the image illustrated inFIG. 10 , a lower left portion corresponds to the right foot, a lower right portion corresponds to a left foot, and an upper portion corresponds to the lumbar part. The image illustrated inFIG. 10 is displayed on the screen of thedisplay device 90 by the processes of step S43 and step S47 illustrated inFIG. 8 andFIG. 9 . As illustrated inFIG. 17 , arrows representing the current component of each of the voxels, and a current intensity distribution, may be superimposed on the image illustrated inFIG. 10 . - In the example illustrated in
FIG. 10 , a curved neural pathway, extracted in correspondence with the nerve axon running from the right foot to the lumbar part, is represented by a black bold solid line. The virtual electrode VEc set at a plurality of positions is displayed as a double circle, and the virtual electrodes VEl and VEr set at a plurality of positions are displayed as symbols X. The virtual electrodes VEc are set at a specified spacing designated by the operator, and are equally spaced in this example. For example, the neural pathway may be represented by the Bezier curve. Both ends of the extracted neural pathway are represented by black circles with white bordering. Four small white rectangles arranged along the neural pathway represent specified positions designated by the operator to draw the Bezier curve. The neural pathway may be drawn freehand by the operator. - Numbers displayed adjacent to the virtual electrodes VEr indicate electrode numbers that are assigned to identify each of the virtual electrodes VEc, and the virtual electrodes VEl and VEr corresponding to each of the virtual electrodes VEc. The virtual electrode VEc and each of the virtual electrodes VEl and VEr, assigned a common electrode number, are connected to each other by black bold solid lines. Since the actual screen may display the image in full color, various lines and marks may be displayed in different colors for easy identification.
- As illustrated in
FIG. 10 , in this embodiment, the neural pathway can be set to the curved shape of the actual nerve axon, and the virtual electrodes VEc, VEl, and VEr can be set to arbitrary positions. For this reason, it is possible to extract the current waveform at an arbitrary position along the shape of the nerve axon, thereby enabling correct evaluation of the intra-axonal current and the volume current. - The shape of the neural pathway can be repeatedly varied, by accepting, by the
position input section 41, an operation performed by the operator using the mouse or the like, to move the small white rectangles. In addition, the number of virtual electrodes VEc, VEl, and VEr, and the spacings of the virtual electrodes VEc, VEl, and VEr, can be freely set and reset, by accepting, by theposition input section 41, an operation performed by the operator using theinput device 80, such as the mouse, the keyboard, or the like. - The varied neural pathway and virtual electrodes VE are superimposed on the image, and displayed in a refreshed state. In other words, the
position input section 41 accepts an instruction to vary the neural pathway and the virtual electrodes VE on the image, thepathway generating section 61 varies the shape of the neural pathway based on the instruction, and theimage display section 51 superimposes and displays the varied neural pathway together with the moved virtual electrodes VE on the image in the refreshed state. - In a case where the shape of the neural pathway to be set is varied, or at least one of the number and the spacing of the virtual electrodes VE is varied, the current
component extracting unit 64 reextracts the current component at the varied (or moved) virtual electrodes VE, and regenerates the current waveform based on the reextracted current component. Thewaveform display section 52 displays the regenerated current waveform on the screen of thedisplay device 90 in the refreshed state. Hence, the shape of the neural pathway and the positions of the virtual electrodes VE may be reset repeatedly, until the current waveform, that enables the evaluation, diagnosis, examination, or the like, can be obtained. - In the case where the virtual electrodes VE are set by extracting the neural pathway using only the X-ray image, it becomes possible to perform both the radiography and the measurement of the biometric magnetic field of the subject inside the shielded enclosure as described above, thereby enabling the measuring positions of the magnetic field in the X-ray image to be accurately obtained.
-
FIG. 11 is a diagram for explaining an example of the current waveforms at the virtual electrodes VEc, VEl, and VEr illustrated inFIG. 10 . The current waveforms (time variations of the current intensities) are displayed for each of the virtual electrodes VEc, VE1, and VEr using a common time base for all of the electrode numbers. The current waveforms illustrated inFIG. 11 are displayed in waveform display windows that are different from the image display window of the screen of thedisplay device 90, by the processes of step S48 and step S49 illustrated inFIG. 8 andFIG. 9 . Numerical values illustrated at the bottom right of each graph inFIG. 11 (in this example, 2nAm) indicate current dipoles. - Variations in the current flowing through the nerve axon can be observed from the current waveform at the virtual electrode VEc, and variations in the volume current flowing into the nerve axon can be observed from the current waveforms at each of the virtual electrodes VEl and VEr. For example, current may be evaluated by the latency, which is the time from the application of the electrical stimulation to the peripheral nerve of the subject until the current value varies greatly, and this latency can be detected from a peak value of the current waveform.
- In
FIG. 11 , in a region of the current waveform at the virtual electrode VEc encircled by an oval dotted line, the latency increases for the virtual electrode VEc having the larger electrode number, indicating that the electrical signal is transmitted from the side closer to the peripheral nerve to the side closer to the central nerve of the nerve axon. By setting the neural pathway according to the curved shape of the actual nerve axon, and detecting the current by setting the virtual electrodes VEc on the set neural pathway, the variation in the current flowing through the nerve axon can be determined from a single graph of the current waveform. The graph of the current waveform may be one of the graph of the current waveform at the virtual electrode VEc illustrated at a center portion ofFIG. 11 , the graph of the current waveform at the virtual electrode VEl illustrated at a left portion ofFIG. 11 , and the graph of the current waveform at the virtual electrode VEr illustrated at a right portion ofFIG. 11 . - In
FIG. 11 , the current waveform at the virtual electrode VEl is small compared to the current waveforms at the virtual electrode VEc and VEr. This is because, when the virtual electrodes VEl are set from the right foot toward the lumbar part as illustrated inFIG. 10 , particularly the virtual electrode VEl on the side closer to the right foot is located at the end of the subject, thereby making the current component reconstructed from the magnetic field data small. However, by setting the virtual electrodes VEl and VEr on both sides of each of the virtual electrodes VEc, it is possible to increase the possibility of detecting the waveform of the volume current flowing into the nerve axon at either the virtual electrode VEl or the virtual electrode VEr. -
FIG. 12 is a diagram for explaining an example in which the neural pathway is extracted using the MR image. When extracting the neural pathway using the MR image, step S20 and step S21 illustrated inFIG. 8 are performed instead of step S10 illustrated inFIG. 9 , and step S43 is performed thereafter. A left portion ofFIG. 12 illustrates the MR image before the neural pathway is extracted, and a right portion ofFIG. 12 illustrates the MR image after the neural pathway is extracted. - In the example illustrated in
FIG. 12 , both the neural pathway running from the right foot to the lumbar part, and the neural pathway running from the left foot to the lumbar part, are extracted, as represented by thick white lines in the right portion ofFIG. 12 . However, it is possible to extract only one of these two neural pathways. In addition, the neural pathways may be extracted, based on the coordinates of the plurality of specified positions on the image designated by the operator, or may be extracted automatically utilizing the machine learning technique, such as the deep learning or the like. - By using the MR image, it is possible to obtain the detailed morphological information related to the manner in which the nerve of the subject runs. For this reason, after the neural pathway is extracted using the MR image, for example, it is possible to align the extracted neural pathway (that is, superimpose the image of the extracted neural pathway) to the X-ray image. Further, the binary image may be used when automatically extracting the neural pathway using the MR image.
-
FIG. 13 is a diagram for explaining an example (comparative example) in which the neural pathway is set linearly. InFIG. 13 , a detailed description of the same elements as inFIG. 10 will be omitted. The X-ray image illustrated inFIG. 13 is similar to that ofFIG. 10 , and is a captured image, from the foot to the lumbar part of the subject. - The virtual electrodes VEc set on the neural pathway is not aligned with the nerve axon, because the neural pathway is not aligned to the nerve axon when the neural pathway is set linearly. In addition, the virtual electrodes VEl and VEr, which are set on both sides of each of the virtual electrodes VEc, do not extend along both sides of the nerve axon.
-
FIG. 14 is a diagram for explaining an example of the current waveforms at the virtual electrodes VEc, VEl, and VEr illustrated inFIG. 13 . InFIG. 14 , a detailed description of the same elements as inFIG. 11 will be omitted. As illustrated inFIG. 6 , the actual neural pathway is curved. For this reason, when the virtual electrodes VE are set linearly, the current waveform flowing through the actual nerve axon becomes separated into the current waveform at the virtual electrode VEl and the current waveform at the virtual electrode VEc. InFIG. 14 , the current waveforms flowing through the nerve axon are separated and displayed separately as waveforms at the virtual electrodes VE1 having the electrode numbers No.0 through No.2 surrounded by a dotted oval and a latency of approximately 16.5 ms, and waveforms at the virtual electrodes VEl having the electrode numbers No.4 through No.6 surrounded by a dotted oval and a latency of approximately 22 ms. - In this case, an evaluator, such as a physician or the like, who evaluates the nerve function of the subject, is required to evaluate the state of the current flowing through the nerve axon, by adding the current waveforms at the virtual electrodes VEl and the current waveforms at the virtual electrodes VEc in the head of the evaluator. In addition, the positions of the virtual electrodes VEc are deviated from the neural pathway of the actual nerve axon, and the virtual electrodes VEl and VEr are not parallel to the neural pathway of the actual nerve axon. For this reason, the MCV calculated using the latencies of the current waveforms at the virtual electrodes VEc, for example, does not become the MCV of the actual nerve axon.
- On the other hand, by enabling the neural pathway to be set to the curve, as illustrated in
FIG. 10 , it becomes possible to set the neural pathway and the virtual electrodes VE along the actual nerve axon. For this reason, it is possible to accurately and easily calculate the MCV of the actual nerve axon, using only the latencies of the current waveforms at the virtual electrodes VEc. In addition, the evaluator, such as the physician or the like, can evaluate the manner in which the intra-axonal current and the volume current flow, by simply observing the current waveforms at the virtual electrodes VEc. - Similarly, it is possible to accurately and easily calculate the MCV, based on the variation of the volume current, using only the latencies of the current waveforms at the virtual electrodes VEl or the virtual electrodes VEr. In addition, the evaluator, such as the physician or the like, can evaluate the manner in which the volume current flows, by simply observing the current waveforms at the virtual electrodes VEl or the virtual electrodes VEr.
-
FIG. 15 is a diagram for explaining an example in which the virtual electrodes VE are set along the neural pathway of a carpal tunnel part. InFIG. 15 , a detailed description of the same elements as inFIG. 10 will be omitted.FIG. 15 illustrates an example that uses the X-ray image to set the virtual electrodes VEc, VEl, and VEr, similar toFIG. 10 . The X-ray image in a right portion ofFIG. 15 illustrating the wrist and vicinities thereof captured from the front, and the X-ray image in a left portion ofFIG. 15 illustrating the wrist and the vicinities thereof taken from the side, are displayed on the screen of thedisplay device 90. The X-ray image in the left portion ofFIG. 15 may or may not be displayed, as appropriate. - When evaluating the neural pathway of the carpal tunnel that is shorter in length than the neural pathway of the lumbar part illustrated in
FIG. 10 , for example, the spacing of the virtual electrodes VEc is set smaller than inFIG. 10 . Hence, a suitable number of virtual electrodes VEc can be set according to the size of the part to be evaluated. -
FIG. 16 is a diagram for explaining an example of the current waveforms at the virtual electrodes VEc, VEl, and VEr illustrated inFIG. 15 . InFIG. 16 , a detailed description of the same elements as inFIG. 11 will be omitted. In the example illustrated inFIG. 16 , a window for detecting the latency is set in the graphs of the current waveforms at the virtual electrodes VEc, VEl, and VEr. When setting this window, the operator may input a window set command, or select a window set command from a menu screen, for example, using theinput device 80, such as the mouse, the keyboard, or the like. The waveformregion designating section 42 instructs thewaveform display section 52 to display straight lines indicating the window, based on the window setting command accepted from theinput device 80. Thewaveform display section 52 displays two straight lines, indicated by one-dot chain lines inFIG. 16 , and perpendicular to the time base, in a display region of each of the graphs, based on the instruction from the waveformregion designating section 42. - Thereafter, the waveform
region designating section 42 accepts an operation performed by the operator to select the one-dot chain line and move the selected one-dot chain line along the direction of the time base, and instructs thewaveform display section 52 to move the display position of the one-dot chain line based on the accepted operation. As a result, it is possible to set the window that selects the range of a portion of the current waveform, that is, a time range of an arbitrary region sandwiched between the two one-dot chain lines. In other words, theposition input section 41 receives an instruction that selects the range of the portion of the current waveform displayed on thedisplay device 90, as positions of the two straight lines indicated by the one-dot chain lines inFIG. 16 . The window may be displayed in the graph of each of the current waveforms illustrated inFIG. 11 . - The latency of each of the current waveforms is detected within the window. For this reason, it is possible to prevent detection of an erroneous latency caused by a noise waveform or the like outside the window. In other words, the window is set to exclude current waveforms affected by noise caused by factors other than the body function or activity (that is, avoid the influence of magnetic fields from and vicinities of the biometric information measuring apparatus 100).
- For example, the conduction
velocity calculating section 65 detects peaks of the current waveform within the window, as feature points, and regards an appearing duration (time) of the peaks as the latency. - The waveform
region designating section 42 accepts, from the operator via theinput device 80, an instruction to select two current waveforms for calculating a conduction velocity CV of the nerve activity. In the example illustrated inFIG. 16 , the waveformregion designating section 42 accepts, from the operator, the positions of the current waveforms extracted at the virtual electrodes VEr having the electrode numbers No.1 and No.3, from among the plurality of current waveforms extracted at the virtual electrodes VEr, and an instruction to calculate the conduction velocity CV. - The conduction
velocity calculating section 65 calculates the conduction velocity CV (55.582 m/s), based on the accepted instruction, and notifies the calculated conduction velocity CV to thewaveform display section 52 together with information indicating the current waveforms used for the calculation of the conduction velocity CV. For example, the conductionvelocity calculating section 65 calculates the conduction velocity CV, by dividing the distance between the two virtual electrodes VE from which the two current waveforms designated by the operator are extracted, by the latency difference between the latencies of the two current waveforms, as indicated by a formula illustrated inFIG. 3 . - The
waveform display section 52 displays the conduction velocity CV calculated by the conductionvelocity calculating section 65, within the graph together with a line connecting the peaks of the current waveforms used for calculating the conduction velocity CV, for example. In other words, thewaveform display section 52 displays the conduction velocity CV in correspondence with the current waveforms used for the calculating the conduction velocity CV. Accordingly, the evaluator, such as the physician or the like, can visually ascertain the conduction velocity CV, while viewing the displayed graph of the current waveforms. The example illustrated inFIG. 16 may be used for the diagnosis of whether the nerve in the carpal tunnel of the subject is pinched, compressed, or the like. - The distance between the two virtual electrodes VE is not a linear distance, and is the length along the neural pathway. In order to calculate the distance between the two virtual electrodes VE as the length of the neural pathway, the neural pathway extracted in step S43 illustrated in
FIG. 8 is formed by a plurality of line segments. Accordingly, even in a case where the conduction velocity CV is calculated by a simple division, it is possible to accurately calculate the conduction velocity CV according to the length of the actual neural pathway. - Moreover, since the virtual electrodes VE are set at equal spacing, the conduction
velocity calculating section 65 can calculate the conduction velocity CV from the current waveform data by a simple calculation. Furthermore, by setting the virtual electrodes VE at equal spacing, the evaluator, such as the physician or the like, can ascertain the approximate conduction velocity CV by simply viewing the graphs of the current waveforms, even before the conduction velocity CV is displayed. - The one-dot chain lines that are moved on the screen according to the instruction from the operator, may be the peak values (indicating latency) of the current waveforms at the two virtual electrodes VE. In this case, the
position input section 41 accepts the input of the two electrode numbers used for calculating the conduction velocity CV, and the changes in the positions of the one-dot chain lines. Accordingly, the conductionvelocity calculating section 65 can calculate the conduction velocity CV, by dividing the distance between the two virtual electrodes VE corresponding to the two electrode numbers that are input, by a time difference of the two one-dot chain lines. - Since the virtual electrodes VEl are set outside the region where the hand of the subject is located in the example illustrated in
FIG. 15 , the peak values that can detect the latency do not appear in the current waveforms at the virtual electrodes VEl illustrated inFIG. 16 . Even in this case, it is possible to calculate the conduction velocity CV, using the current waveforms at the virtual electrodes VEr on the opposite side from the virtual electrodes VE1. -
FIG. 17 is a diagram for explaining an example in which the virtual electrodes VE are set along the neural pathway running from the left foot to the lumbar part. InFIG. 17 , a detailed description of the same elements as inFIG. 10 andFIG. 15 will be omitted.FIG. 17 illustrates an example that uses the X-ray image to set the virtual electrodes VEc, VEl, and VEr along the neural pathway running from the left foot to the lower back, similar toFIG. 10 . Further, inFIG. 17 , the arrows indicating the current components and the current intensity distribution are superimposed and displayed on the screen, together with the X-ray image, the neural pathway, and the virtual electrodes VE. -
FIG. 18 is a diagram for explaining an example of the current waveforms at the virtual electrodes VEc, VEl, and VEr illustrated inFIG. 17 . InFIG. 18 , a detailed description of the same elements as inFIG. 11 andFIG. 16 will be omitted. In the example illustrated inFIG. 18 , the window for detecting the latency is set in the graphs of the current waveforms at the virtual electrodes VEc, VE1, and VEr, similar toFIG. 16 . - In the example illustrated in
FIG. 18 , the waveformregion designating section 42 accepts from the operator, the positions of the current waveforms extracted at the virtual electrodes VEl having the electrode numbers No.2 and No. 4, from among the plurality of current waveforms extracted at the virtual electrode VE1, and the instruction to calculate the conduction velocity CV. The conductionvelocity calculating section 65 calculates the conduction velocity CV (65.030 m/s), based on the accepted instruction. - The
waveform display section 52 displays the conduction velocity CV calculated by the conductionvelocity calculating section 65, in the graph, together with the line connecting the peaks of the current waveforms used for calculating the conduction velocity CV, for example. In the example illustrated inFIG. 18 , it is possible to visualize the nerve activity of the lumbar part upon stimulation of the sciatic nerve, and the evaluator, such as the physician or the like, can utilize the visualized nerve activity for the diagnosis of the nerve activity or the like of a patient with disc herniation, for example. -
FIG. 19 is a block diagram illustrating an example of a hardware configuration of thedata processing device 30 illustrated inFIG. 1 . Thedata processing device 30 includes aCPU 301, a read only memory (ROM) 302, a random access memory (RAM) 303, and anexternal storage device 304. Thedata processing device 30 also includes aninput interface 305, anoutput interface 306, an input-output (I/O)interface 307, and acommunication interface 308. For example, theCPU 301, theROM 302, theRAM 303, theexternal storage device 304, theinput interface 305, theoutput interface 306, the I/O interface 307, and thecommunication interface 308 are connected to each other through a bus BUS. - The
CPU 301 executes various programs, such as an operating system (OS), application programs, or the like, and controls the general operation of thedata processing device 30. TheROM 302 stores basic programs, various parameters, or the like for enabling the various programs to be executed by theCPU 301. TheRAM 303 stores the various programs executed by theCPU 301, data used by the various programs, or the like. Theexternal storage device 304 may be formed by an HDD, a solid state drive (SSD), or the like, and stores the various programs loaded into theRAM 303. The various programs may include a display program for displaying the current waveforms, reconstructed from the magnetic field data, ondisplay device 90. - The
input device 80, such as the keyboard, the mouse, a tablet, or the like, which accepts the input from the operator or the like who operates thedata processing device 30, is connected to theinput interface 305. Anoutput device 92, such as a display device (thedisplay device 90 illustrated inFIG. 1 , for example) that displays a screen (or display screen) or the like generated by the various programs executed by theCPU 301, a printer, or the like, is connected to theoutput interface 306. - A
recording medium 400, such as a universal serial bus (USB) memory or the like, is connected to the I/O interface 307. For example, therecording medium 400 may store the various programs, such as the above described display program for displaying the current waveforms on thedisplay device 90. In this case, the programs are transferred from therecording medium 400 to theRAM 303 through the I/O interface 307. Therecording medium 400 may be formed by a compact disk-ROM (CD-ROM), a digital versatile disk (DVD, registered trademark), or the like. In this case, the I/O interface 307 includes an interface corresponding to therecording medium 400 connected thereto. Thecommunication interface 308 connects thedata processing device 30 to a network or the like. - The
ROM 302, therecording medium 400, or the like are examples of a non-transitory computer-readable recording medium that stores one or more programs executed by a computer, such as theCPU 301. - Accordingly, in this embodiment, it is possible to generate the neural pathway from which the current components are to be extracted in the subject, by utilizing the morphological image of the subject. Hence, even in the case where the neural pathway is curved, it is possible to extract the current waveforms at arbitrary positions along the shape of the neural pathway, and enable correct evaluation of the intra-axonal current and the volume current. As a result, a detailed evaluation of the nerve function becomes possible, without imposing strain on the subject.
- Since the plurality of virtual electrodes VEc can be set along the neural pathway, it becomes possible to evaluate the intra-axonal current, using only the current waveforms at the virtual electrodes VEc. In addition, since the plurality of virtual electrodes VEl and the plurality of virtual electrodes VEr can be set along both sides of the neural pathway, it becomes possible to evaluate the volume current flowing into the nerve axon, using only the current waveforms at the virtual electrodes VEl, or using only the current waveforms at the virtual electrodes VEr. Moreover, by setting the virtual electrodes VEl and VEr on both sides of each of the virtual electrodes VEc, it is possible to increase the possibility of detecting the waveform of the volume current from one of the virtual electrodes VEl and VEr, even when the waveform of the volume current cannot be detected from the other of the virtual electrodes VE1 and VEr.
- The shape of the neural pathway, and the number and the spacing of each of the virtual electrodes VEc, VEl, and VEr, may be reset repeatedly. Accordingly, the positions of the virtual electrodes VE may be varied repeatedly, until the current waveform that enables the evaluation, diagnosis, or the like is obtained. The
pathway generating section 61 generates the Bezier curve as the curve representing the neural pathway, thereby enabling the operator to easily and finely adjust the neural pathway while viewing the morphological image, and thus, it is possible to easily generate the curve representing the neural pathway almost identical to the actual neural pathway. - By reconstructing (extracting) the current data from the magnetic field data, the conduction velocity CV can be calculated from the current waveform data without measuring the currents using the electromyograph or the like. In this case, by setting the time range of the current waveforms used for the calculation of the conduction velocity CV, it is possible to prevent the detection of the erroneous latency caused by the noise waveform or the like outside the window, and thus, it is possible to calculate the correct conduction velocity CV. For example, by setting the range in which the latency is to be detected, as the window sandwiched by the straight lines, it is possible to calculate the conduction velocity CV using a simple technique.
- By superimposing the conduction velocity CV calculated by the conduction
velocity calculating section 65 on the current waveforms, and displaying the superimposed image on the screen of thedisplay device 90, it becomes possible for the evaluator, such as the physician or the like, to visually ascertain the conduction velocity CV while viewing the displayed graph of the current waveforms. - By setting the virtual electrodes VE at equal spacing, the conduction
velocity calculating section 65 can calculate the conduction velocity CV from the current waveform data by a simple calculation. In addition, the evaluator, such as the physician or the like, can visually ascertain the approximate conduction velocity CV by simply viewing the graph of the current waveforms, even before the conduction velocity CV is displayed. - For example, by using the MR image that illustrates in detail the manner in which the nerve of the subject runs, it is possible to easily extract the neural pathway matching the axonal nerve, and to acquire and display the current waveform at the accurate position of the nerve of interest. By superimposing the X-ray image with the MR image, it is possible to ascertain the part to be measured that is displayed in the image, with reference to a skeletal system, for example.
- According to each of the embodiments described above, it is possible to generate the neural pathway from which the current component is to be extracted in the subject, using the morphological image of the subject.
- Each of the embodiments describes the example in which the current is reconstructed from the biometric magnetic field data of the subject, and the current waveforms at the virtual electrodes set along the neural pathway are displayed on the screen. However, the biometric magnetic field data of the subject may be used to measure the amount of magnetic field per magnetic sensor (per channel), and virtual measuring points for measuring the magnetic field may be set along the neural pathway, to display, on the screen, the magnetic field waveform at each of the virtual measuring points for measuring the magnetic field. In other words, the component of the waveforms displayed on the screen may be other than the current, provided that the component is a signal that can be expressed as a vector quantity.
- Although the present invention is described heretofore based on the embodiments, the present invention is not limited to the described embodiments, and various variations, modifications, and substitutions may be made without departing from the scope of the present invention.
Claims (15)
- A biometric information display device (30) comprising:a display controller (50) configured to display a morphological image indicative of a morphology of a subject, on a display (90);an input controller (40) configured to receive a designation of a specified position on the morphological image;a pathway generating section (61) configured to generate a pathway based on the specified position on the morphological image; anda current extracting section (64) configured to extract current components at a plurality of positions along the pathway, based on current information reconstructed based on magnetic field measurement data generated by the subject,wherein the display controller (50) displays the current components extracted along the pathway on the display (90).
- The biometric information display device (30) as claimed in claim 1, further comprising:a virtual electrode generating section (62) configured to generate a plurality of first virtual electrodes (VEc) on the pathway,wherein the current extracting section (64) extracts the current components at the plurality of first virtual electrodes (VEc).
- The biometric information display device (30) as claimed in claim 2, whereinthe virtual electrode generating section (62) further generates a second virtual electrode (VEl) and a third virtual electrode (VEr) on both sides of the pathway at each of the plurality of the first virtual electrodes (VEc), to generate a plurality of second virtual electrodes (VEl) and a plurality of third virtual electrodes (VEr),the current extracting section (64) extracts the current components at each of the plurality of first virtual electrodes (VEc), second virtual electrodes (VEl), and third virtual electrodes (VEr), andthe display controller (50) displays current waveforms representing a time variation of the respective current components of the plurality of first virtual electrodes (VEc), second virtual electrodes (VEl), and third virtual electrodes (VEr) on the display (90).
- The biometric information display device (30) as claimed in claim 3, whereinthe input controller (40) receives a number of the plurality of first virtual electrodes (VEc), and a distance between the first virtual electrodes (VEc),the pathway generating section (61) resets positions of the plurality of first virtual electrodes (VEc), second virtual electrodes (VEl), and third virtual electrodes (VEr), based on a change in at least one of the number of the plurality of first virtual electrodes (VEc) and the distance between the first virtual electrodes (VEc), andthe current extracting section (64) reextracts the current components of the plurality of first virtual electrodes (VEc), second virtual electrodes (VEl), and third virtual electrodes (VEr) at the reset positions.
- The biometric information display device (30) as claimed in claim 3 or 4, whereinthe display controller (50) displays the current waveform representing the time variation of the current components of the plurality of first virtual electrodes (VEc), second virtual electrodes (VEl), and third virtual electrodes (VEr) on the display (90), andthe input controller (40) receives a designation of a specified time range of one of the current waveforms of the plurality of first virtual electrodes (VEc), second virtual electrodes (VEl), and third virtual electrodes (VEr) displayed on the display (90),the biometric information display device (30) further comprising:
a calculating section (65) configured to calculate a conduction velocity of a stimulus within the subject, based on a time variation of a feature point of the one of the current waveforms within the specified time range. - The biometric information display device (30) as claimed in claim 5, whereinthe display controller (50) displays the current waveforms of the plurality of first virtual electrodes (VEc), second virtual electrodes (VEl), and third virtual electrodes (VEr) on the display (90) using a common time base,the input controller (40) receives positions of two straight lines perpendicular to the time base displayed in a display region of the current waveforms on the display (90), andthe specified time range is a range sandwiched between the two straight lines received by the input controller (40).
- The biometric information display device (30) as claimed in claim 5 or 6, whereinthe input controller (40) receives a designation of two specified current waveforms among the current waveforms of the plurality of first virtual electrodes (VEc), second virtual electrodes (VEl), and third virtual electrodes (VEr) displayed on the display (90), andthe calculating section (65) calculates the conduction velocity between two virtual electrodes corresponding to the two specified current waveforms, based on a difference between appearance times of feature points of the two specified current waveforms, and the pathway between the two virtual electrodes.
- The biometric information display device (30) as claimed in claim 5 or 6, whereinthe input controller (40) receives a designation of two specified current waveforms among the current waveforms of the plurality of first virtual electrodes (VEc), second virtual electrodes (VEl), and third virtual electrodes (VEr) displayed on the display (90),the calculating section (65) calculates the conduction velocity between two virtual electrodes corresponding to the two specified current waveforms, based on a difference between appearance times of feature points of the two specified current waveforms, andthe display controller (50) displays the conduction velocity calculated by the calculating section (65) on the display (90) in correspondence with the current waveforms used to calculate the conduction velocity.
- The biometric information display device (30) as claimed in any one of claims 1 to 8, wherein the morphological image is one of an X-ray image, a computed tomography image, and a magnetic resonance image.
- The biometric information display device (30) as claimed in any one of claims 1 to 9, wherein the pathway generating section (61) generates the pathway using a Bezier curve according to a plurality of specified positions designated on the morphological image.
- A biometric information display method to be implemented in a biometric information display device (30) that includes a display controller (50) configured to display a morphological image indicative of the morphology of a subject, and an input controller (40) configured to receive a designation of a specified position on the morphological image, the biometric information display method comprising:generating (S43) a pathway based on the specified position on the morphological image;extracting (S48) current components at a plurality of positions along the pathway, based on current information reconstructed based on magnetic field measurement data generated by the subject; anddisplaying (S49) the current components extracted along the pathway on a display (90).
- The biometric information display method as claimed in claim 11, further comprising:generating (S47) a plurality of first virtual electrodes (VEc) on the pathway,wherein the extracting (S48) extracts the current components at the plurality of first virtual electrodes (VEc).
- The biometric information display method as claimed in claim 12, whereinthe generating (S47) the plurality of virtual first electrodes (VEc) further generates a second virtual electrode (VEl) and a third virtual electrode (VEr) on both sides of the pathway at each of the plurality of the first virtual electrodes (VEc), to generate a plurality of second virtual electrodes (VE1) and a plurality of third virtual electrodes (VEr),the extracting (S48) extracts the current components at each of the plurality of first virtual electrodes (VEc), second virtual electrodes (VEl), and third virtual electrodes (VEr), andthe displaying (S49) displays current waveforms representing a time variation of the respective current components of the plurality of first virtual electrodes (VEc), second virtual electrodes (VEl), and third virtual electrodes (VEr) on the display (90).
- A display program which, when executed by a computer (301) of a biometric information display device (30) that includes a display controller (50) configured to display a morphological image indicative of the morphology of a subject, and an input controller (40) configured to receive a designation of a specified position on the morphological image, causes the computer (301) to perform a process comprising:generating (S43) a pathway based on the specified position on the morphological image;extracting (S48) current components at a plurality of positions along the pathway, based on current information reconstructed based on magnetic field measurement data generated by the subject; anddisplaying (S49) the current components extracted along the pathway on a display (90).
- The display program as claimed in claim 14, which causes the computer (301) to further perform the process comprising:generating (47) a plurality of first virtual electrodes (VEc) on the pathway,wherein the extracting (S48) extracts the current components at the plurality of first virtual electrodes (VEc).
Applications Claiming Priority (1)
| Application Number | Priority Date | Filing Date | Title |
|---|---|---|---|
| JP2019212346A JP7264377B2 (en) | 2019-11-25 | 2019-11-25 | Biological information display device, biological information display method and display program |
Publications (2)
| Publication Number | Publication Date |
|---|---|
| EP3824812A1 true EP3824812A1 (en) | 2021-05-26 |
| EP3824812B1 EP3824812B1 (en) | 2023-01-04 |
Family
ID=73476020
Family Applications (1)
| Application Number | Title | Priority Date | Filing Date |
|---|---|---|---|
| EP20208418.2A Active EP3824812B1 (en) | 2019-11-25 | 2020-11-18 | Biometric information display device, biometric information display method, and display program |
Country Status (3)
| Country | Link |
|---|---|
| US (1) | US11443717B2 (en) |
| EP (1) | EP3824812B1 (en) |
| JP (1) | JP7264377B2 (en) |
Cited By (2)
| Publication number | Priority date | Publication date | Assignee | Title |
|---|---|---|---|---|
| CN114699094A (en) * | 2022-06-01 | 2022-07-05 | 广州中医药大学深圳医院(福田) | Hand nerve conduction velocity tester and application method |
| JP2022108245A (en) * | 2021-01-12 | 2022-07-25 | 株式会社リコー | Diagnosis support device, diagnosis support method and diagnosis support program |
Families Citing this family (1)
| Publication number | Priority date | Publication date | Assignee | Title |
|---|---|---|---|---|
| JP7539022B2 (en) * | 2021-05-19 | 2024-08-23 | 株式会社リコー | Biomagnetic field measurement processing device, biomagnetic field measurement system, control method for biomagnetic field measurement processing device, and control program for biomagnetic field measurement processing device |
Citations (3)
| Publication number | Priority date | Publication date | Assignee | Title |
|---|---|---|---|---|
| JP2007125236A (en) | 2005-11-04 | 2007-05-24 | Hitachi High-Technologies Corp | Biomagnetic field measurement device |
| JP2008178558A (en) | 2007-01-24 | 2008-08-07 | Hitachi High-Technologies Corp | Biomagnetic field measurement device |
| US20180008223A1 (en) * | 2016-07-08 | 2018-01-11 | Ricoh Company, Ltd. | Diagnosis support system, diagnosis support apparatus, and recording medium |
Family Cites Families (6)
| Publication number | Priority date | Publication date | Assignee | Title |
|---|---|---|---|---|
| JP2000003455A (en) * | 1998-06-12 | 2000-01-07 | Sony Corp | Information processing apparatus and method, and providing medium |
| JP2006187342A (en) | 2004-12-28 | 2006-07-20 | Fujitsu Ltd | Spinal evoked potential measuring electrode and spinal evoked potential measuring device |
| JP6746300B2 (en) | 2015-11-30 | 2020-08-26 | 株式会社リコー | Neurostimulator, biomagnetic field measurement system |
| EP3318185A1 (en) * | 2016-11-04 | 2018-05-09 | Aalborg Universitet | Method and device for analyzing a condition of a heart |
| US11375934B2 (en) | 2017-12-01 | 2022-07-05 | Ricoh Company, Ltd. | Biomagnetic measurement apparatus, biological information measurement apparatus, and biomagnetic measurement method |
| JP7176689B2 (en) | 2017-12-01 | 2022-11-22 | 株式会社リコー | Biomagnetism measuring device and biomagnetism measuring method |
-
2019
- 2019-11-25 JP JP2019212346A patent/JP7264377B2/en active Active
-
2020
- 2020-11-18 EP EP20208418.2A patent/EP3824812B1/en active Active
- 2020-11-20 US US16/953,861 patent/US11443717B2/en active Active
Patent Citations (3)
| Publication number | Priority date | Publication date | Assignee | Title |
|---|---|---|---|---|
| JP2007125236A (en) | 2005-11-04 | 2007-05-24 | Hitachi High-Technologies Corp | Biomagnetic field measurement device |
| JP2008178558A (en) | 2007-01-24 | 2008-08-07 | Hitachi High-Technologies Corp | Biomagnetic field measurement device |
| US20180008223A1 (en) * | 2016-07-08 | 2018-01-11 | Ricoh Company, Ltd. | Diagnosis support system, diagnosis support apparatus, and recording medium |
Non-Patent Citations (3)
| Title |
|---|
| SASAKI T ET AL: "Visualization of electrophysiological activity in patients with carpal tunnel syndrome using magnetoneurography", JOURNAL OF NEUROLOGICAL SCIENCES, ELSEVIER SCIENTIFIC PUBLISHING CO, AMSTERDAM, NL, vol. 405, 15 October 2019 (2019-10-15), pages 23, XP085982477, ISSN: 0022-510X, DOI: 10.1016/J.JNS.2019.10.1589 * |
| SATOSHI SUMIYA ET AL: "Magnetospinography visualizes electrophysiological activity in the cervical spinal cord", SCIENTIFIC REPORTS, vol. 7, no. 1, 19 May 2017 (2017-05-19), XP055449754, DOI: 10.1038/s41598-017-02406-8 * |
| WATANABE TAISHI ET AL: "Novel functional imaging technique for the brachial plexus based on magnetoneurography", CLINICAL NEUROPHYSIOLOGY, ELSEVIER SCIENCE, IE, vol. 130, no. 11, 22 August 2019 (2019-08-22), pages 2114 - 2123, XP085865622, ISSN: 1388-2457, [retrieved on 20190822], DOI: 10.1016/J.CLINPH.2019.08.006 * |
Cited By (2)
| Publication number | Priority date | Publication date | Assignee | Title |
|---|---|---|---|---|
| JP2022108245A (en) * | 2021-01-12 | 2022-07-25 | 株式会社リコー | Diagnosis support device, diagnosis support method and diagnosis support program |
| CN114699094A (en) * | 2022-06-01 | 2022-07-05 | 广州中医药大学深圳医院(福田) | Hand nerve conduction velocity tester and application method |
Also Published As
| Publication number | Publication date |
|---|---|
| EP3824812B1 (en) | 2023-01-04 |
| US20210158780A1 (en) | 2021-05-27 |
| JP7264377B2 (en) | 2023-04-25 |
| JP2021083479A (en) | 2021-06-03 |
| US11443717B2 (en) | 2022-09-13 |
Similar Documents
| Publication | Publication Date | Title |
|---|---|---|
| US11957470B2 (en) | Method and system for evaluation of functional cardiac electrophysiology | |
| EP3824812B1 (en) | Biometric information display device, biometric information display method, and display program | |
| EP3795075B1 (en) | Using supplemental information to improve inverse problem solutions | |
| US12239476B2 (en) | Biometric information display apparatus, method, and program | |
| JP2021087756A (en) | Biological information display device, biological information display method, and display program | |
| US12390142B2 (en) | Systems and methods for electrocardiographic mapping and target site identification | |
| US12114979B2 (en) | Biomagnetic field measurement processing apparatus, biomagnetic field measurement system, and control method of biomagnetic field measurement processing apparatus | |
| US20240315649A1 (en) | Biometric information display device, system, biometric information display method, and biometric information display program | |
| EP4277528B1 (en) | Diagnostic support apparatus, diagnostic support method, and diagnostic support program | |
| US20230284951A1 (en) | Biomagnetic field measurement system, method for controlling biomagnetic field measurement system, and recording medium storing control program for biomagnetic field measurement system | |
| JP2024135382A (en) | Reconstruction method, reconstruction program, and biomagnetic measurement device | |
| JP7385217B2 (en) | Biocurrent estimation method, biocurrent estimation device, and biomagnetic measurement system | |
| JP3033207B2 (en) | Biological activity current source analyzer | |
| CN116801791A (en) | Diagnostic support device, diagnostic support method, and diagnostic support program | |
| JP2022108245A (en) | Diagnosis support device, diagnosis support method and diagnosis support program | |
| JP2023131626A (en) | Biomagnetism measurement device, biomagnetism measurement processing device, and control method for biomagnetism measurement device | |
| WO2023014637A1 (en) | Systems and methods for electrocardiographic mapping and target site identification |
Legal Events
| Date | Code | Title | Description |
|---|---|---|---|
| PUAI | Public reference made under article 153(3) epc to a published international application that has entered the european phase |
Free format text: ORIGINAL CODE: 0009012 |
|
| STAA | Information on the status of an ep patent application or granted ep patent |
Free format text: STATUS: REQUEST FOR EXAMINATION WAS MADE |
|
| 17P | Request for examination filed |
Effective date: 20201118 |
|
| AK | Designated contracting states |
Kind code of ref document: A1 Designated state(s): AL AT BE BG CH CY CZ DE DK EE ES FI FR GB GR HR HU IE IS IT LI LT LU LV MC MK MT NL NO PL PT RO RS SE SI SK SM TR |
|
| RIC1 | Information provided on ipc code assigned before grant |
Ipc: A61B 5/245 20210101ALN20220530BHEP Ipc: A61B 5/243 20210101ALN20220530BHEP Ipc: G16H 50/70 20180101ALN20220530BHEP Ipc: G16H 50/20 20180101ALN20220530BHEP Ipc: G16H 40/63 20180101ALN20220530BHEP Ipc: G16H 30/40 20180101ALN20220530BHEP Ipc: G16H 30/20 20180101ALN20220530BHEP Ipc: A61N 1/04 20060101ALI20220530BHEP Ipc: G06T 11/00 20060101ALI20220530BHEP Ipc: A61B 6/12 20060101ALI20220530BHEP Ipc: A61B 6/03 20060101ALI20220530BHEP Ipc: G06T 7/00 20170101ALI20220530BHEP Ipc: A61B 5/388 20210101ALI20220530BHEP Ipc: A61B 5/055 20060101ALI20220530BHEP Ipc: A61B 5/248 20210101AFI20220530BHEP |
|
| GRAP | Despatch of communication of intention to grant a patent |
Free format text: ORIGINAL CODE: EPIDOSNIGR1 |
|
| STAA | Information on the status of an ep patent application or granted ep patent |
Free format text: STATUS: GRANT OF PATENT IS INTENDED |
|
| INTG | Intention to grant announced |
Effective date: 20220708 |
|
| GRAS | Grant fee paid |
Free format text: ORIGINAL CODE: EPIDOSNIGR3 |
|
| GRAA | (expected) grant |
Free format text: ORIGINAL CODE: 0009210 |
|
| STAA | Information on the status of an ep patent application or granted ep patent |
Free format text: STATUS: THE PATENT HAS BEEN GRANTED |
|
| AK | Designated contracting states |
Kind code of ref document: B1 Designated state(s): AL AT BE BG CH CY CZ DE DK EE ES FI FR GB GR HR HU IE IS IT LI LT LU LV MC MK MT NL NO PL PT RO RS SE SI SK SM TR |
|
| REG | Reference to a national code |
Ref country code: GB Ref legal event code: FG4D |
|
| REG | Reference to a national code |
Ref country code: DE Ref legal event code: R096 Ref document number: 602020007346 Country of ref document: DE |
|
| REG | Reference to a national code |
Ref country code: CH Ref legal event code: EP |
|
| REG | Reference to a national code |
Ref country code: AT Ref legal event code: REF Ref document number: 1541383 Country of ref document: AT Kind code of ref document: T Effective date: 20230115 |
|
| REG | Reference to a national code |
Ref country code: IE Ref legal event code: FG4D |
|
| REG | Reference to a national code |
Ref country code: LT Ref legal event code: MG9D |
|
| REG | Reference to a national code |
Ref country code: NL Ref legal event code: MP Effective date: 20230104 |
|
| REG | Reference to a national code |
Ref country code: AT Ref legal event code: MK05 Ref document number: 1541383 Country of ref document: AT Kind code of ref document: T Effective date: 20230104 |
|
| P01 | Opt-out of the competence of the unified patent court (upc) registered |
Effective date: 20230522 |
|
| PG25 | Lapsed in a contracting state [announced via postgrant information from national office to epo] |
Ref country code: NL Free format text: LAPSE BECAUSE OF FAILURE TO SUBMIT A TRANSLATION OF THE DESCRIPTION OR TO PAY THE FEE WITHIN THE PRESCRIBED TIME-LIMIT Effective date: 20230104 |
|
| PG25 | Lapsed in a contracting state [announced via postgrant information from national office to epo] |
Ref country code: RS Free format text: LAPSE BECAUSE OF FAILURE TO SUBMIT A TRANSLATION OF THE DESCRIPTION OR TO PAY THE FEE WITHIN THE PRESCRIBED TIME-LIMIT Effective date: 20230104 Ref country code: PT Free format text: LAPSE BECAUSE OF FAILURE TO SUBMIT A TRANSLATION OF THE DESCRIPTION OR TO PAY THE FEE WITHIN THE PRESCRIBED TIME-LIMIT Effective date: 20230504 Ref country code: NO Free format text: LAPSE BECAUSE OF FAILURE TO SUBMIT A TRANSLATION OF THE DESCRIPTION OR TO PAY THE FEE WITHIN THE PRESCRIBED TIME-LIMIT Effective date: 20230404 Ref country code: LV Free format text: LAPSE BECAUSE OF FAILURE TO SUBMIT A TRANSLATION OF THE DESCRIPTION OR TO PAY THE FEE WITHIN THE PRESCRIBED TIME-LIMIT Effective date: 20230104 Ref country code: LT Free format text: LAPSE BECAUSE OF FAILURE TO SUBMIT A TRANSLATION OF THE DESCRIPTION OR TO PAY THE FEE WITHIN THE PRESCRIBED TIME-LIMIT Effective date: 20230104 Ref country code: HR Free format text: LAPSE BECAUSE OF FAILURE TO SUBMIT A TRANSLATION OF THE DESCRIPTION OR TO PAY THE FEE WITHIN THE PRESCRIBED TIME-LIMIT Effective date: 20230104 Ref country code: ES Free format text: LAPSE BECAUSE OF FAILURE TO SUBMIT A TRANSLATION OF THE DESCRIPTION OR TO PAY THE FEE WITHIN THE PRESCRIBED TIME-LIMIT Effective date: 20230104 Ref country code: AT Free format text: LAPSE BECAUSE OF FAILURE TO SUBMIT A TRANSLATION OF THE DESCRIPTION OR TO PAY THE FEE WITHIN THE PRESCRIBED TIME-LIMIT Effective date: 20230104 |
|
| PG25 | Lapsed in a contracting state [announced via postgrant information from national office to epo] |
Ref country code: SE Free format text: LAPSE BECAUSE OF FAILURE TO SUBMIT A TRANSLATION OF THE DESCRIPTION OR TO PAY THE FEE WITHIN THE PRESCRIBED TIME-LIMIT Effective date: 20230104 Ref country code: PL Free format text: LAPSE BECAUSE OF FAILURE TO SUBMIT A TRANSLATION OF THE DESCRIPTION OR TO PAY THE FEE WITHIN THE PRESCRIBED TIME-LIMIT Effective date: 20230104 Ref country code: IS Free format text: LAPSE BECAUSE OF FAILURE TO SUBMIT A TRANSLATION OF THE DESCRIPTION OR TO PAY THE FEE WITHIN THE PRESCRIBED TIME-LIMIT Effective date: 20230504 Ref country code: GR Free format text: LAPSE BECAUSE OF FAILURE TO SUBMIT A TRANSLATION OF THE DESCRIPTION OR TO PAY THE FEE WITHIN THE PRESCRIBED TIME-LIMIT Effective date: 20230405 Ref country code: FI Free format text: LAPSE BECAUSE OF FAILURE TO SUBMIT A TRANSLATION OF THE DESCRIPTION OR TO PAY THE FEE WITHIN THE PRESCRIBED TIME-LIMIT Effective date: 20230104 |
|
| REG | Reference to a national code |
Ref country code: DE Ref legal event code: R097 Ref document number: 602020007346 Country of ref document: DE |
|
| PG25 | Lapsed in a contracting state [announced via postgrant information from national office to epo] |
Ref country code: SM Free format text: LAPSE BECAUSE OF FAILURE TO SUBMIT A TRANSLATION OF THE DESCRIPTION OR TO PAY THE FEE WITHIN THE PRESCRIBED TIME-LIMIT Effective date: 20230104 Ref country code: RO Free format text: LAPSE BECAUSE OF FAILURE TO SUBMIT A TRANSLATION OF THE DESCRIPTION OR TO PAY THE FEE WITHIN THE PRESCRIBED TIME-LIMIT Effective date: 20230104 Ref country code: EE Free format text: LAPSE BECAUSE OF FAILURE TO SUBMIT A TRANSLATION OF THE DESCRIPTION OR TO PAY THE FEE WITHIN THE PRESCRIBED TIME-LIMIT Effective date: 20230104 Ref country code: DK Free format text: LAPSE BECAUSE OF FAILURE TO SUBMIT A TRANSLATION OF THE DESCRIPTION OR TO PAY THE FEE WITHIN THE PRESCRIBED TIME-LIMIT Effective date: 20230104 Ref country code: CZ Free format text: LAPSE BECAUSE OF FAILURE TO SUBMIT A TRANSLATION OF THE DESCRIPTION OR TO PAY THE FEE WITHIN THE PRESCRIBED TIME-LIMIT Effective date: 20230104 |
|
| PLBE | No opposition filed within time limit |
Free format text: ORIGINAL CODE: 0009261 |
|
| STAA | Information on the status of an ep patent application or granted ep patent |
Free format text: STATUS: NO OPPOSITION FILED WITHIN TIME LIMIT |
|
| PG25 | Lapsed in a contracting state [announced via postgrant information from national office to epo] |
Ref country code: SK Free format text: LAPSE BECAUSE OF FAILURE TO SUBMIT A TRANSLATION OF THE DESCRIPTION OR TO PAY THE FEE WITHIN THE PRESCRIBED TIME-LIMIT Effective date: 20230104 |
|
| 26N | No opposition filed |
Effective date: 20231005 |
|
| PG25 | Lapsed in a contracting state [announced via postgrant information from national office to epo] |
Ref country code: SI Free format text: LAPSE BECAUSE OF FAILURE TO SUBMIT A TRANSLATION OF THE DESCRIPTION OR TO PAY THE FEE WITHIN THE PRESCRIBED TIME-LIMIT Effective date: 20230104 |
|
| PG25 | Lapsed in a contracting state [announced via postgrant information from national office to epo] |
Ref country code: IT Free format text: LAPSE BECAUSE OF FAILURE TO SUBMIT A TRANSLATION OF THE DESCRIPTION OR TO PAY THE FEE WITHIN THE PRESCRIBED TIME-LIMIT Effective date: 20230104 |
|
| REG | Reference to a national code |
Ref country code: CH Ref legal event code: PL |
|
| PG25 | Lapsed in a contracting state [announced via postgrant information from national office to epo] |
Ref country code: MC Free format text: LAPSE BECAUSE OF FAILURE TO SUBMIT A TRANSLATION OF THE DESCRIPTION OR TO PAY THE FEE WITHIN THE PRESCRIBED TIME-LIMIT Effective date: 20230104 |
|
| PG25 | Lapsed in a contracting state [announced via postgrant information from national office to epo] |
Ref country code: LU Free format text: LAPSE BECAUSE OF NON-PAYMENT OF DUE FEES Effective date: 20231118 |
|
| PG25 | Lapsed in a contracting state [announced via postgrant information from national office to epo] |
Ref country code: CH Free format text: LAPSE BECAUSE OF NON-PAYMENT OF DUE FEES Effective date: 20231130 |
|
| PG25 | Lapsed in a contracting state [announced via postgrant information from national office to epo] |
Ref country code: MC Free format text: LAPSE BECAUSE OF FAILURE TO SUBMIT A TRANSLATION OF THE DESCRIPTION OR TO PAY THE FEE WITHIN THE PRESCRIBED TIME-LIMIT Effective date: 20230104 Ref country code: LU Free format text: LAPSE BECAUSE OF NON-PAYMENT OF DUE FEES Effective date: 20231118 Ref country code: CH Free format text: LAPSE BECAUSE OF NON-PAYMENT OF DUE FEES Effective date: 20231130 |
|
| REG | Reference to a national code |
Ref country code: BE Ref legal event code: MM Effective date: 20231130 |
|
| REG | Reference to a national code |
Ref country code: IE Ref legal event code: MM4A |
|
| PG25 | Lapsed in a contracting state [announced via postgrant information from national office to epo] |
Ref country code: IE Free format text: LAPSE BECAUSE OF NON-PAYMENT OF DUE FEES Effective date: 20231118 |
|
| PG25 | Lapsed in a contracting state [announced via postgrant information from national office to epo] |
Ref country code: BE Free format text: LAPSE BECAUSE OF NON-PAYMENT OF DUE FEES Effective date: 20231130 |
|
| PG25 | Lapsed in a contracting state [announced via postgrant information from national office to epo] |
Ref country code: IE Free format text: LAPSE BECAUSE OF NON-PAYMENT OF DUE FEES Effective date: 20231118 Ref country code: BE Free format text: LAPSE BECAUSE OF NON-PAYMENT OF DUE FEES Effective date: 20231130 |
|
| PG25 | Lapsed in a contracting state [announced via postgrant information from national office to epo] |
Ref country code: BG Free format text: LAPSE BECAUSE OF FAILURE TO SUBMIT A TRANSLATION OF THE DESCRIPTION OR TO PAY THE FEE WITHIN THE PRESCRIBED TIME-LIMIT Effective date: 20230104 |
|
| PG25 | Lapsed in a contracting state [announced via postgrant information from national office to epo] |
Ref country code: BG Free format text: LAPSE BECAUSE OF FAILURE TO SUBMIT A TRANSLATION OF THE DESCRIPTION OR TO PAY THE FEE WITHIN THE PRESCRIBED TIME-LIMIT Effective date: 20230104 |
|
| REG | Reference to a national code |
Ref country code: DE Ref legal event code: R081 Ref document number: 602020007346 Country of ref document: DE Owner name: INSTITUTE OF SCIENCE TOKYO, JP Free format text: FORMER OWNERS: NATIONAL UNIVERSITY CORPORATION TOKYO MEDICAL AND DENTAL UNIVERSITY, TOKYO, JP; RICOH COMPANY, LTD., TOKYO, JP |
|
| REG | Reference to a national code |
Ref country code: GB Ref legal event code: 732E Free format text: REGISTERED BETWEEN 20250313 AND 20250319 |
|
| REG | Reference to a national code |
Ref country code: GB Ref legal event code: 732E Free format text: REGISTERED BETWEEN 20250320 AND 20250326 |
|
| PG25 | Lapsed in a contracting state [announced via postgrant information from national office to epo] |
Ref country code: CY Free format text: LAPSE BECAUSE OF FAILURE TO SUBMIT A TRANSLATION OF THE DESCRIPTION OR TO PAY THE FEE WITHIN THE PRESCRIBED TIME-LIMIT; INVALID AB INITIO Effective date: 20201118 |
|
| PG25 | Lapsed in a contracting state [announced via postgrant information from national office to epo] |
Ref country code: HU Free format text: LAPSE BECAUSE OF FAILURE TO SUBMIT A TRANSLATION OF THE DESCRIPTION OR TO PAY THE FEE WITHIN THE PRESCRIBED TIME-LIMIT; INVALID AB INITIO Effective date: 20201118 |
|
| PG25 | Lapsed in a contracting state [announced via postgrant information from national office to epo] |
Ref country code: TR Free format text: LAPSE BECAUSE OF FAILURE TO SUBMIT A TRANSLATION OF THE DESCRIPTION OR TO PAY THE FEE WITHIN THE PRESCRIBED TIME-LIMIT Effective date: 20230104 |
|
| PGFP | Annual fee paid to national office [announced via postgrant information from national office to epo] |
Ref country code: DE Payment date: 20251104 Year of fee payment: 6 |
|
| PGFP | Annual fee paid to national office [announced via postgrant information from national office to epo] |
Ref country code: GB Payment date: 20251030 Year of fee payment: 6 |
|
| PGFP | Annual fee paid to national office [announced via postgrant information from national office to epo] |
Ref country code: FR Payment date: 20251110 Year of fee payment: 6 |