EP3766984A1 - Determination method` - Google Patents
Determination method` Download PDFInfo
- Publication number
- EP3766984A1 EP3766984A1 EP19766464.2A EP19766464A EP3766984A1 EP 3766984 A1 EP3766984 A1 EP 3766984A1 EP 19766464 A EP19766464 A EP 19766464A EP 3766984 A1 EP3766984 A1 EP 3766984A1
- Authority
- EP
- European Patent Office
- Prior art keywords
- phase difference
- sphere
- difference amount
- correlation
- determined
- Prior art date
- Legal status (The legal status is an assumption and is not a legal conclusion. Google has not performed a legal analysis and makes no representation as to the accuracy of the status listed.)
- Granted
Links
Images




Classifications
-
- C—CHEMISTRY; METALLURGY
- C12—BIOCHEMISTRY; BEER; SPIRITS; WINE; VINEGAR; MICROBIOLOGY; ENZYMOLOGY; MUTATION OR GENETIC ENGINEERING
- C12M—APPARATUS FOR ENZYMOLOGY OR MICROBIOLOGY; APPARATUS FOR CULTURING MICROORGANISMS FOR PRODUCING BIOMASS, FOR GROWING CELLS OR FOR OBTAINING FERMENTATION OR METABOLIC PRODUCTS, i.e. BIOREACTORS OR FERMENTERS
- C12M41/00—Means for regulation, monitoring, measurement or control, e.g. flow regulation
- C12M41/30—Means for regulation, monitoring, measurement or control, e.g. flow regulation of concentration
- C12M41/36—Means for regulation, monitoring, measurement or control, e.g. flow regulation of concentration of biomass, e.g. colony counters or by turbidity measurements
-
- C—CHEMISTRY; METALLURGY
- C12—BIOCHEMISTRY; BEER; SPIRITS; WINE; VINEGAR; MICROBIOLOGY; ENZYMOLOGY; MUTATION OR GENETIC ENGINEERING
- C12Q—MEASURING OR TESTING PROCESSES INVOLVING ENZYMES, NUCLEIC ACIDS OR MICROORGANISMS; COMPOSITIONS OR TEST PAPERS THEREFOR; PROCESSES OF PREPARING SUCH COMPOSITIONS; CONDITION-RESPONSIVE CONTROL IN MICROBIOLOGICAL OR ENZYMOLOGICAL PROCESSES
- C12Q1/00—Measuring or testing processes involving enzymes, nucleic acids or microorganisms; Compositions therefor; Processes of preparing such compositions
- C12Q1/02—Measuring or testing processes involving enzymes, nucleic acids or microorganisms; Compositions therefor; Processes of preparing such compositions involving viable microorganisms
-
- G—PHYSICS
- G01—MEASURING; TESTING
- G01N—INVESTIGATING OR ANALYSING MATERIALS BY DETERMINING THEIR CHEMICAL OR PHYSICAL PROPERTIES
- G01N15/00—Investigating characteristics of particles; Investigating permeability, pore-volume or surface-area of porous materials
- G01N15/06—Investigating concentration of particle suspensions
-
- G—PHYSICS
- G01—MEASURING; TESTING
- G01N—INVESTIGATING OR ANALYSING MATERIALS BY DETERMINING THEIR CHEMICAL OR PHYSICAL PROPERTIES
- G01N15/00—Investigating characteristics of particles; Investigating permeability, pore-volume or surface-area of porous materials
- G01N15/10—Investigating individual particles
- G01N15/14—Optical investigation techniques, e.g. flow cytometry
- G01N15/1429—Signal processing
- G01N15/1433—Signal processing using image recognition
-
- G—PHYSICS
- G01—MEASURING; TESTING
- G01N—INVESTIGATING OR ANALYSING MATERIALS BY DETERMINING THEIR CHEMICAL OR PHYSICAL PROPERTIES
- G01N21/00—Investigating or analysing materials by the use of optical means, i.e. using sub-millimetre waves, infrared, visible or ultraviolet light
- G01N21/17—Systems in which incident light is modified in accordance with the properties of the material investigated
- G01N21/41—Refractivity; Phase-affecting properties, e.g. optical path length
- G01N21/45—Refractivity; Phase-affecting properties, e.g. optical path length using interferometric methods; using Schlieren methods
- G01N21/453—Holographic interferometry
-
- G—PHYSICS
- G03—PHOTOGRAPHY; CINEMATOGRAPHY; ANALOGOUS TECHNIQUES USING WAVES OTHER THAN OPTICAL WAVES; ELECTROGRAPHY; HOLOGRAPHY
- G03H—HOLOGRAPHIC PROCESSES OR APPARATUS
- G03H1/00—Holographic processes or apparatus using light, infrared or ultraviolet waves for obtaining holograms or for obtaining an image from them; Details peculiar thereto
- G03H1/04—Processes or apparatus for producing holograms
- G03H1/08—Synthesising holograms, i.e. holograms synthesized from objects or objects from holograms
- G03H1/0866—Digital holographic imaging, i.e. synthesizing holobjects from holograms
-
- G—PHYSICS
- G06—COMPUTING OR CALCULATING; COUNTING
- G06T—IMAGE DATA PROCESSING OR GENERATION, IN GENERAL
- G06T7/00—Image analysis
- G06T7/0002—Inspection of images, e.g. flaw detection
- G06T7/0012—Biomedical image inspection
-
- G—PHYSICS
- G06—COMPUTING OR CALCULATING; COUNTING
- G06T—IMAGE DATA PROCESSING OR GENERATION, IN GENERAL
- G06T7/00—Image analysis
- G06T7/60—Analysis of geometric attributes
- G06T7/62—Analysis of geometric attributes of area, perimeter, diameter or volume
-
- G—PHYSICS
- G01—MEASURING; TESTING
- G01N—INVESTIGATING OR ANALYSING MATERIALS BY DETERMINING THEIR CHEMICAL OR PHYSICAL PROPERTIES
- G01N15/00—Investigating characteristics of particles; Investigating permeability, pore-volume or surface-area of porous materials
- G01N15/06—Investigating concentration of particle suspensions
- G01N15/075—Investigating concentration of particle suspensions by optical means
-
- G—PHYSICS
- G01—MEASURING; TESTING
- G01N—INVESTIGATING OR ANALYSING MATERIALS BY DETERMINING THEIR CHEMICAL OR PHYSICAL PROPERTIES
- G01N15/00—Investigating characteristics of particles; Investigating permeability, pore-volume or surface-area of porous materials
- G01N15/10—Investigating individual particles
- G01N2015/1006—Investigating individual particles for cytology
-
- G—PHYSICS
- G01—MEASURING; TESTING
- G01N—INVESTIGATING OR ANALYSING MATERIALS BY DETERMINING THEIR CHEMICAL OR PHYSICAL PROPERTIES
- G01N15/00—Investigating characteristics of particles; Investigating permeability, pore-volume or surface-area of porous materials
- G01N15/10—Investigating individual particles
- G01N15/14—Optical investigation techniques, e.g. flow cytometry
- G01N15/1434—Optical arrangements
- G01N2015/1454—Optical arrangements using phase shift or interference, e.g. for improving contrast
-
- G—PHYSICS
- G01—MEASURING; TESTING
- G01N—INVESTIGATING OR ANALYSING MATERIALS BY DETERMINING THEIR CHEMICAL OR PHYSICAL PROPERTIES
- G01N15/00—Investigating characteristics of particles; Investigating permeability, pore-volume or surface-area of porous materials
- G01N15/10—Investigating individual particles
- G01N15/14—Optical investigation techniques, e.g. flow cytometry
- G01N2015/1493—Particle size
-
- G—PHYSICS
- G01—MEASURING; TESTING
- G01N—INVESTIGATING OR ANALYSING MATERIALS BY DETERMINING THEIR CHEMICAL OR PHYSICAL PROPERTIES
- G01N15/00—Investigating characteristics of particles; Investigating permeability, pore-volume or surface-area of porous materials
- G01N15/10—Investigating individual particles
- G01N15/14—Optical investigation techniques, e.g. flow cytometry
- G01N2015/1497—Particle shape
-
- G—PHYSICS
- G01—MEASURING; TESTING
- G01N—INVESTIGATING OR ANALYSING MATERIALS BY DETERMINING THEIR CHEMICAL OR PHYSICAL PROPERTIES
- G01N2201/00—Features of devices classified in G01N21/00
- G01N2201/06—Illumination; Optics
- G01N2201/061—Sources
- G01N2201/06113—Coherent sources; lasers
-
- G—PHYSICS
- G01—MEASURING; TESTING
- G01N—INVESTIGATING OR ANALYSING MATERIALS BY DETERMINING THEIR CHEMICAL OR PHYSICAL PROPERTIES
- G01N2201/00—Features of devices classified in G01N21/00
- G01N2201/06—Illumination; Optics
- G01N2201/063—Illuminating optical parts
- G01N2201/0633—Directed, collimated illumination
-
- G—PHYSICS
- G02—OPTICS
- G02B—OPTICAL ELEMENTS, SYSTEMS OR APPARATUS
- G02B21/00—Microscopes
- G02B21/16—Microscopes adapted for ultraviolet illumination ; Fluorescence microscopes
-
- G—PHYSICS
- G03—PHOTOGRAPHY; CINEMATOGRAPHY; ANALOGOUS TECHNIQUES USING WAVES OTHER THAN OPTICAL WAVES; ELECTROGRAPHY; HOLOGRAPHY
- G03H—HOLOGRAPHIC PROCESSES OR APPARATUS
- G03H1/00—Holographic processes or apparatus using light, infrared or ultraviolet waves for obtaining holograms or for obtaining an image from them; Details peculiar thereto
- G03H1/04—Processes or apparatus for producing holograms
- G03H1/0443—Digital holography, i.e. recording holograms with digital recording means
-
- G—PHYSICS
- G03—PHOTOGRAPHY; CINEMATOGRAPHY; ANALOGOUS TECHNIQUES USING WAVES OTHER THAN OPTICAL WAVES; ELECTROGRAPHY; HOLOGRAPHY
- G03H—HOLOGRAPHIC PROCESSES OR APPARATUS
- G03H1/00—Holographic processes or apparatus using light, infrared or ultraviolet waves for obtaining holograms or for obtaining an image from them; Details peculiar thereto
- G03H1/0005—Adaptation of holography to specific applications
- G03H2001/0033—Adaptation of holography to specific applications in hologrammetry for measuring or analysing
-
- G—PHYSICS
- G03—PHOTOGRAPHY; CINEMATOGRAPHY; ANALOGOUS TECHNIQUES USING WAVES OTHER THAN OPTICAL WAVES; ELECTROGRAPHY; HOLOGRAPHY
- G03H—HOLOGRAPHIC PROCESSES OR APPARATUS
- G03H1/00—Holographic processes or apparatus using light, infrared or ultraviolet waves for obtaining holograms or for obtaining an image from them; Details peculiar thereto
- G03H1/0005—Adaptation of holography to specific applications
- G03H2001/005—Adaptation of holography to specific applications in microscopy, e.g. digital holographic microscope [DHM]
-
- G—PHYSICS
- G03—PHOTOGRAPHY; CINEMATOGRAPHY; ANALOGOUS TECHNIQUES USING WAVES OTHER THAN OPTICAL WAVES; ELECTROGRAPHY; HOLOGRAPHY
- G03H—HOLOGRAPHIC PROCESSES OR APPARATUS
- G03H1/00—Holographic processes or apparatus using light, infrared or ultraviolet waves for obtaining holograms or for obtaining an image from them; Details peculiar thereto
- G03H1/04—Processes or apparatus for producing holograms
- G03H1/08—Synthesising holograms, i.e. holograms synthesized from objects or objects from holograms
- G03H1/0866—Digital holographic imaging, i.e. synthesizing holobjects from holograms
- G03H2001/0875—Solving phase ambiguity, e.g. phase unwrapping
-
- G—PHYSICS
- G03—PHOTOGRAPHY; CINEMATOGRAPHY; ANALOGOUS TECHNIQUES USING WAVES OTHER THAN OPTICAL WAVES; ELECTROGRAPHY; HOLOGRAPHY
- G03H—HOLOGRAPHIC PROCESSES OR APPARATUS
- G03H1/00—Holographic processes or apparatus using light, infrared or ultraviolet waves for obtaining holograms or for obtaining an image from them; Details peculiar thereto
- G03H1/04—Processes or apparatus for producing holograms
- G03H1/08—Synthesising holograms, i.e. holograms synthesized from objects or objects from holograms
- G03H1/0866—Digital holographic imaging, i.e. synthesizing holobjects from holograms
- G03H2001/0883—Reconstruction aspect, e.g. numerical focusing
-
- G—PHYSICS
- G06—COMPUTING OR CALCULATING; COUNTING
- G06T—IMAGE DATA PROCESSING OR GENERATION, IN GENERAL
- G06T2207/00—Indexing scheme for image analysis or image enhancement
- G06T2207/10—Image acquisition modality
- G06T2207/10056—Microscopic image
-
- G—PHYSICS
- G06—COMPUTING OR CALCULATING; COUNTING
- G06T—IMAGE DATA PROCESSING OR GENERATION, IN GENERAL
- G06T2207/00—Indexing scheme for image analysis or image enhancement
- G06T2207/10—Image acquisition modality
- G06T2207/10064—Fluorescence image
-
- G—PHYSICS
- G06—COMPUTING OR CALCULATING; COUNTING
- G06T—IMAGE DATA PROCESSING OR GENERATION, IN GENERAL
- G06T2207/00—Indexing scheme for image analysis or image enhancement
- G06T2207/30—Subject of image; Context of image processing
- G06T2207/30004—Biomedical image processing
- G06T2207/30024—Cell structures in vitro; Tissue sections in vitro
Definitions
- the disclosed technology relates to a determination method for determining a state of a sphere that is an aggregate of a plurality of cells.
- JP2016-005437A discloses a cell evaluation method of irradiating a cell group with illumination light, detecting transmitted light transmitted through the cell group by the irradiation of the illumination light to detect an image of the cell group, irradiating the cell group with detection light for detecting scattered light in the cell group, and evaluating the cell group on the basis of spatial spread or temporal fluctuation of intensity of the detected scattered light.
- JP2017-000163A discloses a cell evaluation apparatus comprising an image input unit that inputs a first captured image obtained by imaging a cell in a neural cell differentiation process, an all-in-focus image generation unit that generates an all-in-focus image focused at a position in a thickness direction of the cell as a first original image based on at least the first captured image, a rosette extraction unit that extracts a region common to a region having a luminance distribution equal to or less than a certain level in a first original image and a region having a density difference equal to or less than a certain level in the first original image as a rosette appearing in a differentiation process, and a rosette correspondence determination unit that determines a state of the extracted rosette.
- JP2015-146747A discloses a cell determination method characterized by comprising a determination step of determining the degree of differentiation of a cell on the basis of a cell thickness.
- a three-dimensional culture method As a culture method capable of mass production of cells, a three-dimensional culture method is known in which a sphere that is an aggregate of cells are cultured in a suspended state in a medium.
- a technique for non-destructively and simply evaluating the quality of cells in the state of spheres is required from the viewpoint of easy process control.
- a method for evaluating spheres having various sizes randomly present in a three-dimensional space has not been established, and in particular, it is difficult to directly observe a density and survival situation of cells inside the sphere.
- evaluation is performed by applying a conventional two-dimensional culture method, but as the number of cells to be cultured increases, the number of evaluation steps increases, and thus much manpower and much time are required.
- a treatment involving cell destruction such as decomposing the sphere into a single cell or adding a fluorescent coloring agent is required.
- An object of the disclosed technology is to determine a state of a sphere that is an aggregate of a plurality of cells, in a non-destructive and simple manner.
- a determination method includes generating a phase difference image of a sphere that is an aggregate of a plurality of cells from a hologram obtained by imaging the sphere; and determining a state of the sphere on the basis of the phase difference image and a shape index value corresponding to a shape of the sphere.
- a determination regarding at least one of a survival rate, a density, a homogeneity, or an undifferentiated state deviation of the plurality of cells included in the sphere, or an outer shape of the sphere may be performed on the basis of the phase difference image and the shape index value.
- a total phase difference amount that is a value obtained by integrating a phase difference amount of each of a plurality of pixels constituting the phase difference image may be derived; and the state of the sphere may be determined using a correlation between the total phase difference amount and the shape index value.
- a reference correlation trend line indicating a reference for the correlation between the total phase difference amount and the shape index value may be compared with a correlation between a total phase difference amount and a shape index value for a sphere to be determined; and the state of the sphere to be determined may be determined according to a degree of deviation of the correlation between the total phase difference amount and the shape index value for the sphere to be determined from the reference correlation trend line.
- a width of the deviation of the correlation between the total phase difference amount and the shape index value for the sphere to be determined from the reference correlation trend line exceeds a threshold value, it may be determined that there is an abnormality in at least one of a survival rate, a density, or a homogeneity of cells included in the sphere to be determined, or an outer shape of the sphere.
- a reference correlation trend line indicating a reference for the correlation between the total phase difference amount and the shape index value may be compared with a correlation between a total phase difference amount and a shape index value for each of a plurality of spheres belonging to a culture lot to be determined; and a quality of the culture lot to be determined may be determined according to at least one of a state of deviation or a degree of deviation of the correlation between the total phase difference amount and the shape index value for the culture lot to be determined from the reference correlation trend line.
- the shape index value may be any one of a volume, a cross-sectional area, a particle diameter, or a circumferential length of the sphere.
- a phase difference amount density may be derived by dividing a total phase difference amount by a volume of the sphere, the a total phase difference amount is a value obtained by integrating a phase difference amount of each of a plurality of pixels constituting the phase difference image; and the state of the sphere may be determined on the basis of the phase difference amount density.
- the phase difference image used for the determination of the state of the sphere is a phase difference image in which variation in a phase difference amount between a plurality of pixels constituting the phase difference image is the maximum among a plurality of phase difference images that are generable from the hologram.
- a state of a sphere that is an aggregate of a plurality of cells can be determined in a non-destructive and simple manner.
- a determination method includes generating a phase difference image of a sphere that is an aggregate of a plurality of cells from a hologram obtained by imaging the sphere, and determining a state of the sphere on the basis of the phase difference image and a shape index value corresponding to a shape of the sphere.
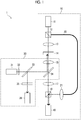
- Fig. 1 is a diagram showing an example of a configuration of an imaging system 1 used for performing a determination method according to an embodiment of the disclosed technology.
- the imaging system 1 is configured to include a hologram optical system 10 for acquiring a hologram of a sphere using a known digital holography technique, and a fluorescence microscope optical system 30 for performing fluorescence microscope observation of the sphere.
- the digital holography technique is a technique in which an image generated by interference between object light transmitted through or reflected by an object and reference light coherent with the object light is imaged using an image sensor, and numerical calculation based on light propagation is performed on the image obtained by the imaging, thereby restoring a wavefront of a light wave from the object. According to the digital holography technique, it is possible to quantify a phase distribution of the object and acquire three-dimensional information of the object without mechanically moving a focal position.
- the hologram optical system 10 is configured to include a laser light source 11, beam splitters 12 and 18, collimating lenses 13 and 21, an objective lens 15, an imaging lens 17, and a complementary metal oxide semiconductor (CMOS) camera 19.
- CMOS complementary metal oxide semiconductor
- a sphere as a sample 14 set on a sample stage is disposed between the collimating lens 13 and the objective lens 15.
- the laser light source 11 for example, a HeNe laser having a wavelength of 632.8 nm can be used.
- Laser light emitted from the laser light source 11 is split into two laser lights by the beam splitter 12.
- One of the two laser lights is object light and the other is reference light.
- the object light is collimated by the collimating lens 13, and then irradiated onto a sphere as the sample 14 set on the sample stage.
- An image formed by the object light transmitted through the sphere is magnified by the objective lens 15.
- the object light transmitted through the objective lens 15 is collimated again by the imaging lens 17, and then is formed on an imaging surface of a CMOS camera 19 via the beam splitter 18.
- the reference light is guided to the front of the collimating lens 21 by the optical fiber 20.
- the reference light emitted from the optical fiber 20 is collimated by the collimating lens 21 and is incident on the imaging surface of the CMOS camera 19 via the beam splitter 18.
- the hologram generated by the interference between the object light and the reference light is recorded by the CMOS camera 19.
- An off-axial optical system in which optical axis directions of the object light and the reference light incident on the imaging surface of the CMOS camera 19 are different from each other may be configured.
- the fluorescence microscope optical system 30 includes an excitation light source 31, an excitation filter 32, an ON/OFF switching mirror 33, a dichroic mirror 34, an objective lens 15, a spectral filter 35, and a CMOS camera 36.
- a mercury lamp for example, can be used as the excitation light source 31.
- the excitation filter 32 transmits light in a wavelength range of, for example, 450 nm to 490 nm among excitation lights emitted from the excitation light source 31.
- the excitation light transmitted through the excitation filter 32 is irradiated onto the sphere that is the sample 14 set on the sample stage, via the ON/OFF switching mirror 33, the dichroic mirror 34, and the objective lens 15.
- a fluorescent coloring agent added to the sphere is irradiated with excitation light
- fluorescence emitted from the fluorescent coloring agent is incident on the imaging surface of the CMOS camera 36 via the objective lens 15, the dichroic mirror 34, the ON/OFF switching mirror 33, and the spectral filter 35.
- the spectral filter 35 transmits, for example, light in a wavelength range of 515 nm or more among the fluorescence emitted from the fluorescent coloring agent.
- the imaging system 1 it is possible to perform hologram observation by the hologram optical system 10 and fluorescence microscopic observation by the fluorescence microscope optical system 30 in parallel.
- the configuration of the above-described imaging system 1 is merely an example, and the present invention is not limited to the above-described configuration. Any imaging system capable of acquiring a hologram using digital hologram technology can be used to perform the determination method according to the disclosed technology.
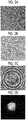
- Fig. 2A the hologram exemplified in Fig. 2A acquired by the CMOS camera 19 is subjected to a two-dimensional Fourier transform to extract a complex amplitude component of only the object light.
- Fig. 2B is an example of a Fourier transform image of the sphere obtained by this processing.
- Fig. 2C is an example of a phase difference image before unwrapping of the sphere obtained by this processing.
- the phase of the sphere at this point is convolved with a value of 0 to 2 ⁇ . Therefore, for example, by applying a phase connection (unwrapping) method such as unweighted least squares or Flynn' s algorithm to join portions of 2 ⁇ or more, a final phase difference image of the sphere as exemplified in Fig. 2D can be obtained.
- phase connection (unwrapping) method such as unweighted least squares or Flynn' s algorithm
- Fig. 3 is a diagram showing the concept of a phase difference image I P .
- a phase difference amount at each pixel k of the phase difference image Ip is three-dimensionally displayed.
- the phase difference amount at each pixel k of the phase difference image Ip is shown on a plane in gray scale.
- a phase difference amount ⁇ in the phase difference image I P is represented by Formula 1 in a case where ⁇ B is a phase of a background (region where the sphere does not exist) existing in the same focal plane of the phase difference image I P , and ⁇ S is a phase of a region where the sphere exists.
- phase in the present specification is a phase of an electric field amplitude in a case where light is regarded as an electromagnetic wave, and is used in a more general sense.
- a phase difference amount ⁇ k at each pixel k of the phase difference image I P can be represented by Formula 2.
- n k refractive index of the sphere at the portion corresponding to each pixel k of the phase difference image I P
- d k is a thickness of the sphere at the portion corresponding to each pixel k of the phase difference image Ip
- ⁇ is a wavelength of the object light in the hologram optical system 10.
- the phase difference image of the sphere is an image showing an optical path length distribution of the object light transmitted through the sphere. Since the optical path length in the sphere corresponds to the product of the refractive index of the sphere and the thickness of the sphere, the phase difference image of the sphere includes information on the refractive index and the thickness (shape) of the sphere, as also shown in Formula 2.
- focusing on a sphere means obtaining a phase difference image sliced near a center of a spherical sphere.
- a more accurate determination result can be obtained by determining the state of the sphere using the phase difference image focused on the sphere.
- a user may determine the state of the sphere on the basis of the acquired phase difference image of the sphere.
- a computer that has learned a determination condition may determine the state of the sphere on the basis of the acquired phase difference image of the sphere.
- the graph on the left side of Fig. 4 is a graph showing an example of a relationship between the position of the sphere in the plane direction and the phase difference amount in the phase difference image, in which a solid line corresponds to a state in which the sphere is in focus and a dotted line corresponds to a state in which the sphere is out of focus.
- a solid line corresponds to a state in which the sphere is in focus
- a dotted line corresponds to a state in which the sphere is out of focus.
- a steep peak appears at a specific position in the phase difference image.
- the peak is lower and smoother than the case where the sphere is in focus.
- the graph on the right side of Fig. 4 is an example of a histogram of the phase difference amount in the phase difference image of the sphere, in which a solid line corresponds to a state in which the sphere is in focus and a dotted line corresponds to a state in which the sphere is out of focus.
- a width w of a curve (variation in the phase difference amount) is relatively large, and in the case where the sphere is out of focus, the width w of the curve (variation in the phase difference amount) is relatively small.
- focusing can be realized by acquiring phase difference image of the sphere for each of different focal positions (slice positions), obtaining the width w of the curve in the histogram of the phase difference amount (variation in the phase difference amount) for each of the acquired phase difference image, and extracting the phase difference image having the maximum width w among the obtained widths w as the phase difference image focused on the sphere.
- Fig. 5 is an example of a hardware configuration of a computer 500 that performs an autofocus processing for automatically performing the above-described focusing.
- the computer 500 includes a central processing unit (CPU) 501, a main memory 502 as a temporary storage region, a nonvolatile auxiliary storage device 503, a communication interface (I/F) 504 for communicating with the CMOS camera 19, and a display unit 505 such as a liquid crystal display.
- the CPU 501, the main memory 502, the auxiliary storage device 503, the communication I/F 504, and the display unit 505 are each connected to a bus 507.
- the auxiliary storage device 503 houses an autofocus program 506 which describes the procedure of the above-described autofocus processing.
- the CPU 501 executes the autofocus program 506 to perform the autofocus processing.
- Fig. 6 is a flowchart showing an example of a flow of the autofocus processing performed by the computer 500.
- step S1 the CPU 501 acquires a hologram of the sphere from the CMOS camera 19.
- step S2 the CPU 501 generates a plurality of phase difference images having different focal positions (slice positions) from the acquired hologram.
- step S3 the CPU 501 derives the variation in the phase difference amount for each phase difference image for each focal position (slice position).
- the CPU 501 may derive, for example, a difference between the maximum value and the minimum value of the phase difference amount in the phase difference image as the variation of the phase difference amount in the phase difference image.
- step S4 the CPU 501 extracts a phase difference image having the largest variation in the phase difference amount derived in step S3 as the phase difference image focused on the sphere among the plurality of phase difference images having different focal positions (slice positions).
- Fig. 7 is a graph showing an example of the relationship between the focal position (slice position) and the variation in the phase difference amount in the phase difference image of the sphere.
- Fig. 7 exemplifies phase difference images and graphs of spheres corresponding to focal positions of -400 ⁇ m, -200 ⁇ m, 0 ⁇ m, +200 ⁇ m, and +400 ⁇ m.
- a focal position in which the variation in the phase difference amount is the maximum is set to 0 ⁇ m.
- the phase difference image corresponding to the focal position 0 ⁇ m in which the variation in the phase difference amount is the maximum is extracted as the focused phase difference image.
- a contour of the sphere becomes the clearest.
- the determination method includes determining the state of the sphere on the basis of a phase difference image of the sphere and a shape index value of the sphere. That is, the state of the sphere is determined by analyzing the phase difference image of the sphere in association with the shape index value of the sphere.
- the state of the sphere to be determined includes, for example, a survival rate, a density, a homogeneity, or an undifferentiated state deviation of a plurality of cells included in the sphere, or an outer shape of the sphere.
- the shape index value of the sphere for example, a volume of the sphere, a cross-sectional area, a particle diameter, a circumferential length, or the like can be used.
- the particle diameter and circumferential length of the sphere can be obtained directly from the image of the sphere in the phase difference image focused on the sphere (that is, the phase difference image sliced near the center of the sphere).
- the cross-sectional area of the sphere can be derived, for example, as a cross-sectional area of a circle whose diameter is the particle diameter of the sphere.
- the volume of the sphere can be derived as, for example, the volume of a sphere having a diameter of the particle diameter of the sphere.
- the determination method may include deriving a total phase difference amount ⁇ A that is a value obtained by integrating a phase difference amount of each of a plurality of pixels constituting the phase difference image, and determining the state of the sphere using a correlation between the total phase difference amount ⁇ A and the shape index value.
- the total phase difference amount ⁇ A is represented by Formula 3. However, s is the area of each pixel k of the phase difference image, and V k is the volume of the sphere in the portion corresponding to each pixel k of the phase difference image. As shown in Formula 3, the total phase difference amount ⁇ A corresponds to a value obtained by integrating the phase difference amount ⁇ k for each pixel of the phase difference image of the sphere for all pixels k. In Formula 3, d k shows a thickness of the sphere portion projected on the pixel k, and n k represents a difference in refractive index between a background culture solution and the inside of the sphere.
- V k d k ⁇ s is used.
- the determination method may include comparing a reference correlation trend line indicating a reference for the correlation between the total phase difference amount ⁇ A and the shape index value of the sphere with a correlation between the total phase difference amount ⁇ A and the shape index value for a sphere to be determined, and determining the state of the sphere to be determined according to a degree of deviation of the correlation for the sphere to be determined from the reference correlation trend line.
- a width of the deviation of the correlation for the sphere to be determined from the reference correlation trend line exceeds a threshold value, it may be determined that there is an abnormality in at least one of a survival rate, a density, or a homogeneity of cells included in the sphere to be determined, or an outer shape of the sphere.
- the state of the sphere to be determined may be determined according to the degree of deviation from the reference correlation trend line of a plot of the sphere to be determined which is plotted on a graph in which the total phase difference amount ⁇ A is taken on one axis and the shape index value is taken on the other axis.
- a width of a deviation of the above-described plot from the reference correlation trend line exceeds a threshold value, it may be determined that there is an abnormality in at least one of a survival rate, a density, or a homogeneity of cells included in the sphere to be determined, or an outer shape of the sphere.
- the determination method can include comparing the reference correlation trend line with the correlation between the total phase difference amount ⁇ A and the shape index value for each of the plurality of spheres belonging to a culture lot to be determined, and determining a quality of the culture lot to be determined according to at least one of the state of deviation or the degree of deviation of the correlation for the culture lot to be determined from the reference correlation trend line.
- the quality of the culture lot may be determined according to at least one of the state of deviation or the degree of deviation from the reference correlation trend line of the plot for each of the plurality of spheres belonging to the culture lot to be determined which is plotted on a graph in which the total phase difference amount ⁇ A is taken on one axis and the shape index value is taken on the other axis.
- the reference correlation trend line a correlation line between the total phase difference amount ⁇ A and the shape index value of the sphere, which is acquired in advance for a healthy sphere (standard sample).
- a regression line derived from each plot of the sphere to be determined using, for example, the least squares method may be used as the reference correlation trend line.
- the determination method may include deriving a phase difference amount density D P by dividing the total phase difference amount ⁇ A by the volume of the sphere, and determining the state of the sphere on the basis of the derived phase difference amount density D P .
- the phase difference amount density D P is represented by Formula 4.
- V is the volume of the sphere.
- the phase difference amount density D P corresponds to a value obtained by dividing the total phase difference amount ⁇ A by a volume V of the sphere.
- Healthy cells are considered to maintain a constant internal refractive index different from the refractive index of the medium due to their homeostasis.
- dead cells lose homeostasis and the internal refractive index becomes almost the same as that of the medium. Therefore, it is considered possible to use the phase difference amount density D P as an index indicating the state of cells.
- the state of the sphere is good in a case where the phase difference amount density D P acquired for the sphere to be determined is equal to or more than a threshold value, and it can be determined that the state of the sphere is abnormal in a case where the phase difference amount density D P is less than the threshold value. Since 2 ⁇ / ⁇ can be treated as a constant, the multiplication of 2 ⁇ / ⁇ may be omitted in a case of deriving the phase difference amount density D P .
- the phase difference density is a value obtained by normalizing the volume-averaged difference in refractive index of sphere by the length of wavelength.
- V is obtained by calculating a sphere equivalent diameter from the cross-sectional image of the phase image of the sphere. A more accurate ellipsoidal sphere is also possible.
- a sphere of an induced pluripotent stem (iPS) cell cultured by the three-dimensional culture method is set on the sample stage of the imaging system 1 shown in Fig. 1 , and holograms of the plurality of spheres are captured by the CMOS camera 19.
- a computer numerical calculation is performed on the acquired hologram of each sphere to acquire the phase difference image sliced near the center of the sphere.
- the volume is derived as the shape index value of each sphere. Further, for the phase difference image of each sphere, the total phase difference amount ⁇ A shown by Formula 3 is derived. Correlation properties between the volume of the sphere and the total phase difference amount ⁇ A are acquired by forming a plot for each sphere on a graph in which the volume of the sphere is taken on the lateral axis and the total phase difference amount ⁇ A is taken on the vertical axis.
- Fig. 8 is a graph showing the correlation properties between the volume of the sphere and the total phase difference amount ⁇ A . As shown in Fig. 8 , it is confirmed that the total phase difference amount ⁇ A and the volume of the sphere have a proportional relationship.
- Fig. 8 shows a reference correlation trend line Ls and a plot showing a reference for correlation between the volume of the sphere and the total phase difference amount ⁇ A .
- a regression line derived from each plot shown in Fig. 8 is applied as the reference correlation trend line L S .
- Fig. 8 shows phase difference images of spheres corresponding to plots a1 and a2 existing on the reference correlation trend line L S , and phase difference images of spheres corresponding to plots a3, a4, and a5 existing at a position deviated from the reference correlation trend line L S .
- a phase difference image having uniform luminance over the entire sphere is obtained. This indicates that the plurality of cells constituting the sphere are homogeneous, the density of the cells in the sphere is uniform, and the like.
- the state of the sphere can be determined by using a correlation between the total phase difference amount ⁇ A and the volume, which is an example of the shape index value of the sphere.
- the reference correlation trend line L S indicating the correlation between the total phase difference amount ⁇ A and the volume of the sphere can be compared with a correlation between the total phase difference amount ⁇ A and the shape index value for a sphere to be determined, and the state of the sphere can be determined according to a degree of deviation of the correlation for the sphere to be determined from the reference correlation trend line L S .
- the state of each sphere can be determined according to the degree of deviation from the reference correlation trend line L S of the plot of the sphere to be determined which is plotted on the graph in which the volume of the sphere is taken on one axis and the total phase difference amount ⁇ A is taken on the other axis. Therefore, for example, for spheres in which a minus width of the total phase difference amount ⁇ A from the reference correlation trend line L S is equal to or more than a threshold value, it can be determined that there is an abnormality in at least one of the density or homogeneity of the plurality of cells included in the sphere, or an outer shape of the sphere.
- the volume of the sphere is used as the shape index value of the sphere in this example, it is also possible to use the cross-sectional area, particle diameter, or circumferential length of the sphere instead of this. Even in a case where any of these shape index values is used, it is possible to determine the state of the sphere by using the correlation with the total phase difference amount ⁇ A .
- a culture lot including a plurality of spheres is used as an object to be determined.
- the culture lot to be determined are a good lot and a bad lot shown in Table 1 below.
- the sphere belonging to the good lot and the sphere belonging to the bad lot are spheres of iPS cells cultured by the three-dimensional culture method, respectively.
- a proliferation rate of cells from the first day to the fifth day of a culture period is 20 times in the sphere belonging to the good lot and 3.7 times in the sphere belonging to the bad lot.
- the survival rate of cells on the fifth day of culture is 90.2% in the sphere belonging to the good lot and 64.1% in the sphere belonging to the bad lot.
- the sphere as the sample 14 is set on the sample stage of the imaging system 1 shown in Fig. 1 , and holograms of the plurality of spheres are imaged by the CMOS camera 19. A computer numerical calculation is performed on the acquired hologram of each sphere to acquire the phase difference image sliced near the center of the sphere.
- the particle diameter of each sphere is derived from the obtained phase difference image of each sphere, and a histogram of the particle diameter of the sphere is acquired.
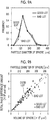
- Fig. 9A is the histogram of the particle diameter of the sphere derived for each of the good lot and the bad lot. As shown in Fig. 9A , there is no significant difference in the histogram between the good lot and the bad lot. This indicates that the state of the sphere is difficult to be reflected in the particle diameter of the sphere, and it is difficult to determine the state of the sphere on the basis of only the particle diameter of the sphere.
- the volume is derived as the shape index value of each sphere from the phase difference image of each sphere obtained for each of the good lot and the bad lot, and the total phase difference amount ⁇ A shown by Formula 3 is derived for the phase difference image of each sphere.
- the correlation properties between the volume of the sphere and the total phase difference amount ⁇ A are acquired by forming the plot for each sphere of each culture lot on the graph in which the volume of the sphere is taken on the lateral axis and the total phase difference amount ⁇ A is taken on the vertical axis.
- Fig. 9B is a graph showing an example of the correlation properties between the volume of the sphere and the total phase difference amount ⁇ A acquired for each of the good lot and the bad lot.
- FIG. 9B shows the reference correlation trend line L S and the plot. As shown in Fig. 9B , in the good lot, the number of spheres in which the total phase difference amount ⁇ A falls below the reference correlation trend line L S is small, whereas in the bad lot, the number of spheres in which the total phase difference amount ⁇ A falls below the reference correlation trend line L S is larger than that in the good lot.
- the quality of the culture lot can be determined by using a correlation between the total phase difference amount ⁇ A and the volume, which is an example of the shape index value of the sphere.
- the reference correlation trend line L S indicating the correlation between the total phase difference amount ⁇ A and the volume of the sphere can be compared with the correlation for the sphere belonging to the culture lot to be determined, and the quality of the culture lot can be determined according to the degree of deviation of the correlation for the culture lot to be determined from the reference correlation trend line L S .
- the state of the culture lot can be determined on the basis of at least one of the state of deviation (whether or not the plot falls below the reference correlation trend line L S ) or the degree of deviation from the reference correlation trend line L S of the plot of each sphere belonging to the culture lot to be determined which is plotted on the graph in which the volume of the sphere is taken on one axis and the total phase difference amount ⁇ A is taken on the other axis.
- a content of the spheres in which the minus width from the reference correlation trend line L S of the total phase difference amount ⁇ A is equal to or more than a first threshold value is equal to or more than a second threshold value
- the content of the spheres is less than the second threshold value
- Fig. 9C is a histogram of the phase difference amount density D P acquired for each of a good lot and a bad lot. As shown in Fig. 9C , there is a significant difference in the histogram between the good lot and the bad lot. Specifically, in the good lot, a peak of distribution exists at a position where the phase difference amount density D P is relatively high, and in the bad lot, a peak of distribution exists at a position where the phase difference amount density D P is relatively low.
- a p value (significance probability) which is an index showing the reliability of the significant difference between the good lot and the bad lot in the histogram of the phase difference amount density D P , is less than 0.05.
- the quality of the culture lot can be determined on the basis of the phase difference amount density D P of the sphere. Therefore, for example, an average value of the phase difference amount density D P is obtained for the plurality of spheres belonging to the culture lot to be determined, and in a case where the average value is equal to or more than a threshold value, the culture lot can be determined as a good lot, and in a case where the average value is less than the threshold value, the culture lot can be determined as a bad lot.
- phase difference amount density D P can also be used for quality determination of a single sphere. For example, it can be determined that the state of the sphere is good in a case where the phase difference amount density D P acquired for the sphere to be determined is equal to or more than a threshold value, and it can be determined that the state of the sphere is abnormal in a case where the phase difference amount density D P is less than the threshold value.
- a plurality of spheres belonging to a plurality of different culture lots are used as an object to be determined.
- the spheres to be determined are all spheres of iPS cells cultured by the three-dimensional culture method.
- the sphere as the sample 14 is set on the sample stage of the imaging system 1 shown in Fig. 1 , and holograms of the plurality of spheres are imaged by the CMOS camera 19.
- a computer numerical calculation is performed on the acquired hologram of each sphere to acquire the phase difference image sliced near the center of the sphere.
- the phase difference amount density Dp shown by Formula 4 is derived for each culture lot.
- the procedure for measuring the survival rate is as follows.
- a sphere accommodated in a centrifuge tube is subjected to a centrifugal separation treatment of 400G (G: gravity acceleration) for 3 minutes.
- the sphere settled to the bottom of the centrifuge tube is collected and decomposed into single cells using TrypLE (registered trademark) Select, which is a cell dissociation enzyme.
- TrypLE registered trademark
- Select which is a cell dissociation enzyme.
- the number of stained dead cells is counted by counting the cells using a commercially available general cell counter (Countess (registered trademark)).
- the survival rate of cells is derived for each culture lot from the count of dead cells.
- Correlation properties between the survival rate of cells and the phase difference amount density D P are acquired by forming a plot for each culture lot on a graph in which the survival rate of cells is taken on the lateral axis and the phase difference amount density D P is taken on the vertical axis.
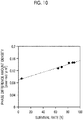
- Fig. 10 is a graph showing the correlation properties between the survival rate of cells and the phase difference amount density D P (lot average value). As shown in Fig. 10 , it is confirmed that the survival rate of cells and the phase difference amount density D P have a proportional relationship.
- the survival rate of cells can be estimated from the phase difference amount density D P .
- the survival rate of the cells can be grasped without performing a treatment involving destruction of the cells such as a centrifugal separation treatment and a staining treatment (that is, in a non-destructive manner).
- a correlation line showing the correlation between the survival rate of the cells and the phase difference amount density D P is acquired in advance, and the survival rate of the cells in the culture lot can be estimated from the average value of the phase difference amount density D P acquired for the sphere belonging to the culture lot to be determined and the correlation line.
- the case where the survival rate of cells in the culture lot is estimated from the phase difference amount density D P is exemplified, but it is also possible to estimate the survival rate of the cells within a single sphere from the phase difference amount density D P .
- the correlation line showing the correlation between the survival rate of the cells and the phase difference amount density D P is acquired in advance, and the survival rate of the cells in the sphere can be estimated from the phase difference amount density D P acquired for the sphere to be determined and the correlation line.
- a cell colony In order to induce necrosis in the iPS cells cultured by the two-dimensional culture method (adhesive culture method), 3 wt% of H 2 O 2 (hydrogen peroxide) is added to a cell colony, and then staining treatment with SYTOX (registered trademark) Green as a fluorescent coloring agent is performed. Subsequently, the colony subjected to the above-described processing is set on the sample stage of the imaging system 1 shown in Fig. 1 , and a hologram of the colony is imaged by the CMOS camera 19. A computer numerical calculation is performed on the acquired hologram to acquire the phase difference image of the colony. In parallel with the hologram imaging, a fluorescence microscope image is imaged by the CMOS camera 36.
- H 2 O 2 hydrogen peroxide
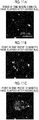
- Figs. 11A, 11B, and 11C are fluorescence microscope images of colonies at a point in time where 0 minute, 15 minutes, and 37 minutes have elapsed after adding H 2 O 2 , respectively.
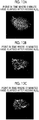
- Figs. 12A, 12B, and 12C are phase difference images of colonies at a point in time where 0 minute, 15 minutes, and 37 minutes have elapsed after adding H 2 O 2 , respectively.
- the number of light emission sites increased with the lapse of time from the time at which H 2 O 2 is added. This means that the dead cells increase (in other words, the survival rate of cells decreases) with the lapse of time from the time at which H 2 O 2 is added.
- the area of the low luminance region in the phase difference image increases with the lapse of time from the time at which H 2 O 2 is added. This means that the total phase difference amount ⁇ A in the phase difference image decreases as the survival rate of cells decreases. As described above, it is confirmed that the survival rate of cells affects the total phase difference amount ⁇ A .
- Necrosis is induced by adding H 2 O 2 to the colonies of iPS cells cultured by the two-dimensional culture method (adhesive culture method).
- another iPS cell colony is induced to undergo apoptosis using Apoptosis Inducer Set from PromoKine.
- the apoptosis is an active cell death that is managed and regulated as a growth control mechanism in cells of multicellular organisms.
- the necrosis is passive cell death caused by external environmental factors such as nutritional deficiency, toxic substances, and trauma, and the process leading to cell death is different from apoptosis.
- the colony subjected to the above-described processing and healthy colony are set on the sample stage of the imaging system 1 shown in Fig. 1 , and a hologram of each colony is imaged by the CMOS camera 19. A computer numerical calculation is performed on the acquired hologram to acquire the phase difference image of each colony. For the phase difference image of each colony, the total phase difference amount ⁇ A shown by Formula 3 is derived.
- Fig. 13 is a graph showing a relative value of the total phase difference amount ⁇ A of each of a colony (dead cell) induced by necrosis, a colony (dead cell) induced by apoptosis, and a healthy colony (live cell).
- the total phase difference amount ⁇ A of the healthy colony (live cell) is set to 1.
- a significant difference is observed in the total phase difference amount ⁇ A between the healthy colony (live cell) and the colony (dead cell) induced by necrosis and the colony (dead cell) induced by apoptosis.
- the p value (significance probability), which is an index showing the reliability of the significant difference, is less than 0.05.
- the total phase difference amount ⁇ A can be used for determining whether the cells are live or dead. For example, in a case where the total phase difference amount ⁇ A acquired for the sphere to be determined is equal to or more than a threshold value, it can be determined that the sphere includes more live cells, and in a case where the total phase difference amount ⁇ A acquired for the sphere to be determined is less than the threshold value, it can be determined that the sphere includes more dead cells. It is also possible to use the phase difference amount density D P instead of the total phase difference amount ⁇ A to determine whether the cell is live or dead.
- a sphere of iPS cells maintained in the undifferentiated state and a sphere of iPS cells deviated from the undifferentiated state are set on the sample stage of the imaging system 1 shown in Fig. 1 , and the hologram of each sphere is imaged by the CMOS camera 19.
- a computer numerical calculation is performed on the acquired hologram of each sphere to acquire the phase difference image sliced near the center of the sphere.
- the total phase difference amount ⁇ A shown by Formula 3 is derived.
- the sphere deviated from the undifferentiated state is induced to the undifferentiated deviation state by using a basal medium to which components necessary for maintaining the undifferentiated state are not added.
- Fig. 14 is a graph showing an average value of the total phase difference amount ⁇ A of each of the spheres maintained in the undifferentiated state and the sphere deviated from the undifferentiated state. As shown in Fig. 14 , a significant difference is found in the total phase difference amount ⁇ A between the sphere that maintained the undifferentiated state and the sphere that deviated from the undifferentiated state.
- the total phase difference amount ⁇ A can be used for determining whether an undifferentiated state of a stem cell is maintained or deviated from the undifferentiated state. For example, in the case where the total phase difference amount ⁇ A acquired for the sphere to be determined is equal to or more than a threshold value, it can be determined that the sphere maintains the undifferentiated state, and in the case where the total phase difference amount ⁇ A acquired for the sphere to be determined is less than the threshold value, it can be determined that the sphere deviates from the undifferentiated state. It is also possible to use the phase difference amount density D P instead of the total phase difference amount ⁇ A for determining whether the undifferentiated state is maintained or deviated.
- the state of the sphere is determined on the basis of the phase difference image generated from the hologram of the sphere and the shape index value corresponding to the shape of the sphere, and thus the state of the sphere can be determined in a non-destructive and simple manner.
- the determination method of the embodiment of the disclosed technology it is possible to determine the density, the survival rate, or the like of cells inside the sphere that cannot be grasped by the conventional optical microscope.
- imaging of hologram, an image analysis, statistical processing, and the like performed in this determination method can be easily automated by a computer, and labor and processing time can be reduced as compared with conventional methods. Further, it is possible to obtain a stable determination result without affecting the variation of techniques by operators. Further, it is possible to determine the state of the sphere non-destructively without performing a treatment involving cell destruction such as decomposing the sphere into single cells or adding a fluorescent coloring agent. Additionally, the hologram imaging can be easily performed even for spheres randomly present in a three-dimensional space, and the state of the sphere during culture by the three-dimensional culture method can be determined on the spot.
- phase difference image sliced near the center of the spherical sphere By using one phase difference image sliced near the center of the spherical sphere, it is possible to simplify the processing required for determination, as compared with the case of using a plurality of phase difference images having different slice positions.
- a determination method includes generating a phase difference image of a sphere that is an aggregate of a plurality of cells from a hologram obtained by imaging the sphere; and determining a state of the sphere on the basis of the phase difference image and a shape index value corresponding to a shape of the sphere.
- a determination regarding at least one of a survival rate, a density, a homogeneity, or an undifferentiated state deviation of the plurality of cells included in the sphere, or an outer shape of the sphere may be performed on the basis of the phase difference image and the shape index value.
- a total phase difference amount that is a value obtained by integrating a phase difference amount of each of a plurality of pixels constituting the phase difference image may be derived; and the state of the sphere may be determined using a correlation between the total phase difference amount and the shape index value.
- a reference correlation trend line indicating a reference for the correlation between the total phase difference amount and the shape index value may be compared with a correlation between a total phase difference amount and a shape index value for a sphere to be determined; and the state of the sphere to be determined may be determined according to a degree of deviation of the correlation between the total phase difference amount and the shape index value for the sphere to be determined from the reference correlation trend line.
- a width of the deviation of the correlation between the total phase difference amount and the shape index value for the sphere to be determined from the reference correlation trend line exceeds a threshold value, it may be determined that there is an abnormality in at least one of a survival rate, a density, or a homogeneity of cells included in the sphere to be determined, or an outer shape of the sphere.
- a reference correlation trend line indicating a reference for the correlation between the total phase difference amount and the shape index value may be compared with a correlation between a total phase difference amount and a shape index value for each of a plurality of spheres belonging to a culture lot to be determined; and a quality of the culture lot to be determined may be determined according to at least one of a state of deviation or a degree of deviation of the correlation between the total phase difference amount and the shape index value for the culture lot to be determined from the reference correlation trend line.
- the shape index value may be any one of a volume, a cross-sectional area, a particle diameter, or a circumferential length of the sphere.
- a phase difference amount density may be derived by dividing a total phase difference amount that is a value obtained by integrating a phase difference amount of each of a plurality of pixels constituting the phase difference image by a volume of the sphere; and the state of the sphere may be determined on the basis of the phase difference amount density.
- phase difference amount density By using the phase difference amount density to determine the state of the sphere, it is possible to make an accurate determination of the state of the sphere.
- the phase difference image used for the determination of the state of the sphere is a phase difference image in which variation in a phase difference amount between a plurality of pixels constituting the phase difference image is the maximum among a plurality of phase difference images that can be generated from the hologram.
- phase difference image used to determine the state of the sphere
- more accurate information matching the actual condition of the sphere can be obtained from the phase difference image, and the accuracy of the state determination of the sphere can be further improved.
Landscapes
- Engineering & Computer Science (AREA)
- Chemical & Material Sciences (AREA)
- Physics & Mathematics (AREA)
- Health & Medical Sciences (AREA)
- Life Sciences & Earth Sciences (AREA)
- General Physics & Mathematics (AREA)
- General Health & Medical Sciences (AREA)
- Biochemistry (AREA)
- Analytical Chemistry (AREA)
- Immunology (AREA)
- Organic Chemistry (AREA)
- Wood Science & Technology (AREA)
- Zoology (AREA)
- Pathology (AREA)
- Theoretical Computer Science (AREA)
- Computer Vision & Pattern Recognition (AREA)
- Bioinformatics & Cheminformatics (AREA)
- Proteomics, Peptides & Aminoacids (AREA)
- Nuclear Medicine, Radiotherapy & Molecular Imaging (AREA)
- Radiology & Medical Imaging (AREA)
- Quality & Reliability (AREA)
- Medical Informatics (AREA)
- Genetics & Genomics (AREA)
- General Engineering & Computer Science (AREA)
- Dispersion Chemistry (AREA)
- Microbiology (AREA)
- Biotechnology (AREA)
- Geometry (AREA)
- Biophysics (AREA)
- Molecular Biology (AREA)
- Sustainable Development (AREA)
- Biomedical Technology (AREA)
- Signal Processing (AREA)
- Investigating Or Analysing Materials By Optical Means (AREA)
- Apparatus Associated With Microorganisms And Enzymes (AREA)
- Holo Graphy (AREA)
- Measuring Or Testing Involving Enzymes Or Micro-Organisms (AREA)
Abstract
Description
- The disclosed technology relates to a determination method for determining a state of a sphere that is an aggregate of a plurality of cells.
- As a technique for evaluating or determining a state of a cell, for example, the following techniques are known.
JP2016-005437A -
JP2017-000163A -
JP2015-146747A - As a culture method capable of mass production of cells, a three-dimensional culture method is known in which a sphere that is an aggregate of cells are cultured in a suspended state in a medium. In the production process of cells by the three-dimensional culture, a technique for non-destructively and simply evaluating the quality of cells in the state of spheres is required from the viewpoint of easy process control. However, at the present time, a method for evaluating spheres having various sizes randomly present in a three-dimensional space has not been established, and in particular, it is difficult to directly observe a density and survival situation of cells inside the sphere. For this reason, evaluation is performed by applying a conventional two-dimensional culture method, but as the number of cells to be cultured increases, the number of evaluation steps increases, and thus much manpower and much time are required. In the evaluation to which the conventional two-dimensional culture method is applied, a treatment involving cell destruction such as decomposing the sphere into a single cell or adding a fluorescent coloring agent is required.
- An object of the disclosed technology is to determine a state of a sphere that is an aggregate of a plurality of cells, in a non-destructive and simple manner.
- A determination method according to the disclosed technology includes generating a phase difference image of a sphere that is an aggregate of a plurality of cells from a hologram obtained by imaging the sphere; and determining a state of the sphere on the basis of the phase difference image and a shape index value corresponding to a shape of the sphere.
- In the determination method according to the disclosed technology, it is possible to determine the state of the sphere in a non-destructive and simple manner.
- In the determination method according to the disclosed technology, a determination regarding at least one of a survival rate, a density, a homogeneity, or an undifferentiated state deviation of the plurality of cells included in the sphere, or an outer shape of the sphere may be performed on the basis of the phase difference image and the shape index value.
- In the determination method according to the disclosed technology, a total phase difference amount that is a value obtained by integrating a phase difference amount of each of a plurality of pixels constituting the phase difference image may be derived; and the state of the sphere may be determined using a correlation between the total phase difference amount and the shape index value.
- In the determination method according to the disclosed technology, a reference correlation trend line indicating a reference for the correlation between the total phase difference amount and the shape index value may be compared with a correlation between a total phase difference amount and a shape index value for a sphere to be determined; and the state of the sphere to be determined may be determined according to a degree of deviation of the correlation between the total phase difference amount and the shape index value for the sphere to be determined from the reference correlation trend line. For example, in a case where a width of the deviation of the correlation between the total phase difference amount and the shape index value for the sphere to be determined from the reference correlation trend line exceeds a threshold value, it may be determined that there is an abnormality in at least one of a survival rate, a density, or a homogeneity of cells included in the sphere to be determined, or an outer shape of the sphere.
- In the determination method according to the disclosed technology, a reference correlation trend line indicating a reference for the correlation between the total phase difference amount and the shape index value may be compared with a correlation between a total phase difference amount and a shape index value for each of a plurality of spheres belonging to a culture lot to be determined; and a quality of the culture lot to be determined may be determined according to at least one of a state of deviation or a degree of deviation of the correlation between the total phase difference amount and the shape index value for the culture lot to be determined from the reference correlation trend line.
- In the determination method according to the disclosed technology, the shape index value may be any one of a volume, a cross-sectional area, a particle diameter, or a circumferential length of the sphere.
- In the determination method according to the disclosed technology, a phase difference amount density may be derived by dividing a total phase difference amount by a volume of the sphere, the a total phase difference amount is a value obtained by integrating a phase difference amount of each of a plurality of pixels constituting the phase difference image; and the state of the sphere may be determined on the basis of the phase difference amount density.
- In the determination method according to the disclosed technology, it is preferable that the phase difference image used for the determination of the state of the sphere is a phase difference image in which variation in a phase difference amount between a plurality of pixels constituting the phase difference image is the maximum among a plurality of phase difference images that are generable from the hologram.
- According to the disclosed technology, a state of a sphere that is an aggregate of a plurality of cells can be determined in a non-destructive and simple manner.
-
-
Fig. 1 is a diagram showing an example of a configuration of an imaging system used for performing a determination method according to an embodiment of the disclosed technology. -
Fig. 2A is a diagram showing an example of a hologram used for performing a determination method according to an embodiment of the disclosed technology. -
Fig. 2B is a diagram showing an example of a Fourier transform image of a sphere. -
Fig. 2C is a diagram showing an example of a phase difference image of a sphere before unwrapping. -
Fig. 2D is a diagram showing an example of a phase difference image of a sphere after unwrapping. -
Fig. 3 is a diagram showing the concept of a phase difference image according to an embodiment of the disclosed technology. -
Fig. 4 is an explanatory diagram related to focusing of a phase difference image according to an embodiment of the disclosed technology. -
Fig. 5 is an example of a hardware configuration of a computer that performs autofocus processing according to an embodiment of the disclosed technology. -
Fig. 6 is a flowchart showing an example of a flow of an autofocus processing according to an embodiment of the disclosed technology. -
Fig. 7 is a graph showing an example of a relationship between a focal position and variation in a phase difference amount in a phase difference image of a sphere according to an embodiment of the disclosed technology. -
Fig. 8 is a graph showing an example of correlation properties between a volume of a sphere and a total phase difference amount according to an embodiment of the disclosed technology. -
Fig. 9A is a histogram of a particle diameter of a sphere derived for each of a good lot and a bad lot according to an embodiment of the disclosed technology. -
Fig. 9B is a graph showing an example of correlation properties between a volume of a sphere and a total phase difference amount acquired for each of a good lot and a bad lot according to the embodiment of the disclosed technology. -
Fig. 9C is a histogram of phase difference amount densities acquired for each of a good lot and a bad lot according to an embodiment of the disclosed technology. -
Fig. 10 is a graph showing an example of correlation properties between a survival rate of cells and a phase difference amount density according to an embodiment of the disclosed technology. -
Fig. 11A is a fluorescence microscope image of a colony at a point in time where 0 minute has elapsed after H2O2 is added. -
Fig. 11B is a fluorescence microscope image of a colony at a point in time where 15 minutes have elapsed after H2O2 is added. -
Fig. 11C is a fluorescence microscope image of a colony at a point in time where 37 minutes have elapsed after H2O2 is added. -
Fig. 12A is a phase difference image of a colony at a point in time where 0 minute has elapsed after H2O2 is added. -
Fig. 12B is a phase difference image of a colony at a point in time where 15 minutes have elapsed after H2O2 is added. -
Fig. 12C is a phase difference image of a colony at a point in time where 37 minutes have elapsed after H2O2 is added. -
Fig. 13 is a graph showing a relative value of a total phase difference amount of each of a colony induced by necrosis, a colony induced by apoptosis, and a healthy colony according to an embodiment of the disclosed technology. -
Fig. 14 is a graph showing an average value of a total phase difference amount of each of a sphere maintained in the undifferentiated state and a sphere deviated from the undifferentiated state according to the embodiment of the disclosed technology. - Hereinafter, embodiments of the present invention will be described with reference to the drawings. In the drawings, substantially the same or equivalent components or portions are denoted by the same reference numerals.
- A determination method according to the embodiments of the disclosed technology includes generating a phase difference image of a sphere that is an aggregate of a plurality of cells from a hologram obtained by imaging the sphere, and determining a state of the sphere on the basis of the phase difference image and a shape index value corresponding to a shape of the sphere.
-
Fig. 1 is a diagram showing an example of a configuration of animaging system 1 used for performing a determination method according to an embodiment of the disclosed technology. Theimaging system 1 is configured to include a hologramoptical system 10 for acquiring a hologram of a sphere using a known digital holography technique, and a fluorescence microscopeoptical system 30 for performing fluorescence microscope observation of the sphere. - The digital holography technique is a technique in which an image generated by interference between object light transmitted through or reflected by an object and reference light coherent with the object light is imaged using an image sensor, and numerical calculation based on light propagation is performed on the image obtained by the imaging, thereby restoring a wavefront of a light wave from the object. According to the digital holography technique, it is possible to quantify a phase distribution of the object and acquire three-dimensional information of the object without mechanically moving a focal position.
- The hologram
optical system 10 is configured to include alaser light source 11,beam splitters collimating lenses objective lens 15, an imaging lens 17, and a complementary metal oxide semiconductor (CMOS)camera 19. A sphere as asample 14 set on a sample stage is disposed between the collimatinglens 13 and theobjective lens 15. - As the
laser light source 11, for example, a HeNe laser having a wavelength of 632.8 nm can be used. Laser light emitted from thelaser light source 11 is split into two laser lights by thebeam splitter 12. One of the two laser lights is object light and the other is reference light. The object light is collimated by the collimatinglens 13, and then irradiated onto a sphere as thesample 14 set on the sample stage. An image formed by the object light transmitted through the sphere is magnified by theobjective lens 15. The object light transmitted through theobjective lens 15 is collimated again by the imaging lens 17, and then is formed on an imaging surface of aCMOS camera 19 via thebeam splitter 18. On the other hand, the reference light is guided to the front of the collimatinglens 21 by theoptical fiber 20. The reference light emitted from theoptical fiber 20 is collimated by the collimatinglens 21 and is incident on the imaging surface of theCMOS camera 19 via thebeam splitter 18. The hologram generated by the interference between the object light and the reference light is recorded by theCMOS camera 19. An off-axial optical system in which optical axis directions of the object light and the reference light incident on the imaging surface of theCMOS camera 19 are different from each other may be configured. - On the other hand, the fluorescence microscope
optical system 30 includes anexcitation light source 31, anexcitation filter 32, an ON/OFF switching mirror 33, adichroic mirror 34, anobjective lens 15, aspectral filter 35, and aCMOS camera 36. - A mercury lamp, for example, can be used as the
excitation light source 31. Theexcitation filter 32 transmits light in a wavelength range of, for example, 450 nm to 490 nm among excitation lights emitted from theexcitation light source 31. The excitation light transmitted through theexcitation filter 32 is irradiated onto the sphere that is thesample 14 set on the sample stage, via the ON/OFF switching mirror 33, thedichroic mirror 34, and theobjective lens 15. In a case where a fluorescent coloring agent added to the sphere is irradiated with excitation light, fluorescence emitted from the fluorescent coloring agent is incident on the imaging surface of theCMOS camera 36 via theobjective lens 15, thedichroic mirror 34, the ON/OFF switching mirror 33, and thespectral filter 35. Thespectral filter 35 transmits, for example, light in a wavelength range of 515 nm or more among the fluorescence emitted from the fluorescent coloring agent. - According to the
imaging system 1 according to the present embodiment, it is possible to perform hologram observation by the hologramoptical system 10 and fluorescence microscopic observation by the fluorescence microscopeoptical system 30 in parallel. The configuration of the above-describedimaging system 1 is merely an example, and the present invention is not limited to the above-described configuration. Any imaging system capable of acquiring a hologram using digital hologram technology can be used to perform the determination method according to the disclosed technology. - Hereinafter, an example of a method of acquiring a phase difference image of a sphere from a hologram of the sphere acquired by using the
imaging system 1 will be described. - First, the hologram exemplified in
Fig. 2A acquired by theCMOS camera 19 is subjected to a two-dimensional Fourier transform to extract a complex amplitude component of only the object light.Fig. 2B is an example of a Fourier transform image of the sphere obtained by this processing. - Next, for example, the angular spectrum method is applied to restore the image showing the phase of the sphere at an arbitrary spatial position.
Fig. 2C is an example of a phase difference image before unwrapping of the sphere obtained by this processing. The phase of the sphere at this point is convolved with a value of 0 to 2π. Therefore, for example, by applying a phase connection (unwrapping) method such as unweighted least squares or Flynn' s algorithm to join portions of 2 π or more, a final phase difference image of the sphere as exemplified inFig. 2D can be obtained. Many unwrapping methods have been proposed, and an appropriate method that does not cause phase mismatch may be appropriately selected. -
Fig. 3 is a diagram showing the concept of a phase difference image IP. In the lower part ofFig. 3 , a phase difference amount at each pixel k of the phase difference image Ip is three-dimensionally displayed. In the upper part ofFig. 3 , the phase difference amount at each pixel k of the phase difference image Ip is shown on a plane in gray scale. - Here, a phase difference amount θ in the phase difference image IP is represented by
Formula 1 in a case where θB is a phase of a background (region where the sphere does not exist) existing in the same focal plane of the phase difference image IP, and θS is a phase of a region where the sphere exists. In addition, the term "phase" in the present specification is a phase of an electric field amplitude in a case where light is regarded as an electromagnetic wave, and is used in a more general sense.
- In addition, a phase difference amount θk at each pixel k of the phase difference image IP can be represented by
Formula 2. Here, nk is refractive index of the sphere at the portion corresponding to each pixel k of the phase difference image IP, dk is a thickness of the sphere at the portion corresponding to each pixel k of the phase difference image Ip, and λ is a wavelength of the object light in the hologramoptical system 10.
- The phase difference image of the sphere is an image showing an optical path length distribution of the object light transmitted through the sphere. Since the optical path length in the sphere corresponds to the product of the refractive index of the sphere and the thickness of the sphere, the phase difference image of the sphere includes information on the refractive index and the thickness (shape) of the sphere, as also shown in
Formula 2. - Accurate information matching the actual condition of the sphere cannot be obtained from the phase difference image that is out of focus with respect to the sphere by the influence of the spread due to diffraction. Therefore, it is preferable to focus on the sphere in a case of acquiring the phase difference image from the hologram acquired by the
CMOS camera 19. Here, "focusing on a sphere" means obtaining a phase difference image sliced near a center of a spherical sphere. A more accurate determination result can be obtained by determining the state of the sphere using the phase difference image focused on the sphere. A user may determine the state of the sphere on the basis of the acquired phase difference image of the sphere. Alternatively, a computer that has learned a determination condition may determine the state of the sphere on the basis of the acquired phase difference image of the sphere. - It is preferable to automate the focusing of the phase difference image without manual operation. By automating the focusing, it is possible to eliminate the arbitrariness by an operator and further shorten the processing time. The inventors have found an automatable focusing technique described below.
- The graph on the left side of
Fig. 4 is a graph showing an example of a relationship between the position of the sphere in the plane direction and the phase difference amount in the phase difference image, in which a solid line corresponds to a state in which the sphere is in focus and a dotted line corresponds to a state in which the sphere is out of focus. In a case where the sphere is in focus, a steep peak appears at a specific position in the phase difference image. On the other hand, in a case where the sphere is out of focus, the peak is lower and smoother than the case where the sphere is in focus. - The graph on the right side of
Fig. 4 is an example of a histogram of the phase difference amount in the phase difference image of the sphere, in which a solid line corresponds to a state in which the sphere is in focus and a dotted line corresponds to a state in which the sphere is out of focus. In the case where the sphere is in focus, a width w of a curve (variation in the phase difference amount) is relatively large, and in the case where the sphere is out of focus, the width w of the curve (variation in the phase difference amount) is relatively small. - Therefore, focusing can be realized by acquiring phase difference image of the sphere for each of different focal positions (slice positions), obtaining the width w of the curve in the histogram of the phase difference amount (variation in the phase difference amount) for each of the acquired phase difference image, and extracting the phase difference image having the maximum width w among the obtained widths w as the phase difference image focused on the sphere.
- The above-described focusing can be automated using a computer.
Fig. 5 is an example of a hardware configuration of acomputer 500 that performs an autofocus processing for automatically performing the above-described focusing. - The
computer 500 includes a central processing unit (CPU) 501, amain memory 502 as a temporary storage region, a nonvolatileauxiliary storage device 503, a communication interface (I/F) 504 for communicating with theCMOS camera 19, and adisplay unit 505 such as a liquid crystal display. TheCPU 501, themain memory 502, theauxiliary storage device 503, the communication I/F 504, and thedisplay unit 505 are each connected to abus 507. Theauxiliary storage device 503 houses anautofocus program 506 which describes the procedure of the above-described autofocus processing. In thecomputer 500, theCPU 501 executes theautofocus program 506 to perform the autofocus processing. -
Fig. 6 is a flowchart showing an example of a flow of the autofocus processing performed by thecomputer 500. - In step S1, the
CPU 501 acquires a hologram of the sphere from theCMOS camera 19. - In step S2, the
CPU 501 generates a plurality of phase difference images having different focal positions (slice positions) from the acquired hologram. - In step S3, the
CPU 501 derives the variation in the phase difference amount for each phase difference image for each focal position (slice position). TheCPU 501 may derive, for example, a difference between the maximum value and the minimum value of the phase difference amount in the phase difference image as the variation of the phase difference amount in the phase difference image. - In step S4, the
CPU 501 extracts a phase difference image having the largest variation in the phase difference amount derived in step S3 as the phase difference image focused on the sphere among the plurality of phase difference images having different focal positions (slice positions). -
Fig. 7 is a graph showing an example of the relationship between the focal position (slice position) and the variation in the phase difference amount in the phase difference image of the sphere.Fig. 7 exemplifies phase difference images and graphs of spheres corresponding to focal positions of -400 µm, -200 µm, 0 µm, +200 µm, and +400 µm. InFig. 7 , a focal position in which the variation in the phase difference amount is the maximum is set to 0 µm. According to the above-described autofocus processing, the phase difference image corresponding to thefocal position 0 µm in which the variation in the phase difference amount is the maximum is extracted as the focused phase difference image. In the phase difference image corresponding to thefocal position 0 µm in which the variation of the phase difference amount is maximum, a contour of the sphere becomes the clearest. - The determination method according to an embodiment of the disclosed technology includes determining the state of the sphere on the basis of a phase difference image of the sphere and a shape index value of the sphere. That is, the state of the sphere is determined by analyzing the phase difference image of the sphere in association with the shape index value of the sphere. The state of the sphere to be determined includes, for example, a survival rate, a density, a homogeneity, or an undifferentiated state deviation of a plurality of cells included in the sphere, or an outer shape of the sphere.
- As the shape index value of the sphere, for example, a volume of the sphere, a cross-sectional area, a particle diameter, a circumferential length, or the like can be used. The particle diameter and circumferential length of the sphere can be obtained directly from the image of the sphere in the phase difference image focused on the sphere (that is, the phase difference image sliced near the center of the sphere). The cross-sectional area of the sphere can be derived, for example, as a cross-sectional area of a circle whose diameter is the particle diameter of the sphere. The volume of the sphere can be derived as, for example, the volume of a sphere having a diameter of the particle diameter of the sphere.
- The determination method according to the embodiment of the disclosed technology may include deriving a total phase difference amount θA that is a value obtained by integrating a phase difference amount of each of a plurality of pixels constituting the phase difference image, and determining the state of the sphere using a correlation between the total phase difference amount θA and the shape index value.
- The total phase difference amount θA is represented by
Formula 3. However, s is the area of each pixel k of the phase difference image, and Vk is the volume of the sphere in the portion corresponding to each pixel k of the phase difference image. As shown inFormula 3, the total phase difference amount θA corresponds to a value obtained by integrating the phase difference amount θk for each pixel of the phase difference image of the sphere for all pixels k. InFormula 3, dk shows a thickness of the sphere portion projected on the pixel k, and nk represents a difference in refractive index between a background culture solution and the inside of the sphere. - In
Formula 3, Vk = dk · s is used. - Here, according to
Formula 3, the unit of the total phase difference amount θA is the scale of the area, for example, [µm2], but in a case where a comparison is not performed between the image sensors, the unit of the total phase difference amount θA may be simply set to [pixel] as the sum of the phase difference amount θk for each pixel per 1 pixel, that is, s = 1 [pixel].
- The determination method according to the embodiment of the disclosed technology may include comparing a reference correlation trend line indicating a reference for the correlation between the total phase difference amount θA and the shape index value of the sphere with a correlation between the total phase difference amount θA and the shape index value for a sphere to be determined, and determining the state of the sphere to be determined according to a degree of deviation of the correlation for the sphere to be determined from the reference correlation trend line. In this case, in a case where a width of the deviation of the correlation for the sphere to be determined from the reference correlation trend line exceeds a threshold value, it may be determined that there is an abnormality in at least one of a survival rate, a density, or a homogeneity of cells included in the sphere to be determined, or an outer shape of the sphere.
- For example, the state of the sphere to be determined may be determined according to the degree of deviation from the reference correlation trend line of a plot of the sphere to be determined which is plotted on a graph in which the total phase difference amount θA is taken on one axis and the shape index value is taken on the other axis. In this case, in a case where a width of a deviation of the above-described plot from the reference correlation trend line exceeds a threshold value, it may be determined that there is an abnormality in at least one of a survival rate, a density, or a homogeneity of cells included in the sphere to be determined, or an outer shape of the sphere.
- The determination method according to the embodiment of the disclosed technology can include comparing the reference correlation trend line with the correlation between the total phase difference amount θA and the shape index value for each of the plurality of spheres belonging to a culture lot to be determined, and determining a quality of the culture lot to be determined according to at least one of the state of deviation or the degree of deviation of the correlation for the culture lot to be determined from the reference correlation trend line.
- For example, the quality of the culture lot may be determined according to at least one of the state of deviation or the degree of deviation from the reference correlation trend line of the plot for each of the plurality of spheres belonging to the culture lot to be determined which is plotted on a graph in which the total phase difference amount θA is taken on one axis and the shape index value is taken on the other axis.
- For example, it is possible to use, as the reference correlation trend line, a correlation line between the total phase difference amount θA and the shape index value of the sphere, which is acquired in advance for a healthy sphere (standard sample). In addition, a regression line derived from each plot of the sphere to be determined using, for example, the least squares method may be used as the reference correlation trend line.
- The determination method according to the embodiment of the disclosed technology may include deriving a phase difference amount density DP by dividing the total phase difference amount θA by the volume of the sphere, and determining the state of the sphere on the basis of the derived phase difference amount density DP.
- The phase difference amount density DP is represented by
Formula 4. However, V is the volume of the sphere. As shown inFormula 4, the phase difference amount density DP corresponds to a value obtained by dividing the total phase difference amount θA by a volume V of the sphere. Healthy cells are considered to maintain a constant internal refractive index different from the refractive index of the medium due to their homeostasis. On the other hand, it is considered that dead cells lose homeostasis and the internal refractive index becomes almost the same as that of the medium. Therefore, it is considered possible to use the phase difference amount density DP as an index indicating the state of cells. For example, it can be determined that the state of the sphere is good in a case where the phase difference amount density DP acquired for the sphere to be determined is equal to or more than a threshold value, and it can be determined that the state of the sphere is abnormal in a case where the phase difference amount density DP is less than the threshold value. Since 2π / λ can be treated as a constant, the multiplication of 2π / λ may be omitted in a case of deriving the phase difference amount density DP. Here, in a case where the volume average refractive index difference Nave of the sphere is Nave = ∑ nk · (vk / V), since theFormula 4 is DP = (2 π / λ) × Nave, the phase difference density is a value obtained by normalizing the volume-averaged difference in refractive index of sphere by the length of wavelength. In the present specification, V is obtained by calculating a sphere equivalent diameter from the cross-sectional image of the phase image of the sphere. A more accurate ellipsoidal sphere is also possible.
- An example of the determination method according to the disclosed technology will be described below.
- A sphere of an induced pluripotent stem (iPS) cell cultured by the three-dimensional culture method is set on the sample stage of the
imaging system 1 shown inFig. 1 , and holograms of the plurality of spheres are captured by theCMOS camera 19. A computer numerical calculation is performed on the acquired hologram of each sphere to acquire the phase difference image sliced near the center of the sphere. - From the obtained phase difference image of each sphere, the volume is derived as the shape index value of each sphere. Further, for the phase difference image of each sphere, the total phase difference amount θA shown by
Formula 3 is derived. Correlation properties between the volume of the sphere and the total phase difference amount θA are acquired by forming a plot for each sphere on a graph in which the volume of the sphere is taken on the lateral axis and the total phase difference amount θA is taken on the vertical axis.Fig. 8 is a graph showing the correlation properties between the volume of the sphere and the total phase difference amount θA. As shown inFig. 8 , it is confirmed that the total phase difference amount θA and the volume of the sphere have a proportional relationship.Fig. 8 shows a reference correlation trend line Ls and a plot showing a reference for correlation between the volume of the sphere and the total phase difference amount θA. A regression line derived from each plot shown inFig. 8 is applied as the reference correlation trend line LS. -
Fig. 8 shows phase difference images of spheres corresponding to plots a1 and a2 existing on the reference correlation trend line LS, and phase difference images of spheres corresponding to plots a3, a4, and a5 existing at a position deviated from the reference correlation trend line LS. For the spheres corresponding to the plots a1 and a2 existing on the reference correlation trend line LS, a phase difference image having uniform luminance over the entire sphere is obtained. This indicates that the plurality of cells constituting the sphere are homogeneous, the density of the cells in the sphere is uniform, and the like. On the other hand, for the spheres corresponding to the plots a3 and a4 existing at the positions deviated from the reference correlation trend line LS, a phase difference image in which the luminance of the central portion is lower than that of other portions is obtained. This indicates that the plurality of cells constituting the sphere are an inhomogeneity, the density of the cells in the sphere is non-uniform, and the like. In addition, for the sphere corresponding to the plot a5 existing at the position deviated from the reference correlation trend line LS, a phase difference image in which the unevenness of a contour line of the sphere is remarkable is obtained. This indicates that an abnormality occurs in the cells constituting the sphere. - From the above results, it can be said that the state of the sphere can be determined by using a correlation between the total phase difference amount θA and the volume, which is an example of the shape index value of the sphere. In addition, it can be said that the reference correlation trend line LS indicating the correlation between the total phase difference amount θA and the volume of the sphere can be compared with a correlation between the total phase difference amount θA and the shape index value for a sphere to be determined, and the state of the sphere can be determined according to a degree of deviation of the correlation for the sphere to be determined from the reference correlation trend line LS. Specifically, it can be said that the state of each sphere can be determined according to the degree of deviation from the reference correlation trend line LS of the plot of the sphere to be determined which is plotted on the graph in which the volume of the sphere is taken on one axis and the total phase difference amount θA is taken on the other axis. Therefore, for example, for spheres in which a minus width of the total phase difference amount θA from the reference correlation trend line LS is equal to or more than a threshold value, it can be determined that there is an abnormality in at least one of the density or homogeneity of the plurality of cells included in the sphere, or an outer shape of the sphere.
- Although the volume of the sphere is used as the shape index value of the sphere in this example, it is also possible to use the cross-sectional area, particle diameter, or circumferential length of the sphere instead of this. Even in a case where any of these shape index values is used, it is possible to determine the state of the sphere by using the correlation with the total phase difference amount θA.
- In this example, a culture lot including a plurality of spheres is used as an object to be determined. The culture lot to be determined are a good lot and a bad lot shown in Table 1 below. The sphere belonging to the good lot and the sphere belonging to the bad lot are spheres of iPS cells cultured by the three-dimensional culture method, respectively. A proliferation rate of cells from the first day to the fifth day of a culture period is 20 times in the sphere belonging to the good lot and 3.7 times in the sphere belonging to the bad lot. The survival rate of cells on the fifth day of culture is 90.2% in the sphere belonging to the good lot and 64.1% in the sphere belonging to the bad lot.
[Table 1] Proliferation rate Survival rate Good lot 20.0 times 90.2% Bad lot 3.7 times 64.1% - For each of the good lot and the bad lot, the sphere as the
sample 14 is set on the sample stage of theimaging system 1 shown inFig. 1 , and holograms of the plurality of spheres are imaged by theCMOS camera 19. A computer numerical calculation is performed on the acquired hologram of each sphere to acquire the phase difference image sliced near the center of the sphere. - The particle diameter of each sphere is derived from the obtained phase difference image of each sphere, and a histogram of the particle diameter of the sphere is acquired.
Fig. 9A is the histogram of the particle diameter of the sphere derived for each of the good lot and the bad lot. As shown inFig. 9A , there is no significant difference in the histogram between the good lot and the bad lot. This indicates that the state of the sphere is difficult to be reflected in the particle diameter of the sphere, and it is difficult to determine the state of the sphere on the basis of only the particle diameter of the sphere. - Next, the volume is derived as the shape index value of each sphere from the phase difference image of each sphere obtained for each of the good lot and the bad lot, and the total phase difference amount θA shown by
Formula 3 is derived for the phase difference image of each sphere. The correlation properties between the volume of the sphere and the total phase difference amount θA are acquired by forming the plot for each sphere of each culture lot on the graph in which the volume of the sphere is taken on the lateral axis and the total phase difference amount θA is taken on the vertical axis.Fig. 9B is a graph showing an example of the correlation properties between the volume of the sphere and the total phase difference amount θA acquired for each of the good lot and the bad lot.Fig. 9B shows the reference correlation trend line LS and the plot. As shown inFig. 9B , in the good lot, the number of spheres in which the total phase difference amount θA falls below the reference correlation trend line LS is small, whereas in the bad lot, the number of spheres in which the total phase difference amount θA falls below the reference correlation trend line LS is larger than that in the good lot. - From the above results, it can be said that the quality of the culture lot can be determined by using a correlation between the total phase difference amount θA and the volume, which is an example of the shape index value of the sphere. In addition, it can be said that the reference correlation trend line LS indicating the correlation between the total phase difference amount θA and the volume of the sphere can be compared with the correlation for the sphere belonging to the culture lot to be determined, and the quality of the culture lot can be determined according to the degree of deviation of the correlation for the culture lot to be determined from the reference correlation trend line LS. Specifically, it can be said that the state of the culture lot can be determined on the basis of at least one of the state of deviation (whether or not the plot falls below the reference correlation trend line LS) or the degree of deviation from the reference correlation trend line LS of the plot of each sphere belonging to the culture lot to be determined which is plotted on the graph in which the volume of the sphere is taken on one axis and the total phase difference amount θA is taken on the other axis. Accordingly, for example, in a case where a content of the spheres in which the minus width from the reference correlation trend line LS of the total phase difference amount θA is equal to or more than a first threshold value is equal to or more than a second threshold value, it can be determined that the culture lot is a bad lot, and in a case where the content of the spheres is less than the second threshold value, it can be determined that the culture lot is a good lot.
- Next, the phase difference amount density DP shown by
Formula 4 is derived from the phase difference images of each sphere obtained for each of the good lot and the bad lot.Fig. 9C is a histogram of the phase difference amount density DP acquired for each of a good lot and a bad lot. As shown inFig. 9C , there is a significant difference in the histogram between the good lot and the bad lot. Specifically, in the good lot, a peak of distribution exists at a position where the phase difference amount density DP is relatively high, and in the bad lot, a peak of distribution exists at a position where the phase difference amount density DP is relatively low. A p value (significance probability), which is an index showing the reliability of the significant difference between the good lot and the bad lot in the histogram of the phase difference amount density DP, is less than 0.05. - From the above results, it can be said that the quality of the culture lot can be determined on the basis of the phase difference amount density DP of the sphere. Therefore, for example, an average value of the phase difference amount density DP is obtained for the plurality of spheres belonging to the culture lot to be determined, and in a case where the average value is equal to or more than a threshold value, the culture lot can be determined as a good lot, and in a case where the average value is less than the threshold value, the culture lot can be determined as a bad lot.
- In this example, the case where the phase difference amount density DP is used for the quality determination of the culture lot is exemplified, but the phase difference amount density DP can also be used for quality determination of a single sphere. For example, it can be determined that the state of the sphere is good in a case where the phase difference amount density DP acquired for the sphere to be determined is equal to or more than a threshold value, and it can be determined that the state of the sphere is abnormal in a case where the phase difference amount density DP is less than the threshold value.
- In this example, a plurality of spheres belonging to a plurality of different culture lots are used as an object to be determined. The spheres to be determined are all spheres of iPS cells cultured by the three-dimensional culture method.
- For each of the plurality of culture lots, the sphere as the
sample 14 is set on the sample stage of theimaging system 1 shown inFig. 1 , and holograms of the plurality of spheres are imaged by theCMOS camera 19. A computer numerical calculation is performed on the acquired hologram of each sphere to acquire the phase difference image sliced near the center of the sphere. For the obtained phase difference image of each sphere, the phase difference amount density Dp shown byFormula 4 is derived for each culture lot. - Next, the survival rate of cells is acquired for each of the plurality of culture lots. The procedure for measuring the survival rate is as follows. A sphere accommodated in a centrifuge tube is subjected to a centrifugal separation treatment of 400G (G: gravity acceleration) for 3 minutes. The sphere settled to the bottom of the centrifuge tube is collected and decomposed into single cells using TrypLE (registered trademark) Select, which is a cell dissociation enzyme. After the decomposed cells are subjected to a dead cell staining treatment by Trypan Blue, the number of stained dead cells is counted by counting the cells using a commercially available general cell counter (Countess (registered trademark)). The survival rate of cells is derived for each culture lot from the count of dead cells.
- Correlation properties between the survival rate of cells and the phase difference amount density DP (lot average value) are acquired by forming a plot for each culture lot on a graph in which the survival rate of cells is taken on the lateral axis and the phase difference amount density DP is taken on the vertical axis.
Fig. 10 is a graph showing the correlation properties between the survival rate of cells and the phase difference amount density DP (lot average value). As shown inFig. 10 , it is confirmed that the survival rate of cells and the phase difference amount density DP have a proportional relationship. - From the above results, it can be said that the survival rate of cells can be estimated from the phase difference amount density DP. By estimating the survival rate of the cells from the phase difference amount density DP, the survival rate of the cells can be grasped without performing a treatment involving destruction of the cells such as a centrifugal separation treatment and a staining treatment (that is, in a non-destructive manner). For example, a correlation line showing the correlation between the survival rate of the cells and the phase difference amount density DP is acquired in advance, and the survival rate of the cells in the culture lot can be estimated from the average value of the phase difference amount density DP acquired for the sphere belonging to the culture lot to be determined and the correlation line.
- In this example, the case where the survival rate of cells in the culture lot is estimated from the phase difference amount density DP is exemplified, but it is also possible to estimate the survival rate of the cells within a single sphere from the phase difference amount density DP. For example, the correlation line showing the correlation between the survival rate of the cells and the phase difference amount density DP is acquired in advance, and the survival rate of the cells in the sphere can be estimated from the phase difference amount density DP acquired for the sphere to be determined and the correlation line.
- The effect of the survival rate of cells on the phase difference image is confirmed. In order to induce necrosis in the iPS cells cultured by the two-dimensional culture method (adhesive culture method), 3 wt% of H2O2 (hydrogen peroxide) is added to a cell colony, and then staining treatment with SYTOX (registered trademark) Green as a fluorescent coloring agent is performed. Subsequently, the colony subjected to the above-described processing is set on the sample stage of the
imaging system 1 shown inFig. 1 , and a hologram of the colony is imaged by theCMOS camera 19. A computer numerical calculation is performed on the acquired hologram to acquire the phase difference image of the colony. In parallel with the hologram imaging, a fluorescence microscope image is imaged by theCMOS camera 36. -
Figs. 11A, 11B, and 11C are fluorescence microscope images of colonies at a point in time where 0 minute, 15 minutes, and 37 minutes have elapsed after adding H2O2, respectively.Figs. 12A, 12B, and 12C are phase difference images of colonies at a point in time where 0 minute, 15 minutes, and 37 minutes have elapsed after adding H2O2, respectively. - As shown in
Figs. 11A to 11C , the number of light emission sites increased with the lapse of time from the time at which H2O2 is added. This means that the dead cells increase (in other words, the survival rate of cells decreases) with the lapse of time from the time at which H2O2 is added. In addition, as shown inFigs. 12A to 12C , the area of the low luminance region in the phase difference image increases with the lapse of time from the time at which H2O2 is added. This means that the total phase difference amount θA in the phase difference image decreases as the survival rate of cells decreases. As described above, it is confirmed that the survival rate of cells affects the total phase difference amount θA. - Necrosis is induced by adding H2O2 to the colonies of iPS cells cultured by the two-dimensional culture method (adhesive culture method). In addition, another iPS cell colony is induced to undergo apoptosis using Apoptosis Inducer Set from PromoKine. The apoptosis is an active cell death that is managed and regulated as a growth control mechanism in cells of multicellular organisms. On the other hand, the necrosis is passive cell death caused by external environmental factors such as nutritional deficiency, toxic substances, and trauma, and the process leading to cell death is different from apoptosis.
- The colony subjected to the above-described processing and healthy colony are set on the sample stage of the
imaging system 1 shown inFig. 1 , and a hologram of each colony is imaged by theCMOS camera 19. A computer numerical calculation is performed on the acquired hologram to acquire the phase difference image of each colony. For the phase difference image of each colony, the total phase difference amount θA shown byFormula 3 is derived. -
Fig. 13 is a graph showing a relative value of the total phase difference amount θA of each of a colony (dead cell) induced by necrosis, a colony (dead cell) induced by apoptosis, and a healthy colony (live cell). The total phase difference amount θA of the healthy colony (live cell) is set to 1. As shown inFig. 13 , a significant difference is observed in the total phase difference amount θA between the healthy colony (live cell) and the colony (dead cell) induced by necrosis and the colony (dead cell) induced by apoptosis. The p value (significance probability), which is an index showing the reliability of the significant difference, is less than 0.05. - From the above results, regardless of whether the process leading to cell death is necrosis or apoptosis, it can be said that the total phase difference amount θA can be used for determining whether the cells are live or dead. For example, in a case where the total phase difference amount θA acquired for the sphere to be determined is equal to or more than a threshold value, it can be determined that the sphere includes more live cells, and in a case where the total phase difference amount θA acquired for the sphere to be determined is less than the threshold value, it can be determined that the sphere includes more dead cells. It is also possible to use the phase difference amount density DP instead of the total phase difference amount θA to determine whether the cell is live or dead.
- A sphere of iPS cells maintained in the undifferentiated state and a sphere of iPS cells deviated from the undifferentiated state are set on the sample stage of the
imaging system 1 shown inFig. 1 , and the hologram of each sphere is imaged by theCMOS camera 19. A computer numerical calculation is performed on the acquired hologram of each sphere to acquire the phase difference image sliced near the center of the sphere. For the phase difference image of each sphere, the total phase difference amount θA shown byFormula 3 is derived. The sphere deviated from the undifferentiated state is induced to the undifferentiated deviation state by using a basal medium to which components necessary for maintaining the undifferentiated state are not added. -
Fig. 14 is a graph showing an average value of the total phase difference amount θA of each of the spheres maintained in the undifferentiated state and the sphere deviated from the undifferentiated state. As shown inFig. 14 , a significant difference is found in the total phase difference amount θA between the sphere that maintained the undifferentiated state and the sphere that deviated from the undifferentiated state. - From the above results, it can be said that the total phase difference amount θA can be used for determining whether an undifferentiated state of a stem cell is maintained or deviated from the undifferentiated state. For example, in the case where the total phase difference amount θA acquired for the sphere to be determined is equal to or more than a threshold value, it can be determined that the sphere maintains the undifferentiated state, and in the case where the total phase difference amount θA acquired for the sphere to be determined is less than the threshold value, it can be determined that the sphere deviates from the undifferentiated state. It is also possible to use the phase difference amount density DP instead of the total phase difference amount θA for determining whether the undifferentiated state is maintained or deviated.
- As is clear from the above description, according to the determination method of the embodiment of the disclosed technology, the state of the sphere is determined on the basis of the phase difference image generated from the hologram of the sphere and the shape index value corresponding to the shape of the sphere, and thus the state of the sphere can be determined in a non-destructive and simple manner.
- That is, according to the determination method of the embodiment of the disclosed technology, it is possible to determine the density, the survival rate, or the like of cells inside the sphere that cannot be grasped by the conventional optical microscope. In addition, imaging of hologram, an image analysis, statistical processing, and the like performed in this determination method can be easily automated by a computer, and labor and processing time can be reduced as compared with conventional methods. Further, it is possible to obtain a stable determination result without affecting the variation of techniques by operators. Further, it is possible to determine the state of the sphere non-destructively without performing a treatment involving cell destruction such as decomposing the sphere into single cells or adding a fluorescent coloring agent. Additionally, the hologram imaging can be easily performed even for spheres randomly present in a three-dimensional space, and the state of the sphere during culture by the three-dimensional culture method can be determined on the spot.
- In the determination of the state of the sphere, a more accurate determination result can be obtained by using the phase difference image sliced near the center of the spherical sphere. By using one phase difference image sliced near the center of the spherical sphere, it is possible to simplify the processing required for determination, as compared with the case of using a plurality of phase difference images having different slice positions.
- A determination method according to the disclosed technology includes generating a phase difference image of a sphere that is an aggregate of a plurality of cells from a hologram obtained by imaging the sphere; and determining a state of the sphere on the basis of the phase difference image and a shape index value corresponding to a shape of the sphere.
- In the determination method according to the disclosed technology, it is possible to determine the state of the sphere in a non-destructive and simple manner.
- In the determination method according to the disclosed technology, a determination regarding at least one of a survival rate, a density, a homogeneity, or an undifferentiated state deviation of the plurality of cells included in the sphere, or an outer shape of the sphere may be performed on the basis of the phase difference image and the shape index value.
- In the determination method according to the disclosed technology, a total phase difference amount that is a value obtained by integrating a phase difference amount of each of a plurality of pixels constituting the phase difference image may be derived; and the state of the sphere may be determined using a correlation between the total phase difference amount and the shape index value.
- By using the correlation between the total phase difference amount and the shape index value to determine the state of the sphere, it is possible to make an accurate determination of the state of the sphere.
- In the determination method according to the disclosed technology, a reference correlation trend line indicating a reference for the correlation between the total phase difference amount and the shape index value may be compared with a correlation between a total phase difference amount and a shape index value for a sphere to be determined; and the state of the sphere to be determined may be determined according to a degree of deviation of the correlation between the total phase difference amount and the shape index value for the sphere to be determined from the reference correlation trend line. For example, in a case where a width of the deviation of the correlation between the total phase difference amount and the shape index value for the sphere to be determined from the reference correlation trend line exceeds a threshold value, it may be determined that there is an abnormality in at least one of a survival rate, a density, or a homogeneity of cells included in the sphere to be determined, or an outer shape of the sphere.
- According to this aspect, it is possible to further improve the accuracy of the state determination of the sphere.
- In the determination method according to the disclosed technology, a reference correlation trend line indicating a reference for the correlation between the total phase difference amount and the shape index value may be compared with a correlation between a total phase difference amount and a shape index value for each of a plurality of spheres belonging to a culture lot to be determined; and a quality of the culture lot to be determined may be determined according to at least one of a state of deviation or a degree of deviation of the correlation between the total phase difference amount and the shape index value for the culture lot to be determined from the reference correlation trend line.
- According to this aspect, it becomes possible to accurately determine the quality of the culture lot including a plurality of spheres.
- In the determination method according to the disclosed technology, the shape index value may be any one of a volume, a cross-sectional area, a particle diameter, or a circumferential length of the sphere.
- In the determination method according to the disclosed technology, a phase difference amount density may be derived by dividing a total phase difference amount that is a value obtained by integrating a phase difference amount of each of a plurality of pixels constituting the phase difference image by a volume of the sphere; and the state of the sphere may be determined on the basis of the phase difference amount density.
- By using the phase difference amount density to determine the state of the sphere, it is possible to make an accurate determination of the state of the sphere.
- In the determination method according to the disclosed technology, it is preferable that the phase difference image used for the determination of the state of the sphere is a phase difference image in which variation in a phase difference amount between a plurality of pixels constituting the phase difference image is the maximum among a plurality of phase difference images that can be generated from the hologram.
- By using the above-described image as the phase difference image used to determine the state of the sphere, more accurate information matching the actual condition of the sphere can be obtained from the phase difference image, and the accuracy of the state determination of the sphere can be further improved.
-
- 1: imaging system
- 10: hologram optical system
- 11: laser light source
- 12: beam splitter
- 13: collimating lens
- 14: sample
- 15: objective lens
- 17: imaging lens
- 18: beam splitter
- 19, 36: CMOS camera
- 20: optical fiber
- 21: collimating lens
- 30: fluorescence microscope optical system
- 31: excitation light source
- 32: excitation filter
- 33: ON/OFF switching mirror
- 34: dichroic mirror
- 35: spectral filter
- 500: computer
- 502: main memory
- 503: auxiliary storage device
- 504: communication interface
- 505: display unit
- 506: autofocus program
- 507: bus
- Dp: phase difference amount density
- IP: phase difference image
- Ls: reference correlation trend line
- θ: phase difference amount
- θB: phase of background
- θS: phase of region where sphere exist
- θA: total phase difference amount
- θk: phase difference amount θk per 1 pixel
- V: volume of sphere
- vk: volume of sphere in portion corresponding to each pixel k of phase difference image
- a1, a2, a3, a4, a5: plot
- k: pixel
- w: width of curve
Claims (9)
- A determination method, comprising:generating a phase difference image of a sphere that is an aggregate of a plurality of cells from a hologram obtained by imaging the sphere; anddetermining a state of the sphere on the basis of the phase difference image and a shape index value corresponding to a shape of the sphere.
- The determination method according to claim 1, further comprising:
performing determination regarding at least one of a survival rate, a density, a homogeneity, or an undifferentiated state deviation of the plurality of cells included in the sphere, or an outer shape of the sphere, on the basis of the phase difference image and the shape index value. - The determination method according to claim 1 or 2, further comprising:deriving a total phase difference amount that is a value obtained by integrating a phase difference amount of each of a plurality of pixels constituting the phase difference image; anddetermining the state of the sphere using a correlation between the total phase difference amount and the shape index value.
- The determination method according to claim 3, further comprising:comparing a reference correlation trend line indicating a reference for the correlation between the total phase difference amount and the shape index value with a correlation between a total phase difference amount and a shape index value for a sphere to be determined; anddetermining the state of the sphere to be determined according to a degree of deviation of the correlation between the total phase difference amount and the shape index value for the sphere to be determined from the reference correlation trend line.
- The determination method according to claim 4, further comprising:
determining that there is an abnormality in at least one of a survival rate, a density, or a homogeneity of cells included in the sphere to be determined, or an outer shape of the sphere in a case where a width of the deviation of the correlation between the total phase difference amount and the shape index value for the sphere to be determined from the reference correlation trend line exceeds a threshold value. - The determination method according to claim 3, further comprising:comparing a reference correlation trend line indicating a reference for the correlation between the total phase difference amount and the shape index value with a correlation between a total phase difference amount and a shape index value for each of a plurality of spheres belonging to a culture lot to be determined; anddetermining a quality of the culture lot to be determined according to at least one of a state of deviation or a degree of deviation of the correlation between the total phase difference amount and the shape index value for the culture lot to be determined from the reference correlation trend line.
- The determination method according to any one of claims 1 to 6,
wherein the shape index value is any one of a volume, a cross-sectional area, a particle diameter, or a circumferential length of the sphere. - The determination method according to claim 1 or 2, further comprising:deriving a phase difference amount density by dividing a total phase difference amount by a volume of the sphere, the a total phase difference amount is a value obtained by integrating a phase difference amount of each of a plurality of pixels constituting the phase difference image; anddetermining the state of the sphere on the basis of the phase difference amount density.
- The determination method according to any one of claims 1 to 8,
wherein the phase difference image used for the determination of the state of the sphere is a phase difference image in which variation in a phase difference amount between a plurality of pixels constituting the phase difference image is the maximum among a plurality of phase difference images that are generable from the hologram.
Applications Claiming Priority (2)
| Application Number | Priority Date | Filing Date | Title |
|---|---|---|---|
| JP2018044594 | 2018-03-12 | ||
| PCT/JP2019/005112 WO2019176427A1 (en) | 2018-03-12 | 2019-02-13 | Determination method` |
Publications (3)
| Publication Number | Publication Date |
|---|---|
| EP3766984A1 true EP3766984A1 (en) | 2021-01-20 |
| EP3766984A4 EP3766984A4 (en) | 2021-05-12 |
| EP3766984B1 EP3766984B1 (en) | 2024-10-30 |
Family
ID=67908147
Family Applications (1)
| Application Number | Title | Priority Date | Filing Date |
|---|---|---|---|
| EP19766464.2A Active EP3766984B1 (en) | 2018-03-12 | 2019-02-13 | Determination method` |
Country Status (4)
| Country | Link |
|---|---|
| US (1) | US11893728B2 (en) |
| EP (1) | EP3766984B1 (en) |
| JP (1) | JP6995975B2 (en) |
| WO (1) | WO2019176427A1 (en) |
Families Citing this family (9)
| Publication number | Priority date | Publication date | Assignee | Title |
|---|---|---|---|---|
| WO2020066344A1 (en) | 2018-09-28 | 2020-04-02 | 富士フイルム株式会社 | Determination method |
| WO2020066348A1 (en) * | 2018-09-28 | 2020-04-02 | 富士フイルム株式会社 | Determination method |
| WO2021085034A1 (en) * | 2019-10-28 | 2021-05-06 | 富士フイルム株式会社 | Method for selecting pluripotent stem cells, method for predicting result of differentiation induction, and method for producing cell product |
| JPWO2021085033A1 (en) * | 2019-10-28 | 2021-05-06 | ||
| CN112765624B (en) * | 2021-01-19 | 2022-05-27 | 浙江科技学院 | Authenticatable phase-only hologram generation method based on phase optimization and sparse constraint |
| US12482564B2 (en) * | 2021-02-05 | 2025-11-25 | Anvitha Addanki | Data processing system for estimating disease progression rates |
| EP4321936A4 (en) * | 2021-04-09 | 2024-09-18 | FUJIFILM Corporation | HOLOGRAPHY DEVICE AND CELL EVALUATION METHOD |
| WO2022224722A1 (en) | 2021-04-21 | 2022-10-27 | 富士フイルム株式会社 | Method for acquiring evaluation value |
| WO2023233827A1 (en) * | 2022-06-03 | 2023-12-07 | 富士フイルム株式会社 | Phase image acquisition method and quantitative data acquisition method |
Family Cites Families (15)
| Publication number | Priority date | Publication date | Assignee | Title |
|---|---|---|---|---|
| EP1963927B1 (en) * | 2005-12-22 | 2020-01-15 | Phase Holographic Imaging PHI AB | Method and apparatus for analysis of a sample of cells |
| ITRM20060226A1 (en) * | 2006-04-21 | 2007-10-22 | Cnr Consiglio Naz Delle Ricerche | HOLOGRAPHY METHOD WITH A QUANTITATIVE PHASE FOR THE NUMERICAL RECONSTRUCTION OF IMAGES AND RALATIVE APPARATUS |
| US8531747B2 (en) * | 2009-06-24 | 2013-09-10 | Canon Kabushiki Kaisha | Hologram, hologram data generation method, and exposure apparatus |
| US9514271B2 (en) * | 2010-06-17 | 2016-12-06 | Purdue Research Foundation | Digital holographic method of measuring cellular activity and measuring apparatus with improved stability |
| CN108107197B (en) * | 2011-07-19 | 2020-05-08 | 奥维茨奥成像系统公司 | Methods and systems for detecting and/or classifying cancer cells in a cell sample |
| EP2963503B1 (en) * | 2013-03-01 | 2020-05-20 | Citizen Watch Co., Ltd. | Luminous flux splitting element |
| JP2015146747A (en) | 2014-02-05 | 2015-08-20 | 浜松ホトニクス株式会社 | Cell determination method |
| JP6122817B2 (en) * | 2014-03-26 | 2017-04-26 | 株式会社Screenホールディングス | Spheroid evaluation method and spheroid evaluation apparatus |
| JP6284832B2 (en) | 2014-06-20 | 2018-02-28 | 富士フイルム株式会社 | Cell evaluation apparatus, method and program |
| JP6388036B2 (en) * | 2014-11-27 | 2018-09-12 | 株式会社島津製作所 | Digital holography apparatus and digital hologram generation method |
| JP6256669B1 (en) * | 2016-03-18 | 2018-01-10 | 株式会社村田製作所 | METAL POROUS MEMBRANE, CLASSIFICATION METHOD USING SAME, AND CLASSIFICATION DEVICE |
| WO2017216930A1 (en) * | 2016-06-16 | 2017-12-21 | 株式会社日立ハイテクノロジーズ | Method for analyzing state of cells in spheroid |
| JP6376196B2 (en) | 2016-09-29 | 2018-08-22 | 株式会社ニコン | Cell evaluation apparatus, cell evaluation method and program |
| EP3842518A4 (en) * | 2018-08-20 | 2021-12-01 | FUJIFILM Corporation | CELL CULTURE METHOD AND CELL CULTURE DEVICE |
| JP7159334B2 (en) * | 2018-09-28 | 2022-10-24 | 富士フイルム株式会社 | CELL STRUCTURE, CELL STRUCTURE MANUFACTURING METHOD, CELL CULTURE METHOD, AND MICROCHANNEL |
-
2019
- 2019-02-13 EP EP19766464.2A patent/EP3766984B1/en active Active
- 2019-02-13 JP JP2020505699A patent/JP6995975B2/en active Active
- 2019-02-13 WO PCT/JP2019/005112 patent/WO2019176427A1/en not_active Ceased
-
2020
- 2020-07-14 US US16/928,974 patent/US11893728B2/en active Active
Also Published As
| Publication number | Publication date |
|---|---|
| US11893728B2 (en) | 2024-02-06 |
| EP3766984A4 (en) | 2021-05-12 |
| JP6995975B2 (en) | 2022-02-04 |
| US20200342599A1 (en) | 2020-10-29 |
| EP3766984B1 (en) | 2024-10-30 |
| WO2019176427A1 (en) | 2019-09-19 |
| JPWO2019176427A1 (en) | 2020-12-10 |
Similar Documents
| Publication | Publication Date | Title |
|---|---|---|
| US11893728B2 (en) | Method for determining a state of a sphere | |
| US20240341668A1 (en) | Hyperspectral Image-Guided Ocular Imager for Alzheimer's Disease Pathologies | |
| US20230085827A1 (en) | Single-shot autofocusing of microscopy images using deep learning | |
| CN101943663B (en) | Measuring analytical system and measuring analytical method for distinguishing diffraction image of particles automatically | |
| Seo et al. | Multi-color LUCAS: lensfree on-chip cytometry using tunable monochromatic illumination and digital noise reduction | |
| CN110392732B (en) | Cell analysis method and cell analysis device | |
| WO2019117177A1 (en) | Distinguishing method, learning method, distinguishing device and computer program | |
| US11480920B2 (en) | Image processing apparatus, evaluation system, image processing program, and image processing method | |
| CN111899215A (en) | Method for extracting optical element body defects | |
| JPWO2020054466A1 (en) | Fine particle observation device and fine particle observation method | |
| US12067713B2 (en) | Determination method | |
| US11869181B2 (en) | Determination method | |
| Go et al. | Learning-based automatic sensing and size classification of microparticles using smartphone holographic microscopy | |
| Taieb et al. | Classification of tissue biopsies by Raman spectroscopy guided by quantitative phase imaging and its application to bladder cancer | |
| CN119630808A (en) | Method for identifying a region of cells undergoing programmed cell death, device having an identifying unit, and information processing program including an identifying step | |
| US12560790B2 (en) | Optical measurement method, optical measurement apparatus, and non-transitory storage medium storing optical measurement program | |
| US20230351602A1 (en) | Cell segmentation image processing methods | |
| Nienałtowski et al. | Comparison of fixed and living biological cells parameters investigated with digital holographic microscope | |
| Walkenfort et al. | Counting Synaptic Vesicles: As Simple as That? | |
| JP2023170616A (en) | Raman scattering spectrum correction device and correction method | |
| Vaccari et al. | Assessment of Wallerian degeneration by automated image analysis | |
| Weng | Integrating Coherent Anti-Stokes Raman Scattering Imaging and Deep Learning Analytics for High Precision, Real Time, Label Free Cancer Diagnosis |
Legal Events
| Date | Code | Title | Description |
|---|---|---|---|
| STAA | Information on the status of an ep patent application or granted ep patent |
Free format text: STATUS: THE INTERNATIONAL PUBLICATION HAS BEEN MADE |
|
| PUAI | Public reference made under article 153(3) epc to a published international application that has entered the european phase |
Free format text: ORIGINAL CODE: 0009012 |
|
| STAA | Information on the status of an ep patent application or granted ep patent |
Free format text: STATUS: REQUEST FOR EXAMINATION WAS MADE |
|
| 17P | Request for examination filed |
Effective date: 20200714 |
|
| AK | Designated contracting states |
Kind code of ref document: A1 Designated state(s): AL AT BE BG CH CY CZ DE DK EE ES FI FR GB GR HR HU IE IS IT LI LT LU LV MC MK MT NL NO PL PT RO RS SE SI SK SM TR |
|
| AX | Request for extension of the european patent |
Extension state: BA ME |
|
| REG | Reference to a national code |
Ref country code: DE Ref legal event code: R079 Free format text: PREVIOUS MAIN CLASS: C12Q0001020000 Ipc: G01N0015060000 Ref document number: 602019061158 Country of ref document: DE |
|
| RAP3 | Party data changed (applicant data changed or rights of an application transferred) |
Owner name: FUJIFILM CORPORATION |
|
| A4 | Supplementary search report drawn up and despatched |
Effective date: 20210412 |
|
| RIC1 | Information provided on ipc code assigned before grant |
Ipc: G01N 15/06 20060101AFI20210406BHEP Ipc: G01N 15/10 20060101ALI20210406BHEP Ipc: G01N 15/14 20060101ALI20210406BHEP Ipc: G01N 21/45 20060101ALI20210406BHEP Ipc: G03H 1/00 20060101ALI20210406BHEP Ipc: G03H 1/04 20060101ALI20210406BHEP Ipc: G03H 1/08 20060101ALI20210406BHEP Ipc: C12Q 1/02 20060101ALI20210406BHEP Ipc: C12M 1/34 20060101ALI20210406BHEP Ipc: G06T 7/00 20170101ALI20210406BHEP |
|
| DAV | Request for validation of the european patent (deleted) | ||
| DAX | Request for extension of the european patent (deleted) | ||
| STAA | Information on the status of an ep patent application or granted ep patent |
Free format text: STATUS: EXAMINATION IS IN PROGRESS |
|
| 17Q | First examination report despatched |
Effective date: 20230329 |
|
| GRAP | Despatch of communication of intention to grant a patent |
Free format text: ORIGINAL CODE: EPIDOSNIGR1 |
|
| STAA | Information on the status of an ep patent application or granted ep patent |
Free format text: STATUS: GRANT OF PATENT IS INTENDED |
|
| RIC1 | Information provided on ipc code assigned before grant |
Ipc: G02B 21/16 20060101ALI20240315BHEP Ipc: G06T 7/00 20170101ALI20240315BHEP Ipc: C12M 1/34 20060101ALI20240315BHEP Ipc: C12Q 1/02 20060101ALI20240315BHEP Ipc: G03H 1/08 20060101ALI20240315BHEP Ipc: G03H 1/04 20060101ALI20240315BHEP Ipc: G03H 1/00 20060101ALI20240315BHEP Ipc: G01N 15/1434 20240101ALI20240315BHEP Ipc: G01N 15/1433 20240101ALI20240315BHEP Ipc: G01N 21/45 20060101ALI20240315BHEP Ipc: G01N 15/14 20060101ALI20240315BHEP Ipc: G01N 15/10 20060101ALI20240315BHEP Ipc: G01N 15/06 20060101AFI20240315BHEP |
|
| INTG | Intention to grant announced |
Effective date: 20240410 |
|
| GRAJ | Information related to disapproval of communication of intention to grant by the applicant or resumption of examination proceedings by the epo deleted |
Free format text: ORIGINAL CODE: EPIDOSDIGR1 |
|
| STAA | Information on the status of an ep patent application or granted ep patent |
Free format text: STATUS: EXAMINATION IS IN PROGRESS |
|
| GRAP | Despatch of communication of intention to grant a patent |
Free format text: ORIGINAL CODE: EPIDOSNIGR1 |
|
| STAA | Information on the status of an ep patent application or granted ep patent |
Free format text: STATUS: GRANT OF PATENT IS INTENDED |
|
| INTC | Intention to grant announced (deleted) | ||
| INTG | Intention to grant announced |
Effective date: 20240729 |
|
| GRAS | Grant fee paid |
Free format text: ORIGINAL CODE: EPIDOSNIGR3 |
|
| GRAA | (expected) grant |
Free format text: ORIGINAL CODE: 0009210 |
|
| STAA | Information on the status of an ep patent application or granted ep patent |
Free format text: STATUS: THE PATENT HAS BEEN GRANTED |
|
| AK | Designated contracting states |
Kind code of ref document: B1 Designated state(s): AL AT BE BG CH CY CZ DE DK EE ES FI FR GB GR HR HU IE IS IT LI LT LU LV MC MK MT NL NO PL PT RO RS SE SI SK SM TR |
|
| REG | Reference to a national code |
Ref country code: GB Ref legal event code: FG4D |
|
| REG | Reference to a national code |
Ref country code: CH Ref legal event code: EP |
|
| REG | Reference to a national code |
Ref country code: IE Ref legal event code: FG4D |
|
| REG | Reference to a national code |
Ref country code: DE Ref legal event code: R096 Ref document number: 602019061158 Country of ref document: DE |
|
| REG | Reference to a national code |
Ref country code: LT Ref legal event code: MG9D |
|
| REG | Reference to a national code |
Ref country code: NL Ref legal event code: MP Effective date: 20241030 |
|
| PG25 | Lapsed in a contracting state [announced via postgrant information from national office to epo] |
Ref country code: IS Free format text: LAPSE BECAUSE OF FAILURE TO SUBMIT A TRANSLATION OF THE DESCRIPTION OR TO PAY THE FEE WITHIN THE PRESCRIBED TIME-LIMIT Effective date: 20250228 Ref country code: PT Free format text: LAPSE BECAUSE OF FAILURE TO SUBMIT A TRANSLATION OF THE DESCRIPTION OR TO PAY THE FEE WITHIN THE PRESCRIBED TIME-LIMIT Effective date: 20250228 Ref country code: HR Free format text: LAPSE BECAUSE OF FAILURE TO SUBMIT A TRANSLATION OF THE DESCRIPTION OR TO PAY THE FEE WITHIN THE PRESCRIBED TIME-LIMIT Effective date: 20241030 |
|
| PG25 | Lapsed in a contracting state [announced via postgrant information from national office to epo] |
Ref country code: FI Free format text: LAPSE BECAUSE OF FAILURE TO SUBMIT A TRANSLATION OF THE DESCRIPTION OR TO PAY THE FEE WITHIN THE PRESCRIBED TIME-LIMIT Effective date: 20241030 Ref country code: NL Free format text: LAPSE BECAUSE OF FAILURE TO SUBMIT A TRANSLATION OF THE DESCRIPTION OR TO PAY THE FEE WITHIN THE PRESCRIBED TIME-LIMIT Effective date: 20241030 |
|
| REG | Reference to a national code |
Ref country code: AT Ref legal event code: MK05 Ref document number: 1737310 Country of ref document: AT Kind code of ref document: T Effective date: 20241030 |
|
| PG25 | Lapsed in a contracting state [announced via postgrant information from national office to epo] |
Ref country code: BG Free format text: LAPSE BECAUSE OF FAILURE TO SUBMIT A TRANSLATION OF THE DESCRIPTION OR TO PAY THE FEE WITHIN THE PRESCRIBED TIME-LIMIT Effective date: 20241030 |
|
| PG25 | Lapsed in a contracting state [announced via postgrant information from national office to epo] |
Ref country code: ES Free format text: LAPSE BECAUSE OF FAILURE TO SUBMIT A TRANSLATION OF THE DESCRIPTION OR TO PAY THE FEE WITHIN THE PRESCRIBED TIME-LIMIT Effective date: 20241030 |
|
| PG25 | Lapsed in a contracting state [announced via postgrant information from national office to epo] |
Ref country code: NO Free format text: LAPSE BECAUSE OF FAILURE TO SUBMIT A TRANSLATION OF THE DESCRIPTION OR TO PAY THE FEE WITHIN THE PRESCRIBED TIME-LIMIT Effective date: 20250130 |
|
| PG25 | Lapsed in a contracting state [announced via postgrant information from national office to epo] |
Ref country code: AT Free format text: LAPSE BECAUSE OF FAILURE TO SUBMIT A TRANSLATION OF THE DESCRIPTION OR TO PAY THE FEE WITHIN THE PRESCRIBED TIME-LIMIT Effective date: 20241030 Ref country code: LV Free format text: LAPSE BECAUSE OF FAILURE TO SUBMIT A TRANSLATION OF THE DESCRIPTION OR TO PAY THE FEE WITHIN THE PRESCRIBED TIME-LIMIT Effective date: 20241030 Ref country code: GR Free format text: LAPSE BECAUSE OF FAILURE TO SUBMIT A TRANSLATION OF THE DESCRIPTION OR TO PAY THE FEE WITHIN THE PRESCRIBED TIME-LIMIT Effective date: 20250131 |
|
| PG25 | Lapsed in a contracting state [announced via postgrant information from national office to epo] |
Ref country code: PL Free format text: LAPSE BECAUSE OF FAILURE TO SUBMIT A TRANSLATION OF THE DESCRIPTION OR TO PAY THE FEE WITHIN THE PRESCRIBED TIME-LIMIT Effective date: 20241030 |
|
| PG25 | Lapsed in a contracting state [announced via postgrant information from national office to epo] |
Ref country code: RS Free format text: LAPSE BECAUSE OF FAILURE TO SUBMIT A TRANSLATION OF THE DESCRIPTION OR TO PAY THE FEE WITHIN THE PRESCRIBED TIME-LIMIT Effective date: 20250130 |
|
| PG25 | Lapsed in a contracting state [announced via postgrant information from national office to epo] |
Ref country code: SM Free format text: LAPSE BECAUSE OF FAILURE TO SUBMIT A TRANSLATION OF THE DESCRIPTION OR TO PAY THE FEE WITHIN THE PRESCRIBED TIME-LIMIT Effective date: 20241030 |
|
| PG25 | Lapsed in a contracting state [announced via postgrant information from national office to epo] |
Ref country code: DK Free format text: LAPSE BECAUSE OF FAILURE TO SUBMIT A TRANSLATION OF THE DESCRIPTION OR TO PAY THE FEE WITHIN THE PRESCRIBED TIME-LIMIT Effective date: 20241030 |
|
| PG25 | Lapsed in a contracting state [announced via postgrant information from national office to epo] |
Ref country code: EE Free format text: LAPSE BECAUSE OF FAILURE TO SUBMIT A TRANSLATION OF THE DESCRIPTION OR TO PAY THE FEE WITHIN THE PRESCRIBED TIME-LIMIT Effective date: 20241030 |
|
| PG25 | Lapsed in a contracting state [announced via postgrant information from national office to epo] |
Ref country code: RO Free format text: LAPSE BECAUSE OF FAILURE TO SUBMIT A TRANSLATION OF THE DESCRIPTION OR TO PAY THE FEE WITHIN THE PRESCRIBED TIME-LIMIT Effective date: 20241030 |
|
| PG25 | Lapsed in a contracting state [announced via postgrant information from national office to epo] |
Ref country code: SK Free format text: LAPSE BECAUSE OF FAILURE TO SUBMIT A TRANSLATION OF THE DESCRIPTION OR TO PAY THE FEE WITHIN THE PRESCRIBED TIME-LIMIT Effective date: 20241030 |
|
| PG25 | Lapsed in a contracting state [announced via postgrant information from national office to epo] |
Ref country code: CZ Free format text: LAPSE BECAUSE OF FAILURE TO SUBMIT A TRANSLATION OF THE DESCRIPTION OR TO PAY THE FEE WITHIN THE PRESCRIBED TIME-LIMIT Effective date: 20241030 |
|
| PG25 | Lapsed in a contracting state [announced via postgrant information from national office to epo] |
Ref country code: IT Free format text: LAPSE BECAUSE OF FAILURE TO SUBMIT A TRANSLATION OF THE DESCRIPTION OR TO PAY THE FEE WITHIN THE PRESCRIBED TIME-LIMIT Effective date: 20241030 |
|
| REG | Reference to a national code |
Ref country code: DE Ref legal event code: R097 Ref document number: 602019061158 Country of ref document: DE |
|
| PLBE | No opposition filed within time limit |
Free format text: ORIGINAL CODE: 0009261 |
|
| STAA | Information on the status of an ep patent application or granted ep patent |
Free format text: STATUS: NO OPPOSITION FILED WITHIN TIME LIMIT |
|
| PG25 | Lapsed in a contracting state [announced via postgrant information from national office to epo] |
Ref country code: SE Free format text: LAPSE BECAUSE OF FAILURE TO SUBMIT A TRANSLATION OF THE DESCRIPTION OR TO PAY THE FEE WITHIN THE PRESCRIBED TIME-LIMIT Effective date: 20241030 |
|
| PG25 | Lapsed in a contracting state [announced via postgrant information from national office to epo] |
Ref country code: MC Free format text: LAPSE BECAUSE OF FAILURE TO SUBMIT A TRANSLATION OF THE DESCRIPTION OR TO PAY THE FEE WITHIN THE PRESCRIBED TIME-LIMIT Effective date: 20241030 |
|
| 26N | No opposition filed |
Effective date: 20250731 |
|
| PG25 | Lapsed in a contracting state [announced via postgrant information from national office to epo] |
Ref country code: LU Free format text: LAPSE BECAUSE OF NON-PAYMENT OF DUE FEES Effective date: 20250213 |
|
| REG | Reference to a national code |
Ref country code: BE Ref legal event code: MM Effective date: 20250228 |
|
| PGFP | Annual fee paid to national office [announced via postgrant information from national office to epo] |
Ref country code: FR Payment date: 20251231 Year of fee payment: 8 |
|
| PG25 | Lapsed in a contracting state [announced via postgrant information from national office to epo] |
Ref country code: BE Free format text: LAPSE BECAUSE OF NON-PAYMENT OF DUE FEES Effective date: 20250228 |
|
| PG25 | Lapsed in a contracting state [announced via postgrant information from national office to epo] |
Ref country code: IE Free format text: LAPSE BECAUSE OF NON-PAYMENT OF DUE FEES Effective date: 20250213 |
|
| REG | Reference to a national code |
Ref country code: CH Ref legal event code: U11 Free format text: ST27 STATUS EVENT CODE: U-0-0-U10-U11 (AS PROVIDED BY THE NATIONAL OFFICE) Effective date: 20260301 |
|
| PGFP | Annual fee paid to national office [announced via postgrant information from national office to epo] |
Ref country code: GB Payment date: 20260106 Year of fee payment: 8 |
|
| PGFP | Annual fee paid to national office [announced via postgrant information from national office to epo] |
Ref country code: DE Payment date: 20251230 Year of fee payment: 8 |
|
| PGFP | Annual fee paid to national office [announced via postgrant information from national office to epo] |
Ref country code: CH Payment date: 20260301 Year of fee payment: 8 |