EP3748350A1 - Data processing device for imaging mass spectrometry - Google Patents
Data processing device for imaging mass spectrometry Download PDFInfo
- Publication number
- EP3748350A1 EP3748350A1 EP18903784.9A EP18903784A EP3748350A1 EP 3748350 A1 EP3748350 A1 EP 3748350A1 EP 18903784 A EP18903784 A EP 18903784A EP 3748350 A1 EP3748350 A1 EP 3748350A1
- Authority
- EP
- European Patent Office
- Prior art keywords
- mass
- charge ratio
- value
- range
- search
- Prior art date
- Legal status (The legal status is an assumption and is not a legal conclusion. Google has not performed a legal analysis and makes no representation as to the accuracy of the status listed.)
- Withdrawn
Links
- 238000012545 processing Methods 0.000 title claims abstract description 35
- 238000001871 ion mobility spectroscopy Methods 0.000 title 1
- 238000005259 measurement Methods 0.000 claims abstract description 84
- 238000003384 imaging method Methods 0.000 claims abstract description 67
- 238000000034 method Methods 0.000 claims abstract description 57
- 230000008569 process Effects 0.000 claims abstract description 44
- 238000004949 mass spectrometry Methods 0.000 claims abstract description 34
- 150000002500 ions Chemical class 0.000 claims abstract description 27
- 238000001819 mass spectrum Methods 0.000 claims abstract description 26
- 238000009826 distribution Methods 0.000 claims abstract description 25
- 230000001747 exhibiting effect Effects 0.000 claims abstract description 20
- 238000000611 regression analysis Methods 0.000 claims abstract description 9
- 230000007717 exclusion Effects 0.000 claims description 13
- 238000004458 analytical method Methods 0.000 claims description 9
- 238000007619 statistical method Methods 0.000 claims description 8
- 230000003247 decreasing effect Effects 0.000 claims description 2
- 150000001875 compounds Chemical class 0.000 abstract description 48
- 238000000879 optical micrograph Methods 0.000 abstract description 3
- 239000011159 matrix material Substances 0.000 description 19
- 239000000523 sample Substances 0.000 description 17
- 238000013500 data storage Methods 0.000 description 10
- 238000010586 diagram Methods 0.000 description 10
- 238000001228 spectrum Methods 0.000 description 7
- 238000004364 calculation method Methods 0.000 description 6
- 230000003287 optical effect Effects 0.000 description 6
- 210000001519 tissue Anatomy 0.000 description 6
- 241000699666 Mus <mouse, genus> Species 0.000 description 3
- 238000004435 EPR spectroscopy Methods 0.000 description 2
- 241001465754 Metazoa Species 0.000 description 2
- 239000012472 biological sample Substances 0.000 description 2
- 238000002591 computed tomography Methods 0.000 description 2
- 238000012937 correction Methods 0.000 description 2
- 238000010219 correlation analysis Methods 0.000 description 2
- 150000002632 lipids Chemical class 0.000 description 2
- 210000004185 liver Anatomy 0.000 description 2
- 238000002595 magnetic resonance imaging Methods 0.000 description 2
- 238000002600 positron emission tomography Methods 0.000 description 2
- 238000010186 staining Methods 0.000 description 2
- 208000004930 Fatty Liver Diseases 0.000 description 1
- 206010019708 Hepatic steatosis Diseases 0.000 description 1
- 241000282412 Homo Species 0.000 description 1
- 241000699670 Mus sp. Species 0.000 description 1
- 238000001069 Raman spectroscopy Methods 0.000 description 1
- 238000010521 absorption reaction Methods 0.000 description 1
- 238000007792 addition Methods 0.000 description 1
- 210000000577 adipose tissue Anatomy 0.000 description 1
- 239000000090 biomarker Substances 0.000 description 1
- 238000006243 chemical reaction Methods 0.000 description 1
- 238000012790 confirmation Methods 0.000 description 1
- 230000007423 decrease Effects 0.000 description 1
- 238000003795 desorption Methods 0.000 description 1
- 201000010099 disease Diseases 0.000 description 1
- 208000037265 diseases, disorders, signs and symptoms Diseases 0.000 description 1
- 238000007876 drug discovery Methods 0.000 description 1
- 230000000694 effects Effects 0.000 description 1
- 239000000284 extract Substances 0.000 description 1
- 208000010706 fatty liver disease Diseases 0.000 description 1
- 238000002073 fluorescence micrograph Methods 0.000 description 1
- 238000007490 hematoxylin and eosin (H&E) staining Methods 0.000 description 1
- 238000011835 investigation Methods 0.000 description 1
- 238000005040 ion trap Methods 0.000 description 1
- 238000000691 measurement method Methods 0.000 description 1
- 230000037353 metabolic pathway Effects 0.000 description 1
- 238000001000 micrograph Methods 0.000 description 1
- 238000012986 modification Methods 0.000 description 1
- 230000004048 modification Effects 0.000 description 1
- 238000000491 multivariate analysis Methods 0.000 description 1
- 238000003068 pathway analysis Methods 0.000 description 1
- 238000011160 research Methods 0.000 description 1
- 230000004044 response Effects 0.000 description 1
- 231100000240 steatosis hepatitis Toxicity 0.000 description 1
- 239000000126 substance Substances 0.000 description 1
- 238000005211 surface analysis Methods 0.000 description 1
- 239000002699 waste material Substances 0.000 description 1
Images




Classifications
-
- H—ELECTRICITY
- H01—ELECTRIC ELEMENTS
- H01J—ELECTRIC DISCHARGE TUBES OR DISCHARGE LAMPS
- H01J49/00—Particle spectrometers or separator tubes
- H01J49/0027—Methods for using particle spectrometers
- H01J49/0036—Step by step routines describing the handling of the data generated during a measurement
-
- G—PHYSICS
- G01—MEASURING; TESTING
- G01N—INVESTIGATING OR ANALYSING MATERIALS BY DETERMINING THEIR CHEMICAL OR PHYSICAL PROPERTIES
- G01N27/00—Investigating or analysing materials by the use of electric, electrochemical, or magnetic means
- G01N27/62—Investigating or analysing materials by the use of electric, electrochemical, or magnetic means by investigating the ionisation of gases, e.g. aerosols; by investigating electric discharges, e.g. emission of cathode
-
- H—ELECTRICITY
- H01—ELECTRIC ELEMENTS
- H01J—ELECTRIC DISCHARGE TUBES OR DISCHARGE LAMPS
- H01J49/00—Particle spectrometers or separator tubes
- H01J49/0004—Imaging particle spectrometry
Definitions
- the present invention relates to a data processing device for processing mass spectrum data acquired by an imaging mass spectrometer capable of acquiring mass spectrum data for each of multiple measurement points in a measurement area on a sample.
- Mass spectrometric imaging is a method of performing mass spectrometric analysis on each of a plurality of measurement points (micro areas) in a two-dimensional measurement area on a sample such as a slice of biological tissue to examine a spatial distribution of matters having a certain mass.
- the method has been proactively applied to drug discovery, biomarker search, and investigation for the cause of various diseases/illnesses.
- a mass spectrometer for performing the mass spectrometric analysis imaging is generally referred to as an imaging mass spectrometer (see Non-Patent Literature 1 and the like).
- An imaging mass spectrometer generally obtains mass spectrum data (including MS n spectrum data where n is equal to or larger than 2) over a predetermined mass-to-charge ratio (m/z) range for each measurement point on a sample. Then, when the user designates the mass-to-charge ratio of ions originating from a compound to be observed, the signal intensity at each measurement point at the mass-to-charge ratio designated is extracted. Then, a two-dimensional image (MS image) is obtained in which values of the signal intensity are visualized based on gray scale or color scale while being associated with the positions of the respective measurement points. The two-dimensional image is displayed on a screen of a display unit.
- MS image mass-to-charge ratio
- adipose tissue cells of animals such as mice and humans are known to store lipid droplets.
- the lipid droplets can be observed using an optical microscope, by applying hematoxylin-eosin (HE) staining to a sample such as a slice of biological tissue of such an animal.
- HE hematoxylin-eosin
- an example is considered where a slice of the liver of a mouse with a fatty liver is searched for a compound related to fat, which is the target.
- a mass-to-charge ratio value yielding an MS image with an image pattern similar to an HE stained image as a result of HE staining on the slice of biological tissue.
- reference image an image used to find an MS image with a predetermined image pattern in this manner will be referred to as a "reference image”.
- This reference image may simply be an optical microscopic image of a sample such as a slice of biological tissue, or may be a stained image as described above or a fluorescent microscopic image.
- the mass-to-charge ratio may be hereinafter referred to as "m/z" exhibiting a two-dimensional distribution with an image pattern similar to that of the reference image as described above
- m/z Total Ion Count or Total Ion Current
- This TIC is a result of integrating the signal intensity values in multiple mass spectra at all the measurement points within a measurement area, for each mass-to-charge ratio value.
- the peaks are selected in descending order of the signal intensity values, and the user visually determines the similarity between the MS image and the reference image in the image pattern at the m/z value corresponding to the selected peaks.
- the TIC spectrum generally includes multiple peaks originating from various compounds.
- the peaks are narrowed down to those with the signal intensity values being equal to or larger than a predetermined threshold, it takes quite a large amount of effort to generate the MS image and to check the image pattern. Furthermore, such work takes so much time, and thus is inefficient.
- a statistical analysis method has conventionally been proposed with which the m/z value yielding the MS image with an image pattern similar to that of the reference image is searched for automatically, that is, without relying on the human's decision.
- This method includes performing regression analysis using a pixel value of the reference image as an objective variable and the mass spectrum data at each measurement point as an explanatory variable. Then, the compound with a distribution similar to the image pattern of the reference image is found by selecting an m/z value having a large absolute value of the regression coefficient obtained as a result.
- Such a method is effective in extracting an accurate m/z value without relying on human labor, but also involves the following problems.
- Non Patent Literature 1 " iMScope TRIO Imaging Mass Microscope", [online], [accessed on June 5, 2017], Shimadzu Corporation, Internet ⁇ URL: http://www.an.shimadzu.co.jp /bio/imscope/>
- the present invention is made in view of the above problems, and an object of the present invention is to provide a data processing device for imaging mass spectrometric analysis enabling, in a search for a compound exhibiting a two-dimensional distribution similar to the image pattern of the reference image through statistical analysis processing and the like, ions originating from a wide variety of compounds to be obtained as candidates of the target compound with the influence of isotopes of the compounds eliminated.
- the present invention provides a data processing device for imaging mass spectrometric analysis that processes mass spectrum data obtained at a plurality of measurement points in a two-dimensional measurement area on a sample, the data processing device including:
- the data processing device for imaging mass spectrometric analysis can use the reference image that is obtained by various methods other than mass spectrometric analysis.
- the reference image may include observation images obtained with an electron microscope, an optical microscope, a fluorescence microscope, or the like; images obtained by Raman spectroscopy, measurement of emission intensity of electromagnetic waves having various wavelengths (terahertz range, far-infrared range, visible range, ultraviolet range, X-ray range, or the like), absorption measurement, or the like; and images obtained by various measurements and analyzes such as surface analysis by PET (Positron Emission Tomography) measurement, MRI (Magnetic Resonance Imaging) measurement, ESR (Electron Spin Resonance) measurement, CT (Computed Tomography) measurement, or EPMA (Electron Probe MicroAnalyser).
- the reference image information acquisition section reads data constituting an optical image obtained by capturing a stained sample with an optical microscope, for example.
- the analysis processor performs statistical analysis based on the mass spectrum data of each measurement point in the measurement area and the reference image data to calculate an index value related to similarity of image patterns of the MS image exhibiting the distribution of the signal intensity of ions having an m/z for each m/z value and the reference image.
- partial least-square regression analysis can be used as a statistical analysis method.
- PLS partial least-square regression analysis
- the mass-to-charge ratio value search section basically searches for m/z values exhibiting relatively large index values among the calculated index values, but excludes m/z values that provide smaller index values existing in a predetermined m/z range including one m/z value already selected, from the selection target of further m/z values. In other words, these m/z values are disregarded.
- the difference in m/z values between the peak of ions originating from a certain compound and its isotope peak on the mass spectrum is as small as about several Da.
- the isotope peak will be substantially within the m/z value range. Accordingly, with the process described above by the mass-to-charge ratio value search section, when the m/z value of ions originating from a certain compound is selected, subsequent selection of m/z values of ions originating from isotopes of the compound can be practically almost entirely avoided. That is, the m/z value originating from a certain compound and the m/z value originating from an isotope of the compound are rarely selected in duplicate.
- a plurality of consecutive mass-to-charge ratio ranges obtained by dividing an entire measurement mass-to-charge ratio range for each predetermined mass-to-charge ratio width may be defined, and when a mass-to-charge ratio value exhibiting a largest index value in one mass-to-charge ratio search range is selected within the range, the mass-to-charge ratio value search section may be configured to exclude other mass-to-charge ratio values included in the mass-to-charge ratio search range from the selection target.
- the mass-to-charge ratio value search section may be configured to select mass-to-charge ratio values exhibiting a largest index value in each of the plurality of mass-to-charge ratio search ranges, and thereafter select a mass-to-charge ratio value exhibiting an index value that is equal to or more than a predetermined threshold among the selected plurality of mass-to-charge ratio values.
- m/z values originating from an isotope are excluded, m/z values with index values that are equal to or more than a predetermined threshold, that is, m/z values that are assumed to have high similarity in distribution with the reference image can be selected.
- the mass-to-charge ratio value search section may be configured to select a plurality of mass-to-charge ratio values in descending order of index values in the entire mass-to-charge ratio range of the measurement target.
- the mass-to-charge ratio value search section may be configured to select one mass-to-charge ratio value, thereafter determine an exclusion range with same or different widths set in a decreasing direction and an increasing direction of the mass-to-charge ratio with respect to the one mass-to-charge ratio value, and exclude other mass-to-charge ratio values included in the exclusion range from the selection target.
- the mass-to-charge ratio search range is not predetermined, and the exclusion m/z range is determined according to the actually selected m/z value.
- the m/z value of the isotope peak cannot be excluded from the selection target.
- ions originating from one or more isotopes of a certain compound can be almost completely excluded from the selection target.
- the mass-to-charge ratio value search section can be configured to select a plurality of mass-to-charge ratio values in descending order of index values in the entire mass-to-charge ratio range of the measurement target. As a result, it is possible to efficiently select an ion candidate originating from a target compound having a distribution close to that of the reference image.
- the data processing device for imaging mass spectrometric analysis enables, in a search for a compound exhibiting a distribution similar to a reference image such as an optical microscope image, ions originating from a wide variety of compounds to be obtained with the influence of isotopes of the compounds substantially eliminated.
- a compound having a distribution close to that of the reference image can be found accurately and quickly.
- An embodiment of an imaging mass spectrometer including a data processing device for imaging mass spectrometric analysis according to the present invention is hereinafter described with reference to the attached drawings.
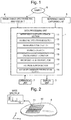
- Fig. 1 is a schematic configuration diagram of an imaging mass spectrometer according to the present embodiment.
- Fig. 2 is a conceptual diagram of a measurement area on a sample measured by an imaging mass spectrometric analysis unit in the imaging mass spectrometer according to the present embodiment.
- the imaging mass spectrometer includes an imaging mass spectrometric analysis unit 4, a reference image capturing unit 5, a data processing unit 1, an operation unit 2, and a display unit 3.
- the operation unit 2 and the display unit 3 serve as user interfaces.
- the imaging mass spectrometric analysis unit 4 includes, for example, a matrix assisted laser desorption/ionization ion trap time-of-flight mass spectrometer (MALDI-IT-TOFMS), and can acquire mass spectrum data on each of multiple measurement points (micro areas) within a two-dimensional measurement area on a sample 6 such as a slice of biological tissue.
- This mass spectrum data also includes MS n spectrum data, where n is equal to or larger than 2.
- the reference image capturing unit 5 is an optical microscope, a fluorescence microscope, a phase contrast microscope, or the like, and acquires reference images such as an optical microscope image, a stained image, a fluorescence image, a phase contrast microscope image, or the like in a range including at least the measurement area on the sample 6.
- reference images two-dimensional images of the sample obtained by various other measurement methods can be used.
- the data processing unit 1 receives mass spectrum data at each measurement point collected by the imaging mass spectrometric analysis unit 4 and reference image data obtained by the imaging by the reference image capturing unit 5 and performs a predetermined process.
- the data processing unit 1 includes functional blocks such as a reference image data storage section 11, an MS imaging data storage section 12, a reference image creator 13, an MS image creator 14, a calculation data creator 15, a regression analysis executor 16, an m/z value search section 17, and an m/z value candidate presentation section 18.
- the substance of the data processing unit 1 is a personal computer (or a higher performance workstation).
- the data processing unit 1 can be configured such that the functions of the above blocks are achieved by operating dedicated software installed in the computer on the computer.
- the operation unit 2 is a pointing device such as a keyboard or a mouse
- the display unit 3 is a display monitor.
- the imaging mass spectrometric analysis unit 4 when a measurement area 60 is set on a biological sample 6 such as a mouse liver slice, the imaging mass spectrometric analysis unit 4 performs mass spectrometric analysis (or MS n analysis) for each of a large number of measurement points 61 within the range of the measurement area 60 and acquires mass spectrum data over a predetermined m/z range. As a result, a set of mass spectrum data corresponding to the number of measurement points 61 in the measurement area 60 (hereinafter referred to as "MS imaging data”) is obtained, and this data is input from the imaging mass spectrometric analysis unit 4 to the data processing unit 1 and stored in the MS imaging data storage section 12.
- MS imaging data a set of mass spectrum data corresponding to the number of measurement points 61 in the measurement area 60
- the reference image capturing unit 5 captures, for example, a stained image of the same sample 6. It should be noted that the capturing range of the stained image obtained in this process does not have to match the measurement area 60, but includes the measurement area 60.
- the reference image data storage section 11 reads and stores reference image data forming the reference image obtained by the reference image capturing unit 5.
- Fig. 3 is a flowchart illustrating the procedure of this m/z value search process
- Figs. 4A-4F are conceptual diagrams for explaining this m/z value search process.
- the calculation data creator 15 reads the reference image data used for the process from the reference image data storage section 11 (step S1).
- the reference image creator 13 may create a reference image from the read reference image data and display the reference image on the screen of the display unit 3.
- the calculation data creator 15 reads the mass spectrum data of each measurement point 61 in the measurement area 60, which is used for the process, from the MS imaging data storage section 12 (step S2).
- the calculation data creator 15 creates calculation data in the form of a matrix of pixel value data of each pixel in the reference image corresponding to each measurement point 61 in the measurement area 60 and the mass spectrum data for each measurement point 61 (step S3).
- the capturing range of the reference image is wider than the measurement area 60, only the portion corresponding to the measurement area 60 in the reference image is cut and used.
- the size of the pixels of the reference image is usually different from that of the measurement point 61 on which the mass spectrometric analysis is performed, and in most cases, the pixels are much smaller than the measurement point 61.
- the matrix based on the pixel value data in the reference image is a one-dimensional matrix Y in which the pixel values y 1 , y 2 , ..., y n for each measurement point 61 are arranged.
- the matrix based on the mass spectrum data for each measurement point is a two-dimensional matrix X in which signal intensity values (peak intensity values) x 11 , x 12 , ..., x 1m , x 21 , x 22 , ..., x 2m , ..., x n1 , x n2 , ..., x nm for each measurement point and each m/z value are arranged two-dimensionally.
- the regression analysis executor 16 executes operation of partial least-square regression analysis (PLS) widely known, using the two-dimensional matrix X of the signal intensity values based on the mass spectrum data created in step S3 as an explanatory variable (input variable) and the one-dimensional matrix Y of the pixel values based on the reference image data created in step S3 as an objective variable (output variable). A regression coefficient matrix is thus calculated (step S4).
- PLS partial least-square regression analysis
- this regression coefficient matrix is m, and this is a one-dimensional matrix in which regression coefficients for respective m/z values are arranged.
- the value of each regression coefficient indicates the degree of similarity of the image pattern (two-dimensional distribution status) for each m/z value between the reference image and the MS image, using the pixel values in the reference image as teacher data.
- the m/z value having a regression coefficient with a large absolute value is the m/z at which an MS image having an image pattern similar to the reference image is obtained.
- this m/z can be considered as the m/z of ions originating from a compound having a distribution similar to the image pattern of the reference image.
- the imaging mass spectrometer of the present embodiment performs the following characteristic process so as to eliminate isotopes as much as possible in selecting a significant m/z value from the regression coefficient matrix.
- a plurality of (N) consecutive search m/z ranges are defined in advance obtained by dividing the entire measurement m/z range for each predetermined m/z width ⁇ M.
- the m/z width ⁇ M can be determined as appropriate, such as 10 Da.
- the m/z value search section 17 searches each predetermined search m/z range as described above for the m/z value having a regression coefficient with the maximum absolute value, and determines the value of the regression coefficient and the m/z value to be representative values of the search m/z range. Through this process, N representative values are obtained (step S5).
- each element that is, regression coefficient in the regression coefficient matrix is indicated by a circle.
- the position of each circle on the m/z axis represents the m/z value corresponding to the regression coefficient.
- the elements indicated by circles in Fig. 4C remain after the elements whose regression coefficients are not maximum (elements that are crossed out) are excluded. If there is only one element in a certain search m/z range, this element necessarily serves as a representative value.
- the m/z value search section 17 selects the m/z values of the representative values having regression coefficients with absolute values that are equal to or more than a threshold among the N representative values obtained in step S5 (step S6).
- the m/z values of the representative values that satisfy another appropriate condition may be selected, instead of the condition involving regression coefficients with absolute values that are equal to or more than the threshold.
- a predetermined number of representative values may be selected in descending order of the absolute values of the regression coefficients, and the m/z value of the representative values may be calculated.
- m/z values that do not satisfy a set condition are excluded, and the m/z value is selected that has the regression coefficient with the maximum absolute value in each search m/z range and satisfies the set condition.
- the m/z value candidate presentation section 18 creates an m/z value candidate list listing all m/z values selected in step S6, and displays the list on the screen of the display unit 3 (step S7).
- the user confirms this and, for example, selects and designates one m/z value candidate using the operation unit 2.
- the MS image creator 14 extracts the signal intensity value of the designated m/z value from the mass spectrum data at each measurement point 61 in the measurement area 60, creates an MS image, and causes the screen of the display unit 3 to display the image.
- This allows the user to confirm, on the screen, the MS image of the m/z value candidate with an image pattern estimated to be similar to that of the reference image. In this stage, the reference image may be displayed together. Through such confirmation, the user can find an appropriate m/z value candidate and estimate a target compound from the m/z value.
- imaging mass spectrometer including a data processing device for imaging mass spectrometric analysis according to the present invention.
- the configuration of the imaging mass spectrometer of this embodiment is the same as the configuration of the imaging mass spectrometer of the above embodiment illustrated in Fig. 1 , and the description thereof will be omitted.
- Fig. 5 is a flowchart of a m/z value search process in the imaging mass spectrometer of this embodiment
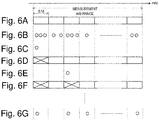
- Figs. 6A-6G are conceptual diagrams for explaining the m/z value search process.
- the process in steps S1 to S4 that is, the process until the regression coefficient matrix is calculated through PLS is exactly the same as that in the above embodiment, and only a process of searching for an appropriate m/z value from the regression coefficient matrix, performed by the m/z value search section 17, is different from that in the above embodiment.
- this point will be described in detail below.
- a plurality of consecutive search m/z ranges are defined in advance obtained by dividing the measurement m/z range for each predetermined m/z width ⁇ M as in the above embodiment.
- the m/z value search section 17 first searches the entire measurement m/z range for the regression coefficient with the maximum absolute value, and selects the m/z value corresponding to this regression coefficient (step S15). Now, assuming that the elements in the regression coefficient matrix exist as illustrated in Fig. 6B , the result of searching for the maximum regression coefficient among them is illustrated in Fig. 6C .
- the m/z value search section 17 excludes the search m/z value range including the only m/z value selected in step S15, and sets a new measurement m/z range (step S16). That is, in the example of Fig. 6C , since the m/z value corresponding to one element indicated by a circle is selected, one search m/z range that is crossed out in Fig. 6D is excluded from the measurement m/z range, and a new measurement m/z range is set. Then, in the measurement m/z range from which the one or more search m/z ranges are excluded, the largest regression coefficient is searched for and the m/z value corresponding to this regression coefficient is selected (step S 17).
- the ending condition may be selection of a predetermined number of m/z values or the elapse of a predetermined time from the start of the process.
- the ending condition may be that the maximum regression coefficient at that time is below a predetermined threshold. In this way, various ending conditions can be considered.
- step S18 the process in steps S16 to S18 is repeated until it is determined in step S18 that the ending condition is satisfied. For example, when the process returns to step S16 after the one indicated by a circle illustrated in Fig. 6E is selected, as illustrated in Fig. 6F , the search m/z value range including the newly selected m/z value is excluded from the measurement m/z range. Thus, as in the above embodiment, at most one m/z value can be selected within one search m/z range. If there is any m/z value originating from an isotope exists within the search m/z range including the m/z value already selected, selection of this value will be avoided.
- the imaging mass spectrometer of this embodiment also selects at most one m/z value having a relatively large regression coefficient in each search m/z range as illustrated in Fig. 6G .
- the m/z value candidate presentation section 18 creates an m/z value candidate list listing m/z values selected in step S15 and multiple steps S17, and displays the list on the screen of the display unit 3 (step S19).
- imaging mass spectrometer including a data processing device for imaging mass spectrometric analysis according to the present invention.
- the configuration of the imaging mass spectrometer of this embodiment is also the same as the configuration of the imaging mass spectrometer of the above embodiment illustrated in Fig. 1 , and the description thereof will be omitted.
- Fig. 7 is a flowchart of a m/z value search process in the imaging mass spectrometer of this embodiment
- Figs. 8A-8G are conceptual diagrams for explaining the m/z value search process.
- the process in steps S1 to S4 that is, the process until the regression coefficient matrix is calculated through PLS is exactly the same as that in the above embodiment, and only a process of searching for an appropriate m/z value from the regression coefficient matrix, performed by the m/z value search section 17, is different from that in the above embodiment.
- this point will be described in detail below.
- the m/z value search section 17 first searches a given measurement m/z range for the regression coefficient with the maximum absolute value, and selects the m/z value corresponding to this regression coefficient (step S25). Now, among the regression coefficients illustrated in Fig. 8B , the result of searching for the maximum regression coefficient is illustrated in Fig. 8C .
- the m/z value search section 17 defines an exclusion m/z range having a predetermined width before and after the one m/z value selected in step S25. Specifically, an m/z width ⁇ Ma in the direction in which m/z decreases and an m/z width ⁇ Mb (may be the same as ⁇ Ma) in the direction in which m/z increases are set, and once a selected m/z value M1 is determined, the range of M1- ⁇ Ma to M1+ ⁇ Mb is set as the exclusion m/z range. It is desirable to determine ⁇ Ma and ⁇ Mb so that isotopes of one compound are contained as much as possible while these widths are as small as possible. Once the exclusion m/z range is determined, the measurement m/z range excluding the exclusion m/z range is set as a new measurement m/z range (step S26).
- the exclusion m/z range indicated by ⁇ P in Fig. 8D can be defined based on the m/z value corresponding to one regression coefficient illustrated in Fig. 8C .
- the m/z value search section 17 searches the measurement m/z range from which the one or more exclusion m/z ranges are excluded, for the regression coefficient with the maximum absolute value and selects the m/z value corresponding to this regression coefficient (step S27).
- the m/z value corresponding to this regression coefficient will not be selected.
- step S28 it is determined whether a predetermined ending condition is satisfied (step S28), and if not, the process returns from step S28 to step S26.
- the ending condition in this process is the same as the ending condition in step S18 described above.
- step S28 the process in steps S26 to S28 is repeated until it is determined in step S28 that the ending condition is satisfied. For example, when the process returns to step S26 after the one indicated by a circle illustrated in Fig. 8E is selected, as illustrated in Fig. 8F , the exclusion m/z range including the newly selected m/z value is excluded from the measurement m/z range. Thus, even if any ion peak originating from an isotope exists in the vicinity of the m/z value already selected on the mass spectrum, the m/z value of this ion peak will not be selected.
- the imaging mass spectrometers of any of the above embodiments while selection of the m/z value of ions originating from an isotope of a certain compound as a candidate is avoided, the m/z value of ions originating from the compound exhibiting a two-dimensional distribution similar to the image pattern of the reference image can be accurately selected as an m/z value candidate. That is, it is possible to avoid selection of the m/z value of ions originating from one compound and the m/z value of ions originating from an isotope of the same compound in duplicate.
Landscapes
- Chemical & Material Sciences (AREA)
- Analytical Chemistry (AREA)
- Physics & Mathematics (AREA)
- Spectroscopy & Molecular Physics (AREA)
- Health & Medical Sciences (AREA)
- Electrochemistry (AREA)
- Chemical Kinetics & Catalysis (AREA)
- Life Sciences & Earth Sciences (AREA)
- Biochemistry (AREA)
- General Health & Medical Sciences (AREA)
- General Physics & Mathematics (AREA)
- Immunology (AREA)
- Pathology (AREA)
- Other Investigation Or Analysis Of Materials By Electrical Means (AREA)
Abstract
Description
- The present invention relates to a data processing device for processing mass spectrum data acquired by an imaging mass spectrometer capable of acquiring mass spectrum data for each of multiple measurement points in a measurement area on a sample.
- Mass spectrometric imaging is a method of performing mass spectrometric analysis on each of a plurality of measurement points (micro areas) in a two-dimensional measurement area on a sample such as a slice of biological tissue to examine a spatial distribution of matters having a certain mass. The method has been proactively applied to drug discovery, biomarker search, and investigation for the cause of various diseases/illnesses. A mass spectrometer for performing the mass spectrometric analysis imaging is generally referred to as an imaging mass spectrometer (see Non-Patent
Literature 1 and the like). - An imaging mass spectrometer generally obtains mass spectrum data (including MSn spectrum data where n is equal to or larger than 2) over a predetermined mass-to-charge ratio (m/z) range for each measurement point on a sample. Then, when the user designates the mass-to-charge ratio of ions originating from a compound to be observed, the signal intensity at each measurement point at the mass-to-charge ratio designated is extracted. Then, a two-dimensional image (MS image) is obtained in which values of the signal intensity are visualized based on gray scale or color scale while being associated with the positions of the respective measurement points. The two-dimensional image is displayed on a screen of a display unit.
- In recent years, such imaging mass spectrometers have been actively used for observing a two-dimensional distribution of a certain compound in a sample cut out from a biological tissue, in researches involving analysis such as pharmacokinetic analysis, metabolic pathway analysis, and molecular correlation analysis. In such an analysis, the target compound to be observed is determined, and the two-dimensional distribution of the compound can be visualized by a method such as vital staining in not a few cases (see
Patent Literature 1 and the like). - For example, adipose tissue cells of animals such as mice and humans are known to store lipid droplets. The lipid droplets can be observed using an optical microscope, by applying hematoxylin-eosin (HE) staining to a sample such as a slice of biological tissue of such an animal. In this context, an example is considered where a slice of the liver of a mouse with a fatty liver is searched for a compound related to fat, which is the target. In such a case, what needs to be searched is a mass-to-charge ratio value yielding an MS image with an image pattern similar to an HE stained image as a result of HE staining on the slice of biological tissue. Hereinafter, an image used to find an MS image with a predetermined image pattern in this manner will be referred to as a "reference image". This reference image may simply be an optical microscopic image of a sample such as a slice of biological tissue, or may be a stained image as described above or a fluorescent microscopic image.
- As a general procedure for searching for the mass-to-charge ratio value (the mass-to-charge ratio may be hereinafter referred to as "m/z") exhibiting a two-dimensional distribution with an image pattern similar to that of the reference image as described above, first of all, a Total Ion Count or Total Ion Current (TIC) spectrum is generated. This TIC is a result of integrating the signal intensity values in multiple mass spectra at all the measurement points within a measurement area, for each mass-to-charge ratio value. Then, in the TIC spectrum, the peaks are selected in descending order of the signal intensity values, and the user visually determines the similarity between the MS image and the reference image in the image pattern at the m/z value corresponding to the selected peaks.
- Unfortunately, the TIC spectrum generally includes multiple peaks originating from various compounds. Thus, even when the peaks are narrowed down to those with the signal intensity values being equal to or larger than a predetermined threshold, it takes quite a large amount of effort to generate the MS image and to check the image pattern. Furthermore, such work takes so much time, and thus is inefficient.
- In view of this, a statistical analysis method has conventionally been proposed with which the m/z value yielding the MS image with an image pattern similar to that of the reference image is searched for automatically, that is, without relying on the human's decision. This method, for example, includes performing regression analysis using a pixel value of the reference image as an objective variable and the mass spectrum data at each measurement point as an explanatory variable. Then, the compound with a distribution similar to the image pattern of the reference image is found by selecting an m/z value having a large absolute value of the regression coefficient obtained as a result.
- Such a method is effective in extracting an accurate m/z value without relying on human labor, but also involves the following problems.
- Specifically, many compounds contained in biological samples have isotopes. Measurement on a sample containing many kinds of compounds with isotopes using an imaging mass spectrometer to obtain the TIC spectrum as described above results in many isotope peaks monitored in the TIC spectrum. Since isotope peaks originating from the same compound exhibit similar spatial distributions, obtaining candidates of the m/z value with the method described above may only end up in the m/z value(s) of the isotope peak(s) originating from one or a few compounds selected all the time. The isotope peaks originating from one compound are different from each other in the m/z value but correspond to the same compound. Thus, fewer compounds are extracted, which may result in a search result failing to include alternative compounds exhibiting a distribution similar to that of the reference image. In addition, it is a waste of time for the user to check the two-dimensional distributions of a plurality of matters that are substantially the same compound.
-
- Patent Literature 1:
WO 2017/002226 A (paragraph [0037]) - Patent Literature 2:
JP 2009-25275 A - Non Patent Literature 1: "iMScope TRIO Imaging Mass Microscope", [online], [accessed on June 5, 2017], Shimadzu Corporation, Internet <URL: http://www.an.shimadzu.co.jp /bio/imscope/>
- The present invention is made in view of the above problems, and an object of the present invention is to provide a data processing device for imaging mass spectrometric analysis enabling, in a search for a compound exhibiting a two-dimensional distribution similar to the image pattern of the reference image through statistical analysis processing and the like, ions originating from a wide variety of compounds to be obtained as candidates of the target compound with the influence of isotopes of the compounds eliminated.
- To achieve the object described above, the present invention provides a data processing device for imaging mass spectrometric analysis that processes mass spectrum data obtained at a plurality of measurement points in a two-dimensional measurement area on a sample, the data processing device including:
- a) a reference image information acquisition section that acquires reference image data forming a reference image for the measurement area;
- b) an analysis processor that calculates, for each mass-to-charge ratio, an index value related to similarity of an image pattern of an MS image exhibiting a distribution of a signal intensity of ions having the mass-to-charge ratio and the reference image, through statistical analysis based on the mass spectrum data of each measurement point in the measurement area and the reference image data acquired by the reference image information acquisition section; and
- c) a mass-to-charge ratio value search section that searches for and selects a mass-to-charge ratio exhibiting a relatively large index value among index values for respective mass-to-charge ratios obtained by the analysis processor, and excludes, from a selection target, a mass-to-charge ratio value existing in a predetermined mass-to-charge ratio range including one mass-to-charge ratio value already selected, the mass-to-charge ratio value exhibiting an index value smaller than an index value corresponding to the mass-to-charge ratio value.
- The data processing device for imaging mass spectrometric analysis according to the present invention can use the reference image that is obtained by various methods other than mass spectrometric analysis. Examples of the reference image may include observation images obtained with an electron microscope, an optical microscope, a fluorescence microscope, or the like; images obtained by Raman spectroscopy, measurement of emission intensity of electromagnetic waves having various wavelengths (terahertz range, far-infrared range, visible range, ultraviolet range, X-ray range, or the like), absorption measurement, or the like; and images obtained by various measurements and analyzes such as surface analysis by PET (Positron Emission Tomography) measurement, MRI (Magnetic Resonance Imaging) measurement, ESR (Electron Spin Resonance) measurement, CT (Computed Tomography) measurement, or EPMA (Electron Probe MicroAnalyser).
- In the data processing device for imaging mass spectrometric analysis according to the present invention, the reference image information acquisition section reads data constituting an optical image obtained by capturing a stained sample with an optical microscope, for example. The analysis processor performs statistical analysis based on the mass spectrum data of each measurement point in the measurement area and the reference image data to calculate an index value related to similarity of image patterns of the MS image exhibiting the distribution of the signal intensity of ions having an m/z for each m/z value and the reference image.
- Specifically, for example, partial least-square regression analysis (PLS) can be used as a statistical analysis method. In this case, through regression analysis using the mass spectrum data at each measurement point as an explanatory variable and the pixel value of each pixel in the reference image corresponding to each measurement point as an objective variable, the regression coefficient for each m/z value can be obtained as the index value.
- If the index value such as the regression coefficient is large (in a strict sense, if the absolute value of the regression coefficient is large since the regression coefficient can be negative), the two-dimensional distribution of the m/z value providing this regression coefficient should be close to the image pattern of the reference image. However, as described above, if an m/z value having a large index value described above is simply selected, ions originating from an isotope of the same compound will also be selected. To address this, the mass-to-charge ratio value search section basically searches for m/z values exhibiting relatively large index values among the calculated index values, but excludes m/z values that provide smaller index values existing in a predetermined m/z range including one m/z value already selected, from the selection target of further m/z values. In other words, these m/z values are disregarded.
- In general, the difference in m/z values between the peak of ions originating from a certain compound and its isotope peak on the mass spectrum is as small as about several Da. Thus, if the m/z range with respect to the peak originating from one compound molecule is determined as appropriate, the isotope peak will be substantially within the m/z value range. Accordingly, with the process described above by the mass-to-charge ratio value search section, when the m/z value of ions originating from a certain compound is selected, subsequent selection of m/z values of ions originating from isotopes of the compound can be practically almost entirely avoided. That is, the m/z value originating from a certain compound and the m/z value originating from an isotope of the compound are rarely selected in duplicate.
- In a first aspect of the data processing device for imaging mass spectrometric analysis according to the present invention, a plurality of consecutive mass-to-charge ratio ranges obtained by dividing an entire measurement mass-to-charge ratio range for each predetermined mass-to-charge ratio width may be defined, and when a mass-to-charge ratio value exhibiting a largest index value in one mass-to-charge ratio search range is selected within the range, the mass-to-charge ratio value search section may be configured to exclude other mass-to-charge ratio values included in the mass-to-charge ratio search range from the selection target.
- With this configuration, it is only necessary to perform the process of excluding a predetermined mass-to-charge ratio search range as a unit from the selection target of m/z values. In this manner, it is easy to perform this process of excluding such m/z range.
- In the first aspect described above, the mass-to-charge ratio value search section may be configured to select mass-to-charge ratio values exhibiting a largest index value in each of the plurality of mass-to-charge ratio search ranges, and thereafter select a mass-to-charge ratio value exhibiting an index value that is equal to or more than a predetermined threshold among the selected plurality of mass-to-charge ratio values.
- In this configuration, while m/z values originating from an isotope are excluded, m/z values with index values that are equal to or more than a predetermined threshold, that is, m/z values that are assumed to have high similarity in distribution with the reference image can be selected.
- Furthermore, in the first aspect, the mass-to-charge ratio value search section may be configured to select a plurality of mass-to-charge ratio values in descending order of index values in the entire mass-to-charge ratio range of the measurement target.
- With this configuration, while m/z values originating from an isotope are excluded, appropriate m/z values can be selected in descending order of index values, that is, in descending order of possibility of similarity in distribution with the reference image. Thus, it is possible to efficiently select an ion candidate originating from a target compound having a distribution close to that of the reference image.
- In a second aspect of the data processing device for imaging mass spectrometric analysis according to the present invention, the mass-to-charge ratio value search section may be configured to select one mass-to-charge ratio value, thereafter determine an exclusion range with same or different widths set in a decreasing direction and an increasing direction of the mass-to-charge ratio with respect to the one mass-to-charge ratio value, and exclude other mass-to-charge ratio values included in the exclusion range from the selection target.
- In this configuration, unlike the first aspect, the mass-to-charge ratio search range is not predetermined, and the exclusion m/z range is determined according to the actually selected m/z value. In the first aspect, in the case where a peak originating from one compound molecule and its isotope peak exist across adjacent mass-to-charge ratio search ranges on the mass spectrum, the m/z value of the isotope peak cannot be excluded from the selection target. By contrast, in the second aspect, ions originating from one or more isotopes of a certain compound can be almost completely excluded from the selection target.
- Note that, also in this configuration, as in the first aspect, the mass-to-charge ratio value search section can be configured to select a plurality of mass-to-charge ratio values in descending order of index values in the entire mass-to-charge ratio range of the measurement target. As a result, it is possible to efficiently select an ion candidate originating from a target compound having a distribution close to that of the reference image.
- The data processing device for imaging mass spectrometric analysis according to the present invention enables, in a search for a compound exhibiting a distribution similar to a reference image such as an optical microscope image, ions originating from a wide variety of compounds to be obtained with the influence of isotopes of the compounds substantially eliminated. Thus, a compound having a distribution close to that of the reference image can be found accurately and quickly.
-
-
Fig. 1 is a schematic configuration diagram of an embodiment of an imaging mass spectrometer including a data processing device for imaging mass spectrometric analysis according to the present invention. -
Fig. 2 is a conceptual diagram of a measurement area on a sample measured by an imaging mass spectrometric analysis unit in the imaging mass spectrometer according to the present embodiment. -
Fig. 3 is a flowchart of a characteristic m/z value search process in the imaging mass spectrometer according to the present embodiment. -
Figs. 4A-4F are conceptual diagrams for explaining the m/z value search process illustrated inFig. 3 . -
Fig. 5 is a flowchart of an m/z value search process in another embodiment of an imaging mass spectrometer including a data processing device for imaging mass spectrometric analysis according to the present invention. -
Figs. 6A-6G are conceptual diagrams for explaining the m/z value search process illustrated inFig. 5 . -
Fig. 7 is a flowchart of an m/z value search process in still another embodiment of an imaging mass spectrometer including a data processing device for imaging mass spectrometric analysis according to the present invention. -
Figs. 8A-8G are conceptual diagrams for explaining the m/z value search process illustrated inFig. 7 . - An embodiment of an imaging mass spectrometer including a data processing device for imaging mass spectrometric analysis according to the present invention is hereinafter described with reference to the attached drawings.
-
Fig. 1 is a schematic configuration diagram of an imaging mass spectrometer according to the present embodiment.Fig. 2 is a conceptual diagram of a measurement area on a sample measured by an imaging mass spectrometric analysis unit in the imaging mass spectrometer according to the present embodiment. - The imaging mass spectrometer according to the present embodiment includes an imaging mass
spectrometric analysis unit 4, a referenceimage capturing unit 5, adata processing unit 1, anoperation unit 2, and adisplay unit 3. Theoperation unit 2 and thedisplay unit 3 serve as user interfaces. - The imaging mass
spectrometric analysis unit 4 includes, for example, a matrix assisted laser desorption/ionization ion trap time-of-flight mass spectrometer (MALDI-IT-TOFMS), and can acquire mass spectrum data on each of multiple measurement points (micro areas) within a two-dimensional measurement area on asample 6 such as a slice of biological tissue. This mass spectrum data also includes MSn spectrum data, where n is equal to or larger than 2. On the other hand, the referenceimage capturing unit 5 is an optical microscope, a fluorescence microscope, a phase contrast microscope, or the like, and acquires reference images such as an optical microscope image, a stained image, a fluorescence image, a phase contrast microscope image, or the like in a range including at least the measurement area on thesample 6. Of course, as the reference images, two-dimensional images of the sample obtained by various other measurement methods can be used. - The
data processing unit 1 receives mass spectrum data at each measurement point collected by the imaging massspectrometric analysis unit 4 and reference image data obtained by the imaging by the referenceimage capturing unit 5 and performs a predetermined process. Thedata processing unit 1 includes functional blocks such as a reference imagedata storage section 11, an MS imagingdata storage section 12, areference image creator 13, anMS image creator 14, acalculation data creator 15, aregression analysis executor 16, an m/zvalue search section 17, and an m/z valuecandidate presentation section 18. - In general, the substance of the
data processing unit 1 is a personal computer (or a higher performance workstation). Thedata processing unit 1 can be configured such that the functions of the above blocks are achieved by operating dedicated software installed in the computer on the computer. In this case, theoperation unit 2 is a pointing device such as a keyboard or a mouse, and thedisplay unit 3 is a display monitor. - As illustrated in
Fig. 2 , in the imaging mass spectrometer of the present embodiment, when ameasurement area 60 is set on abiological sample 6 such as a mouse liver slice, the imaging massspectrometric analysis unit 4 performs mass spectrometric analysis (or MSn analysis) for each of a large number of measurement points 61 within the range of themeasurement area 60 and acquires mass spectrum data over a predetermined m/z range. As a result, a set of mass spectrum data corresponding to the number of measurement points 61 in the measurement area 60 (hereinafter referred to as "MS imaging data") is obtained, and this data is input from the imaging massspectrometric analysis unit 4 to thedata processing unit 1 and stored in the MS imagingdata storage section 12. - The reference
image capturing unit 5 captures, for example, a stained image of thesame sample 6. It should be noted that the capturing range of the stained image obtained in this process does not have to match themeasurement area 60, but includes themeasurement area 60. The reference imagedata storage section 11 reads and stores reference image data forming the reference image obtained by the referenceimage capturing unit 5. - As described above, the characteristic m/z value search process performed by the
data processing unit 1 in the state where the MS imaging data is stored in the MS imagingdata storage section 12 and the reference image data is stored in the reference imagedata storage section 11 will be described with reference toFigs. 3 and4 .Fig. 3 is a flowchart illustrating the procedure of this m/z value search process, andFigs. 4A-4F are conceptual diagrams for explaining this m/z value search process. - When the process is started, the
calculation data creator 15 reads the reference image data used for the process from the reference image data storage section 11 (step S1). In this process, thereference image creator 13 may create a reference image from the read reference image data and display the reference image on the screen of thedisplay unit 3. Furthermore, thecalculation data creator 15 reads the mass spectrum data of eachmeasurement point 61 in themeasurement area 60, which is used for the process, from the MS imaging data storage section 12 (step S2). - The
calculation data creator 15 creates calculation data in the form of a matrix of pixel value data of each pixel in the reference image corresponding to eachmeasurement point 61 in themeasurement area 60 and the mass spectrum data for each measurement point 61 (step S3). As described above, when the capturing range of the reference image is wider than themeasurement area 60, only the portion corresponding to themeasurement area 60 in the reference image is cut and used. The size of the pixels of the reference image is usually different from that of themeasurement point 61 on which the mass spectrometric analysis is performed, and in most cases, the pixels are much smaller than themeasurement point 61. For this reason, it is preferable to perform a correction process or the like using pixel values of a plurality of pixels corresponding to onemeasurement point 61 to obtain a pixel value corresponding to this measurement point. Note that such data conversion process itself is known, and the method disclosed in, for example,Patent Literature 2 can be used. The matrix based on the pixel value data in the reference image is a one-dimensional matrix Y in which the pixel values y1, y2, ..., yn for eachmeasurement point 61 are arranged. Furthermore, the matrix based on the mass spectrum data for each measurement point is a two-dimensional matrix X in which signal intensity values (peak intensity values) x11, x12, ..., x1m, x21, x22, ..., x2m, ..., xn1, xn2, ..., xnm for each measurement point and each m/z value are arranged two-dimensionally. - The
regression analysis executor 16 executes operation of partial least-square regression analysis (PLS) widely known, using the two-dimensional matrix X of the signal intensity values based on the mass spectrum data created in step S3 as an explanatory variable (input variable) and the one-dimensional matrix Y of the pixel values based on the reference image data created in step S3 as an objective variable (output variable). A regression coefficient matrix is thus calculated (step S4). - The number of elements of this regression coefficient matrix is m, and this is a one-dimensional matrix in which regression coefficients for respective m/z values are arranged. The value of each regression coefficient indicates the degree of similarity of the image pattern (two-dimensional distribution status) for each m/z value between the reference image and the MS image, using the pixel values in the reference image as teacher data. Thus, the m/z value having a regression coefficient with a large absolute value is the m/z at which an MS image having an image pattern similar to the reference image is obtained. For example, if an m/z value having a regression coefficient equal to or more than a certain threshold is selected in the regression coefficient matrix, this m/z can be considered as the m/z of ions originating from a compound having a distribution similar to the image pattern of the reference image.
- However, the m/z of ions originating from one compound and the m/z of ions originating from an isotope of the compound are different, and if multiple m/z values are selected, the same compound will be disadvantageously selected substantially in duplicate. To address this, the imaging mass spectrometer of the present embodiment performs the following characteristic process so as to eliminate isotopes as much as possible in selecting a significant m/z value from the regression coefficient matrix.
- Here, as illustrated in
Fig. 4A , a plurality of (N) consecutive search m/z ranges are defined in advance obtained by dividing the entire measurement m/z range for each predetermined m/z width ΔM. The m/z width ΔM can be determined as appropriate, such as 10 Da. The m/zvalue search section 17 searches each predetermined search m/z range as described above for the m/z value having a regression coefficient with the maximum absolute value, and determines the value of the regression coefficient and the m/z value to be representative values of the search m/z range. Through this process, N representative values are obtained (step S5). - Now, in
Fig. 4B with the horizontal axis being the m/z axis, each element (that is, regression coefficient) in the regression coefficient matrix is indicated by a circle. In other words, the position of each circle on the m/z axis represents the m/z value corresponding to the regression coefficient. As illustrated inFig. 4C , in each search m/z range, the elements indicated by circles inFig. 4C remain after the elements whose regression coefficients are not maximum (elements that are crossed out) are excluded. If there is only one element in a certain search m/z range, this element necessarily serves as a representative value. - Next, the m/z
value search section 17 selects the m/z values of the representative values having regression coefficients with absolute values that are equal to or more than a threshold among the N representative values obtained in step S5 (step S6). Alternatively, the m/z values of the representative values that satisfy another appropriate condition may be selected, instead of the condition involving regression coefficients with absolute values that are equal to or more than the threshold. For example, a predetermined number of representative values may be selected in descending order of the absolute values of the regression coefficients, and the m/z value of the representative values may be calculated. As a result, as illustrated inFig. 4E , m/z values that do not satisfy a set condition are excluded, and the m/z value is selected that has the regression coefficient with the maximum absolute value in each search m/z range and satisfies the set condition. - The m/z value
candidate presentation section 18 creates an m/z value candidate list listing all m/z values selected in step S6, and displays the list on the screen of the display unit 3 (step S7). The user confirms this and, for example, selects and designates one m/z value candidate using theoperation unit 2. Then, in response to this designation, theMS image creator 14 extracts the signal intensity value of the designated m/z value from the mass spectrum data at eachmeasurement point 61 in themeasurement area 60, creates an MS image, and causes the screen of thedisplay unit 3 to display the image. This allows the user to confirm, on the screen, the MS image of the m/z value candidate with an image pattern estimated to be similar to that of the reference image. In this stage, the reference image may be displayed together. Through such confirmation, the user can find an appropriate m/z value candidate and estimate a target compound from the m/z value. - Next, another embodiment of an imaging mass spectrometer including a data processing device for imaging mass spectrometric analysis according to the present invention will be described. The configuration of the imaging mass spectrometer of this embodiment is the same as the configuration of the imaging mass spectrometer of the above embodiment illustrated in
Fig. 1 , and the description thereof will be omitted. -
Fig. 5 is a flowchart of a m/z value search process in the imaging mass spectrometer of this embodiment, andFigs. 6A-6G are conceptual diagrams for explaining the m/z value search process. As illustrated inFig. 5 , the process in steps S1 to S4, that is, the process until the regression coefficient matrix is calculated through PLS is exactly the same as that in the above embodiment, and only a process of searching for an appropriate m/z value from the regression coefficient matrix, performed by the m/zvalue search section 17, is different from that in the above embodiment. Thus, this point will be described in detail below. - As illustrated in
Fig. 6A , a plurality of consecutive search m/z ranges are defined in advance obtained by dividing the measurement m/z range for each predetermined m/z width ΔM as in the above embodiment. The m/zvalue search section 17 first searches the entire measurement m/z range for the regression coefficient with the maximum absolute value, and selects the m/z value corresponding to this regression coefficient (step S15). Now, assuming that the elements in the regression coefficient matrix exist as illustrated inFig. 6B , the result of searching for the maximum regression coefficient among them is illustrated inFig. 6C . - The m/z
value search section 17 excludes the search m/z value range including the only m/z value selected in step S15, and sets a new measurement m/z range (step S16). That is, in the example ofFig. 6C , since the m/z value corresponding to one element indicated by a circle is selected, one search m/z range that is crossed out inFig. 6D is excluded from the measurement m/z range, and a new measurement m/z range is set. Then, in the measurement m/z range from which the one or more search m/z ranges are excluded, the largest regression coefficient is searched for and the m/z value corresponding to this regression coefficient is selected (step S 17). In this manner, even if an m/z value having a large regression coefficient exists in the previously excluded search m/z range, this m/z value will not be selected. Here, it is assumed that the one indicated by a circle inFig. 6E is found in searching the measurement m/z range illustrated inFig. 6D for the maximum regression coefficient. - After that, it is determined whether a predetermined ending condition is satisfied (step S18), and if not, the process returns from step S18 to step S16. For example, the ending condition may be selection of a predetermined number of m/z values or the elapse of a predetermined time from the start of the process. Alternatively, the ending condition may be that the maximum regression coefficient at that time is below a predetermined threshold. In this way, various ending conditions can be considered.
- In any case, the process in steps S16 to S18 is repeated until it is determined in step S18 that the ending condition is satisfied. For example, when the process returns to step S16 after the one indicated by a circle illustrated in
Fig. 6E is selected, as illustrated inFig. 6F , the search m/z value range including the newly selected m/z value is excluded from the measurement m/z range. Thus, as in the above embodiment, at most one m/z value can be selected within one search m/z range. If there is any m/z value originating from an isotope exists within the search m/z range including the m/z value already selected, selection of this value will be avoided. - Although depending on the ending condition, the imaging mass spectrometer of this embodiment also selects at most one m/z value having a relatively large regression coefficient in each search m/z range as illustrated in
Fig. 6G . The m/z valuecandidate presentation section 18 creates an m/z value candidate list listing m/z values selected in step S15 and multiple steps S17, and displays the list on the screen of the display unit 3 (step S19). - Next, still another embodiment of an imaging mass spectrometer including a data processing device for imaging mass spectrometric analysis according to the present invention will be described. The configuration of the imaging mass spectrometer of this embodiment is also the same as the configuration of the imaging mass spectrometer of the above embodiment illustrated in
Fig. 1 , and the description thereof will be omitted. -
Fig. 7 is a flowchart of a m/z value search process in the imaging mass spectrometer of this embodiment, andFigs. 8A-8G are conceptual diagrams for explaining the m/z value search process. As illustrated inFig. 7 , the process in steps S1 to S4, that is, the process until the regression coefficient matrix is calculated through PLS is exactly the same as that in the above embodiment, and only a process of searching for an appropriate m/z value from the regression coefficient matrix, performed by the m/zvalue search section 17, is different from that in the above embodiment. Thus, this point will be described in detail below. - The m/z
value search section 17 first searches a given measurement m/z range for the regression coefficient with the maximum absolute value, and selects the m/z value corresponding to this regression coefficient (step S25). Now, among the regression coefficients illustrated inFig. 8B , the result of searching for the maximum regression coefficient is illustrated inFig. 8C . - The m/z
value search section 17 defines an exclusion m/z range having a predetermined width before and after the one m/z value selected in step S25. Specifically, an m/z width ΔMa in the direction in which m/z decreases and an m/z width ΔMb (may be the same as ΔMa) in the direction in which m/z increases are set, and once a selected m/z value M1 is determined, the range of M1-ΔMa to M1+ΔMb is set as the exclusion m/z range. It is desirable to determine ΔMa and ΔMb so that isotopes of one compound are contained as much as possible while these widths are as small as possible. Once the exclusion m/z range is determined, the measurement m/z range excluding the exclusion m/z range is set as a new measurement m/z range (step S26). - For example, the exclusion m/z range indicated by ΔP in
Fig. 8D can be defined based on the m/z value corresponding to one regression coefficient illustrated inFig. 8C . The m/zvalue search section 17 searches the measurement m/z range from which the one or more exclusion m/z ranges are excluded, for the regression coefficient with the maximum absolute value and selects the m/z value corresponding to this regression coefficient (step S27). Thus, even if any regression coefficient with a large value exists in the immediate vicinity of the previously selected m/z value (within the above exclusion m/z range), the m/z value corresponding to this regression coefficient will not be selected. Here, it is assumed that the one indicated by a circle inFig. 8E is found in searching the measurement m/z range illustrated inFig. 8D for the maximum regression coefficient. - After that, it is determined whether a predetermined ending condition is satisfied (step S28), and if not, the process returns from step S28 to step S26. The ending condition in this process is the same as the ending condition in step S18 described above.
- In any case, the process in steps S26 to S28 is repeated until it is determined in step S28 that the ending condition is satisfied. For example, when the process returns to step S26 after the one indicated by a circle illustrated in
Fig. 8E is selected, as illustrated inFig. 8F , the exclusion m/z range including the newly selected m/z value is excluded from the measurement m/z range. Thus, even if any ion peak originating from an isotope exists in the vicinity of the m/z value already selected on the mass spectrum, the m/z value of this ion peak will not be selected. - In the imaging mass spectrometers of any of the above embodiments, while selection of the m/z value of ions originating from an isotope of a certain compound as a candidate is avoided, the m/z value of ions originating from the compound exhibiting a two-dimensional distribution similar to the image pattern of the reference image can be accurately selected as an m/z value candidate. That is, it is possible to avoid selection of the m/z value of ions originating from one compound and the m/z value of ions originating from an isotope of the same compound in duplicate.
- While PLS is used for the statistical analysis process in the above embodiments, multivariate analysis other than PLS may be used instead as long as such a technique can obtain an index value reflecting the similarity of the image patterns between the two-dimensional distribution of ion intensity and the reference image for each m/z. Specifically, correlation analysis or the like can be used.
- The embodiments described above are examples of the present invention, and thus modification, correction, and addition to the embodiments without departing from the gist of the present invention are apparently included in the scope of the claims of the present application.
-
- 1
- Data Processing Unit
- 11
- Reference Image Data Storage Section
- 12
- MS Imaging Data Storage Section
- 13
- Reference Image Creator
- 14
- MS Image Creator
- 15
- Calculation Data Creator
- 16
- Regression Analysis Executor
- 17
- m/z Value Search Section
- 18
- m/z Candidate Presentation Section
- 2
- Operation Unit
- 3
- Display Unit
- 4
- Imaging Mass Spectrometric Analysis Unit
- 5
- Reference Image Capturing Unit
- 6
- Sample
Claims (7)
- A data processing device for imaging mass spectrometric analysis that processes mass spectrum data obtained at a plurality of measurement points in a two-dimensional measurement area on a sample, the data processing device comprising:a) a reference image information acquisition section that acquires reference image data forming a reference image for the measurement area;b) an analysis processor that calculates, for each mass-to-charge ratio, an index value related to similarity of an image pattern of an MS image exhibiting a distribution of a signal intensity of ions having the mass-to-charge ratio and the reference image, through statistical analysis based on the mass spectrum data of each measurement point in the measurement area and the reference image data acquired by the reference image information acquisition section; andc) a mass-to-charge ratio value search section that searches for and selects a mass-to-charge ratio exhibiting a relatively large index value among index values for respective mass-to-charge ratios obtained by the analysis processor, and excludes, from a selection target, a mass-to-charge ratio value existing in a predetermined mass-to-charge ratio range including one mass-to-charge ratio value already selected, the mass-to-charge ratio value exhibiting an index value smaller than an index value corresponding to the mass-to-charge ratio value.
- The data processing device for imaging mass spectrometric analysis according to claim 1, wherein
a plurality of consecutive mass-to-charge ratio ranges obtained by dividing an entire measurement mass-to-charge ratio range for each predetermined mass-to-charge ratio width are defined, and
when a mass-to-charge ratio value exhibiting a largest index value in one mass-to-charge ratio search range is selected within the range, the mass-to-charge ratio value search section excludes other mass-to-charge ratio values included in the mass-to-charge ratio search range from the selection target. - The data processing device for imaging mass spectrometric analysis according to claim 2, wherein the mass-to-charge ratio value search section selects mass-to-charge ratio values exhibiting a largest index value in each of the plurality of mass-to-charge ratio search ranges, and thereafter selects a mass-to-charge ratio value exhibiting an index value that is equal to or more than a predetermined threshold among the selected plurality of mass-to-charge ratio values.
- The data processing device for imaging mass spectrometric analysis according to claim 2, wherein the mass-to-charge ratio value search section selects a plurality of mass-to-charge ratio values in descending order of index values in an entire mass-to-charge ratio range of a measurement target.
- The data processing device for imaging mass spectrometric analysis according to claim 1, wherein the mass-to-charge ratio value search section selects one mass-to-charge ratio value, thereafter determines an exclusion range with same or different widths set in a decreasing direction and an increasing direction of the mass-to-charge ratio with respect to the one mass-to-charge ratio value, and excludes other mass-to-charge ratio values included in the exclusion range from the selection target.
- The data processing device for imaging mass spectrometric analysis according to claim 5, wherein the mass-to-charge ratio value search section selects a plurality of mass-to-charge ratio values in descending order of index values in a mass-to-charge ratio range of a measurement target.
- The data processing device for imaging mass spectrometric analysis according to any one of claims 1 to 6, wherein the statistical analysis is partial least-square regression analysis, and the index value is a regression coefficient.
Applications Claiming Priority (1)
| Application Number | Priority Date | Filing Date | Title |
|---|---|---|---|
| PCT/JP2018/003601 WO2019150554A1 (en) | 2018-02-02 | 2018-02-02 | Data processing device for imaging mass spectrometry |
Publications (2)
| Publication Number | Publication Date |
|---|---|
| EP3748350A1 true EP3748350A1 (en) | 2020-12-09 |
| EP3748350A4 EP3748350A4 (en) | 2021-01-27 |
Family
ID=67478097
Family Applications (1)
| Application Number | Title | Priority Date | Filing Date |
|---|---|---|---|
| EP18903784.9A Withdrawn EP3748350A4 (en) | 2018-02-02 | 2018-02-02 | Data processing device for imaging mass spectrometry |
Country Status (5)
| Country | Link |
|---|---|
| US (1) | US11276565B2 (en) |
| EP (1) | EP3748350A4 (en) |
| JP (1) | JP6939912B2 (en) |
| CN (1) | CN111587374B (en) |
| WO (1) | WO2019150554A1 (en) |
Families Citing this family (3)
| Publication number | Priority date | Publication date | Assignee | Title |
|---|---|---|---|---|
| CN107850567A (en) * | 2015-07-01 | 2018-03-27 | 株式会社岛津制作所 | data processing device |
| US11211235B2 (en) * | 2018-05-30 | 2021-12-28 | Shimadzu Corporation | Imaging mass spectrometry data processing device |
| US12176194B2 (en) * | 2019-09-13 | 2024-12-24 | Shimadzu Corporation | Analysis device |
Family Cites Families (9)
| Publication number | Priority date | Publication date | Assignee | Title |
|---|---|---|---|---|
| US6983213B2 (en) * | 2003-10-20 | 2006-01-03 | Cerno Bioscience Llc | Methods for operating mass spectrometry (MS) instrument systems |
| WO2008126151A1 (en) * | 2007-04-04 | 2008-10-23 | Shimadzu Corporation | Mass spectrometry data analyzing method and device |
| JP4973360B2 (en) | 2007-07-24 | 2012-07-11 | 株式会社島津製作所 | Mass spectrometer |
| JP5273144B2 (en) * | 2008-06-04 | 2013-08-28 | 株式会社島津製作所 | Mass spectrometry data analysis method and mass spectrometry data analysis apparatus |
| JP5673348B2 (en) * | 2011-05-25 | 2015-02-18 | 株式会社島津製作所 | Mass spectrometry data analysis method and analysis apparatus |
| JP6179600B2 (en) * | 2013-10-11 | 2017-08-16 | 株式会社島津製作所 | Mass spectrometry data analyzer |
| FR3016461B1 (en) * | 2014-01-10 | 2017-06-23 | Imabiotech | METHOD FOR PROCESSING MOLECULAR IMAGING DATA AND CORRESPONDING DATA SERVER |
| WO2016015108A1 (en) * | 2014-08-01 | 2016-02-04 | Katholieke Universiteit Leuven | System for interpretation of image patterns in terms of anatomical or curated patterns |
| CN107850567A (en) * | 2015-07-01 | 2018-03-27 | 株式会社岛津制作所 | data processing device |
-
2018
- 2018-02-02 JP JP2019568521A patent/JP6939912B2/en active Active
- 2018-02-02 US US16/966,664 patent/US11276565B2/en active Active
- 2018-02-02 EP EP18903784.9A patent/EP3748350A4/en not_active Withdrawn
- 2018-02-02 WO PCT/JP2018/003601 patent/WO2019150554A1/en not_active Ceased
- 2018-02-02 CN CN201880086132.7A patent/CN111587374B/en active Active
Also Published As
| Publication number | Publication date |
|---|---|
| JPWO2019150554A1 (en) | 2020-12-10 |
| CN111587374A (en) | 2020-08-25 |
| CN111587374B (en) | 2024-02-06 |
| US20210035790A1 (en) | 2021-02-04 |
| WO2019150554A1 (en) | 2019-08-08 |
| EP3748350A4 (en) | 2021-01-27 |
| JP6939912B2 (en) | 2021-09-22 |
| US11276565B2 (en) | 2022-03-15 |
Similar Documents
| Publication | Publication Date | Title |
|---|---|---|
| US11776799B2 (en) | Data processing device | |
| CN105190303B (en) | Image quality analysis data processing method and image quality analysis device | |
| JP5565810B2 (en) | Mass spectrometry data processing method and apparatus | |
| JP6207036B2 (en) | Mass spectrometry data processing method and apparatus | |
| JP5348029B2 (en) | Mass spectrometry data processing method and apparatus | |
| JP6908136B2 (en) | Data analyzer | |
| US11276565B2 (en) | Data processing device for imaging mass spectrometric analysis | |
| JPWO2016103312A1 (en) | Analytical data processing method and apparatus | |
| Palmer et al. | Randomized approximation methods for the efficient compression and analysis of hyperspectral data | |
| JP6179600B2 (en) | Mass spectrometry data analyzer | |
| JP2018504600A (en) | Interference detection and deconvolution of peak of interest | |
| JP7004073B2 (en) | Imaging data processing equipment | |
| JPWO2017158673A1 (en) | Mass spectrometry data analysis apparatus and mass spectrometry data analysis program | |
| US20210020420A1 (en) | Imaging mass spectrometric data analyzer | |
| JP6477833B2 (en) | Data processing device | |
| CN114096839A (en) | Imaging quality analysis device | |
| WO2019150553A1 (en) | Imaging mass spectrometry device | |
| WO2019150574A1 (en) | Imaging mass spectrometry device | |
| US12190517B2 (en) | Imaging analysis device and imaging data analysis method | |
| US20140379306A1 (en) | Spectral data processing apparatus, spectral data processing method, and recording medium |
Legal Events
| Date | Code | Title | Description |
|---|---|---|---|
| STAA | Information on the status of an ep patent application or granted ep patent |
Free format text: STATUS: THE INTERNATIONAL PUBLICATION HAS BEEN MADE |
|
| PUAI | Public reference made under article 153(3) epc to a published international application that has entered the european phase |
Free format text: ORIGINAL CODE: 0009012 |
|
| STAA | Information on the status of an ep patent application or granted ep patent |
Free format text: STATUS: REQUEST FOR EXAMINATION WAS MADE |
|
| 17P | Request for examination filed |
Effective date: 20200729 |
|
| AK | Designated contracting states |
Kind code of ref document: A1 Designated state(s): AL AT BE BG CH CY CZ DE DK EE ES FI FR GB GR HR HU IE IS IT LI LT LU LV MC MK MT NL NO PL PT RO RS SE SI SK SM TR |
|
| AX | Request for extension of the european patent |
Extension state: BA ME |
|
| A4 | Supplementary search report drawn up and despatched |
Effective date: 20210113 |
|
| RIC1 | Information provided on ipc code assigned before grant |
Ipc: H01J 49/00 20060101AFI20201222BHEP |
|
| DAV | Request for validation of the european patent (deleted) | ||
| DAX | Request for extension of the european patent (deleted) | ||
| STAA | Information on the status of an ep patent application or granted ep patent |
Free format text: STATUS: THE APPLICATION HAS BEEN WITHDRAWN |
|
| 18W | Application withdrawn |
Effective date: 20210803 |