EP3717894B1 - Spectrometry system - Google Patents
Spectrometry system Download PDFInfo
- Publication number
- EP3717894B1 EP3717894B1 EP18815303.5A EP18815303A EP3717894B1 EP 3717894 B1 EP3717894 B1 EP 3717894B1 EP 18815303 A EP18815303 A EP 18815303A EP 3717894 B1 EP3717894 B1 EP 3717894B1
- Authority
- EP
- European Patent Office
- Prior art keywords
- field
- humidity
- peak
- turning point
- value
- Prior art date
- Legal status (The legal status is an assumption and is not a legal conclusion. Google has not performed a legal analysis and makes no representation as to the accuracy of the status listed.)
- Active
Links
Images










Classifications
-
- G—PHYSICS
- G01—MEASURING; TESTING
- G01N—INVESTIGATING OR ANALYSING MATERIALS BY DETERMINING THEIR CHEMICAL OR PHYSICAL PROPERTIES
- G01N27/00—Investigating or analysing materials by the use of electric, electrochemical, or magnetic means
- G01N27/62—Investigating or analysing materials by the use of electric, electrochemical, or magnetic means by investigating the ionisation of gases, e.g. aerosols; by investigating electric discharges, e.g. emission of cathode
- G01N27/622—Ion mobility spectrometry
- G01N27/624—Differential mobility spectrometry [DMS]; Field asymmetric-waveform ion mobility spectrometry [FAIMS]
Definitions
- the present invention relates to devices and methods for ion mobility systems. More specifically, the invention relates to a method and apparatus for detecting humidity using a Field Asymmetric Ion Mobility Spectrometry (FAIMS) system.
- FIMS Field Asymmetric Ion Mobility Spectrometry
- IMS Ion Mobility Spectrometry
- FAMMS Field Asymmetric Ion Mobility Spectrometry
- DMS Differential Mobility Spectrometry
- Ion mobility techniques can also be used effectively over a range of gas pressures, including pressures close to one atmosphere. This makes them useful for, amongst other things, measuring low-level impurities in air.
- the sample gas is passed through an ionizer to produce a population of ionized molecules that are then manipulated in some way involving separation or selection of ionized molecules according to their behaviour in an electric field, before being detected.
- Ionizers commonly in use include radioactive sources, light-based devices such as ultra-violet lamps, and electrostatic devices such as corona discharge ionizers.
- Stability and repeatability of DMS spectra are important issues in the use of DMS in analytical applications, as explained for example in " Temperature effects in differential mobility spectrometry" by Krylov et al in International Journal of Mass Spectrometry 279 (2009) 119-125 .
- Various factors, including humidity, are known to influence the field dependence of ion mobility, changing peak positions in the DMS spectra.
- WO2005106450 discloses a system and method for identifying one or more ion species of a sample.
- the method comprises filtering the ion species of the sample over a range of applied asymmetric fields and compensation fields and measuring the ion intensities of the filtered ion species over the range of applied asymmetric fields and compensation fields. Then, the method comprises generating an image showing the ion intensities over the range of the asymmetric fields and compensation fields and processing windowed portions of the image to identify one or more ion species of the sample.
- WO2009092012 discloses a method, system, and device for identifying chemical species in a sample.
- This may include introducing a sample gas into a differential ion mobility device and ionizing at least a portion of the sample gas to generate at least one ion species. It may also include filtering the at least one ion species between a pair of filter electrodes and generating a detection signal in response to the at least one ion species depositing a charge on a collector electrode. This may lead to detecting a spectral peak associated with the at least one ion species.
- JP2015081908 provides a peak analysis method for obtaining a feature quantity included in three-dimensional spectrum data obtained by a sensor. Two-dimensional peak geometry is obtained from three-dimensional spectrum data. Derived factors of peaks are estimated from peak trends included in the two-dimensional peak geometry to obtain a feature quantity.
- a miniature spectrometer based around the multi-micron-gap ion separator and ultra-high-field drivers has been developed to meet the continuing industrial need for sensitive (sub-ppm), broadband and fast (second time-scale) response volatile chemical detection.
- US2014061459 discloses a field asymmetric ion mobility spectrometer, wherein a turning point in a peak trajectory is associated with one or more classes of analytes to facilitate chemical detection, identification, classification and/or quantification.
- the present applicant has recognised the need to address humidity issues with ion mobility systems.
- a method of determining humidity using a field asymmetric ion mobility system comprising: generating ions within a gas sample flowing through the field asymmetric ion mobility system; applying a compensation field and a dispersion field to the generated ions; measuring an output ion current; extracting a spectrum of peak intensity of the measured output as a function of the compensation field and the dispersion field; calculating a turning point for the extracted spectrum; determining operating parameters of the field asymmetric ion mobility system; obtaining, from a database, a plurality of known turning points each of which have an associated humidity value and each of which were obtained using a field asymmetric ion mobility system having operating parameters which are aligned with the determined operating parameters; and determining a value for the humidity by comparing the calculated turning point with known turning points.
- a FAIMS may be used as a hygrometer and thus measure the humidity.
- the FAIMS may be used to measure the humidity of air. The sequence of steps may be completed relatively quickly so that the humidity measurement can be done in real time.
- the value of humidity may be expressed as a percentage, e.g. a percentage by volume which may be in the range of 0 to 3% where 3% represents total saturation, or a percentage by mass.
- applying a compensation field and a dispersion field to the generated ions may comprise applying a compensation field and dispersion field to filter water ions from the generated ions. In this way, the measured output ion current may measure the ion current which is output from water ions.
- the method comprises determining the operating parameters which will affect the output, including for example temperature and pressure.
- the operating parameters may be determined by using appropriate sensors which may be incorporated in the system, e.g. a temperature sensor and/or a pressure sensor. The sensors may collect the data in real-time. Alternatively, the operating parameters may be determined from a database which stores information about the operating parameters for different environments.
- the plurality of known turning points may be obtained for a field asymmetric ion mobility system having at least two operating parameters which are the same as the determined operating parameters. Alternatively, the plurality of known turning points may be obtained for a system having a plurality of operating parameters (e.g.
- the operating parameters may be considered to be aligned with the determined operating parameters if either a minimum number of parameters are equal to one another or a number of parameters are within an acceptable range of each other.
- Extracting a spectrum of peak intensity may comprise plotting the measured output ion current as a function of dispersion field against compensation field; determining points of peak intensity within the plot and generating the spectrum of the peak intensity using the determined points.
- Known techniques may be used to plot the measured output ion current and to determine the points of peak intensity.
- the method may further comprise plotting the spectrum of peak intensity as a function of dispersion field against compensation field.
- the spectrum may be a line graph.
- Calculating a turning point may comprise calculating the turning point (i.e. the stationary point) in the generated line graph, e.g. locating the point on the line graph having a zero gradient.
- the spectrum may be presented in any suitable form, e.g. a table of data points and the turning point may be calculated from the spectrum using any suitable technique.
- turning point it is meant a stationary point at which the value for the dispersion field stops increasing or decreasing relative to the value of the compensation field.
- Determining a value for the humidity comprises determining a pair of known turning points defining a range within which the calculated turning point is located and extrapolating a humidity value for the calculated turning point from the humidity values associated with the pair of known turning points.
- a first known turning point may be higher than the calculated turning point and may thus be the upper limit of the range.
- a second known turning point in the pair may be lower than the calculated turning point and may thus be the lower limit of the range.
- the pair of known turning points may be the pair defining the smallest range, i.e. the first and second known turning points may be the points closest in value to the calculated turning points.
- the humidity value may be extrapolated using any known technique, e.g. a best fit line may be determined between the pair of known turning points and the value of the humidity simply "read" off the best fit line.
- the method may thus comprise determining two pairs of known turning points each of which define a range within which the calculated turning point is located, selecting a preferred pair and extrapolating the humidity value using the preferred pair. Selecting a preferred pair may comprise considering the range of humidity values defined by the pair and rejecting a pair having a range which is smaller than a predetermined value (e.g. a range having a difference between upper and lower limits of less than 0.1%). In a small range, it will be difficult to accurately interpolate a value for the humidity. Alternatively, selecting a preferred pair may comprise rejecting the pair having at least one value below a threshold humidity value which represents an almost completely dry environment (e.g. 0.25%).
- a threshold humidity value which represents an almost completely dry environment
- Both positive and negative ions may be generated in the generating step.
- the method may thus comprise extracting a first spectrum of peak intensity for the negative ions; calculating a first turning point, obtaining a first plurality of known turning points each of which have an associated humidity and each of which were obtained using negative ions; and determining a first humidity value from the first calculated turning point and the first plurality of known turning points.
- the method may thus comprise extracting a second spectrum of peak intensity for the positive ions; calculating a second turning point, obtaining a second plurality of known turning points each of which have an associated humidity and each of which were obtained using positive ions; and determining a second humidity value from the second calculated turning point and the second plurality of known turning points.
- first and second can be used interchangeably, e.g. the first humidity value could be determined using the positive ions and the second humidity value could be determined using the negative ions.
- the method may further comprise comparing the first and the second determined humidity values and selecting one of the first and second humidity values as the determined humidity value. Selecting may comprise considering rejecting the value which is below a lower threshold humidity value which represents an almost completely dry environment (e.g. 0.25%) or above an upper threshold humidity value which represents an almost saturated environment (e.g. 2.75%). Both such environments are unlikely.
- the determined humidity value may be an average of the first and second values.
- the humidity value may be determined by using other parameters such as peak width or location.
- Peak width may be determined by plotting the dispersion field against compensation field and extracting the locations of peak intensity as described above. Thereafter, the widths of the locations of peak intensity which are extracted may be determined. Peak location may be determined by plotting the dispersion field against compensation field and extracting the peak values for the compensation field for a particular set value of the dispersion field (or vice versa).
- the system parameters may also be determined.
- a stored plot of peak width or location against humidity for the system having aligned parameters with the determined parameters may then be obtained and the humidity may be determined using this stored plot.
- a humidity value which has been calculated using the turning point may be checked against a humidity value determined using peak width/location. This is particularly useful if the turning point and/or peak width/location generates more than one humidity value because a single humidity value which appears in both results may then be selected as the output.
- the method may further comprise building the database which may be done prior to determining the humidity.
- Building the database may comprise setting the operating parameters of a test field asymmetric ion mobility system, wherein the operating parameters include the humidity of a gas sample being sampled by the system and calculating the turning point in the same manner as described above and storing the calculated turning point together with the set operating parameters wherein the calculated turning point is associated with the set humidity.
- the method may comprise generating ions within the gas sample flowing through the test field asymmetric ion mobility system, applying a compensation field and a dispersion field to the generated ions; measuring an output ion current; extracting a spectrum of peak intensity of the measured output as a function of the compensation field and the dispersion field and calculating a turning point for the extracted spectrum.
- the method may comprise calculating peak location and/or peak width for the extracted spectrum; and storing the calculated peak location and/or peak width together with the set operating parameters wherein the calculated peak location and/or peak width is associated with the set humidity
- the database comprises a plurality of known values and thus the method may comprise adjusting the humidity of the gas sample flowing through the test field asymmetric ion mobility system and repeating the generating, applying, measuring, extracting and storing steps.
- the adjusting and the repeating steps may be performed until there is sufficient data, for example, four or more values for a particular set of operating parameters.
- the humidity may be set at several different humidity values, e.g. 0.5%, 1.0%, 1.5%, 2.0%, 2.5% and 3% expressed as percentage water by volume.
- the database comprises a plurality of known values for different operating parameters.
- the method may comprise changing an operating parameter of the test field asymmetric ion mobility system and repeating the generating, applying, measuring, extracting and storing steps. For the changed operating parameter, the adjusting of the humidity and the repeating steps may be performed until there is sufficient data.
- the plurality of known values for a test system having aligned operating parameters may be obtained.
- aligned it is meant that either the number of operating parameters in common is above a threshold or individual parameters are within an acceptable threshold range, e.g. within 5 degrees for a set temperature.
- a method of determining humidity using a field asymmetric ion mobility system comprising: generating ions within a gas sample flowing through the field asymmetric ion mobility system; applying a compensation field and a dispersion field to the generated ions; measuring an output ion current; extracting a spectrum of peak intensity of the measured output as a function of the compensation field and the dispersion field; calculating a peak location for compensation field the extracted spectrum at a particular value for the dispersion field; determining operating parameters of the field asymmetric ion mobility system; obtaining, from a database, a plurality of known peak locations each of which have an associated humidity value and each of which were obtained using a field asymmetric ion mobility system having operating parameters which are aligned with the determined operating parameters; and determining a value for the humidity by comparing the calculated peak location with known peak locations.
- this method can be used, a preferred embodiment, in conjunction with the use of turning points to generate more than one humidity value so that the humidity values
- the methods described above may be performed by a field asymmetric ion mobility spectrometry.
- the ions may be generated using an ionizer, a drive signal system may be used to generate the compensation field and the dispersion field and the output may be measured (or detected) by a detector.
- the compensation field and the dispersion field may be considered to separate ions within an ion filter.
- a spectrometry systen comprising: an ionizer for generating ions within a gas sample wherein each ion has an associated mobility; an ion filter for separating the ions by applying a compensation field and a dispersion field to the generated ions; a detector for detecting an output from the ion filter; and a processor configured to extract a spectrum of peak intensity of the detected output as a function of the compensation field and the dispersion field; calculate a turning point for the extracted spectrum; determine operating parameters of the spectrometry system; obtain, from a database, a plurality of known turning points each of which have an associated humidity and each of which were obtained using a field asymmetric ion mobility system having operating parameters aligned with the determined operating parameters; and determine the humidity by comparing the calculated turning point with known turning points.
- the system may further comprise a drive signal system which applies a compensation field and a dispersion field to the ion filter to separate the ions. It will be appreciated that the features above described in relation to the method also apply to the system.
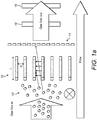
- Figures 1a to 1c shows a schematic illustration of a spectrometry system which may be a miniature device as described in " Characterisation of a miniature, ultra-high field, ion mobility spectrometer" by Wilks et al published in Int. J. Ion Mobil Spec. (2012) 15:199-222 .
- gas flows into an ionizer 10 and the generated ions then pass through an ion filter 12.
- the ion filter separates the ions and may thus be termed an ion separator.
- the ion filter has a plurality of ion channels each having a small gap width (g of around 30 to 50 ⁇ m) and relatively short length (e.g. L around 300 ⁇ m).
- the gap surfaces are made of high-conductivity silicon (or similar material) and are electrically connected via wire bonding to metal pads on the face of the silicon. Ions exiting from the ion separator are detected by an ion detector 14. It is known that temperature and pressure can affect the results and thus a temperature sensor 16 and/or a pressure sensor 18 may also be included in the system. These are shown schematically on the output gas flow but could be incorporated into another appropriate location within the device.
- an oscillating electric field is applied to the ion separator.
- a variable high-voltage asymmetric waveform of low voltage pulse duration t(s) and high voltage pulse duration ⁇ (s) and peak voltage V D is applied to create the variable field of V D / g (kVcm -1 ).
- the mobility of each ion within the ion separator oscillates between a low-field mobility K 0 and a high-field mobility K E and the difference between the high-field mobility and low field mobility is termed ⁇ K .
- Ions of different chemicals will have different values of ⁇ K and the ions adopt a net longitudinal drift path length ( d h -d t ) through the ion filter which is determined by their high and low field drift velocity ( v D(h) and v D(l) ) and the high field and low field pulse durations. Only ions in a "balanced" condition such as the middle ion in Figure 1b will exit from the ion separator and be detected by the ion detector. Ions which contact either of the sides of the ion channel will not be detected.
- a bias DC "tuning voltage" ( V c ) is applied on top of the applied waveform to enable subtle adjustment of the peak voltage V D to counter the drift experienced by an ion of a specific ⁇ K .
- a drive signal system 130 applies the asymmetric waveform and the tuning voltage to the ion filter 100 as described above.
- the output ions from the ion filter 100 are detected by the detector 110.
- the output from the detector 110 is sent to a processor 120 which may be local (i.e. within the ion filter) or remote (i.e. in a separate computer/server).
- the processor is adapted to extract numerical parameters which facilitate chemical detection, identification, classification and/or quantification of the ions.
- the processor may be configured to generate an output in which the measurement of ion current at the detector is plotted as a function of the applied electric field resulting from the asymmetric waveform which is known as the dispersion field E D (kVcm -1 ) and the applied electric field resulting from the DC voltage which is known as the compensation field E c (kVcm -1 ).
- the processor is also configured to receive inputs from sensors 150a, 150b in the system, for example a pressure or temperature sensor.
- the spectral output may alternatively be presented as an mxn matrix of ion current measurements at m compensation field and n dispersion field settings.
- the outputs are compared to a database 140 of similar outputs which have been previously gathered to determine the nature of the ions that have been detected.
- the database may be located in a memory with the spectrometer housing, e.g. on a PCB within the housing.
- Figures 2a and 2b are flowcharts illustrating the steps of the method of determining humidity.
- Figure 2a shows the steps in the first phase which is a calibration (or data gathering) phase used to build a database (or library) of results.
- Figure 2b shows the steps of a second phase, namely a determining phase, and shows how the database generated in Figure 2a may be used.
- the first step S100 in the calibration phase of Figure 2a is to fix the parameters (or variables) of the ion spectrometry system, in particular the parameters which are known to influence the output, e.g. pressure, temperature, humidity, the gas being sampled, flow rate through the system.
- the parameters which are known to influence the output
- the temperature setting the temperature at various points within the system may be set, e.g. the temperature at the inlet.
- the system is then operated at these set parameters and the output is generated, for example a plot of dispersion field versus compensation field (S102).
- the output is generated using known techniques. For example, the compensation and dispersion fields are varied and the measured ion current is recorded for each value of the compensation and dispersion field.
- the measured ion current may then be plotted as "heat maps" where the intensity is colour coded to differentiate higher intensity from lower intensity, e.g. as shown in Figures 3a to 3h .
- the parameters for this particular output are preferably captured together with the output itself.
- the humidity value namely the water concentration
- the water concentration may be adjusted from 0% (i.e. completely dry) to 0.25%.
- the operation is then repeated with all other parameters unchanged and the output for this set of parameters is generated which again could be a plot of the dispersion field against the compensation field as shown at step S106.
- the complete set of parameters for this particular output is also preferably captured together with the output itself.
- FIGS 3a to 3h The results of steps S100 to S108 are illustrated in Figures 3a to 3h for a system in which the temperature is fixed at 150 degrees Celsius.
- the other parameters in the system which may impact the output are also fixed and recorded, for example system flow: 2320ml/min; chip bias 54V and chip gap: 64.19 micron.
- a sample of air having a fixed concentration of water is passed through the system.
- Figure 3a plots the dispersion field (rdf) against compensation field (rcf) for the positive mode (i.e. positive ions generated from the water) at 0% water concentration.
- 0% water concentration means that no water is added to the gas sample.
- Figure 3e plots the dispersion field (rdf) against compensation field (rcf) for the negative mode (i.e. negative ions generated by the chemical sample) at 0% water concentration.
- the intensity of the output is illustrated using the colour coding to the side of the image with the brightest colour indicating the greatest intensity. The highest intensity is above 10 2 (i.e. above 100) with the scale showing 10 1 in the middle and 10° towards the lower third of the scale.
- Figures 3b and 3f are the corresponding graphs at a water concentration of 0.5%. Both Figures 3b and 3f show a different result when compared to the graphs at a lower water concentration with the change being perhaps the most noticeable for the negative mode.
- Figures 3c and 3g are the corresponding graphs at a water concentration of 1.5% and Figures 3d and 3h are the corresponding graphs at a water concentration of 3%. The change is once again more noticeable for the negative mode.
- Figures 3a to 3h are merely illustrative of the graphs that could be collected at various different water concentrations.
- the next step S110 is to extract a plurality of locations of peak intensity for the compensation field versus dispersion field outputs. These locations of peak intensity are plotted on a graph of compensation field versus dispersion field. The extraction of the data and its plotting on a graph are done using known techniques.
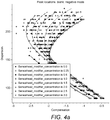
- An example of the plot of peak locations is shown in Figure 4a which shows the locations as points on a plot of dispersion field against compensation field. The points for each of the results obtained in the previous steps are plotted, which as shown in this example is at humidity values, of 0%, 0.25%, 0.5%, 1.0%, 1.5%, 2.0%, 2.5% and 3%.
- the next step S112 is to plot spectra of dispersion field versus compensation field for each of the concentration levels using the data from the previous step.
- Each spectrum at a particular concentration level is a line which represents a best fit for the extracted points.
- the spectra are generated using known techniques. These spectra are shown on Figure 4a but for clarity are reproduced on Figure 4b without the data points.
- Figure 4b thus shows smooth graphs of the variation in dispersion field and compensation field at each concentration level which as shown in this example is at humidity values, of 0%, 0.25%, 0.5%, 1.0%, 1.5%, 2.0%, 2.5% and 3%.
- Figure 4b shows the results of the negative mode and
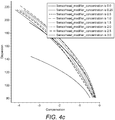
- Figure 4c is a similar graph for the positive mode.
- the next step S114 is to extract the value of the compensation field at which these turning points occur in each spectrum.
- the turning points are extracted using known techniques, for example manually or by fitting a quadratic, differentiating and looking for a zero crossing. These extracted turning points are then plotted on a graph of turning point (measured in Townsends (Td)) against water concentration at the sensor head, i.e. at the location of the FAIMS ion filter itself.
- Figure 5a and 5b illustrate the plots of turning points which are generated for the negative mode.
- the plots of turning points are for the compensation field only and in Figure 5b , the turning points for both the compensation and dispersion fields are shown separately.
- These plots are then stored and can then be used to determine the water concentration (i.e. humidity) in which a system is operating as shown in Figure 2b .
- the spectrometry system can be used as a humidity sensor.
- the first step S200 of Figure 2b is to plot the dispersion field versus compensation field for the spectrometry system.
- the next step S202 is to determine the locations of peak intensity in the generated plot.
- the peak intensity spectrum is then plotted at step S204 and the turning point of the spectrum is determined in step S206. It will be appreciated that these steps correspond to those described above in steps S106, S110 to S114 and thus can be done using the techniques described above or other comparable techniques.
- ion mobility system As explained above, various factors are known to influence the field dependence of ion mobility, changing peak positions in the DMS spectra.
- humidity is not known but other key operating parameters such as temperature and pressure can be determined using the appropriate sensors as shown at step S208. These determined parameters may then be used to select the appropriate plot of turning points which is stored in the database (step S210). For example, the plot of Figure 4b can be selected when the temperature is 150 degrees Celsius. The selected plot and the extracted turning point are then used to determine the humidity.
- the humidity may be determined as illustrated in Figure 6 .
- the humidity at the extracted value (which is this example is shown as -2.21) can be determined from Figure 6 by plotting the extracted value between two known values (one with a value higher than the extracted value and one with a value lower than the extracted values) and extrapolating, by following a line of best fit between these two closest known values, that the humidity value is 1.76% for the extracted turning point.
- the two known values effectively define a range within which the extracted value is located. It will be appreciated that this is just one way that the value of the humidity can be extracted from the stored values of turning points and humidity and other equivalent methods can be used.
- the values of turning points and humidity may be stored in a table and extrapolation between the values in the table can used to determine the humidity for a particular turning point.
- accuracy could be improved by obtaining two turning points, one for the negative mode and one for the positive mode (if turning points exist in both modes) and comparing both of these points with the corresponding graphs.
- accuracy can be improved by using other data, such as the width of each peak or the peak location at a particular value for either the compensation or dispersion field in the mode where there is no turning point.
- Figure 5c plots the value of the peak location at 140Td in the compensation field against sensor head water concentration.
- the plot in Figure 5c can be used to verify the humidity value which is obtained using the method above.
- the method may comprise calculating the peak location for the compensation field for the gas sample under consideration for the extracted spectrum; determining operating parameters of the field asymmetric ion mobility system; and obtaining, from a database, a plurality of known peak locations each of which have an associated humidity value and each of which were obtained using a field asymmetric ion mobility system having operating parameters aligned with the determined operating parameters; and determining a value for the humidity by comparing the calculated peak location with known peak locations.
- a humidity value which has been calculated using the turning point may be checked against a humidity value determined using peak location (or vice versa). This is particularly useful if the turning point and/or peak location generates more than one humidity value because a single humidity value which appears in both results may then be selected as the output.
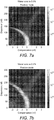
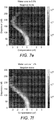
- Figures 7a to 7f illustrate the calibration process for the same system set at a different water concentrations and a temperature of 65 degrees Celsius.
- Figure 7a plots the dispersion field against compensation field for the positive mode (i.e. positive ions generated by the chemical sample) at 0% water concentration.
- Figure 7d plots the dispersion field against compensation field for the negative mode (i.e. positive ions generated by the chemical sample) at 0% water concentration.
- Figures 7b and 7e are the corresponding graphs at a water concentration of 0.5%.
- Figures 7b and 7e show a different result when compared to the graphs at a lower water concentration with the change being perhaps the most noticeable for the negative mode and are also different to the graphs at the same concentration at a different temperature.
- Figures 7c and 7f are the corresponding graphs at a water concentration of 1.5%. The change is once again more noticeable for the negative mode.
- Figures 7a to 7f are merely illustrative of the graphs that could be collected at various different water concentrations. The highest intensity is shown as being above 10 2 (i.e. above 100) with the scale showing 10 1 is the middle and 10° towards the lower end of the scale.
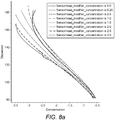
- Figures 8a and 8b show graphs of the variation in dispersion field and compensation field at each concentration level which as shown in this example is at humidity values, of 0%, 0.25%, 0.5%, 1.0%, 1.5%, 2.0%, 2.5% and 3%.
- Figure 8a shows the results of the negative mode
- Figure 8b is a similar graph for the positive mode.
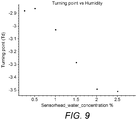
- Figure 9 illustrates the plot of turning points against humidity which are generated for the negative mode respectively. This is created using the same techniques described above in relation to Figures 5a and 5b but are clearly different in shape to the corresponding Figures 5a and 5b . Accordingly, these would give a different result in the final step of Figure 2b and thus it is important to select the correct data plot to use for the analysis.
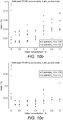
- Figure 10a plots the locations of each extracted peak at the different concentrations in the positive mode for 150 degrees Celsius. This is determined in a similar manner to Figure 4a for the negative mode.
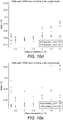
- Figures 10b to 10e show the full peak widths at half maximum (FWHM) for a plurality of these peak locations.
- the number of peak locations which are considered when determining the peak widths may be reduced by considering only ranges of compensation and dispersion field values, e.g. compensation field below 0Td and dispersion field above 100Td for the positive mode and compensation field below -1.4Td and dispersion field above 125Td for the negative mode.
- compensation field below 0Td and dispersion field above 100Td for the positive mode and compensation field below -1.4Td and dispersion field above 125Td for the negative mode.
- approximately five locations may be considered for both the positive and negative modes.
- Each of Figures 10b to 10e thus plots multiple widths for each humidity value because there are multiple corresponding points in Figures 10a and 4
- Figure 10b shows the peak width for multiple peak locations at reference values of 130Td (positive mode) and -130Td (negative mode).
- Figure 10c shows the peak width for the reference values of the dispersion field of 150Td (positive mode) and -150Td (negative mode) respectively.
- Figure 10d shows the peak width for the reference values of the dispersion field of 170Td (positive mode) and -170Td (negative mode) respectively.
- Figure 10e shows the peak width for the reference values of the dispersion field of 190Td (positive mode) and - 190Td (negative mode) respectively.
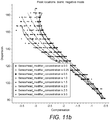
- Figures 11a and 11b plot the locations of each extracted peak at the different concentrations in the positive mode and negative mode respectively for 65 degrees Celsius.
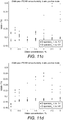
- Figures 11c to 11e show the full peak widths at half maximum (FWHM) for each of the peak locations. As above, the number of peak locations which are considered may be reduced.
- Figure 11c shows the peak width for the reference values of the dispersion field of 131Td (positive mode) and -131Td (negative mode) respectively.
- Figure 11d shows the peak width for the reference values of the dispersion field of 141Td (positive mode) and -141Td (negative mode) respectively.
- Figure 11e shows the peak width for the reference values of the dispersion field of 151Td (positive mode) and -151Td (negative mode) respectively.
- the humidity value can be determined from peak width by plotting the dispersion field against compensation field and extracting the locations of peak intensity as per steps S200 and S202 in the method of Figure 2b . Thereafter, the widths of the locations of peak intensity which are extracted in step S202 can be determined.
- the system parameters are also determined as in step S208 of Figure 2b . In this case, rather than obtaining a stored plot of turning points, a stored plot of peak width against humidity for the system having aligned parameters is obtained and the humidity is determined using this stored plot.
- each of the peak width plots of Figures 10b to 11e shows various concentration values having a particular peak width, it is possible that some systems have parameters which do not produce multiple values and thus the humidity value can be uniquely determined.
- the plots can be used to cross-reference (i.e. double check) a humidity value which has been calculated using the turning point as described above. This is particularly useful if the turning point method generates more than one humidity value because the correct one can then be selected as the one which corresponds to a humidity value determined using the peak width.
- 'processor' or 'controller' used herein may include, but are not limited to, a hardware device, such as circuitry in the form of discrete or integrated components, a Field Programmable Gate Array (FPGA) or Application Specific Integrated Circuit (ASIC), which performs certain tasks or provides the associated functionality.
- FPGA Field Programmable Gate Array
- ASIC Application Specific Integrated Circuit
- the described elements may be configured to reside on a tangible, persistent, addressable storage medium and may be configured to execute on one or more processors.
- These functional elements may in some embodiments include, by way of example, components, such as software components, object-oriented software components, class components and task components, processes, functions, attributes, procedures, subroutines, segments of program code, drivers, firmware, microcode, circuitry, data, databases, data structures, tables, arrays, and variables.
- components such as software components, object-oriented software components, class components and task components, processes, functions, attributes, procedures, subroutines, segments of program code, drivers, firmware, microcode, circuitry, data, databases, data structures, tables, arrays, and variables.
- components such as software components, object-oriented software components, class components and task components, processes, functions, attributes, procedures, subroutines, segments of program code, drivers, firmware, microcode, circuitry, data, databases, data structures, tables, arrays, and variables.
Landscapes
- Physics & Mathematics (AREA)
- Spectroscopy & Molecular Physics (AREA)
- Chemical & Material Sciences (AREA)
- Chemical Kinetics & Catalysis (AREA)
- Electrochemistry (AREA)
- Health & Medical Sciences (AREA)
- Life Sciences & Earth Sciences (AREA)
- Analytical Chemistry (AREA)
- Biochemistry (AREA)
- General Health & Medical Sciences (AREA)
- General Physics & Mathematics (AREA)
- Immunology (AREA)
- Pathology (AREA)
- Other Investigation Or Analysis Of Materials By Electrical Means (AREA)
Description
- The present invention relates to devices and methods for ion mobility systems. More specifically, the invention relates to a method and apparatus for detecting humidity using a Field Asymmetric Ion Mobility Spectrometry (FAIMS) system.
- The ability to ionize gases using ion mobility systems is useful for a wide range of applications including many chemical detection applications. Ionization techniques, in which a gas sample is ionized and then separated into constituent parts that can be detected individually, are widely used for gas composition sensing. Two well-known examples are Ion Mobility Spectrometry (IMS) and Field Asymmetric Ion Mobility Spectrometry (FAIMS), also known as Differential Mobility Spectrometry (DMS). Ion mobility detection techniques tend to be very well suited to measuring trace constituents of gas mixtures that often consist of a carrier gas with additional gases mixed in at low concentrations (for example part-per-million or part-per-billion levels).
- Ion mobility techniques can also be used effectively over a range of gas pressures, including pressures close to one atmosphere. This makes them useful for, amongst other things, measuring low-level impurities in air. The sample gas is passed through an ionizer to produce a population of ionized molecules that are then manipulated in some way involving separation or selection of ionized molecules according to their behaviour in an electric field, before being detected. Ionizers commonly in use include radioactive sources, light-based devices such as ultra-violet lamps, and electrostatic devices such as corona discharge ionizers.
- Stability and repeatability of DMS spectra are important issues in the use of DMS in analytical applications, as explained for example in " Temperature effects in differential mobility spectrometry" by Krylov et al in International Journal of Mass Spectrometry 279 (2009) 119-125. Various factors, including humidity, are known to influence the field dependence of ion mobility, changing peak positions in the DMS spectra.
-
WO2005106450 discloses a system and method for identifying one or more ion species of a sample. The method comprises filtering the ion species of the sample over a range of applied asymmetric fields and compensation fields and measuring the ion intensities of the filtered ion species over the range of applied asymmetric fields and compensation fields. Then, the method comprises generating an image showing the ion intensities over the range of the asymmetric fields and compensation fields and processing windowed portions of the image to identify one or more ion species of the sample.WO2009092012 discloses a method, system, and device for identifying chemical species in a sample. This may include introducing a sample gas into a differential ion mobility device and ionizing at least a portion of the sample gas to generate at least one ion species. It may also include filtering the at least one ion species between a pair of filter electrodes and generating a detection signal in response to the at least one ion species depositing a charge on a collector electrode. This may lead to detecting a spectral peak associated with the at least one ion species.JP2015081908 US2014061459 discloses a field asymmetric ion mobility spectrometer, wherein a turning point in a peak trajectory is associated with one or more classes of analytes to facilitate chemical detection, identification, classification and/or quantification. - The present applicant has recognised the need to address humidity issues with ion mobility systems.
- According to the present invention there is provided a system and method as set forth in the appended claims. Other features of the invention will be apparent from the dependent claims, and the description which follows.
- According to the invention as set out in
independent claim 1, we describe a method of determining humidity using a field asymmetric ion mobility system, the method comprising: generating ions within a gas sample flowing through the field asymmetric ion mobility system; applying a compensation field and a dispersion field to the generated ions; measuring an output ion current; extracting a spectrum of peak intensity of the measured output as a function of the compensation field and the dispersion field; calculating a turning point for the extracted spectrum; determining operating parameters of the field asymmetric ion mobility system; obtaining, from a database, a plurality of known turning points each of which have an associated humidity value and each of which were obtained using a field asymmetric ion mobility system having operating parameters which are aligned with the determined operating parameters; and determining a value for the humidity by comparing the calculated turning point with known turning points. - In this way, a FAIMS may be used as a hygrometer and thus measure the humidity. For example, the FAIMS may be used to measure the humidity of air. The sequence of steps may be completed relatively quickly so that the humidity measurement can be done in real time.
- The value of humidity may be expressed as a percentage, e.g. a percentage by volume which may be in the range of 0 to 3% where 3% represents total saturation, or a percentage by mass. By adjusting the compensation and dispersion fields, ions from a particular chemical species may be selected or filtered by the FAIMS. When using a FAIMS as a hygrometer, applying a compensation field and a dispersion field to the generated ions may comprise applying a compensation field and dispersion field to filter water ions from the generated ions. In this way, the measured output ion current may measure the ion current which is output from water ions.
- Various factors are known to influence the output from a FAIMS. Accordingly, the method comprises determining the operating parameters which will affect the output, including for example temperature and pressure. The operating parameters may be determined by using appropriate sensors which may be incorporated in the system, e.g. a temperature sensor and/or a pressure sensor. The sensors may collect the data in real-time. Alternatively, the operating parameters may be determined from a database which stores information about the operating parameters for different environments. The plurality of known turning points may be obtained for a field asymmetric ion mobility system having at least two operating parameters which are the same as the determined operating parameters. Alternatively, the plurality of known turning points may be obtained for a system having a plurality of operating parameters (e.g. three or more) which are all within a threshold (e.g. 5%) of the determined operating parameters. In other words, the operating parameters may be considered to be aligned with the determined operating parameters if either a minimum number of parameters are equal to one another or a number of parameters are within an acceptable range of each other.
- Extracting a spectrum of peak intensity may comprise plotting the measured output ion current as a function of dispersion field against compensation field; determining points of peak intensity within the plot and generating the spectrum of the peak intensity using the determined points. Known techniques may be used to plot the measured output ion current and to determine the points of peak intensity. The method may further comprise plotting the spectrum of peak intensity as a function of dispersion field against compensation field. In this way, the spectrum may be a line graph. Calculating a turning point may comprise calculating the turning point (i.e. the stationary point) in the generated line graph, e.g. locating the point on the line graph having a zero gradient. Alternatively, the spectrum may be presented in any suitable form, e.g. a table of data points and the turning point may be calculated from the spectrum using any suitable technique. By turning point it is meant a stationary point at which the value for the dispersion field stops increasing or decreasing relative to the value of the compensation field.
- Determining a value for the humidity comprises determining a pair of known turning points defining a range within which the calculated turning point is located and extrapolating a humidity value for the calculated turning point from the humidity values associated with the pair of known turning points. A first known turning point may be higher than the calculated turning point and may thus be the upper limit of the range. Similarly, a second known turning point in the pair may be lower than the calculated turning point and may thus be the lower limit of the range. The pair of known turning points may be the pair defining the smallest range, i.e. the first and second known turning points may be the points closest in value to the calculated turning points. The humidity value may be extrapolated using any known technique, e.g. a best fit line may be determined between the pair of known turning points and the value of the humidity simply "read" off the best fit line.
- There may be more than one pair of known turning points which define a range within which the calculated turning point is located. The method may thus comprise determining two pairs of known turning points each of which define a range within which the calculated turning point is located, selecting a preferred pair and extrapolating the humidity value using the preferred pair. Selecting a preferred pair may comprise considering the range of humidity values defined by the pair and rejecting a pair having a range which is smaller than a predetermined value (e.g. a range having a difference between upper and lower limits of less than 0.1%). In a small range, it will be difficult to accurately interpolate a value for the humidity. Alternatively, selecting a preferred pair may comprise rejecting the pair having at least one value below a threshold humidity value which represents an almost completely dry environment (e.g. 0.25%).
- Both positive and negative ions may be generated in the generating step. The method may thus comprise extracting a first spectrum of peak intensity for the negative ions; calculating a first turning point, obtaining a first plurality of known turning points each of which have an associated humidity and each of which were obtained using negative ions; and determining a first humidity value from the first calculated turning point and the first plurality of known turning points. Similarly, the method may thus comprise extracting a second spectrum of peak intensity for the positive ions; calculating a second turning point, obtaining a second plurality of known turning points each of which have an associated humidity and each of which were obtained using positive ions; and determining a second humidity value from the second calculated turning point and the second plurality of known turning points. It will be appreciated that first and second can be used interchangeably, e.g. the first humidity value could be determined using the positive ions and the second humidity value could be determined using the negative ions. Where two values are determined, the method may further comprise comparing the first and the second determined humidity values and selecting one of the first and second humidity values as the determined humidity value. Selecting may comprise considering rejecting the value which is below a lower threshold humidity value which represents an almost completely dry environment (e.g. 0.25%) or above an upper threshold humidity value which represents an almost saturated environment (e.g. 2.75%). Both such environments are unlikely. Alternatively, the determined humidity value may be an average of the first and second values.
- Alternatively, the humidity value may be determined by using other parameters such as peak width or location. Peak width may be determined by plotting the dispersion field against compensation field and extracting the locations of peak intensity as described above. Thereafter, the widths of the locations of peak intensity which are extracted may be determined. Peak location may be determined by plotting the dispersion field against compensation field and extracting the peak values for the compensation field for a particular set value of the dispersion field (or vice versa). The system parameters may also be determined. A stored plot of peak width or location against humidity for the system having aligned parameters with the determined parameters may then be obtained and the humidity may be determined using this stored plot. A humidity value which has been calculated using the turning point may be checked against a humidity value determined using peak width/location. This is particularly useful if the turning point and/or peak width/location generates more than one humidity value because a single humidity value which appears in both results may then be selected as the output.
- The method may further comprise building the database which may be done prior to determining the humidity. Building the database may comprise setting the operating parameters of a test field asymmetric ion mobility system, wherein the operating parameters include the humidity of a gas sample being sampled by the system and calculating the turning point in the same manner as described above and storing the calculated turning point together with the set operating parameters wherein the calculated turning point is associated with the set humidity. In other words, the method may comprise generating ions within the gas sample flowing through the test field asymmetric ion mobility system, applying a compensation field and a dispersion field to the generated ions; measuring an output ion current; extracting a spectrum of peak intensity of the measured output as a function of the compensation field and the dispersion field and calculating a turning point for the extracted spectrum. The method may comprise calculating peak location and/or peak width for the extracted spectrum; and storing the calculated peak location and/or peak width together with the set operating parameters wherein the calculated peak location and/or peak width is associated with the set humidity
- The database comprises a plurality of known values and thus the method may comprise adjusting the humidity of the gas sample flowing through the test field asymmetric ion mobility system and repeating the generating, applying, measuring, extracting and storing steps. The adjusting and the repeating steps may be performed until there is sufficient data, for example, four or more values for a particular set of operating parameters. The humidity may be set at several different humidity values, e.g. 0.5%, 1.0%, 1.5%, 2.0%, 2.5% and 3% expressed as percentage water by volume.
- The database comprises a plurality of known values for different operating parameters. Thus the method may comprise changing an operating parameter of the test field asymmetric ion mobility system and repeating the generating, applying, measuring, extracting and storing steps. For the changed operating parameter, the adjusting of the humidity and the repeating steps may be performed until there is sufficient data. It will be appreciated that there may not be a plurality of known values for a test system having operating parameters which exactly match the determined operating parameters. Accordingly, the plurality of known values for a test system having aligned operating parameters may be obtained. By aligned, it is meant that either the number of operating parameters in common is above a threshold or individual parameters are within an acceptable threshold range, e.g. within 5 degrees for a set temperature.
- We also describe a method of determining humidity using a field asymmetric ion mobility system, the method comprising: generating ions within a gas sample flowing through the field asymmetric ion mobility system; applying a compensation field and a dispersion field to the generated ions; measuring an output ion current; extracting a spectrum of peak intensity of the measured output as a function of the compensation field and the dispersion field; calculating a peak location for compensation field the extracted spectrum at a particular value for the dispersion field; determining operating parameters of the field asymmetric ion mobility system; obtaining, from a database, a plurality of known peak locations each of which have an associated humidity value and each of which were obtained using a field asymmetric ion mobility system having operating parameters which are aligned with the determined operating parameters; and determining a value for the humidity by comparing the calculated peak location with known peak locations. As explained above, this method can be used, a preferred embodiment, in conjunction with the use of turning points to generate more than one humidity value so that the humidity values generated using different methods can be validated against each other.
- The methods described above may be performed by a field asymmetric ion mobility spectrometry. Thus, the ions may be generated using an ionizer, a drive signal system may be used to generate the compensation field and the dispersion field and the output may be measured (or detected) by a detector. The compensation field and the dispersion field may be considered to separate ions within an ion filter. Thus, we also describe a spectrometry systen according to
independent claim 14 comprising: an ionizer for generating ions within a gas sample wherein each ion has an associated mobility; an ion filter for separating the ions by applying a compensation field and a dispersion field to the generated ions; a detector for detecting an output from the ion filter; and a processor configured to extract a spectrum of peak intensity of the detected output as a function of the compensation field and the dispersion field; calculate a turning point for the extracted spectrum; determine operating parameters of the spectrometry system; obtain, from a database, a plurality of known turning points each of which have an associated humidity and each of which were obtained using a field asymmetric ion mobility system having operating parameters aligned with the determined operating parameters; and determine the humidity by comparing the calculated turning point with known turning points. - The system may further comprise a drive signal system which applies a compensation field and a dispersion field to the ion filter to separate the ions. It will be appreciated that the features above described in relation to the method also apply to the system.
- For a better understanding of the invention, and to show how embodiments of the same may be carried into effect, reference will now be made, by way of example only, to the accompanying diagrammatic drawings in which:
-
Figure 1a is a schematic illustration of a spectrometry system; -
Figure 1b is a schematic illustration of a channel within an ion filter in the system ofFigure 1a ; -
Figure 1c is an alternative schematic illustration of the spectrometry system ofFigure 1a ; -
Figures 2a and2b are a flowchart illustrating a method of using a spectrometry system such as the one shown inFigure 1a ; -
Figures 3a to 3d are graphs plotting the dispersion field versus compensation field for the positive mode at water concentrations of 0%, 0.5%, 1.5% and 3% percentage by volume; -
Figures 3e to 3h are graphs plotting the dispersion field versus compensation field for the negative mode at water concentrations of 0%, 0.5%, 1.5% and 3% percentage by volume; -
Figure 4a is a graph plotting the locations of the peak values in the dispersion field versus compensation field graphs shown inFigure 3e to 3h ; -
Figure 4b is a line graph derived fromFigure 4a showing the variation in the peak values for each water concentration plotted as dispersion field versus compensation field; -
Figure 4c is a line graph showing the variation in the peak values for each water concentration plotted as dispersion field versus compensation field for the positive mode derived using the results shown inFigures 3a to 3d ; -
Figure 5a is a graph plotting the turning point of the dispersion field versus humidity for each of the line graphs shown inFigure 4b ; -
Figure 5b is a graph plotting the turning point of both the dispersion field and the compensation field versus humidity for each of the line graphs shown inFigure 4b ; -
Figure 5c is a graph plotting peak location at 140 TD in the compensation field for each of the line graphs shown inFigure 4c ; -
Figure 6 is a graph in which a turning point has been plotted on the graph ofFigure 5a ; -
Figures 7a to 7c are graphs plotting the dispersion field versus compensation field for the positive mode at water concentrations of 0%, 0.5% and 1.5% for a temperature of 65 degrees Celsius; -
Figures 7d to 7f are graphs plotting the dispersion field versus compensation field for the negative mode at water concentrations of 0%, 0.5% and 1.5% for a temperature of 65 degrees Celsius; -
Figures 8a and8b are line graphs showing the variation in the peak values for each water concentration plotted as dispersion field versus compensation field for the negative and positive modes respectively; -
Figure 9 is a graph plotting the turning point versus humidity for each of the line graphs shown inFigure 8a ; -
Figure 10a is a graph plotting the locations of the peak values in the dispersion field versus compensation field graphs shown inFigures 3a to 3d ; -
Figure 10b, 10c ,10d and 10e are graphs plotting the widths of each of the peaks shown inFigure 10a andFigure 4a against humidity for reference values of ±130, ±150, ±170 and ±190 respectively; -
Figure 11a is a graph plotting the locations of the peak values in the dispersion field versus compensation field graphs shown inFigure 7a to 7c ; -
Figure 11b is a graph plotting the locations of the peak values in the dispersion field versus compensation field graphs shown inFigure 7d to 7f and -
Figure 11c, 11d and11e are graphs plotting the widths of each of the peaks shown inFigures 11a and11b against humidity for reference values of ±131, ±141 and ±151 respectively. -
Figures 1a to 1c shows a schematic illustration of a spectrometry system which may be a miniature device as described in "Characterisation of a miniature, ultra-high field, ion mobility spectrometer" by Wilks et al published in Int. J. Ion Mobil Spec. (2012) 15:199-222. As shown inFigure 1a , gas flows into anionizer 10 and the generated ions then pass through anion filter 12. The ion filter separates the ions and may thus be termed an ion separator. In the illustrated example, the ion filter has a plurality of ion channels each having a small gap width (g of around 30 to 50 µm) and relatively short length (e.g. L around 300 µm). The gap surfaces are made of high-conductivity silicon (or similar material) and are electrically connected via wire bonding to metal pads on the face of the silicon. Ions exiting from the ion separator are detected by anion detector 14. It is known that temperature and pressure can affect the results and thus atemperature sensor 16 and/or apressure sensor 18 may also be included in the system. These are shown schematically on the output gas flow but could be incorporated into another appropriate location within the device. - As shown in
Figure 1b , an oscillating electric field is applied to the ion separator. A variable high-voltage asymmetric waveform of low voltage pulse duration t(s) and high voltage pulse duration τ(s) and peak voltage VD is applied to create the variable field of VD /g (kVcm-1). The mobility of each ion within the ion separator oscillates between a low-field mobility K0 and a high-field mobility KE and the difference between the high-field mobility and low field mobility is termed ΔK. Ions of different chemicals will have different values of ΔK and the ions adopt a net longitudinal drift path length (dh-dt ) through the ion filter which is determined by their high and low field drift velocity (vD(h) and vD(l) ) and the high field and low field pulse durations. Only ions in a "balanced" condition such as the middle ion inFigure 1b will exit from the ion separator and be detected by the ion detector. Ions which contact either of the sides of the ion channel will not be detected. A bias DC "tuning voltage" (Vc ) is applied on top of the applied waveform to enable subtle adjustment of the peak voltage VD to counter the drift experienced by an ion of a specific ΔK. - As shown schematically in
Figure 1c , adrive signal system 130 applies the asymmetric waveform and the tuning voltage to theion filter 100 as described above. The output ions from theion filter 100 are detected by thedetector 110. The output from thedetector 110 is sent to aprocessor 120 which may be local (i.e. within the ion filter) or remote (i.e. in a separate computer/server). The processor is adapted to extract numerical parameters which facilitate chemical detection, identification, classification and/or quantification of the ions. For example, the processor may be configured to generate an output in which the measurement of ion current at the detector is plotted as a function of the applied electric field resulting from the asymmetric waveform which is known as the dispersion field ED (kVcm-1) and the applied electric field resulting from the DC voltage which is known as the compensation field Ec (kVcm-1). The processor is also configured to receive inputs fromsensors database 140 of similar outputs which have been previously gathered to determine the nature of the ions that have been detected. The database may be located in a memory with the spectrometer housing, e.g. on a PCB within the housing. -
Figures 2a and2b are flowcharts illustrating the steps of the method of determining humidity.Figure 2a shows the steps in the first phase which is a calibration (or data gathering) phase used to build a database (or library) of results.Figure 2b shows the steps of a second phase, namely a determining phase, and shows how the database generated inFigure 2a may be used. - The first step S100 in the calibration phase of
Figure 2a is to fix the parameters (or variables) of the ion spectrometry system, in particular the parameters which are known to influence the output, e.g. pressure, temperature, humidity, the gas being sampled, flow rate through the system. For the temperature setting, the temperature at various points within the system may be set, e.g. the temperature at the inlet. The system is then operated at these set parameters and the output is generated, for example a plot of dispersion field versus compensation field (S102). The output is generated using known techniques. For example, the compensation and dispersion fields are varied and the measured ion current is recorded for each value of the compensation and dispersion field. The measured ion current may then be plotted as "heat maps" where the intensity is colour coded to differentiate higher intensity from lower intensity, e.g. as shown inFigures 3a to 3h . The parameters for this particular output are preferably captured together with the output itself. - Once the results have been gathered for a particular set of parameters, the humidity value, namely the water concentration, is adjusted. For example, the water concentration may be adjusted from 0% (i.e. completely dry) to 0.25%. The operation is then repeated with all other parameters unchanged and the output for this set of parameters is generated which again could be a plot of the dispersion field against the compensation field as shown at step S106. Although only the humidity is changed, there may be slight variations in the other parameters and thus the complete set of parameters for this particular output is also preferably captured together with the output itself.
- A decision on whether or not enough data has been gathered at step S108 and if not, the adjustment of humidity value at step S104 and the output step S106 is then repeated to cover several different humidity values, e.g. 0.5%, 1.0%, 1.5%, 2.0%, 2.5% and 3% (effectively fully saturated). These humidity values are expressed as percentage by volume. It will be appreciated that these values are arbitrary and other values can be used.
- The results of steps S100 to S108 are illustrated in
Figures 3a to 3h for a system in which the temperature is fixed at 150 degrees Celsius. The other parameters in the system which may impact the output are also fixed and recorded, for example system flow: 2320ml/min; chip bias 54V and chip gap: 64.19 micron. A sample of air having a fixed concentration of water is passed through the system.Figure 3a plots the dispersion field (rdf) against compensation field (rcf) for the positive mode (i.e. positive ions generated from the water) at 0% water concentration. In this example, 0% water concentration means that no water is added to the gas sample. There is however a background water level present in the air (from a gas cylinder) which is used to flow the sample through the system. Accordingly, water ions are detected at 0% water concentration. Similarly,Figure 3e plots the dispersion field (rdf) against compensation field (rcf) for the negative mode (i.e. negative ions generated by the chemical sample) at 0% water concentration. The intensity of the output is illustrated using the colour coding to the side of the image with the brightest colour indicating the greatest intensity. The highest intensity is above 102 (i.e. above 100) with the scale showing 101 in the middle and 10° towards the lower third of the scale.Figures 3b and3f are the corresponding graphs at a water concentration of 0.5%. BothFigures 3b and3f show a different result when compared to the graphs at a lower water concentration with the change being perhaps the most noticeable for the negative mode.Figures 3c and3g are the corresponding graphs at a water concentration of 1.5% andFigures 3d and3h are the corresponding graphs at a water concentration of 3%. The change is once again more noticeable for the negative mode.Figures 3a to 3h are merely illustrative of the graphs that could be collected at various different water concentrations. - Returning to
Figure 2a , when sufficient outputs have been gathered, the next step S110 is to extract a plurality of locations of peak intensity for the compensation field versus dispersion field outputs. These locations of peak intensity are plotted on a graph of compensation field versus dispersion field. The extraction of the data and its plotting on a graph are done using known techniques. An example of the plot of peak locations is shown inFigure 4a which shows the locations as points on a plot of dispersion field against compensation field. The points for each of the results obtained in the previous steps are plotted, which as shown in this example is at humidity values, of 0%, 0.25%, 0.5%, 1.0%, 1.5%, 2.0%, 2.5% and 3%. - Returning to
Figure 2a , the next step S112 is to plot spectra of dispersion field versus compensation field for each of the concentration levels using the data from the previous step. Each spectrum at a particular concentration level is a line which represents a best fit for the extracted points. The spectra are generated using known techniques. These spectra are shown onFigure 4a but for clarity are reproduced onFigure 4b without the data points.Figure 4b thus shows smooth graphs of the variation in dispersion field and compensation field at each concentration level which as shown in this example is at humidity values, of 0%, 0.25%, 0.5%, 1.0%, 1.5%, 2.0%, 2.5% and 3%.Figure 4b shows the results of the negative mode andFigure 4c is a similar graph for the positive mode. - As shown more clearly in the spectra for the negative mode in
Figure 4b , there is a gradual increase in the value of the dispersion field with decreasing value of compensation field until aturning point 200 at which the compensation field begins to increase with increasing dispersions field value. Returning toFigure 2a , the next step S114 is to extract the value of the compensation field at which these turning points occur in each spectrum. The turning points are extracted using known techniques, for example manually or by fitting a quadratic, differentiating and looking for a zero crossing. These extracted turning points are then plotted on a graph of turning point (measured in Townsends (Td)) against water concentration at the sensor head, i.e. at the location of the FAIMS ion filter itself.Figure 5a and 5b illustrate the plots of turning points which are generated for the negative mode. InFigure 5a , the plots of turning points are for the compensation field only and inFigure 5b , the turning points for both the compensation and dispersion fields are shown separately. These plots are then stored and can then be used to determine the water concentration (i.e. humidity) in which a system is operating as shown inFigure 2b . In other words, the spectrometry system can be used as a humidity sensor. - The first step S200 of
Figure 2b is to plot the dispersion field versus compensation field for the spectrometry system. The next step S202 is to determine the locations of peak intensity in the generated plot. The peak intensity spectrum is then plotted at step S204 and the turning point of the spectrum is determined in step S206. It will be appreciated that these steps correspond to those described above in steps S106, S110 to S114 and thus can be done using the techniques described above or other comparable techniques. - As explained above, various factors are known to influence the field dependence of ion mobility, changing peak positions in the DMS spectra. When using the ion mobility system as a humidity sensor, humidity is not known but other key operating parameters such as temperature and pressure can be determined using the appropriate sensors as shown at step S208. These determined parameters may then be used to select the appropriate plot of turning points which is stored in the database (step S210). For example, the plot of
Figure 4b can be selected when the temperature is 150 degrees Celsius. The selected plot and the extracted turning point are then used to determine the humidity. - The humidity may be determined as illustrated in
Figure 6 . The humidity at the extracted value (which is this example is shown as -2.21) can be determined fromFigure 6 by plotting the extracted value between two known values (one with a value higher than the extracted value and one with a value lower than the extracted values) and extrapolating, by following a line of best fit between these two closest known values, that the humidity value is 1.76% for the extracted turning point. The two known values effectively define a range within which the extracted value is located. It will be appreciated that this is just one way that the value of the humidity can be extracted from the stored values of turning points and humidity and other equivalent methods can be used. For example, the values of turning points and humidity may be stored in a table and extrapolation between the values in the table can used to determine the humidity for a particular turning point. - It will be appreciated that accuracy could be improved by obtaining two turning points, one for the negative mode and one for the positive mode (if turning points exist in both modes) and comparing both of these points with the corresponding graphs. However, if turning points are only available in one mode, accuracy can be improved by using other data, such as the width of each peak or the peak location at a particular value for either the compensation or dispersion field in the mode where there is no turning point.
- For example,
Figure 5c plots the value of the peak location at 140Td in the compensation field against sensor head water concentration. The plot inFigure 5c can be used to verify the humidity value which is obtained using the method above. For example, the method may comprise calculating the peak location for the compensation field for the gas sample under consideration for the extracted spectrum; determining operating parameters of the field asymmetric ion mobility system; and obtaining, from a database, a plurality of known peak locations each of which have an associated humidity value and each of which were obtained using a field asymmetric ion mobility system having operating parameters aligned with the determined operating parameters; and determining a value for the humidity by comparing the calculated peak location with known peak locations. A humidity value which has been calculated using the turning point may be checked against a humidity value determined using peak location (or vice versa). This is particularly useful if the turning point and/or peak location generates more than one humidity value because a single humidity value which appears in both results may then be selected as the output. - Temperature is a known factor which influences ion mobility. Accordingly,
Figures 7a to 7f illustrate the calibration process for the same system set at a different water concentrations and a temperature of 65 degrees Celsius.Figure 7a plots the dispersion field against compensation field for the positive mode (i.e. positive ions generated by the chemical sample) at 0% water concentration. Similarly,Figure 7d plots the dispersion field against compensation field for the negative mode (i.e. positive ions generated by the chemical sample) at 0% water concentration.Figures 7b and7e are the corresponding graphs at a water concentration of 0.5%. BothFigures 7b and7e show a different result when compared to the graphs at a lower water concentration with the change being perhaps the most noticeable for the negative mode and are also different to the graphs at the same concentration at a different temperature.Figures 7c and7f are the corresponding graphs at a water concentration of 1.5%. The change is once again more noticeable for the negative mode.Figures 7a to 7f are merely illustrative of the graphs that could be collected at various different water concentrations. The highest intensity is shown as being above 102 (i.e. above 100) with the scale showing 101 is the middle and 10° towards the lower end of the scale. -
Figures 8a and8b show graphs of the variation in dispersion field and compensation field at each concentration level which as shown in this example is at humidity values, of 0%, 0.25%, 0.5%, 1.0%, 1.5%, 2.0%, 2.5% and 3%.Figure 8a shows the results of the negative mode andFigure 8b is a similar graph for the positive mode. These are created using the same techniques described above in relation toFigures 4b and4c but are clearly different in shape to the correspondingFigures 4b and4c . -
Figure 9 illustrates the plot of turning points against humidity which are generated for the negative mode respectively. This is created using the same techniques described above in relation toFigures 5a and 5b but are clearly different in shape to the correspondingFigures 5a and 5b . Accordingly, these would give a different result in the final step ofFigure 2b and thus it is important to select the correct data plot to use for the analysis. - As shown in
Figure 6 (andFigure 9 ), between 0.25% and 2.5% a single value of humidity is likely to be determined for each turning point. Moreover, there is good differentiation between the turning points in these ranges. Below the value of 0.25%, there is a steep drop in the value of the turning point against concentration. Accordingly, there is a second humidity value for many of the turning point values. However, it is possible to discount these values because they represent an almost completely dry environment which is unlikely. -
Figure 10a plots the locations of each extracted peak at the different concentrations in the positive mode for 150 degrees Celsius. This is determined in a similar manner toFigure 4a for the negative mode.Figures 10b to 10e show the full peak widths at half maximum (FWHM) for a plurality of these peak locations. The number of peak locations which are considered when determining the peak widths may be reduced by considering only ranges of compensation and dispersion field values, e.g. compensation field below 0Td and dispersion field above 100Td for the positive mode and compensation field below -1.4Td and dispersion field above 125Td for the negative mode. For example, inFigures 10b to 10e approximately five locations may be considered for both the positive and negative modes. Each ofFigures 10b to 10e thus plots multiple widths for each humidity value because there are multiple corresponding points inFigures 10a and4a . -
Figure 10b shows the peak width for multiple peak locations at reference values of 130Td (positive mode) and -130Td (negative mode).Figure 10c shows the peak width for the reference values of the dispersion field of 150Td (positive mode) and -150Td (negative mode) respectively.Figure 10d shows the peak width for the reference values of the dispersion field of 170Td (positive mode) and -170Td (negative mode) respectively.Figure 10e shows the peak width for the reference values of the dispersion field of 190Td (positive mode) and - 190Td (negative mode) respectively. - Similarly
Figures 11a and11b plot the locations of each extracted peak at the different concentrations in the positive mode and negative mode respectively for 65 degrees Celsius.Figures 11c to 11e show the full peak widths at half maximum (FWHM) for each of the peak locations. As above, the number of peak locations which are considered may be reduced.Figure 11c shows the peak width for the reference values of the dispersion field of 131Td (positive mode) and -131Td (negative mode) respectively.Figure 11d shows the peak width for the reference values of the dispersion field of 141Td (positive mode) and -141Td (negative mode) respectively.Figure 11e shows the peak width for the reference values of the dispersion field of 151Td (positive mode) and -151Td (negative mode) respectively. - The humidity value can be determined from peak width by plotting the dispersion field against compensation field and extracting the locations of peak intensity as per steps S200 and S202 in the method of
Figure 2b . Thereafter, the widths of the locations of peak intensity which are extracted in step S202 can be determined. The system parameters are also determined as in step S208 ofFigure 2b . In this case, rather than obtaining a stored plot of turning points, a stored plot of peak width against humidity for the system having aligned parameters is obtained and the humidity is determined using this stored plot. Although each of the peak width plots ofFigures 10b to 11e shows various concentration values having a particular peak width, it is possible that some systems have parameters which do not produce multiple values and thus the humidity value can be uniquely determined. Alternatively, the plots can be used to cross-reference (i.e. double check) a humidity value which has been calculated using the turning point as described above. This is particularly useful if the turning point method generates more than one humidity value because the correct one can then be selected as the one which corresponds to a humidity value determined using the peak width. - At least some of the example embodiments described herein may be constructed, partially or wholly, using dedicated special-purpose hardware. Terms such as 'processor' or 'controller' used herein may include, but are not limited to, a hardware device, such as circuitry in the form of discrete or integrated components, a Field Programmable Gate Array (FPGA) or Application Specific Integrated Circuit (ASIC), which performs certain tasks or provides the associated functionality. In some embodiments, the described elements may be configured to reside on a tangible, persistent, addressable storage medium and may be configured to execute on one or more processors. These functional elements may in some embodiments include, by way of example, components, such as software components, object-oriented software components, class components and task components, processes, functions, attributes, procedures, subroutines, segments of program code, drivers, firmware, microcode, circuitry, data, databases, data structures, tables, arrays, and variables. Although the example embodiments have been described with reference to the components discussed herein, such functional elements may be combined into fewer elements or separated into additional elements. Various combinations of optional features have been described herein, and it will be appreciated that described features may be combined in any suitable combination. In particular, the features of any one example embodiment may be combined with features of any other embodiment, as appropriate, except where such combinations are mutually exclusive. Throughout this specification, the term "comprising" or "comprises" means including the component(s) specified but not to the exclusion of the presence of others.
Claims (14)
- A method of determining humidity using a field asymmetric ion mobility system, the method comprising:generating ions within a gas sample flowing through the field asymmetric ion mobility system,applying a compensation field and a dispersion field to the generated ions;measuring an output ion current;extracting a spectrum of peak intensity of the measured output as a function of the compensation field and the dispersion field byplotting the measured output ion current as a function of dispersion field against compensation field;determining points of peak intensity within the plot;generating the spectrum of the peak intensity using the determined points; andgenerating a line graph of peak intensity as a function of the compensation field and the dispersion field;calculating a turning point for the extracted spectrum, wherein the turning point is a stationary point at which a value for the dispersion field stops increasing or decreasing relative to a value of the compensation field;determining operating parameters of the field asymmetric ion mobility system;obtaining, from a database, a plurality of known turning points each of which have an associated humidity value and each of which were obtained using a field asymmetric ion mobility system having operating parameters aligned with the determined operating parameters; anddetermining a value for the humidity by comparing the calculated turning point with known turning points.
- The method of claim 1, wherein calculating a turning point comprises calculating the turning point in the generated line graph.
- The method of any one of claims 1 to 2, wherein determining a value for the humidity comprises determining a pair of known turning points defining a range within which the calculated turning point is located and extrapolating a humidity value for the calculated turning point from the humidity values associated with the pair of known turning points.
- The method of claim 3, wherein determining the humidity comprises determining two pairs of known turning points each of which define a range within which the calculated turning point is located, selecting a preferred pair and extrapolating the humidity value using the preferred pair.
- The method of any one of claims 1 to 4, comprising
generating positive and negative ions;
wherein extracting the spectrum of peak intensity comprises extracting a first spectrum of peak intensity for the negative ions;
wherein obtaining, from the database, comprises obtaining a first plurality of known turning points each of which have an associated humidity and each of which were obtained using negative ions; and
wherein determining the humidity value comprises determining a first humidity value. - The method of claim 5, comprising
extracting a second spectrum of peak intensity for the positive ions;
calculating a second turning point from the second spectrum of peak intensity;
obtaining a second plurality of known turning points each of which have an associated humidity and each of which were obtained using positive ions; and
determining a second humidity value by comparing the second calculated turning point with the second plurality of known turning points. - The method of claim 6, further comprising comparing the first and the second determined humidity values and selecting one of the first and second humidity values as the determined humidity value.
- The method of any one of claims 1 to 7, further comprising determining the humidity value by using peak width or location.
- The method of claim 8, further comprising comparing the humidity value determined using peak width or location with the humidity value determined using turning points.
- The method of any one of claims 1 to 9, further comprising building the database by
setting the operating parameters of a test field asymmetric ion mobility system, wherein the operating parameters include the humidity of a gas sample being sampled by the system;
generating ions within the gas sample flowing through the test field asymmetric ion mobility system,
applying a compensation field and a dispersion field to the generated ions;
measuring an output ion current;
extracting a spectrum of peak intensity of the measured output as a function of the compensation field and the dispersion field;
calculating a turning point for the extracted spectrum; and
storing the calculated turning point together with the set operating parameters wherein the calculated turning point is associated with the set humidity. - The method of claim 10, further comprising calculating peak location and/or peak width for the extracted spectrum; and storing the calculated peak location and/or peak width together with the set operating parameters wherein the calculated peak location and/or peak width is associated with the set humidity.
- The method of claim 10 or claim 11, further comprising adjusting the humidity of the gas sample flowing through the test field asymmetric ion mobility system and repeating the generating, applying, measuring, extracting and storing steps.
- The method of claim 10, claim 11 or claim 12, further comprising adjusting an operating parameter of the test field asymmetric ion mobility system and repeating the generating, applying, measuring, extracting and storing steps.
- A spectrometry system comprising:an ionizer (10) for generating ions within a gas sample, wherein each ion has an associated ion mobility;an ion filter (12, 100) for separating the ions by applying a compensation field and a dispersion field to the generated ions;a detector (14, 110) for detecting an output from the ion filter (12, 100); anda processor (120) configured to extract a spectrum of peak intensity of the detected output as a function of the compensation field and the dispersion field byplotting the measured output ion current as a function of dispersion field against compensation field;determining points of peak intensity within the plot;generating the spectrum of the peak intensity using the determined points; andgenerating a line graph of peak intensity as a function of the compensation field and the dispersion field;calculate a turning point for the extracted spectrum, wherein the turning point is a stationary point at which a value for the dispersion field stops increasing or decreasing relative to a value of the compensation field;determine operating parameters of the field asymmetric ion mobility system;obtain, from a database (140), a plurality of known turning points each of which have an associated humidity and each of which were obtained using a field asymmetric ion mobility system having operating parameters aligned with the determined operating parameters;determine the humidity by comparing the calculated turning point with known turning points.
Applications Claiming Priority (2)
| Application Number | Priority Date | Filing Date | Title |
|---|---|---|---|
| GB1719819.3A GB2573978B (en) | 2017-11-29 | 2017-11-29 | Spectrometry System |
| PCT/GB2018/053460 WO2019106373A1 (en) | 2017-11-29 | 2018-11-29 | Spectrometry system |
Publications (2)
| Publication Number | Publication Date |
|---|---|
| EP3717894A1 EP3717894A1 (en) | 2020-10-07 |
| EP3717894B1 true EP3717894B1 (en) | 2021-04-28 |
Family
ID=60950575
Family Applications (1)
| Application Number | Title | Priority Date | Filing Date |
|---|---|---|---|
| EP18815303.5A Active EP3717894B1 (en) | 2017-11-29 | 2018-11-29 | Spectrometry system |
Country Status (5)
| Country | Link |
|---|---|
| US (1) | US11513098B2 (en) |
| EP (1) | EP3717894B1 (en) |
| CN (1) | CN111406210B (en) |
| GB (1) | GB2573978B (en) |
| WO (1) | WO2019106373A1 (en) |
Families Citing this family (2)
| Publication number | Priority date | Publication date | Assignee | Title |
|---|---|---|---|---|
| CN116359320B (en) * | 2023-03-20 | 2025-11-28 | 中国科学院合肥物质科学研究院 | A method and apparatus for rapid scanning and spectral correction of ion mobility spectra. |
| CN119224691B (en) * | 2024-12-03 | 2025-03-21 | 浙江大华技术股份有限公司 | Sound source localization method, device and storage medium |
Citations (1)
| Publication number | Priority date | Publication date | Assignee | Title |
|---|---|---|---|---|
| US20140061459A1 (en) * | 2012-03-29 | 2014-03-06 | Owlstone Nanotech Inc | Field asymmetric ion mobility spectrometry system |
Family Cites Families (5)
| Publication number | Priority date | Publication date | Assignee | Title |
|---|---|---|---|---|
| EP1756561A1 (en) * | 2004-04-28 | 2007-02-28 | Sionex Corporation | System and method for ion species analysis with enhanced condition control and data interpretation using differential mobility spectrometers |
| GB0417184D0 (en) * | 2004-08-02 | 2004-09-01 | Owlstone Ltd | Microchip ion mobility spectrometer |
| US8207493B2 (en) * | 2007-05-14 | 2012-06-26 | Chemring Detection Systems, Inc. | Chemical detection system and method using a prediction methodology |
| WO2009092007A1 (en) * | 2008-01-16 | 2009-07-23 | General Dynamics Armament And Technical Products, Inc. | Chemical detection system and method |
| JP6278658B2 (en) * | 2013-10-24 | 2018-02-14 | アトナープ株式会社 | Analysis method |
-
2017
- 2017-11-29 GB GB1719819.3A patent/GB2573978B/en active Active
-
2018
- 2018-11-29 US US16/767,264 patent/US11513098B2/en active Active
- 2018-11-29 WO PCT/GB2018/053460 patent/WO2019106373A1/en not_active Ceased
- 2018-11-29 CN CN201880076525.XA patent/CN111406210B/en active Active
- 2018-11-29 EP EP18815303.5A patent/EP3717894B1/en active Active
Patent Citations (1)
| Publication number | Priority date | Publication date | Assignee | Title |
|---|---|---|---|---|
| US20140061459A1 (en) * | 2012-03-29 | 2014-03-06 | Owlstone Nanotech Inc | Field asymmetric ion mobility spectrometry system |
Also Published As
| Publication number | Publication date |
|---|---|
| EP3717894A1 (en) | 2020-10-07 |
| CN111406210A (en) | 2020-07-10 |
| GB2573978B (en) | 2020-06-03 |
| WO2019106373A1 (en) | 2019-06-06 |
| CN111406210B (en) | 2023-10-27 |
| US11513098B2 (en) | 2022-11-29 |
| US20210025850A1 (en) | 2021-01-28 |
| GB201719819D0 (en) | 2018-01-10 |
| GB2573978A (en) | 2019-11-27 |
Similar Documents
| Publication | Publication Date | Title |
|---|---|---|
| JP5452578B2 (en) | Ultra-compact asymmetric field ion mobility filter and detection system | |
| US8502138B2 (en) | Integrated ion mobility spectrometer | |
| CN105793701B (en) | Mass analysis method and quality analysis apparatus | |
| US6190316B1 (en) | Method of mass-analyzing body fluid and apparatus therefor | |
| US20110056371A1 (en) | Sensor | |
| JP4782801B2 (en) | Tandem differential mobile ion electromobility meter for chemical vapor detection | |
| CN104979158B (en) | The method for assessing the vacuum condition in mass spectrograph | |
| US20050211891A1 (en) | A-priori biomarker knowledge based mass filtering for enhanced biomarker detection | |
| GB2586710A (en) | Chromatography mass spectrometry method, and chromatograph mass spectrometry device | |
| CN110108778A (en) | A kind of UV-FAIMS quantitative detecting method of volatile organic matter | |
| US20200278319A1 (en) | Ion Mobility Filter | |
| US11513098B2 (en) | Spectrometry system | |
| US9716001B2 (en) | Method for analyzing ionic structure | |
| CN104934286B (en) | A kind of high-resolution High-Field asymmetric waveform ion mobility spectrometer and substance detecting method thereof | |
| JP6278658B2 (en) | Analysis method | |
| RU2706420C1 (en) | Combined device for gravimetric and chemical analysis of aerosols | |
| JP2001028252A (en) | Mass spectrometry | |
| US12196708B2 (en) | Sensor system | |
| RU2354963C1 (en) | Method of detecting organic molecules | |
| US3569825A (en) | Corona discharge plasma oscillation gas trace detector | |
| WO2019058115A1 (en) | Spectrometry system | |
| US20190187096A1 (en) | Method and apparatus for analyzing a sample by high-field asymmetric waveform ion mobility-mass spectrometry | |
| CN114720551B (en) | Method for rapidly identifying aging years of pericarpium citri reticulatae by fusing multiple sample introduction modes | |
| JPH06507472A (en) | Method for detecting foreign substances in gas | |
| US20140061459A1 (en) | Field asymmetric ion mobility spectrometry system |
Legal Events
| Date | Code | Title | Description |
|---|---|---|---|
| STAA | Information on the status of an ep patent application or granted ep patent |
Free format text: STATUS: UNKNOWN |
|
| STAA | Information on the status of an ep patent application or granted ep patent |
Free format text: STATUS: THE INTERNATIONAL PUBLICATION HAS BEEN MADE |
|
| PUAI | Public reference made under article 153(3) epc to a published international application that has entered the european phase |
Free format text: ORIGINAL CODE: 0009012 |
|
| STAA | Information on the status of an ep patent application or granted ep patent |
Free format text: STATUS: REQUEST FOR EXAMINATION WAS MADE |
|
| 17P | Request for examination filed |
Effective date: 20200623 |
|
| AK | Designated contracting states |
Kind code of ref document: A1 Designated state(s): AL AT BE BG CH CY CZ DE DK EE ES FI FR GB GR HR HU IE IS IT LI LT LU LV MC MK MT NL NO PL PT RO RS SE SI SK SM TR |
|
| AX | Request for extension of the european patent |
Extension state: BA ME |
|
| GRAP | Despatch of communication of intention to grant a patent |
Free format text: ORIGINAL CODE: EPIDOSNIGR1 |
|
| STAA | Information on the status of an ep patent application or granted ep patent |
Free format text: STATUS: GRANT OF PATENT IS INTENDED |
|
| DAV | Request for validation of the european patent (deleted) | ||
| DAX | Request for extension of the european patent (deleted) | ||
| INTG | Intention to grant announced |
Effective date: 20201126 |
|
| RIN1 | Information on inventor provided before grant (corrected) |
Inventor name: FEW, JULIAN WILLIAM Inventor name: MARQUEZ SILLERO, ISABEL Inventor name: ALLSWORTH, MAX Inventor name: PEARSON, JON |
|
| GRAS | Grant fee paid |
Free format text: ORIGINAL CODE: EPIDOSNIGR3 |
|
| GRAA | (expected) grant |
Free format text: ORIGINAL CODE: 0009210 |
|
| STAA | Information on the status of an ep patent application or granted ep patent |
Free format text: STATUS: THE PATENT HAS BEEN GRANTED |
|
| AK | Designated contracting states |
Kind code of ref document: B1 Designated state(s): AL AT BE BG CH CY CZ DE DK EE ES FI FR GR HR HU IE IS IT LI LT LU LV MC MK MT NL NO PL PT RO RS SE SI SK SM TR |
|
| RBV | Designated contracting states (corrected) |
Designated state(s): AL AT BE BG CH CY CZ DE DK EE ES FI FR GR HR HU IE IS IT LI LT LU LV MC MK MT NL NO PL PT RO RS SE SI SK SM TR |
|
| REG | Reference to a national code |
Ref country code: CH Ref legal event code: EP |
|
| REG | Reference to a national code |
Ref country code: AT Ref legal event code: REF Ref document number: 1387626 Country of ref document: AT Kind code of ref document: T Effective date: 20210515 |
|
| REG | Reference to a national code |
Ref country code: DE Ref legal event code: R096 Ref document number: 602018016363 Country of ref document: DE |
|
| REG | Reference to a national code |
Ref country code: IE Ref legal event code: FG4D |
|
| REG | Reference to a national code |
Ref country code: LT Ref legal event code: MG9D |
|
| REG | Reference to a national code |
Ref country code: AT Ref legal event code: MK05 Ref document number: 1387626 Country of ref document: AT Kind code of ref document: T Effective date: 20210428 |
|
| PG25 | Lapsed in a contracting state [announced via postgrant information from national office to epo] |
Ref country code: FI Free format text: LAPSE BECAUSE OF FAILURE TO SUBMIT A TRANSLATION OF THE DESCRIPTION OR TO PAY THE FEE WITHIN THE PRESCRIBED TIME-LIMIT Effective date: 20210428 Ref country code: LT Free format text: LAPSE BECAUSE OF FAILURE TO SUBMIT A TRANSLATION OF THE DESCRIPTION OR TO PAY THE FEE WITHIN THE PRESCRIBED TIME-LIMIT Effective date: 20210428 Ref country code: HR Free format text: LAPSE BECAUSE OF FAILURE TO SUBMIT A TRANSLATION OF THE DESCRIPTION OR TO PAY THE FEE WITHIN THE PRESCRIBED TIME-LIMIT Effective date: 20210428 Ref country code: NL Free format text: LAPSE BECAUSE OF FAILURE TO SUBMIT A TRANSLATION OF THE DESCRIPTION OR TO PAY THE FEE WITHIN THE PRESCRIBED TIME-LIMIT Effective date: 20210428 Ref country code: AT Free format text: LAPSE BECAUSE OF FAILURE TO SUBMIT A TRANSLATION OF THE DESCRIPTION OR TO PAY THE FEE WITHIN THE PRESCRIBED TIME-LIMIT Effective date: 20210428 Ref country code: BG Free format text: LAPSE BECAUSE OF FAILURE TO SUBMIT A TRANSLATION OF THE DESCRIPTION OR TO PAY THE FEE WITHIN THE PRESCRIBED TIME-LIMIT Effective date: 20210728 |
|
| PG25 | Lapsed in a contracting state [announced via postgrant information from national office to epo] |
Ref country code: IS Free format text: LAPSE BECAUSE OF FAILURE TO SUBMIT A TRANSLATION OF THE DESCRIPTION OR TO PAY THE FEE WITHIN THE PRESCRIBED TIME-LIMIT Effective date: 20210828 Ref country code: GR Free format text: LAPSE BECAUSE OF FAILURE TO SUBMIT A TRANSLATION OF THE DESCRIPTION OR TO PAY THE FEE WITHIN THE PRESCRIBED TIME-LIMIT Effective date: 20210729 Ref country code: RS Free format text: LAPSE BECAUSE OF FAILURE TO SUBMIT A TRANSLATION OF THE DESCRIPTION OR TO PAY THE FEE WITHIN THE PRESCRIBED TIME-LIMIT Effective date: 20210428 Ref country code: PT Free format text: LAPSE BECAUSE OF FAILURE TO SUBMIT A TRANSLATION OF THE DESCRIPTION OR TO PAY THE FEE WITHIN THE PRESCRIBED TIME-LIMIT Effective date: 20210830 Ref country code: SE Free format text: LAPSE BECAUSE OF FAILURE TO SUBMIT A TRANSLATION OF THE DESCRIPTION OR TO PAY THE FEE WITHIN THE PRESCRIBED TIME-LIMIT Effective date: 20210428 Ref country code: PL Free format text: LAPSE BECAUSE OF FAILURE TO SUBMIT A TRANSLATION OF THE DESCRIPTION OR TO PAY THE FEE WITHIN THE PRESCRIBED TIME-LIMIT Effective date: 20210428 Ref country code: LV Free format text: LAPSE BECAUSE OF FAILURE TO SUBMIT A TRANSLATION OF THE DESCRIPTION OR TO PAY THE FEE WITHIN THE PRESCRIBED TIME-LIMIT Effective date: 20210428 Ref country code: NO Free format text: LAPSE BECAUSE OF FAILURE TO SUBMIT A TRANSLATION OF THE DESCRIPTION OR TO PAY THE FEE WITHIN THE PRESCRIBED TIME-LIMIT Effective date: 20210728 |
|
| REG | Reference to a national code |
Ref country code: NL Ref legal event code: MP Effective date: 20210428 |
|
| PG25 | Lapsed in a contracting state [announced via postgrant information from national office to epo] |
Ref country code: EE Free format text: LAPSE BECAUSE OF FAILURE TO SUBMIT A TRANSLATION OF THE DESCRIPTION OR TO PAY THE FEE WITHIN THE PRESCRIBED TIME-LIMIT Effective date: 20210428 Ref country code: ES Free format text: LAPSE BECAUSE OF FAILURE TO SUBMIT A TRANSLATION OF THE DESCRIPTION OR TO PAY THE FEE WITHIN THE PRESCRIBED TIME-LIMIT Effective date: 20210428 Ref country code: SK Free format text: LAPSE BECAUSE OF FAILURE TO SUBMIT A TRANSLATION OF THE DESCRIPTION OR TO PAY THE FEE WITHIN THE PRESCRIBED TIME-LIMIT Effective date: 20210428 Ref country code: DK Free format text: LAPSE BECAUSE OF FAILURE TO SUBMIT A TRANSLATION OF THE DESCRIPTION OR TO PAY THE FEE WITHIN THE PRESCRIBED TIME-LIMIT Effective date: 20210428 Ref country code: CZ Free format text: LAPSE BECAUSE OF FAILURE TO SUBMIT A TRANSLATION OF THE DESCRIPTION OR TO PAY THE FEE WITHIN THE PRESCRIBED TIME-LIMIT Effective date: 20210428 Ref country code: RO Free format text: LAPSE BECAUSE OF FAILURE TO SUBMIT A TRANSLATION OF THE DESCRIPTION OR TO PAY THE FEE WITHIN THE PRESCRIBED TIME-LIMIT Effective date: 20210428 Ref country code: SM Free format text: LAPSE BECAUSE OF FAILURE TO SUBMIT A TRANSLATION OF THE DESCRIPTION OR TO PAY THE FEE WITHIN THE PRESCRIBED TIME-LIMIT Effective date: 20210428 |
|
| REG | Reference to a national code |
Ref country code: DE Ref legal event code: R097 Ref document number: 602018016363 Country of ref document: DE |
|
| PLBE | No opposition filed within time limit |
Free format text: ORIGINAL CODE: 0009261 |
|
| STAA | Information on the status of an ep patent application or granted ep patent |
Free format text: STATUS: NO OPPOSITION FILED WITHIN TIME LIMIT |
|
| 26N | No opposition filed |
Effective date: 20220131 |
|
| PG25 | Lapsed in a contracting state [announced via postgrant information from national office to epo] |
Ref country code: IS Free format text: LAPSE BECAUSE OF FAILURE TO SUBMIT A TRANSLATION OF THE DESCRIPTION OR TO PAY THE FEE WITHIN THE PRESCRIBED TIME-LIMIT Effective date: 20210828 Ref country code: AL Free format text: LAPSE BECAUSE OF FAILURE TO SUBMIT A TRANSLATION OF THE DESCRIPTION OR TO PAY THE FEE WITHIN THE PRESCRIBED TIME-LIMIT Effective date: 20210428 |
|
| PG25 | Lapsed in a contracting state [announced via postgrant information from national office to epo] |
Ref country code: MC Free format text: LAPSE BECAUSE OF FAILURE TO SUBMIT A TRANSLATION OF THE DESCRIPTION OR TO PAY THE FEE WITHIN THE PRESCRIBED TIME-LIMIT Effective date: 20210428 |
|
| REG | Reference to a national code |
Ref country code: CH Ref legal event code: PL |
|
| PG25 | Lapsed in a contracting state [announced via postgrant information from national office to epo] |
Ref country code: LU Free format text: LAPSE BECAUSE OF NON-PAYMENT OF DUE FEES Effective date: 20211129 Ref country code: IT Free format text: LAPSE BECAUSE OF FAILURE TO SUBMIT A TRANSLATION OF THE DESCRIPTION OR TO PAY THE FEE WITHIN THE PRESCRIBED TIME-LIMIT Effective date: 20210428 Ref country code: BE Free format text: LAPSE BECAUSE OF NON-PAYMENT OF DUE FEES Effective date: 20211130 |
|
| REG | Reference to a national code |
Ref country code: BE Ref legal event code: MM Effective date: 20211130 |
|
| PG25 | Lapsed in a contracting state [announced via postgrant information from national office to epo] |
Ref country code: LI Free format text: LAPSE BECAUSE OF NON-PAYMENT OF DUE FEES Effective date: 20211130 Ref country code: CH Free format text: LAPSE BECAUSE OF NON-PAYMENT OF DUE FEES Effective date: 20211130 |
|
| PG25 | Lapsed in a contracting state [announced via postgrant information from national office to epo] |
Ref country code: IE Free format text: LAPSE BECAUSE OF NON-PAYMENT OF DUE FEES Effective date: 20211129 |
|
| P01 | Opt-out of the competence of the unified patent court (upc) registered |
Effective date: 20230508 |
|
| PG25 | Lapsed in a contracting state [announced via postgrant information from national office to epo] |
Ref country code: CY Free format text: LAPSE BECAUSE OF FAILURE TO SUBMIT A TRANSLATION OF THE DESCRIPTION OR TO PAY THE FEE WITHIN THE PRESCRIBED TIME-LIMIT Effective date: 20210428 |
|
| PG25 | Lapsed in a contracting state [announced via postgrant information from national office to epo] |
Ref country code: HU Free format text: LAPSE BECAUSE OF FAILURE TO SUBMIT A TRANSLATION OF THE DESCRIPTION OR TO PAY THE FEE WITHIN THE PRESCRIBED TIME-LIMIT; INVALID AB INITIO Effective date: 20181129 |
|
| PG25 | Lapsed in a contracting state [announced via postgrant information from national office to epo] |
Ref country code: MK Free format text: LAPSE BECAUSE OF FAILURE TO SUBMIT A TRANSLATION OF THE DESCRIPTION OR TO PAY THE FEE WITHIN THE PRESCRIBED TIME-LIMIT Effective date: 20210428 |
|
| PG25 | Lapsed in a contracting state [announced via postgrant information from national office to epo] |
Ref country code: TR Free format text: LAPSE BECAUSE OF FAILURE TO SUBMIT A TRANSLATION OF THE DESCRIPTION OR TO PAY THE FEE WITHIN THE PRESCRIBED TIME-LIMIT Effective date: 20210428 |
|
| PG25 | Lapsed in a contracting state [announced via postgrant information from national office to epo] |
Ref country code: MT Free format text: LAPSE BECAUSE OF FAILURE TO SUBMIT A TRANSLATION OF THE DESCRIPTION OR TO PAY THE FEE WITHIN THE PRESCRIBED TIME-LIMIT Effective date: 20210428 |
|
| PGFP | Annual fee paid to national office [announced via postgrant information from national office to epo] |
Ref country code: DE Payment date: 20251119 Year of fee payment: 8 |
|
| PGFP | Annual fee paid to national office [announced via postgrant information from national office to epo] |
Ref country code: FR Payment date: 20251126 Year of fee payment: 8 |