EP3706906B1 - Rapid assessment device for radiation exposure - Google Patents
Rapid assessment device for radiation exposure Download PDFInfo
- Publication number
- EP3706906B1 EP3706906B1 EP18887794.8A EP18887794A EP3706906B1 EP 3706906 B1 EP3706906 B1 EP 3706906B1 EP 18887794 A EP18887794 A EP 18887794A EP 3706906 B1 EP3706906 B1 EP 3706906B1
- Authority
- EP
- European Patent Office
- Prior art keywords
- pcr
- region
- microchannel
- sample
- lysing
- Prior art date
- Legal status (The legal status is an assumption and is not a legal conclusion. Google has not performed a legal analysis and makes no representation as to the accuracy of the status listed.)
- Active
Links
Images












Classifications
-
- B—PERFORMING OPERATIONS; TRANSPORTING
- B01—PHYSICAL OR CHEMICAL PROCESSES OR APPARATUS IN GENERAL
- B01L—CHEMICAL OR PHYSICAL LABORATORY APPARATUS FOR GENERAL USE
- B01L3/00—Containers or dishes for laboratory use, e.g. laboratory glassware; Droppers
- B01L3/50—Containers for the purpose of retaining a material to be analysed, e.g. test tubes
- B01L3/502—Containers for the purpose of retaining a material to be analysed, e.g. test tubes with fluid transport, e.g. in multi-compartment structures
- B01L3/5027—Containers for the purpose of retaining a material to be analysed, e.g. test tubes with fluid transport, e.g. in multi-compartment structures by integrated microfluidic structures, i.e. dimensions of channels and chambers are such that surface tension forces are important, e.g. lab-on-a-chip
- B01L3/502715—Containers for the purpose of retaining a material to be analysed, e.g. test tubes with fluid transport, e.g. in multi-compartment structures by integrated microfluidic structures, i.e. dimensions of channels and chambers are such that surface tension forces are important, e.g. lab-on-a-chip characterised by interfacing components, e.g. fluidic, electrical, optical or mechanical interfaces
-
- B—PERFORMING OPERATIONS; TRANSPORTING
- B01—PHYSICAL OR CHEMICAL PROCESSES OR APPARATUS IN GENERAL
- B01L—CHEMICAL OR PHYSICAL LABORATORY APPARATUS FOR GENERAL USE
- B01L7/00—Heating or cooling apparatus; Heat insulating devices
- B01L7/52—Heating or cooling apparatus; Heat insulating devices with provision for submitting samples to a predetermined sequence of different temperatures, e.g. for treating nucleic acid samples
- B01L7/525—Heating or cooling apparatus; Heat insulating devices with provision for submitting samples to a predetermined sequence of different temperatures, e.g. for treating nucleic acid samples with physical movement of samples between temperature zones
-
- B—PERFORMING OPERATIONS; TRANSPORTING
- B01—PHYSICAL OR CHEMICAL PROCESSES OR APPARATUS IN GENERAL
- B01L—CHEMICAL OR PHYSICAL LABORATORY APPARATUS FOR GENERAL USE
- B01L3/00—Containers or dishes for laboratory use, e.g. laboratory glassware; Droppers
- B01L3/50—Containers for the purpose of retaining a material to be analysed, e.g. test tubes
- B01L3/502—Containers for the purpose of retaining a material to be analysed, e.g. test tubes with fluid transport, e.g. in multi-compartment structures
- B01L3/5027—Containers for the purpose of retaining a material to be analysed, e.g. test tubes with fluid transport, e.g. in multi-compartment structures by integrated microfluidic structures, i.e. dimensions of channels and chambers are such that surface tension forces are important, e.g. lab-on-a-chip
- B01L3/502761—Containers for the purpose of retaining a material to be analysed, e.g. test tubes with fluid transport, e.g. in multi-compartment structures by integrated microfluidic structures, i.e. dimensions of channels and chambers are such that surface tension forces are important, e.g. lab-on-a-chip specially adapted for handling suspended solids or molecules independently from the bulk fluid flow, e.g. for trapping or sorting beads or physically stretching molecules
-
- C—CHEMISTRY; METALLURGY
- C12—BIOCHEMISTRY; BEER; SPIRITS; WINE; VINEGAR; MICROBIOLOGY; ENZYMOLOGY; MUTATION OR GENETIC ENGINEERING
- C12Q—MEASURING OR TESTING PROCESSES INVOLVING ENZYMES, NUCLEIC ACIDS OR MICROORGANISMS; COMPOSITIONS OR TEST PAPERS THEREFOR; PROCESSES OF PREPARING SUCH COMPOSITIONS; CONDITION-RESPONSIVE CONTROL IN MICROBIOLOGICAL OR ENZYMOLOGICAL PROCESSES
- C12Q1/00—Measuring or testing processes involving enzymes, nucleic acids or microorganisms; Compositions therefor; Processes of preparing such compositions
- C12Q1/68—Measuring or testing processes involving enzymes, nucleic acids or microorganisms; Compositions therefor; Processes of preparing such compositions involving nucleic acids
- C12Q1/6844—Nucleic acid amplification reactions
- C12Q1/686—Polymerase chain reaction [PCR]
-
- B—PERFORMING OPERATIONS; TRANSPORTING
- B01—PHYSICAL OR CHEMICAL PROCESSES OR APPARATUS IN GENERAL
- B01L—CHEMICAL OR PHYSICAL LABORATORY APPARATUS FOR GENERAL USE
- B01L2200/00—Solutions for specific problems relating to chemical or physical laboratory apparatus
- B01L2200/10—Integrating sample preparation and analysis in single entity, e.g. lab-on-a-chip concept
-
- B—PERFORMING OPERATIONS; TRANSPORTING
- B01—PHYSICAL OR CHEMICAL PROCESSES OR APPARATUS IN GENERAL
- B01L—CHEMICAL OR PHYSICAL LABORATORY APPARATUS FOR GENERAL USE
- B01L2300/00—Additional constructional details
- B01L2300/06—Auxiliary integrated devices, integrated components
- B01L2300/0681—Filter
-
- B—PERFORMING OPERATIONS; TRANSPORTING
- B01—PHYSICAL OR CHEMICAL PROCESSES OR APPARATUS IN GENERAL
- B01L—CHEMICAL OR PHYSICAL LABORATORY APPARATUS FOR GENERAL USE
- B01L2300/00—Additional constructional details
- B01L2300/08—Geometry, shape and general structure
- B01L2300/0809—Geometry, shape and general structure rectangular shaped
- B01L2300/0816—Cards, e.g. flat sample carriers usually with flow in two horizontal directions
-
- B—PERFORMING OPERATIONS; TRANSPORTING
- B01—PHYSICAL OR CHEMICAL PROCESSES OR APPARATUS IN GENERAL
- B01L—CHEMICAL OR PHYSICAL LABORATORY APPARATUS FOR GENERAL USE
- B01L2300/00—Additional constructional details
- B01L2300/08—Geometry, shape and general structure
- B01L2300/0861—Configuration of multiple channels and/or chambers in a single devices
- B01L2300/0867—Multiple inlets and one sample wells, e.g. mixing, dilution
-
- B—PERFORMING OPERATIONS; TRANSPORTING
- B01—PHYSICAL OR CHEMICAL PROCESSES OR APPARATUS IN GENERAL
- B01L—CHEMICAL OR PHYSICAL LABORATORY APPARATUS FOR GENERAL USE
- B01L2300/00—Additional constructional details
- B01L2300/08—Geometry, shape and general structure
- B01L2300/0861—Configuration of multiple channels and/or chambers in a single devices
- B01L2300/0883—Serpentine channels
-
- B—PERFORMING OPERATIONS; TRANSPORTING
- B01—PHYSICAL OR CHEMICAL PROCESSES OR APPARATUS IN GENERAL
- B01L—CHEMICAL OR PHYSICAL LABORATORY APPARATUS FOR GENERAL USE
- B01L2300/00—Additional constructional details
- B01L2300/12—Specific details about materials
- B01L2300/123—Flexible; Elastomeric
-
- B—PERFORMING OPERATIONS; TRANSPORTING
- B01—PHYSICAL OR CHEMICAL PROCESSES OR APPARATUS IN GENERAL
- B01L—CHEMICAL OR PHYSICAL LABORATORY APPARATUS FOR GENERAL USE
- B01L2400/00—Moving or stopping fluids
- B01L2400/04—Moving fluids with specific forces or mechanical means
- B01L2400/0475—Moving fluids with specific forces or mechanical means specific mechanical means and fluid pressure
- B01L2400/0487—Moving fluids with specific forces or mechanical means specific mechanical means and fluid pressure fluid pressure, pneumatics
-
- B—PERFORMING OPERATIONS; TRANSPORTING
- B01—PHYSICAL OR CHEMICAL PROCESSES OR APPARATUS IN GENERAL
- B01L—CHEMICAL OR PHYSICAL LABORATORY APPARATUS FOR GENERAL USE
- B01L2400/00—Moving or stopping fluids
- B01L2400/08—Regulating or influencing the flow resistance
- B01L2400/084—Passive control of flow resistance
- B01L2400/086—Passive control of flow resistance using baffles or other fixed flow obstructions
-
- B—PERFORMING OPERATIONS; TRANSPORTING
- B01—PHYSICAL OR CHEMICAL PROCESSES OR APPARATUS IN GENERAL
- B01L—CHEMICAL OR PHYSICAL LABORATORY APPARATUS FOR GENERAL USE
- B01L3/00—Containers or dishes for laboratory use, e.g. laboratory glassware; Droppers
- B01L3/50—Containers for the purpose of retaining a material to be analysed, e.g. test tubes
- B01L3/502—Containers for the purpose of retaining a material to be analysed, e.g. test tubes with fluid transport, e.g. in multi-compartment structures
- B01L3/5027—Containers for the purpose of retaining a material to be analysed, e.g. test tubes with fluid transport, e.g. in multi-compartment structures by integrated microfluidic structures, i.e. dimensions of channels and chambers are such that surface tension forces are important, e.g. lab-on-a-chip
- B01L3/50273—Containers for the purpose of retaining a material to be analysed, e.g. test tubes with fluid transport, e.g. in multi-compartment structures by integrated microfluidic structures, i.e. dimensions of channels and chambers are such that surface tension forces are important, e.g. lab-on-a-chip characterised by the means or forces applied to move the fluids
-
- B—PERFORMING OPERATIONS; TRANSPORTING
- B01—PHYSICAL OR CHEMICAL PROCESSES OR APPARATUS IN GENERAL
- B01L—CHEMICAL OR PHYSICAL LABORATORY APPARATUS FOR GENERAL USE
- B01L7/00—Heating or cooling apparatus; Heat insulating devices
- B01L7/52—Heating or cooling apparatus; Heat insulating devices with provision for submitting samples to a predetermined sequence of different temperatures, e.g. for treating nucleic acid samples
Definitions
- the present disclosure relates generally to a method and apparatus to analyze components in a sample and in particular to determining an individual's level of exposure to radiation.
- bio-dosimetry The ability to determine an individual's level of exposure to ionizing radiation (bio-dosimetry) due to a nuclear event is critical in the performing of triaging and determining the appropriate medical treatment of the exposed individuals. The following is a review of the current art for bio-dosimetry.
- Molecular responses to ionizing radiation exposure fall in three broad categories according to the type of biomolecule chosen for analysis. These responses involve DNA, RNA, and protein.
- DNA responses occur first in the cell, i.e. DNA damage by radiation occurs instantly upon exposure.
- repair of the damage can take hours or even days to weeks, depending on the cell type and the nature of the damage.
- DNA damage occurs in several broad categories, including chromosomal breaks and rearrangements that are visible through the microscope, and point mutations including small (submicroscopic) deletions / insertions / rearrangements. Detection of chromosomal events is slow because the steps needed for their identification typically require cell culture followed by time-consuming analysis involving trained observers. The turn-around time is typically several days. Some chromosomal changes can be observed in cells that have not been cultured to metaphase, but these approaches require hybridization technologies followed by manual scoring involving trained observers.
- micronuclei are formed by chromosomal fragments and by disruption of the mitotic spindle apparatus. Micronuclei are rare events and, in humans, erythrocytes bearing micronuclei are very efficiently filtered out by the spleen. In individuals who have had their spleen removed, micronucleated erythrocytes are not filtered out, and because the micronuclei are readily visible they can be efficiently counted by manual and by flow cytometric means. However, only about one adult per 1000 has been splenectomized, effectively negating this assay from broad-based population monitoring.
- Another flow-cytometry-based approach might involve the analysis of rearranged chromosomes, e.g. dicentrics and/or translocations.
- chromosomes that have undergone radiation-induced rearrangements would be detected and enumerated.
- Rearranged chromosomes would appear to be bi-colored because they would have been hybridized with whole chromosome paints in a manner that is analogous to in situ hybridization.
- the chromosomes would need to remain in solution, meaning that hybridizations would also have to occur in solution.
- proteins are the least well-characterized. There are several reasons why proteins may not be the subject of much research effort. First, the number of proteins is very large, perhaps an order of magnitude greater than the number of genes due to alternative splicing of mRNA and post-translational modification such as phosphorylation. Second, proteins often occur in complexes, sometimes making it difficult to enumerate quantities of specific peptide sequences. Third, proteins are all-too-readily denatured, which can interfere with common analysis methods such as enzyme-linked immunosorbent assay (ELISA).
- ELISA enzyme-linked immunosorbent assay
- RNA The third category of biological response to radiation is RNA.
- Specific RNA sequences are known to respond to ionizing radiation.
- US 2016/199835 A1 and US 2012/178091 A1 describe microfluidic cartridges for polymerase chain reaction (PCR) according to the state of the art.
- RNA levels can be quantified quickly, easily, and inexpensively. Cell culture is not required, and every tissue contains RNA, so the analyses are not limited to a particular cell type. Significantly, RNA is readily reverse-transcribed into cDNA which can be amplified via the polymerase chain reaction (PCR) and quantified by real-time PCR. This means that very small amounts of tissue can be analyzed rapidly, efficiently, and quantitatively. Furthermore, RNA analyses take advantage of the very rapid response to ionizing radiation. Further, specific sequences of RNA undergo increased expression within an hour of exposure, while other genes continue to have elevated expression up to 24 hours, providing a flexible range of options for performing bio-dosimetry.
- PCR polymerase chain reaction
- a portable bio-dosimetry system that can perform rapid and reliable testing of radiation exposure is needed.
- a handheld field deployable real-time quantitative polymerase chain reaction (qPCR) based system that can assess exposure of individuals to ionizing radiation based on the levels of specific mRNA sequences present in the leukocytes from a drop of blood.
- the drop of blood may be obtained, for example, by a finger stick in a field or triage setting following a nuclear event.
- the system can predict whether an individual has received a dose of ionizing radiation greater than or less than a predetermined threshold value to allow field medical personnel to identify individuals in urgent need of medical treatment and to determine exposure levels to aid in medical treatment.
- the portable-dosimetry system includes sub-systems for receiving a blood sample from a person, lysing (breaking up of) blood cells from the blood sample into component parts including mRNA, binding the mRNA in a binding region for further processing while discarding waste from the lysing process, converting the bound mRNA to complimentary cDNA and performing quantitative polymerase chain reaction (qPCR) on the complimentary cDNA.
- qPCR quantitative polymerase chain reaction
- FIGS 1-4 illustrate an example bio-dosimetry system 10.
- the bio-dosimetry system 10 includes a bio-dosimetry device 12 and a cartridge 14 for processing a blood sample to determine the level of exposure to radiation of a respective person.
- the bio-dosimetry device 12 may be a reusable, portable device that may be configured to receive one disposable cartridge 14 at a time, each cartridge 14 processing a blood sample of a respective person.
- the cartridge 14 is intended to be a single-use cartridge, used to measure a single sample.
- the bio-dosimetry device 12 performs a number of functions on the sample, including pumping, lysing, binding, conversion and PCR analysis. Based on these operations, the bio-dosimetry device 12 can determine a level of exposure to radiation of the blood sample.
- bio-dosimetry system 10 along with the various sub-systems and related processes, will be described in relation to analyzing a blood sample for exposure to radiation. It is envisioned within the context of this disclosure that the bio-dosimetry system 10 and/or some of the sub-systems, can be used for other applications such as analyzing cancer cells, types of cells (phenotypes) such as with use of flow cytometry, RNA viruses, types of bacteria, etc.
- the bio-dosimetry device 12 comprises a housing 16, a socket 18 for receiving the cartridge 14 and a door 20 coupled to the housing 16.
- the door 20 encloses the socket 18 in a closed position ( Figure 1 ) and provides access to the socket 18 in an open position ( Figure 2 ).
- the housing 16 includes a reservoir 22 for receiving a blood sample and a cap 24 for enclosing the sample within the reservoir 22 (e.g., to avoid contamination). and a handle 26 for carrying the bio-dosimetry device 12.
- the housing 16 further may include a display 28 for displaying information such as measurement data to a user, and a user input device 30 for receiving input from the user.
- the door 20 may be coupled to the housing 16 with a hinge. When the door 20 is the opened position the socket 18 can receive the cartridge 14. Upon receiving the cartridge 14 in the socket 18, the door 20 can be closed. As described below, closing the door 20 can couple components in the bio-dosimetry device 12 to the cartridge 14.
- the bio-dosimetry device 12 includes a battery 48 which provides electrical energy to the bio-dosimetry device 12.
- the battery 48 may be a standard battery such as a lead-acid, nickel-cadmium, lithium-ion battery etc.
- the battery 48 enables the bio-dosimetry device 12 to be portable and used in locations without access to a power grid.
- the bio-dosimetry device 12 further include a computer 50 including one or more processors 52 and one or more memories 54, the memories 54 including instructions for programming the one or more processors 52.
- the computer 50 executes instructions which can be used carry out the processes for preparing and analyzing the sample for exposure to radiation as described herein.
- the computer 50 is communicatively coupled to components of the bio-dosimetry device 12 including the display 28, the user input device 30, sensors 56, an illumination system 58, optical detector 60, heating systems 62, pumps 64, blister actuators 66 and a piezo electric element 68.
- the display 28 may be, for example, a liquid crystal display (LCD) or organic light emitting diode display (OLED) and can be used for outputting data, for example measurement data, to a user.
- the display 28 may further be a touch-screen device and used as an input device by the user.
- the user input device 30 includes one or more input elements such as buttons, turn knobs, touch-screens, a microphone, etc. that permit a user to input data and/or instructions to the bio-dosimetry device 12.
- the sensors 56 can include, for example, temperature sensors, pressure sensors and contact sensors.
- the sensors 56 can receive instructions from and provide data to the computer 50 to enable the computer 50 to control the processes for preparing and analyzing the samples as described below.
- the illumination system 58 provides light for performing PCR.
- the illumination system 58 is communicatively coupled to the computer 50 and includes a light source.
- the light source optimally emits light in a narrow band of wavelengths to stimulate the fluorescent tag.
- the fluorescent tag in response, emits light at a different wavelength.
- the band of wavelengths radiated by the light source to stimulate the fluorescent tag needs to be limited to a range that does not overlap the light emitted by the fluorescent tag.
- the light sources should be as monochromatic (narrow banded) as possible, such as a laser or a narrow emission light emitting diode or other light source with a narrow notch filter blocking wavelengths outside of the narrow band needed to stimulate the fluorescent tags.
- the illumination system 58 may further include electronic circuitry to turn the light source on and off, bias the light source in an operating condition, control or limit the power supplied to the light source, etc. As described below, the illumination system 58 can radiate light on the cartridge 14 during analysis of material to be analyzed, based on commands from the computer 50.
- Material to be analyzed as used herein is material that has been prepared to be analyzed based on components of the blood sample. The material to be analyzed may include fluorescent markers.
- the optical detector 60 is communicatively coupled to the computer 50, and can be, for example, a camera, a charge-coupled device (CCD), a light sensitive, CMOS array, etc.
- the optical detector 60 may include a filter to block the excitation wavelength (from the light source) used to stimulate a fluorescent tag and allow the fluorescent tag emission through for detection.
- the optical detector 60 receives light emitted by the material to be analyzed.
- the optical detector 60 can provide data to the computer 50 based on the received light.
- the material to be analyzed includes fluorescent markers. Following illumination, the fluorescent markers radiate light at a wavelength based on the markers and the optical detector 60 detects the light.
- the optical detector 60 may be used to detect different fluorescent tags emitting light at different wavelengths. In these cases, the optical detector 60 may receive respective images of the two fluorescent tags by applying different filters for each of the respective fluorescent tags.
- each of the heating system(s) 62 of the bio-dosimetry device 12 includes a heating element such as a resistance heater and may include electronic circuitry to turn the heating element on and off, bias the heating element in an operating condition, control or limit the power to the heating element, etc.
- the heating system 62 may further include a sensor 56, such as a temperature sensor, that can be used to detect a temperature of the heating element and provide feedback to the heating system 62 such that the heating system 62 can regulate the temperature of the heating element.
- the heating system(s) 62 may be used to heat a portion(s) of the cartridge 14 during processing of the blood sample. Further, the heating elements included in the heating system 62 may in some cases be contained in the bio-dosimetry device 12 and in other cases included as part of the cartridge 14.
- the pump(s) 64 of the bio-dosimetry device 12 may be electrically coupled to and controlled by the computer 50 such that the computer 50 can turn them on and off.
- the pumps 64 may further be in fluid communication with the cartridge 14 such that the pumps 64 can move fluids, e.g., from the reservoir 22 to the cartridge 14 or within the cartridge 14 from one region to another.
- the bio-dosimetry device 12 may further include one or more blister actuators 66.
- Each blister actuator 66 may be communicatively coupled with the computer 50 and include a plunger.
- the blister actuators 66 may be arranged within the bio-dosimetry device 12 such that, when the cartridge 14 is inserted in the bio-dosimetry device 12 and the door 20 is closed, the blister actuator 66 is within a range of elements on the cartridge 14 such that the plunger, in an extended state, extends into and compresses the elements on the cartridge 14 and releases fluids into a processing flow on the cartridge 14.
- the bio-dosimetry device 12 may further include a piezo electric element 38.
- the piezo electric element 68 may be communicatively coupled with the computer 50 such that it can receive commands, for example, to turn the piezo electric element 68 on and off or adjust a power level of the piezo electric element 68.
- the piezo electric element 68 When the piezo electric element 68 is turned on, it may vibrate at a frequency, for example 20 kHz.
- the piezo electric element 68 may be coupled, either directly (in physical contact), or indirectly (for example, via a small air space) with elements on the cartridge 14 and cause the elements to vibrate, transferring mechanical energy to the elements.
- the cartridge 14 is a disposable cartridge that is intended to be used to analyze a single blood sample and is configured to be inserted into the bio-dosimetry device 12.
- the cartridge 14 includes a cassette 32 and a substrate 34.
- the cassette 32 is adapted to be inserted into the socket 18 of the bio-dosimetry device 12 and includes a recessed area 40 for receiving and supporting the substrate 34.
- the substrate 34 has a first side 41 and a second side 42 and supports a plurality of sections configured to process and analyze a blood sample and determine a level of exposure to radiation.
- the cartridge 14 further includes a cover 44 having a first side 45 and a second side 46.
- the second side 46 of the cover is attached to the first side 41 of the substrate 34 and encloses the processing regions formed in the substrate 34.
- the substrate 34 and the cover 44 can be made of a material such as glass (e.g., Pyrex), silicon, a silicone-based material, sapphire, a polymer, or any transparent substrate.
- the cartridge 14 contains a plurality of regions for processing and analyzing a blood sample to determine a level of exposure to radiation. An overview of the regions of the cartridge 14 will be presented in the next paragraph. Thereafter, the structure and features of different sections of the cartridge 14 will be described in additional detail.
- the blood sample is pumped into a lysing region 90 on the cartridge 14, by a micropump 82 or via a port 84.
- the blood sample is broken into components parts including mRNA.
- the blood sample including the mRNA is transferred to the binding region 92.
- mRNA from the blood sample is bound (held). The remaining components are removed, by flushing. Thereafter, the bound mRNA in the binding region 92 is flushed with a material, which forms cDNA with the bound mRNA.
- the cDNA, formed in the binding region 92 is then transferred to a mixing region 94 where the cDNA is more evenly distributed within a reaction mixture.
- the cDNA is transferred to a polymerase chain reaction (PCR) region 96 where the cDNA is analyzed for exposure to radiation of the mRNA with which the cDNA was previously formed (in the binding region 92).
- PCR polymerase chain reaction
- the micropump 82 may be built into and/or on the substrate 34 and based on a micro-electro-mechanic systems (MEMS) technology.
- MEMS micro-electro-mechanic systems
- the cartridge 14 may further include one or more ports 84.
- the ports 84 may be openings formed in the cover 44 of the cartridge 14.
- the ports 84 may be arranged to fluidly couple, for example, with an outlet of a pump 64 in the bio-dosimetry device 12 when the cartridge 14 is inserted in the bio-dosimetry device 12 and the door 20 is closed.
- the outlet of the pump 64 which may be a nozzle or a tube, may be inserted into the port 84 when the door 20 of the bio-dosimetry device 12 is closed, such that when the pump 64 is activated, the pump 64 can output a fluid into the port 84.
- the cartridge 14 may include one or more blisters 86 fluidly coupled to respective regions in the cartridge 14.
- one or more blisters 86a may be fluidly coupled to an inlet to the lysing region 90.
- One or more blister 86b may be coupled to an inlet to the binding region 92 and one or more blister 86c may be coupled to an inlet to the mixing region 94.
- the blisters 86 may be, for example, a flexible, polymer based, fluid container, that is formed, for example, on a first side 55 of the cover 44.
- Microchannels 85 may be used to fluidly couple regions and features of the cartridge 14.
- a microchannel 85a may couple one or more of the micropump 82, one or more blisters 86a and one or more ports 84 to an inlet of the lysing region.
- a microchannel 85b may fluidly couple an outlet of the lysing region 90 and an outlet of one or more blisters 86b to an inlet of the binding region 92.
- a microchannel 85c may couple an outlet of the mixing region 94 to an inlet of the PCR region 96, etc.
- Each of the microchannels 85 may be formed in the substrate 34 and closed on a first side 41 of the substrate 34 by a second side 46 of the cover 44.
- the blister 86 may be a hollow, flexible container made of a polymer that forms a cavity for containing a fluid.
- the blister 86 may have a flat portion 100 for attaching to a surface, for example the first side 45 of the cover 44.
- the blister 86 may further have a dome-shaped structure 102 arranged on a side of the flat portion and forming the cavity.
- the dome shaped structure 102 may be, for example, round, or in the form of an elongated rectangle or oval.
- the blister 86 may have an outlet 104 which may be fluidly coupled, to one of the processing regions on the cartridge 14.
- the blister 86 is configured such that, when pressure is applied to the dome shaped structure 102, fluid contained in the blister 86 is expelled through the outlet 104.
- a blister 86 may be actuated by a blister actuator 66 on the bio-dosimetry device 12.
- the blister actuator 66 may be arranged in the bio-dosimetry device 12 such that when the cartridge 14 is inserted in the socket 18, the blister actuator 66 is in a range to actuate the blister 86.
- the computer 50 in the bio-dosimetry device 12 may instruct the blister actuator 66 to extend a plunger toward and apply pressure to the dome-shaped structure 102, and expel the liquid contained in the blister 86 into the processing region to which the blister 86 is fluidly coupled.
- a size of each blister 86 in the cartridge 14 can be selected based on a volume of liquid required for the processing step in which the blister 86 participates.
- the lysing region 90 lyses biological samples by applying ultrasonic stimulation.
- the sample to be lysed may be a drop of blood.
- the sample may be any fluid with cells, for example waver with bacteria, cells in lymphatic fluid, cells in urine, etc.
- the lysing region 90 may also be used for other applications such as lysing microbes, animal and plant cells, fracturing bonds in DNA, RNA, protein aggregates and lipid aggregates.
- the lysing region 90 may be applied to prepare a sample for polymerase chain reaction (PCR) and rolling circle genetic amplification.
- PCR polymerase chain reaction
- the lysing region 90 includes an inlet 130, a distribution manifold 132, a lysing array 134, an outlet manifold 136, and an outlet 138.
- the lysing region 90 is configured to receive a sample via the inlet 130, pass the sample through the distribution manifold 132, lyse, by transfer of mechanical energy, the sample into component parts in the lysing array 134 and output the component parts through the outlet manifold 136 to the outlet 138.
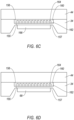
- Each of the inlet 130, the distribution manifold 132, the lysing array 134, the outlet manifold 136 and the outlet 138 can be formed in the substrate 34 ( Figures 6C, 6D ).
- the inlet 130 can receive the sample and/or other input material from one or more of the micropump 82, a blister 86 or a port 84, and deliver the sample or input material to the lysing array 134 via the distribution manifold 132.
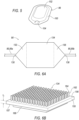
- the distribution manifold 132 may be triangular shaped, with an apex of the triangle connected a microchannel 85a delivering the sample and/or input material and a base of the triangle connected to the lysing array 134, such that the distribution manifold 132 broadens from the microchannel 85a to the lysing array 134 to distribute the material across a side of the lysing array 134.
- the lysing array 134 may be square and with a typical length of the side in a range from 0.5cm to 1.0 cm. Other shapes are possible. For example, the lysing array 134 may be rectangular with either a short side of the rectangle of a long side of the rectangle connecting to the distribution manifold. Further, the size of the lysing array 134 is scalable. Increasing the size of the lysing array 134 increases a volume of material that can be lysed in a period of time. A smaller lysing array 134, can be used, for example, to lyse viruses or other small components.
- the outlet manifold 136 and outlet 138 output material from the lysing array 134 to a microchannel 85b.
- the outlet manifold 136 may be triangular shaped with a base of the triangle connected to the lysing array 134 and an apex connected to the microchannel 85b, such that the material output from the lysing array 134 is directed into the microchannel 85b.
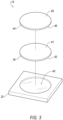
- the lysing array 134 includes a diaphragm 155 formed in the substrate 34.
- the diaphragm 155 has a first side 156, a second side 157 and a thickness t1.
- the thickness t1 can be in a range from 0.01 millimeters to 1 millimeter with a typical value of 0.1 millimeter.
- the first side 156 of the diaphragm 155 together with the substrate 34 and the cover 44, define a cavity 160.
- the cavity 160 contains the sample to be lysed during lysing.
- the cavity 160 may have a typical volume of four microliters and a typical volume range from one to 100 microliters. This range is not intended to be limiting. In addition to cavity volumes within this range, a lysing array 134 according to this disclosure can also have volumes greater than or less than this range.
- a plurality of micropillars 162 extend outwardly from the first side 156 of the diaphragm 155 into the cavity 160.
- Each of the micropillars 162 has a top end 164.
- the micropillars 162 are arranged in columns and rows and may be evenly spaced.
- the lysing array 134 may include 40 rows and 40 columns of micropillars 162, for a total of 1600 micropillars.
- the micropillars 162 may be formed, for example, by an embossing or etching process.
- the lysing array 134 may include, coupled to the second side 157 of the diaphragm 155, a piezo electric layer 166.
- the piezo electric layer 166 may be stimulated (i.e., an electric current may be applied). Based on the stimulation, the piezo electric layer 166 may apply an oscillating force to the diaphragm 155, causing the diaphragm 155 to flex.
- the flexing of the diaphragm 155 may be substantially perpendicular to a plane of the diaphragm 155.
- the flexing of the diaphragm can result in a displacement in a range from 1 to 20 microns at points towards the center of the lysing diaphragm.
- the displacement can be larger, up to a range of 1 millimeter or more.
- the amount of displacement may vary with the frequency of stimulation as there is a relaxation time dependent on displacement. That is, a lower frequency of stimulation may result in a larger displacement.
- the flexing causes a lateral motion on the top ends 164 of the micropillars 162.
- the lateral motion of the top ends 164 can create a liquid shock wave that can lyse the sample contained in the cavity 160, breaking the sample into component parts.
- An energy level applied to the diaphragm can be controlled to allow for lysing, for example, of cell walls, without damaging internal organelles in the blood cells.
- a piezo electric element 68 included in the bio-dosimetry device 12 can be used to stimulate the diaphragm of the lysing region 90. This is illustrated in Figure 6D .
- the piezo electric element 68 is arranged to physically couple with the diaphragm 155 such that when the piezo electric element 68 is turned on, ultrasonic waves radiated from the piezo electric element 68 cause the diaphragm 155 to flex.
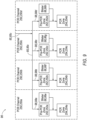
- Figure 6E is a top view of a section of the lysing array 134, with the cover 44 removed.
- the section shows two rows R1 and R2 and two columns C1 and C2.
- the micropillars 162 may be cylindrically shaped, and have a diameter d.
- the diameter d may, for example, be in a range from 0.01 millimeters to 10 millimeters with a typical value of 0.075 millimeters.
- the micropillars 162 may be evenly spaced and have a spacing W 1 between adjacent micropillars 162 in a row (e.g., the row R1) and evenly spaced and have a spacing W 2 between two micropillars 162 in a column (e.g., the column C1).
- W 1 may be substantially equal to W 2 .
- the spacings W 1 and W 2 may be in a range from 0.015 millimeters to 10 millimeters and have a typical value of 0.075 millimeters which is effective for most cells.
- the ranges of W 1 and W 2 may be selected based on a particle size of the sample to be lysed and would typically increase as the particle size to be lysed increases.
- the lysing array 134 may be applied to open or break apart protein chains and viruses.
- the spacings W 1 , W 2 and the diameter d may be in a range of tens of nanometers.
- FIG 6F is a side view of the section of the lysing array 134 shown in Figure 6D .
- the micropillars 164 can have a height h 1 .
- the height h 1 can be in a range from 0.1 millimeters to 100 millimeters and can depend on the diameter d chosen for the micropillars 164 and the sample to be lysed.
- the height h 1 and diameter d are typically selected such that an aspect ratio h 1 /d is 10, with a range from 5 to 20. For example, in the case that the diameter d is selected to be 2 millimeters, the height h 1 can be selected to be 20 millimeters.
- the diaphragm 155 has a thickness t 1 .
- the thickness t 1 can be in the range 0.01 millimeters to 1 millimeter with a typical value of 0.1 millimeters.
- the thickness of the piezo electric layer 166 (when present) may be in a range from 0.1 millimeters to 10 millimeters.
- the cross-section of the micropillars 162 may be rectangular or triangular, the micropillars 164 may be conical with a base of the cone located at the first side 156 of the diaphragm 155, etc.
- FIGS 7A-7D illustrate an example binding region 92.
- the binding region 92 includes a microchannel 200 having an inlet 203 and an outlet 204.
- material for example, a lysed blood sample flows through the microchannel 200 in a direction 212.
- the microchannel 200 includes a stationary phase 202.
- the stationary phase 202 includes a plurality of micropillars 220.
- the micropillars 220 are formed in and extend outwardly from the substrate 34. As shown in Figures 7B and 7C , the micropillars 220 are arranged in rows, for example rows R3 and R4. Each row is offset from a previous row such that the micropillars 220 in the row R4 are arranged to correspond with an opening between micropillars 220 in the row R3.
- the micropillars 220 may have a cross-section having a hexagonal shape.
- the micropillar 220 has first, second, third, fourth, fifth and sixth sides 222, 224, 226, 228, 230 and 232.
- First and fourth sides 222, 228 are parallel, and have a length l 1 .
- Second and fifth sides 224, 230 are parallel and have a length l 2 .
- Third and sixth sides 226, 232 are parallel and have length l 3 .
- the micropillar 220 has a diameter d 1 and a spacing between the micropillars d 2 .
- the diameter d 1 may be in a range of two microns to 2,000 microns, with a typical value of 20 microns.
- the spacing may be in a range from one micron to 1,000 microns, with a typical value of 10 microns.
- the micropillars 220 have a height h 2 .
- the height h 2 may be in a range of 10 microns to 10 millimeters, with a typical height of one millimeter.
- the micropillars 220 may be coated with a binding material to bind target components of the sample.
- the micropillars 220 may be coated with oligo dT25 to bind the mRNA in the blood sample to the micropillars 220.
- the binding region 92 further may include a heating element 210 having two contacts 211 on opposite ends.
- the heating element 210 may be supported on the cover 44.
- the heating element 210 may be formed of a resistive material such that, when an electrical voltage is applied across the two contacts 211, a current will flow through the heating element 210 and generate heat.
- a heating system 62 in the bio-dosimetry device 12 may be arranged such that when the cartridge 14 is inserted into the socket 18 and the door 20 closed, the heating system 62 is thermally coupled to (i.e., can heat) the binding region 92.
- the binding region 92 can be used to bind mRNA in a blood sample to the stationary phase 202. This is described below as the process 1600 in reference to the Figure 16 .
- the binding region 92 can further be used to convert the mRNA, bound in the stationary phase, to cDNA. This is described below as the process 1700 in reference to the Figure 17 .
- FIGS 8A and 8B illustrate the mixing region 94.
- the mixing region 94 includes a microchannel 240 having an inlet 241 and an outlet 242.
- the microchannel 240 may be in the form of a meander having straight portions coupled at angles of, for example, 90° to one another.
- a length l 8 of a straight portion in the meander may have a typical value of 1 millimeter to 2 millimeters.
- the microchannel 240 is formed in the substrate 34 and has a width d 3 .
- the width d 3 can be in a range of 0.1 millimeters to 2 millimeters with a typical value of 0.5 millimeters.
- the depth U 4 of the microchannel 240 can be in a range from 0.1 millimeters to 1 millimeter with a typical value in a range from 0.1 to 0.2 millimeters.
- the microchannel 240 can be used to remove gradients of cDNA in reaction mixture.
- the reaction mixture, containing the cDNA may enter the mixing region 94 at the inlet 241, pass through the microchannel 240, continue through the outlet 242.
- the changes of directions as the microchannel 240 passes through the 90 passing through 90° angles may cause turbulence in the fluid flow, mixing the cDNA within the reaction mixture.
- the cDNA may be more evenly distributed, reducing or eliminating gradients in the cDNA within the reaction mixture.
- the mixing region 94 may have other shapes or features.
- the width d 3 of the microchannel 240 may be varied alternatively between a first width and a second width or the depth U 4 of the microchannel 240 varied alternatively between a first depth and a second depth to create turbulence in the reaction mixture flow.
- extensions or bumps may be formed, extending from a bottom of the microchannel 240 into the microchannel 240 to increase turbulence in the reaction mixture flow.
- FIG 9 is a diagram of an example PCR region 96.
- the PCR region 96 receives material including cDNA from the mixing region 94.
- the PCR region analyzes the cDNA for exposure to radiation of the mRNA from which the cDNA was generated. Analyzing the cDNA includes thermally cycling the material to be analyzed including the cDNA between two temperatures, as described below.
- the PCR region 96 receives the material via a microchannel 85c.
- the microchannel 85c couples the mixing region 94 ( Figure 4 ) via four sub-microchannels 98a, 98b, 98c, 98d to four respective PCR channels 250a, 250b, 250c, 250d.
- a PCR region 96 including four PCR channels 250a, 250b, 250c, 250d is only an example.
- the PCR region 96 may include any number of PCR channels 250.
- the first PCR channel 250a includes the pre-PCR zone 252a, the blister 86e and the PCR zone 254a
- the second PCR channel 250b includes the pre-PCR zone 252b
- the third PCR channel 250c includes the pre-PCR zone 252c
- the fourth PCR channel 250d includes the pre-PCR zone 252d, the blister 86h and the PCR zone 254d.
- the four PCR channels 250a, 250b, 250c, 250d may be the same or similar, and will be described as an example PCR channel 250 including an example pre-PCR zone 252, an example blister 86 and an example PCR zone 254 below.
- FIGs 10 and 11 illustrate an example pre-PCR zone 252.
- the pre-PCR zone 252 heats material prior to beginning analysis in the PCR zone 254.
- the pre-PCR zone 252 includes a microchannel 255 including an inlet 256 and an outlet 257. Material enters the microchannel 255 at the inlet 256 and flows towards the outlet 257.
- the outlet 257 may be coupled, for example, to a sub-microchannel 98 such as the sub-microchannel 98a.
- the outlet 257 may be coupled to the PCR zone 254.
- the microchannel 255 may have a width d 4 and a depth U 6 . Adjacent parallel sections of the microchannel 255 may be spaced away from each other by a distance d 5 .
- the width d 4 may be in a range from 0.1 millimeters to 2 millimeters with a typical value of 1 millimeter.
- the depth U 6 of the microchannel 255 may be in a range from 0.05 millimeters to 2 millimeters with a typical value of 1 millimeter.
- the spacing d 5 between adjacent sections of the microchannel 255 may have a range from 0.1 millimeters to 5 millimeters with a typical value of 2 millimeters.
- the pre-PCR zone 252 further may further include a heating element 260 including two contacts 261. on opposite ends.
- the heating element 260 may be supported on the cover 44.
- the heating element 260 may be formed of a resistive material such that, when an electrical voltage is applied across the two contacts 261, a current will flow through the heating element 260 and generate heat.
- a heating system 62 in the bio-dosimetry device 12 may be arranged such that when the cartridge 14 is inserted into the socket 18 and the door 20 closed, the heating system 62 thermally couples to (i.e., can heat) the pre-PCR zone 252.
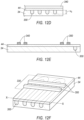
- FIGS 12A through 12F illustrate an example PCR zone 254.
- the PCR zone 254 thermally cycles the material between a first temperature and a second temperature, and then images the material using fluorescent markers.
- the imaging provides data indicating a degree of exposure to radiation of the original sample.
- the PCR zone 254 includes a microchannel 300. As shown in Figure 12A , the microchannel 300 meanders from an inlet 302 to an outlet 304. In practice, material to be analyzed by the PCR zone 254 is pumped into the inlet 302 and flows through the microchannel 300 to the outlet 304.
- the PCR zone 254 includes a first heating region 310, a detection region 320 and a second heating region 330.
- One or more first heating elements 340 extend across the first heating region 310.
- one more second heating elements 350 extend across the second heating region 330.
- the first and second heating elements 340, 350 are arranged on and supported by the cover 44.
- the first and second heating regions 310, 330 are spaced away one from the other, to eliminate or reduce thermal interference between the first and second heating regions 310, 330. That is, maintaining the first heating region 310 at a first temperature should not interfere with maintaining the second heating region 330 at a second temperature, and vice versa.
- the detection region 320 is arranged between the first heating region 310 and the second heating region 330.
- the detection region 320 is characterized in that there are no heating elements organized above the microchannel 300. Other arrangements of the detection region 320, are possible. However, placing the detection region 320 between the first and second heating regions 310, 330 has the advantage of efficient use of the space required for separating the first and second heating regions 310, 330.
- a heating system 62 included in the bio-dosimetry device 12 can be used respectively to heat each of the first the second heating regions 310, 330.
- the microchannel 300 is formed of a plurality of interconnected segments 303 ( Figure 12C ) each segment 303 is arranged to perform one thermal cycle on the material flowing through the microchannel 300.
- One thermal cycle is defined as passing through the first heating region 310 followed by passing through the second heating region 330.
- the microchannel 300 may include approximately 35 segments 303. The number of segments 303 can be adjusted, based on the specific analysis to be performed in the PCR zone 254.
- Figure 12C is an enlarged view of a section of the microchannel 300 illustrating an example segment 303a.
- the segment 303a has a first end 305 and a second end 307.
- the segment 303a starts at the first end 305, continues through the first heating region 310, through the detection region 320, through the second heating region 330 and back through the detector region to the second end 307.
- the microchannel 300 then continues in a next segment 303b.
- the first heating region 310 will be maintained at a first temperature and the second heating region 330 will be maintained at a second temperature, so that, as the material to be analyzed passes through the microchannel 300, it is repeatedly cycled between the first temperature and the second temperature.
- the microchannel 300 has a width d 8 .
- the width d 8 can be in a range from 0.01 millimeters to 1 millimeter with a typical value of 0.05 millimeters.
- the width d 8 can be selected depending on a volume of fluid to be passed through the microchannel 300, a particle size of the fluid passing through the microchannel 300, the manufacturing process used to create the microchannel 300 in the substrate 34, etc.
- the microchannel 300 further has a spacing d 9 between parallel portions of microchannel 300.
- the spacing d 9 can be in a range from 0.01 millimeters to 3 millimeters with a typical value of 1 millimeter and can depend on factors such as the manufacturing process used to create microchannel 300. To conserve space in the substrate, the spacing d 9 will typically be chosen to be close to or equal to a minimum feature size allowed by the manufacturing process used to form the microchannel 300 in the substrate 34.
- the microchannel 300 further has a height h 3 .
- the height h 3 is the distance, as measured along the axis Y-Y, from a furthest extension of the microchannel 300 within the first heating region 310, for example the point 306a, to a furthest extension of the microchannel 300 within the second heating region 330, for example the point 308a.
- the first heating region 310 has a height h 4 .
- the detection region 320 has a height h 5 and the third heating region 330 has a height h 6 .
- the height h 4 of the first heating region 310 can be determined, for example, by the area required for the first heating element 340, based on the target first temperature of the first heating region 310.
- the height h 6 of the second heating region 330 can be determined by the area required for the second heating element 350, based on the target second temperature for the second heating region.
- the height h 5 of the detection region 320 can be determined, for example, based on having a specifically defined region for detecting (counting) cDNA based on a tag emission. The sensitivity of the detection increases as an area of the detection region 320 increases.
- the height h 5 can be determined based on a distance required to thermally isolate the first heating region 310 from the second heating region 330.
- Figure 12D is a partial side view of a section of the PCR zone 254 shown in Figure 12C , cut along the axis X-X.
- the microchannel 300 is formed in the substrate 34.
- the cover 44 is attached to the substrate 34, forming a top of the microchannel 300.
- the microchannel 300 has a depth U 5 .
- the depth U 5 can be in a range from 10 microns to 1000 microns, with a typical value of 100 microns.
- Figure 12E is a partial side view of a section of the PCR zone 254 shown in Figure 8C, cut along the axis Y-Y.
- the microchannel 300 is formed in the substrate 34 and covered by the cover 44.
- First and second heating elements 340, 350 are arranged on and supported by the cover 44.
- Figure 12F is a partial perspective view of the section of the PCR zone 254 shown in Figure 12D .
- the microchannel 300 is shown extending through the second heating region 330 and back again with each segment of the microchannel 300.
- the pre-PCR zone 252 may be physically arranged on the substrate 34 near (e.g., adjacent) the PCR zone 254 in the same PCR channel 250. More specifically, the pre-PCR zone 252 may be arranged near the first heating region 310 of the PCR zone 254. This allows the pre-PCR zone 252 to be heated to a substantially same temperature as the temperature of the first heating region of the PCR zone 254.
- the heating element 260 in the pre-PCR zone 252 may be electrically coupled to the first heating element 340 in the first heating region. In a case that the heating system 62 is used to heat the first heating region 310, the same heating system 62 can also be used to heat the pre-PCR zone 252.
- Figure 13 illustrates an example organization of a cartridge 14.
- a cassette 32 supports a substrate 34 in a recessed area 40.
- the substrate 34 has a first side 41 and a second side 42.
- a micropump 82 receives a blood sample and pumps the blood sample to the lysing region 90. After performing lysing on the blood sample, the lysing region 90 outputs the lysed blood sample to the binding region 92.
- a blister 86b is arranged above the binding region 92, which may be used to inject fluid, for example, a reaction material for conversion of the mRNA to cDNA in the binding region 92.
- a single blister 86b is only an example. One or more blisters 86b may be used to inject fluid into the binding region 92.
- the binding region 92 outputs material including cDNA to the mixing region 94.
- the mixing region 94 outputs the material including the cDNA to four pre-PCR zones 252a, 252b, 252c, 252d.
- Four blisters 86e, 86f, 86g, 86h are arranged respectively above the four pre-PCR zones 252a, 252b, 252c, 252d.
- the four pre-PCR zones 252a. 252b, 252c, 252d output material respectively to the four PCR zones 254a, 254b, 254c, 254d.
- the four blisters 86e, 86f, 86g, 86h can output primer including fluorescent markers to the material to be analyzed respectively in the four PCR zones 254a, 254b, 254c, 254d.
- DNA based cells bacteria and other cells
- a DNA trapping region can be substituted for the RNA binding region.
- the trapped DNA can go directly to amplification in a PCR region 96.
- Figure 14 is a diagram of an exemplary process 1400 for performing bio-dosimetry on a sample with the bio-dosimetry system 10.
- a sample size can be in a range of 1 to 1000 microliters and can typically be approximately 100 microliters.
- An example sample is a drop of blood.
- the process 1400 begins in a block 1402.
- the computer 50 is programmed to initiate bio-dosimetry on a sample.
- the computer 50 may receive a trigger event, such as an input from the user via the user input device 30 to begin the bio-dosimetry process 1400, or inputs, for example from sensors 56, that the sample is available in the reservoir 22 and a fresh cartridge 14 has been inserted into the bio-dosimetry device 12. Based on the trigger event, the computer 50 may instruct the micropump 82 on the cartridge 14 to pump the sample from the reservoir 22 into the lysing region 90 on the cartridge 14.
- a trigger event such as an input from the user via the user input device 30 to begin the bio-dosimetry process 1400, or inputs, for example from sensors 56, that the sample is available in the reservoir 22 and a fresh cartridge 14 has been inserted into the bio-dosimetry device 12.
- the computer 50 may instruct the micropump 82 on the cartridge 14 to pump the sample from the reservoir 22 into the lysing region 90 on the cartridge 14.
- the computer 50 may instruct a pump 64 on the bio-dosimetry device 12 to pump the sample into the lysing region 90.
- the process 1400 continues in a block 1404.
- the computer 50 is programmed to lyse the sample according to process 1500, described below. Lysing the sample is defined herein as breaking the sample into component parts. Upon lysing the sample, the process 1400 continues in a block 1406.
- the computer 50 is programmed to bind target components of the sample in the binding region 92 according to a process 1600, described below.
- Target components are components of the sample that the bio-dosimetry system 10 targets to remove from the lysed sample and contain in the binding region 92.
- target components in the lysed sample are bound to the stationary phase 202 in the binding region 92, and other components are discarded.
- the process 1400 continues in a block 1408.
- the computer 50 is programmed to convert target components from the sample bound in the binding region 92 to a material to be analyzed by PCR according to the process 1700, described below.
- mRNA bound in the binding region
- cDNA can be converted to cDNA.
- the computer 50 is programmed to perform PCR analysis on the material to be analyzed according to the process 1800 described below.
- the process 1400 continues in a block 1412.
- the computer 50 is programmed to store and/or output results of the PCR analysis.
- the computer 50 may output data on the display 28 on the bio-dosimetry device 12. Additionally or alternatively, the computer 50 may transmit the data, for example via wireless communications to another computer. Still further, the computer 50 may be programmed to store the data from the PCR analysis for retrieval at a future time. Upon outputting and/or storing the data, the process 900 may end.
- Figure 15 is a diagram of an exemplary process 1500 for lysing the sample received from the bio-dosimetry device 12 in an example lysing region 90.
- the sample to be lysed may be a drop of blood.
- the lysing region may be used to lyse other biological samples such as gram positive bacteria, gram negative bacteria, and encapsulated bacteria such as Anthrax.
- the process 1500 can be initiated by block 1404 of process 1400 and begins in the block 1502.
- the computer 50 is programmed to pump the sample through the lysing region 90.
- the sample may be a drop of blood or other liquid with a size of 100 microliters.
- a micropump 82 on the cartridge 14 may perform the pumping ( Figure 4 ).
- a pump 64 in the bio-dosimetry device 12 can perform the pumping.
- the sample can be pumped at a flow rate corresponding to a resonance time within the cavity 160 of the lysing array 134 in a range of 5 to 30 seconds. With an average resonance time of 20 seconds, and a cavity volume of four microliters, a sample can be lysed within a time of five minutes or less.
- the process 1500 continues in a block 1504.
- the computer 50 is programmed to apply ultrasonic stimulation to the lysing array 134.
- the lysing array 134 may include a piezo electric layer 166 as shown in Figure 6C .
- the lysing array 134 may be coupled to a piezo electric element 68, included in the bio-dosimetry device 12, as shown in Figure 6D .
- the computer 50 is programmed to activate the piezo electric layer 166 or piezo electric element 68 to induce flexing of the diaphragm 155 in the lysing array 134.
- a displacement of the diaphragm 155 may be in a range from one to 100 microns, with a typical displacement of 5 microns, and may be in a direction substantially perpendicular to a plane of the diaphragm 155.
- the induced movement can typically be at a frequency of 20kHz, with a range between 10kHz and 40kHz. The range is not intended to be limiting, and other frequencies above or below this range can also be used.
- the micropillars 162 will be induced to move laterally, back and forth through their respective non-stimulated positions in the lysing array 134.
- the induced lateral motion of the micropillars 162 can transfer mechanical energy to the sample, causing the sample to break into component parts.
- the sample includes human blood.
- Blood cells leukocytes and/or erythrocytes
- the process 1500 continues in a block 1506.
- the computer 50 is programmed to output the lysed sample to the binding region 92. Based on pressure from one of the micropump 82 and the pump 64, as described with regard to block 1502, the lysed sample passes through the outlet manifold 136, through a microchannel formed in the substrate, and into the binding region 92.
- the process 1500 ends.
- Figure 16 is a diagram of an exemplary process 1600 for binding components of the sample in the binding region 92.
- the process 1600 can be initiated by block 1406 of process 1400 and begins in a block 1602.
- the computer 50 is programmed to pump the lysed sample through the binding region 92.
- the block 1602 can occur concurrently with all or a portion of the process 1500, as described above. That is, one of the micropump 82 or the pump 64 can pump the sample into the lysing region 90 and continue pumping such that the sample continues to flow into the binding region 92.
- a volume of the sample in a typical case can be 100 microliters.
- the volume of the lysing array 134 can be in a range of four microliters.
- a portion of the sample can have exited the lysing region 90 and entered the binding region 92 while another portion of the sample has not yet entered the lysing region 90, such that a continuous flow exists from the reservoir 22, through the lysing region 90 and through the binding region 92.
- the binding region 92 binds to target components in the sample, containing the target components.
- the binding region 92 includes a stationary phase 202.
- the stationary phase 202 includes a plurality of micropillars 220.
- the micropillars 220 may be coated with a binding material that binds with target components in the lysed sample.
- the target components bind with the binding material coated on the micropillars 220.
- a sufficient quantity of the lysed sample can be passed through the binding region 92 such that the binding material on the stationary phase 202 is saturated. That is, substantially every site available to bind with a target component is occupied by a target component.
- the target components may be mRNA cells.
- the binding material may be oligo dT25 that specifically binds to any mRNA present in the sample.
- An amount of lysed sample through the binding region 92 to saturate the stationary phase 202 for a set of target components can be determined empirically. For example, for the binding region 92 as described above, including a stationary phase 202 coated with oligo dT25, a quantity of lysed sample of 60 microliters was determined to be sufficient to saturate the stationary phase 202.
- waste material after passing through the binding region, can be discarded.
- the computer 50 can be further programmed to turn off the micropump 82 or pump 64 when sufficient material has been passed through the binding region to saturate the stationary phase 202.
- the process 1600 continues in a block 1604.
- the computer 50 is programmed to rinse the binding region 92.
- the computer 50 sends instructions to force a rinsing fluid through the binding region 92.
- the rinsing fluid may be contained in a blister 86 arranged at the inlet 203 of the binding region 92.
- the computer 50 may instruct a blister actuator 66 in the bio-dosimetry device 12 to actuate the blister 86.
- the blister actuator 66 may extend a plunger into the blister 86, expelling contents of the blister 86 into the binding region 92.
- the rinsing fluid may be selected to be a material that mixes with the non-bound material in the binding region but does not react with the target components. In this manner, the target components can remain bound in the binding region 92 after rinsing.
- the process 1600 continues in a block 1606.
- Figure 17 is a diagram of an exemplary process 1700 for converting the target components of the sample, bound in the binding region 92, to material for analysis.
- the process 1700 can be initiated by block 1408 of process 1400 and begins in a block 1702.
- the target components may be mRNA from the sample.
- the reaction mixture can include the components necessary to convert, through reverse transcription, the mRNA to cDNA which can then be subjected to PCR analysis.
- the process 1700 continues in a block 1704.
- components in the reaction mixture react with the target components that are bound in the binding region 92, forming material to be analyzed.
- heat may be applied to the binding region 92 to cause/support the reaction.
- the computer 50 cay be programmed to heat the binding region 92 to 50 °C for 30 minutes.
- the newly formed material may be bound to the stationary phase 202 of the binding region 92.
- the process 1700 continues in a block 1706.
- the computer 50 is programmed to release the material to be analyzed for analysis.
- the material to be analyzed is cDNA
- the cDNA may be bound to the stationary phase 202.
- the computer 50 can be programmed to heat the binding region to 84°C for 5 minutes + sufficient time to release the cDNA.
- a time that is sufficient to release the cDNA can be determined empirically by performing tests with sample cartridges 14.
- the process 1700 continues in a block 1708.
- the computer 50 is programmed to remove gradients of the material to be analyzed in the reaction mixture.
- the computer 50 sends commands to pump the reaction mixture through the mixing region 94.
- the material to be analyzed for example, cDNA
- the process 1700 ends.
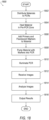
- Figure 18 is a diagram for a process 1800 for performing qPCR analysis on the material to be analyzed.
- the process 1800 includes thermally cycling the material to be analyzed between a first temperature and a second temperature, and then imaging the material to be analyzed using fluorescent markers.
- the process 1800 can be initiated by block 1410 of process 1400 and begins in a block 1802.
- the computer 50 is programmed to distribute the reaction mixture including the material to be analyzed to four PCR channels 250a, 250b, 250c, 250d for analysis.
- the four PCR channels 250a, 250b, 250c, 250d include respectively four pre-PCR zones, 252a, 252b, 252c, 252d.
- the four pre-PCR zones 252a, 252b, 252c, 252d may be associated respectively with the four PCR zones 254a, 254b, 254c, 254d.
- the computer 50 can activate a pump 64 to pump the reaction mixture into the pre-PCR zones 252a, 252b, 252c, 252d.
- the microchannel 85 coupling the mixing region 94 to the four pre-PCR zones 252a. 252b, 252c, 252e can split into four sub-channels 98a, 98b, 98c, 98d.
- the reaction mixture including the material to be analyzed can be pumped through the microchannel, and divide between the four sub-channels 98a, 98b, 98c, 98d, under pressure from the pump 64, such that a portion of the reaction mixture including the material to be analyzed is directed toward each of the four pre-PCR zones 252a, 252b, 252c, 252d.
- the process 1800 continues in a block 1804.
- the computer 50 may be programmed to heat the reaction mixture including the material to be analyzed in the pre-PCR zones 252a, 252b, 252c, 252d.
- the material to be analyzed may include cDNA.
- the computer 50 may be programmed to heat the reaction mixture including the material to be analyzed, to separate the cDNA into single strands prior to adding the primers and markers.
- the computer 50 may be programmed to heat the reaction mixture to 95°C for 10 minutes. Other temperatures and times can be used for different materials to be analyzed. The times and temperatures can be determined empirically.
- the process continues in a block 1806.
- the computer 50 is programmed to add a set of markers and primers to the reaction mixture flowing respectively into each of the four PCR zones 254a, 254b, 254c, 254d.
- a different set of markers may be used respectively for each of the four PCR zones 254a, 254b, 254c, 254d.
- a first blister 86e may be coupled to add markers and primers to a microchannel between the pre-PCR zone 252a and PCR zone 254a
- a second blister 86f may be coupled to add markers and primers to a microchannel between the pre-PCR zone 252b and PCR zone 254b
- a third blister 86g may be coupled to add markers and primers to a microchannel between the pre-PCR zone 252c and the PCR zone 254c
- a fourth blister 86h may be coupled to add markers and primers to a microchannel between the pre-PCR zone 252d and the PCR zone 254d.
- the computer 50 may actuate the first blister 86e.
- the computer 50 may actuate a second blister 86f.
- the computer 50 may actuate a third blister 86g at a time that the reaction mixture including the material to be analyzed is flowing from the pre-PCR zone 252c to PCR zone 254c and a fourth blister 86h at a time that the reaction mixture including the material to be analyzed is flowing from the pre-PCR zone 252d to PCR zone 254d.
- the times that the reaction mixture is flowing respectively from pre-PCR zone 252a to PCR zone 254a, from pre-PCR zone 252b to PCR zone 254b, from pre-PCR zone 252c to PCR zone 254c and from pre-PCR zone 252d to PCR zone 254d may be the same, partially overlapping, or different, depending on an organization of the microchannel and four sub-channels between the mixing region 94 and the four pre-PCR zones 252.
- each of the four sub-channels coupling the respective pre-PCR zones 252a, 252b, 252c, 252d to the microchannel coming from the mixing region 94 may be a same length or a different length.
- the lengths of the sub-channels may impact a timing for adding the sets of markers to the reaction mixture for the respective PCR zones 254a, 254b, 254c, 254d.
- the primers for each PCR zone 254 are selected to mark prepare a particular component or pair of components in the material to be analyzed for qPCR analysis.
- respective primers containing fluorescent markers may be selected to allow two genes (or DNA sequences) to be evaluated simultaneously.
- One gene may be an endogenous control (EC) gene that is stable with regard to exposure to radiation.
- An example EC gene is RB1.
- a second gene may be a radiation response gene. Examples of radiation response genes include CDKN1A, ASTN2, and GDF15.
- the process continues in a block 1808.
- the computer 50 is programmed to pump the reaction mixture, including the material to be analyzed and combined with the primers, into the respective PCR zones 254a, 254b, 254c, 254d.
- the blocks 1808 through 1816 will be described with respect to an example PCR zone 254. It can be understood that the process of block 1808 can be applied similarly to each of the PCR zones 254a, 254b, 254c, 254d.
- the computer 50 may, for example, instruct a pump 64 in the bio-dosimetry device 12 to pump the reaction mixture including the material to be analyzed and the primers into the example PCR zone 254.
- the PCR zone 254 includes a microchannel 300.
- the microchannel 300 is formed of a plurality of segments. Each segment extends back and forth between a first heating region 310, a detection region 320 and a second heating region 330. In an example, the microchannel 300 includes 35 segments.
- the material to be analyzed includes cDNA.
- the computer 50 may be programmed to maintain a first temperature of the first heating region at 95°C and to maintain second temperature of the second heating region at 60°C.
- the 95°C temperature causes the cDNA to separate into single strands.
- the 60°C temperature allows single stranded primers to attach to single stranded DNA to form complementary strands.
- the material to be analyzed continues to thermally cycle, that is, to cycle between the first and second heating regions 310, 330 at a rate of one cycle per segment, such that, with each consecutive segment, a greater number of strands of the cDNA form complementary strands with the primer.
- the computer 50 can be programmed to continue to pump the reaction mixture in the PCR zone 254 until all or most of the microchannel 300 is filled with the reaction mixture. In this case, the farther through the microchannel 300 the reaction mixture has passed, the greater number of cycles of the first and second heating regions the reaction mixture will have experienced.
- the process 1800 continues in a block 1810.
- the computer 50 is programmed to illuminate the microchannel 300 in the PCR zone 254.
- the computer 50 may radiate the detection region 320 of the PCR zone 254 with light for a time.
- the time may be in a range of from 1 to 2000 seconds, with a typical time of 1200 seconds.
- the process 1800 continues in a block 1812.
- the computer 50 receives images from the detection region 320 of the PCR zone 254.
- the fluorescent markers that combined with the cDNA will fluoresce at wavelengths determined by the markers.
- the optical detector 60 in the bio-dosimetry device 12 receives the light fluoresced from the markers.
- a filter may be used to select which wavelength of light can be received by the optical detector 60.
- a first image can be received from the detection region 320 with a first filter for a first range of wavelengths and a second image can be received from the detection region 320 with a second filter for a second range of wavelengths.
- the optical detector 60 can provide data representing the first and second images to the computer 50.
- the process 1800 continues in a block 1814.
- the computer 50 analyzes the data of the first and second images. For example, the computer 50 may determine the Ct of each of the genes combined with a respective fluorescent marker.
- the Ct (cycle threshold) is defined as the number of cycles required for the fluorescent signal to exceed background level.
- the number of cycles required for the fluorescent signal to exceed the background level can be determined by a position within the PCR detection region 320 along an axis of increasing cycles that shows a radiation of light at the wavelength of the particular fluorescent material that exceeds the radiation of the background. The position can be directly correlated to a number of cycles to which the material to be analyzed (i.e., the genes with the fluorescent material currently being measured) were exposed before their collective illumination exceeded the background illumination.
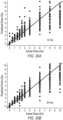
- a measurement taken with an example PCR zone is described below in reference to Figure 22 .
- the process 1800 continues in a block 1816.
- the computer 50 reports and/or stores the results of the PCR analysis.
- the computer 50 may report the results to another computer and/or on a display such as the display 28 on the bio-dosimetry device 12. Further, the computer 50 may store the results, for example with a time stamp, or an identification of the cartridge that was measured, in memory associated with the computer 50.
- the process 1800 ends.
- the adverb "substantially" modifying an adjective means that a shape, structure, measurement, value, calculation, etc. may deviate from an exact described geometry, distance, measurement, value, calculation, etc., because of imperfections in materials, machining, manufacturing, data collector measurements, computations, processing time, communications time, etc.
- the bio-dosimetry system 10 can be used to determine radiation exposure of an individual.
- a drop of blood from the individual can be evaluated to determine the radiation dose they received based on their gene expression levels.
- As evidence of efficacy ex vivo irradiation of human blood was utilized and the subsequent culturing of that blood for quantitative study of utilizing gene expression for human dosimetry.
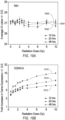
- Figure 19A illustrates a fold increase in expression level as a function of dose for the gene RB1 at 12 hours (trace 1902), 24 hours (trace 1904 and 48 hours (trace 1906). This EC gene is stable with respect to dose and time. It is also stable in its expression across all donors in our study.
- radiation responsive genes can be evaluated by examining the gene expression level of a potential response gene relative to that of a selected EC gene for exposed sample. A fold increase in expression levels as a function of dose and time following exposure can be determined by comparing that ratio to the population average of the non-exposed ratio of those same genes.
- CDKN1A, ASTN2, and GDF15 three potential radiation response genes that can be utilized as dosimetry biomarkers as shown respectively in Figures 19B , 19C and 19D referenced to RB1.
- Figure 19B illustrates a fold increase of expression level as a function of dose for the gene CDKN1A at 12 hours (trace 1912), 24 hours (trace 1914) and 48 hours (trace 1916).
- Figure 19C illustrates a fold increase of expression level for the gene ASTN2 at 12 hours (trace 1922) 24 hours (trace 1924) and 48 hours (trace 1926).
- Figure 19D illustrates a fold increase of expression level as a function of dose for the gene GDF15 at 12 hours (trace 1932), 24 hours (trace 1934) and 48 hours (trace 1936).
- the curves show clear increases in expression for each of the times post irradiation examined.
- the time of the nuclear event is known.
- a user can, in this case, follow the appropriate dosimetry curve for each gene product. All the gene products shown, and many others, exhibit significant increases in genes expression even at doses as low as 0.5 Gy. In the case of some genes, up to 16-fold increases of expression can be observed at higher doses. Fold changes in gene expression of 1.5 or 2 are large can easily and accurately be detected by qPCR analysis, indicating that these changes will be readily detectable by a portable PCR system.
- Figure 19E illustrates a fold increase of expression of the gene CDKN1A v. dose for a in vivo radiation utilizing an animal model (C57BI/6 male mice).
- Traces 1941, 1943 and 1945 show the fold increase in expression of CDKN1A v. dose respectively at 1 day, 3 days and 7 days.
- direct comparisons of gene expression levels between humans and mice cannot be made, the measurements indicate that fold increases in CDKN1A expression due to radiation exposure in vivo can be detected in the animal models.
- Figure 19F illustrates a comparison between human cancer patients irradiated in vivo and blood samples from these patients irradiated ex vivo.
- Sample of blood was drawn from the patients immediately prior to the patient receiving total body irradiation doses of between 2 and 4 Gy from a Cobalt 60 source
- a portion of the pre-radiation therapy blood sample was then irradiated with the same source and conditions as that received by the patient, and this blood was then cultured in the absence of mitogen for 24 hours.
- a second blood sample was drawn from the patient at approximately 24 hours post exposure.
- An in vivo / ex vivo exposure comparison for one of the genes examined (CDKN1A) was referenced to DPM1.
- Trace 2104 is an example trace from PCR analysis of whole blood that was not passed through the lysing device (a sample representing the condition of the blood as input into the lysing device).
- the cycle threshold (Ct) is defined as the number of cycles (through the first and second heating regions 310, 330) required for the fluorescent signal from the tag to exceed background level.
- the cycle threshold provides an indication of a degree of exposure to radiation of the original sample used to prepare the material to be analyzed.
- the number of cycles of the PCR to which the material to be analyzed has been exposed increases from left to right. Imaging is performed in the detection region 320 between the first and second heating regions 310, 330 (see, for example, Figures 12A and 12C ).
- the fluorescing signal from the material to be analyzed begins to exceed the background level. This is indicated by the dark oval shaped areas 2203 in the middle of the image.
- the intensity of the fluorescing signal continues to increase from left to right. This increasing discontinues at approximately a point 2204. This indicates that the material to be analyzed was only pumped into the PCR zone up to this point.
- Figure 23 shows an example amplification of two targeted genes with a PCR.
- the first target gene was cDNA made from human 18S rRNA.
- the sample was run through the sample PCR and yielded a Ct (PCR cycled threshold) value of 13.7 (trace 2302).
- the same sample was then diluted by a factor of 1 to 1000 and run on the PCR. This dilution should correspond to a Ct shift of ⁇ 10 cycles.
- the resulting trace 2304 corresponds well with this expected shift.
Landscapes
- Chemical & Material Sciences (AREA)
- Health & Medical Sciences (AREA)
- Chemical Kinetics & Catalysis (AREA)
- General Health & Medical Sciences (AREA)
- Analytical Chemistry (AREA)
- Clinical Laboratory Science (AREA)
- Life Sciences & Earth Sciences (AREA)
- Dispersion Chemistry (AREA)
- Hematology (AREA)
- Physics & Mathematics (AREA)
- Organic Chemistry (AREA)
- Fluid Mechanics (AREA)
- Zoology (AREA)
- Proteomics, Peptides & Aminoacids (AREA)
- Biochemistry (AREA)
- Wood Science & Technology (AREA)
- Engineering & Computer Science (AREA)
- Molecular Biology (AREA)
- Microbiology (AREA)
- Immunology (AREA)
- Biophysics (AREA)
- Biotechnology (AREA)
- Bioinformatics & Cheminformatics (AREA)
- General Engineering & Computer Science (AREA)
- Genetics & Genomics (AREA)
- Apparatus Associated With Microorganisms And Enzymes (AREA)
Description
- This application claims priority to
U.S. Provisional Application No. 62/584,199, filed on November 10, 2017 U.S. Provisional Application No. 62/584,204, filed on November 10, 2017 U.S. Provisional Application No. 62/584,208, filed on November 10, 2017 - The present disclosure relates generally to a method and apparatus to analyze components in a sample and in particular to determining an individual's level of exposure to radiation.
- The ability to determine an individual's level of exposure to ionizing radiation (bio-dosimetry) due to a nuclear event is critical in the performing of triaging and determining the appropriate medical treatment of the exposed individuals. The following is a review of the current art for bio-dosimetry.
- Molecular responses to ionizing radiation exposure fall in three broad categories according to the type of biomolecule chosen for analysis. These responses involve DNA, RNA, and protein.
- Of these three, DNA responses occur first in the cell, i.e. DNA damage by radiation occurs instantly upon exposure. However, repair of the damage can take hours or even days to weeks, depending on the cell type and the nature of the damage. DNA damage occurs in several broad categories, including chromosomal breaks and rearrangements that are visible through the microscope, and point mutations including small (submicroscopic) deletions / insertions / rearrangements. Detection of chromosomal events is slow because the steps needed for their identification typically require cell culture followed by time-consuming analysis involving trained observers. The turn-around time is typically several days. Some chromosomal changes can be observed in cells that have not been cultured to metaphase, but these approaches require hybridization technologies followed by manual scoring involving trained observers.
- Another type of cytogenetic response, that does not require cell culture, is the evaluation of micronuclei in erythrocytes. Micronuclei are formed by chromosomal fragments and by disruption of the mitotic spindle apparatus. Micronuclei are rare events and, in humans, erythrocytes bearing micronuclei are very efficiently filtered out by the spleen. In individuals who have had their spleen removed, micronucleated erythrocytes are not filtered out, and because the micronuclei are readily visible they can be efficiently counted by manual and by flow cytometric means. However, only about one adult per 1000 has been splenectomized, effectively negating this assay from broad-based population monitoring.
- Another flow-cytometry-based approach might involve the analysis of rearranged chromosomes, e.g. dicentrics and/or translocations. In this approach, chromosomes that have undergone radiation-induced rearrangements would be detected and enumerated. Rearranged chromosomes would appear to be bi-colored because they would have been hybridized with whole chromosome paints in a manner that is analogous to in situ hybridization. However, for such flow-based analyses the chromosomes would need to remain in solution, meaning that hybridizations would also have to occur in solution. These chemistries have not been widely adapted due to technical difficulties related to the separation of unbound probe from the chromosomes.
- Another approach to biological dosimetry involves protein analyses. Of the three biological response systems (DNA, RNA, protein), protein is the least well-characterized. There are several reasons why proteins may not be the subject of much research effort. First, the number of proteins is very large, perhaps an order of magnitude greater than the number of genes due to alternative splicing of mRNA and post-translational modification such as phosphorylation. Second, proteins often occur in complexes, sometimes making it difficult to enumerate quantities of specific peptide sequences. Third, proteins are all-too-readily denatured, which can interfere with common analysis methods such as enzyme-linked immunosorbent assay (ELISA). Finally, efficient quantitative analysis of proteins requires the use of monoclonal antibodies, which are not available for every protein, not to mention the vast array of protein variants that result from alternative splicing of mRNA and post-translational modification. Numerous changes to protein occur following irradiation. Unfortunately, the analytical techniques available for protein analysis lag substantially behind those for nucleic acid. To date, there are no systems using proteins that offer hope of performing meaningful biological dosimetry.
- The third category of biological response to radiation is RNA. Specific RNA sequences are known to respond to ionizing radiation.
US 2016/199835 A1 andUS 2012/178091 A1 describe microfluidic cartridges for polymerase chain reaction (PCR) according to the state of the art. -
-
Figure 1 is a perspective view of an example bio-dosimetry device. -
Figure 2 is a perspective view of the example bio-dosimetry device ofFigure 1 in an open position as well as an example cartridge for performing analysis being received into bio-dosimetry device. -
Figure 3 is an exploded view of the cartridge shown inFigure 2 . -
Figure 4 is a block diagram of an example bio-dosimetry system including the bio-dosimetry device shown inFigures 1 and 2 and the cartridge shown inFigures 2 and3 . -
Figure 5 is a perspective view of an example blister for injecting fluid into the cartridge at points in a processing flow. -
Figure 6A is a top view of an example lysing region with a cover removed. -
Figure 6B is a perspective view of an example lysing array with the cover removed. -
Figure 6C is a side view of the example lysing array ofFigure 6B showing the cover and including a piezo electric layer. -
Figure 6D is a side view of an example lysing array ofFigure 6B showing the cover and including a piezo electric element. -
Figure 6E is a top view of a section of the example lysing array ofFigure 6B with the cover removed. -
Figure 6F is a side view of the example the section of the lysing region ofFigure 6E . -
Figure 7A is a top view of an example binding region. -
Figure 7B is a perspective view of a section of the stationary phase in the binding region ofFigure 7A . -
Figure 7C is a top view of a section of the stationary phase in the binding region ofFigure 7A . -
Figure 7D is a side view of a section of the stationary phase in the binding region ofFigure 7A . -
Figure 8A is a top view of an example mixing region. -
Figure 8B is a perspective view of a portion of the mixing region ofFigure 8A . -
Figure 9 is a block diagram of an example PCR region. -
Figure 10 is a top view of an example pre-PCR zone. -
Figure 11 is side view of the example pre-PCR zone ofFigure 10 along an axis WW. -
Figure 12A is a top view of an example PCR zone. -
Figure 12B is a top view of the example PCR zone ofFigure 12A with the heating elements removed. -
Figure 12C is a top view of a section of the PCR zone ofFigure 12A . -
Figure 12D is a side view along cross-section X-X of the section of the example PCR zone ofFigure 12C . -
Figure 12E is a side view along cross-section Y-Y of the section of the example PCR zone ofFigure 12C . -
Figure 12F is a perspective view of the section of the example PCR zone ofFigure 12C . -
Figure 13 is an illustration of an example arrangement of acartridge 14. -
Figure 14 is a diagram of an example process for performing bio-dosimetry. -
Figure 15 is a diagram of an example process for lysing a sample. -
Figure 16 is a diagram of an example process for binding components of the sample. -
Figure 17 is a diagram of an example process for converting components of the sample to material for analysis. -
Figure 18 is a diagram of an example process for performing PCR on the material for analysis. -
Figures 19A-19E are graphs illustrating example responses of a respective genes to radiation. -
Figure 19F is a graph comparing example in vivo and ex vivo gene responses to radiation. -
Figure 20A-20C illustrate example comparisons of modeling results with ex vivo human data respectively for 12 hours, 24 hours and 48 hours post exposure. -
Figure 20D illustrates an example receiver operating characteristic (ROC) for modeling exposure to radiation at 12 hours post exposure. -
Figure 21 illustrates example graphs of fluorescence v. cycles from PCR analysis of blood samples with varying degrees of lysing. -
Figure 22 illustrates an example fluorescent image from a PCR zone. -
Figure 23 illustrates an example amplification of two targeted genes with a PCR zone. - The cartridge of the invention is defined in
claim 1. Preferred embodiments are described in claims 2-4. - RNA levels can be quantified quickly, easily, and inexpensively. Cell culture is not required, and every tissue contains RNA, so the analyses are not limited to a particular cell type. Significantly, RNA is readily reverse-transcribed into cDNA which can be amplified via the polymerase chain reaction (PCR) and quantified by real-time PCR. This means that very small amounts of tissue can be analyzed rapidly, efficiently, and quantitatively. Furthermore, RNA analyses take advantage of the very rapid response to ionizing radiation. Further, specific sequences of RNA undergo increased expression within an hour of exposure, while other genes continue to have elevated expression up to 24 hours, providing a flexible range of options for performing bio-dosimetry.
- A portable bio-dosimetry system that can perform rapid and reliable testing of radiation exposure is needed. Disclosed is a handheld field deployable real-time quantitative polymerase chain reaction (qPCR) based system that can assess exposure of individuals to ionizing radiation based on the levels of specific mRNA sequences present in the leukocytes from a drop of blood. The drop of blood may be obtained, for example, by a finger stick in a field or triage setting following a nuclear event. The system can predict whether an individual has received a dose of ionizing radiation greater than or less than a predetermined threshold value to allow field medical personnel to identify individuals in urgent need of medical treatment and to determine exposure levels to aid in medical treatment.
- The portable-dosimetry system includes sub-systems for receiving a blood sample from a person, lysing (breaking up of) blood cells from the blood sample into component parts including mRNA, binding the mRNA in a binding region for further processing while discarding waste from the lysing process, converting the bound mRNA to complimentary cDNA and performing quantitative polymerase chain reaction (qPCR) on the complimentary cDNA. The results of the qPCR analysis can provide an indication of exposure to radiation of the person.
-
Figures 1-4 illustrate anexample bio-dosimetry system 10. Thebio-dosimetry system 10 includes abio-dosimetry device 12 and acartridge 14 for processing a blood sample to determine the level of exposure to radiation of a respective person. As described in detail below, thebio-dosimetry device 12 may be a reusable, portable device that may be configured to receive onedisposable cartridge 14 at a time, eachcartridge 14 processing a blood sample of a respective person. Thecartridge 14 is intended to be a single-use cartridge, used to measure a single sample. Thebio-dosimetry device 12, performs a number of functions on the sample, including pumping, lysing, binding, conversion and PCR analysis. Based on these operations, thebio-dosimetry device 12 can determine a level of exposure to radiation of the blood sample. - As an example, the
bio-dosimetry system 10, along with the various sub-systems and related processes, will be described in relation to analyzing a blood sample for exposure to radiation. It is envisioned within the context of this disclosure that thebio-dosimetry system 10 and/or some of the sub-systems, can be used for other applications such as analyzing cancer cells, types of cells (phenotypes) such as with use of flow cytometry, RNA viruses, types of bacteria, etc. - The
bio-dosimetry device 12 comprises ahousing 16, asocket 18 for receiving thecartridge 14 and adoor 20 coupled to thehousing 16. Thedoor 20 encloses thesocket 18 in a closed position (Figure 1 ) and provides access to thesocket 18 in an open position (Figure 2 ). Thehousing 16 includes areservoir 22 for receiving a blood sample and acap 24 for enclosing the sample within the reservoir 22 (e.g., to avoid contamination). and ahandle 26 for carrying thebio-dosimetry device 12. Thehousing 16 further may include adisplay 28 for displaying information such as measurement data to a user, and auser input device 30 for receiving input from the user. - The
door 20 may be coupled to thehousing 16 with a hinge. When thedoor 20 is the opened position thesocket 18 can receive thecartridge 14. Upon receiving thecartridge 14 in thesocket 18, thedoor 20 can be closed. As described below, closing thedoor 20 can couple components in thebio-dosimetry device 12 to thecartridge 14. - The
bio-dosimetry device 12 includes abattery 48 which provides electrical energy to thebio-dosimetry device 12. Thebattery 48 may be a standard battery such as a lead-acid, nickel-cadmium, lithium-ion battery etc. Thebattery 48 enables thebio-dosimetry device 12 to be portable and used in locations without access to a power grid. - The
bio-dosimetry device 12 further include acomputer 50 including one ormore processors 52 and one ormore memories 54, thememories 54 including instructions for programming the one ormore processors 52. Thecomputer 50 executes instructions which can be used carry out the processes for preparing and analyzing the sample for exposure to radiation as described herein. Thecomputer 50 is communicatively coupled to components of thebio-dosimetry device 12 including thedisplay 28, theuser input device 30,sensors 56, anillumination system 58,optical detector 60,heating systems 62, pumps 64,blister actuators 66 and a piezoelectric element 68. - The
display 28 may be, for example, a liquid crystal display (LCD) or organic light emitting diode display (OLED) and can be used for outputting data, for example measurement data, to a user. Thedisplay 28 may further be a touch-screen device and used as an input device by the user. - The
user input device 30 includes one or more input elements such as buttons, turn knobs, touch-screens, a microphone, etc. that permit a user to input data and/or instructions to thebio-dosimetry device 12. - The
sensors 56 can include, for example, temperature sensors, pressure sensors and contact sensors. Thesensors 56 can receive instructions from and provide data to thecomputer 50 to enable thecomputer 50 to control the processes for preparing and analyzing the samples as described below. - The
illumination system 58 provides light for performing PCR. Theillumination system 58 is communicatively coupled to thecomputer 50 and includes a light source. The light source optimally emits light in a narrow band of wavelengths to stimulate the fluorescent tag. The fluorescent tag, in response, emits light at a different wavelength. The band of wavelengths radiated by the light source to stimulate the fluorescent tag needs to be limited to a range that does not overlap the light emitted by the fluorescent tag. There are many possible fluorescent tags (markers) and the wavelength of the light source needs to be matched to the tags. The light sources should be as monochromatic (narrow banded) as possible, such as a laser or a narrow emission light emitting diode or other light source with a narrow notch filter blocking wavelengths outside of the narrow band needed to stimulate the fluorescent tags. - The
illumination system 58 may further include electronic circuitry to turn the light source on and off, bias the light source in an operating condition, control or limit the power supplied to the light source, etc. As described below, theillumination system 58 can radiate light on thecartridge 14 during analysis of material to be analyzed, based on commands from thecomputer 50. Material to be analyzed as used herein is material that has been prepared to be analyzed based on components of the blood sample. The material to be analyzed may include fluorescent markers. - The
optical detector 60 is communicatively coupled to thecomputer 50, and can be, for example, a camera, a charge-coupled device (CCD), a light sensitive, CMOS array, etc. Theoptical detector 60 may include a filter to block the excitation wavelength (from the light source) used to stimulate a fluorescent tag and allow the fluorescent tag emission through for detection. Following or during illumination of the material to be analyzed by theillumination system 58, theoptical detector 60 receives light emitted by the material to be analyzed. Theoptical detector 60 can provide data to thecomputer 50 based on the received light. In an example, the material to be analyzed includes fluorescent markers. Following illumination, the fluorescent markers radiate light at a wavelength based on the markers and theoptical detector 60 detects the light. In some cases, theoptical detector 60 may be used to detect different fluorescent tags emitting light at different wavelengths. In these cases, theoptical detector 60 may receive respective images of the two fluorescent tags by applying different filters for each of the respective fluorescent tags. - In at least one example, each of the heating system(s) 62 of the
bio-dosimetry device 12 includes a heating element such as a resistance heater and may include electronic circuitry to turn the heating element on and off, bias the heating element in an operating condition, control or limit the power to the heating element, etc. Theheating system 62 may further include asensor 56, such as a temperature sensor, that can be used to detect a temperature of the heating element and provide feedback to theheating system 62 such that theheating system 62 can regulate the temperature of the heating element. As will be explained in greater detail below, the heating system(s) 62 may be used to heat a portion(s) of thecartridge 14 during processing of the blood sample. Further, the heating elements included in theheating system 62 may in some cases be contained in thebio-dosimetry device 12 and in other cases included as part of thecartridge 14. - In at least one example, the pump(s) 64 of the
bio-dosimetry device 12 may be electrically coupled to and controlled by thecomputer 50 such that thecomputer 50 can turn them on and off. As described in additional detail below, when thecartridge 14 is inserted into thebio-dosimetry device 12, and thedoor 20 is closed, thepumps 64 may further be in fluid communication with thecartridge 14 such that thepumps 64 can move fluids, e.g., from thereservoir 22 to thecartridge 14 or within thecartridge 14 from one region to another. - The
bio-dosimetry device 12 may further include one ormore blister actuators 66. Eachblister actuator 66 may be communicatively coupled with thecomputer 50 and include a plunger. The blister actuators 66 may be arranged within thebio-dosimetry device 12 such that, when thecartridge 14 is inserted in thebio-dosimetry device 12 and thedoor 20 is closed, theblister actuator 66 is within a range of elements on thecartridge 14 such that the plunger, in an extended state, extends into and compresses the elements on thecartridge 14 and releases fluids into a processing flow on thecartridge 14. - The
bio-dosimetry device 12 may further include a piezo electric element 38. The piezoelectric element 68 may be communicatively coupled with thecomputer 50 such that it can receive commands, for example, to turn the piezoelectric element 68 on and off or adjust a power level of the piezoelectric element 68. When the piezoelectric element 68 is turned on, it may vibrate at a frequency, for example 20 kHz. When acartridge 14 is inserted into thebio-dosimetry device 12 and thedoor 20 is closed, the piezoelectric element 68 may be coupled, either directly (in physical contact), or indirectly (for example, via a small air space) with elements on thecartridge 14 and cause the elements to vibrate, transferring mechanical energy to the elements. - The
cartridge 14 is a disposable cartridge that is intended to be used to analyze a single blood sample and is configured to be inserted into thebio-dosimetry device 12. Thecartridge 14 includes acassette 32 and asubstrate 34. Thecassette 32 is adapted to be inserted into thesocket 18 of thebio-dosimetry device 12 and includes a recessedarea 40 for receiving and supporting thesubstrate 34. Thesubstrate 34 has afirst side 41 and asecond side 42 and supports a plurality of sections configured to process and analyze a blood sample and determine a level of exposure to radiation. Thecartridge 14 further includes acover 44 having afirst side 45 and asecond side 46. Thesecond side 46 of the cover is attached to thefirst side 41 of thesubstrate 34 and encloses the processing regions formed in thesubstrate 34. Thesubstrate 34 and thecover 44 can be made of a material such as glass (e.g., Pyrex), silicon, a silicone-based material, sapphire, a polymer, or any transparent substrate. - The
cartridge 14 contains a plurality of regions for processing and analyzing a blood sample to determine a level of exposure to radiation. An overview of the regions of thecartridge 14 will be presented in the next paragraph. Thereafter, the structure and features of different sections of thecartridge 14 will be described in additional detail. - The blood sample is pumped into a lysing
region 90 on thecartridge 14, by amicropump 82 or via aport 84. In the lysingregion 90, the blood sample is broken into components parts including mRNA. After lysing, the blood sample including the mRNA, is transferred to thebinding region 92. In thebinding region 92, mRNA from the blood sample is bound (held). The remaining components are removed, by flushing. Thereafter, the bound mRNA in thebinding region 92 is flushed with a material, which forms cDNA with the bound mRNA. The cDNA, formed in thebinding region 92 is then transferred to a mixingregion 94 where the cDNA is more evenly distributed within a reaction mixture. Next, the cDNA is transferred to a polymerase chain reaction (PCR)region 96 where the cDNA is analyzed for exposure to radiation of the mRNA with which the cDNA was previously formed (in the binding region 92). - The
micropump 82 may be built into and/or on thesubstrate 34 and based on a micro-electro-mechanic systems (MEMS) technology. When thecartridge 14 is inserted in thebio-dosimetry device 12 and thedoor 20 is closed, an input to themicropump 82 may be fluidly coupled to thereservoir 22 in thebio-dosimetry device 12 such that themicropump 82 can pump the sample into the cartridge 14 (for example, into the lysing region 90). - The
cartridge 14 may further include one ormore ports 84. Theports 84 may be openings formed in thecover 44 of thecartridge 14. Theports 84 may be arranged to fluidly couple, for example, with an outlet of apump 64 in thebio-dosimetry device 12 when thecartridge 14 is inserted in thebio-dosimetry device 12 and thedoor 20 is closed. For example, the outlet of thepump 64, which may be a nozzle or a tube, may be inserted into theport 84 when thedoor 20 of thebio-dosimetry device 12 is closed, such that when thepump 64 is activated, thepump 64 can output a fluid into theport 84. - To store and, at a proper time during the sample processing, inject liquid materials in the processing flow, the
cartridge 14 may include one ormore blisters 86 fluidly coupled to respective regions in thecartridge 14. For example, one or more blisters 86a may be fluidly coupled to an inlet to the lysingregion 90. One ormore blister 86b may be coupled to an inlet to thebinding region 92 and one or more blister 86c may be coupled to an inlet to the mixingregion 94. Theblisters 86 may be, for example, a flexible, polymer based, fluid container, that is formed, for example, on a first side 55 of thecover 44. - Microchannels 85 may be used to fluidly couple regions and features of the
cartridge 14. For example, a microchannel 85a may couple one or more of themicropump 82, one or more blisters 86a and one ormore ports 84 to an inlet of the lysing region. A microchannel 85b may fluidly couple an outlet of the lysingregion 90 and an outlet of one ormore blisters 86b to an inlet of thebinding region 92. A microchannel 85c may couple an outlet of the mixingregion 94 to an inlet of thePCR region 96, etc. Each of the microchannels 85 may be formed in thesubstrate 34 and closed on afirst side 41 of thesubstrate 34 by asecond side 46 of thecover 44. - An
example blister 86 is shown inFigure 5 . Theblister 86 may be a hollow, flexible container made of a polymer that forms a cavity for containing a fluid. Theblister 86 may have aflat portion 100 for attaching to a surface, for example thefirst side 45 of thecover 44. Theblister 86 may further have a dome-shapedstructure 102 arranged on a side of the flat portion and forming the cavity. The dome shapedstructure 102 may be, for example, round, or in the form of an elongated rectangle or oval. Theblister 86 may have anoutlet 104 which may be fluidly coupled, to one of the processing regions on thecartridge 14. Theblister 86 is configured such that, when pressure is applied to the dome shapedstructure 102, fluid contained in theblister 86 is expelled through theoutlet 104. - A
blister 86 may be actuated by ablister actuator 66 on thebio-dosimetry device 12. Theblister actuator 66 may be arranged in thebio-dosimetry device 12 such that when thecartridge 14 is inserted in thesocket 18, theblister actuator 66 is in a range to actuate theblister 86. At an appropriate time during a processing cycle, thecomputer 50 in thebio-dosimetry device 12 may instruct theblister actuator 66 to extend a plunger toward and apply pressure to the dome-shapedstructure 102, and expel the liquid contained in theblister 86 into the processing region to which theblister 86 is fluidly coupled. A size of eachblister 86 in thecartridge 14 can be selected based on a volume of liquid required for the processing step in which theblister 86 participates. - An
example lysing region 90 is illustrated inFigures 6A - 6F . The lysing region lyses biological samples by applying ultrasonic stimulation. In an example, the sample to be lysed may be a drop of blood. In other examples, the sample may be any fluid with cells, for example waver with bacteria, cells in lymphatic fluid, cells in urine, etc. The lysingregion 90 may also be used for other applications such as lysing microbes, animal and plant cells, fracturing bonds in DNA, RNA, protein aggregates and lipid aggregates. The lysingregion 90 may be applied to prepare a sample for polymerase chain reaction (PCR) and rolling circle genetic amplification. - The lysing
region 90 includes aninlet 130, adistribution manifold 132, a lysingarray 134, anoutlet manifold 136, and anoutlet 138. The lysingregion 90 is configured to receive a sample via theinlet 130, pass the sample through thedistribution manifold 132, lyse, by transfer of mechanical energy, the sample into component parts in the lysingarray 134 and output the component parts through theoutlet manifold 136 to theoutlet 138. Each of theinlet 130, thedistribution manifold 132, the lysingarray 134, theoutlet manifold 136 and theoutlet 138 can be formed in the substrate 34 (Figures 6C, 6D ). - The
inlet 130 can receive the sample and/or other input material from one or more of themicropump 82, ablister 86 or aport 84, and deliver the sample or input material to the lysingarray 134 via thedistribution manifold 132. Thedistribution manifold 132 may be triangular shaped, with an apex of the triangle connected a microchannel 85a delivering the sample and/or input material and a base of the triangle connected to the lysingarray 134, such that thedistribution manifold 132 broadens from the microchannel 85a to the lysingarray 134 to distribute the material across a side of the lysingarray 134. - The lysing
array 134 may be square and with a typical length of the side in a range from 0.5cm to 1.0 cm. Other shapes are possible. For example, the lysingarray 134 may be rectangular with either a short side of the rectangle of a long side of the rectangle connecting to the distribution manifold. Further, the size of the lysingarray 134 is scalable. Increasing the size of the lysingarray 134 increases a volume of material that can be lysed in a period of time. Asmaller lysing array 134, can be used, for example, to lyse viruses or other small components. - The
outlet manifold 136 andoutlet 138 output material from the lysingarray 134 to a microchannel 85b. Theoutlet manifold 136 may be triangular shaped with a base of the triangle connected to the lysingarray 134 and an apex connected to the microchannel 85b, such that the material output from the lysingarray 134 is directed into the microchannel 85b. - The lysing
array 134 includes adiaphragm 155 formed in thesubstrate 34. Referring toFigure 6B , thediaphragm 155 has afirst side 156, asecond side 157 and a thickness t1. The thickness t1 can be in a range from 0.01 millimeters to 1 millimeter with a typical value of 0.1 millimeter. Referring toFigure 6C , thefirst side 156 of thediaphragm 155, together with thesubstrate 34 and thecover 44, define acavity 160. Thecavity 160 contains the sample to be lysed during lysing. Thecavity 160 may have a typical volume of four microliters and a typical volume range from one to 100 microliters. This range is not intended to be limiting. In addition to cavity volumes within this range, a lysingarray 134 according to this disclosure can also have volumes greater than or less than this range. - A plurality of
micropillars 162 extend outwardly from thefirst side 156 of thediaphragm 155 into thecavity 160. Each of themicropillars 162 has atop end 164. In an example, themicropillars 162 are arranged in columns and rows and may be evenly spaced. As an example, the lysingarray 134 may include 40 rows and 40 columns ofmicropillars 162, for a total of 1600 micropillars. Themicropillars 162 may be formed, for example, by an embossing or etching process. - The lysing
array 134 may include, coupled to thesecond side 157 of thediaphragm 155, a piezoelectric layer 166. During lysing, the piezoelectric layer 166 may be stimulated (i.e., an electric current may be applied). Based on the stimulation, the piezoelectric layer 166 may apply an oscillating force to thediaphragm 155, causing thediaphragm 155 to flex. At points towards a center of the lysingarray 134, the flexing of thediaphragm 155 may be substantially perpendicular to a plane of thediaphragm 155. In an example, the flexing of the diaphragm can result in a displacement in a range from 1 to 20 microns at points towards the center of the lysing diaphragm. In other examples, the displacement can be larger, up to a range of 1 millimeter or more. The amount of displacement may vary with the frequency of stimulation as there is a relaxation time dependent on displacement. That is, a lower frequency of stimulation may result in a larger displacement. The flexing causes a lateral motion on the top ends 164 of themicropillars 162. The lateral motion of the top ends 164 can create a liquid shock wave that can lyse the sample contained in thecavity 160, breaking the sample into component parts. An energy level applied to the diaphragm can be controlled to allow for lysing, for example, of cell walls, without damaging internal organelles in the blood cells. - As an alternative to the piezo
electric layer 166, a piezoelectric element 68 included in thebio-dosimetry device 12 can be used to stimulate the diaphragm of the lysingregion 90. This is illustrated inFigure 6D . In this case, when thecartridge 14 is inserted in thebio-dosimetry device 12 and thedoor 20 closed, the piezoelectric element 68 is arranged to physically couple with thediaphragm 155 such that when the piezoelectric element 68 is turned on, ultrasonic waves radiated from the piezoelectric element 68 cause thediaphragm 155 to flex. -
Figure 6E is a top view of a section of the lysingarray 134, with thecover 44 removed. The section shows two rows R1 and R2 and two columns C1 and C2. Themicropillars 162 may be cylindrically shaped, and have a diameter d. The diameter d may, for example, be in a range from 0.01 millimeters to 10 millimeters with a typical value of 0.075 millimeters. Themicropillars 162 may be evenly spaced and have a spacing W1 betweenadjacent micropillars 162 in a row (e.g., the row R1) and evenly spaced and have a spacing W2 between twomicropillars 162 in a column (e.g., the column C1). In a typical example, W1 may be substantially equal to W2. The spacings W1 and W2 may be in a range from 0.015 millimeters to 10 millimeters and have a typical value of 0.075 millimeters which is effective for most cells. The ranges of W1 and W2 may be selected based on a particle size of the sample to be lysed and would typically increase as the particle size to be lysed increases. - In another example, the lysing
array 134 may be applied to open or break apart protein chains and viruses. In this case, the spacings W1, W2 and the diameter d may be in a range of tens of nanometers. -
Figure 6F is a side view of the section of the lysingarray 134 shown inFigure 6D . Themicropillars 164 can have a height h1. The height h1 can be in a range from 0.1 millimeters to 100 millimeters and can depend on the diameter d chosen for themicropillars 164 and the sample to be lysed. The height h1 and diameter d are typically selected such that an aspect ratio h1/d is 10, with a range from 5 to 20. For example, in the case that the diameter d is selected to be 2 millimeters, the height h1 can be selected to be 20 millimeters. - The
diaphragm 155 has a thickness t1. As noted above, the thickness t1 can be in the range 0.01 millimeters to 1 millimeter with a typical value of 0.1 millimeters. The thickness of the piezo electric layer 166 (when present) may be in a range from 0.1 millimeters to 10 millimeters. - Other shapes may be used for the cross-section of the
micropillars 162. For example, the cross-section may be rectangular or triangular, themicropillars 164 may be conical with a base of the cone located at thefirst side 156 of thediaphragm 155, etc. -
Figures 7A-7D illustrate anexample binding region 92. Thebinding region 92 includes amicrochannel 200 having aninlet 203 and anoutlet 204. During operation, material, for example, a lysed blood sample flows through themicrochannel 200 in adirection 212. - The
microchannel 200 includes astationary phase 202. Thestationary phase 202 includes a plurality ofmicropillars 220. Themicropillars 220 are formed in and extend outwardly from thesubstrate 34. As shown inFigures 7B and7C , themicropillars 220 are arranged in rows, for example rows R3 and R4. Each row is offset from a previous row such that themicropillars 220 in the row R4 are arranged to correspond with an opening betweenmicropillars 220 in the row R3. - As an example, as shown in
Figure 7C , themicropillars 220 may have a cross-section having a hexagonal shape. Themicropillar 220 has first, second, third, fourth, fifth andsixth sides fourth sides fifth sides sixth sides micropillar 220 has a diameter d1 and a spacing between the micropillars d2. The diameter d1 may be in a range of two microns to 2,000 microns, with a typical value of 20 microns. The spacing may be in a range from one micron to 1,000 microns, with a typical value of 10 microns. Themicropillars 220 have a height h2. The height h2 may be in a range of 10 microns to 10 millimeters, with a typical height of one millimeter. - In some cases, the
micropillars 220 may be coated with a binding material to bind target components of the sample. For example, in the case of a blood sample containing mRNA, themicropillars 220 may be coated with oligo dT25 to bind the mRNA in the blood sample to themicropillars 220. - The
binding region 92 further may include aheating element 210 having twocontacts 211 on opposite ends. Theheating element 210 may be supported on thecover 44. Theheating element 210 may be formed of a resistive material such that, when an electrical voltage is applied across the twocontacts 211, a current will flow through theheating element 210 and generate heat. - Additionally or alternatively, during operation of the
bio-dosimetry system 10, aheating system 62 in thebio-dosimetry device 12 may be arranged such that when thecartridge 14 is inserted into thesocket 18 and thedoor 20 closed, theheating system 62 is thermally coupled to (i.e., can heat) thebinding region 92. - The
binding region 92 can be used to bind mRNA in a blood sample to thestationary phase 202. This is described below as theprocess 1600 in reference to theFigure 16 . - The
binding region 92 can further be used to convert the mRNA, bound in the stationary phase, to cDNA. This is described below as theprocess 1700 in reference to theFigure 17 . -
Figures 8A and 8B illustrate the mixingregion 94. The mixingregion 94 includes amicrochannel 240 having aninlet 241 and anoutlet 242. Themicrochannel 240 may be in the form of a meander having straight portions coupled at angles of, for example, 90° to one another. A length l8 of a straight portion in the meander may have a typical value of 1 millimeter to 2 millimeters. Themicrochannel 240 is formed in thesubstrate 34 and has a width d3. The width d3 can be in a range of 0.1 millimeters to 2 millimeters with a typical value of 0.5 millimeters. The depth U4 of the microchannel 240can be in a range from 0.1 millimeters to 1 millimeter with a typical value in a range from 0.1 to 0.2 millimeters. - The
microchannel 240 can be used to remove gradients of cDNA in reaction mixture. The reaction mixture, containing the cDNA may enter the mixingregion 94 at theinlet 241, pass through themicrochannel 240, continue through theoutlet 242. As the reaction mixture containing the cDNA passes through themicrochannel 240, the changes of directions as themicrochannel 240 passes through the 90 passing through 90° angles, may cause turbulence in the fluid flow, mixing the cDNA within the reaction mixture. Through the mixing process, the cDNA may be more evenly distributed, reducing or eliminating gradients in the cDNA within the reaction mixture. - The mixing
region 94 may have other shapes or features. For example, the width d3 of themicrochannel 240 may be varied alternatively between a first width and a second width or the depth U4 of themicrochannel 240 varied alternatively between a first depth and a second depth to create turbulence in the reaction mixture flow. As another example, extensions or bumps may be formed, extending from a bottom of themicrochannel 240 into themicrochannel 240 to increase turbulence in the reaction mixture flow. -
Figure 9 is a diagram of anexample PCR region 96. ThePCR region 96 receives material including cDNA from the mixingregion 94. The PCR region analyzes the cDNA for exposure to radiation of the mRNA from which the cDNA was generated. Analyzing the cDNA includes thermally cycling the material to be analyzed including the cDNA between two temperatures, as described below. ThePCR region 96 receives the material via a microchannel 85c. The microchannel 85c couples the mixing region 94 (Figure 4 ) via four sub-microchannels 98a, 98b, 98c, 98d to four respective PCR channels 250a, 250b, 250c, 250d. - A
PCR region 96 including four PCR channels 250a, 250b, 250c, 250d is only an example. ThePCR region 96 may include any number ofPCR channels 250. - As shown in
Figure 9 , the first PCR channel 250a includes thepre-PCR zone 252a, theblister 86e and thePCR zone 254a, the second PCR channel 250b includes thepre-PCR zone 252b, the blister 86f and thePCR zone 254, the third PCR channel 250c includes thepre-PCR zone 252c, theblister 86g and thePCR zone 254c and the fourth PCR channel 250d includes thepre-PCR zone 252d, theblister 86h and thePCR zone 254d. The four PCR channels 250a, 250b, 250c, 250d may be the same or similar, and will be described as anexample PCR channel 250 including anexample pre-PCR zone 252, anexample blister 86 and anexample PCR zone 254 below. -
Figures 10 and 11 illustrate anexample pre-PCR zone 252. Thepre-PCR zone 252 heats material prior to beginning analysis in thePCR zone 254. Thepre-PCR zone 252 includes amicrochannel 255 including aninlet 256 and anoutlet 257. Material enters themicrochannel 255 at theinlet 256 and flows towards theoutlet 257. Theoutlet 257 may be coupled, for example, to a sub-microchannel 98 such as the sub-microchannel 98a. Theoutlet 257 may be coupled to thePCR zone 254. - The
microchannel 255 may have a width d4 and a depth U6. Adjacent parallel sections of themicrochannel 255 may be spaced away from each other by a distance d5. The width d4 may be in a range from 0.1 millimeters to 2 millimeters with a typical value of 1 millimeter. The depth U6 of themicrochannel 255 may be in a range from 0.05 millimeters to 2 millimeters with a typical value of 1 millimeter. The spacing d5 between adjacent sections of themicrochannel 255 may have a range from 0.1 millimeters to 5 millimeters with a typical value of 2 millimeters. - The
pre-PCR zone 252 further may further include aheating element 260 including twocontacts 261. on opposite ends. Theheating element 260 may be supported on thecover 44. Theheating element 260 may be formed of a resistive material such that, when an electrical voltage is applied across the twocontacts 261, a current will flow through theheating element 260 and generate heat. - Additionally or alternatively to including the
heating element 260, aheating system 62 in thebio-dosimetry device 12 may be arranged such that when thecartridge 14 is inserted into thesocket 18 and thedoor 20 closed, theheating system 62 thermally couples to (i.e., can heat) thepre-PCR zone 252. -
Figures 12A through 12F illustrate anexample PCR zone 254. ThePCR zone 254 thermally cycles the material between a first temperature and a second temperature, and then images the material using fluorescent markers. The imaging provides data indicating a degree of exposure to radiation of the original sample. - The
PCR zone 254 includes amicrochannel 300. As shown inFigure 12A , themicrochannel 300 meanders from aninlet 302 to anoutlet 304. In practice, material to be analyzed by thePCR zone 254 is pumped into theinlet 302 and flows through themicrochannel 300 to theoutlet 304. - The
PCR zone 254 includes afirst heating region 310, adetection region 320 and asecond heating region 330. One or morefirst heating elements 340 extend across thefirst heating region 310. Similarly, one moresecond heating elements 350 extend across thesecond heating region 330. The first andsecond heating elements cover 44. - The first and
second heating regions second heating regions first heating region 310 at a first temperature should not interfere with maintaining thesecond heating region 330 at a second temperature, and vice versa. - In an example, the
detection region 320 is arranged between thefirst heating region 310 and thesecond heating region 330. Thedetection region 320 is characterized in that there are no heating elements organized above themicrochannel 300. Other arrangements of thedetection region 320, are possible. However, placing thedetection region 320 between the first andsecond heating regions second heating regions - Additionally to the first and
second heating elements heating system 62 included in thebio-dosimetry device 12 can be used respectively to heat each of the first thesecond heating regions - The
microchannel 300 is formed of a plurality of interconnected segments 303 (Figure 12C ) each segment 303 is arranged to perform one thermal cycle on the material flowing through themicrochannel 300. One thermal cycle is defined as passing through thefirst heating region 310 followed by passing through thesecond heating region 330. Typically, in aPCR zone 254, themicrochannel 300 may include approximately 35 segments 303. The number of segments 303 can be adjusted, based on the specific analysis to be performed in thePCR zone 254. -
Figure 12C is an enlarged view of a section of themicrochannel 300 illustrating an example segment 303a. The segment 303a has afirst end 305 and asecond end 307. The segment 303a starts at thefirst end 305, continues through thefirst heating region 310, through thedetection region 320, through thesecond heating region 330 and back through the detector region to thesecond end 307. Themicrochannel 300 then continues in a next segment 303b. As described below, when performing PCR, thefirst heating region 310 will be maintained at a first temperature and thesecond heating region 330 will be maintained at a second temperature, so that, as the material to be analyzed passes through themicrochannel 300, it is repeatedly cycled between the first temperature and the second temperature. - As shown in
Figure 12C , themicrochannel 300 has a width d8. The width d8 can be in a range from 0.01 millimeters to 1 millimeter with a typical value of 0.05 millimeters. The width d8 can be selected depending on a volume of fluid to be passed through themicrochannel 300, a particle size of the fluid passing through themicrochannel 300, the manufacturing process used to create themicrochannel 300 in thesubstrate 34, etc. - The
microchannel 300 further has a spacing d9 between parallel portions ofmicrochannel 300. The spacing d9 can be in a range from 0.01 millimeters to 3 millimeters with a typical value of 1 millimeter and can depend on factors such as the manufacturing process used to createmicrochannel 300. To conserve space in the substrate, the spacing d9 will typically be chosen to be close to or equal to a minimum feature size allowed by the manufacturing process used to form themicrochannel 300 in thesubstrate 34. - The
microchannel 300 further has a height h3. The height h3 is the distance, as measured along the axis Y-Y, from a furthest extension of themicrochannel 300 within thefirst heating region 310, for example thepoint 306a, to a furthest extension of themicrochannel 300 within thesecond heating region 330, for example thepoint 308a. - As further illustrated in
Figure 12C , thefirst heating region 310 has a height h4. Thedetection region 320 has a height h5 and thethird heating region 330 has a height h6. The height h3 of themicrochannel 300 is equal to the sum of the height h4 of thefirst heating region 310, the height h5 of the detector region and the height h6 of thesecond heating region 330. That is, h3 = h4 + h5 + h6. - The height h4 of the
first heating region 310 can be determined, for example, by the area required for thefirst heating element 340, based on the target first temperature of thefirst heating region 310. Similarly, the height h6 of thesecond heating region 330 can be determined by the area required for thesecond heating element 350, based on the target second temperature for the second heating region. The height h5 of thedetection region 320 can be determined, for example, based on having a specifically defined region for detecting (counting) cDNA based on a tag emission. The sensitivity of the detection increases as an area of thedetection region 320 increases. Further, as described above, in the case that thedetection region 320 is located between thefirst heating region 310 and thesecond heating region 330, the height h5 can be determined based on a distance required to thermally isolate thefirst heating region 310 from thesecond heating region 330. -
Figure 12D is a partial side view of a section of thePCR zone 254 shown inFigure 12C , cut along the axis X-X. Themicrochannel 300 is formed in thesubstrate 34. Thecover 44 is attached to thesubstrate 34, forming a top of themicrochannel 300. Themicrochannel 300 has a depth U5. The depth U5 can be in a range from 10 microns to 1000 microns, with a typical value of 100 microns. -
Figure 12E is a partial side view of a section of thePCR zone 254 shown in Figure 8C, cut along the axis Y-Y. As above, themicrochannel 300 is formed in thesubstrate 34 and covered by thecover 44. First andsecond heating elements cover 44. -
Figure 12F is a partial perspective view of the section of thePCR zone 254 shown inFigure 12D . Themicrochannel 300 is shown extending through thesecond heating region 330 and back again with each segment of themicrochannel 300. - In an example, the
pre-PCR zone 252 may be physically arranged on thesubstrate 34 near (e.g., adjacent) thePCR zone 254 in thesame PCR channel 250. More specifically, thepre-PCR zone 252 may be arranged near thefirst heating region 310 of thePCR zone 254. This allows thepre-PCR zone 252 to be heated to a substantially same temperature as the temperature of the first heating region of thePCR zone 254. Theheating element 260 in thepre-PCR zone 252 may be electrically coupled to thefirst heating element 340 in the first heating region. In a case that theheating system 62 is used to heat thefirst heating region 310, thesame heating system 62 can also be used to heat thepre-PCR zone 252. -
Figure 13 illustrates an example organization of acartridge 14. Acassette 32 supports asubstrate 34 in a recessedarea 40. Thesubstrate 34 has afirst side 41 and asecond side 42. Amicropump 82 receives a blood sample and pumps the blood sample to the lysingregion 90. After performing lysing on the blood sample, the lysingregion 90 outputs the lysed blood sample to thebinding region 92. Ablister 86b is arranged above thebinding region 92, which may be used to inject fluid, for example, a reaction material for conversion of the mRNA to cDNA in thebinding region 92. Asingle blister 86b is only an example. One ormore blisters 86b may be used to inject fluid into thebinding region 92. Thebinding region 92 outputs material including cDNA to the mixingregion 94. In the mixingregion 94, gradients of the cDNA in the material are reduced or eliminated. The mixingregion 94 outputs the material including the cDNA to fourpre-PCR zones blisters pre-PCR zones pre-PCR zones 252a. 252b, 252c, 252d output material respectively to the fourPCR zones blisters PCR zones - In an embodiment, DNA based cells (bacteria and other cells) can be analyzed. In this case, a DNA trapping region can be substituted for the RNA binding region. The trapped DNA can go directly to amplification in a
PCR region 96. -
Figure 14 is a diagram of anexemplary process 1400 for performing bio-dosimetry on a sample with thebio-dosimetry system 10. A sample size can be in a range of 1 to 1000 microliters and can typically be approximately 100 microliters. An example sample is a drop of blood. Theprocess 1400 begins in ablock 1402. - In the
block 1402, thecomputer 50 is programmed to initiate bio-dosimetry on a sample. Thecomputer 50 may receive a trigger event, such as an input from the user via theuser input device 30 to begin thebio-dosimetry process 1400, or inputs, for example fromsensors 56, that the sample is available in thereservoir 22 and afresh cartridge 14 has been inserted into thebio-dosimetry device 12. Based on the trigger event, thecomputer 50 may instruct themicropump 82 on thecartridge 14 to pump the sample from thereservoir 22 into the lysingregion 90 on thecartridge 14. Alternatively, in a case that thecartridge 14 does not include themicropump 82, thecomputer 50 may instruct apump 64 on thebio-dosimetry device 12 to pump the sample into the lysingregion 90. Theprocess 1400 continues in ablock 1404. - In the
block 1404, thecomputer 50 is programmed to lyse the sample according toprocess 1500, described below. Lysing the sample is defined herein as breaking the sample into component parts. Upon lysing the sample, theprocess 1400 continues in ablock 1406. - In the
block 1406, thecomputer 50 is programmed to bind target components of the sample in thebinding region 92 according to aprocess 1600, described below. Target components are components of the sample that thebio-dosimetry system 10 targets to remove from the lysed sample and contain in thebinding region 92. During the binding process, target components in the lysed sample are bound to thestationary phase 202 in thebinding region 92, and other components are discarded. Theprocess 1400 continues in ablock 1408. - In the
block 1408, thecomputer 50 is programmed to convert target components from the sample bound in thebinding region 92 to a material to be analyzed by PCR according to theprocess 1700, described below. For example, mRNA, bound in the binding region, can be converted to cDNA. Upon converting the bound target components into material to be analyzed by PCR, theprocess 1400 continues in ablock 1410. - In the
block 1410, thecomputer 50 is programmed to perform PCR analysis on the material to be analyzed according to theprocess 1800 described below. Theprocess 1400 continues in ablock 1412. - In the
block 1412, thecomputer 50 is programmed to store and/or output results of the PCR analysis. Thecomputer 50 may output data on thedisplay 28 on thebio-dosimetry device 12. Additionally or alternatively, thecomputer 50 may transmit the data, for example via wireless communications to another computer. Still further, thecomputer 50 may be programmed to store the data from the PCR analysis for retrieval at a future time. Upon outputting and/or storing the data, theprocess 900 may end. -
Figure 15 is a diagram of anexemplary process 1500 for lysing the sample received from thebio-dosimetry device 12 in anexample lysing region 90. The sample to be lysed may be a drop of blood. Alternatively, the lysing region may be used to lyse other biological samples such as gram positive bacteria, gram negative bacteria, and encapsulated bacteria such as Anthrax. Theprocess 1500 can be initiated byblock 1404 ofprocess 1400 and begins in theblock 1502. - In the
block 1502, thecomputer 50 is programmed to pump the sample through the lysingregion 90. For example, the sample may be a drop of blood or other liquid with a size of 100 microliters. Amicropump 82 on thecartridge 14 may perform the pumping (Figure 4 ). Alternatively, apump 64 in thebio-dosimetry device 12 can perform the pumping. As an example, the sample can be pumped at a flow rate corresponding to a resonance time within thecavity 160 of the lysingarray 134 in a range of 5 to 30 seconds. With an average resonance time of 20 seconds, and a cavity volume of four microliters, a sample can be lysed within a time of five minutes or less. Theprocess 1500 continues in ablock 1504. - In the
block 1504, which can occur concurrently with all or a portion theblock 1502, thecomputer 50 is programmed to apply ultrasonic stimulation to the lysingarray 134. The lysingarray 134 may include a piezoelectric layer 166 as shown inFigure 6C . Alternatively, the lysingarray 134 may be coupled to a piezoelectric element 68, included in thebio-dosimetry device 12, as shown inFigure 6D . Thecomputer 50 is programmed to activate the piezoelectric layer 166 or piezoelectric element 68 to induce flexing of thediaphragm 155 in the lysingarray 134. At points of maximum flexing, for example near a center of thediaphragm 155, a displacement of thediaphragm 155 may be in a range from one to 100 microns, with a typical displacement of 5 microns, and may be in a direction substantially perpendicular to a plane of thediaphragm 155. The induced movement can typically be at a frequency of 20kHz, with a range between 10kHz and 40kHz. The range is not intended to be limiting, and other frequencies above or below this range can also be used. - Based on the induced flexing of the
diaphragm 155, themicropillars 162 will be induced to move laterally, back and forth through their respective non-stimulated positions in the lysingarray 134. The induced lateral motion of themicropillars 162 can transfer mechanical energy to the sample, causing the sample to break into component parts. In an example, the sample includes human blood. Blood cells (leukocytes and/or erythrocytes) can be broken up to free mRNA from the cells. Theprocess 1500 continues in ablock 1506. - In the
block 1506, that can occur concurrently with all or a portion of theblocks computer 50 is programmed to output the lysed sample to thebinding region 92. Based on pressure from one of themicropump 82 and thepump 64, as described with regard to block 1502, the lysed sample passes through theoutlet manifold 136, through a microchannel formed in the substrate, and into thebinding region 92. Theprocess 1500 ends. -
Figure 16 is a diagram of anexemplary process 1600 for binding components of the sample in thebinding region 92. Theprocess 1600 can be initiated byblock 1406 ofprocess 1400 and begins in ablock 1602. - In the
block 1602, thecomputer 50 is programmed to pump the lysed sample through thebinding region 92. Theblock 1602 can occur concurrently with all or a portion of theprocess 1500, as described above. That is, one of themicropump 82 or thepump 64 can pump the sample into the lysingregion 90 and continue pumping such that the sample continues to flow into thebinding region 92. As described above, a volume of the sample in a typical case can be 100 microliters. The volume of the lysingarray 134 can be in a range of four microliters. Accordingly, a portion of the sample can have exited the lysingregion 90 and entered thebinding region 92 while another portion of the sample has not yet entered the lysingregion 90, such that a continuous flow exists from thereservoir 22, through the lysingregion 90 and through thebinding region 92. - As the lysed sample flows through the
binding region 92, thebinding region 92 binds to target components in the sample, containing the target components. As described above, thebinding region 92 includes astationary phase 202. Thestationary phase 202 includes a plurality ofmicropillars 220. Themicropillars 220 may be coated with a binding material that binds with target components in the lysed sample. - As the lysed sample flows through the
binding region 92, the target components bind with the binding material coated on themicropillars 220. During theblock 1602, a sufficient quantity of the lysed sample can be passed through thebinding region 92 such that the binding material on thestationary phase 202 is saturated. That is, substantially every site available to bind with a target component is occupied by a target component. As an example, the target components may be mRNA cells. The binding material may be oligo dT25 that specifically binds to any mRNA present in the sample. An amount of lysed sample through thebinding region 92 to saturate thestationary phase 202 for a set of target components can be determined empirically. For example, for thebinding region 92 as described above, including astationary phase 202 coated with oligo dT25, a quantity of lysed sample of 60 microliters was determined to be sufficient to saturate thestationary phase 202. - As the sample continues to be pumped through the lysing
region 90 and thebinding region 92, waste material, after passing through the binding region, can be discarded. Thecomputer 50 can be further programmed to turn off themicropump 82 or pump 64 when sufficient material has been passed through the binding region to saturate thestationary phase 202. Theprocess 1600 continues in ablock 1604. - In the
block 1604, thecomputer 50 is programmed to rinse thebinding region 92. Thecomputer 50 sends instructions to force a rinsing fluid through thebinding region 92. For example, the rinsing fluid may be contained in ablister 86 arranged at theinlet 203 of thebinding region 92. Thecomputer 50 may instruct ablister actuator 66 in thebio-dosimetry device 12 to actuate theblister 86. Theblister actuator 66 may extend a plunger into theblister 86, expelling contents of theblister 86 into thebinding region 92. The rinsing fluid may be selected to be a material that mixes with the non-bound material in the binding region but does not react with the target components. In this manner, the target components can remain bound in thebinding region 92 after rinsing. Theprocess 1600 continues in ablock 1606. - In the
block 1606, which can occur during all or a portion of theblock 1604, the non-bound material, mixed with the rinsing fluid is discarded. Theprocess 1600 ends. -
Figure 17 is a diagram of anexemplary process 1700 for converting the target components of the sample, bound in thebinding region 92, to material for analysis. Theprocess 1700 can be initiated byblock 1408 ofprocess 1400 and begins in ablock 1702. - In the
block 1702, thecomputer 50 is programmed to flush thebinding region 92 with a reaction mixture. For example, thecartridge 14 can include ablister 86b containing the reaction mixture fluidly coupled to theinlet 203 of thebinding region 92. Thecomputer 50 can instruct ablister actuator 66 to actuate theblister 86b such the reaction mixture is forced into and through thebinding region 92. The reaction mixture can include the components necessary to convert the bond target components in thebinding region 92 to material to be analyzed. - In an example, the target components may be mRNA from the sample. The reaction mixture can include the components necessary to convert, through reverse transcription, the mRNA to cDNA which can then be subjected to PCR analysis. The
process 1700 continues in ablock 1704. - In the
block 1704, components in the reaction mixture react with the target components that are bound in thebinding region 92, forming material to be analyzed. In some cases, heat may be applied to thebinding region 92 to cause/support the reaction. For example, in the case of forming cDNA from mRNA bound in thebinding region 92, thecomputer 50 cay be programmed to heat thebinding region 92 to 50 °C for 30 minutes. The newly formed material may be bound to thestationary phase 202 of thebinding region 92. Theprocess 1700 continues in ablock 1706. - In the
block 1706, thecomputer 50 is programmed to release the material to be analyzed for analysis. For example, in the case that the material to be analyzed is cDNA, the cDNA may be bound to thestationary phase 202. In this case, thecomputer 50 can be programmed to heat the binding region to 84°C for 5 minutes + sufficient time to release the cDNA. A time that is sufficient to release the cDNA can be determined empirically by performing tests withsample cartridges 14. Theprocess 1700 continues in ablock 1708. - In the
block 1708, thecomputer 50 is programmed to remove gradients of the material to be analyzed in the reaction mixture. Thecomputer 50 sends commands to pump the reaction mixture through the mixingregion 94. As the reaction mixture flows through the mixingregion 94, the material to be analyzed, for example, cDNA, is distributed throughout the reaction mixture, reducing or eliminating gradients of the cDNA. Theprocess 1700 ends. -
Figure 18 is a diagram for aprocess 1800 for performing qPCR analysis on the material to be analyzed. Theprocess 1800 includes thermally cycling the material to be analyzed between a first temperature and a second temperature, and then imaging the material to be analyzed using fluorescent markers. Theprocess 1800 can be initiated byblock 1410 ofprocess 1400 and begins in ablock 1802. - In the
block 1802, thecomputer 50 is programmed to distribute the reaction mixture including the material to be analyzed to four PCR channels 250a, 250b, 250c, 250d for analysis. The four PCR channels 250a, 250b, 250c, 250d include respectively four pre-PCR zones, 252a, 252b, 252c, 252d. As shown inFigure 9 , the fourpre-PCR zones PCR zones computer 50 can activate apump 64 to pump the reaction mixture into thepre-PCR zones - In an example, the microchannel 85 coupling the mixing
region 94 to the fourpre-PCR zones 252a. 252b, 252c, 252e can split into four sub-channels 98a, 98b, 98c, 98d. The reaction mixture including the material to be analyzed can be pumped through the microchannel, and divide between the four sub-channels 98a, 98b, 98c, 98d, under pressure from thepump 64, such that a portion of the reaction mixture including the material to be analyzed is directed toward each of the fourpre-PCR zones - The
process 1800 continues in ablock 1804. - In the
block 1804, thecomputer 50 may be programmed to heat the reaction mixture including the material to be analyzed in thepre-PCR zones computer 50 may be programmed to heat the reaction mixture including the material to be analyzed, to separate the cDNA into single strands prior to adding the primers and markers. Thecomputer 50 may be programmed to heat the reaction mixture to 95°C for 10 minutes. Other temperatures and times can be used for different materials to be analyzed. The times and temperatures can be determined empirically. The process continues in ablock 1806. - In the
block 1806, thecomputer 50 is programmed to add a set of markers and primers to the reaction mixture flowing respectively into each of the fourPCR zones PCR zones Figure 9 , afirst blister 86e may be coupled to add markers and primers to a microchannel between thepre-PCR zone 252a andPCR zone 254a, a second blister 86f may be coupled to add markers and primers to a microchannel between thepre-PCR zone 252b andPCR zone 254b, athird blister 86g may be coupled to add markers and primers to a microchannel between thepre-PCR zone 252c and thePCR zone 254c and afourth blister 86h may be coupled to add markers and primers to a microchannel between thepre-PCR zone 252d and thePCR zone 254d. At a time that the reaction mixture including the material to be analyzed is flowing from thepre-PCR zone 252a toPCR zone 254a, thecomputer 50 may actuate thefirst blister 86e. At a time that the reaction mixture including the material to be analyzed is flowing from thepre-PCR zone 252b toPCR zone 254b, thecomputer 50 may actuate a second blister 86f. Similarly, thecomputer 50 may actuate athird blister 86g at a time that the reaction mixture including the material to be analyzed is flowing from thepre-PCR zone 252c toPCR zone 254c and afourth blister 86h at a time that the reaction mixture including the material to be analyzed is flowing from thepre-PCR zone 252d toPCR zone 254d. The times that the reaction mixture is flowing respectively frompre-PCR zone 252a toPCR zone 254a, frompre-PCR zone 252b toPCR zone 254b, frompre-PCR zone 252c toPCR zone 254c and frompre-PCR zone 252d toPCR zone 254d may be the same, partially overlapping, or different, depending on an organization of the microchannel and four sub-channels between the mixingregion 94 and the fourpre-PCR zones 252. For example, each of the four sub-channels coupling the respectivepre-PCR zones region 94, may be a same length or a different length. The lengths of the sub-channels may impact a timing for adding the sets of markers to the reaction mixture for therespective PCR zones - The primers for each
PCR zone 254 are selected to mark prepare a particular component or pair of components in the material to be analyzed for qPCR analysis. For example, for each of the fourPCR zones block 1808. - In the
block 1808, thecomputer 50 is programmed to pump the reaction mixture, including the material to be analyzed and combined with the primers, into therespective PCR zones blocks 1808 through 1816 will be described with respect to anexample PCR zone 254. It can be understood that the process ofblock 1808 can be applied similarly to each of thePCR zones - The
computer 50 may, for example, instruct apump 64 in thebio-dosimetry device 12 to pump the reaction mixture including the material to be analyzed and the primers into theexample PCR zone 254. As described above, thePCR zone 254 includes amicrochannel 300. Themicrochannel 300 is formed of a plurality of segments. Each segment extends back and forth between afirst heating region 310, adetection region 320 and asecond heating region 330. In an example, themicrochannel 300 includes 35 segments. - As an example, the material to be analyzed includes cDNA. The
computer 50 may be programmed to maintain a first temperature of the first heating region at 95°C and to maintain second temperature of the second heating region at 60°C. As the reaction mixture together with the material to be analyzed and the primer passes through thefirst heating region 310, the 95°C temperature causes the cDNA to separate into single strands. As the reaction mixture together with the material to be analyzed and the primer passes through thesecond heating region 330, the 60°C temperature allows single stranded primers to attach to single stranded DNA to form complementary strands. As the reaction mixture continues to pass through the segments of themicrochannel 300, the material to be analyzed continues to thermally cycle, that is, to cycle between the first andsecond heating regions - The
computer 50 can be programmed to continue to pump the reaction mixture in thePCR zone 254 until all or most of themicrochannel 300 is filled with the reaction mixture. In this case, the farther through themicrochannel 300 the reaction mixture has passed, the greater number of cycles of the first and second heating regions the reaction mixture will have experienced. Theprocess 1800 continues in ablock 1810. - In the
block 1810, thecomputer 50 is programmed to illuminate themicrochannel 300 in thePCR zone 254. Thecomputer 50 may radiate thedetection region 320 of thePCR zone 254 with light for a time. The time may be in a range of from 1 to 2000 seconds, with a typical time of 1200 seconds. Theprocess 1800 continues in ablock 1812. - In the
block 1812, thecomputer 50 receives images from thedetection region 320 of thePCR zone 254. The fluorescent markers that combined with the cDNA will fluoresce at wavelengths determined by the markers. Theoptical detector 60 in thebio-dosimetry device 12 receives the light fluoresced from the markers. Before being received by theoptical detector 60, a filter may be used to select which wavelength of light can be received by theoptical detector 60. As described above, in the case that different markers were used for two different components of the material to be analyzed (e.g., two different genes), a first image can be received from thedetection region 320 with a first filter for a first range of wavelengths and a second image can be received from thedetection region 320 with a second filter for a second range of wavelengths. Theoptical detector 60 can provide data representing the first and second images to thecomputer 50. Theprocess 1800 continues in ablock 1814. - In the
block 1814, thecomputer 50 analyzes the data of the first and second images. For example, thecomputer 50 may determine the Ct of each of the genes combined with a respective fluorescent marker. The Ct (cycle threshold) is defined as the number of cycles required for the fluorescent signal to exceed background level. The number of cycles required for the fluorescent signal to exceed the background level can be determined by a position within thePCR detection region 320 along an axis of increasing cycles that shows a radiation of light at the wavelength of the particular fluorescent material that exceeds the radiation of the background. The position can be directly correlated to a number of cycles to which the material to be analyzed (i.e., the genes with the fluorescent material currently being measured) were exposed before their collective illumination exceeded the background illumination. A measurement taken with an example PCR zone is described below in reference toFigure 22 . Theprocess 1800 continues in ablock 1816. - In the
block 1816, thecomputer 50 reports and/or stores the results of the PCR analysis. Thecomputer 50 may report the results to another computer and/or on a display such as thedisplay 28 on thebio-dosimetry device 12. Further, thecomputer 50 may store the results, for example with a time stamp, or an identification of the cartridge that was measured, in memory associated with thecomputer 50. Theprocess 1800 ends. - As used herein, the adverb "substantially" modifying an adjective means that a shape, structure, measurement, value, calculation, etc. may deviate from an exact described geometry, distance, measurement, value, calculation, etc., because of imperfections in materials, machining, manufacturing, data collector measurements, computations, processing time, communications time, etc.
- As an example, the
bio-dosimetry system 10 can be used to determine radiation exposure of an individual. A drop of blood from the individual can be evaluated to determine the radiation dose they received based on their gene expression levels. As evidence of efficacy ex vivo irradiation of human blood was utilized and the subsequent culturing of that blood for quantitative study of utilizing gene expression for human dosimetry. - Selection of valid control genes is critical to have a point of reference to evaluate radiation responsive genes. Several very stable endogenous control (EC) gene products were identified. As an example,
Figure 19A illustrates a fold increase in expression level as a function of dose for the gene RB1 at 12 hours (trace 1902), 24 hours (trace - Having selected a series of EC genes as controls, radiation responsive genes can be evaluated by examining the gene expression level of a potential response gene relative to that of a selected EC gene for exposed sample. A fold increase in expression levels as a function of dose and time following exposure can be determined by comparing that ratio to the population average of the non-exposed ratio of those same genes. The results for three potential radiation response genes (CDKN1A, ASTN2, and GDF15) that can be utilized as dosimetry biomarkers as shown respectively in
Figures 19B ,19C and 19D referenced to RB1. -
Figure 19B illustrates a fold increase of expression level as a function of dose for the gene CDKN1A at 12 hours (trace 1912), 24 hours (trace 1914) and 48 hours (trace 1916). -
Figure 19C illustrates a fold increase of expression level for the gene ASTN2 at 12 hours (trace 1922) 24 hours (trace 1924) and 48 hours (trace 1926). -
Figure 19D illustrates a fold increase of expression level as a function of dose for the gene GDF15 at 12 hours (trace 1932), 24 hours (trace 1934) and 48 hours (trace 1936). - For each of these genes CDKN1A, ASTN2 and GDF15, the curves show clear increases in expression for each of the times post irradiation examined. In a case of a nuclear event, the time of the nuclear event is known. A user can, in this case, follow the appropriate dosimetry curve for each gene product. All the gene products shown, and many others, exhibit significant increases in genes expression even at doses as low as 0.5 Gy. In the case of some genes, up to 16-fold increases of expression can be observed at higher doses. Fold changes in gene expression of 1.5 or 2 are large can easily and accurately be detected by qPCR analysis, indicating that these changes will be readily detectable by a portable PCR system.
- In the case of several radiation responsive genes such as CDKN1A (
Figure 19B ) gene expression levels slowly increase with time post-exposure and were highest at the longest time point examined in our studies. While other gene products such as ASTN2 and GDF15 (Figures 19C and 19D ) rapidly increase at very short times post exposure and then decrease with time, they still maintain an easily-detectable increase in expression out to 48 hours post exposure. Also of note is that while a number of gene products such as CDKN1A and GDF15 (Figures 19B and 14D) show a response to radiation over the entire range of doses examined, other gene products such as ASTN2 (Figure 19C ) show a relatively steep dose response over a short range of doses and plateau in their expression at higher doses. This wide range in dose and time responses observed in the radiation response genes identified provides the ability to select a series of genes that can be utilized and optimized for dosimetry at various exposure levels and times post exposure. -
Figure 19E illustrates a fold increase of expression of the gene CDKN1A v. dose for a in vivo radiation utilizing an animal model (C57BI/6 male mice).Traces -
Figure 19F illustrates a comparison between human cancer patients irradiated in vivo and blood samples from these patients irradiated ex vivo. Sample of blood was drawn from the patients immediately prior to the patient receiving total body irradiation doses of between 2 and 4 Gy from aCobalt 60 source A portion of the pre-radiation therapy blood sample was then irradiated with the same source and conditions as that received by the patient, and this blood was then cultured in the absence of mitogen for 24 hours. A second blood sample was drawn from the patient at approximately 24 hours post exposure. An in vivo / ex vivo exposure comparison for one of the genes examined (CDKN1A) was referenced to DPM1. Similar increase in gene expression can be observed in both the in vivo and ex vivo irradiated samples for each patient. In this study (#501, #505, #507) were given higher levels of chemotherapy while the later patients (#509, #510, #511, #513) were given lower doses of chemotherapy in their treatment. In these later patients (#509, #510, #511, #513), increases in gene expression from in vivo exposure closely match those seen in ex vivo exposure for CDKN1A shown as well as for other genes examined, and in several cases such as CDKN1A expression increases match those seen in samples from healthy donors. The fact that gene expression levels for several genes, which could be utilized for radiation dosimetry, remain viable as biomarkers even in cancer patients receiving light doses of chemotherapy is a good indication of the robustness of these markers and to their potential resistance to confounding factors in the general population. - Both the results from our mouse study and our evaluation of TBI patients support the validity of the use of ex vivo irradiated blood as a valid model for radiation exposure in humans for the study of gene expression from a blood sample. The animal study showed that comparable gene expression increases, resulting from radiation exposure, occur in an in vivo irradiation animal model as those seen with the ex vivo irradiation of cultured blood samples. The animal study further confirms that gene expression is a valid and feasible dosimetry method even at times of seven days post exposure and possible beyond. In vivo / ex vivo comparisons of gene expression levels in human cancer patients confirm that increases in gene expression due to radiation exposure for the genes examined in our study are not dependent on whether the radiation exposure was performed in vivo or ex vivo.
- The results from individual genes as shown in
Figures 19A-19F illustrate a time dose dependence to the genes expression levels. To accurately perform dosimetry based on data from these genes, a statistical model is required. To develop a statistical model, multiple predictive models to determine dosimetry were developed for the various time points post exposure. These regression models, a quadratic fit to the log of dose, were fit using forward stepwise regression. At each step a gene was added to the model based on the following: (a) the greatest contribution to increasing R-squared and (b) maintaining the available sample size. The statistical model for time point post exposure is shown inFigures 20A-20C where the actual radiation dose is plotted against the model's predicted dose. The genes utilized in this model were CDKN1A, ATM, ASTN2, and GDF15.Figure 20A-20C compare modeling results with ex vivo human data respectively for 12 hours, 24 hours and 48 hours post exposure. - While the modeling of the gene expression data is modeled with respect to the log of dose, due to the exponential nature of Ct values, this data is converted to a linear scale for the plots in
Figures 20A-20C . It is this conversion from the native log scale of the model to a linear dose for plotting that makes the data at high doses inFigures 20A-20C appears to be more scattered then at the lower doses. - An example result is shown in
Figure 20D where a receiver operating characteristic (ROC) curve for a prediction of exposure of 2 Gy or greater is shown at 12 hours post exposure. For the data shown inFigure 20D , the area under the ROC curve was 0.9816 (value of 1 being perfect), which is very good for biomedical screening application. Similar ROC curves were obtained for the predictive models for the other post exposure time points examined in the ex vivo human study and for the data from the animal model. In order to further reduce any false negatives, sensitivity could be maximized at the cost specificity resulting in increased false positives. - Tests were performed on an example lysing device to estimate the lysing capability of the lysing
region 90 described above. The example lysing device used for the test had included 1600 micropillars arranged in a 40 by 40 lysing array. The micropillars were supported on a 6mm x 6 mm x 0.1 mm thick diaphragm. The micropillars had a diameter of 0.075 mm and a height of 0.75 mm. The spacing between the micropillars was 0.075mm. To estimate the effectiveness of the lysing region, PCR analysis was performed on four different samples exposed to varying degrees of lysing. The results are of the tests are shown inFigure 21 , which illustrates example traces of cycle threshold (Ct) from PCR analysis of the four different blood samples. The Ct level indicates a number of remaining unlysed lymphocites in each blood sample. -
Trace 2102 inFigure 21 is an example trace from PCR analysis of whole blood that is passed through an example lysing device without powering the lysing device. -
Trace 2104 is an example trace from PCR analysis of whole blood that was not passed through the lysing device (a sample representing the condition of the blood as input into the lysing device). -
Trace 2106 is an example trace from PCR analysis of a control_lynmphocyte GM40. The control lymphocyte is a set amount that is injected as a known control for reference. -
Trace 2108 is an example trace from PCR analysis of whole blood that is passed through the lysing device under power. That is, the diaphragm is actuated at 20kHz while the whole blood is passed through the lysing device. -
Figure 22 illustrates an example image of aPCR zone 254 containing material to be analyzed that has been illuminated and is fluorescing. As described above, thePCR zone 254 includes amicrochannel 300 including a plurality of segments. Each segment cycles through afirst heating region 310, adetection region 320 and asecond heating region 330. - In the test, material to be analyzed is pumped into the
microchannel 300 in thePCR zone 254. In an example, sufficient material can be pumped into themicrochannel 300 that all of the plurality of segments contain material. When, themicrochannel 300 is filled in this manner, thedetection region 320 in thePCR zone 254 can be illuminated. Following illumination, an image can be taken of thedetection region 320. The resulting image can show, by an intensity of fluorescent light at locations (i.e., in different segments) of themicrochannel 300, the cycle threshold (Ct) required to detect a component (for example, a gene) within the material to be analyzed. The cycle threshold (Ct) is defined as the number of cycles (through the first andsecond heating regions 310, 330) required for the fluorescent signal from the tag to exceed background level. The cycle threshold provides an indication of a degree of exposure to radiation of the original sample used to prepare the material to be analyzed. - In
Figure 22 , the number of cycles of the PCR to which the material to be analyzed has been exposed increases from left to right. Imaging is performed in thedetection region 320 between the first andsecond heating regions 310, 330 (see, for example,Figures 12A and12C ). In the area labelled 2202, the fluorescing signal from the material to be analyzed begins to exceed the background level. This is indicated by the dark oval shapedareas 2203 in the middle of the image. As can be seen, the intensity of the fluorescing signal continues to increase from left to right. This increasing discontinues at approximately apoint 2204. This indicates that the material to be analyzed was only pumped into the PCR zone up to this point. -
Figure 23 shows an example amplification of two targeted genes with a PCR. The first target gene was cDNA made from human 18S rRNA. The sample was run through the sample PCR and yielded a Ct (PCR cycled threshold) value of 13.7 (trace 2302). The same sample was then diluted by a factor of 1 to 1000 and run on the PCR. This dilution should correspond to a Ct shift of ~ 10 cycles. The resultingtrace 2304 corresponds well with this expected shift. - With regard to the media, processes, systems, methods, etc. described herein, it should be understood that, although the steps of such processes, etc. have been described as occurring according to a certain ordered sequence, such processes could be practiced with the described steps performed in an order other than the order described herein. It further should be understood that certain steps could be performed simultaneously, that other steps could be added, or that certain steps described herein could be omitted. In other words, the descriptions of systems and/or processes herein are provided for the purpose of illustrating certain embodiments and should in no way be construed so as to limit the disclosed subject matter.
- Accordingly, it is to be understood that the present disclosure, including the above description and the accompanying figures is intended to be illustrative and not restrictive. Many embodiments and applications other than the examples provided would be apparent to those of skill in the art upon reading the above description. The scope of the invention should be determined, not with reference to the above description, but should instead be determined with reference to claims appended hereto.
- The article "a" modifying a noun should be understood as meaning one or more unless stated otherwise, or context requires otherwise. The phrase "based on" encompasses being partly or entirely based on.
Claims (4)
- A cartridge (14) comprising:a substrate (34) including a polymerase chain reaction (PCR) zone (96) including:a first heating region (310);a second heating region (330) spaced away from the first heating region (310);a detection region (320); anda microchannel (300) formed in the substrate (34), the microchannel (300) configured to receive a fluid flowing therethrough, the microchannel (300) passing through the first heating region (310) and second heating region (330) to thermally cycle the fluid, and the microchannel (300) passing through the detection region (320) after the fluid has been thermally cycled, the cartridge further comprising: a cover (44) having a first side (45) and second side (46), the second side (46) of the cover (44) attached to a first side (41) of the substrate (34) and enclosing the microchannel (300), the cartridge characterized by,a first heating element (340) arranged on the first side (45) of the cover (44) in the first heating region (310); anda second heating element (350) arranged on the first side (45) of the cover (44) in the second heating region (330).
- The cartridge (14) of claim 1, wherein the detection region (320) is arranged between the first heating region (310) and the second heating region (330).
- The cartridge (14) of claims 1 or 2, wherein the microchannel (300) extends into a pre-PCR zone (252) that preheats the fluid prior to the fluid entering the polymerase chain reaction (PCR) zone (96), wherein the first heating region (310) of the PCR zone (96) extends to include an area of the substrate (34) occupied by the pre-PCR zone (252).
- The cartridge (14) of claim 3, further comprising:
a blister (86) formed on the first side (45) of the cover (44), the blister (86) containing a fluid and being fluidly coupled to the PCR zone (96), such that, when the blister (86) is compressed, the fluid flows into the PCR zone (96).
Applications Claiming Priority (4)
| Application Number | Priority Date | Filing Date | Title |
|---|---|---|---|
| US201762584204P | 2017-11-10 | 2017-11-10 | |
| US201762584199P | 2017-11-10 | 2017-11-10 | |
| US201762584208P | 2017-11-10 | 2017-11-10 | |
| PCT/US2018/060112 WO2019118109A2 (en) | 2017-11-10 | 2018-11-09 | Rapid assessment device for radiation exposure |
Publications (3)
| Publication Number | Publication Date |
|---|---|
| EP3706906A2 EP3706906A2 (en) | 2020-09-16 |
| EP3706906A4 EP3706906A4 (en) | 2021-11-03 |
| EP3706906B1 true EP3706906B1 (en) | 2025-03-26 |
Family
ID=66820033
Family Applications (1)
| Application Number | Title | Priority Date | Filing Date |
|---|---|---|---|
| EP18887794.8A Active EP3706906B1 (en) | 2017-11-10 | 2018-11-09 | Rapid assessment device for radiation exposure |
Country Status (3)
| Country | Link |
|---|---|
| US (1) | US11192104B2 (en) |
| EP (1) | EP3706906B1 (en) |
| WO (1) | WO2019118109A2 (en) |
Families Citing this family (5)
| Publication number | Priority date | Publication date | Assignee | Title |
|---|---|---|---|---|
| US11499865B2 (en) * | 2019-06-01 | 2022-11-15 | Apple Inc. | Environmental acoustic dosimetry with water event detection |
| EP4133102A1 (en) * | 2020-04-07 | 2023-02-15 | Vaccim | Device and method for determining, from a sample previously collected from an individual, that at least one target antibody has been or is present in said individual |
| EP4204807A4 (en) * | 2020-08-31 | 2024-08-07 | Indian Institute of Technology, Delhi | SYSTEM FOR CARRYING OUT RAPID DETECTION OF PATHOGENS |
| CN114100707B (en) * | 2021-10-21 | 2023-04-14 | 天津大学 | A device for trapping micro-nano particles |
| CN114989969B (en) * | 2022-05-27 | 2025-02-28 | 天津大学 | A device and method for capturing micro-nano particles in solution |
Family Cites Families (7)
| Publication number | Priority date | Publication date | Assignee | Title |
|---|---|---|---|---|
| ATE388480T1 (en) * | 2002-08-26 | 2008-03-15 | Ibm | MEMBRANE ACTIVATED MICROELECTROMECHANICAL SWITCH |
| US8613889B2 (en) | 2006-04-13 | 2013-12-24 | Advanced Liquid Logic, Inc. | Droplet-based washing |
| US9156010B2 (en) | 2008-09-23 | 2015-10-13 | Bio-Rad Laboratories, Inc. | Droplet-based assay system |
| CA2824404C (en) | 2011-01-06 | 2023-01-03 | Meso Scale Technologies, Llc | Assay cartridges for pcr analysis and methods of use thereof |
| EP2675819B1 (en) * | 2011-02-18 | 2020-04-08 | Bio-Rad Laboratories, Inc. | Compositions and methods for molecular labeling |
| WO2015019520A1 (en) * | 2013-08-08 | 2015-02-12 | パナソニック株式会社 | Microfluidic device |
| EP3248018B1 (en) | 2015-01-22 | 2020-01-08 | Becton, Dickinson and Company | Devices and systems for molecular barcoding of nucleic acid targets in single cells |
-
2018
- 2018-11-09 EP EP18887794.8A patent/EP3706906B1/en active Active
- 2018-11-09 WO PCT/US2018/060112 patent/WO2019118109A2/en not_active Ceased
- 2018-11-09 US US16/761,746 patent/US11192104B2/en active Active
Also Published As
| Publication number | Publication date |
|---|---|
| US20210187502A1 (en) | 2021-06-24 |
| WO2019118109A2 (en) | 2019-06-20 |
| EP3706906A2 (en) | 2020-09-16 |
| US20200261909A1 (en) | 2020-08-20 |
| US11192104B2 (en) | 2021-12-07 |
| WO2019118109A3 (en) | 2019-10-17 |
| EP3706906A4 (en) | 2021-11-03 |
Similar Documents
| Publication | Publication Date | Title |
|---|---|---|
| US11192104B2 (en) | Rapid assessment device for radiation exposure | |
| US9149806B2 (en) | Microfluidic devices and methods for cell sorting, cell culture and cells based diagnostics and therapeutics | |
| DK2440941T3 (en) | Sheath flow devices and methods | |
| US20130244906A1 (en) | Microfluidic devices and methods based on massively parallel picoreactors for cell and molecular diagnostics | |
| CN108449996A (en) | Microfluidic device and its application method | |
| KR20160068804A (en) | Micro-fluidic devices for assaying biological activity | |
| EP3401015A1 (en) | Surface measurement sensing-based real time nucleic acid amplification measuring device | |
| CN107002016A (en) | The device and method thereof of the optical detection for cell including cassette and fluid chip | |
| JP2010515887A (en) | Sample processing equipment | |
| CN108700499A (en) | The unmarked characterization of suspended particles in fluid | |
| CN109142717B (en) | Microfluidic device for determining biological activity | |
| US20210121878A1 (en) | Microfluidic devices and method for sampling and analysis of cells using optical forces and raman spectroscopy | |
| US20230400431A1 (en) | Diagnostics systems and methods | |
| US8687195B2 (en) | Optical measurement apparatus and chip lifetime judgment method | |
| JP2009042103A (en) | Substrate, reaction processing apparatus using the same, and reaction control method | |
| US12629674B2 (en) | Rapid assessment device for radiation exposure | |
| Chen et al. | Advances in single-cell techniques for linking phenotypes to genotypes | |
| CA3109892A1 (en) | Fluid sensor, system for testing a sample and process | |
| NL1043994B1 (en) | A method for identifying the best therapeutics producing candidates using a digital microfuidics based lab-on-a-chip platform | |
| KR101391087B1 (en) | Microwave based Nucleic Acid Amplification disc apparatus and analysis method using the same | |
| Jankelow | Simulation model of a microfluidic point of care biosensor for electrical enumeration of blood cells | |
| HK40002833A (en) | Micro-fluidic devices for assaying biological activity | |
| TW593677B (en) | Bio-chip-type flow cytometer (FCM) bio-detector with fiber optical type barcode carrier chip | |
| WO2021219533A1 (en) | Cartridge, system and method for amplification of at least one analyte | |
| US20200246795A1 (en) | Cartridge, analysis system and method for testing a sample |
Legal Events
| Date | Code | Title | Description |
|---|---|---|---|
| STAA | Information on the status of an ep patent application or granted ep patent |
Free format text: STATUS: THE INTERNATIONAL PUBLICATION HAS BEEN MADE |
|
| PUAI | Public reference made under article 153(3) epc to a published international application that has entered the european phase |
Free format text: ORIGINAL CODE: 0009012 |
|
| STAA | Information on the status of an ep patent application or granted ep patent |
Free format text: STATUS: REQUEST FOR EXAMINATION WAS MADE |
|
| 17P | Request for examination filed |
Effective date: 20200508 |
|
| AK | Designated contracting states |
Kind code of ref document: A2 Designated state(s): AL AT BE BG CH CY CZ DE DK EE ES FI FR GB GR HR HU IE IS IT LI LT LU LV MC MK MT NL NO PL PT RO RS SE SI SK SM TR |
|
| AX | Request for extension of the european patent |
Extension state: BA ME |
|
| DAV | Request for validation of the european patent (deleted) | ||
| DAX | Request for extension of the european patent (deleted) | ||
| RIC1 | Information provided on ipc code assigned before grant |
Ipc: B01L 3/00 20060101AFI20210625BHEP Ipc: C12Q 1/686 20180101ALI20210625BHEP Ipc: B01L 7/00 20060101ALI20210625BHEP |
|
| A4 | Supplementary search report drawn up and despatched |
Effective date: 20211005 |
|
| RIC1 | Information provided on ipc code assigned before grant |
Ipc: B01L 7/00 20060101ALI20210929BHEP Ipc: C12Q 1/686 20180101ALI20210929BHEP Ipc: B01L 3/00 20060101AFI20210929BHEP |
|
| GRAP | Despatch of communication of intention to grant a patent |
Free format text: ORIGINAL CODE: EPIDOSNIGR1 |
|
| STAA | Information on the status of an ep patent application or granted ep patent |
Free format text: STATUS: GRANT OF PATENT IS INTENDED |
|
| INTG | Intention to grant announced |
Effective date: 20231208 |
|
| GRAJ | Information related to disapproval of communication of intention to grant by the applicant or resumption of examination proceedings by the epo deleted |
Free format text: ORIGINAL CODE: EPIDOSDIGR1 |
|
| STAA | Information on the status of an ep patent application or granted ep patent |
Free format text: STATUS: REQUEST FOR EXAMINATION WAS MADE |
|
| GRAP | Despatch of communication of intention to grant a patent |
Free format text: ORIGINAL CODE: EPIDOSNIGR1 |
|
| STAA | Information on the status of an ep patent application or granted ep patent |
Free format text: STATUS: GRANT OF PATENT IS INTENDED |
|
| INTC | Intention to grant announced (deleted) | ||
| INTG | Intention to grant announced |
Effective date: 20240515 |
|
| GRAJ | Information related to disapproval of communication of intention to grant by the applicant or resumption of examination proceedings by the epo deleted |
Free format text: ORIGINAL CODE: EPIDOSDIGR1 |
|
| STAA | Information on the status of an ep patent application or granted ep patent |
Free format text: STATUS: REQUEST FOR EXAMINATION WAS MADE |
|
| GRAP | Despatch of communication of intention to grant a patent |
Free format text: ORIGINAL CODE: EPIDOSNIGR1 |
|
| STAA | Information on the status of an ep patent application or granted ep patent |
Free format text: STATUS: GRANT OF PATENT IS INTENDED |
|
| INTC | Intention to grant announced (deleted) | ||
| INTG | Intention to grant announced |
Effective date: 20241016 |
|
| GRAS | Grant fee paid |
Free format text: ORIGINAL CODE: EPIDOSNIGR3 |
|
| GRAA | (expected) grant |
Free format text: ORIGINAL CODE: 0009210 |
|
| STAA | Information on the status of an ep patent application or granted ep patent |
Free format text: STATUS: THE PATENT HAS BEEN GRANTED |
|
| AK | Designated contracting states |
Kind code of ref document: B1 Designated state(s): AL AT BE BG CH CY CZ DE DK EE ES FI FR GB GR HR HU IE IS IT LI LT LU LV MC MK MT NL NO PL PT RO RS SE SI SK SM TR |
|
| REG | Reference to a national code |
Ref country code: GB Ref legal event code: FG4D |
|
| REG | Reference to a national code |
Ref country code: CH Ref legal event code: EP |
|
| REG | Reference to a national code |
Ref country code: DE Ref legal event code: R096 Ref document number: 602018080581 Country of ref document: DE |
|
| REG | Reference to a national code |
Ref country code: IE Ref legal event code: FG4D |
|
| PG25 | Lapsed in a contracting state [announced via postgrant information from national office to epo] |
Ref country code: RS Free format text: LAPSE BECAUSE OF FAILURE TO SUBMIT A TRANSLATION OF THE DESCRIPTION OR TO PAY THE FEE WITHIN THE PRESCRIBED TIME-LIMIT Effective date: 20250626 |
|
| PG25 | Lapsed in a contracting state [announced via postgrant information from national office to epo] |
Ref country code: FI Free format text: LAPSE BECAUSE OF FAILURE TO SUBMIT A TRANSLATION OF THE DESCRIPTION OR TO PAY THE FEE WITHIN THE PRESCRIBED TIME-LIMIT Effective date: 20250326 |
|
| REG | Reference to a national code |
Ref country code: LT Ref legal event code: MG9D |
|
| PG25 | Lapsed in a contracting state [announced via postgrant information from national office to epo] |
Ref country code: NO Free format text: LAPSE BECAUSE OF FAILURE TO SUBMIT A TRANSLATION OF THE DESCRIPTION OR TO PAY THE FEE WITHIN THE PRESCRIBED TIME-LIMIT Effective date: 20250626 |
|
| PG25 | Lapsed in a contracting state [announced via postgrant information from national office to epo] |
Ref country code: HR Free format text: LAPSE BECAUSE OF FAILURE TO SUBMIT A TRANSLATION OF THE DESCRIPTION OR TO PAY THE FEE WITHIN THE PRESCRIBED TIME-LIMIT Effective date: 20250326 |
|
| PG25 | Lapsed in a contracting state [announced via postgrant information from national office to epo] |
Ref country code: LV Free format text: LAPSE BECAUSE OF FAILURE TO SUBMIT A TRANSLATION OF THE DESCRIPTION OR TO PAY THE FEE WITHIN THE PRESCRIBED TIME-LIMIT Effective date: 20250326 |
|
| PG25 | Lapsed in a contracting state [announced via postgrant information from national office to epo] |
Ref country code: BG Free format text: LAPSE BECAUSE OF FAILURE TO SUBMIT A TRANSLATION OF THE DESCRIPTION OR TO PAY THE FEE WITHIN THE PRESCRIBED TIME-LIMIT Effective date: 20250326 Ref country code: GR Free format text: LAPSE BECAUSE OF FAILURE TO SUBMIT A TRANSLATION OF THE DESCRIPTION OR TO PAY THE FEE WITHIN THE PRESCRIBED TIME-LIMIT Effective date: 20250627 |
|
| REG | Reference to a national code |
Ref country code: NL Ref legal event code: MP Effective date: 20250326 |
|
| PG25 | Lapsed in a contracting state [announced via postgrant information from national office to epo] |
Ref country code: NL Free format text: LAPSE BECAUSE OF FAILURE TO SUBMIT A TRANSLATION OF THE DESCRIPTION OR TO PAY THE FEE WITHIN THE PRESCRIBED TIME-LIMIT Effective date: 20250326 |
|
| PG25 | Lapsed in a contracting state [announced via postgrant information from national office to epo] |
Ref country code: SE Free format text: LAPSE BECAUSE OF FAILURE TO SUBMIT A TRANSLATION OF THE DESCRIPTION OR TO PAY THE FEE WITHIN THE PRESCRIBED TIME-LIMIT Effective date: 20250326 |
|
| REG | Reference to a national code |
Ref country code: AT Ref legal event code: MK05 Ref document number: 1778534 Country of ref document: AT Kind code of ref document: T Effective date: 20250326 |
|
| PG25 | Lapsed in a contracting state [announced via postgrant information from national office to epo] |
Ref country code: SM Free format text: LAPSE BECAUSE OF FAILURE TO SUBMIT A TRANSLATION OF THE DESCRIPTION OR TO PAY THE FEE WITHIN THE PRESCRIBED TIME-LIMIT Effective date: 20250326 |
|
| PG25 | Lapsed in a contracting state [announced via postgrant information from national office to epo] |
Ref country code: ES Free format text: LAPSE BECAUSE OF FAILURE TO SUBMIT A TRANSLATION OF THE DESCRIPTION OR TO PAY THE FEE WITHIN THE PRESCRIBED TIME-LIMIT Effective date: 20250326 Ref country code: PT Free format text: LAPSE BECAUSE OF FAILURE TO SUBMIT A TRANSLATION OF THE DESCRIPTION OR TO PAY THE FEE WITHIN THE PRESCRIBED TIME-LIMIT Effective date: 20250728 |
|
| PG25 | Lapsed in a contracting state [announced via postgrant information from national office to epo] |
Ref country code: PL Free format text: LAPSE BECAUSE OF FAILURE TO SUBMIT A TRANSLATION OF THE DESCRIPTION OR TO PAY THE FEE WITHIN THE PRESCRIBED TIME-LIMIT Effective date: 20250326 Ref country code: IT Free format text: LAPSE BECAUSE OF FAILURE TO SUBMIT A TRANSLATION OF THE DESCRIPTION OR TO PAY THE FEE WITHIN THE PRESCRIBED TIME-LIMIT Effective date: 20250326 |
|
| PG25 | Lapsed in a contracting state [announced via postgrant information from national office to epo] |
Ref country code: AT Free format text: LAPSE BECAUSE OF FAILURE TO SUBMIT A TRANSLATION OF THE DESCRIPTION OR TO PAY THE FEE WITHIN THE PRESCRIBED TIME-LIMIT Effective date: 20250326 |
|
| PG25 | Lapsed in a contracting state [announced via postgrant information from national office to epo] |
Ref country code: EE Free format text: LAPSE BECAUSE OF FAILURE TO SUBMIT A TRANSLATION OF THE DESCRIPTION OR TO PAY THE FEE WITHIN THE PRESCRIBED TIME-LIMIT Effective date: 20250326 |
|
| PG25 | Lapsed in a contracting state [announced via postgrant information from national office to epo] |
Ref country code: RO Free format text: LAPSE BECAUSE OF FAILURE TO SUBMIT A TRANSLATION OF THE DESCRIPTION OR TO PAY THE FEE WITHIN THE PRESCRIBED TIME-LIMIT Effective date: 20250326 |
|
| PG25 | Lapsed in a contracting state [announced via postgrant information from national office to epo] |
Ref country code: SK Free format text: LAPSE BECAUSE OF FAILURE TO SUBMIT A TRANSLATION OF THE DESCRIPTION OR TO PAY THE FEE WITHIN THE PRESCRIBED TIME-LIMIT Effective date: 20250326 |
|
| PG25 | Lapsed in a contracting state [announced via postgrant information from national office to epo] |
Ref country code: IS Free format text: LAPSE BECAUSE OF FAILURE TO SUBMIT A TRANSLATION OF THE DESCRIPTION OR TO PAY THE FEE WITHIN THE PRESCRIBED TIME-LIMIT Effective date: 20250726 |
|
| REG | Reference to a national code |
Ref country code: DE Ref legal event code: R097 Ref document number: 602018080581 Country of ref document: DE |
|
| PGFP | Annual fee paid to national office [announced via postgrant information from national office to epo] |
Ref country code: DE Payment date: 20251114 Year of fee payment: 8 |
|
| PG25 | Lapsed in a contracting state [announced via postgrant information from national office to epo] |
Ref country code: DK Free format text: LAPSE BECAUSE OF FAILURE TO SUBMIT A TRANSLATION OF THE DESCRIPTION OR TO PAY THE FEE WITHIN THE PRESCRIBED TIME-LIMIT Effective date: 20250326 |
|
| PG25 | Lapsed in a contracting state [announced via postgrant information from national office to epo] |
Ref country code: CZ Free format text: LAPSE BECAUSE OF FAILURE TO SUBMIT A TRANSLATION OF THE DESCRIPTION OR TO PAY THE FEE WITHIN THE PRESCRIBED TIME-LIMIT Effective date: 20250326 |
|
| PLBE | No opposition filed within time limit |
Free format text: ORIGINAL CODE: 0009261 |
|
| STAA | Information on the status of an ep patent application or granted ep patent |
Free format text: STATUS: NO OPPOSITION FILED WITHIN TIME LIMIT |
|
| REG | Reference to a national code |
Ref country code: CH Ref legal event code: L10 Free format text: ST27 STATUS EVENT CODE: U-0-0-L10-L00 (AS PROVIDED BY THE NATIONAL OFFICE) Effective date: 20260211 |
|
| 26N | No opposition filed |
Effective date: 20260105 |