EP3702768A1 - Soil sensor and soil measurement method - Google Patents
Soil sensor and soil measurement method Download PDFInfo
- Publication number
- EP3702768A1 EP3702768A1 EP18871471.1A EP18871471A EP3702768A1 EP 3702768 A1 EP3702768 A1 EP 3702768A1 EP 18871471 A EP18871471 A EP 18871471A EP 3702768 A1 EP3702768 A1 EP 3702768A1
- Authority
- EP
- European Patent Office
- Prior art keywords
- unit
- current
- soil
- voltage
- measured voltage
- Prior art date
- Legal status (The legal status is an assumption and is not a legal conclusion. Google has not performed a legal analysis and makes no representation as to the accuracy of the status listed.)
- Granted
Links
Images





Classifications
-
- G—PHYSICS
- G01—MEASURING; TESTING
- G01N—INVESTIGATING OR ANALYSING MATERIALS BY DETERMINING THEIR CHEMICAL OR PHYSICAL PROPERTIES
- G01N27/00—Investigating or analysing materials by the use of electric, electrochemical, or magnetic means
- G01N27/02—Investigating or analysing materials by the use of electric, electrochemical, or magnetic means by investigating impedance
-
- G—PHYSICS
- G01—MEASURING; TESTING
- G01N—INVESTIGATING OR ANALYSING MATERIALS BY DETERMINING THEIR CHEMICAL OR PHYSICAL PROPERTIES
- G01N27/00—Investigating or analysing materials by the use of electric, electrochemical, or magnetic means
- G01N27/02—Investigating or analysing materials by the use of electric, electrochemical, or magnetic means by investigating impedance
- G01N27/04—Investigating or analysing materials by the use of electric, electrochemical, or magnetic means by investigating impedance by investigating resistance
- G01N27/048—Investigating or analysing materials by the use of electric, electrochemical, or magnetic means by investigating impedance by investigating resistance for determining moisture content of the material
-
- G—PHYSICS
- G01—MEASURING; TESTING
- G01K—MEASURING TEMPERATURE; MEASURING QUANTITY OF HEAT; THERMALLY-SENSITIVE ELEMENTS NOT OTHERWISE PROVIDED FOR
- G01K7/00—Measuring temperature based on the use of electric or magnetic elements directly sensitive to heat ; Power supply therefor, e.g. using thermoelectric elements
-
- G—PHYSICS
- G01—MEASURING; TESTING
- G01N—INVESTIGATING OR ANALYSING MATERIALS BY DETERMINING THEIR CHEMICAL OR PHYSICAL PROPERTIES
- G01N33/00—Investigating or analysing materials by specific methods not covered by groups G01N1/00 - G01N31/00
- G01N33/24—Earth materials
- G01N33/246—Earth materials for water content
-
- G—PHYSICS
- G01—MEASURING; TESTING
- G01N—INVESTIGATING OR ANALYSING MATERIALS BY DETERMINING THEIR CHEMICAL OR PHYSICAL PROPERTIES
- G01N33/00—Investigating or analysing materials by specific methods not covered by groups G01N1/00 - G01N31/00
- G01N33/24—Earth materials
- G01N33/245—Earth materials for agricultural purposes
Definitions
- the present invention relates to a soil sensor and a soil measurement method.
- the soil sensor supplies a DC current to the measurement target when calculating the resistance component and the capacitance component.
- the soil sensor can measure the characteristic values of the soil based on the wide measurable range.
- the soil sensor 1 measures the capacitance component C and the resistance component R in such a wide range.
- the capacitance component C and the resistance component R are relevant to a water content W and a total ion concentration N of the soil 100. Therefore, the soil sensor 1 can acquire the water content W and the total ion concentration N by acquiring the capacitance component C and the resistance component R.
- the water content W refers to the ratio of the volume of water in the soil per unit volume.
- the total ion concentration N refers to the sum of various ions contained in water. For example, the sum of main ions, such as nitrogen ion, phosphate ion, and potassium ion, as the total ion concentration is used in the agricultural field.
- the soil sensor 1 has an electrode that detects a voltage generated as a result of applying a constant current to liquid, for example, water or a substance containing the liquid (for example, soil containing water). Then, the soil sensor 1 detects the temporal change of the voltage.
- the current supply unit 2 supplies a positive DC current (first DC current) or a negative DC current (second DC current) to the electrode 3.
- the current supply unit 2 includes an input 2a, an output 2b, a current setting unit 6, a first constant current source 7, a second constant current source 8, and a switch 9.
- the comparison unit 13 compares the measured voltage VM with a threshold value.
- the comparison unit 13 outputs the result of the comparison as a binary digital value. For example, when the measured voltage VM is smaller than the threshold value, the comparison unit 13 outputs a digital value (0). In addition, when the measured voltage VM is larger than the threshold value, the comparison unit 13 outputs a digital value (1). In addition, when the measured voltage VM is equal to the threshold value, the comparison unit 13 outputs a digital value (1).
- the second comparator 17 is connected to the input 13a, the output 13c, and the threshold voltage supply unit 15.
- the second comparator 17 compares the measured voltage VM with the first threshold voltage VL1.
- the second threshold voltage VL2 is supplied, the second comparator 17 compares the measured voltage VM with the second threshold voltage VL2.
- the second comparator 17 operates as follows. In other words, the second comparator 17 generates a positive maximum voltage (1) when the absolute value of the measured voltage VM is larger than the absolute value of the first threshold voltage VL1 or the second threshold voltage VL2. Then, the second comparator 17 provides a result (0 or 1) of the comparison to the output 13c.
- the magnitude relationship between the measured voltage VM and the first threshold voltage VH1 is reversed (VM > VH1).
- the first comparator 16 outputs a maximum voltage (for example, +1.5 V) (digital value (1)).
- the polarity of the pulse signal generated at the output 14c is reversed (see FIG. 6(b) ).
- the polarity of the pulse signal provided from the output 14d to the switch 9 is also reversed (see FIG. 6(c) ). Therefore, the switch 9 releases the connection between the second constant current source 8 and the electrode 3.
- the switch 9 connects the first constant current source 7 to the electrode 3. By this connection switching, the electrode 3 receives a positive DC current (see a G6d part in FIG. 6 ).
- "when the current supply unit starts supplying the DC current” in the present disclosure includes a case where the direction of the DC current supplied to the electrode 3 is reversed.
- a step of setting a DC current (S1) is performed.
- the step S1 is performed by the current setting unit 6.
- the current setting unit 6 sets a DC current output from the first constant current source 7 to +1 ⁇ A.
- the current setting unit 6 sets a DC current output from the second constant current source 8 to -1 ⁇ A.
- the step of starting to supply the second threshold voltage (S6a) is performed.
- the step S6a is performed by the threshold voltage supply unit 15.
- the threshold voltage supply unit 15 supplies +1 V to the first comparator 16 as the second threshold voltage VH2.
- the threshold voltage supply unit 15 supplies -1 V to the second comparator 17 as the second threshold voltage VL2.
- the step S6f is performed.
- the step S6f is performed by the comparison unit 13 and the logic circuit unit 14.
- the second comparator 17 receives the measured voltage VM.
- the second comparator 17 compares the measured voltage VM with the second threshold voltage VL2 (S6f). Specifically, the second comparator 17 determines whether or not the absolute value of the measured voltage VM is larger than the absolute value of the second threshold voltage VL2.
- the water content and ion concentration (nutrient concentration in the agricultural field) in soil.
- a method for measuring the water content and ion concentration in soil a method using electric impedance, a method using the reflection of emitted electromagnetic waves, a method using the propagation speed of temperature, and the like can be mentioned.
- the method using impedance has higher measurement accuracy than the method using the temperature.
- the method using impedance consumes less power than the method using the reflection of electromagnetic waves.
- the known soil sensor has a limit of a measurement frequency.
- a sine wave of a high frequency of 100 kHz or more may be applied to water.
- the current supply unit 2 of the soil sensor 1 includes the first constant current source 7 that outputs a positive DC current, a second constant current source 8 that outputs a negative DC current, and the switch 9 for selectively connecting one of the first constant current source 7 and the second constant current source 8 to the electrode 3 according to a pulse signal.
- the pulsed current has no limitation in a high frequency range such as a sine wave.
- a current having a high frequency can be supplied to the soil 100. Therefore, it is possible to reduce the influence of an additional capacitance component (so-called electric double layer) that may exist before and after the soil 100. As a result, the soil sensor 1 can obtain a better voltage change.
- the soil sensor 1 may include a monitoring terminal 41 connected to the electrode 3.
- a soil sensor 1A may include a plurality of sensors for obtaining different characteristic values.
- the soil sensor 1A has a sensor 51 (first sensor unit) for obtaining the water content and the total ion concentration, and a sensor 52 (second sensor unit, temperature measurement unit) for obtaining the temperature.
- the sensor 51 is configured by the above-described current supply unit 2, electrode 3, and the like, and outputs a voltage (first measured voltage) according to the water content and the total ion concentration.
- the sensor 52 is embedded in the soil 100, and outputs a voltage (second measured voltage) according to the temperature of the soil 100.
- the sensor 52 may be a temperature sensor using a diode or a temperature sensor using an n-mos.
- FIG. 8(b) shows the characteristics of the circuit.
- a graph G8c shows the measured voltage VM received by the input 11a of the information conversion unit 11.
- a graph G8d shows a pulse signal provided by the output 11c of the information conversion unit 11. Referring to the graph G8c and the graph G8d, it was found that the same tendency as in the simulation result ( FIG. 8(a) ) appeared. As a result, it was found that an actual circuit created based on the circuit illustrated in FIG. 1 can perform a correct operation.
- the frequency of the pulse signal was 2.95 kHz.
Landscapes
- Life Sciences & Earth Sciences (AREA)
- Chemical & Material Sciences (AREA)
- Health & Medical Sciences (AREA)
- General Physics & Mathematics (AREA)
- Physics & Mathematics (AREA)
- Immunology (AREA)
- Engineering & Computer Science (AREA)
- Pathology (AREA)
- General Health & Medical Sciences (AREA)
- Biochemistry (AREA)
- Analytical Chemistry (AREA)
- General Life Sciences & Earth Sciences (AREA)
- Medicinal Chemistry (AREA)
- Food Science & Technology (AREA)
- Environmental & Geological Engineering (AREA)
- Remote Sensing (AREA)
- Geology (AREA)
- Chemical Kinetics & Catalysis (AREA)
- Electrochemistry (AREA)
- Investigating Or Analyzing Materials By The Use Of Electric Means (AREA)
Abstract
Description
- The present invention relates to a soil sensor and a soil measurement method.
- In recent years, measurement of the water content or ion concentration (nutrient concentration in the agricultural field) in soil has attracted attention in the field of agriculture and disaster prevention. As a method for measuring the water content and ion concentration in soil, a method using electric impedance (for example, see Non Patent Literature 1), a method using the reflection of emitted electromagnetic waves, a method using the propagation speed of temperature, and the like can be mentioned. Among these, a method using electric impedance is mainly used.
- Non Patent Literature 1: Shin Ogasawara, Masato Futagawa et al., "Development of Shield Electrode Type Soil Impedance Sensor that Enables Measurement of Low-water Soil", Proceedings of the 33rd Symposium on "Sensors, Micromachines, and Applied Systems", Japan, The Institute of Electrical Engineers of Japan, October 17, 2016.
- When measuring the water content of soil, the condition of the soil can change from a very dry state to a state in which the soil contains a large amount of water. Therefore, the measurement apparatus requires a wide measurement range. As a result, in the field, a soil sensor and a soil measurement method having a wide measurable range have been desired.
- It is an object of the present invention to obtain a soil sensor and a soil measurement method capable of measuring the characteristic values of soil based on a wide measurable range.
- A soil sensor according to one aspect of the present invention includes: a current supply unit that outputs a DC current; an electrode unit that is connected to the current supply unit and is disposed in soil as a measurement target to supply the DC current to the measurement target; and a processing unit that is connected to the electrode unit and obtains a water content and a total ion concentration in the measurement target using a temporal change of a measured voltage, which is generated in the electrode unit, while the DC current is being supplied to the measurement target, in which the processing unit includes: an information conversion unit that converts time information from when the current supply unit starts supplying the DC current to when an absolute value of the measured voltage reaches an absolute value of a threshold voltage into frequency information by determining whether or not the absolute value of the measured voltage has reached the absolute value of the threshold voltage using the temporal change of the measured voltage; an impedance calculation unit that obtains an impedance of the measurement target using the frequency information, the threshold voltage, and the DC current; a water content calculation unit that obtains the water content using the impedance; and a total ion concentration calculation unit that obtains the total ion concentration using the impedance.
- The soil can be modeled as an electric circuit including a resistance component and a capacitance component. In addition, the water content and the total ion concentration in the soil can be obtained based on the resistance component and the capacitance component. The resistance component and the capacitance component can be obtained based on the temporal change of the measured voltage generated in the electrode unit. That is, by using the time until the measured voltage reaches the threshold voltage in the temporal change of the measured voltage, it is possible to calculate the resistance component and the capacitance component that define the temporal change. Then, in order to cause the temporal change of the measured voltage, the soil sensor supplies a DC current from the current supply unit to the electrode unit. The DC current is supplied to the soil as a measurement target through the electrode unit. In the electrode unit, a temporal change of a voltage corresponding to the magnitude of the resistance component and the capacitance component in the soil occurs. As described above, the soil sensor supplies a DC current to the measurement target when calculating the resistance component and the capacitance component. As a result, even when the range of change of the resistance component and the capacitance component is large, it is possible to obtain a good temporal change of a voltage by adjusting the magnitude of the DC current. Therefore, the soil sensor can measure the characteristic values of the soil based on the wide measurable range.
- In one aspect, the information conversion unit may output a pulse signal indicating that the absolute value of the measured voltage has reached the absolute value of the threshold voltage, and the current supply unit may switch a direction of the DC current according to the pulse signal. According to this configuration, information based on time regarding the temporal change of the voltage is appropriately converted into information based on the frequency. Since the information based on time is converted into the information based on the frequency, it is possible to increase the resistance to noise.
- In one aspect, the DC current may include a first DC current having a positive current value and a second DC current having a negative current value, and the current supply unit may include: a first constant current source that outputs the first DC current; a second constant current source that outputs the second DC current; and a switch that selectively connects one of the first constant current source and the second constant current source to the electrode unit according to the pulse signal. According to this configuration, it is possible to supply a pulsed current that changes periodically to the measurement target. The pulsed current has no limitation in a high frequency range such as a sine wave. As a result, a current having a high frequency can be supplied to the measurement target. Therefore, since it is possible to reduce the influence of an additional capacitance component that may exist before and after the measurement target, it is possible to obtain a better voltage change.
- In one aspect, the information conversion unit may include: a first comparator that is connected to the electrode unit and compares the threshold voltage that is positive with the measured voltage; and a second comparator that is connected to the electrode unit and compares the threshold voltage that is negative with the measured voltage. According to this configuration, the information based on time can be converted into the information based on the frequency with a simple configuration.
- In one aspect, the information conversion unit may include a logic circuit unit connected to the first comparator and the second comparator. According to this configuration, the information based on time can be converted into the information based on the frequency with a simpler configuration.
- In one aspect, the logic circuit unit may include a flip-flop circuit. According to this configuration, the information based on time can be converted into the information based on the frequency with a simpler configuration.
- In one aspect, the information conversion unit may include a buffer provided between an output of the first comparator and the impedance calculation unit. According to this configuration, it is possible to reduce the influence of noise on the information transmitted from the information conversion unit to the impedance calculation unit.
- In one aspect, the processing unit may further include an amplifier that is disposed between the electrode unit and the first comparator to amplify the measured voltage. According to this configuration, it is possible to eliminate a reading error of the threshold voltage of the comparator when the measured voltage is small.
- A soil measurement method according to another aspect of the present invention includes: a step of arranging an electrode unit, which is connected to a current supply unit that outputs a DC current, in soil as a measurement target and then supplying the DC current to the measurement target through the electrode unit; and a step of obtaining a water content and a total ion concentration in the measurement target using a temporal change of a measured voltage, which is generated in the electrode unit, while the DC current is being supplied to the measurement target, in which the step of obtaining the water content and the total ion concentration includes: a step of converting time information from when the current supply unit starts supplying the DC current to when an absolute value of the measured voltage reaches an absolute value of a threshold voltage into frequency information by determining whether or not the absolute value of the measured voltage has reached the absolute value of the threshold voltage using the temporal change of the measured voltage; a step of obtaining an impedance of the measurement target using the frequency information, the threshold voltage, and the DC current; a step of obtaining the water content using the impedance; and a step of obtaining the total ion concentration using the impedance.
- Also in this method, when calculating the resistance component and the capacitance component, a DC current is supplied to the measurement target. As a result, even when the range of change of the resistance component and the capacitance component is large, it is possible to obtain a good temporal change of a voltage by adjusting the magnitude of the DC current. Therefore, the soil measurement method can measure the characteristic values of the soil based on the wide measurable range.
- In one aspect, the soil sensor may further include a temperature measurement unit that is disposed in the measurement target and that outputs a voltage corresponding to a temperature of the measurement target and supplies the voltage to the processing unit. The processing unit may include: a temperature information conversion unit that receives the voltage supplied from the temperature measurement unit and converts the received voltage into temperature frequency information; and a temperature calculation unit that calculates a temperature of the measurement target using the temperature frequency information output from the temperature information conversion unit.
- In one aspect, the temperature measurement unit of the soil sensor may include a diode, and the current supply unit may supply a current to the diode.
- A soil sensor according to still another aspect of the present invention includes: a first sensor unit that is disposed in soil as a measurement target and outputs a first measured voltage corresponding to a water content and a total ion concentration in the soil; a second sensor unit that is disposed in soil as the measurement target and outputs a second measured voltage corresponding to a temperature of the soil; an information conversion unit that is selectively connected to the first sensor unit and the second sensor unit and that converts the first measured voltage into first frequency information and converts the second measured voltage into second frequency information; and a measurement value calculation unit that is connected to the information conversion unit and that obtains the water content and the total ion concentration using the first frequency information and obtains the temperature using the second frequency information.
- According to the present invention, a soil sensor and a soil measurement method capable of measuring the characteristic values of soil based on the wide measurement range are provided.
-
-
FIG. 1 is a diagram illustrating a configuration of a soil sensor. -
FIG. 2(a) is a diagram illustrating an example of a DC current supplied from a current supply unit andFIG. 2(b) is a diagram illustrating an example of a measured voltage generated at an electrode. -
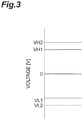
FIG. 3 is a diagram illustrating a relationship between a first threshold voltage and a second threshold voltage. -
FIG. 4 is a diagram illustrating a circuit model of soil for describing the operation principle of an impedance calculation unit. -
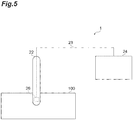
FIG. 5 is a diagram illustrating a specific configuration example of the soil sensor. -
FIG. 6(a) is a graph showing a temporal change of a DC current and a temporal change of a measured voltage,FIG. 6(b) is a graph showing a pulse signal, andFIG. 6(c) is a graph showing a control signal. -
FIG. 7 is a flowchart illustrating main steps of a soil measurement method. -
FIG. 8(a) is a graph showing a result of Experimental Example 1,FIG. 8(b) is a graph showing a result of Experimental Example 2,FIG. 8(c) is a graph showing a result of Experimental Example 3, andFIG. 8(d) is a graph showing a result of Experimental Example 4. -
FIG. 9(a) is a graph showing a result of Experimental Example 5 andFIG. 9(b) is a graph showing a result of Experimental Example 6. -
FIG. 10 is a diagram illustrating a configuration of a soil sensor according to a modification example. - Hereinafter, embodiments for carrying out the present invention will be described in detail with reference to the accompanying diagrams. In the description of the diagrams, the same elements are denoted by the same reference numerals, and the repeated description thereof will be omitted.
- As illustrated in
FIG. 1 , asoil sensor 1 acquires the impedance ofsoil 100 as a measurement target. Thesoil 100 includes an electrostatic capacitance (hereinafter, referred to as a "capacitance component C") and an electric resistance (hereinafter, referred to as a "resistance component R") that form the impedance. Thesoil 100 can be modeled as an electric circuit in which the capacitance component C and the resistance component R are connected in parallel with each other. For example, the size of the capacitance component C of thesoil 100 is 10 pF or more and 500 pF or less. In addition, the magnitude of the resistance component R of thesoil 100 is 100 Ω or more and 1 MΩ or less. Therefore, thesoil sensor 1 measures the capacitance component C and the resistance component R in such a wide range. The capacitance component C and the resistance component R are relevant to a water content W and a total ion concentration N of thesoil 100. Therefore, thesoil sensor 1 can acquire the water content W and the total ion concentration N by acquiring the capacitance component C and the resistance component R. The water content W refers to the ratio of the volume of water in the soil per unit volume. The total ion concentration N refers to the sum of various ions contained in water. For example, the sum of main ions, such as nitrogen ion, phosphate ion, and potassium ion, as the total ion concentration is used in the agricultural field. - The
soil sensor 1 includes acurrent supply unit 2, an electrode 3 (electrode unit), and a processing unit 4. Thecurrent supply unit 2 supplies a DC current to theelectrode 3. Theelectrode 3 is inserted into thesoil 100. Theelectrode 3 supplies a DC current (seeFIG. 2(a) ) to thesoil 100. As a result, charges are supplied to the capacitance component C. Therefore, a measured voltage VM received by theelectrode 3 increases with time. Then, the measured voltage VM converges to a predetermined value (seeFIG. 2(b) ). The temporal change of the measured voltage VM is determined by the capacitance component C and the resistance component R. Therefore, the processing unit 4 acquires the capacitance component C and the resistance component R by using the temporal change of the measured voltage VM. In addition, the processing unit 4 acquires the water content W and the total ion concentration N using the capacitance component C and the resistance component R. - In short, the
soil sensor 1 has an electrode that detects a voltage generated as a result of applying a constant current to liquid, for example, water or a substance containing the liquid (for example, soil containing water). Then, thesoil sensor 1 detects the temporal change of the voltage. - The
current supply unit 2 supplies a positive DC current (first DC current) or a negative DC current (second DC current) to theelectrode 3. Thecurrent supply unit 2 includes aninput 2a, anoutput 2b, acurrent setting unit 6, a first constantcurrent source 7, a second constantcurrent source 8, and aswitch 9. - The
output 2b is connected to theelectrode 3. Theoutput 2b supplies a DC current to theelectrode 3. Theinput 2a is connected to the processing unit 4. Theinput 2a receives a control signal from the processing unit 4. Thecurrent setting unit 6 controls the first constantcurrent source 7 and the second constantcurrent source 8. As a result, the magnitude of the DC current is determined. - The first constant
current source 7 is connected to theswitch 9 and thecurrent setting unit 6. The first constantcurrent source 7 generates a positive DC current having a predetermined current value (for example, +1 µA) based on the control signal of thecurrent setting unit 6. The first constantcurrent source 7 supplies the positive DC current to theswitch 9. - The second constant
current source 8 is connected to theswitch 9 and thecurrent setting unit 6. The second constantcurrent source 8 generates a negative DC current (for example, -1 µA) having a predetermined current value based on the control signal of thecurrent setting unit 6. The absolute value of the negative DC current may be the same as the absolute value of the positive DC current in the first constantcurrent source 7. In addition, the absolute value of the negative DC current may be different from the absolute value of the positive DC current in the first constantcurrent source 7. The second constantcurrent source 8 supplies the negative DC current to theswitch 9. - The
switch 9 is connected to the first constantcurrent source 7, the second constantcurrent source 8, and theoutput 2b. Theswitch 9 selectively connects one of the first constantcurrent source 7 and the second constantcurrent source 8 to theoutput 2b. For example, when theswitch 9 connects the first constantcurrent source 7 to theoutput 2b, theswitch 9 does not connect the second constantcurrent source 8 to theoutput 2b. In this case, theoutput 2b receives a positive DC current. Conversely, when theswitch 9 connects the second constantcurrent source 8 to theoutput 2b, theswitch 9 does not connect the first constantcurrent source 7 to theoutput 2b. In this case, theoutput 2b receives a negative DC current. Theswitch 9 performs switching between a configuration in which the first constantcurrent source 7 is connected to theoutput 2b and a configuration in which the second constantcurrent source 8 is connected to theoutput 2b based on a control signal provided from the processing unit 4. - The
electrode 3 is disposed so as to be inserted into thesoil 100. Theelectrode 3 supplies a DC current to thesoil 100. Theelectrode 3 is connected to theoutput 2b of thecurrent supply unit 2 and the processing unit 4. - The processing unit 4 acquires the capacitance component C and the resistance component R by using a temporal change of the measured voltage VM generated at the
electrode 3. In addition, the processing unit 4 acquires the water content W and the total ion concentration N. The processing unit 4 includes aninput 4a,outputs information conversion unit 11, and acalculation unit 12. - The
input 4a is connected to theelectrode 3. Theinput 4a receives a voltage generated at theelectrode 3 as the measured voltage VM. Theoutput 4b is connected to theinput 2a of thecurrent supply unit 2. Theoutput 4b provides a control signal to thecurrent supply unit 2. Theoutput 4c outputs the capacitance component C, the resistance component R, the water content W, and the total ion concentration N. - The
information conversion unit 11 has aninput 11a, outputs 11b and 11c, acomparison unit 13, and alogic circuit unit 14. Theinput 11a is connected to theinput 4a of the processing unit 4. Theoutput 11b is connected to theoutput 4b of the processing unit 4. Theoutput 11c is connected to thecalculation unit 12. - The
comparison unit 13 compares the measured voltage VM with a threshold value. Thecomparison unit 13 outputs the result of the comparison as a binary digital value. For example, when the measured voltage VM is smaller than the threshold value, thecomparison unit 13 outputs a digital value (0). In addition, when the measured voltage VM is larger than the threshold value, thecomparison unit 13 outputs a digital value (1). In addition, when the measured voltage VM is equal to the threshold value, thecomparison unit 13 outputs a digital value (1). - The
comparison unit 13 includes aninput 13a, outputs 13b and 13c, a thresholdvoltage supply unit 15, afirst comparator 16, and asecond comparator 17. - The
input 13a of thecomparison unit 13 is connected to theinput 11a of theinformation conversion unit 11. Theinput 13a receives the measured voltage VM. Theoutputs logic circuit unit 14. Theoutput 13b provides a signal received from thefirst comparator 16 to thelogic circuit unit 14. Theoutput 13c provides a signal received from thesecond comparator 17 to thelogic circuit unit 14. - The threshold
voltage supply unit 15 is connected to thefirst comparator 16 and thesecond comparator 17. The thresholdvoltage supply unit 15 supplies a threshold voltage, which is a threshold value, to thefirst comparator 16 and thesecond comparator 17. The threshold value includes first threshold voltages VH1 and VL1 and second threshold voltages VH2 and VL2 (seeFIG. 3 ). The first threshold voltage VH1 and the second threshold voltage VH2 are positive voltages. The second threshold voltage VH2 is higher than the first threshold voltage VH1. The first threshold voltage VL1 and the second threshold voltage VL2 are negative voltages. The second threshold voltage VL2 is lower than the first threshold voltage VL1. The absolute value of the first threshold voltage VH1 is equal to the absolute value of the first threshold voltage VL1. The absolute value of the second threshold voltage VH2 is equal to the absolute value of the second threshold voltage VL2. In addition, the absolute values may be different. - The threshold
voltage supply unit 15 supplies one of the first threshold voltage VH1 or the second threshold voltage VH2 to thefirst comparator 16. The thresholdvoltage supply unit 15 supplies one of the first threshold voltage VL1 and the second threshold voltage VL2 to thesecond comparator 17. Specifically, when the thresholdvoltage supply unit 15 supplies the first threshold voltage VH1 to thefirst comparator 16, the thresholdvoltage supply unit 15 supplies the first threshold voltage VL1 to thesecond comparator 17. In addition, when the thresholdvoltage supply unit 15 supplies the second threshold voltage VH2 to thefirst comparator 16, the thresholdvoltage supply unit 15 supplies the second threshold voltage VL2 to thesecond comparator 17. - The
first comparator 16 is connected to theinput 13a, theoutput 13b, and the thresholdvoltage supply unit 15. When the first threshold voltage VH1 is supplied, thefirst comparator 16 compares the measured voltage VM with the first threshold voltage VH1. When the second threshold voltage VH2 is supplied, thefirst comparator 16 compares the measured voltage VM with the second threshold voltage VH2. Thefirst comparator 16 operates as follows. In other words, thefirst comparator 16 generates a positive maximum voltage (1) when the absolute value of the measured voltage VM is larger than the absolute value of the first threshold voltage VH1 or the second threshold voltage VH2. Then, thefirst comparator 16 provides a result (0 or 1) of the comparison to theoutput 13b. - In the case of measured voltage VM < first threshold voltage VH1, negative maximum voltage (0).
- In the case of measured voltage VM < second threshold voltage VH2, negative maximum voltage (0).
- In the case of measured voltage VM > first threshold voltage VH1, positive maximum voltage (1).
- In the case of measured voltage VM > second threshold voltage VH2, positive maximum voltage (1).
- The
second comparator 17 is connected to theinput 13a, theoutput 13c, and the thresholdvoltage supply unit 15. When the first threshold voltage VL1 is supplied, thesecond comparator 17 compares the measured voltage VM with the first threshold voltage VL1. When the second threshold voltage VL2 is supplied, thesecond comparator 17 compares the measured voltage VM with the second threshold voltage VL2. Thesecond comparator 17 operates as follows. In other words, thesecond comparator 17 generates a positive maximum voltage (1) when the absolute value of the measured voltage VM is larger than the absolute value of the first threshold voltage VL1 or the second threshold voltage VL2. Then, thesecond comparator 17 provides a result (0 or 1) of the comparison to theoutput 13c. - In the case of measured voltage VM > first threshold voltage VL1, negative maximum voltage (0).
- In the case of measured voltage VM > second threshold voltage VL2, negative maximum voltage (0).
- In the case of measured voltage VM < first threshold voltage VL1, positive maximum voltage (1).
- In the case of measured voltage VM < second threshold voltage VL2, positive maximum voltage (1).
- The
logic circuit unit 14 receives the result of thecomparison unit 13 and outputs a pulse signal (seeFIG. 6(b) ). Thelogic circuit unit 14 includes a so-called SR flip-flop circuit 14f. That is, the processing unit 4 generates a square wave frequency corresponding to the measured voltage value. Thelogic circuit unit 14 hasinputs outputs input 14a is connected to theoutput 13b of thecomparison unit 13. Theinput 14a is connected to theoutput 13c of thecomparison unit 13. Theoutput 14c is connected to thecalculation unit 12. Theoutput 14c provides a pulse signal to thecalculation unit 12. Abuffer 14e is connected before theoutput 14c. Thebuffer 14e inverts an output value. Theoutput 14d is connected to theoutput 11b. - The
logic circuit unit 14 operates as follows.
In the case ofinput 14a (0) andinput 14b (0),output 14c (hold) andoutput 14d (hold)
In the case ofinput 14a (0) andinput 14b (1),output 14c (1) andoutput 14d (1)
In the case ofinput 14a (1) andinput 14b (0),output 14c (0) andoutput 14d (0). - For example, when the measured voltage VM is higher than the set first threshold voltage VH1, the
logic circuit unit 14 inverts the values of theoutputs output 14c of thelogic circuit unit 14 is (0) and theoutput 14d is (0), theoutput 14c is switched from (0) to (1) if the conditions are satisfied. Theoutput 14d is switched from (0) to (1). - The
output 14d is connected to theswitch 9 of thecurrent supply unit 2 through the output 11d and theoutput 4b. Therefore, when the value of theoutput 14d is inverted, theswitch 9 is switched. That is, the output of thecurrent supply unit 2 is switched from the positive DC current to the negative DC current. Alternatively, the output of thecurrent supply unit 2 is switched from the negative DC current to the positive DC current. - The
calculation unit 12 acquires the capacitance component C, the resistance component R, the water content W, and the total ion concentration N using the pulse signal provided from thelogic circuit unit 14. Thecalculation unit 12 includes aninput 12a, anoutput 12b, animpedance calculation unit 18, a watercontent calculation unit 19, and a total ionconcentration calculation unit 21. - The
input 12a is connected to theoutput 11c of theinformation conversion unit 11. Theinput 12a receives an input signal as a pulse signal from theinformation conversion unit 11. Theoutput 13b is connected to theimpedance calculation unit 18, the watercontent calculation unit 19, and the total ionconcentration calculation unit 21. Theinput 12a outputs various kinds of information. - The
impedance calculation unit 18 calculates an impedance using the pulse signal, the first threshold voltages VH1 and VL1, the second threshold voltages VH2 and VL2, and a DC current I. The pulse signal is obtained from thelogic circuit unit 14. The first threshold voltages VH1 and VL1 and the second threshold voltages VH2 and VL2 are obtained from the thresholdvoltage supply unit 15. The DC current I is obtained from thecurrent setting unit 6. - The operation of the
impedance calculation unit 18 will be described in detail.FIG. 4 illustrates an electric circuit obtained by modeling the second constantcurrent source 8 and thesoil 100. In this electric circuit, the current in each element is expressed by the following equations. Equation (1) is a current (IC) in the capacitance component C. Equation (2) is a current (IR) in the resistance component R.
[Equation 1]

- The relationship between the DC current I in the second constant
current source 8 and the current (IC) and the current (IR) is expressed by the following equation.
[Equation 3]
- Then, by modifying the above equation, the following equation is obtained.
[Equation 4]
- Here, as illustrated in
FIG. 2(b) , it is assumed that the time until reaching the first threshold voltage VH1 is a first time t1. In addition, it is assumed that the time until reaching the second threshold voltage VH2 is t2. Then, the following equation is obtained.
[Equation 5]
- In the above equation, the capacitance component C and the resistance component R are unknown. The first threshold voltage VH1, the second threshold voltage VH2, the first time t1, the second time t2, and the DC current I are known. Therefore, the above equation is treated as simultaneous equations to calculate the capacitance component C and the resistance component R. As a result, the following equations are obtained.
[Equation 6]

- By substituting the first threshold voltage VH1, the second threshold voltage VH2, the first time t1, the second time t2, and the DC current I into the above Equations (6) and (7), the capacitance component C and the resistance component R are obtained. That is, the
impedance calculation unit 18 calculates the capacitance component C and the resistance component R using Equations (6) and (7), the first threshold voltage VH1, the second threshold voltage VH2, the first time t1, the second time t2, and the DC current I. - The water
content calculation unit 19 is connected to theimpedance calculation unit 18. The watercontent calculation unit 19 receives the capacitance component C and the resistance component R from theimpedance calculation unit 18. The watercontent calculation unit 19 calculates the water content W using the capacitance component C. The relative permittivity εs in the capacitance component C is determined by the relative permittivity of water, the relative permittivity of air, and the relative permittivity of soil. That is, the relative permittivity εs is an apparent value obtained by combining the relative permittivity of water, the relative permittivity of air, and the relative permittivity of soil. For example, the relative permittivity of water is about 80. The relative permittivity of air is about 1. The relative permittivity of soil is 3 or more and 7 or less. Theimpedance calculation unit 18 calculates the ratio of each relative permittivity to the relative permittivity εs using this method, and acquires the volume water content of water from the ratio. For example, it can be assumed that the capacitance component C of soil M is almost the capacitance component of water. According to this assumption, the capacitance component C of the soil M can be regarded as a product of the water content W and the relative permittivity εs. Therefore, the water content W can be obtained by dividing the capacitance component C of the soil M by the relative permittivity εs. - The total ion
concentration calculation unit 21 is connected to theimpedance calculation unit 18. The total ionconcentration calculation unit 21 receives the capacitance component C and the resistance component R from theimpedance calculation unit 18. The total ionconcentration calculation unit 21 calculates the total ion concentration using the capacitance component C and the resistance component R. The total ionconcentration calculation unit 21 calculates the total ion concentration N by dividing the resistance component R by the water content W using the water content W calculated based on the capacitance component C. For example, the resistance component R of the soil M is assumed to be the product of the water content W and the total ion concentration N. The water content W is obtained by the watercontent calculation unit 19. The resistance component R is obtained by theimpedance calculation unit 18. As a result, the total ion concentration N is obtained by dividing the resistance component R by the water content W. -
FIG. 5 illustrates a specific configuration of thesoil sensor 1. As illustrated inFIG. 5 , thesoil sensor 1 has aprobe 22, acable 23, and acomputer 24. Theprobe 22 is a rod-shaped component inserted into thesoil 100. At the distal end of theprobe 22, asensor chip 26 is provided. Thesensor chip 26 is embedded in thesoil 100. Thesensor chip 26 includes thecurrent supply unit 2, theelectrode 3, and theinformation conversion unit 11. For example, thesensor chip 26 may be an IC chip. One end of thecable 23 is connected to the rear end of theprobe 22. The other end of thecable 23 is connected to thecomputer 24 provided at a position away from theprobe 22. The signal output from theprobe 22 is provided to thecomputer 24 through thecable 23. Theprobe 22 and thecomputer 24 may be connected to each other by wireless communication. - The
sensor chip 26 includes theinformation conversion unit 11. Therefore, the signal output from thesensor chip 26 is a pulse signal. That is, the signal output from thesensor chip 26 is a binary digital signal. Therefore, even when there is a physical distance between thesensor chip 26 and thecomputer 24, it is possible to improve the resistance to noise regardless of wired or wireless. - The
computer 24 includes theimpedance calculation unit 18, the watercontent calculation unit 19, and the total ionconcentration calculation unit 21 that have been described. Theimpedance calculation unit 18, the watercontent calculation unit 19, and the total ionconcentration calculation unit 21 may be functional components realized by executing a program by thecomputer 24. According to such a configuration, even the complicated and various voltage characteristics can be handled by adjusting the algorithm, so that the resistance component R and the capacitance component C can be easily calculated. Thecomputer 24 is not particularly limited as long as it is possible to execute a program for theimpedance calculation unit 18, the watercontent calculation unit 19, and the total ionconcentration calculation unit 21. For example, thecomputer 24 may be a portable information terminal such as a personal computer, a laptop computer, and a smartphone. - Hereinafter, the operation of the
soil sensor 1 will be described. - The
switch 9 connects one of the first constantcurrent source 7 and the second constantcurrent source 8 to theelectrode 3. As an initial setting, the second constantcurrent source 8 is connected to theelectrode 3. In addition, the first constantcurrent source 7 may be connected to theelectrode 3 as an initial setting. - The
current setting unit 6 sets the magnitude of the current. For example, the first threshold voltage VH1 and the second threshold voltage VH2 are set to easily controllable voltages (for example, 0.5 V). In this state, the frequency signal is observed while gradually increasing the current value. Then, a current value at which a desired frequency signal can be obtained is determined as a set value. In the processing unit 4, the first threshold voltage VH1 is supplied from the thresholdvoltage supply unit 15 in thecomparison unit 13 to thefirst comparator 16. In addition, the processing unit 4 supplies the first threshold voltage VL1 to thesecond comparator 17. For example, an inflection point deviating from a linear change is searched for while gradually increasing the first threshold voltages VH1 and VL1. The first threshold voltages VH1 and VL1 may be determined based on the result of the search for the inflection point. - The operations of the first constant
current source 7 and the second constantcurrent source 8 are started. The first constantcurrent source 7 outputs a positive DC current. The second constantcurrent source 8 outputs a negative DC current. The second constantcurrent source 8 is connected to theelectrode 3. As a result, theelectrode 3 receives a negative DC current. -
FIG. 6(a) is a graph showing a temporal change of the DC current supplied from the measured voltage VM and a temporal change of the DC current supplied from thecurrent supply unit 2. InFIG. 6(a) , a graph G6A shows the measured voltage VM. A graph G6B shows the DC current supplied to theelectrode 3.FIG. 6(b) is an example of a pulse signal output from theoutput 14c of theinformation conversion unit 11.FIG. 6(c) is an example of a control signal G6R output from theoutput 14d of theinformation conversion unit 11. When a negative DC current is supplied to the electrode 3 (see a G6a part inFIG. 6 ), a voltage (measured voltage VM) between theelectrode 3 and areference potential 101 increases with time (see a G6b part inFIG. 6 ). The measured voltage VM is supplied to each of thefirst comparator 16 and thesecond comparator 17. - The
first comparator 16 compares the measured voltage VM with the first threshold voltage VH1. The measured voltage VM is initially smaller than the first threshold voltage VH1 (VM < VH1). Therefore, thefirst comparator 16 outputs a minimum voltage (for example, -1.5 V) (digital value (0)). In the following description, it is assumed that the digital value (0) is a voltage value of -1.5 V, for example. In addition, it is assumed that the digital value (1) is, for example, a voltage value of+1.5 V - The
second comparator 17 compares the measured voltage VM with the first threshold voltage VL1. The measured voltage VM increases with time. The measured voltage VM is higher than the first threshold voltage VL1 (VM > VL1). Therefore, thesecond comparator 17 outputs a minimum voltage (digital value (0)). - The
input 14a of thelogic circuit unit 14 receives a digital value (0). Theinput 14b of thelogic circuit unit 14 receives a digital value (0). Therefore, thelogic circuit unit 14 maintains the state at theoutputs logic circuit unit 14 maintains digital values (output 14c (0),output 14d (0)) as initial values. - The measured voltage VM increases with time. Then, it is assumed that the measured voltage VM exceeds the first threshold voltage VH1 (see a G6c part in
FIG. 6 ). In thesecond comparator 17, the magnitude relationship between the measured voltage VM and the first threshold voltage VL1 does not change (VM > VL1). As a result, thesecond comparator 17 outputs a minimum voltage (digital value (0)). - In the
first comparator 16, the magnitude relationship between the measured voltage VM and the first threshold voltage VH1 is reversed (VM > VH1). Thefirst comparator 16 outputs a maximum voltage (for example, +1.5 V) (digital value (1)). - The
input 14a of thelogic circuit unit 14 receives a digital value (1). Theinput 14b of thelogic circuit unit 14 receives a digital value (0). The digital values generated at theoutputs logic circuit unit 14 generates a digital value (1) at theoutput 14c. Thelogic circuit unit 14 generates a digital value (1) at theoutput 14d. - The polarity of the pulse signal generated at the
output 14c is reversed (seeFIG. 6(b) ). In addition, the polarity of the pulse signal provided from theoutput 14d to theswitch 9 is also reversed (seeFIG. 6(c) ). Therefore, theswitch 9 releases the connection between the second constantcurrent source 8 and theelectrode 3. Theswitch 9 connects the first constantcurrent source 7 to theelectrode 3. By this connection switching, theelectrode 3 receives a positive DC current (see a G6d part inFIG. 6 ). In addition, it is assumed that "when the current supply unit starts supplying the DC current" in the present disclosure includes a case where the direction of the DC current supplied to theelectrode 3 is reversed. - When a positive DC current is supplied to the
electrode 3, the voltage between theelectrode 3 and thereference potential 101 decreases with time (see a G6e part inFIG. 6 ). - The
first comparator 16 compares the measured voltage VM with the first threshold voltage VH1. The measured voltage VM is initially smaller than the first threshold voltage VH1 (VM < VH1). Therefore, thefirst comparator 16 outputs a minimum voltage (digital value (0)). - The
second comparator 17 compares the measured voltage VM with the first threshold voltage VL1. The measured voltage VM decreases with time. The measured voltage VM is initially higher than the first threshold voltage VL1 (VM > VL1). Thesecond comparator 17 outputs a minimum voltage (digital value (0)). - The
input 14a of thelogic circuit unit 14 receives a digital value (0). Theinput 14b of thelogic circuit unit 14 receives a digital value (0). Therefore, thelogic circuit unit 14 maintains the states of theoutputs - The measured voltage VM decreases with time. Then, it is assumed that the measured voltage VM falls below the first threshold voltage VL1 (see a G6f part in
FIG. 6 ). In thefirst comparator 16, the magnitude relationship between the measured voltage VM and the first threshold voltage VH1 does not change (VM < VH1). As a result, thefirst comparator 16 outputs a minimum voltage (digital value (0)). - In the
second comparator 17, the magnitude relationship between the measured voltage VM and the first threshold voltage VL1 is reversed (VM < VL1). As a result, thesecond comparator 17 outputs a maximum voltage (digital value (1)). - The
input 14a of thelogic circuit unit 14 receives a digital value (0). Theinput 14b of thelogic circuit unit 14 receives a digital value (1). The digital values generated at theoutputs logic circuit unit 14 generates a digital value (0) at theoutput 14c. Thelogic circuit unit 14 generates a digital value (0) at theoutput 14d. - Therefore, the polarity of the pulse signal generated at the
output 14c is reversed. The polarity of the pulse signal provided from theoutput 14d to theswitch 9 is also reversed. Theswitch 9 releases the connection between the first constantcurrent source 7 and theelectrode 3. Theswitch 9 connects the second constantcurrent source 8 to theelectrode 3. By this connection switching, theelectrode 3 receives a positive DC current (see a G6g part inFIG. 6 ). - The
soil sensor 1 repeats the above operation for a predetermined time. - As a result of the repetition, a pulse signal G6P shown in
FIG. 6(b) is obtained. According to the pulse signal G6P, the time during which the polarity is maintained (the time until the polarity is inverted) corresponds to the time (first time t1H) required for the measured voltage VM to reach the first threshold voltage VL1. Similarly, the time during which the polarity is maintained (the time until the polarity is inverted) corresponds to the time (first time t1L) required for the measured voltage VM to reach the first threshold voltage VL1. The period of the pulse signal G6P corresponds to the first time t1. - The processing unit 4 controls the threshold
voltage supply unit 15 to change the first threshold voltages VH1 and VL1 to the second threshold voltages VH2 and VL2. For example, the second threshold voltages VH2 and VL2 may be points where both the resistance component R and the capacitance component C appear. In the case of only the capacitance component C, (second threshold voltage ÷ first threshold voltage) = (first frequency ÷ second frequency). On the other hand, for a voltage including the resistance component R, (second threshold voltage ÷ first threshold voltage) < (first frequency ÷ second frequency). As a result, the second threshold voltages VH2 and VL2 may be set such that first frequency ÷ second frequency becomes a sufficiently large value. Thecurrent setting unit 6 maintains the initial setting. Thecomparison unit 13 and thelogic circuit unit 14 perform the same operation as when the first threshold voltages VH1 and VL1 are used. As a result, a pulse signal G6Q as shown inFIG. 6 is obtained. - The second threshold voltage VH2 is higher than the first threshold voltage VH1. Therefore, the second time t2H required for the measured voltage VM to reach the second threshold voltage VH2 is longer than the first time t1H required for the measured voltage VM to reach the first threshold voltage VH1. Similarly, the second time t2L required for the measured voltage VM to reach the second threshold voltage VL2 is longer than the first time t1L required for the measured voltage VM to reach the first threshold voltage VL1.
- As described above, the
impedance calculation unit 18 obtains the capacitance component C and the resistance component R by the following equations.
[Equation 8]

- The water
content calculation unit 19 obtains the water content W by dividing the capacitance component C of the soil M by the relative permittivity εs as described above. - The total ion
concentration calculation unit 21 obtains the total ion concentration N by dividing the resistance component R by the water content W as described above. - Through the above operation, the
soil sensor 1 obtains the water content W and the total ion concentration N. - A soil measurement method will be described with reference to the flowchart illustrated in
FIG. 7 . The soil measurement method is executed by operating thesoil sensor 1 described above. For example, the processing unit 4 in thesoil sensor 1 is realized by executing an algorithm. This algorithm calculates the resistance component R and the capacitance component C from the measured frequency and the set current and voltage. - A step of setting a DC current (S1) is performed. The step S1 is performed by the
current setting unit 6. For example, thecurrent setting unit 6 sets a DC current output from the first constantcurrent source 7 to +1 µA. In addition, thecurrent setting unit 6 sets a DC current output from the second constantcurrent source 8 to -1 µA. - A step of setting a switch (S2) is performed. The step S2 is performed by the
current supply unit 2. For example, thecurrent supply unit 2 controls theswitch 9 so that the second constantcurrent source 8 is connected to theelectrode 3. - A step of starting to supply a first threshold voltage (S3) is performed. The step S3 is performed by the threshold
voltage supply unit 15. For example, the thresholdvoltage supply unit 15 supplies +0.5 V to thefirst comparator 16 as the first threshold voltage VH1. In addition, the thresholdvoltage supply unit 15 supplies -0.5 V to thesecond comparator 17 as the first threshold voltage VL1. - The steps S1, S2, and S3 described above are preparatory steps before starting the measurement.
- A step of starting to supply a DC current (S4) is performed. The step S4 is performed by the
current supply unit 2. By the step S4, the supply of a DC current to theelectrode 3 is started. By the step S4, the measurement is started. - A step of obtaining a first pulse signal (S5) is performed. The step S5 includes a step of receiving the measured voltage VM (S5a), a step of comparing the measured voltage VM with the first threshold voltage VH1 (S5b), a step of receiving the measured voltage VM (S5c), and a step of comparing the measured voltage VM with the first threshold voltage VL1 (S5d).
- The step S5a is performed. When the supply of the negative DC current to the
electrode 3 is started, the processing unit 4 receives the measured voltage VM from theinput 4a (S5a). - The step S5b is performed. The step S5b is performed by the
comparison unit 13 and thelogic circuit unit 14. The measured voltage VM is supplied to thefirst comparator 16. Thefirst comparator 16 compares the measured voltage VM with the first threshold voltage VH1 (S5b). Specifically, it is determined whether or not the absolute value of the measured voltage VM is larger than the absolute value of the first threshold voltage VH1. - As a result of the determination, when the measured voltage VM is not higher than the positive first threshold voltage VH1 (S5b: NO, VM < VH1), the
logic circuit unit 14 maintains the output state. Then, after a predetermined time has passed, the steps S5a and S5b are performed again. - When the measured voltage VM is higher than the positive first threshold voltage VH1 (S5b: YES, VM > VH1), the
logic circuit unit 14 inverts the values of theoutputs switch 9 operates according to the result of the inversion of the value of theoutput 14d. As a result, theelectrode 3 starts receiving a positive DC current. - The step S5c is performed. When the
electrode 3 starts receiving the DC current, the processing unit 4 receives the measured voltage VM from theinput 4a (S5c). - The step S5d is performed. The step S5d is performed by the
comparison unit 13 and thelogic circuit unit 14. The measured voltage VM is supplied to thesecond comparator 17. Thesecond comparator 17 compares the measured voltage VM with the first threshold voltage VL1 (S5d). Specifically, it is determined whether or not the absolute value of the measured voltage VM is greater than the absolute value of the first threshold voltage VL1. - As a result of the determination, when the measured voltage VM is higher than the negative first threshold voltage VH1 (S5d: NO, VM > VL1), the
logic circuit unit 14 maintains the output state. Then, after a predetermined time has passed, the steps S5c and S5d are performed again. - When the measured voltage VM is lower than the negative first threshold voltage VL1 (S5d: YES, VM < VL1), the
logic circuit unit 14 inverts the values of theoutputs switch 9 operates according to the result of the inversion of the value of theoutput 14d. As a result, theelectrode 3 starts receiving a negative DC current. - A step of obtaining a second pulse signal (S6) is performed. The step S6 includes a step of starting to supply the second threshold voltage VH2 (S6a), a step of receiving the measured voltage VM (S6b), a step of comparing the measured voltage VM with the second threshold voltage VH2 (S6c), a step of receiving the measured voltage VM (S6d), and a step of comparing the measured voltage VM with the second threshold voltage VL2 (S6e).
- The step of starting to supply the second threshold voltage (S6a) is performed. The step S6a is performed by the threshold
voltage supply unit 15. For example, the thresholdvoltage supply unit 15 supplies +1 V to thefirst comparator 16 as the second threshold voltage VH2. In addition, the thresholdvoltage supply unit 15 supplies -1 V to thesecond comparator 17 as the second threshold voltage VL2. - The step S6b is performed. When the
electrode 3 starts receiving the DC current, the processing unit 4 receives the measured voltage VM from theinput 4a (S6b). - The step S6c is performed. The step S6c is performed by the
comparison unit 13 and thelogic circuit unit 14. Thefirst comparator 16 receives the measured voltage VM. That is, thefirst comparator 16 compares the measured voltage VM with the second threshold voltage VH2 (S6c). Specifically, thefirst comparator 16 determines whether or not the absolute value of the measured voltage VM is larger than the absolute value of the second threshold voltage VH2. - When the measured voltage VM is not higher than the positive second threshold voltage VH2 (S6c: NO, VM < VH2), the
logic circuit unit 14 maintains the state of theoutputs - When the measured voltage VM is higher than the positive second threshold voltage VH2 (S6c: YES, VM > VH1), the
logic circuit unit 14 inverts the values of theoutputs switch 9 operates according to the result of the inversion of the value of theoutput 14d. As a result, theelectrode 3 starts receiving a reverse DC current. - The step S6d is performed. When the supply of the DC current to the
electrode 3 is started, the processing unit 4 receives the measured voltage VM from theinput 4a (S6d). - The step S6f is performed. The step S6f is performed by the
comparison unit 13 and thelogic circuit unit 14. Thesecond comparator 17 receives the measured voltage VM. Thesecond comparator 17 compares the measured voltage VM with the second threshold voltage VL2 (S6f). Specifically, thesecond comparator 17 determines whether or not the absolute value of the measured voltage VM is larger than the absolute value of the second threshold voltage VL2. - When the measured voltage VM is higher than the second threshold voltage VH2 (S6f: NO, VM > VL1), the
logic circuit unit 14 maintains the state of theoutputs - When the measured voltage VM is lower than the second threshold voltage VL2 (S6f: YES, VM < VL1), the
logic circuit unit 14 inverts the values of theoutputs switch 9 operates according to the result of the inversion of the value of theoutput 14d. As a result, theelectrode 3 starts receiving a reverse DC current. - A step of obtaining impedance (S7) is performed. The step S7 is performed by the
impedance calculation unit 18. The step S7 includes a step of acquiring the first time t1 (S7a), a step of acquiring the second time t2 (S7b), a step of obtaining the capacitance component C (S7c), and a step of obtaining the resistance component R (S7d). - The step S7a is performed. In step S7a, the first time t1 is obtained. The first time t1 is an elapsed time from a timing at which the supply of a negative DC current is started (see a G6h part in
FIG. 6(a) ) to a timing at which switching to a positive DC current occurs (see a G6j part inFIG. 6(a) ). In addition, the first time t1 may be an elapsed time from a timing at which the supply of a positive DC current is started (G6j part) to a timing at which switching to a negative DC current occurs (G6k part). - The step S7b is performed. Similarly to the step S7a, the second time t2 is obtained based on the timing at which the polarity of the current is switched.
- The step S7c is performed. The step S7c is performed by the
impedance calculation unit 18. - The step S7d is performed. The step S7d is also performed by the
impedance calculation unit 18. - A step of obtaining the water content W (S8) is performed. The step S8 is performed by the water
content calculation unit 19. - The step of obtaining the total ion concentration N (S9) is performed. The step S9 is performed by the total ion
concentration calculation unit 21. - Through the above steps S1 to S9, the capacitance component C, the resistance component R, the water content W, and the total ion concentration N that indicate the characteristics of the
soil 100 are obtained. - Hereinafter, the operational effects of the
soil sensor 1 will be described. - In the field of agriculture and disaster prevention, it is very important to measure the water content and ion concentration (nutrient concentration in the agricultural field) in soil. As a method for measuring the water content and ion concentration in soil, a method using electric impedance, a method using the reflection of emitted electromagnetic waves, a method using the propagation speed of temperature, and the like can be mentioned. The method using impedance has higher measurement accuracy than the method using the temperature. In addition, the method using impedance consumes less power than the method using the reflection of electromagnetic waves.
- In general, when measuring impedance, a sine wave (single frequency) of voltage or current is applied to a measurement target. The impedance can be obtained using a current or a voltage obtained as a result of applying a voltage or a current. The impedance (Z) of soil and water is shown as Z = 1/(1/R + jωC). The resistance component R and the capacitance component C can be calculated using the measurement result of the sine wave (absolute value |Z| of the impedance, phase Θ, and frequency f).
- According to this method, the impedance (Z) can be accurately calculated. However, the range in which the water content and the total ion concentration in soil change is large. Therefore, there is a possibility that the resistance component R and the capacitance component C will also change significantly depending on the water content and the total ion concentration. When the resistance component R and the capacitance component C also change significantly, it is difficult to perform measurement in the entire change range by measurement using a single frequency. Soil having a low water content has high impedance. As a result, a signal to be measured becomes weak. Therefore, a true signal component may be hidden by a noise component in the soil having a low water content.
- According to the
soil sensor 1 and the soil measurement method according to the embodiment, the following operational effects can be obtained. - The
soil 100 can be modeled as an electric circuit including the resistance component R and the capacitance component C. The water content W and the total ion concentration N in thesoil 100 can be obtained from the resistance component R and the capacitance component C. The resistance component R and the capacitance component C can be obtained from a voltage change occurring at theelectrode 3. By using the first time t1 until reaching the first threshold voltages VH1 and VL1 and the second time t2 until reaching the second threshold voltages VH2 and VL2, it is possible to calculate the resistance component R and the capacitance component C that define a voltage change. In order to cause a voltage change, thesoil sensor 1 supplies a DC current from thecurrent supply unit 2 to theelectrode 3. The DC current is supplied to thesoil 100 as a measurement target through theelectrode 3. As a result of supplying the DC current, theelectrode 3 receives a change in voltage according to the magnitude of the resistance component R and the capacitance component C in thesoil 100. When calculating the resistance component R and the capacitance component C, a DC current is supplied to the measurement target. As a result, even when changes in the resistance component R and the capacitance component C are large, it is possible to obtain a good voltage change by adjusting the magnitude of the DC current. Therefore, thesoil sensor 1 can measure the characteristic values of thesoil 100 over a wide measurement range. - In the
soil sensor 1 and the soil measurement method, a DC current is applied to thesoil 100, and a voltage change obtained as a result of the application is obtained. In thesoil sensor 1 and the soil measurement method, the resistance component R and the capacitance component C are calculated using the voltage change. Thesoil sensor 1 and the soil measurement method can actively change the conditions of the DC current applied to thesoil 100 to conditions in which the resistance component R and the capacitance component C can be easily detected. Therefore, it is possible to detect a wide range of the resistance component R and the capacitance component C. - The
soil sensor 1 can obtain a wide range of water content change and ion concentration change. In the application of a sine wave of a single frequency, it may not be possible to measure soil or water in which the capacitance component C and the resistance component R change greatly. Therefore, thesoil sensor 1 and the soil measurement method can extend the range in which measurement can be performed by actively switching to the conditions in which the capacitance component C and the resistance component R can be detected. - The
information conversion unit 11 outputs a pulse signal (frequency information) indicating that the absolute value of the measured voltage VM has reached the absolute value of the first threshold voltage or the second threshold voltage. Thecurrent supply unit 2 switches the direction of the DC current according to the pulse signal. According to this configuration, time information regarding the temporal change of the voltage is converted into frequency information. By converting the time information regarding the temporal change of the voltage into the frequency information, it is possible to improve the noise resistance. - In other words, the
soil sensor 1 and the soil measurement method convert a voltage change into the number of square wave pulses (frequency) of a digital signal. As a result, in the field measurement of a noisy soil environment, stable signal transmission is performed. As a result, a wide range of water content and ion concentration can be detected by thesoil sensor 1 and the soil measurement method. In addition, thesoil sensor 1 and the soil measurement method can perform stable signal transmission by digital signal conversion. - In short, the digit of the resistance component R may change widely from 100 Ω to 10 MΩ. Here, the
soil sensor 1 and the soil measurement method convert the voltage into the number of square wave pulses. That is, the voltage information is converted into frequency information. As a result, a change in the digit of the resistance component R can be handled as a change in the digit of the frequency. Therefore, conversion into a wide range of digital signals can be performed by one detector. In other words, in thesoil sensor 1 and the soil measurement method, it is not necessary to prepare a plurality of measurement ranges when obtaining a voltage. - Incidentally, the known soil sensor has a limit of a measurement frequency. In the measurement of the soil water content and the ion concentration, when measuring the impedance of water, a sine wave of a high frequency of 100 kHz or more may be applied to water. However, it is difficult for the known soil sensor to generate a high frequency sine wave of 100 kHz or more. Therefore, the measurement itself is difficult.
- On the other hand, the
current supply unit 2 of thesoil sensor 1 includes the first constantcurrent source 7 that outputs a positive DC current, a second constantcurrent source 8 that outputs a negative DC current, and theswitch 9 for selectively connecting one of the first constantcurrent source 7 and the second constantcurrent source 8 to theelectrode 3 according to a pulse signal. According to this configuration, it is possible to supply a pulsed current that changes periodically to thesoil 100. The pulsed current has no limitation in a high frequency range such as a sine wave. As a result, a current having a high frequency can be supplied to thesoil 100. Therefore, it is possible to reduce the influence of an additional capacitance component (so-called electric double layer) that may exist before and after thesoil 100. As a result, thesoil sensor 1 can obtain a better voltage change. - The
information conversion unit 11 includes thefirst comparator 16, which is connected to theelectrode 3 to compare the positive first threshold voltage with the measured voltage VM, and the second comparator, which is connected to theelectrode 3 to compare the negative first threshold voltage with the measured voltage VM. According to this configuration, the first time t1 and the second time t2 can be converted into frequencies with a simple configuration. - The
information conversion unit 11 has thelogic circuit unit 14 connected to thefirst comparator 16 and thesecond comparator 17. According to this configuration, time information can be converted into frequency information with a simpler configuration. - The
logic circuit unit 14 is a flip-flop circuit. According to this configuration, time information can be converted into frequency information with a simpler configuration. - The
information conversion unit 11 has the buffer 12e provided between the output of thefirst comparator 16 and theimpedance calculation unit 18. According to this configuration, it is possible to reduce the influence of noise on the information transmitted from theinformation conversion unit 11 to theimpedance calculation unit 18. - Although the embodiment of the present invention has been described, the present invention is not limited to the above embodiment.
- For example, as illustrated in
FIG. 1 , thesoil sensor 1 may include amonitoring terminal 41 connected to theelectrode 3. - As illustrated in
FIG. 1 , thesoil sensor 1 may include acapacitance component 42 connected to thereference potential 101 between theelectrode 3 and the processing unit 4. - The processing unit 4 may include an amplifier. The amplifier amplifies the measured voltage VM supplied to the
first comparator 16 and/or thesecond comparator 17. The position where the amplifier is provided is not limited as long as the position is between theelectrode 3 and thefirst comparator 16 and/or between theelectrode 3 and thesecond comparator 17. For example, the amplifier may be provided between theinput 4a of the processing unit 4 and theinput 11a of theinformation conversion unit 11. According to the amplifier, it is possible to eliminate a reading error from the threshold voltage of the comparator when the measured voltage VM is small. - For example, the
soil sensor 1 and the soil measurement method may be used for agriculture. In agriculture, the soil water content and the ion concentration are important information. The soil water content has a large effect on crop growth. The ion concentration affects the nutrient concentration in soil. Therefore, precision agriculture requires the collection of information regarding crops and their environment and the use of the collected information for agricultural production management. Therefore, it is necessary to measure soil information. According to thesoil sensor 1 and the soil measurement method, it is possible to provide accurate soil information in a wide measurement range. As a result, the present invention can be appropriately used for precision agriculture. - Since the
soil sensor 1 and the soil measurement method have a wide measurement range, thesoil sensor 1 and the soil measurement method may be used for prediction of a landslide disaster. For example, thesoil sensor 1 and the soil measurement method may be used for evaluating the degree to which a landslide disaster can occur. For example, by obtaining the water content contained in the soil on the slope using thesoil sensor 1 and the soil measurement method, it is possible to evaluate the degree to which a landslide disaster can occur. In order to obtain the water content, thesoil sensor 1 and the soil measurement method can be appropriately used. - For example, as illustrated in
FIG. 10 , asoil sensor 1A may include a plurality of sensors for obtaining different characteristic values. Thesoil sensor 1A has a sensor 51 (first sensor unit) for obtaining the water content and the total ion concentration, and a sensor 52 (second sensor unit, temperature measurement unit) for obtaining the temperature. Thesensor 51 is configured by the above-describedcurrent supply unit 2,electrode 3, and the like, and outputs a voltage (first measured voltage) according to the water content and the total ion concentration. Thesensor 52 is embedded in thesoil 100, and outputs a voltage (second measured voltage) according to the temperature of thesoil 100. For example, thesensor 52 may be a temperature sensor using a diode or a temperature sensor using an n-mos. In addition, thesoil sensor 1A has aswitch circuit 53 connected to thesensors switch circuit 53 selectively connects thesensors processing unit 4A. For example, when obtaining the water content and the total ion concentration by thesoil sensor 1A, thesensor 51 is connected to theprocessing unit 4A. In addition, when obtaining the temperature by thesoil sensor 1A, thesensor 52 is connected to theprocessing unit 4A. Theprocessing unit 4A includes an information conversion unit 54 (temperature information conversion unit) and a calculation unit 56 (temperature calculation unit) that are added in addition to theinformation conversion unit 11 and thecalculation unit 12 for converting the first measured voltage into the first frequency information. Thecalculation units information conversion unit 54 converts the voltage received from theswitch circuit 53 into second frequency information (temperature frequency information). Then, theinformation conversion unit 54 provides the second frequency information to thecalculation unit 56. In addition, theprocessing unit 4A includes oneinformation conversion unit 11, and theinformation conversion unit 11 may be shared. Theinformation conversion unit 54 is a so-called VF conversion circuit, and has approximately the same configuration as theinformation conversion unit 11. Thecalculation unit 56 converts the frequency information provided from theinformation conversion unit 54 into temperature information. Thecalculation unit 56 records conversion information such as a function or a data sheet that defines the correspondence between frequency and temperature. Thecalculation unit 56 converts frequency information into temperature information using these pieces of information. - In Experimental Example 1, a circuit simulation was performed. In this simulation, a model simulating the circuit illustrated in
FIG. 1 was used. The capacitance component C of thesoil 100 was set to 500 pF. The resistance component R was set to 1 MΩ. The magnitude of the DC current was set to 6 µA. The first threshold voltage VH1 was set to +1 V. The first threshold voltage VL1 was set to -1 V.FIG. 8(a) shows the result of the simulation. InFIG. 8(a) , a graph G8a shows the measured voltage VM received by theinput 11a of theinformation conversion unit 11. A graph G8b shows a pulse signal received by theoutput 11c of theinformation conversion unit 11. Referring to the graph G8a, it was found that the measured voltage VM was folded around +1 V and -1 V Referring to the graph G8b, it was found that the signal level of the pulse signal changed in synchronization with the timing at which the measured voltage VM was folded. As a result, it was found that the circuit illustrated inFIG. 1 can perform a correct operation. According to the above conditions, the frequency of the pulse signal was 2.91 kHz. - The circuit illustrated in
FIG. 1 was created using discrete components. Then, the characteristics of the created circuit were checked.FIG. 8(b) shows the characteristics of the circuit. InFIG. 8(b) , a graph G8c shows the measured voltage VM received by theinput 11a of theinformation conversion unit 11. A graph G8d shows a pulse signal provided by theoutput 11c of theinformation conversion unit 11. Referring to the graph G8c and the graph G8d, it was found that the same tendency as in the simulation result (FIG. 8(a) ) appeared. As a result, it was found that an actual circuit created based on the circuit illustrated inFIG. 1 can perform a correct operation. In addition, according to Experimental Example 2, the frequency of the pulse signal was 2.95 kHz. - When the circuit used in Experimental Example 2 was immersed in water, it was confirmed that the circuit operated properly. As a component corresponding to the
electrode 3, a metal plate immersed in water was used instead of a discrete component. The water as a measurement target was ultrapure water (Experimental Example 3) and water of 100 mS/m (Experimental Example 4).FIG. 8(c) shows the result of Experimental Example 3. A graph G8e shows the measured voltage VM received by theinput 11a of theinformation conversion unit 11. A graph G8f shows a pulse signal provided by theoutput 11c of theinformation conversion unit 11.FIG. 8(d) shows the result of Experimental Example 4. A graph G8g shows the measured voltage VM received by theinput 11a of theinformation conversion unit 11. A graph G8h shows a pulse signal provided by theoutput 11c of theinformation conversion unit 11. Referring toFIGS. 8(c) and 8(d) , it was found that the circuit can generate a pulsed waveform even when the measurement target is water. That is, it was found that the created circuit can perform a correct operation even when the measurement target is water. - Using the circuit used in Experimental Example 2, the relationship between the capacitance component C and the resistance component R simulating the
soil 100 and the frequency of the pulse signal was checked. In Experimental Example 5, the resistance component R was set to 1 MΩ. The capacitance component C was set to 100 pF, 200 pF, 300 pF, 400 pF, and 500 pF. In Experimental Example 6, the resistance component R was set to 10 kΩ. The capacitance component C was set to 100 pF200 pF, 300 pF, 400 pF, and 500 pF.FIG. 9(a) shows the result of Experimental Example 5.FIG. 9(b) shows the result of Experimental Example 6. By checkingFIGS. 9(a) and 9(b) , the tendency that the frequency increased as the capacitance component C decreased was confirmed. That is, it was confirmed that the time required to reach the threshold voltage was shortened. By comparingFIGS. 9(a) and 9(b) with each other, it was confirmed that the frequency decreased as the resistance component R decreased. From these results, it was found that the designed circuit illustrated inFIG. 1 can perform a correct operation. - 1: soil sensor, 2: current supply unit, 2a: input, 2b: output, 3: electrode (electrode unit), 4: processing unit, 4a: input, 4b, 4c: output, 6: current setting unit, 7: first constant current source, 8: second constant current source, 9: switch, 11: information conversion unit, 11a: input, 11b, 11c, 11d: output, 12: calculation unit, 12a: input, 12b: output, 13: comparison unit, 13a: input, 13b, 13c: output, 14: logic circuit unit, 14a, 14b: input, 14c, 14d: output, 14e: buffer, 15: threshold voltage supply unit, 16: first comparator, 17: second comparator, 18: impedance calculation unit, 19: water content calculation unit, 21: total ion concentration calculation unit, 22: probe, 23: cable, 24: computer, 26: sensor chip, 41: monitoring terminal, 42: capacitance component, 100: soil, 101: reference potential, C: capacitance component, R: resistance component, W: water content, N: total ion concentration, VM: measured voltage, VH1, VL1: first threshold voltage, VH2, VL2: second threshold voltage, I: DC current, t1, t1H, t1L: first time, t2, t2H, t2L: second time, G6P, G6Q: pulse signal.
Claims (12)
- A soil sensor, comprising:a current supply unit that outputs a DC current;an electrode unit that is connected to the current supply unit and is disposed in soil as a measurement target to supply the DC current to the measurement target; anda processing unit that is connected to the electrode unit and obtains a water content and a total ion concentration in the measurement target using a temporal change of a measured voltage, which is generated in the electrode unit, while the DC current is being supplied to the measurement target,wherein the processing unit includes:an information conversion unit that converts time information from when the current supply unit starts supplying the DC current to when an absolute value of the measured voltage reaches an absolute value of a threshold voltage into frequency information by determining whether or not the absolute value of the measured voltage has reached the absolute value of the threshold voltage using the temporal change of the measured voltage;an impedance calculation unit that obtains an impedance of the measurement target using the frequency information, the threshold voltage, and the DC current;a water content calculation unit that obtains the water content using the impedance; anda total ion concentration calculation unit that obtains the total ion concentration using the impedance.
- The soil sensor according to claim 1,
wherein the information conversion unit outputs a pulse signal indicating that the absolute value of the measured voltage has reached the absolute value of the threshold voltage, and
the current supply unit switches a direction of the DC current according to the pulse signal. - The soil sensor according to claim 2,
wherein the DC current includes a first DC current having a positive current value and a second DC current having a negative current value, and
the current supply unit includes:a first constant current source that outputs the first DC current;a second constant current source that outputs the second DC current; anda switch that selectively connects one of the first constant current source and the second constant current source to the electrode unit according to the pulse signal. - The soil sensor according to any one of claims 1 to 3,
wherein the information conversion unit includes:a first comparator that is connected to the electrode unit and compares the threshold voltage that is positive with the measured voltage; anda second comparator that is connected to the electrode unit and compares the threshold voltage that is negative with the measured voltage. - The soil sensor according to claim 4,
wherein the information conversion unit includes a logic circuit unit connected to the first comparator and the second comparator. - The soil sensor according to claim 5,
wherein the logic circuit unit includes a flip-flop circuit. - The soil sensor according to any one of claims 4 to 6,
wherein the processing unit further includes an amplifier that is disposed between the electrode unit and the first comparator to amplify the measured voltage. - The soil sensor according to any one of claims 4 to 7,
wherein the information conversion unit includes a buffer provided between an output of the first comparator and the impedance calculation unit. - A soil measurement method, comprising:a step of arranging an electrode unit, which is connected to a current supply unit that outputs a DC current, in soil as a measurement target and then supplying the DC current to the measurement target through the electrode unit; anda step of obtaining a water content and a total ion concentration in the measurement target using a temporal change of a measured voltage, which is generated in the electrode unit, while the DC current is being supplied to the measurement target,wherein the step of obtaining the water content and the total ion concentration includes:a step of converting time information from when the current supply unit starts supplying the DC current to when an absolute value of the measured voltage reaches an absolute value of a threshold voltage into frequency information by determining whether or not the absolute value of the measured voltage has reached the absolute value of the threshold voltage using the temporal change of the measured voltage;a step of obtaining an impedance of the measurement target using the frequency information, the threshold voltage, and the DC current;a step of obtaining the water content using the impedance; anda step of obtaining the total ion concentration using the impedance.
- The soil sensor according to any one of claims 1 to 8, further comprising:a temperature measurement unit that is disposed in the measurement target and that outputs a voltage corresponding to a temperature of the measurement target and supplies the voltage to the processing unit,wherein the processing unit includes:a temperature information conversion unit that receives the voltage supplied from the temperature measurement unit and converts the received voltage into temperature frequency information; anda temperature calculation unit that calculates a temperature of the measurement target using the temperature frequency information output from the temperature information conversion unit.
- The soil sensor according to claim 10,
wherein the temperature measurement unit includes a diode, and
the current supply unit supplies a current to the diode. - A soil sensor, comprising:a first sensor unit that is disposed in soil as a measurement target and outputs a first measured voltage corresponding to a water content and a total ion concentration in the soil;a second sensor unit that is disposed in soil as the measurement target and outputs a second measured voltage corresponding to a temperature of the soil;an information conversion unit that is selectively connected to the first sensor unit and the second sensor unit and that converts the first measured voltage into first frequency information and converts the second measured voltage into second frequency information; anda measurement value calculation unit that is connected to the information conversion unit and that obtains the water content and the total ion concentration using the first frequency information and obtains the temperature using the second frequency information.
Applications Claiming Priority (2)
| Application Number | Priority Date | Filing Date | Title |
|---|---|---|---|
| JP2017204337 | 2017-10-23 | ||
| PCT/JP2018/038638 WO2019082763A1 (en) | 2017-10-23 | 2018-10-17 | Soil sensor and soil measurement method |
Publications (3)
| Publication Number | Publication Date |
|---|---|
| EP3702768A1 true EP3702768A1 (en) | 2020-09-02 |
| EP3702768A4 EP3702768A4 (en) | 2021-07-14 |
| EP3702768B1 EP3702768B1 (en) | 2023-09-13 |
Family
ID=66247882
Family Applications (1)
| Application Number | Title | Priority Date | Filing Date |
|---|---|---|---|
| EP18871471.1A Active EP3702768B1 (en) | 2017-10-23 | 2018-10-17 | Soil sensor and soil measurement method |
Country Status (4)
| Country | Link |
|---|---|
| US (1) | US11402344B2 (en) |
| EP (1) | EP3702768B1 (en) |
| JP (1) | JP7133858B2 (en) |
| WO (1) | WO2019082763A1 (en) |
Families Citing this family (6)
| Publication number | Priority date | Publication date | Assignee | Title |
|---|---|---|---|---|
| KR102373104B1 (en) * | 2020-10-23 | 2022-03-14 | 공주대학교 산학협력단 | Lid facilities management system using wastewater |
| JP7716753B2 (en) * | 2021-11-30 | 2025-08-01 | 国立研究開発法人農業・食品産業技術総合研究機構 | Measuring device with temperature control element |
| JP7761263B2 (en) * | 2021-11-30 | 2025-10-28 | 国立研究開発法人農業・食品産業技術総合研究機構 | Measuring device with a sensor for detecting moisture |
| US20230263083A1 (en) * | 2022-02-23 | 2023-08-24 | Deere & Company | Proactive soil density detection system and method |
| JP7693219B2 (en) * | 2022-06-22 | 2025-06-17 | 大起理化工業株式会社 | Soil property measurement method |
| US12498360B1 (en) * | 2025-05-13 | 2025-12-16 | Liping Gao | Soil detector |
Family Cites Families (15)
| Publication number | Priority date | Publication date | Assignee | Title |
|---|---|---|---|---|
| JPS5523484A (en) * | 1977-09-09 | 1980-02-19 | Univ California | Method and apparatus for measuring original ground position |
| CA1121457A (en) | 1977-09-09 | 1982-04-06 | The Regents Of The University Of California | Method and apparatus for measuring in situ density and fabric or soils |
| CA1110698A (en) | 1977-09-09 | 1981-10-13 | Kandiah Arulanandan | Method and apparatus for measuring in situ density and fabric of soils |
| US5376888A (en) * | 1993-06-09 | 1994-12-27 | Hook; William R. | Timing markers in time domain reflectometry systems |
| IL106829A (en) * | 1993-08-29 | 1996-01-19 | Silora Television & Electronic | Soil moisture sensor |
| EP1287477A4 (en) * | 2000-05-06 | 2005-10-05 | Jung-Yeon Park | Apparatus and method for digitally controlling plant pot, and method for ordering plant pot delivering on-line |
| JP3717068B2 (en) * | 2002-08-23 | 2005-11-16 | 松下電器産業株式会社 | Liquid detection sensor and liquid detection device |
| DE10256064B4 (en) * | 2002-11-30 | 2004-10-28 | GSF - Forschungszentrum für Umwelt und Gesundheit GmbH | Method and device for determining the water content and conductivity in soils and bulk materials |
| US7535237B1 (en) * | 2008-01-21 | 2009-05-19 | Advanced Sensor Technology, Inc. | Sensor for measuring moisture and salinity |
| KR101741083B1 (en) * | 2010-06-24 | 2017-05-29 | 삼성전자주식회사 | Apparatus for detecting salinity |
| TWI442050B (en) * | 2010-11-26 | 2014-06-21 | Inst Information Industry | Contact object water content sensing device, sensing method and computer program products |
| EP2668844A1 (en) * | 2012-05-31 | 2013-12-04 | S-Rain Control A/S | A two-wire controlling and monitoring system for in particular irrigation of localized areas of soil |
| EP3781103A1 (en) * | 2018-04-20 | 2021-02-24 | Pampett AB | A method of manufacturing a device for detecting moisture at an absorbent article |
| KR102777740B1 (en) * | 2019-05-08 | 2025-03-06 | 현대자동차주식회사 | System and method for removing water of fuel cell vehicle using impedance |
| CA3147064A1 (en) * | 2019-08-06 | 2021-02-11 | Glxt Holdings, Llc | Systems and methods for electrical earthing systems |
-
2018
- 2018-10-17 JP JP2019551051A patent/JP7133858B2/en active Active
- 2018-10-17 WO PCT/JP2018/038638 patent/WO2019082763A1/en not_active Ceased
- 2018-10-17 US US16/756,885 patent/US11402344B2/en active Active
- 2018-10-17 EP EP18871471.1A patent/EP3702768B1/en active Active
Also Published As
| Publication number | Publication date |
|---|---|
| US11402344B2 (en) | 2022-08-02 |
| JPWO2019082763A1 (en) | 2020-11-12 |
| US20210199609A1 (en) | 2021-07-01 |
| EP3702768A4 (en) | 2021-07-14 |
| EP3702768B1 (en) | 2023-09-13 |
| WO2019082763A1 (en) | 2019-05-02 |
| JP7133858B2 (en) | 2022-09-09 |
Similar Documents
| Publication | Publication Date | Title |
|---|---|---|
| EP3702768B1 (en) | Soil sensor and soil measurement method | |
| Artyushenko et al. | Statistical characteristics of envelope outliers duration of non-Gaussian information processes | |
| CN106556780B (en) | Partial discharge type determination method and system | |
| Geifes et al. | Determination of the entropic heat coefficient in a simple electro-thermal lithium-ion cell model with pulse relaxation measurements and least squares algorithm | |
| KR20190127535A (en) | Battery charge system and battery charge method | |
| Fairweather et al. | Modelling of VRLA batteries over operational temperature range using pseudo random binary sequences | |
| CN104698273A (en) | Harmonic contribution division method and harmonic contribution division system | |
| RU2668336C1 (en) | Method of determining short circuit location on electric transmission lines | |
| dos Santos et al. | Kalman filter for noise reduction of Li-Ion cell discharge current | |
| CN105698915A (en) | Optical fiber vibration source recognition method, device, and system | |
| EP3005249B1 (en) | Improved method of signal processing and system including the same | |
| CN114356281A (en) | Quantum random number generator detection method and system | |
| CN117269686A (en) | A partial discharge positioning method and system based on particle filter algorithm | |
| Lapsa et al. | Measurement of current consumption in a wireless sensor network testbed | |
| RU2537519C1 (en) | Method of determination of current localisation voltage in powerful hf and uhf bipolar transistors | |
| Nugroho et al. | Inexact Newton backtracking method for solving microwave tomography inverse problem | |
| RU2721622C1 (en) | Method for determining intervals of relative stationarity of signals of ionosphere-spatial propagation of radio waves | |
| Choppala et al. | Particle filter parallelisation using random network based resampling | |
| Meng et al. | Performance bounds of extended target tracking in cluttered environments | |
| Espinoza et al. | Wind speed measurement and uncertainty analysis using ultrasonic sensors with Kalman filtering | |
| Kim et al. | Dynamic Voltage-based Battery SOC Estimation for IoT Devices | |
| Teodorescu et al. | Characterizing the attractors of chaotic systems by a direct measurement method | |
| CN118937763B (en) | Method and device for generating electric energy quality waveform and electric energy quality waveform simulation system | |
| US20240402254A1 (en) | Battery state estimation method | |
| Clarkson et al. | The calibration of IEC standard flickermeters using complex modulated signals |
Legal Events
| Date | Code | Title | Description |
|---|---|---|---|
| STAA | Information on the status of an ep patent application or granted ep patent |
Free format text: STATUS: THE INTERNATIONAL PUBLICATION HAS BEEN MADE |
|
| PUAI | Public reference made under article 153(3) epc to a published international application that has entered the european phase |
Free format text: ORIGINAL CODE: 0009012 |
|
| STAA | Information on the status of an ep patent application or granted ep patent |
Free format text: STATUS: REQUEST FOR EXAMINATION WAS MADE |
|
| 17P | Request for examination filed |
Effective date: 20200507 |
|
| AK | Designated contracting states |
Kind code of ref document: A1 Designated state(s): AL AT BE BG CH CY CZ DE DK EE ES FI FR GB GR HR HU IE IS IT LI LT LU LV MC MK MT NL NO PL PT RO RS SE SI SK SM TR |
|
| AX | Request for extension of the european patent |
Extension state: BA ME |
|
| DAV | Request for validation of the european patent (deleted) | ||
| DAX | Request for extension of the european patent (deleted) | ||
| A4 | Supplementary search report drawn up and despatched |
Effective date: 20210616 |
|
| RIC1 | Information provided on ipc code assigned before grant |
Ipc: G01N 27/02 20060101AFI20210610BHEP |
|
| GRAP | Despatch of communication of intention to grant a patent |
Free format text: ORIGINAL CODE: EPIDOSNIGR1 |
|
| STAA | Information on the status of an ep patent application or granted ep patent |
Free format text: STATUS: GRANT OF PATENT IS INTENDED |
|
| INTG | Intention to grant announced |
Effective date: 20230411 |
|
| RIN1 | Information on inventor provided before grant (corrected) |
Inventor name: YASUTOMI, KEITA Inventor name: KAWAHITO, SHOJI Inventor name: FUTAGAWA, MASATO |
|
| GRAS | Grant fee paid |
Free format text: ORIGINAL CODE: EPIDOSNIGR3 |
|
| GRAA | (expected) grant |
Free format text: ORIGINAL CODE: 0009210 |
|
| STAA | Information on the status of an ep patent application or granted ep patent |
Free format text: STATUS: THE PATENT HAS BEEN GRANTED |
|
| AK | Designated contracting states |
Kind code of ref document: B1 Designated state(s): AL AT BE BG CH CY CZ DE DK EE ES FI FR GB GR HR HU IE IS IT LI LT LU LV MC MK MT NL NO PL PT RO RS SE SI SK SM TR |
|
| REG | Reference to a national code |
Ref country code: CH Ref legal event code: EP |
|
| REG | Reference to a national code |
Ref country code: DE Ref legal event code: R096 Ref document number: 602018057689 Country of ref document: DE |
|
| REG | Reference to a national code |
Ref country code: IE Ref legal event code: FG4D |
|
| REG | Reference to a national code |
Ref country code: NL Ref legal event code: FP |
|
| REG | Reference to a national code |
Ref country code: LT Ref legal event code: MG9D |
|
| PG25 | Lapsed in a contracting state [announced via postgrant information from national office to epo] |
Ref country code: GR Free format text: LAPSE BECAUSE OF FAILURE TO SUBMIT A TRANSLATION OF THE DESCRIPTION OR TO PAY THE FEE WITHIN THE PRESCRIBED TIME-LIMIT Effective date: 20231214 |
|
| PG25 | Lapsed in a contracting state [announced via postgrant information from national office to epo] |
Ref country code: SE Free format text: LAPSE BECAUSE OF FAILURE TO SUBMIT A TRANSLATION OF THE DESCRIPTION OR TO PAY THE FEE WITHIN THE PRESCRIBED TIME-LIMIT Effective date: 20230913 Ref country code: RS Free format text: LAPSE BECAUSE OF FAILURE TO SUBMIT A TRANSLATION OF THE DESCRIPTION OR TO PAY THE FEE WITHIN THE PRESCRIBED TIME-LIMIT Effective date: 20230913 Ref country code: NO Free format text: LAPSE BECAUSE OF FAILURE TO SUBMIT A TRANSLATION OF THE DESCRIPTION OR TO PAY THE FEE WITHIN THE PRESCRIBED TIME-LIMIT Effective date: 20231213 Ref country code: LV Free format text: LAPSE BECAUSE OF FAILURE TO SUBMIT A TRANSLATION OF THE DESCRIPTION OR TO PAY THE FEE WITHIN THE PRESCRIBED TIME-LIMIT Effective date: 20230913 Ref country code: LT Free format text: LAPSE BECAUSE OF FAILURE TO SUBMIT A TRANSLATION OF THE DESCRIPTION OR TO PAY THE FEE WITHIN THE PRESCRIBED TIME-LIMIT Effective date: 20230913 Ref country code: HR Free format text: LAPSE BECAUSE OF FAILURE TO SUBMIT A TRANSLATION OF THE DESCRIPTION OR TO PAY THE FEE WITHIN THE PRESCRIBED TIME-LIMIT Effective date: 20230913 Ref country code: GR Free format text: LAPSE BECAUSE OF FAILURE TO SUBMIT A TRANSLATION OF THE DESCRIPTION OR TO PAY THE FEE WITHIN THE PRESCRIBED TIME-LIMIT Effective date: 20231214 Ref country code: FI Free format text: LAPSE BECAUSE OF FAILURE TO SUBMIT A TRANSLATION OF THE DESCRIPTION OR TO PAY THE FEE WITHIN THE PRESCRIBED TIME-LIMIT Effective date: 20230913 |
|
| REG | Reference to a national code |
Ref country code: AT Ref legal event code: MK05 Ref document number: 1611771 Country of ref document: AT Kind code of ref document: T Effective date: 20230913 |
|
| PG25 | Lapsed in a contracting state [announced via postgrant information from national office to epo] |
Ref country code: IS Free format text: LAPSE BECAUSE OF FAILURE TO SUBMIT A TRANSLATION OF THE DESCRIPTION OR TO PAY THE FEE WITHIN THE PRESCRIBED TIME-LIMIT Effective date: 20240113 |
|
| PG25 | Lapsed in a contracting state [announced via postgrant information from national office to epo] |
Ref country code: AT Free format text: LAPSE BECAUSE OF FAILURE TO SUBMIT A TRANSLATION OF THE DESCRIPTION OR TO PAY THE FEE WITHIN THE PRESCRIBED TIME-LIMIT Effective date: 20230913 |
|
| PG25 | Lapsed in a contracting state [announced via postgrant information from national office to epo] |
Ref country code: ES Free format text: LAPSE BECAUSE OF FAILURE TO SUBMIT A TRANSLATION OF THE DESCRIPTION OR TO PAY THE FEE WITHIN THE PRESCRIBED TIME-LIMIT Effective date: 20230913 |
|
| PG25 | Lapsed in a contracting state [announced via postgrant information from national office to epo] |
Ref country code: SM Free format text: LAPSE BECAUSE OF FAILURE TO SUBMIT A TRANSLATION OF THE DESCRIPTION OR TO PAY THE FEE WITHIN THE PRESCRIBED TIME-LIMIT Effective date: 20230913 Ref country code: RO Free format text: LAPSE BECAUSE OF FAILURE TO SUBMIT A TRANSLATION OF THE DESCRIPTION OR TO PAY THE FEE WITHIN THE PRESCRIBED TIME-LIMIT Effective date: 20230913 Ref country code: IS Free format text: LAPSE BECAUSE OF FAILURE TO SUBMIT A TRANSLATION OF THE DESCRIPTION OR TO PAY THE FEE WITHIN THE PRESCRIBED TIME-LIMIT Effective date: 20240113 Ref country code: ES Free format text: LAPSE BECAUSE OF FAILURE TO SUBMIT A TRANSLATION OF THE DESCRIPTION OR TO PAY THE FEE WITHIN THE PRESCRIBED TIME-LIMIT Effective date: 20230913 Ref country code: EE Free format text: LAPSE BECAUSE OF FAILURE TO SUBMIT A TRANSLATION OF THE DESCRIPTION OR TO PAY THE FEE WITHIN THE PRESCRIBED TIME-LIMIT Effective date: 20230913 Ref country code: CZ Free format text: LAPSE BECAUSE OF FAILURE TO SUBMIT A TRANSLATION OF THE DESCRIPTION OR TO PAY THE FEE WITHIN THE PRESCRIBED TIME-LIMIT Effective date: 20230913 Ref country code: AT Free format text: LAPSE BECAUSE OF FAILURE TO SUBMIT A TRANSLATION OF THE DESCRIPTION OR TO PAY THE FEE WITHIN THE PRESCRIBED TIME-LIMIT Effective date: 20230913 Ref country code: PT Free format text: LAPSE BECAUSE OF FAILURE TO SUBMIT A TRANSLATION OF THE DESCRIPTION OR TO PAY THE FEE WITHIN THE PRESCRIBED TIME-LIMIT Effective date: 20240115 Ref country code: SK Free format text: LAPSE BECAUSE OF FAILURE TO SUBMIT A TRANSLATION OF THE DESCRIPTION OR TO PAY THE FEE WITHIN THE PRESCRIBED TIME-LIMIT Effective date: 20230913 |
|
| REG | Reference to a national code |
Ref country code: DE Ref legal event code: R119 Ref document number: 602018057689 Country of ref document: DE |
|
| PG25 | Lapsed in a contracting state [announced via postgrant information from national office to epo] |
Ref country code: PL Free format text: LAPSE BECAUSE OF FAILURE TO SUBMIT A TRANSLATION OF THE DESCRIPTION OR TO PAY THE FEE WITHIN THE PRESCRIBED TIME-LIMIT Effective date: 20230913 Ref country code: IT Free format text: LAPSE BECAUSE OF FAILURE TO SUBMIT A TRANSLATION OF THE DESCRIPTION OR TO PAY THE FEE WITHIN THE PRESCRIBED TIME-LIMIT Effective date: 20230913 |
|
| REG | Reference to a national code |
Ref country code: CH Ref legal event code: PL |
|
| REG | Reference to a national code |
Ref country code: BE Ref legal event code: MM Effective date: 20231031 |
|
| PG25 | Lapsed in a contracting state [announced via postgrant information from national office to epo] |
Ref country code: LU Free format text: LAPSE BECAUSE OF NON-PAYMENT OF DUE FEES Effective date: 20231017 |
|
| PG25 | Lapsed in a contracting state [announced via postgrant information from national office to epo] |
Ref country code: LU Free format text: LAPSE BECAUSE OF NON-PAYMENT OF DUE FEES Effective date: 20231017 |
|
| PG25 | Lapsed in a contracting state [announced via postgrant information from national office to epo] |
Ref country code: MC Free format text: LAPSE BECAUSE OF FAILURE TO SUBMIT A TRANSLATION OF THE DESCRIPTION OR TO PAY THE FEE WITHIN THE PRESCRIBED TIME-LIMIT Effective date: 20230913 |
|
| PG25 | Lapsed in a contracting state [announced via postgrant information from national office to epo] |
Ref country code: DK Free format text: LAPSE BECAUSE OF FAILURE TO SUBMIT A TRANSLATION OF THE DESCRIPTION OR TO PAY THE FEE WITHIN THE PRESCRIBED TIME-LIMIT Effective date: 20230913 |
|
| PG25 | Lapsed in a contracting state [announced via postgrant information from national office to epo] |
Ref country code: CH Free format text: LAPSE BECAUSE OF NON-PAYMENT OF DUE FEES Effective date: 20231031 |
|
| PLBE | No opposition filed within time limit |
Free format text: ORIGINAL CODE: 0009261 |
|
| STAA | Information on the status of an ep patent application or granted ep patent |
Free format text: STATUS: NO OPPOSITION FILED WITHIN TIME LIMIT |
|
| PG25 | Lapsed in a contracting state [announced via postgrant information from national office to epo] |
Ref country code: MC Free format text: LAPSE BECAUSE OF FAILURE TO SUBMIT A TRANSLATION OF THE DESCRIPTION OR TO PAY THE FEE WITHIN THE PRESCRIBED TIME-LIMIT Effective date: 20230913 Ref country code: DK Free format text: LAPSE BECAUSE OF FAILURE TO SUBMIT A TRANSLATION OF THE DESCRIPTION OR TO PAY THE FEE WITHIN THE PRESCRIBED TIME-LIMIT Effective date: 20230913 Ref country code: DE Free format text: LAPSE BECAUSE OF NON-PAYMENT OF DUE FEES Effective date: 20240501 Ref country code: CH Free format text: LAPSE BECAUSE OF NON-PAYMENT OF DUE FEES Effective date: 20231031 |
|
| 26N | No opposition filed |
Effective date: 20240614 |
|
| GBPC | Gb: european patent ceased through non-payment of renewal fee |
Effective date: 20231213 |
|
| PG25 | Lapsed in a contracting state [announced via postgrant information from national office to epo] |
Ref country code: BE Free format text: LAPSE BECAUSE OF NON-PAYMENT OF DUE FEES Effective date: 20231031 |
|
| PG25 | Lapsed in a contracting state [announced via postgrant information from national office to epo] |
Ref country code: IE Free format text: LAPSE BECAUSE OF NON-PAYMENT OF DUE FEES Effective date: 20231017 |
|
| PG25 | Lapsed in a contracting state [announced via postgrant information from national office to epo] |
Ref country code: GB Free format text: LAPSE BECAUSE OF NON-PAYMENT OF DUE FEES Effective date: 20231213 |
|
| PG25 | Lapsed in a contracting state [announced via postgrant information from national office to epo] |
Ref country code: FR Free format text: LAPSE BECAUSE OF NON-PAYMENT OF DUE FEES Effective date: 20231113 |
|
| PG25 | Lapsed in a contracting state [announced via postgrant information from national office to epo] |
Ref country code: SI Free format text: LAPSE BECAUSE OF FAILURE TO SUBMIT A TRANSLATION OF THE DESCRIPTION OR TO PAY THE FEE WITHIN THE PRESCRIBED TIME-LIMIT Effective date: 20230913 |
|
| PG25 | Lapsed in a contracting state [announced via postgrant information from national office to epo] |
Ref country code: SI Free format text: LAPSE BECAUSE OF FAILURE TO SUBMIT A TRANSLATION OF THE DESCRIPTION OR TO PAY THE FEE WITHIN THE PRESCRIBED TIME-LIMIT Effective date: 20230913 Ref country code: IE Free format text: LAPSE BECAUSE OF NON-PAYMENT OF DUE FEES Effective date: 20231017 Ref country code: GB Free format text: LAPSE BECAUSE OF NON-PAYMENT OF DUE FEES Effective date: 20231213 Ref country code: FR Free format text: LAPSE BECAUSE OF NON-PAYMENT OF DUE FEES Effective date: 20231113 |
|
| PG25 | Lapsed in a contracting state [announced via postgrant information from national office to epo] |
Ref country code: BG Free format text: LAPSE BECAUSE OF FAILURE TO SUBMIT A TRANSLATION OF THE DESCRIPTION OR TO PAY THE FEE WITHIN THE PRESCRIBED TIME-LIMIT Effective date: 20230913 |
|
| PG25 | Lapsed in a contracting state [announced via postgrant information from national office to epo] |
Ref country code: BG Free format text: LAPSE BECAUSE OF FAILURE TO SUBMIT A TRANSLATION OF THE DESCRIPTION OR TO PAY THE FEE WITHIN THE PRESCRIBED TIME-LIMIT Effective date: 20230913 |
|
| PG25 | Lapsed in a contracting state [announced via postgrant information from national office to epo] |
Ref country code: CY Free format text: LAPSE BECAUSE OF FAILURE TO SUBMIT A TRANSLATION OF THE DESCRIPTION OR TO PAY THE FEE WITHIN THE PRESCRIBED TIME-LIMIT; INVALID AB INITIO Effective date: 20181017 |
|
| PG25 | Lapsed in a contracting state [announced via postgrant information from national office to epo] |
Ref country code: HU Free format text: LAPSE BECAUSE OF FAILURE TO SUBMIT A TRANSLATION OF THE DESCRIPTION OR TO PAY THE FEE WITHIN THE PRESCRIBED TIME-LIMIT; INVALID AB INITIO Effective date: 20181017 |
|
| PGFP | Annual fee paid to national office [announced via postgrant information from national office to epo] |
Ref country code: NL Payment date: 20251029 Year of fee payment: 8 |
|
| PG25 | Lapsed in a contracting state [announced via postgrant information from national office to epo] |
Ref country code: TR Free format text: LAPSE BECAUSE OF FAILURE TO SUBMIT A TRANSLATION OF THE DESCRIPTION OR TO PAY THE FEE WITHIN THE PRESCRIBED TIME-LIMIT Effective date: 20230913 |