EP3693737B1 - Method and system for determining integrated metabolic baseline and potential of living cells - Google Patents
Method and system for determining integrated metabolic baseline and potential of living cells Download PDFInfo
- Publication number
- EP3693737B1 EP3693737B1 EP20150661.5A EP20150661A EP3693737B1 EP 3693737 B1 EP3693737 B1 EP 3693737B1 EP 20150661 A EP20150661 A EP 20150661A EP 3693737 B1 EP3693737 B1 EP 3693737B1
- Authority
- EP
- European Patent Office
- Prior art keywords
- cells
- cell sample
- well
- media
- treated
- Prior art date
- Legal status (The legal status is an assumption and is not a legal conclusion. Google has not performed a legal analysis and makes no representation as to the accuracy of the status listed.)
- Active
Links
Images





Classifications
-
- G—PHYSICS
- G01—MEASURING; TESTING
- G01N—INVESTIGATING OR ANALYSING MATERIALS BY DETERMINING THEIR CHEMICAL OR PHYSICAL PROPERTIES
- G01N33/00—Investigating or analysing materials by specific methods not covered by groups G01N1/00 - G01N31/00
- G01N33/48—Biological material, e.g. blood, urine; Haemocytometers
- G01N33/50—Chemical analysis of biological material, e.g. blood, urine; Testing involving biospecific ligand binding methods; Immunological testing
- G01N33/5005—Chemical analysis of biological material, e.g. blood, urine; Testing involving biospecific ligand binding methods; Immunological testing involving human or animal cells
- G01N33/5091—Chemical analysis of biological material, e.g. blood, urine; Testing involving biospecific ligand binding methods; Immunological testing involving human or animal cells for testing the pathological state of an organism
-
- G—PHYSICS
- G01—MEASURING; TESTING
- G01N—INVESTIGATING OR ANALYSING MATERIALS BY DETERMINING THEIR CHEMICAL OR PHYSICAL PROPERTIES
- G01N15/00—Investigating characteristics of particles; Investigating permeability, pore-volume or surface-area of porous materials
- G01N15/10—Investigating individual particles
-
- G—PHYSICS
- G01—MEASURING; TESTING
- G01N—INVESTIGATING OR ANALYSING MATERIALS BY DETERMINING THEIR CHEMICAL OR PHYSICAL PROPERTIES
- G01N33/00—Investigating or analysing materials by specific methods not covered by groups G01N1/00 - G01N31/00
- G01N33/48—Biological material, e.g. blood, urine; Haemocytometers
- G01N33/50—Chemical analysis of biological material, e.g. blood, urine; Testing involving biospecific ligand binding methods; Immunological testing
- G01N33/5005—Chemical analysis of biological material, e.g. blood, urine; Testing involving biospecific ligand binding methods; Immunological testing involving human or animal cells
-
- G—PHYSICS
- G01—MEASURING; TESTING
- G01N—INVESTIGATING OR ANALYSING MATERIALS BY DETERMINING THEIR CHEMICAL OR PHYSICAL PROPERTIES
- G01N15/00—Investigating characteristics of particles; Investigating permeability, pore-volume or surface-area of porous materials
- G01N15/10—Investigating individual particles
- G01N2015/1006—Investigating individual particles for cytology
-
- G—PHYSICS
- G01—MEASURING; TESTING
- G01N—INVESTIGATING OR ANALYSING MATERIALS BY DETERMINING THEIR CHEMICAL OR PHYSICAL PROPERTIES
- G01N2800/00—Detection or diagnosis of diseases
- G01N2800/70—Mechanisms involved in disease identification
Definitions
- the methods disclosed herein enable the stimulation of both major metabolic/energetic pathways acutely with a single injection, as well as the determination of the metabolic potential of these major pathways, i.e., mitochondrial respiration and glycolysis, based on that single injection. Mitochondria and glycolysis produce the majority of energy for the cell in terms of ATP and is indispensible for biosynthetic reactions that create biomass and cellular constituents.
- Prior approaches have been limited to stimulating and analyzing the two major energetic pathways individually. Prior approaches are not able to identify and deliver compound(s) capable of stimulating both major energetic pathways simultaneously. Moreover, prior approaches are not able to measure the simultaneous response of the two major energetic pathways to stress.
- uncoupler and ATP synthase inhibitor were developed for studying mitochondria and not glycolysis.
- Seahorse Bioscience is the first company to use the ATP synthase inhibitor to understand glycolytic function, although many researchers demonstrated its use in understanding mitochondrial function.
- Seahorse was the first to employ oligomycin as a stressor for the glycolytic system in its glycolysis stress test.
- OCR oxygen consumption rate
- ECAR extracellular acidification rate
- Methods described herein have a number of significant advantages over prior art methods of determining the metabolic capacity of cells. For example, because dosing of uncoupler and ATP synthase inhibitor is done via a single injection, data may be collected much more rapidly, allowing metabolic capacity to be measured on a high-throughput scale. For example, prior art methods required a 20 minute interval between dosing of the ATP synthase inhibitor and dosing of the uncoupler; which is eliminated in the methods described herein. Instead, methods described herein require less than the 20 minute interval between dosing of the ATP synthase inhibitor and dosing of the uncoupler of the prior art methods.
- certain methods described herein demonstrate that the interval between dosing of the ATP synthase inhibitor and dosing of the uncoupler is less than 20 minutes, less than 15 minutes, less than 10 minutes, less than 5 minutes, less than 2 minutes or less than 1 minute.
- Other methods described herein demonstrate that the ATP synthase inhibitor and the uncoupler can be dosed simultaneously or essentially at the same time (e.g., immediately sequentially).
- the number of cell samples used in a given experiment can be reduced by half as compared to prior art methods which measure OCR and ECAR in parallel in separate samples. This is a key advantage for researchers dealing with rare or difficult to cultivate cell types, particularly primary cell cultures.
- Combining the uncoupler and ATP synthase inhibitor into a single injection frees elements of the dispensing system, allowing for more complicated experiments.
- the ratio of uncoupler and ATP synthase inhibitor is fixed for each replicate, an important source of variation is removed from the data obtained by the methods disclosed herein, as compared with prior art methods.
- here disclosed is a method of determining a metabolic potential of a cell sample.
- An initial oxygen consumption rate and an initial extracellular acidification rate of the cell sample are simultaneously measured.
- a mitochondrial uncoupling agent and an ATP synthase inhibitor are simultaneously administered to the cell sample.
- a subsequent oxygen consumption rate and a subsequent extracellular acidification rate of the cell sample are simultaneously measured.
- a metabolic potential of the cell sample is determined.
- At least one of the mitochondrial uncoupling agent may include carbonyl cyanide p-trifluoromethoxyphenylhydrazone ("FCCP"), carbonyl cyanide-m-chlorophenylhydrazone (“CCCP”) or 2,4-dinitrophenol (DNP) or BAM15, or the ATP synthase inhibitor may include oligomycin or 7-Chloro-5-(4-hydroxyphenyl)-1-methyl-3-(napthalen-2-ylmetyl)-4,5,-dihydro-1H-benzo[b][1,4]diazepin-2(3H)-one (Bz-423).
- FCCP carbonyl cyanide p-trifluoromethoxyphenylhydrazone
- CCCP carbonyl cyanide-m-chlorophenylhydrazone
- DNP 2,4-dinitrophenol
- BAM15 2,4-dinitrophenol
- the ATP synthase inhibitor may include oligomycin or 7
- the mitochondrial uncoupling agent may include carbonyl cyanide p-trifluoromethoxyphenylhydrazone ("FCCP") and the ATP synthase inhibitor may include oligomycin.
- FCCP carbonyl cyanide p-trifluoromethoxyphenylhydrazone
- ATP synthase inhibitor may include oligomycin.
- the cell sample may include a plurality of cells disposed in a media. Measuring the initial oxygen consumption rate and/or measuring the initial extracellular acidification rate of the cell sample include sensing a cell constituent disposed in the media.
- a concentration of the administered mitochondrial uncoupling agent in the media may be in a range of about 0.1 ⁇ M to about 2.0 ⁇ M, e.g., about 0.5 ⁇ M.
- a concentration of the administered ATP synthase inhibitor in the media is about 0.1 ⁇ M to about 2 ⁇ M, e.g., about 1.0 ⁇ M.
- the mitochondrial uncoupling agent and the ATP synthase inhibitor may be mixed prior to administering to the cell sample.
- the cell sample may be disposed in a well of a multi-well plate prior to the simultaneous measurement of the initial oxygen consumption rate and the initial extracellular acidification rate of the cell sample.
- the mitochondrial uncoupling agent and the ATP synthase inhibitor may be administered by simultaneously introducing the agent and the inhibitor simultaneously into the well from at least one port.
- Determining the metabolic potential of the cell sample may include (i) providing the initial oxygen consumption rate, the initial extracellular acidification rate, the subsequent oxygen consumption rate, and the subsequent extracellular acidification rate to a software program, and (ii) using the software program to calculate the metabolic potential.
- embodiments of the invention include an apparatus for determining a metabolic potential of a cell sample in a well of a multiwell plate.
- the apparatus includes (i) a stage adapted to support a multiwell plate; (ii) a sensor adapted to sense a cell constituent associated with the cell sample in a well of the multiwell plate; and (iii) a dispensing system adapted to introduce fluids into the well.
- the stage, sensor, and dispensing system cooperate to simultaneously measure an initial oxygen consumption rate and an initial extracellular acidification rate of the cell sample using the sensor.
- the dispensing system is used to simultaneously administer to the cell sample a mitochondrial uncoupling agent and an ATP synthase inhibitor.
- simultaneously a subsequent oxygen consumption rate and a subsequent extracellular acidification rate of the cell sample are measured using the sensor.
- the metabolic potential of the cell sample is determined.
- the dispensing system may include at least one port disposed above the well.
- the sensor may include an optical sensor.
- the sensor may be adapted to sense a fluorophore.
- the apparatus may include a computer module and software adapted to calculate the metabolic potential based on information communicated to the computer module by the sensor.
- the cell energy phenotype test is a method for rapidly determining the metabolic baseline and potential of living cells. This is accomplished by measuring the activity of each of the two major energy-generating pathways within the cell: mitochondrial respiration and glycolysis, first under baseline conditions, and again after applying a stress to the cells to demand increased energy supply.
- the stress may be applied by exposing the cells to a combination of two chemical compounds: a mitochondrial uncoupler and an ATP synthase inhibitor. These chemical compounds increase the apparent energy demands on the two metabolic pathways, causing the activity within each pathway to increase to as much as a maximum capacity.
- the difference in measured energy generating activity between the stressed and baseline condition defines the metabolic potential.
- the combination of the metabolic baseline and metabolic potential constitutes the energy phenotype of the cell.
- the metabolic energy generating activity of the mitochondrial respiration pathway is determined by measuring the rate of oxygen consumption by the living cells, and the metabolic energy generating activity of the glycolysis pathway is determined from a measurement of extracellular acidification caused by secretion of protons from the cell.
- the prototypic uncoupler carbonyl cyanide p-trifluoromethoxyphenylhydrazone
- FCCP carbonyl cyanide p-trifluoromethoxyphenylhydrazone
- reagents preferably include a combination of a mitochondrial uncoupling agent and an ATP synthase inhibitor.
- Suitable mitochondrial uncoupling agent include, e.g., carbonyl cyanide p-trifluoromethoxyphenylhydrazone (“FCCP”), carbonyl cyanide-m-chlorophenylhydrazone (“CCCP”) or 2,4-dinitrophenol (“DNP”) or BAM15.
- Suitable ATP synthase inhibitors include, e.g., oligomycin or 7-Chloro-5-(4-hydroxyphenyl)-1-methyl-3-(napthalen-2-ylmetyl)-4,5,-dihydro-1H-benzo[b][1,4]diazepin-2(3H)-one (Bz-423).
- a suitable assay kit may include tubes of oligomycin and FCCP.
- the compounds are preferably premeasured, and lyophilized for stability.
- Calculations may be performed on the time-resolved data to determine the baseline and stressed phenotypes, as well as the combined metabolic potential.
- the data may be averaged from multiple technical replicates within a single experimental microplate.
- Example 1 FCCP titration in the presence of oligomycin in RAW 264.7 macrophage cells.
- RAW 264.7 macrophage cells were seeded into XF e 96 microplates (Seahorse Bioscience) at a density of 8.0 x 10 4 cells/well. Because RAW 264.7 cells are semi-adherent, cells were added to each well and the microplate was then centrifuged at 300 x g for two minutes to settle the cells to the bottom of the well. Cells were cultured for 24 hours in DMEM supplemented with 25 mM glucose, 4 mM glutamine, 1 mM pyruvate, and 10% FBS.
- Culture media was replaced with assay media (modified DMEM omitting sodium bicarbonate; available from Seahorse Bioscience as XF Base Medium, supplemented with 10 mM glucose, 2 mM glutamine, and 1 mM pyruvate).
- FCCP titration was performed using an XF e 96 Extracellular Flux Analyzer (Seahorse Bioscience) and XF e 96 assay cartridges (Seahorse Bioscience) according to the manufacturer's instructions. Briefly, cells were first treated with 1.0 ⁇ M oligomycin (final concentration in 200 ⁇ l assay media), OCR was measured, and then one of the following concentrations of FCCP was added: 0.125 ⁇ M, 0.25 ⁇ M, 0.5 ⁇ M, 1.0 ⁇ M, or 2 ⁇ M (final concentration in 222 ⁇ l assay media). The resulting OCR was then plotted as in the example figure to determine the lowest concentration which achieves maximal stimulation of OCR.
- Results of the titration are presented in Figure 1 .
- Data are the oxygen consumption rates of RAW 264.7 macrophage cells in the presence of 1.0 ⁇ M oligomycin plus the indicated concentration of FCCP.
- Data shown are the mean ⁇ standard deviation from three replicates per treatment group. These data indicate that maximal OCR is achieved with 0.5 ⁇ M FCCP in the presence of 1.0 ⁇ M oligomycin.
- RAW 264.7 macrophage cells were seeded into XFp microplates at a density of 8.0 x 10 4 cells/well. Because RAW 264.7 cells are semi-adherent, cells were added to each well and the microplate was then centrifuged at 300 x g for two minutes to settle the cells to the bottom of the well. Cells were cultured for 24 hours in DMEM supplemented with 25 mM glucose, 4 mM glutamine, 1 mM pyruvate, and 10% FBS.
- Culture media was replaced with assay media (modified DMEM omitting sodium bicarbonate; available from Seahorse Bioscience as XF Base Medium, supplemented with 10 mM glucose, 2 mM glutamine, and 1 mM pyruvate).
- Cells treated with LPS received media containing 1 gg/ml LPS, control cells received assay media. Cells were incubated for 1 hour at 37 °C in a non-CO 2 incubator before assay.
- Metabolic potential was measured using an XFp Extracellular Flux Analyzer (Seahorse Bioscience) and XFp assay cartridges (Seahorse Bioscience). Briefly, microplates containing LPS-treated and control cells were placed in the XFp Extracellular Flux Analyzer, and initial OCR and ECAR measurements are taken. Treated and control wells are then treated simultaneously with 0.5 ⁇ M FCCP and 1.0 ⁇ M oligomycin (final concentration in 200 ⁇ l assay media), and OCR and ECAR measurements were subsequently taken.
- Hela cells were seeded into XFp microplates at a density of 1.2 x 10 4 cells/well. Cells were cultured for 24 hours in MEM supplemented with 5.5 mM glucose, 2 mM glutamine, and 10% FBS.
- Culture media was replaced with assay media (modified DMEM omitting sodium bicarbonate; available from Seahorse Bioscience as XF Base Medium, supplemented with 10 mM glucose, 2 mM glutamine, and 1 mM pyruvate).
- Treated cells received media containing 10 mM dichloroacetate (DCA), control cells received assay media. Cells were incubated for 1 hour at 37 °C in a non-CO 2 incubator before assay.
- DCA dichloroacetate
- Metabolic potential was measured using an XFp Extracellular Flux Analyzer (Seahorse Bioscience) and XFp assay cartridges (Seahorse Bioscience). Briefly, microplates containing DCA-treated and control cells were placed in the XFp Extracellular Flux Analyzer, and initial OCR and ECAR measurements are taken. Treated and control wells are then treated simultaneously with 0.75 ⁇ M FCCP and 1.0 ⁇ M oligomycin (final concentration in 200 ⁇ l assay media), and OCR and ECAR measurements were subsequently taken.
- Results of the experiment are presented in Figure 3 .
- Data shown are the mean ⁇ standard deviation from three replicates per treatment group. These data indicate that the aerobic metabolic potential of treated cells is slightly increased relative to control cells, and the glycolytic potential is decreased.
- C2C12 myoblast cells were seeded into XFp microplates at a density of 1.2 ⁇ 10 4 cells/well. Cells were cultured for 24 hours in DMEM supplemented with 25 mM glucose, 4 mM glutamine, 1 mM pyruvate, and 10% FBS.
- Culture media was replaced with assay media (modified DMEM omitting sodium bicarbonate; available from Seahorse Bioscience as XF Base Medium, supplemented with 10 mM glucose, 2 mM glutamine, and 1 mM pyruvate).
- Treated cells received media containing 2 ⁇ M UK5099 (a potent inhibitor of the mitochondrial pyruvate carrier), control cells received assay media. Cells were incubated for 1 hour at 37 °C in a non-CO 2 incubator before assay.
- Metabolic potential was measured using an XFp Extracellular Flux Analyzer (Seahorse Bioscience) and XFp assay cartridges (Seahorse Bioscience). Briefly, microplates containing UK5099 -treated and control cells were placed in the XFp Extracellular Flux Analyzer, and initial OCR and ECAR measurements are taken. Treated and control wells are then treated simultaneously with 0.5 ⁇ M FCCP and 1.0 ⁇ M oligomycin (final concentration in 200 ⁇ l assay media), and OCR and ECAR measurements were subsequently taken.
- Example 5 A. Metabolic potential of A549 cells.
- A549 cells were seeded into XFp microplates at a density of 1.0 ⁇ 10 4 cells/well. Cells were cultured for 24 hours in RPMI 1640 media supplemented with 11 mM glucose, 2 mM glutamine, and 10% FBS.
- Culture media was replaced with assay media (modified DMEM omitting sodium bicarbonate; available from Seahorse Bioscience as XF Base Medium, supplemented with 10 mM glucose, 2 mM glutamine, and 1 mM pyruvate). Cells were incubated for 1 hour at 37 °C in a non-CO 2 incubator before assay.
- assay media modified DMEM omitting sodium bicarbonate; available from Seahorse Bioscience as XF Base Medium, supplemented with 10 mM glucose, 2 mM glutamine, and 1 mM pyruvate.
- Metabolic potential was measured using an XFp Extracellular Flux Analyzer (Seahorse Bioscience) and XFp assay cartridges (Seahorse Bioscience). Briefly, microplates containing cells were placed in the XFp Extracellular Flux Analyzer, and initial OCR and ECAR measurements were taken. Treated and control wells were then treated with 1.0 ⁇ M oligomycin (final concentration in 200 ⁇ l assay media). After oligomycin treatment, intermediate OCR and ECAR measurements were taken. After 20 minutes, treated and control wells were treated with 0.5 ⁇ M FCCP and (final concentration in 200 ⁇ l assay media), and final OCR and ECAR measurements were subsequently taken.
- Example 5 B Metabolic potential rat astrocytes
- 14-day post-isolation rat astrocytes were seeded into XFp microplates at a density of 2.0 x 10 4 cells/well. Cells were cultured for 48 hours in DMEM supplemented with 5.5 mM glucose, 2 mM glutamine, and 10% FBS.
- Culture media was replaced with assay media (modified DMEM omitting sodium bicarbonate; available from Seahorse Bioscience as XF Base Medium, supplemented with 10 mM glucose, 2 mM glutamine, and 1 mM pyruvate). Cells were incubated for 1 hour at 37 °C in a non-CO 2 incubator before assay.
- assay media modified DMEM omitting sodium bicarbonate; available from Seahorse Bioscience as XF Base Medium, supplemented with 10 mM glucose, 2 mM glutamine, and 1 mM pyruvate.
- Metabolic potential was measured using an XFp Extracellular Flux Analyzer (Seahorse Bioscience) and XFp assay cartridges (Seahorse Bioscience). Briefly, microplates containing cells were placed in the XFp Extracellular Flux Analyzer, and initial OCR and ECAR measurements were taken. Treated and control wells were then treated with 1.0 ⁇ M oligomycin (final concentration in 200 ⁇ l assay media). After oligomycin treatment, intermediate OCR and ECAR measurements were taken. After 20 minutes, treated and control wells were treated with 2.0 ⁇ M FCCP and (final concentration in 200 ⁇ l assay media), and final OCR and ECAR measurements were subsequently taken.
- Example 5 C Metabolic potential of primary mouse bone marrow-derived macrophages
- Primary mouse bone marrow-derived macrophages were differentiated using GM-CSF and grown in culture for 7 days. Cells were seeded into XFp microplates at a density of 8.0 x 10 4 cells/well. Cells were cultured for 24 hours in DMEM supplemented with 10 mM glucose, 2 mM glutamine, 1 mM pyruvate, and 10% FBS.
- Culture media was replaced with assay media (modified DMEM omitting sodium bicarbonate; available from Seahorse Bioscience as XF Base Medium, supplemented with 10 mM glucose, 2 mM glutamine, and 1 mM pyruvate). Cells were incubated for 1 hour at 37 °C in a non-CO 2 incubator before assay.
- assay media modified DMEM omitting sodium bicarbonate; available from Seahorse Bioscience as XF Base Medium, supplemented with 10 mM glucose, 2 mM glutamine, and 1 mM pyruvate.
- Metabolic potential was measured using an XFp Extracellular Flux Analyzer (Seahorse Bioscience) and XFp assay cartridges (Seahorse Bioscience). Briefly, microplates containing cells were placed in the XFp Extracellular Flux Analyzer, and initial OCR and ECAR measurements were taken. Treated and control wells were then treated with 1.0 ⁇ M oligomycin (final concentration in 200 ⁇ l assay media). After oligomycin treatment, intermediate OCR and ECAR measurements were taken. After 20 minutes, treated and control wells were treated with 1.0 ⁇ M FCCP and (final concentration in 200 ⁇ l assay media), and final OCR and ECAR measurements were subsequently taken.
- Example 5 D. Metabolic potential of BT474 cells
- BT474 cells were seeded into XFp microplates at a density of 2.0 x 10 4 cells/well. Cells were cultured for 24 hours in ATCC Hybricare media supplemented with 10% FBS.
- Culture media was replaced with assay media (modified DMEM omitting sodium bicarbonate; available from Seahorse Bioscience as XF Base Medium, supplemented with 10 mM glucose, 2 mM glutamine, and 1 mM pyruvate). Cells were incubated for 1 hour at 37 °C in a non-CO 2 incubator before assay.
- assay media modified DMEM omitting sodium bicarbonate; available from Seahorse Bioscience as XF Base Medium, supplemented with 10 mM glucose, 2 mM glutamine, and 1 mM pyruvate.
- Metabolic potential was measured using an XFp Extracellular Flux Analyzer (Seahorse Bioscience) and XFp assay cartridges (Seahorse Bioscience). Briefly, microplates containing cells were placed in the XFp Extracellular Flux Analyzer, and initial OCR and ECAR measurements were taken. Treated and control wells were then treated with 1.0 ⁇ M oligomycin (final concentration in 200 ⁇ l assay media). After oligomycin treatment, intermediate OCR and ECAR measurements were taken. After 20 minutes, treated and control wells were treated with 0.5 ⁇ M FCCP and (final concentration in 200 ⁇ l assay media), and final OCR and ECAR measurements were subsequently taken.
- HCT116 cells were seeded into XFp microplates at a density of 1.2 x 10 4 cells/well. Cells were cultured for 24 hours in RPMI 1640 media supplemented with 11 mM glucose, 2 mM glutamine, and 10% FBS.
- Culture media was replaced with assay media (modified DMEM omitting sodium bicarbonate; available from Seahorse Bioscience as XF Base Medium, supplemented with 10 mM glucose, 2 mM glutamine, and 1 mM pyruvate). Cells were incubated for 1 hour at 37 °C in a non-CO 2 incubator before assay.
- assay media modified DMEM omitting sodium bicarbonate; available from Seahorse Bioscience as XF Base Medium, supplemented with 10 mM glucose, 2 mM glutamine, and 1 mM pyruvate.
- Metabolic potential was measured using an XFp Extracellular Flux Analyzer (Seahorse Bioscience) and XFp assay cartridges (Seahorse Bioscience). Briefly, microplates containing cells were placed in the XFp Extracellular Flux Analyzer, and initial OCR and ECAR measurements were taken. Treated and control wells were then treated with 1.0 ⁇ M oligomycin (final concentration in 200 ⁇ l assay media). After oligomycin treatment, intermediate OCR and ECAR measurements were taken. After 20 minutes, treated and control wells were treated with 0.25 ⁇ M FCCP and (final concentration in 200 ⁇ l assay media), and final OCR and ECAR measurements were subsequently taken.
- HepG2 cells were seeded into XFp microplates at a density of 2.0 ⁇ 10 4 cells/well. Cells were cultured for 24 hours in RPMI 1640 media supplemented with 11 mM glucose, 2 mM glutamine, and 10% FBS.
- Culture media was replaced with assay media (modified DMEM omitting sodium bicarbonate; available from Seahorse Bioscience as XF Base Medium, supplemented with 10 mM glucose, 2 mM glutamine, and 1 mM pyruvate). Cells were incubated for 1 hour at 37 °C in a non-CO 2 incubator before assay.
- assay media modified DMEM omitting sodium bicarbonate; available from Seahorse Bioscience as XF Base Medium, supplemented with 10 mM glucose, 2 mM glutamine, and 1 mM pyruvate.
- Metabolic potential was measured using an XFp Extracellular Flux Analyzer (Seahorse Bioscience) and XFp assay cartridges (Seahorse Bioscience). Briefly, microplates containing cells were placed in the XFp Extracellular Flux Analyzer, and initial OCR and ECAR measurements were taken. Treated and control wells were then treated with 1.0 ⁇ M oligomycin (final concentration in 200 ⁇ l assay media). After oligomycin treatment, intermediate OCR and ECAR measurements were taken. After 20 minutes, treated and control wells were treated with 0.5 ⁇ M FCCP and (final concentration in 200 ⁇ l assay media), and final OCR and ECAR measurements were subsequently taken.
- Example 6 A. Metabolic potential of human umbilical vein endothelial cells.
- Human umbilical vein endothelial cells were seeded into XFp microplates at a density of 1.2 x 10 4 cells/well. Cells were cultured for 24 hours in EGM-2 Bulletkit media (Lonza).
- Culture media was replaced with assay media (modified DMEM omitting sodium bicarbonate; available from Seahorse Bioscience as XF Base Medium, supplemented with 10 mM glucose, 2 mM glutamine, and 1 mM pyruvate). Cells were incubated for 1 hour at 37 °C in a non-CO 2 incubator before assay.
- assay media modified DMEM omitting sodium bicarbonate; available from Seahorse Bioscience as XF Base Medium, supplemented with 10 mM glucose, 2 mM glutamine, and 1 mM pyruvate.
- Metabolic potential was measured using an XFp Extracellular Flux Analyzer (Seahorse Bioscience) and XFp assay cartridges (Seahorse Bioscience). Briefly, microplates containing cells were placed in the XFp Extracellular Flux Analyzer, and initial OCR and ECAR measurements were taken. Treated and control wells were then treated with 1.0 ⁇ M oligomycin (final concentration in 200 ⁇ l assay media). After oligomycin treatment, intermediate OCR and ECAR measurements were taken. After 20 minutes, treated and control wells were treated with 1.0 ⁇ M FCCP and (final concentration in 200 ⁇ l assay media), and final OCR and ECAR measurements were subsequently taken.
- Example 6 B Metabolic potential of MDA-MB-231 cells.
- MDA-MB-231 cells were seeded into XFp microplates at a density of 2.0 x 10 4 cells/well. Cells were cultured for 24 hours in RPMI 1640 media supplemented with 11 mM glucose, 2 mM glutamine, and 10% FBS.
- Culture media was replaced with assay media (modified DMEM omitting sodium bicarbonate; available from Seahorse Bioscience as XF Base Medium, supplemented with 10 mM glucose, 2 mM glutamine, and 1 mM pyruvate). Cells were incubated for 1 hour at 37 °C in a non-CO 2 incubator before assay.
- assay media modified DMEM omitting sodium bicarbonate; available from Seahorse Bioscience as XF Base Medium, supplemented with 10 mM glucose, 2 mM glutamine, and 1 mM pyruvate.
- Metabolic potential was measured using an XFp Extracellular Flux Analyzer (Seahorse Bioscience) and XFp assay cartridges (Seahorse Bioscience). Briefly, microplates containing cells were placed in the XFp Extracellular Flux Analyzer, and initial OCR and ECAR measurements were taken. Treated and control wells were then treated with 1.0 ⁇ M oligomycin (final concentration in 200 ⁇ l assay media). After oligomycin treatment, intermediate OCR and ECAR measurements were taken. After 20 minutes, treated and control wells were treated with 1.0 ⁇ M FCCP and (final concentration in 200 ⁇ l assay media), and final OCR and ECAR measurements were subsequently taken.
- MCF-7 cells were seeded into XFp microplates at a density of 2.0 x 10 4 cells/well. Cells were cultured for 24 hours in RPMI 1640 media supplemented with 11 mM glucose, 2 mM glutamine, and 10% FBS.
- Culture media was replaced with assay media (modified DMEM omitting sodium bicarbonate; available from Seahorse Bioscience as XF Base Medium, supplemented with 10 mM glucose, 2 mM glutamine, and 1 mM pyruvate). Cells were incubated for 1 hour at 37 °C in a non-CO 2 incubator before assay.
- assay media modified DMEM omitting sodium bicarbonate; available from Seahorse Bioscience as XF Base Medium, supplemented with 10 mM glucose, 2 mM glutamine, and 1 mM pyruvate.
- Metabolic potential was measured using an XFp Extracellular Flux Analyzer (Seahorse Bioscience) and XFp assay cartridges (Seahorse Bioscience). Briefly, microplates containing cells were placed in the XFp Extracellular Flux Analyzer, and initial OCR and ECAR measurements were taken. Treated and control wells were then treated with 1.0 ⁇ M oligomycin (final concentration in 200 ⁇ l assay media). After oligomycin treatment, intermediate OCR and ECAR measurements were taken. After 20 minutes, treated and control wells were treated with 0.25 ⁇ M FCCP and (final concentration in 200 ⁇ l assay media), and final OCR and ECAR measurements were subsequently taken.
- Example 6 D Metabolic potential of neonatal rat ventricular myocytes.
- Neonatal rat ventricular myocytes were seeded into XFp microplates at a density of 5.0 x 10 4 cells/well. Cells were cultured for 48 hours in DMEM supplemented with 5.5 mM glucose, 2 mM glutamine, and 1 mM pyruvate.
- Culture media was replaced with assay media (modified DMEM omitting sodium bicarbonate; available from Seahorse Bioscience as XF Base Medium, supplemented with 10 mM glucose, 2 mM glutamine, and 1 mM pyruvate). Cells were incubated for 1 hour at 37 °C in a non-CO 2 incubator before assay.
- assay media modified DMEM omitting sodium bicarbonate; available from Seahorse Bioscience as XF Base Medium, supplemented with 10 mM glucose, 2 mM glutamine, and 1 mM pyruvate.
- Metabolic potential was measured using an XFp Extracellular Flux Analyzer (Seahorse Bioscience) and XFp assay cartridges (Seahorse Bioscience). Briefly, microplates containing cells were placed in the XFp Extracellular Flux Analyzer, and initial OCR and ECAR measurements were taken. Treated and control wells were then treated with 1.0 ⁇ M oligomycin (final concentration in 200 ⁇ l assay media). After oligomycin treatment, intermediate OCR and ECAR measurements were taken. After 20 minutes, treated and control wells were treated with 1.0 ⁇ M FCCP and (final concentration in 200 ⁇ l assay media), and final OCR and ECAR measurements were subsequently taken.
- Example 6 Metabolic potential of PC12 cells.
- PC12 cells were seeded into XFp microplates at a density of 8.0 ⁇ 10 4 cells/well.
- Cells were cultured in assay media (modified DMEM omitting sodium bicarbonate; available from Seahorse Bioscience as XF Base Medium, supplemented with 10 mM glucose, 2 mM glutamine, and 1 mM pyruvate). Cells were incubated for 1 hour at 37 °C in a non-CO 2 incubator before assay.
- assay media modified DMEM omitting sodium bicarbonate; available from Seahorse Bioscience as XF Base Medium, supplemented with 10 mM glucose, 2 mM glutamine, and 1 mM pyruvate.
- Metabolic potential was measured using an XFp Extracellular Flux Analyzer (Seahorse Bioscience) and XFp assay cartridges (Seahorse Bioscience). Briefly, microplates containing cells were placed in the XFp Extracellular Flux Analyzer, and initial OCR and ECAR measurements were taken. Treated and control wells were then treated with 1.0 ⁇ M oligomycin (final concentration in 200 ⁇ l assay media). After oligomycin treatment, intermediate OCR and ECAR measurements were taken. After 20 minutes, treated and control wells were treated with 1.0 ⁇ M FCCP and (final concentration in 200 ⁇ l assay media), and final OCR and ECAR measurements were subsequently taken.
- Example 6 F Metabolic potential of SKBR-3 cells.
- SKBR-3 cells were seeded into XFp microplates at a density of 2.0 x 10 4 cells/well. Cells were cultured for 24 hours in RPMI 1640 media supplemented with 11 mM glucose, 2 mM glutamine, and 10% FBS.
- Culture media was replaced with assay media (modified DMEM omitting sodium bicarbonate; available from Seahorse Bioscience as XF Base Medium, supplemented with 10 mM glucose, 2 mM glutamine, and 1 mM pyruvate). Cells were incubated for 1 hour at 37 °C in a non-CO 2 incubator before assay.
- assay media modified DMEM omitting sodium bicarbonate; available from Seahorse Bioscience as XF Base Medium, supplemented with 10 mM glucose, 2 mM glutamine, and 1 mM pyruvate.
- Metabolic potential was measured using an XFp Extracellular Flux Analyzer (Seahorse Bioscience) and XFp assay cartridges (Seahorse Bioscience). Briefly, microplates containing cells were placed in the XFp Extracellular Flux Analyzer, and initial OCR and ECAR measurements were taken. Treated and control wells were then treated with 1.0 ⁇ M oligomycin (final concentration in 200 ⁇ l assay media). After oligomycin treatment, intermediate OCR and ECAR measurements were taken. After 20 minutes, treated and control wells were treated with 1.0 ⁇ M FCCP and (final concentration in 200 ⁇ l assay media), and final OCR and ECAR measurements were subsequently taken.
- C2C12 myoblast cells were seeded into XFp microplates at a density of 1.2 x 10 4 cells/well.
- Cells were cultured for 24 hours in DMEM supplemented with 25 mM glucose, 4 mM glutamine, 1 mM pyruvate, and 10% FBS.
- This media was then removed and replaced with differentiation media comprised of DMEM supplemented with 25 mM glucose, 4 mM glutamine, 1 mM pyruvate, and 2% horse serum, and allowed to differentiate into myotubes for 4 days. During differentiation, medium was replaced with fresh differentiation medium every other day.
- Culture media was replaced with assay media (modified DMEM omitting sodium bicarbonate; available from Seahorse Bioscience as XF Base Medium, supplemented with 10 mM glucose, 2 mM glutamine, and 1 mM pyruvate).
- Treated myotubes received media containing 40 ⁇ M etomoxir (an inhibitor of carnitine-palmitoyl transferase-1, which is involved in fatty acid oxidation), control myotubes received assay media.
- myotubes were incubated for 1 hour at 37 °C in a non-CO 2 incubator before assay.
- Metabolic potential was measured using an XFp Extracellular Flux Analyzer (Seahorse Bioscience) and XFp assay cartridges (Seahorse Bioscience). Briefly, microplates containing etomoxir-treated and control myotubes were placed in the XFp Extracellular Flux Analyzer, and initial OCR and ECAR measurements are taken. Treated and control wells are then treated simultaneously with 0.5 ⁇ M FCCP and 1.0 ⁇ M oligomycin (final concentration in 200 ⁇ l assay media), and OCR and ECAR measurements were subsequently taken.
- Jurkat cells were seeded into XFp microplates at a density of 1.0 ⁇ 10 5 cells/well. Because Jurkat cells are semi-adherent, cells were added to each well and the microplate was then centrifuged at 300 ⁇ g for two minutes to settle the cells to the bottom of the well. Cells were cultured for 24 hours in RPMI 1640 supplemented with Geneticin, 11 mM glucose, 2 mM glutamine, and 10% FBS. Cells in the treatment group were cultured for 24 hours in media containing 10 nM rapamycin (an inhibitor of mTORC1).
- Culture media was replaced with assay media (modified DMEM omitting sodium bicarbonate; available from Seahorse Bioscience as XF Base Medium, supplemented with 10 mM glucose, 2 mM glutamine, and 1 mM pyruvate). Cells were incubated for 1 hour at 37 °C in a non-CO 2 incubator before assay.
- assay media modified DMEM omitting sodium bicarbonate; available from Seahorse Bioscience as XF Base Medium, supplemented with 10 mM glucose, 2 mM glutamine, and 1 mM pyruvate.
- Metabolic potential was measured using an XFp Extracellular Flux Analyzer (Seahorse Bioscience) and XFp assay cartridges (Seahorse Bioscience). Briefly, microplates containing DCA-treated and control cells were placed in the XFp Extracellular Flux Analyzer, and initial OCR and ECAR measurements are taken. Treated and control wells are then treated simultaneously with 0.5 ⁇ M FCCP and 1.0 ⁇ M oligomycin (final concentration in 200 ⁇ l assay media), and OCR and ECAR measurements were subsequently taken.
Landscapes
- Health & Medical Sciences (AREA)
- Life Sciences & Earth Sciences (AREA)
- Immunology (AREA)
- Engineering & Computer Science (AREA)
- Chemical & Material Sciences (AREA)
- Biomedical Technology (AREA)
- Urology & Nephrology (AREA)
- Hematology (AREA)
- Molecular Biology (AREA)
- Biochemistry (AREA)
- General Health & Medical Sciences (AREA)
- Analytical Chemistry (AREA)
- General Physics & Mathematics (AREA)
- Pathology (AREA)
- Physics & Mathematics (AREA)
- Microbiology (AREA)
- Biotechnology (AREA)
- Cell Biology (AREA)
- Tropical Medicine & Parasitology (AREA)
- Food Science & Technology (AREA)
- Medicinal Chemistry (AREA)
- Physiology (AREA)
- Dispersion Chemistry (AREA)
- Measuring Or Testing Involving Enzymes Or Micro-Organisms (AREA)
- Wood Science & Technology (AREA)
- Bioinformatics & Cheminformatics (AREA)
- Zoology (AREA)
- Organic Chemistry (AREA)
- Sustainable Development (AREA)
- General Engineering & Computer Science (AREA)
- Genetics & Genomics (AREA)
- Apparatus Associated With Microorganisms And Enzymes (AREA)
- Clinical Laboratory Science (AREA)
- Pharmaceuticals Containing Other Organic And Inorganic Compounds (AREA)
Description
- This application claims the benefit of
U.S. Provisional Application No. 62/139,432, filed on March 27, 2015 - Seahorse Bioscience has developed two independent tests of metabolic baseline and potential for each of the two primary energy-generating pathways of cells. Each test requires the addition of three chemical compounds and measurement of activity of one metabolic pathway. Exemplary publications regarding the mitochondrial function test include S.W. Choi, et al., J. Neurochem. (2009) 109, 1179-1191; L.S. Pike et al., Biochim. Biophys. Acta (2010), doi:10.1016/j.bbabio.2010.10.022; B.B. Hill, Biochem. J. (2009) 424, 99-107; D.G. Nichols, et al., JoVE. (2010) 46. www.jouve.com/details.php?id-2511, doi:10.3791/2511; B.P. Dranka et al., Free Radical Biology & Medicine 51 (2011) 1621-1635. Exemplary publications regarding the glycolysis function test include Pike et al., and A. Ibrahim-Hashim, et al, J. Cancer Sci Ther. (November 19, 2011), Suppl 1(4). The combined measurement of both pathways is disclosed in D.A. Ferrick, et al., Drug Discovery Today (March 2008) 13, 5/6.
- The invention is defined in the appended claims.
- Here disclosed is the combination of certain chemical compounds to measure both metabolic pathway baselines and potentials simultaneously using a single exposure of the combined compounds to the living cells. Surprisingly, the measured result from this test provides robust measurements of the two pathways simultaneously.
- The methods disclosed herein enable the stimulation of both major metabolic/energetic pathways acutely with a single injection, as well as the determination of the metabolic potential of these major pathways, i.e., mitochondrial respiration and glycolysis, based on that single injection. Mitochondria and glycolysis produce the majority of energy for the cell in terms of ATP and is indispensible for biosynthetic reactions that create biomass and cellular constituents.
- Prior approaches have been limited to stimulating and analyzing the two major energetic pathways individually. Prior approaches are not able to identify and deliver compound(s) capable of stimulating both major energetic pathways simultaneously. Moreover, prior approaches are not able to measure the simultaneous response of the two major energetic pathways to stress.
- For at least four reasons, identification and delivery of compounds capable of stimulating both pathways simultaneously is not obvious to one of skill in the art. First of all, until Seahorse Bioscience commercialized its extracellular flux ("XF") instruments, no technology was capable of measuring both pathways in living cells, so very few even considered the question. Secondly, the vast majority of those trained in the art are either experts on mitochondria or experts in glycolysis. Metabolism is a huge collection of many "subsystems" of which mitochondria and glycolysis are but two. In the majority of diseases and disciplines where metabolism is studied, those trained in the art only focus on the subsystems most relevant to their research and therefore would not know how to perform an experiment relevant to both pathways and as well interpret it. Thirdly, the two compounds delivered in a single injection in embodiments of the invention, uncoupler and ATP synthase inhibitor (oligomycin), were developed for studying mitochondria and not glycolysis. Seahorse Bioscience is the first company to use the ATP synthase inhibitor to understand glycolytic function, although many researchers demonstrated its use in understanding mitochondrial function. For example, Seahorse was the first to employ oligomycin as a stressor for the glycolytic system in its glycolysis stress test.
- Finally, those of skill in the art assume that glycolysis and oxidative phosphorylation work to compensate for each other. Accordingly, previous approaches are generally based on the premise of stimulating one pathway and decreasing the other. The present disclosure includes an approach that is fundamentally different, as both pathways are expected to be stimulated simultaneously.
- Seahorse Bioscience has demonstrated technology that allows one to measure oxygen consumption rate ("OCR") and extracellular acidification rate ("ECAR") simultaneously. See Ferrick et al. No one, however, has shown injection of both an uncoupler and ATP synthase inhibitor, at the same time, to stress both energetic pathways simultaneously to provide a single indication of metabolic potential and hence phenotype. One may independently determine the stressed responses using two separate approaches and two separate samples, and then combine the data mathematically to determine a total. In contrast, methods described herein employ a single sample and a single injection, whereby the user can determine a single metabolic baseline and potential of the cell that is representative of both mitochondrial respiration and glycolysis.
- Methods described herein have a number of significant advantages over prior art methods of determining the metabolic capacity of cells. For example, because dosing of uncoupler and ATP synthase inhibitor is done via a single injection, data may be collected much more rapidly, allowing metabolic capacity to be measured on a high-throughput scale. For example, prior art methods required a 20 minute interval between dosing of the ATP synthase inhibitor and dosing of the uncoupler; which is eliminated in the methods described herein. Instead, methods described herein require less than the 20 minute interval between dosing of the ATP synthase inhibitor and dosing of the uncoupler of the prior art methods. For example, certain methods described herein demonstrate that the interval between dosing of the ATP synthase inhibitor and dosing of the uncoupler is less than 20 minutes, less than 15 minutes, less than 10 minutes, less than 5 minutes, less than 2 minutes or less than 1 minute. Other methods described herein demonstrate that the ATP synthase inhibitor and the uncoupler can be dosed simultaneously or essentially at the same time (e.g., immediately sequentially).
- Similarly, the number of cell samples used in a given experiment can be reduced by half as compared to prior art methods which measure OCR and ECAR in parallel in separate samples. This is a key advantage for researchers dealing with rare or difficult to cultivate cell types, particularly primary cell cultures. Combining the uncoupler and ATP synthase inhibitor into a single injection frees elements of the dispensing system, allowing for more complicated experiments. Finally, because the ratio of uncoupler and ATP synthase inhibitor is fixed for each replicate, an important source of variation is removed from the data obtained by the methods disclosed herein, as compared with prior art methods.
- In an aspect, here disclosed is a method of determining a metabolic potential of a cell sample. An initial oxygen consumption rate and an initial extracellular acidification rate of the cell sample are simultaneously measured. Thereafter, a mitochondrial uncoupling agent and an ATP synthase inhibitor are simultaneously administered to the cell sample. Thereafter, a subsequent oxygen consumption rate and a subsequent extracellular acidification rate of the cell sample are simultaneously measured. A metabolic potential of the cell sample is determined.
- One or more of the following features may be included. At least one of the mitochondrial uncoupling agent may include carbonyl cyanide p-trifluoromethoxyphenylhydrazone ("FCCP"), carbonyl cyanide-m-chlorophenylhydrazone ("CCCP") or 2,4-dinitrophenol (DNP) or BAM15, or the ATP synthase inhibitor may include oligomycin or 7-Chloro-5-(4-hydroxyphenyl)-1-methyl-3-(napthalen-2-ylmetyl)-4,5,-dihydro-1H-benzo[b][1,4]diazepin-2(3H)-one (Bz-423).
- The mitochondrial uncoupling agent may include carbonyl cyanide p-trifluoromethoxyphenylhydrazone ("FCCP") and the ATP synthase inhibitor may include oligomycin.
- The cell sample may include a plurality of cells disposed in a media. Measuring the initial oxygen consumption rate and/or measuring the initial extracellular acidification rate of the cell sample include sensing a cell constituent disposed in the media.
- A concentration of the administered mitochondrial uncoupling agent in the media may be in a range of about 0.1 µM to about 2.0 µM, e.g., about 0.5 µM. A concentration of the administered ATP synthase inhibitor in the media is about 0.1 µM to about 2 µM, e.g., about 1.0 µM. The mitochondrial uncoupling agent and the ATP synthase inhibitor may be mixed prior to administering to the cell sample.
- The cell sample may be disposed in a well of a multi-well plate prior to the simultaneous measurement of the initial oxygen consumption rate and the initial extracellular acidification rate of the cell sample. The mitochondrial uncoupling agent and the ATP synthase inhibitor may be administered by simultaneously introducing the agent and the inhibitor simultaneously into the well from at least one port.
- Determining the metabolic potential of the cell sample may include (i) providing the initial oxygen consumption rate, the initial extracellular acidification rate, the subsequent oxygen consumption rate, and the subsequent extracellular acidification rate to a software program, and (ii) using the software program to calculate the metabolic potential.
- In another aspect, embodiments of the invention include an apparatus for determining a metabolic potential of a cell sample in a well of a multiwell plate. The apparatus includes (i) a stage adapted to support a multiwell plate; (ii) a sensor adapted to sense a cell constituent associated with the cell sample in a well of the multiwell plate; and (iii) a dispensing system adapted to introduce fluids into the well. The stage, sensor, and dispensing system cooperate to simultaneously measure an initial oxygen consumption rate and an initial extracellular acidification rate of the cell sample using the sensor. Thereafter, the dispensing system is used to simultaneously administer to the cell sample a mitochondrial uncoupling agent and an ATP synthase inhibitor. Thereafter, simultaneously a subsequent oxygen consumption rate and a subsequent extracellular acidification rate of the cell sample are measured using the sensor. The metabolic potential of the cell sample is determined.
- One or more of the following features may be included. The dispensing system may include at least one port disposed above the well. The sensor may include an optical sensor. The sensor may be adapted to sense a fluorophore. The apparatus may include a computer module and software adapted to calculate the metabolic potential based on information communicated to the computer module by the sensor.
-
-
Fig. 1 is a graph showing the results from an FCCP titration in the presence of oligomycin in RAW 264.7 macrophage cells. -
Fig. 2 presents the results from an experiment showing the effects of LPS treatment on Metabolic potential in RAW 264.7 macrophage cells. -
Fig. 3 presents results from an experiment showing the effects of treatment with DCA on metabolic potential of Hela cells. -
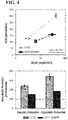
Fig. 4 presents results from an experiment showing the effects of treatment with UK5099 on C2C12 myoblast cells. -
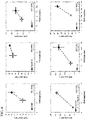
Fig. 5 presents results from experiments showing the metabolic potential of A549 cells, rat astrocytes, primary mouse bone marrow-derived macrophages, BT474 cells, HCT116 cells and HepG2 cells. -
Fig. 6 presents results from experiments showing the metabolic potential of human umbilical vein endothelial cells, MDA-MB-231 cells, MCF-7 cells, neonatal rat ventricular myocytes, PC12 cells and SKBR-3 cells. -
Fig. 7 presents results from an experiment showing the effects of etomoxir on the metabolic potential of C2C12 myotubes. -
Fig. 8 presents results from an experiment showing the effects of treatment with rapamycin on metabolic potential of Jurkat cells. -
Fig. 9 is a graph of exemplary data that may be generated by certain methods in accordance with embodiments of the invention described herein. -
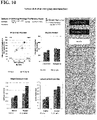
Fig. 10 is a screen shot of an exemplary user interface that may be used in conjunction with certain embodiments of the invention described herein. - The cell energy phenotype test is a method for rapidly determining the metabolic baseline and potential of living cells. This is accomplished by measuring the activity of each of the two major energy-generating pathways within the cell: mitochondrial respiration and glycolysis, first under baseline conditions, and again after applying a stress to the cells to demand increased energy supply.
- The stress may be applied by exposing the cells to a combination of two chemical compounds: a mitochondrial uncoupler and an ATP synthase inhibitor. These chemical compounds increase the apparent energy demands on the two metabolic pathways, causing the activity within each pathway to increase to as much as a maximum capacity.
- The difference in measured energy generating activity between the stressed and baseline condition defines the metabolic potential. The combination of the metabolic baseline and metabolic potential constitutes the energy phenotype of the cell.
- The metabolic energy generating activity of the mitochondrial respiration pathway is determined by measuring the rate of oxygen consumption by the living cells, and the metabolic energy generating activity of the glycolysis pathway is determined from a measurement of extracellular acidification caused by secretion of protons from the cell.
- In accordance with embodiments of the invention, the prototypic uncoupler, carbonyl cyanide p-trifluoromethoxyphenylhydrazone ("FCCP"), stresses the aerobic system by dissipating the proton gradient across the inner mitochondrial membrane. This forces the cell to increase mitochondrial activity up to its maximum. Oligomycin blocks the ATPase of complex V, thus preventing the hydrolysis of adenosine triphosphate ("ATP"), that would supply electrons through this complex in the reverse direction which would counteract the effects of FCCP. Oligomycin also "stresses" the glycolytic system to produce more ATP to counteract the loss of ATP caused by its inhibition of the mitochondrial ATPase.
-
- 1. An analytical tool suitable for performing analysis in accordance with embodiments of
the invention may be, e.g., any one of the following instruments:- a. Seahorse Bioscience XFp Extracellular Flux Analyzer
- b. Seahorse Bioscience XFe24 Extracellular Flux Analyzer
- c. Seahorse Bioscience XFe96 Extracellular Flux Analyzer
- d. Seahorse Bioscience XF24 Extracellular Flux Analyzer
- e. Seahorse Bioscience XF24-3 Extracellular Flux Analyzer
- f. Seahorse Bioscience XF96 Extracellular Flux Analyzer
U.S. Patent Nos. 7,276,351 and8,658,349 . As discussed below, the stage, sensor, and dispensing system cooperate to simultaneously measure an initial oxygen consumption rate and an initial extracellular acidification rate of the cell sample using the sensor. Thereafter, the dispensing system is used to simultaneously administer to the cell sample a mitochondrial uncoupling agent and an ATP synthase inhibitor. Thereafter, a subsequent oxygen consumption rate and a subsequent extracellular acidification rate of the cell sample are simultaneously measured using the sensor. The metabolic potential of the cell sample is determined. - 2. Cell culture media. Typically Dulbecco's Modified Eagle's medium ("DMEM"), available from Invitrogen, supplemented with 10 mM glucose, 2 mM glutamine, and 1 mM pyruvate.
- 3. Assay media (typically DMEM supplemented with glucose, glutamine, and pyruvate, but omitting sodium bicarbonate; available from Seahorse Bioscience as XF Base Medium and supplemented with 10 mM glucose, 2 mM glutamine, and 1 mM pyruvate.
- 4. Assay cartridge appropriate for the instrument being used, e.g., XFe96 FluxPak.
- 5. Cells in culture (typically mammalian although not limited to this.) The number of cells required varies based on the instrument used and the type of cell. Typically the number is between 10,000 and 1,000,000 per well. In a prototypical example utilizing RAW 264.7 macrophage cells, 80,000 cells may be seeded per well of an XFp miniplate.
- 6. Reagents (either a or b)
- a. Oligomycin and FCCP (each available from Seahorse Bioscience)
- b. For the XFp instrument, oligomycin and FCCP are offered as a kit, i.e., the XFp Cell Energy Phenotype Test Kit
- Generally, reagents preferably include a combination of a mitochondrial uncoupling agent and an ATP synthase inhibitor. Suitable mitochondrial uncoupling agent include, e.g., carbonyl cyanide p-trifluoromethoxyphenylhydrazone ("FCCP"), carbonyl cyanide-m-chlorophenylhydrazone ("CCCP") or 2,4-dinitrophenol ("DNP") or BAM15. Suitable ATP synthase inhibitors include, e.g., oligomycin or 7-Chloro-5-(4-hydroxyphenyl)-1-methyl-3-(napthalen-2-ylmetyl)-4,5,-dihydro-1H-benzo[b][1,4]diazepin-2(3H)-one (Bz-423).
-
- 1. Cultured cells are first seeded into the wells of an appropriate microplate (also referred to herein as a multi-well plate) for the instrument being used (as described above).
- 2. After adherence to the microplate, cells are either allowed to grow as desired, or may be assayed for metabolic potential immediately.
- 3. At time of assay, cell culture media is exchanged for a volume of assay media appropriate for the microplate being used to create a cell sample including a plurality of cells disposed in a media. The microplate is allowed to incubate for 1 h at 37°C in a non-CO2 incubator.
- 4. In some cells, lipopolysaccharide ("LPS") may be added to a final concentration of 1 µg/ml during the change to assay media. The cells may be allowed to incubate for 1 h at 37 °C in a non-CO2 incubator before assay. The LPS treatment may not be removed during the assay.
- 5. The appropriate instrument is programmed with command instructions to conduct, e.g., three measurements, inject the solution from a port in a cartridge disposed above the cell sample in a well, and then conduct 5 additional measurements.
- 6. Oligomycin stock solution is prepared to a working concentration of 10 µM in assay media. FCCP is added to this solution to a working concentration optimized for the particular cell type being assayed. For example, in RAW 264.7 macrophages, a working solution of 5 µM is prepared.
- 7. A sufficient volume of the working solution is added to an assay cartridge such that upon injection the working solution is diluted into the assay medium to the final desired concentration. For example, in RAW 264.7 macrophages, the final desired concentration is 1.0 µM oligomycin and 0.5 µM FCCP. Both of these concentrations were determined by titration for optimal effectiveness.
- 8. To titrate optimal FCCP concentration in an XFe96 instrument, RAW 264.7 macrophages are exposed to varying concentrations of the drug, and the resulting OCR is measured. In this example, cells were first treated with 1.0 µM oligomycin (final concentration in 200 µl assay media), OCR was measured, and then one of the following concentrations of FCCP was added: 0.125, 0.25, 0.5, 1.0, or 2.0 µM (final concentration in 222 µl assay media). The resulting OCR is then plotted as in the example figure to determine the lowest concentration which achieves maximal stimulation of OCR.
- 9. The hydrated assay cartridge containing oligomycin and FCCP is loaded into the instrument.
- 10. After assay cartridge calibration, the cell culture microplate is loaded into the instrument. The instrument then performs the programmed measurement steps as outlined above.
- 11. The metabolic potential of the cell sample may be determined by (i) providing the initial oxygen consumption rate, the initial extracellular acidification rate, the subsequent oxygen consumption rate, and the subsequent extracellular acidification rate to a software program, and (ii) using the software program to calculate the metabolic potential. Accordingly, at the completion of an experiment, the data may be analyzed using an Excel macro that calculates the metabolic potential based upon the degree of stimulation of each pathway. The Excel macro analyzes the data generated by any XF instrument. Data analysis begins by determining the baseline rate of oxygen consumption and extracellular acidification as defined by the last measurement prior to injection of stressors. The stressed data point is determined using the data point which is stimulated maximally following co-injection of oligomycin and FCCP. These data are plotted graphically where the Y-axis represents OCR and the X axis represents ECAR. Metabolic potential is determined for each element separately by determining the percent stimulation of each pathway (OCR and ECAR) by the stressor above baseline. An example of the types of data that may be generated by certain methods described herein are presented in
Figure 9 . A screen shot of an exemplary user interface that may be used in conjunction with certain methods described herein is presented inFigure 10 . - A suitable assay kit may include tubes of oligomycin and FCCP. The compounds are preferably premeasured, and lyophilized for stability.
- Calculations may be performed on the time-resolved data to determine the baseline and stressed phenotypes, as well as the combined metabolic potential. The data may be averaged from multiple technical replicates within a single experimental microplate.
- RAW 264.7 macrophage cells were seeded into XFe96 microplates (Seahorse Bioscience) at a density of 8.0 x 10⁴ cells/well. Because RAW 264.7 cells are semi-adherent, cells were added to each well and the microplate was then centrifuged at 300 x g for two minutes to settle the cells to the bottom of the well. Cells were cultured for 24 hours in DMEM supplemented with 25 mM glucose, 4 mM glutamine, 1 mM pyruvate, and 10% FBS.
- Culture media was replaced with assay media (modified DMEM omitting sodium bicarbonate; available from Seahorse Bioscience as XF Base Medium, supplemented with 10 mM glucose, 2 mM glutamine, and 1 mM pyruvate).
- FCCP titration was performed using an XFe96 Extracellular Flux Analyzer (Seahorse Bioscience) and XFe96 assay cartridges (Seahorse Bioscience) according to the manufacturer's instructions. Briefly, cells were first treated with 1.0 µM oligomycin (final concentration in 200 µl assay media), OCR was measured, and then one of the following concentrations of FCCP was added: 0.125 µM, 0.25 µM, 0.5 µM, 1.0 µM, or 2 µM (final concentration in 222 µl assay media). The resulting OCR was then plotted as in the example figure to determine the lowest concentration which achieves maximal stimulation of OCR.
- Results of the titration are presented in
Figure 1 . Data are the oxygen consumption rates of RAW 264.7 macrophage cells in the presence of 1.0 µM oligomycin plus the indicated concentration of FCCP. Data shown are the mean ± standard deviation from three replicates per treatment group. These data indicate that maximal OCR is achieved with 0.5 µM FCCP in the presence of 1.0 µM oligomycin. - RAW 264.7 macrophage cells were seeded into XFp microplates at a density of 8.0 x 10⁴ cells/well. Because RAW 264.7 cells are semi-adherent, cells were added to each well and the microplate was then centrifuged at 300 x g for two minutes to settle the cells to the bottom of the well. Cells were cultured for 24 hours in DMEM supplemented with 25 mM glucose, 4 mM glutamine, 1 mM pyruvate, and 10% FBS.
- Culture media was replaced with assay media (modified DMEM omitting sodium bicarbonate; available from Seahorse Bioscience as XF Base Medium, supplemented with 10 mM glucose, 2 mM glutamine, and 1 mM pyruvate). Cells treated with LPS received media containing 1 gg/ml LPS, control cells received assay media. Cells were incubated for 1 hour at 37 °C in a non-CO2 incubator before assay.
- Metabolic potential was measured using an XFp Extracellular Flux Analyzer (Seahorse Bioscience) and XFp assay cartridges (Seahorse Bioscience). Briefly, microplates containing LPS-treated and control cells were placed in the XFp Extracellular Flux Analyzer, and initial OCR and ECAR measurements are taken. Treated and control wells are then treated simultaneously with 0.5 µM FCCP and 1.0 µM oligomycin (final concentration in 200 µl assay media), and OCR and ECAR measurements were subsequently taken.
- Results of the experiment are presented in
Figure 2 . Data shown are the mean ± standard deviation from three replicates per treatment group. These data indicate that the aerobic metabolic potential of cells treated with LPS is increased relative to control cells, and the glycolytic potential remains roughly unchanged. - Hela cells were seeded into XFp microplates at a density of 1.2 x 10⁴ cells/well. Cells were cultured for 24 hours in MEM supplemented with 5.5 mM glucose, 2 mM glutamine, and 10% FBS.
- Culture media was replaced with assay media (modified DMEM omitting sodium bicarbonate; available from Seahorse Bioscience as XF Base Medium, supplemented with 10 mM glucose, 2 mM glutamine, and 1 mM pyruvate). Treated cells received media containing 10 mM dichloroacetate (DCA), control cells received assay media. Cells were incubated for 1 hour at 37 °C in a non-CO2 incubator before assay.
- Metabolic potential was measured using an XFp Extracellular Flux Analyzer (Seahorse Bioscience) and XFp assay cartridges (Seahorse Bioscience). Briefly, microplates containing DCA-treated and control cells were placed in the XFp Extracellular Flux Analyzer, and initial OCR and ECAR measurements are taken. Treated and control wells are then treated simultaneously with 0.75 µM FCCP and 1.0 µM oligomycin (final concentration in 200 µl assay media), and OCR and ECAR measurements were subsequently taken.
- Results of the experiment are presented in
Figure 3 . Data shown are the mean ± standard deviation from three replicates per treatment group. These data indicate that the aerobic metabolic potential of treated cells is slightly increased relative to control cells, and the glycolytic potential is decreased. - C2C12 myoblast cells were seeded into XFp microplates at a density of 1.2 × 10⁴ cells/well. Cells were cultured for 24 hours in DMEM supplemented with 25 mM glucose, 4 mM glutamine, 1 mM pyruvate, and 10% FBS.
- Culture media was replaced with assay media (modified DMEM omitting sodium bicarbonate; available from Seahorse Bioscience as XF Base Medium, supplemented with 10 mM glucose, 2 mM glutamine, and 1 mM pyruvate). Treated cells received media containing 2 µM UK5099 (a potent inhibitor of the mitochondrial pyruvate carrier), control cells received assay media. Cells were incubated for 1 hour at 37 °C in a non-CO2 incubator before assay.
- Metabolic potential was measured using an XFp Extracellular Flux Analyzer (Seahorse Bioscience) and XFp assay cartridges (Seahorse Bioscience). Briefly, microplates containing UK5099 -treated and control cells were placed in the XFp Extracellular Flux Analyzer, and initial OCR and ECAR measurements are taken. Treated and control wells are then treated simultaneously with 0.5 µM FCCP and 1.0 µM oligomycin (final concentration in 200 µl assay media), and OCR and ECAR measurements were subsequently taken.
- Results of the experiment are presented in
Figure 4 . Data shown are the mean ± standard deviation from three replicates per treatment group. These data indicate that the aerobic and glycolytic metabolic potential of cells treated with UK5099 is decreased relative to control cells. - A549 cells were seeded into XFp microplates at a density of 1.0 × 10⁴ cells/well. Cells were cultured for 24 hours in RPMI 1640 media supplemented with 11 mM glucose, 2 mM glutamine, and 10% FBS.
- Culture media was replaced with assay media (modified DMEM omitting sodium bicarbonate; available from Seahorse Bioscience as XF Base Medium, supplemented with 10 mM glucose, 2 mM glutamine, and 1 mM pyruvate). Cells were incubated for 1 hour at 37 °C in a non-CO2 incubator before assay.
- Metabolic potential was measured using an XFp Extracellular Flux Analyzer (Seahorse Bioscience) and XFp assay cartridges (Seahorse Bioscience). Briefly, microplates containing cells were placed in the XFp Extracellular Flux Analyzer, and initial OCR and ECAR measurements were taken. Treated and control wells were then treated with 1.0 µM oligomycin (final concentration in 200 µl assay media). After oligomycin treatment, intermediate OCR and ECAR measurements were taken. After 20 minutes, treated and control wells were treated with 0.5 µM FCCP and (final concentration in 200 µl assay media), and final OCR and ECAR measurements were subsequently taken.
- Results of the experiment are presented in
Figure 5 . Data shown are the mean ± standard deviation from three replicates per treatment group. - 14-day post-isolation rat astrocytes were seeded into XFp microplates at a density of 2.0 x 10⁴ cells/well. Cells were cultured for 48 hours in DMEM supplemented with 5.5 mM glucose, 2 mM glutamine, and 10% FBS.
- Culture media was replaced with assay media (modified DMEM omitting sodium bicarbonate; available from Seahorse Bioscience as XF Base Medium, supplemented with 10 mM glucose, 2 mM glutamine, and 1 mM pyruvate). Cells were incubated for 1 hour at 37 °C in a non-CO2 incubator before assay.
- Metabolic potential was measured using an XFp Extracellular Flux Analyzer (Seahorse Bioscience) and XFp assay cartridges (Seahorse Bioscience). Briefly, microplates containing cells were placed in the XFp Extracellular Flux Analyzer, and initial OCR and ECAR measurements were taken. Treated and control wells were then treated with 1.0 µM oligomycin (final concentration in 200 µl assay media). After oligomycin treatment, intermediate OCR and ECAR measurements were taken. After 20 minutes, treated and control wells were treated with 2.0 µM FCCP and (final concentration in 200 µl assay media), and final OCR and ECAR measurements were subsequently taken.
- Results of the experiment are presented in
Figure 5 . Data shown are the mean ± standard deviation from three replicates per treatment group. - Primary mouse bone marrow-derived macrophages were differentiated using GM-CSF and grown in culture for 7 days. Cells were seeded into XFp microplates at a density of 8.0 x 10⁴ cells/well. Cells were cultured for 24 hours in DMEM supplemented with 10 mM glucose, 2 mM glutamine, 1 mM pyruvate, and 10% FBS.
- Culture media was replaced with assay media (modified DMEM omitting sodium bicarbonate; available from Seahorse Bioscience as XF Base Medium, supplemented with 10 mM glucose, 2 mM glutamine, and 1 mM pyruvate). Cells were incubated for 1 hour at 37 °C in a non-CO2 incubator before assay.
- Metabolic potential was measured using an XFp Extracellular Flux Analyzer (Seahorse Bioscience) and XFp assay cartridges (Seahorse Bioscience). Briefly, microplates containing cells were placed in the XFp Extracellular Flux Analyzer, and initial OCR and ECAR measurements were taken. Treated and control wells were then treated with 1.0 µM oligomycin (final concentration in 200 µl assay media). After oligomycin treatment, intermediate OCR and ECAR measurements were taken. After 20 minutes, treated and control wells were treated with 1.0 µM FCCP and (final concentration in 200 µl assay media), and final OCR and ECAR measurements were subsequently taken.
- Results of the experiment are presented in
Figure 5 . Data shown are the mean ± standard deviation from three replicates per treatment group. - BT474 cells were seeded into XFp microplates at a density of 2.0 x 10⁴ cells/well. Cells were cultured for 24 hours in ATCC Hybricare media supplemented with 10% FBS.
- Culture media was replaced with assay media (modified DMEM omitting sodium bicarbonate; available from Seahorse Bioscience as XF Base Medium, supplemented with 10 mM glucose, 2 mM glutamine, and 1 mM pyruvate). Cells were incubated for 1 hour at 37 °C in a non-CO2 incubator before assay.
- Metabolic potential was measured using an XFp Extracellular Flux Analyzer (Seahorse Bioscience) and XFp assay cartridges (Seahorse Bioscience). Briefly, microplates containing cells were placed in the XFp Extracellular Flux Analyzer, and initial OCR and ECAR measurements were taken. Treated and control wells were then treated with 1.0 µM oligomycin (final concentration in 200 µl assay media). After oligomycin treatment, intermediate OCR and ECAR measurements were taken. After 20 minutes, treated and control wells were treated with 0.5 µM FCCP and (final concentration in 200 µl assay media), and final OCR and ECAR measurements were subsequently taken.
- Results of the experiment are presented in
Figure 5 . Data shown are the mean ± standard deviation from three replicates per treatment group. - HCT116 cells were seeded into XFp microplates at a density of 1.2 x 10⁴ cells/well. Cells were cultured for 24 hours in RPMI 1640 media supplemented with 11 mM glucose, 2 mM glutamine, and 10% FBS.
- Culture media was replaced with assay media (modified DMEM omitting sodium bicarbonate; available from Seahorse Bioscience as XF Base Medium, supplemented with 10 mM glucose, 2 mM glutamine, and 1 mM pyruvate). Cells were incubated for 1 hour at 37 °C in a non-CO2 incubator before assay.
- Metabolic potential was measured using an XFp Extracellular Flux Analyzer (Seahorse Bioscience) and XFp assay cartridges (Seahorse Bioscience). Briefly, microplates containing cells were placed in the XFp Extracellular Flux Analyzer, and initial OCR and ECAR measurements were taken. Treated and control wells were then treated with 1.0 µM oligomycin (final concentration in 200 µl assay media). After oligomycin treatment, intermediate OCR and ECAR measurements were taken. After 20 minutes, treated and control wells were treated with 0.25 µM FCCP and (final concentration in 200 µl assay media), and final OCR and ECAR measurements were subsequently taken.
- Results of the experiment are presented in
Figure 5 . Data shown are the mean ± standard deviation from three replicates per treatment group. - HepG2 cells were seeded into XFp microplates at a density of 2.0 × 10⁴ cells/well. Cells were cultured for 24 hours in RPMI 1640 media supplemented with 11 mM glucose, 2 mM glutamine, and 10% FBS.
- Culture media was replaced with assay media (modified DMEM omitting sodium bicarbonate; available from Seahorse Bioscience as XF Base Medium, supplemented with 10 mM glucose, 2 mM glutamine, and 1 mM pyruvate). Cells were incubated for 1 hour at 37 °C in a non-CO2 incubator before assay.
- Metabolic potential was measured using an XFp Extracellular Flux Analyzer (Seahorse Bioscience) and XFp assay cartridges (Seahorse Bioscience). Briefly, microplates containing cells were placed in the XFp Extracellular Flux Analyzer, and initial OCR and ECAR measurements were taken. Treated and control wells were then treated with 1.0 µM oligomycin (final concentration in 200 µl assay media). After oligomycin treatment, intermediate OCR and ECAR measurements were taken. After 20 minutes, treated and control wells were treated with 0.5 µM FCCP and (final concentration in 200 µl assay media), and final OCR and ECAR measurements were subsequently taken.
- Results of the experiment are presented in
Figure 5 . Data shown are the mean ± standard deviation from three replicates per treatment group. - Human umbilical vein endothelial cells were seeded into XFp microplates at a density of 1.2 x 10⁴ cells/well. Cells were cultured for 24 hours in EGM-2 Bulletkit media (Lonza).
- Culture media was replaced with assay media (modified DMEM omitting sodium bicarbonate; available from Seahorse Bioscience as XF Base Medium, supplemented with 10 mM glucose, 2 mM glutamine, and 1 mM pyruvate). Cells were incubated for 1 hour at 37 °C in a non-CO2 incubator before assay.
- Metabolic potential was measured using an XFp Extracellular Flux Analyzer (Seahorse Bioscience) and XFp assay cartridges (Seahorse Bioscience). Briefly, microplates containing cells were placed in the XFp Extracellular Flux Analyzer, and initial OCR and ECAR measurements were taken. Treated and control wells were then treated with 1.0 µM oligomycin (final concentration in 200 µl assay media). After oligomycin treatment, intermediate OCR and ECAR measurements were taken. After 20 minutes, treated and control wells were treated with 1.0 µM FCCP and (final concentration in 200 µl assay media), and final OCR and ECAR measurements were subsequently taken.
- Results of the experiment are presented in
Figure 6 . Data shown are the mean ± standard deviation from three replicates per treatment group. - MDA-MB-231 cells were seeded into XFp microplates at a density of 2.0 x 10⁴ cells/well. Cells were cultured for 24 hours in RPMI 1640 media supplemented with 11 mM glucose, 2 mM glutamine, and 10% FBS.
- Culture media was replaced with assay media (modified DMEM omitting sodium bicarbonate; available from Seahorse Bioscience as XF Base Medium, supplemented with 10 mM glucose, 2 mM glutamine, and 1 mM pyruvate). Cells were incubated for 1 hour at 37 °C in a non-CO2 incubator before assay.
- Metabolic potential was measured using an XFp Extracellular Flux Analyzer (Seahorse Bioscience) and XFp assay cartridges (Seahorse Bioscience). Briefly, microplates containing cells were placed in the XFp Extracellular Flux Analyzer, and initial OCR and ECAR measurements were taken. Treated and control wells were then treated with 1.0 µM oligomycin (final concentration in 200 µl assay media). After oligomycin treatment, intermediate OCR and ECAR measurements were taken. After 20 minutes, treated and control wells were treated with 1.0 µM FCCP and (final concentration in 200 µl assay media), and final OCR and ECAR measurements were subsequently taken.
- Results of the experiment are presented in
Figure 6 . Data shown are the mean ± standard deviation from three replicates per treatment group. - MCF-7 cells were seeded into XFp microplates at a density of 2.0 x 10⁴ cells/well. Cells were cultured for 24 hours in RPMI 1640 media supplemented with 11 mM glucose, 2 mM glutamine, and 10% FBS.
- Culture media was replaced with assay media (modified DMEM omitting sodium bicarbonate; available from Seahorse Bioscience as XF Base Medium, supplemented with 10 mM glucose, 2 mM glutamine, and 1 mM pyruvate). Cells were incubated for 1 hour at 37 °C in a non-CO2 incubator before assay.
- Metabolic potential was measured using an XFp Extracellular Flux Analyzer (Seahorse Bioscience) and XFp assay cartridges (Seahorse Bioscience). Briefly, microplates containing cells were placed in the XFp Extracellular Flux Analyzer, and initial OCR and ECAR measurements were taken. Treated and control wells were then treated with 1.0 µM oligomycin (final concentration in 200 µl assay media). After oligomycin treatment, intermediate OCR and ECAR measurements were taken. After 20 minutes, treated and control wells were treated with 0.25 µM FCCP and (final concentration in 200 µl assay media), and final OCR and ECAR measurements were subsequently taken.
- Results of the experiment are presented in
Figure 6 . Data shown are the mean ± standard deviation from three replicates per treatment group. - Neonatal rat ventricular myocytes were seeded into XFp microplates at a density of 5.0 x 10⁴ cells/well. Cells were cultured for 48 hours in DMEM supplemented with 5.5 mM glucose, 2 mM glutamine, and 1 mM pyruvate.
- Culture media was replaced with assay media (modified DMEM omitting sodium bicarbonate; available from Seahorse Bioscience as XF Base Medium, supplemented with 10 mM glucose, 2 mM glutamine, and 1 mM pyruvate). Cells were incubated for 1 hour at 37 °C in a non-CO2 incubator before assay.
- Metabolic potential was measured using an XFp Extracellular Flux Analyzer (Seahorse Bioscience) and XFp assay cartridges (Seahorse Bioscience). Briefly, microplates containing cells were placed in the XFp Extracellular Flux Analyzer, and initial OCR and ECAR measurements were taken. Treated and control wells were then treated with 1.0 µM oligomycin (final concentration in 200 µl assay media). After oligomycin treatment, intermediate OCR and ECAR measurements were taken. After 20 minutes, treated and control wells were treated with 1.0 µM FCCP and (final concentration in 200 µl assay media), and final OCR and ECAR measurements were subsequently taken.
- Results of the experiment are presented in
Figure 6 . Data shown are the mean ± standard deviation from three replicates per treatment group. - PC12 cells were seeded into XFp microplates at a density of 8.0 × 10⁴ cells/well. Cells were cultured in assay media (modified DMEM omitting sodium bicarbonate; available from Seahorse Bioscience as XF Base Medium, supplemented with 10 mM glucose, 2 mM glutamine, and 1 mM pyruvate). Cells were incubated for 1 hour at 37 °C in a non-CO2 incubator before assay.
- Metabolic potential was measured using an XFp Extracellular Flux Analyzer (Seahorse Bioscience) and XFp assay cartridges (Seahorse Bioscience). Briefly, microplates containing cells were placed in the XFp Extracellular Flux Analyzer, and initial OCR and ECAR measurements were taken. Treated and control wells were then treated with 1.0 µM oligomycin (final concentration in 200 µl assay media). After oligomycin treatment, intermediate OCR and ECAR measurements were taken. After 20 minutes, treated and control wells were treated with 1.0 µM FCCP and (final concentration in 200 µl assay media), and final OCR and ECAR measurements were subsequently taken.
- Results of the experiment are presented in
Figure 6 . Data shown are the mean ± standard deviation from three replicates per treatment group - SKBR-3 cells were seeded into XFp microplates at a density of 2.0 x 10⁴ cells/well. Cells were cultured for 24 hours in RPMI 1640 media supplemented with 11 mM glucose, 2 mM glutamine, and 10% FBS.
- Culture media was replaced with assay media (modified DMEM omitting sodium bicarbonate; available from Seahorse Bioscience as XF Base Medium, supplemented with 10 mM glucose, 2 mM glutamine, and 1 mM pyruvate). Cells were incubated for 1 hour at 37 °C in a non-CO2 incubator before assay.
- Metabolic potential was measured using an XFp Extracellular Flux Analyzer (Seahorse Bioscience) and XFp assay cartridges (Seahorse Bioscience). Briefly, microplates containing cells were placed in the XFp Extracellular Flux Analyzer, and initial OCR and ECAR measurements were taken. Treated and control wells were then treated with 1.0 µM oligomycin (final concentration in 200 µl assay media). After oligomycin treatment, intermediate OCR and ECAR measurements were taken. After 20 minutes, treated and control wells were treated with 1.0 µM FCCP and (final concentration in 200 µl assay media), and final OCR and ECAR measurements were subsequently taken.
- Results of the experiment are presented in
Figure 6 . Data shown are the mean ± standard deviation from three replicates per treatment group. - C2C12 myoblast cells were seeded into XFp microplates at a density of 1.2 x 10⁴ cells/well. Cells were cultured for 24 hours in DMEM supplemented with 25 mM glucose, 4 mM glutamine, 1 mM pyruvate, and 10% FBS. This media was then removed and replaced with differentiation media comprised of DMEM supplemented with 25 mM glucose, 4 mM glutamine, 1 mM pyruvate, and 2% horse serum, and allowed to differentiate into myotubes for 4 days. During differentiation, medium was replaced with fresh differentiation medium every other day.
- Culture media was replaced with assay media (modified DMEM omitting sodium bicarbonate; available from Seahorse Bioscience as XF Base Medium, supplemented with 10 mM glucose, 2 mM glutamine, and 1 mM pyruvate). Treated myotubes received media containing 40 µM etomoxir (an inhibitor of carnitine-palmitoyl transferase-1, which is involved in fatty acid oxidation), control myotubes received assay media. myotubes were incubated for 1 hour at 37 °C in a non-CO2 incubator before assay.
- Metabolic potential was measured using an XFp Extracellular Flux Analyzer (Seahorse Bioscience) and XFp assay cartridges (Seahorse Bioscience). Briefly, microplates containing etomoxir-treated and control myotubes were placed in the XFp Extracellular Flux Analyzer, and initial OCR and ECAR measurements are taken. Treated and control wells are then treated simultaneously with 0.5 µM FCCP and 1.0 µM oligomycin (final concentration in 200 µl assay media), and OCR and ECAR measurements were subsequently taken.
- Results of the experiment are presented in
Figure 7 . Data shown are the mean ± standard deviation from three replicates per treatment group. These data indicate that the aerobic metabolic potential was increased and glycolytic metabolic potential was slightly decreased in myotubes treated with etomoxir compared to control myotubes. - Jurkat cells were seeded into XFp microplates at a density of 1.0 × 10⁵ cells/well. Because Jurkat cells are semi-adherent, cells were added to each well and the microplate was then centrifuged at 300 × g for two minutes to settle the cells to the bottom of the well. Cells were cultured for 24 hours in RPMI 1640 supplemented with Geneticin, 11 mM glucose, 2 mM glutamine, and 10% FBS. Cells in the treatment group were cultured for 24 hours in media containing 10 nM rapamycin (an inhibitor of mTORC1).
- Culture media was replaced with assay media (modified DMEM omitting sodium bicarbonate; available from Seahorse Bioscience as XF Base Medium, supplemented with 10 mM glucose, 2 mM glutamine, and 1 mM pyruvate). Cells were incubated for 1 hour at 37 °C in a non-CO2 incubator before assay.
- Metabolic potential was measured using an XFp Extracellular Flux Analyzer (Seahorse Bioscience) and XFp assay cartridges (Seahorse Bioscience). Briefly, microplates containing DCA-treated and control cells were placed in the XFp Extracellular Flux Analyzer, and initial OCR and ECAR measurements are taken. Treated and control wells are then treated simultaneously with 0.5 µM FCCP and 1.0 µM oligomycin (final concentration in 200 µl assay media), and OCR and ECAR measurements were subsequently taken.
- Results of the experiment are presented in
Figure 8 . Data shown are the mean ± standard deviation from three replicates per treatment group. These data indicate that treatment with rapamycin decreased the basal and stressed OCR and ECAR levels in Jurkat cells, and decreased aerobic metabolic potential, but slightly increased glycolytic potential relative to controls. While several aspects of the present invention have been described and depicted herein, alternative aspects may be effected by those skilled in the art to accomplish the same objectives.
Claims (13)
- An apparatus for determining a metabolic potential of a cell sample in a well of a multiwell plate, the apparatus comprising:(i) a stage adapted to support a multiwell plate;(ii) a sensor adapted to sense a cell constituent associated with the cell sample in a well of the multiwell plate; and(iii) a dispensing system adapted to introduce fluids into the well, comprising a single injection element combining the mitochondrial uncoupling agent and the ATP synthase inhibitor, wherein the mitochondrial uncoupling agent and the ATP synthase inhibitor is mixed prior to administering to the cell sample, wherein the stage, sensor, and dispensing system cooperate to:simultaneously measure an initial oxygen consumption rate and an initial extracellular acidification rate of the cell sample using the sensor;thereafter, use the dispensing system to simultaneously administer to the cell sample a mitochondrial uncoupling agent and an ATP synthase inhibitor;thereafter, simultaneously measure a subsequent oxygen consumption rate and a subsequent extracellular acidification rate of the cell sample using the sensor; anddetermine the metabolic potential of the cell sample.
- The apparatus of claim 1, wherein the dispensing system comprises at least one port disposed above the well.
- The apparatus of claim 1 or 2, wherein the sensor comprises an optical sensor.
- The apparatus of claim 3, wherein the sensor is adapted to sense a fluorophore.
- The apparatus of any one of claims 1-4, further comprising a computer module and software adapted to calculate the metabolic potential based on information communicated to the computer module by the sensor.
- The apparatus of any one of claims 1-5, wherein at least one of the mitochondrial uncoupling agents comprises carbonyl cyanide p-trifluoromethoxyphenylhydrazone ("FCCP"), carbonyl cyanide-m-chlorophenylhydrazone ("CCCP") or 2,4-dinitrophenol ("DNP") or BAM15, and the ATP synthase inhibitor comprises oligomycin or 7-Chloro-5-(4-hydroxyphenyl)-1-methyl-3-(napthalen-2-ylmetyl)-4,5,-dihydro-1H-benzo[b][1,4]diazepin-2(3H)-one (Bz-423).
- The apparatus of claim 6, wherein the mitochondrial uncoupling agent comprises carbonyl cyanide p-trifluoromethoxyphenylhydrazone ("FCCP") and the ATP synthase inhibitor comprises oligomycin.
- The apparatus of any one of claims 1-7, wherein the cell sample comprises a plurality of cells disposed in a media.
- The apparatus of any one of claims 1-8, wherein a concentration of the administered mitochondrial uncoupling agent in the media is in a range of 0.1 µM to 2.0 µM.
- The apparatus of any one of claims 1-9, wherein a concentration of the administered ATP synthase inhibitor in the media is 0.1 µM to 2 µM.
- The apparatus of any one of claims 1-10, wherein the cell sample is disposed in a well of a multi-well plate prior to simultaneously measuring the initial oxygen consumption rate and the initial extracellular acidification rate of the cell sample.
- The apparatus of claim 11, wherein administering the mitochondrial uncoupling agent and the ATP synthase inhibitor comprises introducing the agent and the inhibitor simultaneously into the well from at least one port.
- The apparatus of any one of claims 1-12, wherein determining the metabolic potential of the cell sample comprises (i) providing the initial oxygen consumption rate, the initial extracellular acidification rate, the subsequent oxygen consumption rate, and the subsequent extracellular acidification rate to a software program, and (ii) using the software program to calculate the metabolic potential.
Priority Applications (1)
| Application Number | Priority Date | Filing Date | Title |
|---|---|---|---|
| EP22150034.1A EP4009048B1 (en) | 2015-03-27 | 2016-03-28 | Method and system for determining integrated metabolic baseline and potential of living cells |
Applications Claiming Priority (3)
| Application Number | Priority Date | Filing Date | Title |
|---|---|---|---|
| US201562139432P | 2015-03-27 | 2015-03-27 | |
| EP16773926.7A EP3274713B1 (en) | 2015-03-27 | 2016-03-28 | Method and system for determining integrated metabolic baseline and potential of living cells |
| PCT/US2016/024514 WO2016160702A1 (en) | 2015-03-27 | 2016-03-28 | Method and system for determining integrated metabolic baseline and potential of living cells |
Related Parent Applications (2)
| Application Number | Title | Priority Date | Filing Date |
|---|---|---|---|
| EP16773926.7A Division EP3274713B1 (en) | 2015-03-27 | 2016-03-28 | Method and system for determining integrated metabolic baseline and potential of living cells |
| EP16773926.7A Division-Into EP3274713B1 (en) | 2015-03-27 | 2016-03-28 | Method and system for determining integrated metabolic baseline and potential of living cells |
Related Child Applications (2)
| Application Number | Title | Priority Date | Filing Date |
|---|---|---|---|
| EP22150034.1A Division-Into EP4009048B1 (en) | 2015-03-27 | 2016-03-28 | Method and system for determining integrated metabolic baseline and potential of living cells |
| EP22150034.1A Division EP4009048B1 (en) | 2015-03-27 | 2016-03-28 | Method and system for determining integrated metabolic baseline and potential of living cells |
Publications (2)
| Publication Number | Publication Date |
|---|---|
| EP3693737A1 EP3693737A1 (en) | 2020-08-12 |
| EP3693737B1 true EP3693737B1 (en) | 2022-03-30 |
Family
ID=56974931
Family Applications (3)
| Application Number | Title | Priority Date | Filing Date |
|---|---|---|---|
| EP16773926.7A Active EP3274713B1 (en) | 2015-03-27 | 2016-03-28 | Method and system for determining integrated metabolic baseline and potential of living cells |
| EP20150661.5A Active EP3693737B1 (en) | 2015-03-27 | 2016-03-28 | Method and system for determining integrated metabolic baseline and potential of living cells |
| EP22150034.1A Active EP4009048B1 (en) | 2015-03-27 | 2016-03-28 | Method and system for determining integrated metabolic baseline and potential of living cells |
Family Applications Before (1)
| Application Number | Title | Priority Date | Filing Date |
|---|---|---|---|
| EP16773926.7A Active EP3274713B1 (en) | 2015-03-27 | 2016-03-28 | Method and system for determining integrated metabolic baseline and potential of living cells |
Family Applications After (1)
| Application Number | Title | Priority Date | Filing Date |
|---|---|---|---|
| EP22150034.1A Active EP4009048B1 (en) | 2015-03-27 | 2016-03-28 | Method and system for determining integrated metabolic baseline and potential of living cells |
Country Status (8)
| Country | Link |
|---|---|
| US (3) | US20160281049A1 (en) |
| EP (3) | EP3274713B1 (en) |
| JP (1) | JP7109190B2 (en) |
| KR (1) | KR102520441B1 (en) |
| CN (1) | CN107430055B (en) |
| AU (1) | AU2016243147B2 (en) |
| CA (1) | CA2979705C (en) |
| WO (1) | WO2016160702A1 (en) |
Families Citing this family (35)
| Publication number | Priority date | Publication date | Assignee | Title |
|---|---|---|---|---|
| JP7109190B2 (en) | 2015-03-27 | 2022-07-29 | アジレント・テクノロジーズ・インク | Methods and systems for determining the integrated metabolic baseline and metabolic capacity of living cells |
| US11709156B2 (en) | 2017-09-18 | 2023-07-25 | Waters Technologies Corporation | Use of vapor deposition coated flow paths for improved analytical analysis |
| US12180581B2 (en) | 2017-09-18 | 2024-12-31 | Waters Technologies Corporation | Use of vapor deposition coated flow paths for improved chromatography of metal interacting analytes |
| US12181452B2 (en) | 2017-09-18 | 2024-12-31 | Waters Technologies Corporation | Use of vapor deposition coated flow paths for improved chromatography of metal interacting analytes |
| US11709155B2 (en) | 2017-09-18 | 2023-07-25 | Waters Technologies Corporation | Use of vapor deposition coated flow paths for improved chromatography of metal interacting analytes |
| CN108434144A (en) * | 2018-02-09 | 2018-08-24 | 哈尔滨医科大学 | A kind of novel AMPK activator and its application in anti-diabetic, reducing blood lipid, liver fat and antiatherosclerosis |
| CN112219156B (en) | 2018-06-29 | 2023-03-24 | 豪雅镜片泰国有限公司 | Glasses lens |
| US11947191B2 (en) | 2018-06-29 | 2024-04-02 | Hoya Lens Thailand, Ltd. | Eyeglass lens |
| JP7213246B2 (en) | 2018-06-29 | 2023-01-26 | ホヤ レンズ タイランド リミテッド | spectacle lenses |
| JP7213090B2 (en) | 2018-12-28 | 2023-01-26 | ホヤ レンズ タイランド リミテッド | Evaluation method of spectacle lenses |
| KR20210151842A (en) * | 2019-04-15 | 2021-12-14 | 엥스띠뛰 나씨오날 드 라 쌍떼 에 드 라 흐쉐르슈 메디깔 (인쎄름) | Methods for Profiling the Active Metabolism of a Population of Cells |
| CN110517776B (en) * | 2019-08-16 | 2023-06-16 | 四川大学华西医院 | Old people health risk assessment method and application thereof |
| JP7232927B2 (en) | 2019-09-25 | 2023-03-03 | ホヤ レンズ タイランド リミテッド | Spectacle lens and manufacturing method thereof |
| JP7350588B2 (en) | 2019-09-26 | 2023-09-26 | ホヤ レンズ タイランド リミテッド | ophthalmic lenses |
| JP7256100B2 (en) | 2019-09-26 | 2023-04-11 | ホヤ レンズ タイランド リミテッド | ophthalmic lens |
| WO2021131454A1 (en) | 2019-12-27 | 2021-07-01 | ホヤ レンズ タイランド リミテッド | Spectacle lens |
| US11918936B2 (en) | 2020-01-17 | 2024-03-05 | Waters Technologies Corporation | Performance and dynamic range for oligonucleotide bioanalysis through reduction of non specific binding |
| JP7488328B2 (en) | 2020-03-09 | 2024-05-21 | ホヤ レンズ タイランド リミテッド | Eyeglass lenses |
| CN114930229B (en) | 2020-03-17 | 2024-08-27 | 豪雅镜片泰国有限公司 | Spectacle lens |
| TWI856237B (en) | 2020-05-14 | 2024-09-21 | 泰國商豪雅鏡片泰國有限公司 | Spectacle lens |
| CN111909981A (en) * | 2020-07-23 | 2020-11-10 | 赛济检验认证中心有限责任公司 | Metabolism level-based dry cell quality control and evaluation method |
| JP7541882B2 (en) | 2020-09-18 | 2024-08-29 | ホヤ レンズ タイランド リミテッド | Eyeglass lenses and their design method |
| EP4628889A3 (en) | 2020-09-24 | 2025-12-10 | Waters Technologies Corporation | Chromatographic hardware improvements for the separation of reactive molecules |
| JP7716203B2 (en) | 2021-03-08 | 2025-07-31 | ホヤ レンズ タイランド リミテッド | Eyeglass lenses and their design methods |
| JP7787644B2 (en) | 2021-03-22 | 2025-12-17 | ホヤ レンズ タイランド リミテッド | Eyeglass lens and method for designing an eyeglass lens |
| US20240184141A1 (en) | 2021-03-31 | 2024-06-06 | Hoya Lens Thailand Ltd. | Method for manufacturing spectacle lens, and spectacle lens |
| JPWO2022209795A1 (en) | 2021-03-31 | 2022-10-06 | ||
| JP7842543B2 (en) | 2021-09-15 | 2026-04-08 | ホヤ レンズ タイランド リミテッド | Eyeglass lenses |
| JP7177959B1 (en) | 2021-09-15 | 2022-11-24 | ホヤ レンズ タイランド リミテッド | spectacle lenses |
| WO2023064752A1 (en) * | 2021-10-12 | 2023-04-20 | Agilent Technologies, Inc. | Methods and systems for determining metabolic poise and capacity of living cells |
| JP7775068B2 (en) | 2021-12-21 | 2025-11-25 | ホヤ レンズ タイランド リミテッド | Eyeglass lens and method for designing an eyeglass lens |
| JP7818690B2 (en) | 2022-03-03 | 2026-02-20 | ホヤ レンズ タイランド リミテッド | Spectacle lenses, spectacle lens manufacturing method, spectacle lens design method, eyeglasses and spectacle lens manufacturing method |
| EP4245839A1 (en) | 2022-03-14 | 2023-09-20 | Fluigent | Method for monitoring at least one substance produced or consumed by a living entity |
| CA3257116A1 (en) | 2022-07-19 | 2025-04-14 | Hoya Lens Thailand Ltd. | Method for designing spectacle lens, method for manufacturing spectacle lens, spectacle lens, and eyeglasses |
| EP4560385A1 (en) | 2022-07-19 | 2025-05-28 | Hoya Lens Thailand Ltd. | Method for designing spectacle lens, method for manufacturing spectacle lens, spectacle lens, and spectacles |
Family Cites Families (7)
| Publication number | Priority date | Publication date | Assignee | Title |
|---|---|---|---|---|
| US7276351B2 (en) | 2003-09-10 | 2007-10-02 | Seahorse Bioscience | Method and device for measuring multiple physiological properties of cells |
| US20070087401A1 (en) * | 2003-10-17 | 2007-04-19 | Andy Neilson | Analysis of metabolic activity in cells using extracellular flux rate measurements |
| US8658349B2 (en) | 2006-07-13 | 2014-02-25 | Seahorse Bioscience | Cell analysis apparatus and method |
| WO2012016018A1 (en) * | 2010-07-28 | 2012-02-02 | Vdf Futureceuticals, Inc. | Compositions and methods for improvement of oxygen metabolism and cytokine regulation |
| US8759097B2 (en) * | 2011-04-19 | 2014-06-24 | University of Pittsburgh—of the Commonwealth System of Higher Eduction | Inhibition of dynamin related protein 1 to promote cell death |
| EP2904391B1 (en) * | 2012-10-05 | 2018-01-17 | Neurovive Pharmaceutical AB | Mitochondrial toxicity test |
| JP7109190B2 (en) | 2015-03-27 | 2022-07-29 | アジレント・テクノロジーズ・インク | Methods and systems for determining the integrated metabolic baseline and metabolic capacity of living cells |
-
2016
- 2016-03-28 JP JP2017550228A patent/JP7109190B2/en active Active
- 2016-03-28 US US15/082,658 patent/US20160281049A1/en not_active Abandoned
- 2016-03-28 EP EP16773926.7A patent/EP3274713B1/en active Active
- 2016-03-28 WO PCT/US2016/024514 patent/WO2016160702A1/en not_active Ceased
- 2016-03-28 KR KR1020177030590A patent/KR102520441B1/en active Active
- 2016-03-28 CN CN201680018668.6A patent/CN107430055B/en active Active
- 2016-03-28 EP EP20150661.5A patent/EP3693737B1/en active Active
- 2016-03-28 EP EP22150034.1A patent/EP4009048B1/en active Active
- 2016-03-28 AU AU2016243147A patent/AU2016243147B2/en active Active
- 2016-03-28 CA CA2979705A patent/CA2979705C/en active Active
-
2020
- 2020-06-30 US US16/917,352 patent/US11940442B2/en active Active
-
2024
- 2024-03-19 US US18/609,912 patent/US20240302355A1/en active Pending
Also Published As
| Publication number | Publication date |
|---|---|
| KR20170131567A (en) | 2017-11-29 |
| WO2016160702A1 (en) | 2016-10-06 |
| US20200333327A1 (en) | 2020-10-22 |
| US20240302355A1 (en) | 2024-09-12 |
| EP3693737A1 (en) | 2020-08-12 |
| EP3274713A1 (en) | 2018-01-31 |
| KR102520441B1 (en) | 2023-04-10 |
| EP3274713B1 (en) | 2020-02-19 |
| AU2016243147B2 (en) | 2021-09-02 |
| CN107430055A (en) | 2017-12-01 |
| CN107430055B (en) | 2020-10-30 |
| EP4009048B1 (en) | 2024-11-06 |
| CA2979705A1 (en) | 2016-10-06 |
| JP2018509170A (en) | 2018-04-05 |
| EP4009048A1 (en) | 2022-06-08 |
| JP7109190B2 (en) | 2022-07-29 |
| US11940442B2 (en) | 2024-03-26 |
| EP3274713A4 (en) | 2018-08-15 |
| US20160281049A1 (en) | 2016-09-29 |
| CA2979705C (en) | 2023-03-28 |
| AU2016243147A1 (en) | 2017-10-12 |
Similar Documents
| Publication | Publication Date | Title |
|---|---|---|
| US20240302355A1 (en) | Method and system for determining integrated metabolic baseline and potential of living cells | |
| Divakaruni et al. | A practical guide for the analysis, standardization and interpretation of oxygen consumption measurements | |
| Yoo et al. | Extracellular flux assay (Seahorse assay): Diverse applications in metabolic research across biological disciplines | |
| Zhang et al. | Measuring energy metabolism in cultured cells, including human pluripotent stem cells and differentiated cells | |
| Hertig et al. | Live monitoring of cellular metabolism and mitochondrial respiration in 3D cell culture system using NMR spectroscopy | |
| Shestov et al. | 13C MRS and LC–MS flux analysis of tumor intermediary metabolism | |
| EP3023489B1 (en) | Componential analyzer, drug efficacy analyzer, and analysis method | |
| Zhao et al. | Technical applications of microelectrode array and patch clamp recordings on human induced pluripotent stem cell-derived cardiomyocytes | |
| Gravel et al. | Metabolomics analyses of cancer cells in controlled microenvironments | |
| Zhang et al. | Enhancing the functional maturity of hiPSC-derived cardiomyocytes to assess inotropic compounds | |
| Wong et al. | Metabolic and transcriptional patterns accompanying glutamine depletion and repletion in mouse hepatoma cells: a model for physiological regulatory networks | |
| Zunica et al. | Analytical determination of mitochondrial function of excised solid tumor homogenates | |
| Park et al. | Human induced pluripotent stem cell-cardiomyocytes for cardiotoxicity assessment: a comparative study of arrhythmia-inducing drugs with multi-electrode array analysis | |
| Coltman et al. | Exploring mitochondrial energy metabolism of single 3D microtissue spheroids using extracellular flux analysis | |
| Hlozková et al. | Assessment of the metabolic profile of primary leukemia cells | |
| US20230128888A1 (en) | Methods and systems for determining metabolic poise and capacity of living cells | |
| Irigoyen et al. | High-resolution respirometry to assess mitochondrial function in human spermatozoa | |
| Baeza-Lehnert et al. | Two-Point Calibration Protocol for the FRET Indicator Pyronic in Neurons | |
| Seibertz et al. | A modular method for high-throughput measurement of ion channel currents in cardiac myocytes | |
| Baeza-Lehnert et al. | Two-point calibration protocol for the Förster Resonance Energy Transfer indicator Pyronic in neurons | |
| Brault et al. | High throughput, automated and fully contained cytokine release assay using primary human CD4+ T cells | |
| Das et al. | Investigating Glycolysis in Primary Microglia Using Extracellular Flux Assay | |
| Wang et al. | Large-scale proteome inference from unpaired single-cell transcriptomic and proteomic data by msInfer | |
| Taslimifar et al. | Quantification of Amino Acid Transporter Interactions | |
| Fogel et al. | Application of imaging-based assays in microplate formats for high-content screening |
Legal Events
| Date | Code | Title | Description |
|---|---|---|---|
| PUAI | Public reference made under article 153(3) epc to a published international application that has entered the european phase |
Free format text: ORIGINAL CODE: 0009012 |
|
| STAA | Information on the status of an ep patent application or granted ep patent |
Free format text: STATUS: REQUEST FOR EXAMINATION WAS MADE |
|
| 17P | Request for examination filed |
Effective date: 20200108 |
|
| AC | Divisional application: reference to earlier application |
Ref document number: 3274713 Country of ref document: EP Kind code of ref document: P |
|
| AK | Designated contracting states |
Kind code of ref document: A1 Designated state(s): AL AT BE BG CH CY CZ DE DK EE ES FI FR GB GR HR HU IE IS IT LI LT LU LV MC MK MT NL NO PL PT RO RS SE SI SK SM TR |
|
| GRAP | Despatch of communication of intention to grant a patent |
Free format text: ORIGINAL CODE: EPIDOSNIGR1 |
|
| STAA | Information on the status of an ep patent application or granted ep patent |
Free format text: STATUS: GRANT OF PATENT IS INTENDED |
|
| GRAJ | Information related to disapproval of communication of intention to grant by the applicant or resumption of examination proceedings by the epo deleted |
Free format text: ORIGINAL CODE: EPIDOSDIGR1 |
|
| STAA | Information on the status of an ep patent application or granted ep patent |
Free format text: STATUS: REQUEST FOR EXAMINATION WAS MADE |
|
| INTG | Intention to grant announced |
Effective date: 20210623 |
|
| STAA | Information on the status of an ep patent application or granted ep patent |
Free format text: STATUS: EXAMINATION IS IN PROGRESS |
|
| INTC | Intention to grant announced (deleted) | ||
| 17Q | First examination report despatched |
Effective date: 20210726 |
|
| GRAP | Despatch of communication of intention to grant a patent |
Free format text: ORIGINAL CODE: EPIDOSNIGR1 |
|
| STAA | Information on the status of an ep patent application or granted ep patent |
Free format text: STATUS: GRANT OF PATENT IS INTENDED |
|
| INTG | Intention to grant announced |
Effective date: 20211104 |
|
| GRAS | Grant fee paid |
Free format text: ORIGINAL CODE: EPIDOSNIGR3 |
|
| GRAA | (expected) grant |
Free format text: ORIGINAL CODE: 0009210 |
|
| STAA | Information on the status of an ep patent application or granted ep patent |
Free format text: STATUS: THE PATENT HAS BEEN GRANTED |
|
| AC | Divisional application: reference to earlier application |
Ref document number: 3274713 Country of ref document: EP Kind code of ref document: P |
|
| AK | Designated contracting states |
Kind code of ref document: B1 Designated state(s): AL AT BE BG CH CY CZ DE DK EE ES FI FR GB GR HR HU IE IS IT LI LT LU LV MC MK MT NL NO PL PT RO RS SE SI SK SM TR |
|
| REG | Reference to a national code |
Ref country code: GB Ref legal event code: FG4D |
|
| REG | Reference to a national code |
Ref country code: CH Ref legal event code: EP |
|
| REG | Reference to a national code |
Ref country code: DE Ref legal event code: R096 Ref document number: 602016070669 Country of ref document: DE |
|
| REG | Reference to a national code |
Ref country code: AT Ref legal event code: REF Ref document number: 1479662 Country of ref document: AT Kind code of ref document: T Effective date: 20220415 |
|
| REG | Reference to a national code |
Ref country code: IE Ref legal event code: FG4D |
|
| REG | Reference to a national code |
Ref country code: NL Ref legal event code: FP |
|
| REG | Reference to a national code |
Ref country code: LT Ref legal event code: MG9D |
|
| PG25 | Lapsed in a contracting state [announced via postgrant information from national office to epo] |
Ref country code: SE Free format text: LAPSE BECAUSE OF FAILURE TO SUBMIT A TRANSLATION OF THE DESCRIPTION OR TO PAY THE FEE WITHIN THE PRESCRIBED TIME-LIMIT Effective date: 20220330 Ref country code: RS Free format text: LAPSE BECAUSE OF FAILURE TO SUBMIT A TRANSLATION OF THE DESCRIPTION OR TO PAY THE FEE WITHIN THE PRESCRIBED TIME-LIMIT Effective date: 20220330 Ref country code: NO Free format text: LAPSE BECAUSE OF FAILURE TO SUBMIT A TRANSLATION OF THE DESCRIPTION OR TO PAY THE FEE WITHIN THE PRESCRIBED TIME-LIMIT Effective date: 20220630 Ref country code: LT Free format text: LAPSE BECAUSE OF FAILURE TO SUBMIT A TRANSLATION OF THE DESCRIPTION OR TO PAY THE FEE WITHIN THE PRESCRIBED TIME-LIMIT Effective date: 20220330 Ref country code: HR Free format text: LAPSE BECAUSE OF FAILURE TO SUBMIT A TRANSLATION OF THE DESCRIPTION OR TO PAY THE FEE WITHIN THE PRESCRIBED TIME-LIMIT Effective date: 20220330 Ref country code: BG Free format text: LAPSE BECAUSE OF FAILURE TO SUBMIT A TRANSLATION OF THE DESCRIPTION OR TO PAY THE FEE WITHIN THE PRESCRIBED TIME-LIMIT Effective date: 20220630 |
|
| PG25 | Lapsed in a contracting state [announced via postgrant information from national office to epo] |
Ref country code: LV Free format text: LAPSE BECAUSE OF FAILURE TO SUBMIT A TRANSLATION OF THE DESCRIPTION OR TO PAY THE FEE WITHIN THE PRESCRIBED TIME-LIMIT Effective date: 20220330 Ref country code: GR Free format text: LAPSE BECAUSE OF FAILURE TO SUBMIT A TRANSLATION OF THE DESCRIPTION OR TO PAY THE FEE WITHIN THE PRESCRIBED TIME-LIMIT Effective date: 20220701 Ref country code: FI Free format text: LAPSE BECAUSE OF FAILURE TO SUBMIT A TRANSLATION OF THE DESCRIPTION OR TO PAY THE FEE WITHIN THE PRESCRIBED TIME-LIMIT Effective date: 20220330 |
|
| PG25 | Lapsed in a contracting state [announced via postgrant information from national office to epo] |
Ref country code: SM Free format text: LAPSE BECAUSE OF FAILURE TO SUBMIT A TRANSLATION OF THE DESCRIPTION OR TO PAY THE FEE WITHIN THE PRESCRIBED TIME-LIMIT Effective date: 20220330 Ref country code: SK Free format text: LAPSE BECAUSE OF FAILURE TO SUBMIT A TRANSLATION OF THE DESCRIPTION OR TO PAY THE FEE WITHIN THE PRESCRIBED TIME-LIMIT Effective date: 20220330 Ref country code: RO Free format text: LAPSE BECAUSE OF FAILURE TO SUBMIT A TRANSLATION OF THE DESCRIPTION OR TO PAY THE FEE WITHIN THE PRESCRIBED TIME-LIMIT Effective date: 20220330 Ref country code: PT Free format text: LAPSE BECAUSE OF FAILURE TO SUBMIT A TRANSLATION OF THE DESCRIPTION OR TO PAY THE FEE WITHIN THE PRESCRIBED TIME-LIMIT Effective date: 20220801 Ref country code: ES Free format text: LAPSE BECAUSE OF FAILURE TO SUBMIT A TRANSLATION OF THE DESCRIPTION OR TO PAY THE FEE WITHIN THE PRESCRIBED TIME-LIMIT Effective date: 20220330 Ref country code: EE Free format text: LAPSE BECAUSE OF FAILURE TO SUBMIT A TRANSLATION OF THE DESCRIPTION OR TO PAY THE FEE WITHIN THE PRESCRIBED TIME-LIMIT Effective date: 20220330 Ref country code: CZ Free format text: LAPSE BECAUSE OF FAILURE TO SUBMIT A TRANSLATION OF THE DESCRIPTION OR TO PAY THE FEE WITHIN THE PRESCRIBED TIME-LIMIT Effective date: 20220330 |
|
| PG25 | Lapsed in a contracting state [announced via postgrant information from national office to epo] |
Ref country code: PL Free format text: LAPSE BECAUSE OF FAILURE TO SUBMIT A TRANSLATION OF THE DESCRIPTION OR TO PAY THE FEE WITHIN THE PRESCRIBED TIME-LIMIT Effective date: 20220330 Ref country code: IS Free format text: LAPSE BECAUSE OF FAILURE TO SUBMIT A TRANSLATION OF THE DESCRIPTION OR TO PAY THE FEE WITHIN THE PRESCRIBED TIME-LIMIT Effective date: 20220730 Ref country code: AL Free format text: LAPSE BECAUSE OF FAILURE TO SUBMIT A TRANSLATION OF THE DESCRIPTION OR TO PAY THE FEE WITHIN THE PRESCRIBED TIME-LIMIT Effective date: 20220330 |
|
| REG | Reference to a national code |
Ref country code: DE Ref legal event code: R097 Ref document number: 602016070669 Country of ref document: DE |
|
| PG25 | Lapsed in a contracting state [announced via postgrant information from national office to epo] |
Ref country code: DK Free format text: LAPSE BECAUSE OF FAILURE TO SUBMIT A TRANSLATION OF THE DESCRIPTION OR TO PAY THE FEE WITHIN THE PRESCRIBED TIME-LIMIT Effective date: 20220330 |
|
| PLBE | No opposition filed within time limit |
Free format text: ORIGINAL CODE: 0009261 |
|
| STAA | Information on the status of an ep patent application or granted ep patent |
Free format text: STATUS: NO OPPOSITION FILED WITHIN TIME LIMIT |
|
| 26N | No opposition filed |
Effective date: 20230103 |
|
| PG25 | Lapsed in a contracting state [announced via postgrant information from national office to epo] |
Ref country code: SI Free format text: LAPSE BECAUSE OF FAILURE TO SUBMIT A TRANSLATION OF THE DESCRIPTION OR TO PAY THE FEE WITHIN THE PRESCRIBED TIME-LIMIT Effective date: 20220330 |
|
| P01 | Opt-out of the competence of the unified patent court (upc) registered |
Effective date: 20230527 |
|
| REG | Reference to a national code |
Ref country code: AT Ref legal event code: UEP Ref document number: 1479662 Country of ref document: AT Kind code of ref document: T Effective date: 20220330 |
|
| PG25 | Lapsed in a contracting state [announced via postgrant information from national office to epo] |
Ref country code: MC Free format text: LAPSE BECAUSE OF FAILURE TO SUBMIT A TRANSLATION OF THE DESCRIPTION OR TO PAY THE FEE WITHIN THE PRESCRIBED TIME-LIMIT Effective date: 20220330 |
|
| REG | Reference to a national code |
Ref country code: BE Ref legal event code: MM Effective date: 20230331 |
|
| PG25 | Lapsed in a contracting state [announced via postgrant information from national office to epo] |
Ref country code: LU Free format text: LAPSE BECAUSE OF NON-PAYMENT OF DUE FEES Effective date: 20230328 |
|
| REG | Reference to a national code |
Ref country code: IE Ref legal event code: MM4A |
|
| PG25 | Lapsed in a contracting state [announced via postgrant information from national office to epo] |
Ref country code: IE Free format text: LAPSE BECAUSE OF NON-PAYMENT OF DUE FEES Effective date: 20230328 |
|
| PG25 | Lapsed in a contracting state [announced via postgrant information from national office to epo] |
Ref country code: BE Free format text: LAPSE BECAUSE OF NON-PAYMENT OF DUE FEES Effective date: 20230331 |
|
| PGFP | Annual fee paid to national office [announced via postgrant information from national office to epo] |
Ref country code: CH Payment date: 20250401 Year of fee payment: 10 |
|
| PG25 | Lapsed in a contracting state [announced via postgrant information from national office to epo] |
Ref country code: CY Free format text: LAPSE BECAUSE OF FAILURE TO SUBMIT A TRANSLATION OF THE DESCRIPTION OR TO PAY THE FEE WITHIN THE PRESCRIBED TIME-LIMIT; INVALID AB INITIO Effective date: 20160328 |
|
| PG25 | Lapsed in a contracting state [announced via postgrant information from national office to epo] |
Ref country code: HU Free format text: LAPSE BECAUSE OF FAILURE TO SUBMIT A TRANSLATION OF THE DESCRIPTION OR TO PAY THE FEE WITHIN THE PRESCRIBED TIME-LIMIT; INVALID AB INITIO Effective date: 20160328 |
|
| PG25 | Lapsed in a contracting state [announced via postgrant information from national office to epo] |
Ref country code: TR Free format text: LAPSE BECAUSE OF FAILURE TO SUBMIT A TRANSLATION OF THE DESCRIPTION OR TO PAY THE FEE WITHIN THE PRESCRIBED TIME-LIMIT Effective date: 20220330 |
|
| PGFP | Annual fee paid to national office [announced via postgrant information from national office to epo] |
Ref country code: NL Payment date: 20260213 Year of fee payment: 11 |
|
| REG | Reference to a national code |
Ref country code: CH Ref legal event code: U11 Free format text: ST27 STATUS EVENT CODE: U-0-0-U10-U11 (AS PROVIDED BY THE NATIONAL OFFICE) Effective date: 20260401 |
|
| PGFP | Annual fee paid to national office [announced via postgrant information from national office to epo] |
Ref country code: GB Payment date: 20260209 Year of fee payment: 11 |
|
| PGFP | Annual fee paid to national office [announced via postgrant information from national office to epo] |
Ref country code: DE Payment date: 20260204 Year of fee payment: 11 |
|
| PGFP | Annual fee paid to national office [announced via postgrant information from national office to epo] |
Ref country code: AT Payment date: 20260225 Year of fee payment: 11 |
|
| PGFP | Annual fee paid to national office [announced via postgrant information from national office to epo] |
Ref country code: IT Payment date: 20260220 Year of fee payment: 11 |
|
| PGFP | Annual fee paid to national office [announced via postgrant information from national office to epo] |
Ref country code: FR Payment date: 20260209 Year of fee payment: 11 |