EP3685205B1 - Imaging of a sample through a scattering medium - Google Patents
Imaging of a sample through a scattering medium Download PDFInfo
- Publication number
- EP3685205B1 EP3685205B1 EP18778985.4A EP18778985A EP3685205B1 EP 3685205 B1 EP3685205 B1 EP 3685205B1 EP 18778985 A EP18778985 A EP 18778985A EP 3685205 B1 EP3685205 B1 EP 3685205B1
- Authority
- EP
- European Patent Office
- Prior art keywords
- sample
- electromagnetic radiation
- surface region
- spatial
- sub
- Prior art date
- Legal status (The legal status is an assumption and is not a legal conclusion. Google has not performed a legal analysis and makes no representation as to the accuracy of the status listed.)
- Active
Links
Images






Classifications
-
- G—PHYSICS
- G02—OPTICS
- G02B—OPTICAL ELEMENTS, SYSTEMS OR APPARATUS
- G02B21/00—Microscopes
- G02B21/36—Microscopes arranged for photographic purposes or projection purposes or digital imaging or video purposes including associated control and data processing arrangements
- G02B21/365—Control or image processing arrangements for digital or video microscopes
- G02B21/367—Control or image processing arrangements for digital or video microscopes providing an output produced by processing a plurality of individual source images, e.g. image tiling, montage, composite images, depth sectioning, image comparison
-
- G—PHYSICS
- G01—MEASURING; TESTING
- G01N—INVESTIGATING OR ANALYSING MATERIALS BY DETERMINING THEIR CHEMICAL OR PHYSICAL PROPERTIES
- G01N21/00—Investigating or analysing materials by the use of optical means, i.e. using sub-millimetre waves, infrared, visible or ultraviolet light
- G01N21/17—Systems in which incident light is modified in accordance with the properties of the material investigated
- G01N21/1717—Systems in which incident light is modified in accordance with the properties of the material investigated with a modulation of one or more physical properties of the sample during the optical investigation, e.g. electro-reflectance
-
- G—PHYSICS
- G01—MEASURING; TESTING
- G01N—INVESTIGATING OR ANALYSING MATERIALS BY DETERMINING THEIR CHEMICAL OR PHYSICAL PROPERTIES
- G01N21/00—Investigating or analysing materials by the use of optical means, i.e. using sub-millimetre waves, infrared, visible or ultraviolet light
- G01N21/17—Systems in which incident light is modified in accordance with the properties of the material investigated
- G01N21/47—Scattering, i.e. diffuse reflection
- G01N21/4795—Scattering, i.e. diffuse reflection spatially resolved investigating of object in scattering medium
-
- G—PHYSICS
- G01—MEASURING; TESTING
- G01N—INVESTIGATING OR ANALYSING MATERIALS BY DETERMINING THEIR CHEMICAL OR PHYSICAL PROPERTIES
- G01N21/00—Investigating or analysing materials by the use of optical means, i.e. using sub-millimetre waves, infrared, visible or ultraviolet light
- G01N21/62—Systems in which the material investigated is excited whereby it emits light or causes a change in wavelength of the incident light
- G01N21/63—Systems in which the material investigated is excited whereby it emits light or causes a change in wavelength of the incident light optically excited
- G01N21/64—Fluorescence; Phosphorescence
- G01N21/645—Specially adapted constructive features of fluorimeters
- G01N21/6456—Spatial resolved fluorescence measurements; Imaging
-
- G—PHYSICS
- G01—MEASURING; TESTING
- G01N—INVESTIGATING OR ANALYSING MATERIALS BY DETERMINING THEIR CHEMICAL OR PHYSICAL PROPERTIES
- G01N21/00—Investigating or analysing materials by the use of optical means, i.e. using sub-millimetre waves, infrared, visible or ultraviolet light
- G01N21/62—Systems in which the material investigated is excited whereby it emits light or causes a change in wavelength of the incident light
- G01N21/63—Systems in which the material investigated is excited whereby it emits light or causes a change in wavelength of the incident light optically excited
- G01N21/64—Fluorescence; Phosphorescence
- G01N21/645—Specially adapted constructive features of fluorimeters
- G01N21/6456—Spatial resolved fluorescence measurements; Imaging
- G01N21/6458—Fluorescence microscopy
-
- G—PHYSICS
- G02—OPTICS
- G02B—OPTICAL ELEMENTS, SYSTEMS OR APPARATUS
- G02B21/00—Microscopes
- G02B21/0004—Microscopes specially adapted for specific applications
- G02B21/002—Scanning microscopes
- G02B21/0024—Confocal scanning microscopes (CSOMs) or confocal "macroscopes"; Accessories which are not restricted to use with CSOMs, e.g. sample holders
- G02B21/0032—Optical details of illumination, e.g. light-sources, pinholes, beam splitters, slits, fibers
-
- G—PHYSICS
- G02—OPTICS
- G02B—OPTICAL ELEMENTS, SYSTEMS OR APPARATUS
- G02B21/00—Microscopes
- G02B21/0004—Microscopes specially adapted for specific applications
- G02B21/002—Scanning microscopes
- G02B21/0024—Confocal scanning microscopes (CSOMs) or confocal "macroscopes"; Accessories which are not restricted to use with CSOMs, e.g. sample holders
- G02B21/0052—Optical details of the image generation
- G02B21/0076—Optical details of the image generation arrangements using fluorescence or luminescence
-
- G—PHYSICS
- G02—OPTICS
- G02B—OPTICAL ELEMENTS, SYSTEMS OR APPARATUS
- G02B21/00—Microscopes
- G02B21/0004—Microscopes specially adapted for specific applications
- G02B21/002—Scanning microscopes
- G02B21/0024—Confocal scanning microscopes (CSOMs) or confocal "macroscopes"; Accessories which are not restricted to use with CSOMs, e.g. sample holders
- G02B21/008—Details of detection or image processing, including general computer control
-
- G—PHYSICS
- G02—OPTICS
- G02B—OPTICAL ELEMENTS, SYSTEMS OR APPARATUS
- G02B21/00—Microscopes
- G02B21/16—Microscopes adapted for ultraviolet illumination ; Fluorescence microscopes
Definitions
- Such a method may allow imaging of a sample through a scattering medium, or imaging of a sub-surface region of a sample through a scattering surface region of the sample, without any aberration correction, without any a priori knowledge of the scattering medium or scattering surface region of the sample, and without any requirement to determine a priori any information about the scattering medium or the scattering surface region of the sample.
- Such a method may allow imaging of a sample through a scattering medium, or imaging of a sub-surface region of a sample through a scattering surface region of the sample, without reference to the spatial origin of the emitted electromagnetic radiation.
- the plurality of spatial patterns of incident electromagnetic radiation may comprise a set of mutually complementary spatial radiation patterns.
- the plurality of spatial patterns of incident electromagnetic radiation may comprise a set of pairs of inverse spatial radiation patterns.
- the plurality of spatial patterns of incident electromagnetic radiation may comprise an orthonormal basis set of spatial radiation patterns.
- the plurality of spatial patterns of incident electromagnetic radiation may comprise a subset of a full orthonormal basis set of spatial radiation patterns.
- the plurality of spatial patterns of incident electromagnetic radiation may comprise a plurality of binary spatial radiation patterns.
- the plurality of spatial patterns of incident electromagnetic radiation may comprise a set of Hadamard radiation patterns.
- the plurality of spatial patterns of incident electromagnetic radiation may comprise Hermite-Gaussian modes, Laguerre-Gaussian modes, Bessel modes or eigenmodes such as optical eigenmodes.
- the plurality of spatial patterns of incident electromagnetic radiation may comprise a plurality of sinusoidal spatial radiation patterns, wherein each sinusoidal spatial radiation pattern has a different spatial frequency.
- the plurality of spatial patterns of incident electromagnetic radiation may comprise a plurality of harmonic sinusoidal spatial radiation patterns.
- the number of sinusoidal spatial radiation patterns may be equal to a number of pixels required in the final image to be constructed.
- the plurality of spatial patterns of incident electromagnetic radiation may comprise a number N of phase-shifting sinusoidal radiation patterns for each spatial frequency, wherein each phase-shifting sinusoidal radiation pattern has a phase shift of 2 ⁇ / N relative to an adjacent one of the phase-shifting sinusoidal radiation patterns.
- the plurality of spatial patterns of incident electromagnetic radiation may comprise four phase-shifting sinusoidal radiation patterns for each spatial frequency, wherein each phase-shifting sinusoidal radiation pattern has a phase shift of ⁇ /2 relative to an adjacent one of the phase-shifting sinusoidal radiation patterns.
- the plurality of spatial patterns of incident electromagnetic radiation may be selected or configured for imaging beyond the diffraction limit or for super-resolution imaging.
- Using the plurality of spatial patterns of incident electromagnetic radiation and the plurality of corresponding measured values to determine the image of the sample or the image of the sub-surface region of the sample may comprise using an image construction algorithm to construct the image of the sample or the sub-surface region of the sample from the plurality of spatial patterns of incident electromagnetic radiation and the plurality of corresponding measured values.
- Using the plurality of spatial patterns of incident electromagnetic radiation and the plurality of corresponding measured values to determine the image of the sample or the image of the sub-surface region of the sample may comprise using an orthogonal matching pursuit algorithm to construct the image of the sample or the sub-surface region of the sample from the plurality of spatial patterns of incident electromagnetic radiation and the plurality of corresponding measured values.
- Using the plurality of spatial patterns of incident electromagnetic radiation and the plurality of corresponding measured values to determine the image of the sample or the image of the sub-surface region of the sample may comprise using a conventional single-pixel imaging (SPI) algorithm such as a differential ghost imaging method, a gradient descent method, an alternating projection method, a sparse representation method, a total variation regularization method, a conjugate gradient descent method, a Poisson maximum likelihood method, or a Fourier spectrum acquisition method.
- SPI single-pixel imaging
- Using the plurality of spatial patterns of incident electromagnetic radiation and the plurality of corresponding measured values to determine the image of the sample or the image of the sub-surface region of the sample may comprise constructing the image of the sample or the image of the sub-surface region of the sample from the plurality of corresponding measured values using a compressive sensing algorithm e.g. using an algorithm equivalent to an algorithm used for JPEG image compression.
- a compressive sensing algorithm e.g. using an algorithm equivalent to an algorithm used for JPEG image compression.
- the method may use a range of algorithms. These can be classified into three categories according to the type of iteration they use. Examples are: (i) non-iterative methods; (ii) linear iterative methods; and (iii) non-linear iterative methods.
- the non-iterative methods are the fastest but require the most measurements.
- the non-linear iterative methods need the fewest measurements but take longer.
- Using the plurality of spatial patterns of incident electromagnetic radiation and the plurality of corresponding measured values to determine the image of the sample or the image of the sub-surface region of the sample may comprise determining an inverse Fourier transform of the plurality of measured values.
- the method may comprise using the plurality of spatial patterns of incident electromagnetic radiation and the plurality of corresponding measured values to determine the image of the sample or the image of the sub-surface region of the sample without measuring a spatial distribution of the emitted electromagnetic radiation.
- the method may comprise using the plurality of spatial patterns of incident electromagnetic radiation and the plurality of corresponding measured values to determine the image of the sample or the image of the sub-surface region of the sample without recording a spatial distribution of the emitted electromagnetic radiation.
- Measuring, for each spatial pattern of incident electromagnetic radiation, the corresponding value representative of a quantity of at least a portion of the emitted electromagnetic radiation may comprise using a single pixel detector to measure the power or the intensity of the emitted electromagnetic radiation which is incident on the single pixel detector.
- Using a single pixel detector may provide a higher sensitivity and/or a greater dynamic range than using a multi-pixel detector.
- the method may comprise a ghost Imaging method.
- the method may comprise illuminating the sample through the scattering medium or illuminating the sub-surface region of the sample through the scattering surface region of the sample using classical light.
- the method may comprise illuminating the sample through the scattering medium or illuminating the sub-surface region of the sample through the scattering surface region of the sample using one or more sources of light obeying non-classical (quantum) statistics.
- Using single pixel detection to measure, for each spatial pattern of incident electromagnetic radiation, the corresponding value representative of a quantity of at least a portion of the emitted electromagnetic radiation may comprise using single pixel detection to measure, for each spatial pattern of incident electromagnetic radiation, the power or the intensity of the emitted electromagnetic radiation incident on a single pixel of a multi-pixel detector such as an image sensor, or spatially integrating the power or the intensity of the emitted electromagnetic radiation incident on a plurality of the pixels of the multi-pixel detector.
- the method may comprise sequentially illuminating the sample through the scattering medium or sequentially illuminating the sub-surface region of the sample through the scattering surface region of the sample with the plurality of spatial patterns of incident electromagnetic radiation.
- the method may comprise:
- Such a method may allow imaging in an epi-detection configuration. Such a method may be particularly useful for microscopy.
- the method may comprise:
- the detection arrangement may be configured for measuring the emitted electromagnetic radiation generated by the sample without measuring a spatial distribution of the emitted electromagnetic radiation.
- the detection arrangement may comprise a single pixel detector for measuring the emitted electromagnetic radiation incident on the single pixel detector.
- the detection arrangement may comprise a multi-pixel detector having a plurality of pixels such as an image sensor, and wherein the detection arrangement is configured to measure the total emitted electromagnetic radiation incident on the plurality of the pixels.
- the emitted electromagnetic radiation may be generated as a result of Coherent Anti-Stokes Raman Scattering (CARS) by the sample.
- CARS Coherent Anti-Stokes Raman Scattering
Landscapes
- Physics & Mathematics (AREA)
- General Physics & Mathematics (AREA)
- Analytical Chemistry (AREA)
- Chemical & Material Sciences (AREA)
- Health & Medical Sciences (AREA)
- Optics & Photonics (AREA)
- Biochemistry (AREA)
- Pathology (AREA)
- Immunology (AREA)
- Life Sciences & Earth Sciences (AREA)
- General Health & Medical Sciences (AREA)
- Nuclear Medicine, Radiotherapy & Molecular Imaging (AREA)
- Engineering & Computer Science (AREA)
- Computer Vision & Pattern Recognition (AREA)
- Multimedia (AREA)
- General Engineering & Computer Science (AREA)
- Investigating, Analyzing Materials By Fluorescence Or Luminescence (AREA)
Description
- The present disclosure relates to a method and a system for use in imaging of a sample through a scattering medium, or for use in imaging a sub-surface region of a sample through a scattering surface region of the sample, and, in particular though not exclusively, for use in wide-field microscopy of a sample through a scattering medium, or a sub-surface region of a sample through a scattering surface region of the sample, in an epi-detection configuration without any aberration correction and/or without any requirement to determine a priori any information about the scattering medium or the scattering surface region of the sample.
- The confocal microscope has dominated imaging for several decades marking a step change in the way image formation is created, typically by point scanning. The emergence of multi-photon fluorescence imaging has added immense value to the field as the non-linear dependence of the sample signal on the input peak intensity has restricted information solely to the focal volume. However confocal and multi-photon fluorescence imaging in this form requires scanning of the excitation field and thus has an inherent limitation of speed of image acquisition which can be a roadblock for fast dynamics.
- In tandem with the requirement for rapidly acquiring a wide-field image, a challenge for all imaging is to deliver a field and recover a signal through a scattering or turbid medium such as tissue.
- O. D. Therrien et al. "Wide-field multiphoton imaging of cellular dynamics in thick tissue by temporal focusing and patterned illumination", Biomedical Optics Express, Vol. 2, No. 3, March 2011, page 696, discloses a technique that combines beam shaping and temporal focusing of amplified pulses (>1 µJ/pulse) for fast imaging of cells from the central nervous system in acute slices.
- Duran V. et al. "Compressive imaging in scattering media", Optics Express, Vol. 23, No. 11, 1 June 2015, page 14424, discloses a technique which combines structured incoherent illumination and bucket detection for imaging an absorbing object completely embedded in a scattering medium. A sequence of low-intensity microstructures light patterns is launched onto the object, whose image is accurately reconstructed through the light fluctuations measured by a single-pixel detector. The technique is non-invasive, does not require coherent sources, raster scanning nor time-gated detection and benefits from the compressive sensing strategy.
- It should be understood that any one or more of the features of any of the following aspects or embodiments may be combined with any one or more of the features of any of the other aspects or embodiments.
- According to an aspect of the present disclosure there is provided a method according to
claim 1. - Such a method may allow imaging of a sample through a scattering medium, or imaging of a sub-surface region of a sample through a scattering surface region of the sample, without any aberration correction, without any a priori knowledge of the scattering medium or scattering surface region of the sample, and without any requirement to determine a priori any information about the scattering medium or the scattering surface region of the sample. Such a method may allow imaging of a sample through a scattering medium, or imaging of a sub-surface region of a sample through a scattering surface region of the sample, without reference to the spatial origin of the emitted electromagnetic radiation.
- The plurality of spatial patterns of incident electromagnetic radiation may comprise a set of mutually complementary spatial radiation patterns. The plurality of spatial patterns of incident electromagnetic radiation may comprise a set of pairs of inverse spatial radiation patterns.
- The plurality of spatial patterns of incident electromagnetic radiation may comprise an orthonormal basis set of spatial radiation patterns.
- The plurality of spatial patterns of incident electromagnetic radiation may comprise a full orthonormal basis set of spatial radiation patterns.
- The plurality of spatial patterns of incident electromagnetic radiation may comprise a subset of a full orthonormal basis set of spatial radiation patterns.
- Use of a subset of a full orthonormal basis set of spatial radiation patterns may allow compressive imaging techniques to be employed and may, therefore, reduce measurement times and/or reduce the volume of measurement data compared with the use of a full orthonormal basis set of spatial radiation patterns.
- The plurality of spatial patterns of incident electromagnetic radiation may comprise a plurality of binary spatial radiation patterns.
- The plurality of spatial patterns of incident electromagnetic radiation may comprise a set of Hadamard radiation patterns.
- The plurality of spatial patterns of incident electromagnetic radiation may comprise Hermite-Gaussian modes, Laguerre-Gaussian modes, Bessel modes or eigenmodes such as optical eigenmodes.
- The plurality of spatial patterns of first electromagnetic radiation may comprise a plurality of greyscale spatial radiation patterns.
- The plurality of spatial patterns of incident electromagnetic radiation may comprise a plurality of sinusoidal spatial radiation patterns, wherein each sinusoidal spatial radiation pattern has a different spatial frequency. The plurality of spatial patterns of incident electromagnetic radiation may comprise a plurality of harmonic sinusoidal spatial radiation patterns. The number of sinusoidal spatial radiation patterns may be equal to a number of pixels required in the final image to be constructed.
- The plurality of spatial patterns of incident electromagnetic radiation may comprise a number N of phase-shifting sinusoidal radiation patterns for each spatial frequency, wherein each phase-shifting sinusoidal radiation pattern has a phase shift of 2π/N relative to an adjacent one of the phase-shifting sinusoidal radiation patterns. The plurality of spatial patterns of incident electromagnetic radiation may comprise four phase-shifting sinusoidal radiation patterns for each spatial frequency, wherein each phase-shifting sinusoidal radiation pattern has a phase shift of π/2 relative to an adjacent one of the phase-shifting sinusoidal radiation patterns.
- The plurality of spatial patterns of incident electromagnetic radiation may be selected or configured for imaging beyond the diffraction limit or for super-resolution imaging.
- Using the plurality of spatial patterns of incident electromagnetic radiation and the plurality of corresponding measured values to determine the image of the sample or the image of the sub-surface region of the sample may comprise using an image construction algorithm to construct the image of the sample or the sub-surface region of the sample from the plurality of spatial patterns of incident electromagnetic radiation and the plurality of corresponding measured values.
- Using the plurality of spatial patterns of incident electromagnetic radiation and the plurality of corresponding measured values to determine the image of the sample or the image of the sub-surface region of the sample may comprise using an orthogonal matching pursuit algorithm to construct the image of the sample or the sub-surface region of the sample from the plurality of spatial patterns of incident electromagnetic radiation and the plurality of corresponding measured values.
- Using the plurality of spatial patterns of incident electromagnetic radiation and the plurality of corresponding measured values to determine the image of the sample or the image of the sub-surface region of the sample may comprise using a conventional single-pixel imaging (SPI) algorithm such as a differential ghost imaging method, a gradient descent method, an alternating projection method, a sparse representation method, a total variation regularization method, a conjugate gradient descent method, a Poisson maximum likelihood method, or a Fourier spectrum acquisition method.
- Using the plurality of spatial patterns of incident electromagnetic radiation and the plurality of corresponding measured values to determine the image of the sample or the image of the sub-surface region of the sample may comprise constructing the image of the sample or the image of the sub-surface region of the sample from the plurality of corresponding measured values using a compressive sensing algorithm e.g. using an algorithm equivalent to an algorithm used for JPEG image compression. For compressive sensing, the method may use a range of algorithms. These can be classified into three categories according to the type of iteration they use. Examples are: (i) non-iterative methods; (ii) linear iterative methods; and (iii) non-linear iterative methods. The non-iterative methods are the fastest but require the most measurements. The non-linear iterative methods need the fewest measurements but take longer.
- Using the plurality of spatial patterns of incident electromagnetic radiation and the plurality of corresponding measured values to determine the image of the sample or the image of the sub-surface region of the sample may comprise determining an inverse Fourier transform of the plurality of measured values.
- The method may comprise using the plurality of spatial patterns of incident electromagnetic radiation and the plurality of corresponding measured values to determine the image of the sample or the image of the sub-surface region of the sample without measuring a spatial distribution of the emitted electromagnetic radiation.
- The method may comprise using the plurality of spatial patterns of incident electromagnetic radiation and the plurality of corresponding measured values to determine the image of the sample or the image of the sub-surface region of the sample without recording a spatial distribution of the emitted electromagnetic radiation.
- Measuring, for each spatial pattern of incident electromagnetic radiation, the corresponding value representative of a quantity of at least a portion of the emitted electromagnetic radiation may comprise using a single pixel detector to measure the power or the intensity of the emitted electromagnetic radiation which is incident on the single pixel detector. Using a single pixel detector may provide a higher sensitivity and/or a greater dynamic range than using a multi-pixel detector.
- The method may comprise a Ghost Imaging method. The method may comprise illuminating the sample through the scattering medium or illuminating the sub-surface region of the sample through the scattering surface region of the sample using classical light. The method may comprise illuminating the sample through the scattering medium or illuminating the sub-surface region of the sample through the scattering surface region of the sample using one or more sources of light obeying non-classical (quantum) statistics.
- Using single pixel detection to measure, for each spatial pattern of incident electromagnetic radiation, the corresponding value representative of a quantity of at least a portion of the emitted electromagnetic radiation may comprise using single pixel detection to measure, for each spatial pattern of incident electromagnetic radiation, the power or the intensity of the emitted electromagnetic radiation incident on a single pixel of a multi-pixel detector such as an image sensor, or spatially integrating the power or the intensity of the emitted electromagnetic radiation incident on a plurality of the pixels of the multi-pixel detector.
- The method may comprise sequentially illuminating the sample through the scattering medium or sequentially illuminating the sub-surface region of the sample through the scattering surface region of the sample with the plurality of spatial patterns of incident electromagnetic radiation.
- The method may comprise:
- illuminating one side of the sample through the scattering medium or one side of the sub-surface region of the sample through the scattering surface region of the sample; and
- measuring the value representative of a quantity at least a portion of the emitted electromagnetic radiation emitted from the same side of the sample through the same scattering medium or emitted from the same side of the sub-surface region of the sample through the same scattering surface region of the sample.
- Such a method may allow imaging in an epi-detection configuration. Such a method may be particularly useful for microscopy.
- The method may comprise:
- illuminating one side of the sample through the scattering medium or one side of the sub-surface region of the sample through the scattering surface region of the sample; and
- measuring the value representative of a quantity at least a portion of the emitted electromagnetic radiation emitted from a different, for example an opposite, side of the sample or emitted from a different, for example an opposite, side of the sub-surface region of the sample.
- Such a method may allow imaging in a transmission configuration.
- The method may comprise:
- using a lens to illuminate the sample or the sub-surface region of the sample; and
- using the same lens to collect at least a portion of the emitted electromagnetic radiation.
- Such a method may allow imaging in an epi-detection configuration.
- The method may comprise:
- using a lens to illuminate the sample or the sub-surface region of the sample; and
- using a different lens to collect at least a portion of the emitted electromagnetic radiation.
- Such a method may allow imaging in a transmission configuration.
- The method may comprise focusing each spatial pattern of incident electromagnetic radiation to the focal plane or focal volume.
- The method may comprise using temporal focusing to focus each spatial pattern of incident electromagnetic radiation to the focal plane or focal volume. Using temporal focusing may facilitate wide-field imaging without any requirement to scan the illumination. Using temporal focusing may also increase the robustness of the method of imaging to scattering.
- According to an aspect of the present disclosure there is provided an imaging system according to
claim 12. - The plurality of spatial patterns of incident electromagnetic radiation may comprise a set of mutually complementary spatial radiation patterns. The plurality of spatial patterns of incident electromagnetic radiation may comprise a set of pairs of inverse spatial radiation patterns.
- The plurality of spatial patterns of incident electromagnetic radiation may comprise an orthonormal basis set of spatial radiation patterns. The plurality of spatial patterns of incident electromagnetic radiation may comprise a full orthonormal basis set of spatial radiation patterns.
- The plurality of spatial patterns of incident electromagnetic radiation may comprise a subset of a full orthonormal basis set of spatial radiation patterns.
- The plurality of spatial patterns of incident electromagnetic radiation may comprise a plurality of binary spatial radiation patterns.
- The plurality of spatial patterns of incident electromagnetic radiation may comprise a full set of Hadamard radiation patterns.
- The plurality of spatial patterns of incident electromagnetic radiation may comprise Hermite-Gaussian modes, Laguerre-Gaussian modes, Bessel modes or eigenmodes such as optical eigenmodes.
- The plurality of spatial patterns of first electromagnetic radiation may comprise a plurality of greyscale spatial radiation patterns.
- The plurality of spatial patterns of incident electromagnetic radiation may comprise a plurality of sinusoidal spatial radiation patterns, wherein each sinusoidal spatial radiation pattern has a different spatial frequency. The plurality of spatial patterns of incident electromagnetic radiation may comprise a plurality of harmonic sinusoidal spatial radiation patterns. The number of sinusoidal spatial radiation patterns may be equal to a number of pixels required in the final image of the sample or the final image of the sub-surface region of the sample to be constructed.
- The plurality of spatial patterns of incident electromagnetic radiation may comprise a plurality of phase-shifting sinusoidal spatial radiation patterns. The plurality of spatial patterns of incident electromagnetic radiation may comprise a number N of phase-shifting sinusoidal radiation patterns for each spatial frequency, wherein each phase-shifting sinusoidal radiation pattern has a phase shift of 2π/N relative to an adjacent one of the phase-shifting sinusoidal radiation patterns. The plurality of spatial patterns of incident electromagnetic radiation may comprise four phase-shifting sinusoidal radiation patterns for each spatial frequency, wherein each phase-shifting sinusoidal radiation pattern has a phase shift of π/2 relative to an adjacent one of the phase-shifting sinusoidal radiation patterns.
- The plurality of spatial patterns of incident electromagnetic radiation may be selected or configured for imaging beyond the diffraction limit or for super-resolution imaging.
- The imaging system may comprise a controller for controlling the illumination arrangement so as to illuminate the sample through the scattering medium or the sub-surface region of the sample through the scattering surface region of the sample with the plurality of spatial patterns of incident electromagnetic radiation.
- The controller may comprise the processing resource.
- The processing resource may be configured to use an image construction algorithm to construct the image of the sample or the sub-surface region of the sample from the plurality of spatial patterns of incident electromagnetic radiation and the plurality of corresponding measured values.
- The processing resource may be configured to use an orthogonal matching pursuit algorithm to construct the image of the sample or the sub-surface region of the sample from the plurality of spatial patterns of incident electromagnetic radiation and the plurality of corresponding measured values.
- The processing resource may be configured to determine the image of the sample or the image of the sub-surface region of the sample by constructing the image using a conventional single-pixel imaging (SPI) algorithm such as a differential ghost imaging method, a gradient descent method, an alternating projection method, a sparse representation method, a total variation regularization method, a conjugate gradient descent method, a Poisson maximum likelihood method, and a Fourier spectrum acquisition method.
- The processing resource may be configured to construct the image of the sample or the image of the sub-surface region of the sample from the plurality of spatial patterns of incident electromagnetic radiation and the plurality of corresponding measured values using a compressive sensing algorithm e.g. through an algorithm equivalent to an algorithm used for JPEG image compression.
- For compressive sensing, the processing resource may be configured to construct the image of the sample or the image of the sub-surface region of the sample from the plurality of spatial patterns of incident electromagnetic radiation and the plurality of corresponding measured values using a range of algorithms. These can be classified into three categories according to the type of iteration they use. Examples are: (i) non-iterative methods; (ii) linear iterative methods; and (iii) non-linear iterative methods. The non-iterative methods are the fastest but require the most measurements. The non-linear iterative methods need the fewest measurements but take longer.
- The processing resource may be configured to construct the image of the sample or the image of the sub-surface region of the sample from the plurality of spatial patterns of incident electromagnetic radiation and the plurality of corresponding measured values by determining an inverse Fourier transform of the corresponding measured values.
- The processing resource may be configured to control the illumination arrangement so as to illuminate the sample through the scattering medium or the sub-surface region of the sample through the scattering surface region of the sample according to a Ghost Imaging method. The controller may be configured to control the illumination arrangement so as to illuminate the sample or the sub-surface region of the sample using classical light. The controller may be configured to control the illumination arrangement so as to illuminate the sample or the sub-surface region of the sample using one or more sources of light obeying non-classical (quantum) statistics.
- The processing resource may be configured to use the plurality of spatial patterns of incident electromagnetic radiation and the plurality of corresponding measured values to determine the image of the sample or the image of the sub-surface region of the sample without the detection arrangement measuring a spatial distribution of the emitted electromagnetic radiation.
- The processing resource may be configured to use the plurality of spatial patterns of incident electromagnetic radiation and the plurality of corresponding measured values to determine the image of the sample or the image of the sub-surface region of the sample without recording a spatial distribution of the emitted electromagnetic radiation.
- The detection arrangement may comprise a single pixel detector for measuring the power or intensity of the emitted electromagnetic radiation incident on the single pixel detector.
- The detection arrangement may comprise a photodiode or a photo-multiplier tube (PMT).
- The detection arrangement may comprise a single pixel of a multi-pixel detector such as an image sensor.
- The detection arrangement may comprise a multi-pixel detector such as an image sensor which is configured to spatially integrate the power or intensity of the emitted electromagnetic radiation incident on a plurality of the pixels of the multi-pixel detector.
- The illumination arrangement may be configured to sequentially illuminate the sample through the scattering medium or to sequentially illuminate the sub-surface region of the sample through the scattering surface region of the sample with the plurality of spatial patterns of incident electromagnetic radiation.
- The illumination arrangement may comprise a spatial modulation arrangement for imposing each spatial pattern onto a beam of incident electromagnetic radiation so as to provide the corresponding spatial pattern of incident electromagnetic radiation.
- The spatial modulation arrangement may comprise a diffractive spatial modulation arrangement.
- The spatial modulation arrangement may comprise a spatial light modulator or a digital micro-mirror device.
- The illumination arrangement may be configured to focus each spatial pattern of incident electromagnetic radiation to the focal plane or volume.
- The illumination arrangement may be configured to use temporal focusing to focus each spatial pattern of incident electromagnetic radiation to the focal plane or volume.
- The illumination arrangement may comprise a dispersive element such as a diffraction grating for dispersing the different wavelengths in the range of different wavelengths along the different paths.
- The illumination arrangement may comprise a source for emitting the beam of incident electromagnetic radiation.
- The source may comprise a laser and/or an optical parametric oscillator (OPO).
- The source may be tuneable.
- The illumination arrangement may be configured to illuminate one side of the sample through the scattering medium or one side of the sub-surface region of the sample through the scattering surface region of the sample, and wherein the detection arrangement may be configured to measure the value representative of the quantity of at least a portion of the emitted electromagnetic emitted from the same side of the sample through the same scattering medium or emitted from the same side of the sub-surface region of the sample through the same scattering surface region of the sample.
- The imaging system may comprise a lens for illuminating the sample or the sub-surface region of the sample and for collecting at least a portion of the emitted electromagnetic radiation.
- The lens may be configured to illuminate the sample or the sub-surface region of the sample and the same lens may be configured to collect at least a portion of the emitted electromagnetic radiation emitted from the sample through the same scattering medium or emitted from the sub-surface region of the sample through the same scattering surface region of the sample.
- The lens may comprise an objective lens such as a microscope objective.
- The imaging system may be configured for microscopy.
- The imaging system may be configured for use with a microscope.
- The imaging system may comprise a microscope.
- According to at least one aspect of the present disclosure there is provided a method for use in imaging a sample through a scattering medium, the method comprising:
- illuminating the sample through the scattering medium with a plurality of spatial patterns of incident electromagnetic radiation; and
- measuring, for each spatial pattern of incident electromagnetic radiation, emitted electromagnetic radiation generated by the sample as a result of an interaction of the incident electromagnetic radiation with the sample.
- According to at least one aspect of the present disclosure there is provided an imaging system for use in imaging a sample through a scattering medium, the system comprising:
an illumination arrangement for illuminating the sample through the scattering medium with a plurality of spatial patterns of incident electromagnetic radiation; and
a detection arrangement for measuring, for each spatial pattern of incident electromagnetic radiation, emitted electromagnetic radiation generated by the sample as a result of an interaction of the incident electromagnetic radiation with the sample. - The sample or the sub-surface region of the sample may be fluorescent.
- The sample or the sub-surface region of the sample may comprise one or more exogenous fluorophores such as a green fluorescent protein (GFP) or a red fluorescent protein (RFP).
- The sample or the sub-surface region of the sample may comprise one or more endogenous fluorophores such as NADH and/or flavins.
- The scattering medium may be fluorescent.
- The scattering surface region of the sample may be fluorescent.
- The sample or the sub-surface region of the sample may scatter the incident electromagnetic radiation and/or the emitted electromagnetic radiation generated by the sample or the sub-surface region of the sample.
- One or both of the sample and the scattering medium may comprise biological material.
- One or both of the sub-surface region and the scattering surface region of the sample may comprise biological material.
- One or both of the sample and the scattering medium may comprise human or animal tissue.
- One or both of the sub-surface region and the scattering surface region of the sample may comprise human or animal tissue.
- The incident electromagnetic radiation and the emitted electromagnetic radiation may have different spectra.
- The incident electromagnetic radiation and the emitted electromagnetic radiation may have one or more different wavelengths.
- The incident electromagnetic radiation may comprise light, for example infrared, visible or UV light.
- The emitted electromagnetic radiation may comprise light, for example infrared, visible or UV light.
- The emitted electromagnetic radiation may comprise THz radiation.
- The emitted electromagnetic radiation may comprise fluorescence generated by the sample or the sub-surface region of the sample as a result of excitation of the sample or the sub-surface region of the sample by the incident electromagnetic radiation.
- The incident electromagnetic radiation may be configured for two-photon excitation of the sample or the sub-surface region of the sample. For example, the incident electromagnetic radiation may include an appropriate wavelength or range of wavelengths for two-photon excitation of the sample or the sub-surface region of the sample.
- The electromagnetic radiation may comprise one or more wavelengths in the range 680 nm to 1080 nm.
- The electromagnetic radiation may comprise a wavelength of 750 - 850 nm.
- The electromagnetic radiation may comprise a wavelength of approximately 800 nm.
- The incident electromagnetic radiation may be configured for three-photon excitation of the sample or the sub-surface region of the sample. For example, the incident electromagnetic radiation may include an appropriate wavelength or range of wavelengths for three-photon excitation of the sample or the sub-surface region of the sample.
- The electromagnetic radiation may comprise one or more wavelengths in the
range 700 nm to 1800 nm. - The electromagnetic radiation may comprise one or more wavelengths which are:
- between 1030 nm and 1050 nm, for example at or around 1040 nm;
- between 1540 nm and 1560 nm, for example at or around 1550 nm; and/or
- between 1665 nm and 1685 nm, for example at or around 1675 nm.
- The emitted electromagnetic radiation may be generated by the sample or the sub-surface region of the sample as a result of a non-linear optical interaction between the incident electromagnetic radiation and the sample or the sub-surface region of the sample.
- The emitted electromagnetic radiation may comprise a harmonic of the incident electromagnetic radiation. For example, the emitted electromagnetic radiation may comprise the second harmonic of the incident electromagnetic radiation or a third harmonic of the incident electromagnetic radiation.
- The emitted electromagnetic radiation may be generated as a result of inelastic scattering by the sample or the sub-surface region of the sample.
- The emitted electromagnetic radiation may be generated as a result of Raman scattering by the sample or the sub-surface region of the sample.
- The emitted electromagnetic radiation may be generated as a result of coherent or stimulated Raman scattering by the sample or the sub-surface region of the sample.
- The emitted electromagnetic radiation may be generated as a result of Coherent Anti-Stokes Raman Scattering (CARS) by the sample or the sub-surface region of the sample.
- Each pulse of incident electromagnetic radiation may have a duration of 1 ps or less, 500 fs or less, 100 - 200 fs, or 10 - 100 fs.
- The incident electromagnetic radiation may have an average power in the range 100 - 500 mW, 10 mW - 100 mW or 1mW - 10 mW.
- The value representative of the quantity of at least a portion of the emitted electromagnetic radiation may comprise a power or intensity value of at least a portion of the emitted electromagnetic radiation such as a relative or absolute power or intensity value of at least a portion of the emitted electromagnetic radiation.
- The sub-surface region of the sample may comprise an extended region of the sample, for example a 2D region of the sample such as a plane, or a 3D region of the sample.
- A method and a system for use in multi-photon imaging of a fluorescent sample through a scattering medium will now be described by way of non-limiting example only with reference to the drawings of which:
- FIG. 1
- shows a multi-photon imaging system and a reference transmission imaging system;
- FIG. 2A
- illustrates the optical arrangement of the multi-photon imaging system of
Fig. 1 used for TempRAI Focussing Microscopy with Single PIXel Detection (TRAFIX); - FIG. 2B
- illustrates the working principle of TRAFIX;
- FIG. 3A
- shows a reference image of 400 nm diameter fluorescent beads obtained through a 500 µm thick scattering phantom using the reference transmission imaging system of
FIG. 1 ; - FIG. 3B
- shows an image of the fluorescent beads of
FIG. 3A obtained through the 500 µm thick scattering phantom using the multi-photon imaging system ofFIG. 1 to perform TRAFIX for a compression ratio of 1; - FIG. 3C
- shows an image of the fluorescent beads of
FIG. 3A obtained through the 500 µm thick scattering phantom using the multi-photon imaging system ofFIG. 1 to perform TRAFIX for a compression ratio of 2; - FIG. 3D
- shows an image of the fluorescent beads of
FIG. 3A obtained through the 500 µm thick scattering phantom using the multi-photon imaging system ofFIG. 1 to perform TRAFIX for a compression ratio of 4; - FIG. 3E
- shows an image of the fluorescent beads of
FIG. 3A obtained through the 500 µm thick scattering phantom using the multi-photon imaging system ofFIG. 1 to perform TRAFIX for a compression ratio of 8; - FIG. 3F
- shows a reference image of fluorescent Human Embryonic Kidney (HEK) cells obtained through a 540 µm thick scattering phantom using the reference transmission imaging system of
FIG. 1 ; - FIG. 3G
- shows an image of the fluorescent HEK cells of
FIG. 3F obtained through the 540 µm thick scattering phantom using the multi-photon imaging system ofFIG. 1 to perform TRAFIX for a compression ratio of 1; - FIG. 3H
- shows an image of the fluorescent HEK cells of
FIG. 3F obtained through the 540 µm thick scattering phantom using the multi-photon imaging system ofFIG. 1 to perform TRAFIX for a compression ratio of 2; - FIG. 4A
- shows a reference image of 400 nm fluorescent beads obtained through 250 µm of human colon tissue using the reference transmission imaging system of
FIG. 1 ; - FIG. 4B
- shows an image of the fluorescent beads of
FIG. 4A obtained through 250 µm of human colon tissue using the multi-photon imaging system ofFIG. 1 to perform TRAFIX for a compression ratio of 1; - FIG. 4C
- shows a reference image of fluorescent HEK cells obtained through 200 µm of human colon tissue using the reference transmission imaging system of
FIG. 1 ; - FIG. 4D
- shows an image of the fluorescent HEK cells of
FIG. 4C obtained through 200 µm of human colon tissue using the multi-photon imaging system ofFIG. 1 to perform TRAFIX for a compression ratio of 1; - FIG. 5A
- shows a reference image of a fluorescent micro-pattern obtained in the absence of any scattering medium using the reference transmission imaging system of
FIG. 1 ; - FIG. 5B
- shows a comparative image of the fluorescent micro-pattern obtained using the multi-photon imaging system of
FIG. 1 to perform conventional temporal focussing microscopy without single pixel detection (i.e. under uniform wide-field temporally focussed illumination and wide-field detection to measure the spatial intensity distribution of the light received from the fluorescent micro-pattern) in an epi-fluorescence configuration through a 400 µm slice of rat brain tissue; - FIG. 5C
- shows an image of the fluorescent micro-pattern obtained through a 200 µm slice of rat brain tissue using the multi-photon imaging system of
FIG. 1 to perform TRAFIX for a compression ratio of 1; - FIG. 5D
- shows an image of the fluorescent micro-pattern of
FIG. 5A obtained through a 400 µm slice of rat brain tissue using the multi-photon imaging system ofFIG. 1 to perform TRAFIX for a compression ratio of 1; - FIG. 6A
- shows the lateral beam profiles of simulated temporal focused laser beams at several different wavelengths across the wavelength range of the incident beam of ultrashort laser pulses and the total lateral beam profile of the simulated temporal focused laser beams at the focal plane after propagation through a 400 µm slice of brain tissue (see solid curve);
- FIG. 6B
- shows the total fluorescence power collected using a NA = 0.8 microscope objective for different thicknesses of brain tissue;
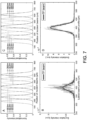
- FIG. 7A
- shows simulated dispersed Gaussian beams at a surface of a scattering medium for different individual wavelengths associated with a laser pulse having a centre wavelength of 800 nm for two-photon excitation using the multi-photon imaging system of
FIG. 1 to perform TRAFIX ; - FIG. 7B
- shows the simulated excitation beams for the different individual wavelengths at the focal plane corresponding to the dispersed Gaussian beams of
FIG. 7A and the profile of the resulting temporal focused beam after propagating through the 400 µm thick sample brain tissue (see solid curve); - FIG. 7C
- shows simulated dispersed Gaussian beams at a surface of a scattering medium for different individual wavelengths associated with a laser pulse having a centre wavelength of 1700 nm for three-photon excitation using the multi-photon imaging system of
FIG. 1 to perform TRAFIX; - FIG. 7D
- shows the simulated excitation beams for the different individual wavelengths at the focal plane corresponding to the dispersed Gaussian beams of
FIG. 7C and the profile of the resulting temporal focused beam after propagating through the 400 µm thick sample brain tissue (see solid curve); - FIG. 8A
- shows the simulated total temporal focused laser power at the focal plane for different thicknesses of brain tissue for two-photon fluorescence excitation (lower, blue curve) and three-photon fluorescence excitation (upper, red curve);
- FIG. 8B
- shows the full width at half maximum (FWHM) of a temporal focused Gaussian beam for different thicknesses of brain tissue for two-photon fluorescence excitation (upper, blue curve) and three-photon fluorescence excitation (lower, red curve);
- FIG. 8C
- shows the total collected fluorescence power using a NA=0.8 objective for different thicknesses of brain tissue for two-photon fluorescence excitation (lower, blue curve) and three-photon fluorescence excitation (upper, red curve);
- FIG. 9A
- shows a measured beam profile at the focal plane when using temporal focusing in the absence of any scattering medium using the multi-photon imaging system of
FIG. 1 ; - FIG. 9B
- shows a measured beam profile at the focal plane when using temporal focusing through 900 µm of scattering phantom (Is ~ 250 µm) using the multi-photon imaging system of
FIG. 1 ; - FIG. 9C
- shows a measured beam profile at the focal plane in the absence of any temporal focusing and in the absence of any scattering medium using the multi-photon imaging system of
FIG. 1 ; - FIG. 9D
- shows a measured beam profile at the focal plane in the absence of any temporal focusing through 900 in the absence of any tem/s ~ 250 µm) using the multi-photon imaging system of

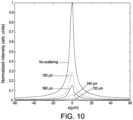
FIG. 1 ; - FIG. 10
- shows a measured depth profile of a temporal focused beam at the focal plane after propagation through different thicknesses of scattering phantom (Is ~ 250 µm) using the multi-photon imaging system of
FIG. 1 ; - FIG. 11A
- shows the full-width at half maximum (FWHM) of the depth profiles of
FIG. 10 ; - FIG. 11B
- shows the peak intensities of the depth profiles of
FIG. 10 ; - FIG. 12A
- shows a reference image of 400 nm diameter fluorescent beads obtained without scattering using the reference transmission imaging system of
FIG. 1 ; - FIG. 12B
- shows an image of the fluorescent beads of
FIG. 12A obtained without scattering using the multi-photon imaging system ofFIG. 1 to perform TRAFIX for a compression ratio of 1; - FIG. 12C
- shows an image of the fluorescent beads of
FIG. 12A obtained without scattering using the multi-photon imaging system ofFIG. 1 to perform TRAFIX for a compression ratio of 2; - FIG. 12D
- shows an image of the fluorescent beads of
FIG. 12A obtained without scattering using the multi-photon imaging system ofFIG. 1 to perform TRAFIX for a compression ratio of 4; - FIG. 12E
- shows an image of the fluorescent beads of
FIG. 12A obtained without scattering using the multi-photon imaging system ofFIG. 1 to perform TRAFIX for a compression ratio of 8; - FIG. 12F
- shows a reference image of fluorescent Human Embryonic Kidney (HEK) cells obtained without scattering using the reference transmission imaging system of
FIG. 1 ; - FIG. 12G
- shows an image of the fluorescent HEK cells of
FIG. 12F obtained without scattering using the multi-photon imaging system ofFIG. 1 to perform TRAFIX for a compression ratio of 1; - FIG. 12H
- shows an image of the fluorescent HEK cells of
FIG. 12F obtained without scattering using the multi-photon imaging system ofFIG. 1 to perform TRAFIX for a compression ratio of 2; - FIG. 13A
- shows a reference image of a hidden sample obtained without scattering using the reference transmission imaging system of
FIG. 1 ; - FIG. 13B
- shows an image of the hidden sample obtained through a 490 µm scattering phantom using the multi-photon imaging system of
FIG. 1 to perform TRAFIX using a full Hadamard basis containing 1024 patterns; - FIG. 13C
- shows an image of the hidden sample obtained through a 490 µm scattering phantom using the multi-photon imaging system of
FIG. 1 to perform TRAFIX using a full Hadamard basis containing 4096 patterns; - FIG. 14A
- shows an image of 4.8 µm diameter fluorescent beads obtained through a 300 µm thick scattering phantom having 0.4 µm diameter fluorescent beads embedded therein and using the multi-photon imaging system of
FIG. 1 to perform TRAFIX; - FIG. 14B
- shows the image of
FIG. 14A with grey levels adjusted to minimise background noise; - FIG. 15A
- images of fluorescent micropatterns obtained with TRAFIX and point-scanning two-photon microscopy (2PM) through scattering phantoms of different thicknesses;
- FIG. 15B
- values of signal-to-background ratio (SBR) for TRAFIX and 2PM through scattering phantoms of different thicknesses;
- FIG. 16A
- image of fluorescent micropattern obtained with TRAFIX in the absence of any scattering;
- FIG. 16B
- image of fluorescent micropattern obtained with 2PM having approximately the same lateral resolution as TRAFIX in the absence of any scattering;
- FIG. 16C
- image of fluorescent micropattern obtained with 2PM having approximately the same axial confinement as TRAFIX in the absence of any scattering;
- FIG. 16D
- image of fluorescent micropattern obtained with TRAFIX through 200 µm of human colon tissue;
- FIG. 16E
- image of fluorescent micropattern obtained with 2PM having approximately the same lateral resolution as TRAFIX through 200 µm of human colon tissue;
- FIG. 16F
- image of fluorescent micropattern obtained with 2PM having approximately the same axial confinement as TRAFIX through 200 µm of human colon tissue;
- FIG. 17A
- axial profile of a uniform temporal focused 84x84 µm square through various layers of scattering phantom (Is ~ 150 µm);
- FIG. 17B
- axial profile of a spatially focused 1.26 µm diameter spot through various layers of scattering phantom (I s ~ 150 µm);
- FIG. 17C
- full width at half maximum (FWHM) of the depth profile for TRAFIX and 2PM as a function of thickness of scattering phantom (Is ~ 150 µm);
- FIG. 18A
- successive images of fluorescent micropattern obtained with TRAFIX in the absence of any scattering for a comparison of photobleaching;
- FIG. 18B
- successive images of fluorescent micropattern obtained with 2PM in the absence of any scattering for a comparison of photobleaching;
- FIG. 18C
- fluorescence intensity decay after several acquisitions for TRAFIX and 2PM;
- FIG. 19A
- illumination pattern in the focal plane for a 4 µm diameter focused beam when using point-scanning 2PM in the absence of scattering;
- FIG. 19B
- illumination pattern in the focal plane for a 4 µm diameter focused beam when using point-scanning 2PM through 200 µm of unfixed colon tissue;
- FIG. 19C
- illumination pattern in the focal plane for a 4 µm diameter focused beam when using point-scanning 2PM through 400 µm of unfixed colon tissue;
- FIG. 19D
- illumination pattern in the focal plane for a first Hadamard pattern when using TRAFIX in the absence of scattering;
- FIG. 19E
- illumination pattern in the focal plane for the first Hadamard pattern when using TRAFIX through 200 µm of unfixed colon tissue;
- FIG. 19F
- illumination pattern in the focal plane for the first Hadamard pattern when using TRAFIX through 400 µm of unfixed colon tissue;
- FIG. 19G
- illumination pattern in the focal plane for a second Hadamard pattern when using TRAFIX in the absence of scattering;
- FIG. 19H
- illumination pattern in the focal plane for the second Hadamard pattern when using TRAFIX through 200 µm of unfixed colon tissue;
- FIG. 19I
- illumination pattern in the focal plane for the second Hadamard pattern when using TRAFIX through 400 µm of unfixed colon tissue;
- FIG. 19J
- illumination pattern in the focal plane for a third Hadamard pattern when using TRAFIX in the absence of scattering;
- FIG. 19K
- illumination pattern in the focal plane for the third Hadamard pattern when using TRAFIX through 200 µm of unfixed colon tissue;
- FIG. 19L
- illumination pattern in the focal plane for the third Hadamard pattern when using TRAFIX through 400 µm of unfixed colon tissue;
- FIG. 20
- intensity versus linear polariser angle after propagation of linearly polarised illumination light in the absence of scattering, through 640 µm of scattering phantom and 400 µm of rat brain tissue; and
- FIG. 21
- shows an alternative multi-photon imaging system and an alternative reference transmission imaging system.
- Referring initially to
FIG. 1 there is shown an imaging system generally designated 2 for use in multi-photon fluorescence excitation microscopy of afluorescent sample 4 through ascattering medium 6. - The
imaging system 2 includes an illumination arrangement generally designated 10 for illuminating thefluorescent sample 4 through thescattering medium 6 with a plurality ofspatial patterns 11 of incident electromagnetic radiation for the multi-photon excitation of thefluorescent sample 4. The plurality ofspatial patterns 11 comprises an orthonormal basis set in the form of a set of Hadamard radiation patterns. - The
imaging system 2 further includes a detection arrangement generally designated 20 for measuring, for eachspatial pattern 11 of incident electromagnetic radiation, emitted electromagnetic radiation in the form offluorescence 22 generated by thefluorescent sample 4 as a result of the multi-photon excitation of thefluorescent sample 4. - As will be appreciated by one of ordinary skill in the art, the
imaging system 2 is arranged in an epi-fluorescence configuration wherein theillumination arrangement 10 is configured to illuminate one side of the fluorescent sample 4 (i.e. the underside of thefluorescent sample 4 inFIG. 1 ) through thescattering medium 6 and thedetection arrangement 20 is configured to measurefluorescence 22 which is generated in thefluorescent sample 4 and emitted from same side of the fluorescent sample 4 (i.e. the underside of thefluorescent sample 4 inFIG. 1 ) through thescattering medium 6. - As shown in
FIG. 1 , theillumination arrangement 10 includes a source of incident electromagnetic radiation in the form of a laser 12 (Coherent Chameleon Ultra II), abeam expansion arrangement 13, a spatial light modulator ((Hamamatsu LCOS-SLM) 14, an optional 4f (f = 400 mm)telescope 15 and a blazed reflective diffraction grating (1200 g/mm) 16. Theillumination arrangement 10 further includes a collimating lens 17 (f = 400 mm) and an illumination objective 18 (40x Nikon NA = 0.8 water dipping objective). Thediffraction grating 16 lies in the back focal plane of the collimatinglens 17, thefluorescent sample 4 lies in the front focal plane of theillumination objective 18, and thecollimating lens 17 and theillumination objective 18 are separated by a distance equal to the sum of their respective focal lengths so that the arrangement of thediffraction grating 16, the collimatinglens 17, theillumination objective 18 and thefluorescent sample 4 is equivalent to a 4f configuration. Thefluorescent sample 4, thescattering medium 6 and the end of theillumination objective 18 adjacent to thescattering medium 6 are enclosed in a custom-made chamber (not shown) filled withwater 19. - The
detection arrangement 20 includes thesame objective 18 used for illumination of thefluorescent sample 4, adichroic mirror 24, a focusinglens 26, and an image sensor in the form of an electron multiplying CCD (EMCCD) camera (Andor iXon 885) 28. TheEMCCD camera 28 is configured to operate as a bucket or a single pixel detector e.g. using 64 x 64 binning. - The
imaging system 2 further includes acontroller 50 which includes aprocessing resource 52. As illustrated by the dashed lines inFIG. 1 , thecontroller 50 is configured for communication with theSLM 14 and theEMCCD camera 28. Specifically, thecontroller 50 is configured to receive a signal from theEMCCD camera 28 which is representative of thetotal fluorescence 22 detected by theEMCCD camera 28 for eachspatial pattern 11 of incident electromagnetic radiation used to illuminate thefluorescent sample 4. Thecontroller 50 is also configured to control theSLM 14 so as to generate thespatial patterns 11 of incident electromagnetic radiation in a focal plane or volume of theillumination objective 18. - Also shown in
FIG. 1 is a reference transmission imaging system generally designated 30. One of ordinary skill in the art will understand that the referencetransmission imaging system 30 does not form part of theimaging system 2. Nor is the referencetransmission imaging system 30 required to provide an image of thefluorescent sample 4. Instead, the referencetransmission imaging system 30 is used only for verifying the operation of theimaging system 2 as will be described in more detail below. The referencetransmission imaging system 30 includes a long working distance 100x Mitutoyo NA = 0.7air objective 32 for collectingfluorescence 22 generated in thefluorescent sample 4 and emitted from the side of thefluorescent sample 4 opposite to the illuminated side of the fluorescent sample 4 (i.e. emitted from the upper side of thefluorescent sample 4 inFIG. 1 ), a focusinglens 34, and a CCD camera (Andor Clara) 36. - The reference
transmission imaging system 30 includes one or more short pass filters 38 for rejecting excitation light at the wavelength of thelaser 12 and for transmitting fluorescence below 700 nm. The referencetransmission imaging system 30 also includes aniris 39 for minimising an auto-fluorescence signal emerging from biological samples. Theiris 39 effectively acts as a "confocal-type" arrangement to help limit out-of-focus light. One of ordinary skill in the art will understand that although the one or more short pass filters 38 and theiris 39 are shown inFIG. 1 mounted at front of theCCD camera 36, the one or more short pass filters 38 and theiris 39 may be located anywhere between theair objective 32 and theCCD camera 36. - One of ordinary skill in the art will also understand that the
objectives sample 4, thescattering medium 6 and theCCD cameras - In use, the
laser 12 delivers alaser beam 40 of optical pulses, each pulse having a duration of less than 1ps, for example 100 - 200 fs or 140 fs, at a variable central wavelength between 680 nm and 1080 nm. The centre wavelength selected depends upon the field of use. For biomedical imaging, the centre wavelength may be selected so as to fall within the therapeutic window (i.e. typically from around 700 nm-1100 nm) to avoid damage to thesample 4. Thebeam expansion arrangement 13 expands thelaser beam 40 by a factor of four to provide an expandedbeam 42 which covers an active area of theSLM 14. The4f telescope 15 images theSLM 14 onto thegrating 16. The first diffraction order from theSLM 14 is transmitted through an iris in thetelescope 15 while all other orders are blocked. The beam is diffracted from the grating 16 to create a spectrally dispersedbeam 46 which is collimated by the collimatinglens 17 and relayed onto the back focal aperture of theillumination objective 18. Theillumination objective 18 focuses the spectrally dispersedbeam 46 to a focal plane or focal volume which intersects and/or is located in thefluorescent sample 4. The size of the focal plane, i.e. the Field Of View (FOV) is 90 x 90 µm2 and the maximum laser intensity on thefluorescent sample 4 is 64 ± 5 mW/µm2. From the foregoing description, one of ordinary skill in the art will understand that for eachspatial pattern 11 of incident electromagnetic radiation, theillumination arrangement 10 uses temporal focusing for scanning-less wide-field multi-photon excitation of thefluorescent sample 4. - The
illumination objective 18 collects a portion of thefluorescence 22 generated in thefluorescent sample 4 for eachspatial pattern 11 of incident electromagnetic radiation. The collected portion of thefluorescence 22 is then coupled via thedichroic mirror 24 and the focusinglens 26 to theEMCCD camera 28 which measures, for eachspatial pattern 11 of incident electromagnetic radiation, the portion of thefluorescence 22 generated by thefluorescent sample 4 as a result of the multi-photon excitation of thefluorescent sample 4. It should be understood that although theEMCCD camera 28 includes a plurality of the pixels, theEMCCD camera 28 is configured to measure thetotal fluorescence 22 incident on the plurality of the pixels or thetotal fluorescence 22 incident on a subset of the plurality of the pixels for eachspatial pattern 11 of electromagnetic radiation used to illuminate thefluorescent sample 4. In other words, theEMCCD camera 28 does not distinguish between thefluorescence 22 incident on different pixels and does not measure the spatial distribution of thefluorescence 22 incident upon theEMCCD camera 28. As such, theEMCCD camera 28 effectively operates as a single pixel detector. - The
processing resource 52 of thecontroller 50 then uses the measuredtotal fluorescence 22 for eachspatial pattern 11 of incident electromagnetic radiation to determine an image of thefluorescent sample 4 with no a priori knowledge of thefluorescent sample 4 or thescattering medium 6 i.e. without any aberration correction for scattering in thefluorescent sample 4 or in thescattering medium 6. Specifically, theprocessing resource 52 of thecontroller 50 constructs an image of thefluorescent sample 4 from knowledge of each Hadamardspatial pattern 11 and the correspondingtotal fluorescence 22 measured by theEMCCD camera 28 using an image construction algorithm in the form of an orthogonal matching pursuit algorithm. -
FIGS. 2A and 2B illustrate the working principle of the TempRAI Focussing Microscopy with Single PIXel Detection (TRAFIX) method implemented using the imaging system ofFIG. 1 . InFIG. 2A , afemtosecond laser beam 42 is expanded onto the spatial light modulator (SLM) 14 that generatesHadamard patterns 11. Subsequently, the beam is diffracted from the grating 16 and theHadamard patterns 11 are projected onto thefluorescent sample 4 after propagating through ascattering medium 6. Fluorescent light emitted by thesample 4 is collected by thesame objective 18 after passing through the scattering medium 6 a second time (epifluorescence geometry) and the total intensity is measured by the single-pixel detector 28. It should be understood that inFIG. 2A , in contrast toFIG. 1 , thefluorescent sample 4 is shown embedded in thescattering medium 6. In other embodiments, the TRAFIX method may be used to image a fluorescent sub-surface region of a sample through a scattering surface region of the same sample. - In
FIG. 2B , a temporal focused (TF) beam propagates through a scattering or turbid medium in the form ortissue 6 with minimal distortion retaining the integrity ofillumination patterns 11 in the sample plane. Emitted fluorescent photons scatter as they propagate back through thetissue 6. In contrast to standard TF microscopy, TRAFIX tolerates scrambling of back-propagating light since only an intensity measurement is performed. In a single-pixel measurement, the fluorescent target is sequentially illuminated with Hadamard patterns (ψn ) and the total intensity detected is stored as a coefficient (ωn ). The gray background in the second column inFIG. 2B denotes regions of zero intensity. By adding up the Hadamard patterns weighted by their respective coefficients, an image of thefluorescent sample 4 is reconstructed. - Temporal focussing (TF) is based on decomposing an incident ultrashort pulsed light field into its constituent wavelengths with a diffraction grating. Each wavelength propagates along an individual path in the optical system and these constructively recombine to regain the original pulse duration only at the plane conjugate to the grating, generating axially confined mutiphoton excitation.
- In TRAFIX, orthonormal light patterns (for example in a Hadamard basis) are temporally focused through a turbid medium to illuminate a fluorescent microscopic sample of interest. The use of TF for this projection ensures the retention of the integrity of these patterns at any given plane within the turbid media (
FIG. 2A ). This can be regarded as due to the fact that ballistic photons remain unperturbed all the way to the object plane and arrive at the same time, contributing to the reconstitution of the pulse. In addition, the superposition of wavelets of slightly different wavelengths at the focal plane results in nearly speckle-free propagation through long distances in scattering media. We confirm these aspects here with a numerical simulation. A scattering medium may affect the spatial and temporal degrees of freedom of an input field differently. In the time domain, the temporal profile of femtosecond pulses is not significantly distorted at substantial imaging depths such as 1-mm-thick brain tissue. As a consequence, TF may induce much more efficient multiphoton excitation when compared to standard point-focusing where spatial speckle greatly reduces the photon density at the focal spot. Consequently, TF is more robust than conventional focusing resulting in a more intense fluorescence signal generated at large depths which is a major attribute for our approach. The total intensity emitted by the fluorescent sample under each illumination pattern is collected by the same objective after passing a second time through the scattering material, in a configuration reminiscent of a single-pixel imaging. In this way we remove the requirement for any spatial resolution on the imaging path which in turn means we can readily tolerate the scrambling of the emitted fluorescence through the scattering medium (FIG. 2B ). We retain exact spatial information of where the sample is illuminated by virtue of using patterned illumination. This allows an original form of TF microscopy to be realised, enabling the use of the full penetration capabilities of TF beams for imaging at depth. - In the
imaging system 2 ofFIG. 1 , theillumination laser 12 has a central wavelength at 800 nm and delivers 140 fs pulses (80 MHz repetition rate, average output power up to 4W) onto thesample 4 and the emitted fluorescent photons are detected by anEMCCD camera 28 which is used as a single-pixel detector. The epi-fluorescence configuration of TRAFIX makes it readily suitable for a suite of biomedical applications. Anadditional microscope 32 takes reference images of the fluorescent sample in a transmission geometry. Reference images are taken with theCCD camera 36 under uniform TF illumination across the field of view (FOV). This additional reference system is not required for imaging. Once all patterns have been sequentially projected and their intensity coefficients measured, images are reconstructed using an orthogonal matching pursuit (OMP) algorithm. The OMP algorithm determines which patterns contribute most effectively to the image reconstruction and sums them up to create an image. The number of pixels in the retrieved image is determined by the size of the Hadamard basis used in the measurement. - An n x n pixels image requires a Hadamard basis containing N = n2 patterns. Therefore, depending on the pixel resolution required, different number of Hadamard patterns (typically 4,096 or 1,024) are encoded on the SLM (14). The acquisition time of the microscope is given by T = 2n 2(texp + TSLM ), where texp is the exposure time of the camera used as a single-pixel detector and tSLM is the time required to refresh the Hadamard patterns on the SLM (including data transmission).
- As TRAFIX is based on patterned illumination, it lends itself to compressive sensing measurements. One of the main advantages of compressive sensing is that sparse signals can be reconstructed with fewer samples than required by Nyquist sampling theory. In terms of microscopy, it means that one does not need to measure with the full set of Hadamard patterns to obtain a good quality image. The compression ratio CR = N/M denotes how many patterns are used to reconstruct the image in relation to the total number of patterns in the Hadamard basis. Here, M is the number of patterns used in the reconstruction algorithm. For example, a 64 x 64 pixels image requires a measurement with a Hadamard basis containing 4,096 patterns. Consequently, a CR of 2 corresponds to using only half of the total patterns to reconstruct the image, i.e. 2,048 patterns, a CR = 4 uses only 1,024 patterns and so on.
- Compressive sensing is a signal processing technique for acquiring and reconstructing signals with fewer measurements than required by the Nyquist sampling theorem. Any signal or image, x, can be expanded as a sum of weighted basis functions:

Equation 1, a good image can be reconstructed by only summing K weighted basis functions with K much smaller than N:
- The reconstruction process can be further optimized by using algorithms as described below.
- In TRAFIX, the sample is illuminated by microstructured light patterns, each corresponding to a basis function, and the total intensity emitted by the sample for each pattern is measured with a photodetector. Different sets of bases can be used to perform a single-pixel measurement. The performance of a digital (Hadamard), a grayscale (discrete cosine transform) and a random (Noiselet) set of bases have been compared. A random set of bases like the Noiselet, may provide a more uniform sampling and higher spatial frequency information is present in the reconstructed images. However, more images are needed to converge to a visually appealing solution. Spatially structured patterns such as the Hadamard or discrete cosine transform, may interact with the structure of the sample and certain weighting coefficients may stand out, which on most occasions, helps reaching more easily a better solution. In general, it has been concluded that the Hadamard basis may provide better results.
- In the TRAFIX microscope of
FIG. 1 , single-pixel measurements are performed with an a posteriori approach to compressive sensing. A basis formed of Hadamard patterns is considered whose entries are either 1 or -1. Two important properties of Hadamard matrices are that their rows are orthogonal and they fulfil the following condition:
SLM 14 and the corresponding patterns are projected onto thesample 4 after propagating through the turbid orscattering medium 6. As the number of pixels in the reconstructed image is determined by the size of the basis, two different sets of Hadamard bases containing 1,024 and 4,096 elements are used to obtain images of 32 x 32 pixels and 64 x 64 pixels, respectively. Since Hadamard matrices are made of -1 and 1, each pattern is split into a sequence of two complementary patterns, one containing the positive portion and the other one the negative portion of the pattern. Then, measurements taken with the negative part of the basis are subtracted from the positive portion obtaining a weight coefficient for each element of the Hadamard basis. The background is subtracted from each measurement. Once all patterns are projected and their weights are determined, the final image is reconstructed by summing them up as described inEquation 1. However, if only a few patterns are used in the reconstruction, a different compression ratio (CR) may be obtained. Reconstruction with fewer patterns is equivalent to taking very few measurements in the first place. In order to optimize the reconstruction process an orthogonal matching pursuit (OMP) algorithm is implemented as described in J. A. Tropp, et al. "Signal Recovery From Random Measurements Via Orthogonal and Matching Pursuit", IEEE Trans. Inf. Theory, 53, 4655-4666 (2007) and J. M. Phillips, "Compressed sensing and orthogonal matching pursuit", CS6140 data mining, University of Utah (2017). - As will be described in more detail below, the reference
transmission imaging system 30 also provides reference images of thefluorescent sample 4 for comparison with the images of thefluorescent sample 4 determined by theprocessing resource 52 of thecontroller 50. - To demonstrate the performance of the
imaging system 2, various microscopic fluorescent samples were imaged through different turbid or scattering media. In each case, the central wavelength of thelaser 12 is 800 nm for two-photon excitation of thefluorescent sample 4 unless otherwise stated. - The signal-to-background ratio (SBR) was calculated according to the definition SBR = µsig /µbg, where µsig and ubg are the average values of the signal and the background, respectively. In the case of cells and fluorescent micropatterns, two small regions-of-interest (ROI) were defined, one containing fluorescent structures and the other corresponding to the background. In the images of beads, the highest intensity pixels in the beads were used as signal value and the maximum intensity pixels in the rest of the image as background noise. Uncertainty is given by the standard deviation of all averaged measurements. All values of SBR presented in this work are summarized in Table 1. Different columns in Table 1 correspond to retrieved images obtained through scattering media with TRAFIX at different compression ratios (CR).
Table 1 SIGNAL-TO-BACKGROUND RATIO CS (CR=1) CS (CR=2) CS (CR=4) CS (CR=8) Beads Without Scattering 14.9 ± 1.5 11.6 ± 1.0 6.4 ± 0.7 3.7 ± 0.4 Beads Phantom 5.5 ± 2.1 4.2 ± 1.8 3.9 ± 1.5 2.6 ± 0.7 Beads Colon 5.4 ± 1.0 - - - Cells Without Scattering 14.8 ± 2.6 11.5 ± 1.6 - - Cells Phantom 4.9 ± 1.5 4.3 ± 0.4 - - Cells Colon 4.6 ± 0.3 - - - - Table 2 shows the cell diameters of images shown in this work. Cells correspond, in order, to
Fig. 12 ,Fig. 3 andFig. 4 . The deviation from the reference value is shown in the last two columns.Table 2 Cell Diameter FWHM (µm) Deviation (%) Reference CR=1 CR=2 CR=1 CR=2 Without scattering 1 19.20 18.92 20.44 1.5 6.4 2 16.31 16.35 14.73 0.2 9.7 Scattering phantom 1 20.66 20.64 19.23 0.1 6.9 2 14.32 13.86 12.71 3.3 11.2 Colon tissue 1 13.07 13.91 - 6.5 - 2 13.94 11.71 - 16.0 - 3 13.22 12.07 - 8.6 - 4 12.22 13.32 - 9.1 - 5 11.65 12.53 - 7.6 - - Table 3 shows the bead spacing corresponding to images shown in this work. They refer, in order, to
Fig. 12 ,Fig. 3 andFig. 4 . The deviation from the reference value is shown in the last four columns.Table 3 No. Distance (µm) Deviation (%) Ref. CR=1 CR=2 CR=4 CR=8 CR=1 CR=2 CR=4 CR=8 Without scattering 1 42.19 40.99 40.29 41.46 40.38 2.8 4.5 1.7 4.2 2 20.40 19.16 19.81 19.73 19.54 6.1 2.9 3.3 4.3 3 55.25 52.95 52.15 54.02 52.88 4.2 5.6 2.2 4.2 Scattering phantom 1 23.21 23.07 23.05 23.51 23.57 0.6 0.7 1.3 1.6 2 18.36 17.87 18.04 18.19 18.80 2.7 1.7 0.9 2.4 3 39.90 40.04 40.04 39.37 39.69 0.4 0.4 1.3 0.5 Colon tissue 1 13.38 15.39 - - - 150 - - - 2 38.31 44.55 - - - 16.3 - - - 3 30.77 35.88 - - - 16.0 - - - - To begin with, 400 nm diameter green fluorescent beads and fixed Human Embryonic Kidney (HEK293T/17) cells labelled with Green Fluorescent Protein (GFP) were imaged through scattering phantoms, designed to mimic the scattering properties of biological tissue, and through unfixed human colon tissue. A custom-made fluorescent microstructure was then imaged through fixed rat brain tissue. As scattering clearly dominates over absorption in the range of wavelengths considered, a scattering mean free path (Is) is used as a reference value to quantify imaging depth. The Is for the scattering media used in the experiments presented here are approximately 140 µm, 85 µm and 55 µm for the scattering phantom, colon tissue and brain tissue, respectively. Full Hadamard bases of either 32 x 32 or 64 x 64 pixel resolution were projected onto the samples and the resulting images were reconstructed with different CR. The lateral resolution of the microscope is defined as twice the pixel size in the reconstructed images, and thus it depends on the FOV. Using a Hadamard basis containing 32 x 32 pixels and a FOV of 90 x 90 µm2, the resolution is 5.6 µm and for a larger basis of 64 x 64 pixels it is 2.8 µm. The depth resolution in the absence of any scattering layer for a 40x NA = 0.8 objective was measured to be 4.7±0.5 µm and the microscope's performance in imaging beads and HEK cells was initially tested without scattering.
- In order to quantify image quality, the signal-to-background ratio (SBR) was measured for all images presented in this work. To assess the effectiveness of this technique in photolocalization, the spacing between fluorescent beads and the size of cells in the reference image and in the reconstructed images were estimated and their deviation from the reference value was then calculated.
-
FIGS. 3A - 3H show the results of imaging fluorescent microscopic samples through scattering phantoms which were designed to match roughly the scattering coefficient of real biological tissue. The scattering phantom was formed from polystyrene beads of 1 µm diameter used as scatterers to simulate a turbid or scattering medium. The beads were purchased in a 1% concentration solution in water (Polysciences, Microbead NIST Traceable Particle Size Standard, 1.00 µm). The solution was thoroughly stirred in a vortex mixer and then mixed with a 1% solution of agarose in water (preheated above melting point). Agarose and beads were mixed in the vortex mixer again and placed into sample wells of variable height. The wells consisted of a 100 µm glass slide with multiple 90 µm vinyl spacers forming the wells. An additional cover slip was placed on top to seal the well. The concentration of polystyrene beads in the sample was chosen to match roughly the scattering coefficient of real biological tissue. Using an online Mie scattering calculator the reduced scattering coefficient of the scattering phantom was determined to be approximately 7.5cm-1 corresponding to a mean free path of about Is ~ 140 µm. -
FIGS. 3A - 3E are images of 400 nm diameter fluorescent beads imaged through 500 µm of scattering phantom. The 400 nm diameter green fluorescent beads used were Green Fluorescent Polymer Microspheres G400 (Duke Scientific) with a diameter of 0.39 µm. Some beads were deposited on a glass coverslip and placed on top of the scattering samples to image them through the scattering phantoms. -
FIGS. 3F - 3H are images of fixed Human Embryonic Kidney (HEK293T/17-GFP) cells through 540 µm of scattering phantom. The HEK cells were labelled with Green Fluorescence Protein (GFP). Human Embryonic Kidney 293T/17 cell line obtained from ATCC® is a derivative of the 293T cell line, highly transfectable derivative of the 293 cell line. The HEK 293T/17 were cultured in Dulbecco's Modified Eagle's Medium GlutaMAXTM-I supplemented with 10% Fetal Bovine Serum and 1% Pen/Strep and was transfected using TranslT-LT1 Transfection Reagent with the lentiviral envelope vector pSD11(VSV-G) and packaging vector pSD16 to deliver the plasmid pLenti-GFP-Puro. Regarding the sample preparation, the HEK 293T/17 expressing GFP were replated on WPI FluorodishTM poly-D-Lysine-coated cell culture dishes at a low density to achieve ideal imaging conditions. The day after plating, prior to imaging, the HEK293T/17-GFP cells were fixed in aPBS 4% paraformaldehyde solution. The scattering samples were attached directly on the bottom of the dishes containing the cells. -
FIGS. 3B and 3G were obtained in the epi-fluorescence configuration with temporal focusing using a Hadamard basis containing 4096 illumination patterns and single-pixel detection. The measurement of the fluorescence for each Hadamard illumination pattern was taken with a binning of 64 and an exposure time of 0.5 s. The lateral resolution of the microscope is determined by the pixel size in the constructed images. Using a Hadamard basis containing 4096 patterns the resolution is 2.8 µm. The depth resolution without any scattering layer was measured to be 34.7 ± 0.5 µm. -
FIGS. 3A and 3F are wide-field temporal focusing reference images measured in transmission using theCCD camera 36 of the referencetransmission imaging system 30 for an exposure time of 20 s and camera binning of 4 and 2, respectively. It is clear from a comparison of the wide-field temporal focusing images ofFIGS. 3B and 3G measured using the Hadamard illumination patterns and single-pixel detection with the corresponding wide-field temporal focusing reference images ofFIGS. 3A and 3F respectively, that the use of temporal focusing in combination with the Hadamard illumination patterns and single-pixel detection is capable of providing images of thefluorescent sample 4 of good quality in an epi-fluorescence configuration without any a priori knowledge or characterisation of thefluorescent sample 4 or thescattering medium 6. - As a result of the strong scattering, very few illumination photons reach the plane of the
fluorescent sample 4 generating a very dim fluorescence signal, therefore long exposure time or large binning is required to even obtain a good reference image in transmission. In conventional multi-photon excitation microscopes, those few emitted fluorescence photons would need to travel back through the thick scattering medium losing all their spatial information resulting in uniform noise on a camera. Consequently, the SNR would essentially be zero. However, for theimaging system 2 ofFIG. 1 which combines temporal focusing microscopy with illumination using the Hadamard patterns and single-pixel detection, there is no need to measure spatial information because the total fluorescence generated for each Hadamard excitation pattern is detected and used to construct the image. That provides a great signal enhancement and higher SNR values can be achieved than with conventional multi-photon excitation microscopes. - Moreover, the use of an orthonormal basis set such as a set of Hadamard radiation patterns and single-pixel detection allows the use of compressive sensing measurements to construct the images of the fluorescent beads. The images shown in
FIGS. 3C - 3E were constructed a posteriori with different compression ratios to show that compressive sensing measurements are also plausible in this configuration. One of the main advantages of compressive sensing is that sparse signals can be constructed with fewer samples than required by Nyquist sampling theory. In terms of microscopy, it means that we do not need to measure with the full Hadamard basis to obtain a good quality image. The compression ratio CR = N/M tells us how many patterns have been used to reconstruct the image in relation to the total number of patterns in the Hadamard basis. Here, M is the number of patterns used in the reconstruction algorithm. For example, a 64 x 64 pixels image requires a measurement with a Hadamard basis containing 4,096 patterns. Consequently, a compression ratio of 2 corresponds to using only half of the total patterns to reconstruct the image, i.e. 2,048 patterns, a CR = 4 uses only 1,024 patterns and so on. - The images shown in
FIGS. 3C - 3E using different compression ratios (CR) corresponding to 50% (CR = 2), 25% (CR = 4) or 12.5% (CR = 8) of the total number of Hadamard patterns. The images ofFIGS. 3C - 3E were obtained using a Hadamard basis containing 4096 illumination patterns and single-pixel detection. The measurement of the fluorescence for each Hadamard illumination pattern was taken with a binning of 64 and an exposure time of 0.5 s. The spacing between the fluorescent beads was measured in all five imagesFIGS. 3A - 3E and the deviations in the spacing measured in FiguresFIGS. 3B - 3E were smaller than 3% from the spacing measured in the reference image ofFIG. 3A (as summarised in Table 3). Image quality is preserved for all compressive ratios obtained with the fluorescent beads. A good image can be faithfully constructed with only 12.5% of the total patterns (512 patterns). - Similarly, compressive sensing measurements were used to construct the images of the HEK cells shown in
FIG. 3H for a compression ratio (CR) corresponding to 50% (CR = 2). The image ofFIG. 3H was obtained using a Hadamard basis containing 4096 illumination patterns and single-pixel detection. The measurement of the fluorescence for each Hadamard illumination pattern was taken with a binning of 64 and an exposure time of 0.5 s. The diameters of the two cells in the reference image ofFIG. 3F were measured to be 20.7 µm and 14.3 µm. The diameters of the same two cells measured fromFIGS. 3G and 3H were found to differ by less than 4% and 12% from the corresponding diameters measured from the reference image ofFIG. 3F (as summarised in Table 2). - Higher compression ratios could not be achieved with the HEK cells mainly because the 800
nm excitation laser 12 used in the experiments is not optimal for two-photon excitation of green fluorescent protein (GFP) which has a peak two-photon absorption in the range of wavelengths between 870 and 920 nm. The laser wavelength could have been shifted to match the peak two-photon absorption wavelength of GFP but the laser power would have dropped significantly. Despite this important issue, a SBR exceeding 4 was achieved at CR=2, i.e. using only 50% of the full Hadamard basis in the image construction algorithm. - The
imaging system 2 was also used with fresh human colon tissue as thescattering medium 6. A problem with imaging through biological tissue can be auto-fluorescence. Specifically, under 435 nm one-photon excitation, it is known that colon tissue presents a very intense auto-fluorescence signal in the green part of the spectrum overlapping with the fluorescence emitted from the beads or cells as a result of two-photon excitation. Consequently, when using an excitation wavelength of 800 nm, two-photon absorption can occur in the colon tissue which can reduce the number of photons that can reach the beads or HEK cells and generate undesired background light. As laser pulses propagate longer distances through scattering tissue, the resulting temporal focusing excitation plane becomes thicker and due to the high intensity laser, some auto-fluorescence was excited in the colon tissue resulting in a lot of noise even in the reference images acquired from above using the referencetransmission imaging system 30. Despite the intense auto-fluorescence light of the colon tissue, it is possible to image the 400 nm fluorescent beads through 250 µm of colon tissue and to image the HEK cells through 200 µm of colon tissue resulting in the images shown inFIGS. 4B and 4D respectively, obtaining high SNR values. The images ofFIGS. 4B and 4D were obtained in the epi-fluorescence configuration with temporal focusing and single-pixel detection using a Hadamard basis containing 1024 and 4096 illumination patterns, respectively. All patterns were used for image reconstruction (CR = 1). Camera binning for each Hadamard pattern was set to 64 and exposure time was 1 s inFIG. 4B and 0.75 s inFIG. 4D. FIGS. 4A and 4C are wide-field temporal focusing reference images measured in transmission using the referencetransmission imaging system 30. Camera binning inFIG. 4A was set to 4 and the exposure time was 5 s. Camera binning inFIG. 4C was set to 1 and exposure time was 15 s. The spacing between beads and the diameter of cells were measured for image quality quantification (as summarised in Tables 3 and 2). The signal-to-background ratio (SBR) is shown for all images. The scale bars are 10 µm. - The photo-localisation analysis was very satisfactory in the case of images obtained through the scattering phantom obtaining deviations smaller than 3% for beads in any compression ratio. Acceptable results were also obtained in the case of cells for the image with no compression. In general, larger deviations were observed for the images through colon tissue presumably due to very low photon count reaching the single-pixel detector.
- Fluorescent micro-patterns were also generated on a thin fluorescent film which was imaged through a scattering phantom to characterize the profile and depth resolution of the temporal focusing beam. The thin fluorescent film was also imaged through fixed mouse brain slices of different thicknesses resulting in the images shown in
FIGS. 5A-5D . The thin fluorescent film was prepared by spin-coating a 200 nm thin layer of super-yellow polymer on a glass cover slip. The negative of a pattern of interest was encoded on theSLM 14 and the thin fluorescent layer was placed at the focal plane of theimaging system 2 without any scattering layer. The power of thelaser 12 was set to the maximum and the negative pattern was photo-bleached on the fluorescent film. Therefore, the only portion of the field of view that remained fluorescent was exactly the microstructure of interest. -
FIGS. 5A-5D compares a hidden object and the images retrieved through brain slices.FIG. 5A shows the reference image of the fluorescent micro-pattern obtained without any scattering medium measured in transmission using the referencetransmission imaging system 30.FIG. 5B shows the image obtained using conventional TF microscopy without using TRAFIX, i.e. under uniform wide-field TF illumination with wide-field detection in the epi-fluorescence configuration, through 400 µm of fixed rat brain tissue.FIGS. 5C and 5D are constructed images obtained using theimaging system 2 to perform TRAFIX in the epi-fluorescence configuration through brain slices of 200 µm and 400 µm, respectively. The two retrieved images were constructed using a full Hadamard basis containing 1024 patterns. The scale bar is 10 µm. The maximum imaging depth achieved through mouse brain slices was 350 µm. At thicknesses of the order of, or larger than, 400 µm, Hadamard patterns turn into speckle and no spatial information can be retrieved. -
FIGS. 6A and 6B illustrate numerical simulation results for the TRAFIX method in scattering media.FIG. 6A shows the simulated TF laser beams at the focal plane through a 400 µm thick brain tissue. The solid red curve indicates the smoothed-out lateral beam profile taking all monochromatic components of the laser pulse into account.FIG. 6B shows the total fluorescence power collected using a NA = 0.8 microscope objective for different thicknesses of brain tissue. Incident laser power at sample surface is set to 100 (a.u.). -
FIGS. 7 and8 show the results of a one-dimensional simulation of the operation of theimaging system 2 ofFIG. 1 . The simulation takes into account the propagation of the different wavelengths or monochromatic portions of the pulse along different paths arising as a result of temporal focusing through thescattering medium 6 and the detection of the fluorescent light after passing a second time through thescattering medium 6. -
FIGS. 7A and 7B show simulation results for the case where the laser pulse is centred at 800 nm for two-photon excitation when the laser pulse propagates through a scattering medium in the form of brain tissue with a thickness of 400 µm.FIGS. 7C and 7D show simulation results for the case where the laser pulse is centred at 1700 nm for three-photon excitation when the laser pulse propagates through a scattering medium in the form of brain tissue with a thickness of 400 µm. -
FIG. 7A shows the dispersed Gaussian beams for two-photon excitation at the surface of the brain tissue (full width at half maximum (FWHM) is 35 µm).FIG. 7B shows the excitation beams with different wavelengths at the focal plane for two-photon excitation. The solid red curve inFIG. 7B shows the profile of the temporal focused beam after propagating through 400 µm of brain tissue. The simulation demonstrates that when monochromatic light propagates through a thick scattering layer such as a 400 µm thick brain slice, it turns into a speckle pattern as expected. However, one of the important features of temporal focusing is that each wavelength or monochromatic portion of the pulse, propagates through thescattering medium 6 with a slightly different angle resulting in speckle patterns that are highly correlated with each other. As a result, the overall beam profile can be remarkably well conserved as represented by the thick curve inFIG. 7B . - For the simulations of
FIGS. 7A and 7B , a layer of turbid tissue is simulated by mixing an aqueous medium with randomly distributed dielectric spheres of 2 µm at a concentration of 1 sphere per 1000 µm3 . The refractive index of the scattering spheres is 0.1 higher than the surrounding media. Numerical simulations are carried out only in one dimension to reduce the required computation power. Similarly to the grating in the experiment, the spectral components in the laser pulse are dispersed and expanded to fill the back aperture of a microscope objective (NA = 0.8) as shown inFIG. 7A . Assuming that the laser pulse contains 70 spectral components at different wavelengths with a step of 0.1 nm, each monochromatic component of the pulse propagates through a different region of scattering tissue and arrives at the same position on the focal plane using the split step approach implemented in Matlab. Back scattering is neglected here while the attenuation coefficient of turbid media is set to 4.45X10³ m-1, experimentally estimated by measuring the laser power before and after tissue samples. At the focal plane, each spectral component forms a speckle pattern as shown inFIG. 7B . These speckle patterns are significantly spatially correlated but shifted from each other since each different wavelength travels a slightly different optical path through the turbid medium. As expected, temporally focusing these speckle patterns results in a distinct 'smooth' excitation beam at the focal plane as shown by the solid red curve inFIG. 7B . According to the numerical simulation results, the total power delivered through the tissue decreases exponentially with the thickness of tissue as shown inFIG. 8A. FIG. 8B also shows the beam's full width at half maximum (FWHM) at the TF plane increases slightly when the beam is focused through a thick layer which would result in a slight distortion of the Hadamard patterns projected in the experimental measurements. The excited fluorescent photons have to propagate through the turbid tissue before they can be collected by the same microscope objective and therefore the total fluorescence signal becomes very weak for a thick tissue layer compared to the initial illumination power as shown inFIG. 8C . -
FIG. 7C shows the dispersed Gaussian beams for three-photon excitation at the surface of the brain tissue (full width at half maximum (FWHM) is 35 µm). -
FIG. 7D shows the excitation beams with different wavelength at the focal plane for three-photon excitation. The solid red curve inFIG. 7D shows the profile of the temporal focused beam after propagating through 400 µm of brain tissue. The simulation demonstrates that when monochromatic light propagates through a thick scattering layer such as a 400 µm thick brain slice, it turns into a speckle pattern as expected. However, one of the important features of temporal focusing is that each wavelength or monochromatic portion of the pulse, propagates through thescattering medium 6 with a slightly different angle resulting in speckle patterns that are highly correlated with each other. As a result, the overall beam profile can be remarkably well conserved as represented by the thick curve inFIG. 7D . - Since the attenuation length at 1700 nm is almost doubled for the same brain tissue, the attenuation coefficient is set to 2.5 x 10³ m-1 for the simulations of
FIGS. 7C and 7D . Assuming all other parameters are the same, three-photon TF beams show a better penetration through the layer of tissue.FIG. 7D shows that the overall smoothed out speckle pattern reaching the focal plane for three-photon excitation more closely resembles the initial Gaussian beams than the smoothed out speckle pattern for two-photon excitation ofFIG. 7B . Additionally, thanks to using longer wavelengths, the amount of TF laser power reaching focus is considerably higher than in the previous case as shown inFIG. 8A . As the FWHM of the overall smoothed out beam is thinner (FIG. 8B ), the shape of the illumination Hadamard patterns would be distorted by a smaller amount than in two-photon excitation. This, combined to the fact that its intensity is higher (FIG. 7D ), would make three-photon TRAFIX capable of penetrating much deeper in biological tissue. For the same fluorescence signal level detection threshold, TRAFIX in the three-photon mode can penetrate nearly 1.5 times deeper into the tissue than in the two-photon mode. -
FIG. 8A shows the total temporal focused laser power at the focal plane using a NA = 0.8 objective for different thicknesses of brain tissue expressed as a percentage of the incident laser power.FIGS. 8B and 8C show the corresponding full width at half maximum of the temporal focused Gaussian beam and the total collected fluorescence power expressed as a percentage of the incident laser power respectively. FromFIG. 8C and, considering the quantum efficiency of the detector, it is clear that the no information could be retrieved through brain tissue thicker than 500 µm. -
FIGS. 9A-9D show the effect of scattering on the beam profile with and without temporal focusing (TF).FIGS. 9A and 9B show the beam profile with, andFIGS. 9C and 9D without, TF.FIGS. 9A and 9C were taken without scattering andFIGS. 9B and 9D through 900 µm of scattering phantom (Is ~250 µm). Scale bar is 20 µm. These results show the resilience of TF to speckle formation after propagation through scattering media. -
FIG. 10 shows the depth profile of a TF beam through a scattering phantom. The axial extent of the illumination plane was measured through different thicknesses of scattering phantom (Is ~250 µm). The size at the FWHM determines the depth resolution of the microscope. The axial resolution without scattering is 4.7±0.5 µm. The objective used for this measurement was aNikon 40x NA = 0.8. -
FIGS. 11A and 11B show the results of the characterisation of a TF beam through a scattering phantom obtained from the data represented inFIG. 10 .FIG. 11A shows the full width at half maximum (FWHM) of the depth profiles. The depth resolution decreases about 2.5 times after propagating through 720 µm of the scattering phantom (Is ~ 250 µm).FIG. 11B shows the peak intensity of the depth profiles. It decreases exponentially as light travels farther through the scattering medium.FIG.11A shows that the depth resolution of TRAFIX deteriorates as the beam propagates deeper inside a turbid medium but it only decreases by a factor of 2.5 after propagating through more than 700 µm of the medium. In addition, the intensity of the light emitted by the excited plane drops exponentially (FIG.11B ). - Prior to imaging through turbid samples, the performance of the
system 2 was tested without scattering.FIGS. 12A - 12H show images of fluorescent microscopic samples without scattering. Fluorescent beads of 400 nm in diameter and fixed HEK293T/17-GFP cells were imaged without the presence of any scattering layer.FIGS. 12A and 12F show images taken from the reference imaging arm under uniform TF illumination across the FOV. Camera binning was set to 1, and exposure time was 5 s and 10 s, respectively.FIGS. 12B-12E and 12G-12H show Images obtained in epi-fluorescence configuration with TRAFIX using a Hadamard basis containing 4096 illumination patterns. They were reconstructed using different compression ratios corresponding to 100% (CR = 1), 50% (CR = 2), 25% (CR = 4) or 12.5% (CR = 8) of the total patterns. Each single measurement of the Hadamard scan was taken with a binning of 64 and an exposure time of 0.025 s and 0.02 s, respectively. The spacing between beads (Table 3) and the diameter of the cells (Table 2) were measured to assess image quality. The signal-to-background ratio (SBR) is shown for all reconstructed images. Scale bars are 10 µm. The images ofFIGS. 12A - 12H demonstrate that the image quality in the case of beads remains practically the same both visually and in terms of signal-to-background ratio (SBR) for all levels of compression. High CR could not be achieved for cell imaging mainly because images are not sparse enough. -
FIGS. 13A-13C show a comparison of the hidden object and the retrieved images through a scattering phantom with different resolution.FIG. 13A shows a reference image of the fluorescent micropattern without any scattering sample.FIGS. 13B and 13C show reconstructed images obtained with TRAFIX in the epifluorescence configuration through 490 µm of scattering phantom. The two retrieved images were reconstructed using full Hadamard bases containing 1024 and 4096 patterns, respectively. The scale bar is 10 µm. - With a FOV of approximately 90x90 µm2 and using a 32x32 pixel basis (1024 patterns), the lateral resolution is 5.6 µm; and using a 64x64 pixel basis (4096 patterns) it becomes 2.8 µm. The resolution can also be improved by making the FOV smaller using higher magnification optics.
- A scattering phantom with fluorophores extending its entire volume was imaged to determine the performance of TRAFIX in imaging in presence of intense out-of-focus fluorescent light. The phantom contained 0.4 µm and 4.8 µm diameter fluorescent beads, and 1 µm diameter polystyrene beads embedded in 1.5 % agarose. The 0.4 µm fluorescent microparticles contribute to creating a fluorescent background and the 4.8 µm beads simulate features of interest. This experiment was done with a Nikon 20x NA = 0.75 air objective.
-
FIGS. 14A and 14B shows images of the phantom at a depth of ~300 µm.FIG. 14A shows an image taken at a depth of 300 µm with balanced gray levels.FIG. 14B shows the same image with gray levels adjusted to minimise background noise. - No reference images are shown because this is a three-dimensional sample and the imaged plane is not accessible from the reference imaging system. As the axial confinement of the TF illumination plane with the present objective at a depth of ~300 µm is ~20 µm, 4.8 µm beads out of the focal plane generate a strong fluorescent background. However, beads located at the focal plane can still be clearly distinguished by simply adjusting the gray levels of the image. Axial resolution can be enhanced by changing imaging parameters such as magnification, NA or pulse duration, or by relaying on line-scanning TF illumination instead of wide-field.
- To compare the performance of TRAFIX and point-scanning 2PM imaging methods at depth, two different point-scanning 2PM experiments were carried out. Each experiment involved imaging fluorescent micropatterns at different depths through a scattering phantom (Is ~100 µm) and comparing the signal-to-background ratio (SBR) of the acquired images. An underfilled Nikon 20x NA = 0.75 air objective was used for the studies below to equate lateral and axial resolution for both approaches. One of skill in the art will understand that for point-scanning 2PM imaging, the
diffraction grating 16 and thelens 17 of theTRAFIX imaging system 2 ofFIG.1 were replaced with a mirror and the illumination was uniform i.e. the spatiallight modulator 14 reflected or diffracted thebeam 42 without imposing any spatial modulation on the reflected light. Also, point-scanning was achieved by translating thesample 4 and thescattering medium 6 relative to the illumination using a translation stage or by keeping thesample 4 stationary and employing one or more beam scanning mirrors (e.g. one or more galvanometer-based scanning mirrors) to scan the illumination relative to thesample 4. - Firstly, the back aperture of the objective was filled so as to produce a focused spot of 3.75 µm diameter to make it similar to the lateral resolution of TRAFIX (FOV of 84x84 µm2 using an illumination basis size of 1024). We term this 2PM-Lateral.
- Here, the NA of the illumination beam was increased to improve the axial resolution of 2PM to 8.4 µm, which was the same as for TRAFIX. We term this 2-PM-Axial.
- The laser power was set to the maximum for TRAFIX, obtaining a power per unit area and pattern on the sample of 0.068 mW/ µm2 ·pattern. The total accumulated power per unit area after a measurement with the full basis was 69 mW/ µm2. The laser power per unit area was then adjusted to generate approximately the same fluorescence intensity in 2PM as the total fluorescence intensity generated by TRAFIX after 1024 patterned illuminations. This was 2.2 mW/ µm2. The exposure time of the camera was set to the same value for each pixel in 2PM scan as for each TRAFIX pattern to make the experiment fully comparable.
- The results for both experiments are shown together in
FIGS. 15A and 15B . All images were obtained with different micropatterns (smiley faces) to avoid the effect of photobleaching in the SBR calculation.FIG. 15A shows images of fluorescent micropatterns obtained with TRAFIX and 2PM through scattering phantoms of different thicknesses. 2PM-Lateral has approximately the same lateral resolution as TRAFIX and 2PM-Axial has similar axial confinement as TRAFIX. Small insets show the same image with different gray values. Laser power per unit area per TRAFIX pattern was 0.068 mW/ µm2·pattern and the total accumulated laser power per unit area after a full measurement with 1024 patterns was 69 mW/ µm2. Laser power per unit area for 2PM was 2.2 mW/ µm2. Camera binning and exposure time were maintained constant for all measurements at the same depth. Exposure time per TRAFIX pattern was the same as per pixel in 2PM. Images were acquired with an underfilled 20x NA = 0.75 objective. Scale bar is 10 µm.FIG. 15B shows the values of SBR at different depths for TRAFIX and 2PM. The scattering mean free path of the phantom is Is ~100 µm. As expected, in the experiments without scattering, the SBR was equivalent for both TRAFIX and 2PM. The SBR in 2PM degrades more rapidly than for TRAFIX when imaging at depth. - Furthermore, we also performed these two experiments in exactly the same conditions through 200 µm of unfixed human colon tissue.
FIGS. 16A - 16F provide a comparison of the results.FIGS. 16A - 16C show images of a fluorescent micropattern obtained with TRAFIX and 2PM without scattering. 2PM-Lateral has approximately the same lateral resolution as TRAFIX and 2PM-Axial has similar axial confinement as TRAFIX.FIGS. 16D - 16F show images obtained through 200 µm of unfixed human colon tissue. Laser power per unit area per TRAFIX pattern was 0.068 mW/ µm2 ·pattern and the total accumulated laser power per unit area after a full measurement with 1024 patterns was 69 mW/ µm2 . Laser power per unit area for 2PM was 2.2 mW/ µm2 . Camera binning and exposure time were maintained constant forFIGS. 16A - 16C and FIGS. 16D - 16F . Exposure time per TRAFIX pattern was the same as per pixel in 2PM. Signal-to-background ratio (SBR) is shown for all images. Images were taken with an underfilled 20x NA = 0.75 objective. The scale bar is 10 µm. -
FIGS. 16A - 16F also show a higher SBR for TRAFIX at depth. These results show that TRAFIX achieves between 2 and 5 times higher SBR than 2PM for the samples and depths considered in this study. As described in the article, this is due to the resilience of TF beams to speckle formation and the fact that the temporal profile of femtosecond pulses is distorted to a lower extent compared to the spatial profile. -
FIGS. 17A- 17C compare the axial confinement of TRAFIX and 2PM through different layers of a scattering phantom having a scattering mean free path of Is~150 µm and using a Nikon 20x NA = 0.75 objective.FIG. 17A shows an axial profile of a uniform TF 84x84 µm square.FIG. 17B shows an axial profile of a spatially focused 1.26 µm diameter spot through various layers of scattering phantom. Is~150 µm.FIG. 17C shows the full width at half maximum (FWHM) of the depth profile for TRAFIX and 2PM through scattering phantoms. The objective used in this experiment was a Nikon 20x NA = 0.75. objective. - Starting from the same axial confinement without scattering,
FIGS. 17A- 17C show that TRAFIX (or equivalently, wide-field TF) degrades faster than 2PM. The axial extent of the illuminated plane in TRAFIX increases ~2.6 times after ~2.4 scattering mean-free-path lengths while in 2PM it only increases by ~1.8 times. It is also worth remarking that 2PM has better axial confinement than TRAFIX because it is currently based on wide-field TF illumination. To achieve the same axial confinement as 2PM, fast line-scanning TF illumination should be used to create the illumination patterns in TRAFIX. - When imaging biological samples, photobleaching and photodamage caused by the high irradiation intensities of the illuminating light need to be carefully considered. The wide-field temporal focusing nature of TRAFIX avoids the need of spatially focusing a laser beam on the sample resulting in a reduced illumination power per unit area.
- The use of patterned illumination is also beneficial for imaging sensitive biological samples since the total illumination energy is distributed over many low intensity exposures. Even though the total accumulated power per unit area in TRAFIX may be higher than in 2PM, it has been shown that by delivering the same total light dosage in a sequential rather than instantaneous manner, photobleaching and photodamage are drastically reduced.
- To verify this, we performed an experiment in which we sequentially imaged two fluorescent micropatterns without scattering with TRAFIX and with 2PM. The illumination power per unit area of TRAFIX was set to 0.034 mW/ µm2 pattern and the resulting accumulated power per unit area after projecting 1024 patterns was 35 mW/ µm2. We determined that in order to have the same total fluorescence count (i.e. equivalent image quality) the laser power per unit area of 2PM in this case should be 1.1 mW/ µm2. We observed that under this power per unit area, the fluorescent micropattern was severely damaged so we decided to perform this experiment with half of that power, i.e. 0.55 mW/ µm2.
-
FIGS. 18A - 18C compare photobleaching of TRAFIX and point-scanning two-photon microscopy (2PM).FIG. 18A shows successive images obtained with TRAFIX without scattering.FIG. 18A shows successive images obtained with 2PM without scattering. Laser power per unit area for TRAFIX is 0.034 mW/ µm2 and the resulting accumulated power per unit area after projecting 1024 patterns is 35 mW/ µm2. The laser power per unit area for 2PM is 0.55 mW/ µm2, which corresponds to half of the required power per unit area to generate the same total fluorescence signal as TRAFIX. Images taken with an underfilled 20x NA = 0.75 objective.FIG. 18C shows the fluorescence intensity decay after several acquisitions for TRAFIX and 2PM. - It is clear to see that the image quality of 2PM degrades much faster than that of TRAFIX even under lower laser power per unit area than required to obtain the same SBR. Under more favourable conditions compared to TRAFIX, 2PM photobleaching is still over three times higher. Thus, this highlights a further major advantage of the TRAFIX approach.
- A further experiment was performed to determine the effect of scattering on the illumination patterns of TRAFIX and 2PM. A fluorescent layer placed on top of the colon tissue was illuminated with various TRAFIX patterns and the 2PM focused beam, and imaged from the reference arm.
-
FIGS. 19A - 19L show the effect of scattering on illumination beams in point-scanning two-photon microscopy (2PM) and TRAFIX. The three columns correspond to the illumination patterns without scattering, through 200 µm and 400 µm of unfixed colon tissue, respectively.FIGS. 19A - 19C are illumination pattern in the form of a 4 µm diameter focused beam used for 2PM.FIGS. 19D - 19L are Hadamard patterns of different orientation and spatial frequencies used for TRAFIX. The size of the patterns is 130x130 µm2 . Scale bars are 10 µm inFIG. 19A and20 µm inFIG. 19D . This experiment was done with a 40x NA = 0.8 objective. It can be seen that the 2PM focused spot turns into a speckle pattern after ~400 µm while low frequency Hadamard patterns remain relatively well conserved though with important brightness inhomogeneities. - A scattering phantom and rat brain tissue were illuminated with linearly polarised light, and the polarisation state of the transmitted light was analyzed using a linear polariser and a power meter. The degree of linear polarisation (DOLP) defined as DOLP = (I∥ - I ⊥)/(I ∥ + I ⊥) was measured in all three cases obtaining 0.999 for the incident light, and 0.978 and 0.964 for the transmitted light through the scattering phantom and rat brain tissue, respectively.
-
FIG. 20 shows the effect of turbid media on light polarisation. Linearly polarised illumination light retains its polarisation state through propagation in the scattering phantom or rat brain tissue used in this experiment. The data clearly obeys Malus' Law. The thickness of the scattering phantom and the rat brain tissue were 640 µm and 400 µm, respectively. InFIG. 20 , intensity was normalised taking into account the transmittance of the different samples and the polariser. The results ofFIG. 20 confirm that the polarisation state of light remains practically unchanged after propagating through the samples used in this investigation. -
FIG. 21 shows an alternative imaging system generally designated 102 for use in multi-photon fluorescence excitation microscopy of afluorescent sample 4 through ascattering medium 6. Thealternative imaging system 102 ofFIG. 21 is similar in many respects to the imaging system toFIG. 1 except that thealternative imaging system 102 ofFIG. 21 does not rely upon the use of temporal focusing. Thealternative imaging system 102 includes many features which correspond to features of theimaging system 2 ofFIG. 1 , with like features of thealternative imaging system 102 ofFIG. 21 having the same reference numerals as the corresponding features of theimaging system 2 ofFIG. 1 incremented by "100". - The
imaging system 102 includes an illumination arrangement generally designated 110 for illuminating thefluorescent sample 4 through thescattering medium 6 with a plurality ofspatial patterns 111 of incident electromagnetic radiation for the multi-photon excitation of thefluorescent sample 4. The plurality ofspatial patterns 111 comprises an orthonormal basis set in the form of a set of Hadamard radiation patterns. - The
imaging system 102 further includes a detection arrangement generally designated 120 for measuring, for eachspatial pattern 111 of incident electromagnetic radiation, emitted electromagnetic radiation in the form offluorescence 122 generated by thefluorescent sample 4 as a result of the multi-photon excitation of thefluorescent sample 4. - As will be appreciated by one of ordinary skill in the art, the
imaging system 102 is arranged in an epi-fluorescence configuration wherein theillumination arrangement 110 is configured to illuminate one side of the fluorescent sample 4 (i.e. the underside of thefluorescent sample 4 inFIG. 21 ) through thescattering medium 6 and thedetection arrangement 120 is configured to measurefluorescence 122 which is generated in thefluorescent sample 4 and emitted from same side of the fluorescent sample 4 (i.e. the underside of thefluorescent sample 4 inFIG. 21 ) through thescattering medium 6. - As shown in
FIG. 21 , theillumination arrangement 110 includes a source of incident electromagnetic radiation in the form of a laser 112 (Coherent Chameleon Ultra II), abeam expansion arrangement 113, a spatial light modulator ((Hamamatsu LCOS-SLM) 114, and atelescope 115. Theillumination arrangement 110 further includes an illumination objective 118 (40x Nikon NA = 0.8 water dipping objective). Thefluorescent sample 4, thescattering medium 6 and the end of theillumination objective 118 adjacent to thescattering medium 6 are enclosed in a custom-made chamber (not shown) filled withwater 19. - The
detection arrangement 120 includes thesame objective 118 used for illumination of thefluorescent sample 4, adichroic mirror 124, a focusinglens 126, and an image sensor in the form of an electron multiplying CCD (EMCCD) camera (Andor iXon 885) 128. TheEMCCD camera 128 is configured to operate as a bucket detector e.g. using 64 x 64 binning. - The
imaging system 102 further includes acontroller 150 which includes aprocessing resource 152. As illustrated by the dashed lines inFIG. 7 , thecontroller 150 is configured for communication with theSLM 114 and theEMCCD camera 128. Specifically, thecontroller 150 is configured to receive a signal from theEMCCD camera 128 which is representative of thetotal fluorescence 122 detected by theEMCCD camera 128 for eachspatial pattern 111 of incident electromagnetic radiation used to illuminate thefluorescent sample 4. Thecontroller 150 is also configured to control theSLM 114 so as to generate thespatial patterns 111 of incident electromagnetic radiation in the focal plane or volume of theillumination objective 118. - Also shown in
FIG. 21 is a reference transmission imaging system generally designated 130. One of ordinary skill in the art will understand that the referencetransmission imaging system 130 does not form part of theimaging system 102. Nor is the referencetransmission imaging system 130 required to provide an image of thefluorescent sample 4. Instead, the referencetransmission imaging system 130 is used only for verifying the operation of theimaging system 102. The referencetransmission imaging system 130 includes a long working distance 100x Mitutoyo NA = 0.7air objective 132 for collectingfluorescence 122 generated in thefluorescent sample 4 and emitted from the side of thefluorescent sample 4 opposite to the illuminated side of the fluorescent sample 4 (i.e. emitted from the upper side of thefluorescent sample 4 inFIG. 21 ), a focusing lens 134, and a CCD camera (Andor Clara) 136. - The reference
transmission imaging system 130 includes one or more short pass filters 138 for rejecting excitation light at the wavelength of thelaser 112 and for transmitting fluorescence below 700 nm. The referencetransmission imaging system 130 also includes an iris 139 for minimising an auto-fluorescence signal emerging from biological samples. The iris 139 effectively acts as a "confocal-type" arrangement to help limit out-of-focus light. One of ordinary skill in the art will understand that although the one or more short pass filters 138 and the iris 139 are shown inFIG. 21 mounted at front of theCCD camera 136, the one or more short pass filters 138 and the iris 139 may be located anywhere between theair objective 132 and theCCD camera 136. - One of ordinary skill in the art will also understand that the
objectives sample 4, thescattering medium 6 and theCCD cameras - In use, the
laser 112 delivers alaser beam 140 of optical pulses, each pulse having a duration of less than 1ps, for example 100 - 200 fs or 140 fs, at a variable central wavelength between 680 nm and 1080 nm. The centre wavelength selected depends upon the field of use. For biomedical imaging the centre wavelength may be selected so as to fall within the therapeutic window (i.e. typically from around 700 nm-1100 nm) to avoid damage to thesample 4. Thebeam expansion arrangement 113 expands thelaser beam 140 by a factor of four to provide an expandedbeam 142 which covers an active area of theSLM 114. Thetelescope 115 expands the beam reflected from theSLM 114 and images the expandedbeam 146 onto the back focal aperture of theillumination objective 118. The first diffraction order from theSLM 114 is transmitted through an iris in thetelescope 115 while all other orders are blocked. Theillumination objective 118 focuses the expandedbeam 146 to a focal plane or focal volume which intersects and/or is located in thefluorescent sample 4. - The
illumination objective 118 collects a portion of thefluorescence 122 generated in thefluorescent sample 4 for eachspatial pattern 111 of incident electromagnetic radiation. The collected portion of thefluorescence 122 is then coupled via thedichroic mirror 124 and the focusinglens 126 to theEMCCD camera 128 which measures, for eachspatial pattern 111 of incident electromagnetic radiation, the portion of thefluorescence 122 generated by thefluorescent sample 4 as a result of the multi-photon excitation of thefluorescent sample 4. It should be understood that although theEMCCD camera 128 includes a plurality of the pixels, theEMCCD camera 128 is configured to measure thetotal fluorescence 122 incident on the plurality of the pixels or thetotal fluorescence 122 incident on a subset of the plurality of the pixels for eachspatial pattern 111 of electromagnetic radiation used to illuminate thefluorescent sample 4. In other words, theEMCCD camera 128 does not distinguish between thefluorescence 122 incident on different pixels and does not measure the spatial distribution of thefluorescence 122 incident upon theEMCCD camera 128. As such, theEMCCD camera 128 effectively operates as a single pixel detector. - The
processing resource 152 of thecontroller 150 then uses the measuredtotal fluorescence 122 for eachspatial pattern 111 of incident electromagnetic radiation to determine an image of thefluorescent sample 4 with no a priori knowledge of thefluorescent sample 4 or thescattering medium 6 i.e. without any aberration correction for scattering in thefluorescent sample 4 or in thescattering medium 6. Specifically, theprocessing resource 152 of thecontroller 150 constructs an image of thefluorescent sample 4 from knowledge of each Hadamardspatial pattern 111 and the correspondingtotal fluorescence 122 measured by theEMCCD camera 128 using an image construction algorithm in the form of an orthogonal matching pursuit algorithm. - As described above in relation to the
imaging system 2 ofFIG. 1 , the referencetransmission imaging system 130 also provides reference images of thefluorescent sample 4 for comparison with the images of thefluorescent sample 4 determined by thecontroller 150. - From the foregoing description of the
imaging system 102 ofFIG. 21 , one of ordinary skill in the art will understand that for eachspatial pattern 111 of incident electromagnetic radiation, theillumination arrangement 110 may excite a narrower field of thefluorescent sample 4 than the wide-field temporal focusingillumination arrangement 10 of theillumination system 2 ofFIG. 1 . Consequently, it may be necessary to scan the beam provided by theillumination arrangement 110 over thefluorescent sample 4 to obtain the same field of view provided by the wide-field temporal focusingillumination arrangement 10 of theillumination system 2 ofFIG. 1 . The illumination system toFIG. 21 may include a tilting or scanning mirror arrangement (not shown) for this purpose. For a given field of view, this may result in longer measurement times (i.e. lower temporal resolution) when using theillumination arrangement 110 of theillumination system 102 ofFIG. 21 compared with theillumination arrangement 10 of theillumination system 2 ofFIG. 1 . Conversely, for a given field of view, theimaging system 102 ofFIG. 21 may require a lower laser power to generate the same amount of fluorescence in thefluorescent sample 4. - It will be appreciated by one skilled in the art that various modifications may be made to the foregoing methods and systems without departing from the scope of the present invention as defined by the claims. For example, the
scattering medium 6 may be fluorescent. Thefluorescent sample 4 may scatter the excitation laser beam and/or the fluorescence generated in thefluorescent sample 4. - One or both of the
fluorescent sample 4 and thescattering medium 6 may comprise biological material. - One or both of the
fluorescent sample 4 and thescattering medium 6 may comprise human or animal tissue. - The
fluorescent sample 4 and thescattering medium 6 may be unitary. For example, a sample may comprise a fluorescent sub-surface region and a scattering surface region. - One or both of the fluorescent sub-surface region of the sample and the scattering surface region of the sample may comprise biological material.
- One or both of the fluorescent sub-surface region of the sample and the scattering surface region of the sample may comprise human or animal tissue.
- Although the
EMCCD cameras EMCCD cameras - Although the operating wavelength of each of the
lasers imaging systems fluorescent sample 4, the operating wavelength of each of thelasers fluorescent sample 4 of any kind. In particular, the operating wavelength of each of thelasers fluorescent sample 4. - Although the
imaging systems fluorescent sample 4 and collecting fluorescence from the same side of thefluorescent sample 4, theimaging systems fluorescent sample 4 opposite to the illuminated side of thefluorescent sample 4. In other words, the referencetransmission imaging systems FIGS. 1 and21 may be operated as detection arrangements which are additional or alternative to thedetection arrangements CCD camera fluorescence Hadamard pattern fluorescent sample 4. EachCCD camera controller processing resources controllers fluorescence Hadamard pattern fluorescent sample 4 in a similar manner to that already described above in relation to thefluorescence EMCCD cameras - Although the
fluorescent sample 4, thescattering medium 6 and the end of theillumination objective 18 adjacent to thescattering medium 6 are described above enclosed in a custom-made chamber filled withwater 19, one of ordinary skill in the art will understand that one or more of thefluorescent sample 4, thescattering medium 6 and the end of theillumination objective 18 may not be enclosed in a chamber of any kind. One or more of thefluorescent sample 4, thescattering medium 6 and the end of theillumination objective 18 may not be immersed in water. - Although the systems and methods described above use a plurality of Hadamard radiation patterns, it should be understood that the systems and methods may use any orthonormal basis set of spatial radiation patterns. The plurality of spatial patterns of incident electromagnetic radiation may comprise a full orthonormal basis set of spatial radiation patterns. The plurality of spatial patterns of incident electromagnetic radiation may comprise a subset of a full orthonormal basis set of spatial radiation patterns.
- The plurality of spatial patterns of incident electromagnetic radiation may comprise a plurality of binary spatial radiation patterns.
- The plurality of spatial patterns of incident electromagnetic radiation may comprise Hermite-Gaussian modes, Laguerre-Gaussian modes, Bessel modes or eigenmodes such as optical eigenmodes.
- Although the methods described above comprise constructing the image of the fluorescent sample from the plurality of measured fluorescence values using an orthogonal matching pursuit algorithm, it should be understood that other algorithms may be used to construct the image of the fluorescent sample from the plurality of measured fluorescence values.
- The plurality of spatial patterns of incident electromagnetic radiation may comprise a plurality of greyscale spatial radiation patterns. For example, the plurality of spatial patterns of incident electromagnetic radiation may comprise a plurality of sinusoidal spatial radiation patterns, wherein each sinusoidal spatial radiation pattern has a different spatial frequency. The plurality of spatial patterns of incident electromagnetic radiation may comprise a number N of phase-shifting sinusoidal radiation patterns for each spatial frequency, wherein each phase-shifting sinusoidal radiation pattern has a phase shift of 2π/N relative to an adjacent one of the phase-shifting sinusoidal radiation patterns. The plurality of spatial patterns of incident electromagnetic radiation may comprise four phase-shifting sinusoidal radiation patterns for each spatial frequency, wherein each phase-shifting sinusoidal radiation pattern has a phase shift of π/2 relative to an adjacent one of the phase-shifting sinusoidal radiation patterns. The method may comprise constructing the image of the fluorescent sample from the plurality of measured fluorescence values by determining an inverse Fourier transform of the plurality of measured fluorescence values.
- Although the methods described above comprise illuminating a fluorescent sample through the scattering medium with a plurality of spatial patterns of incident electromagnetic radiation for the multi-photon fluorescence excitation of the fluorescent sample, and measuring, for each spatial pattern of incident electromagnetic radiation, fluorescence generated by the fluorescent sample, one of ordinary skill in the art will understand that the sample need not be fluorescent and that the method may comprise illuminating the sample through the scattering medium with a plurality of spatial patterns of incident electromagnetic radiation, and measuring, for each spatial pattern of incident electromagnetic radiation, emitted electromagnetic radiation generated by the sample as a result of an interaction of the incident electromagnetic radiation with the sample, wherein the emitted electromagnetic radiation is not fluorescence.
- One of ordinary skill in the art will also understand that the system for use in imaging a sample may be adapted according to the nature of the sample to be imaged and/or the nature of the interaction of the incident electromagnetic radiation with the sample which generates the emitted electromagnetic radiation. For example, the system may comprise an illumination arrangement for illuminating the sample through the scattering medium with a plurality of spatial patterns of incident electromagnetic radiation, which illumination arrangement is adapted according to the nature of the sample to be imaged and/or the nature of the interaction of the incident electromagnetic radiation with the sample which generates the emitted electromagnetic radiation. The illumination arrangement may include an optical source which is capable of producing a beam of incident electromagnetic radiation having properties such as wavelength, pulse duration and power which are selected according to the nature of the sample to be imaged and/or the nature of the interaction of the incident electromagnetic radiation with the sample which generates the emitted electromagnetic radiation. Similarly, the system may comprise a detection arrangement for measuring, for each spatial pattern of incident electromagnetic radiation, emitted electromagnetic radiation generated by the sample as a result of an interaction of the incident electromagnetic radiation with the sample, which detection arrangement is adapted according to the nature of the sample to be imaged and/or the nature of the interaction of the incident electromagnetic radiation with the sample which generates the emitted electromagnetic radiation. For example, the detection arrangement may include one or more suitable optical elements such as filters, spectrometers or the like for measuring, for each spatial pattern of incident electromagnetic radiation, the emitted electromagnetic radiation generated by the sample as a result of the interaction of the incident electromagnetic radiation with the sample.
- The detection arrangement may be configured for measuring the emitted electromagnetic radiation generated by the sample without measuring a spatial distribution of the emitted electromagnetic radiation. The detection arrangement may comprise a single pixel detector for measuring the emitted electromagnetic radiation incident on the single pixel detector. The detection arrangement may comprise a multi-pixel detector having a plurality of pixels such as an image sensor, and wherein the detection arrangement is configured to measure the total emitted electromagnetic radiation incident on the plurality of the pixels.
- The incident electromagnetic radiation and the emitted electromagnetic radiation may have different spectra. The incident electromagnetic radiation may comprise light, for example infrared, visible or UV light. The emitted electromagnetic radiation may comprise light, for example infrared, visible or UV light. The emitted electromagnetic radiation may comprise THz radiation.
- The emitted electromagnetic radiation may be generated by the sample as a result of a non-linear optical interaction of the incident electromagnetic radiation with the sample. The emitted electromagnetic radiation comprises a harmonic of the incident electromagnetic radiation, such as a second harmonic of the incident electromagnetic radiation or a third harmonic of the incident electromagnetic radiation.
- The emitted electromagnetic radiation may be generated as a result of inelastic scattering by the sample.
- The emitted electromagnetic radiation may be generated as a result of Raman scattering by the sample.
- The emitted electromagnetic radiation may be generated as a result of coherent or stimulated Raman scattering by the sample.
- The emitted electromagnetic radiation may be generated as a result of Coherent Anti-Stokes Raman Scattering (CARS) by the sample.
Claims (15)
- A method for use in imaging a sample (4) through a scattering medium (6), or for use in imaging a sub-surface region of a sample through a scattering surface region of the sample, the method comprising:illuminating the sample (4) through the scattering medium (6), or illuminating the sub-surface region of the sample through the scattering surface region of the sample, with a plurality of spatial patterns (11) of incident electromagnetic radiation (46), wherein the incident electromagnetic radiation (46) is coherent and comprises a stream of pulses of incident electromagnetic radiation (46), and wherein each spatial pattern (11) of incident electromagnetic radiation (46) interacts with the sample (4), or the sub-surface region of the sample, to generate electromagnetic radiation (22) in the sample (4) or the sub-surface region of the sample;using single pixel detection to measure, for each spatial pattern (11) of incident electromagnetic radiation (46), a corresponding value representative of a quantity of at least a portion of the emitted electromagnetic radiation (22); andusing the plurality of spatial patterns (11) of incident electromagnetic radiation (46) and the plurality of corresponding measured values to determine an image of the sample (4), or an image of the sub-surface region of the sample, without using a spatial distribution of the emitted electromagnetic radiation (22),wherein the incident electromagnetic radiation (46) comprises a range of different wavelengths and the method comprises:dispersing the different wavelengths in the range of different wavelengths along different paths through the scattering medium (6) and focusing the different wavelengths to the same focal plane or the same focal volume within the sample (4); ordispersing the different wavelengths in the range of different wavelengths along different paths through the scattering surface region of the sample and focusing the different wavelengths to the same focal plane or the same focal volume within the sub-surface region of the sample.
- The method of claim 1, wherein at least one of:the plurality of spatial patterns (11) of incident electromagnetic radiation (46) comprises a set of mutually complementary spatial radiation patterns and/or a set of pairs of inverse spatial radiation patterns; andthe plurality of spatial patterns (11) of incident electromagnetic radiation (46) comprises a full orthonormal basis set of spatial radiation patterns or a subset of a full orthonormal basis set of spatial radiation patterns.
- The method of any preceding claim, wherein at least one of:the plurality of spatial patterns (11) of incident electromagnetic radiation (46) comprises a plurality of binary spatial radiation patterns;the plurality of spatial patterns (11) of incident electromagnetic radiation (46) comprises a set of Hadamard radiation patterns; andthe plurality of spatial patterns (11) of incident electromagnetic radiation (46) comprise Hermite-Gaussian modes, Laguerre-Gaussian modes, Bessel modes or eigenmodes such as optical eigenmodes.
- The method of claim 1 or 2, wherein the plurality of spatial patterns (11) of incident electromagnetic radiation (46) comprises a plurality of greyscale spatial radiation patterns and, optionally, wherein the plurality of spatial patterns (11) of incident electromagnetic radiation (46) comprises a plurality of sinusoidal spatial radiation patterns, wherein each sinusoidal spatial radiation pattern has a different spatial frequency and, optionally, wherein the plurality of spatial patterns (11) of incident electromagnetic radiation (46) comprises a number N of phase-shifting sinusoidal radiation patterns for each spatial frequency, wherein each phase-shifting sinusoidal radiation pattern has a phase shift of 2π/N relative to an adjacent one of the phase-shifting sinusoidal radiation patterns.
- The method of any preceding claim, wherein the plurality of spatial patterns (11) of incident electromagnetic radiation (46) may be selected or configured for imaging beyond the diffraction limit or for super-resolution imaging.
- The method of any preceding claim, wherein using the plurality of spatial patterns (11) of incident electromagnetic radiation (46) and the plurality of corresponding measured values to determine the image of the sample (4) or the image of the sub-surface region of the sample comprises using an image construction algorithm to construct the image of the sample (4) or the sub-surface region of the sample from the plurality of spatial patterns (11) of incident electromagnetic radiation (46) and the plurality of corresponding measured values and/or wherein using the plurality of spatial patterns (11) of incident electromagnetic radiation (46) and the plurality of corresponding measured values to determine the image of the sample (4) or the image of the sub-surface region of the sample comprises using an orthogonal matching pursuit algorithm to construct the image of the sample (4) or the sub-surface region of the sample from the plurality of spatial patterns (11) of incident electromagnetic radiation (46) and the plurality of corresponding measured values.
- The method of claim 4, wherein using the plurality of spatial patterns (11) of incident electromagnetic radiation (46) and the plurality of corresponding measured values to determine the image of the sample (4) or the image of the sub-surface region of the sample comprises determining an inverse Fourier transform of the plurality of measured values.
- The method of any preceding claim,wherein measuring, for each spatial pattern (11) of incident electromagnetic radiation (46), the corresponding value representative of a quantity of at least a portion of the emitted electromagnetic radiation (22) comprises using a single pixel detector to measure the power or the intensity of the emitted electromagnetic radiation (22) which is incident on the single pixel detector, orwherein measuring, for each spatial pattern (11) of incident electromagnetic radiation (46), the corresponding value representative of a quantity of at least a portion of the emitted electromagnetic radiation (22) comprises measuring, for each spatial pattern (11) of incident electromagnetic radiation (46):the power or the intensity of the emitted electromagnetic radiation (22) incident on a single pixel of a multi-pixel detector (28) such as an image sensor; orspatially integrating the power or the intensity of the emitted electromagnetic radiation (22) incident on a plurality of the pixels of the multi-pixel detector (28).
- The method of any preceding claim, comprising sequentially illuminating the sample (4) through the scattering medium (6) or sequentially illuminating the sub-surface region of the sample through the scattering surface region of the sample with the plurality of spatial patterns (11) of incident electromagnetic radiation (46).
- The method of any preceding claim, comprising:illuminating one side of the sample (4) through the scattering medium (6) or one side of the sub-surface region of the sample through the scattering surface region of the sample; andmeasuring the value representative of a quantity of at least a portion of the emitted electromagnetic radiation (22) emitted from the same side of the sample (4) through the same scattering medium (6) or emitted from the same side of the sub-surface region of the sample through the same scattering surface region of the sample; and/or the method comprising:using a lens (18) to illuminate the sample (4) or the sub-surface region of the sample; andusing the same lens (18) to collect at least a portion of the emitted electromagnetic radiation (22).
- The method of any preceding claim, comprising using temporal focusing to focus each spatial pattern (11) of incident electromagnetic radiation (46) to the focal plane or the focal volume.
- An imaging system (2) for use in imaging a sample (4) through a scattering medium (6), or for use in imaging a sub-surface region of a sample through a scattering surface region of the sample, the system (2) comprising:an illumination arrangement (10) for illuminating the sample (4) through the scattering medium (6), or illuminating the sub-surface region of the sample through the scattering surface region of the sample, with a plurality of spatial patterns (11) of incident electromagnetic radiation (46), wherein the incident electromagnetic radiation (46) is coherent and comprises a stream of pulses of incident electromagnetic radiation (46), and wherein each spatial pattern (11) of incident electromagnetic radiation (46) interacts with the sample (4), or the sub-surface region of the sample, to generate electromagnetic radiation (22) in the sample (4) or the sub-surface region of the sample;a detection arrangement (20) for measuring, for each spatial pattern (11) of incident electromagnetic radiation (46), a corresponding value representative of a quantity of at least a portion of the emitted electromagnetic radiation (22) using single pixel detection; anda processing resource (52) configured to use the plurality of spatial patterns (11) of incident electromagnetic radiation (46) and the plurality of corresponding measured values to determine an image of the sample (4), or an image of the sub-surface region of the sample, without using a spatial distribution of the emitted electromagnetic radiation (22),wherein the illumination arrangement (10) is configured to provide the incident electromagnetic radiation (46) with a range of different wavelengths, and to:disperse the different wavelengths in the range of different wavelengths along different paths through the scattering medium (6), and to focus the different wavelengths to the same focal plane or the same focal volume within the sample (4); ordisperse the different wavelengths in the range of different wavelengths along different paths through the scattering surface region of the sample, and to focus the different wavelengths to the same focal plane or the same focal volume within the sub-surface region of the sample.
- The imaging system (2) of claim 12, wherein the detection arrangement (20) comprises a single pixel detector for measuring the power or intensity of the emitted electromagnetic radiation (22) incident on the single pixel detector, or
wherein the detection arrangement (20) comprises a multi-pixel detector (28) having a plurality of pixels such as an image sensor, and wherein the detection arrangement (20) is configured:to measure the power or the intensity of the emitted electromagnetic radiation (22) incident on a single pixel of the multi-pixel detector (28), orto spatially integrate the power or the intensity of the emitted electromagnetic radiation (22) incident on a plurality of the pixels of the multi-pixel detector (28). - The imaging system (2) of claim 12 or 13, wherein at least one of:the illumination arrangement (10) is configured to sequentially illuminate the sample (4) through the scattering medium (6) or to sequentially illuminate the sub-surface region of the sample through the scattering surface region of the sample with the plurality of spatial patterns (11) of incident electromagnetic radiation (46);the illumination arrangement (10) comprises a spatial modulation arrangement (14) for imposing each spatial pattern (11) onto a beam of incident electromagnetic radiation (42) so as to provide the corresponding spatial pattern (11) of incident electromagnetic radiation;the spatial modulation arrangement (14) comprises a diffractive spatial modulation arrangement such as a spatial light modulator or a digital micro-mirror device;the illumination arrangement (10) is configured to use temporal focusing to focus each spatial pattern (11) of incident electromagnetic radiation (46) to the same focal plane or the same focal volume;the illumination arrangement (10) comprises a dispersive element (16) such as a diffraction grating;the illumination arrangement (10) is configured to illuminate one side of the sample (4) through the scattering medium (6) or one side of the sub-surface region of the sample through the scattering surface region of the sample, and the detection arrangement (20) is configured to measure the value representative of the quantity of at least a portion of the emitted electromagnetic radiation (22) emitted from the same side of the sample (4) through the same scattering medium (6) or emitted from the same side of the sub-surface region of the sample through the same scattering surface region of the sample;the imaging system (2) comprises a lens (18), such as a microscope objective, configured to illuminate the sample (4) or the sub-surface region of the sample, and the same lens (18) is configured to collect at least a portion of the emitted electromagnetic radiation (22) emitted from the sample (4) through the same scattering medium (6) or emitted from the sub-surface region of the sample through the same scattering surface region of the sample;the illumination arrangement (10) comprises a source (12) for emitting the beam of incident electromagnetic radiation;the source(12) is tuneable; andwherein at least one of:the imaging system (2) is configured for microscopy;the imaging system (2) is configured for use with a microscope; andthe imaging system (2) comprises a microscope.
- The method of any one of claims 1 to 11 or the imaging system (2) of any one of claims 12 to 14, wherein at least one of:the incident electromagnetic radiation (46) and the emitted electromagnetic radiation (22) have different spectra and/or one or more different wavelengths;the incident electromagnetic radiation (46) comprises light, for example infrared, visible or UV light;the emitted electromagnetic radiation (22) comprises light, for example infrared, visible or UV light;the emitted electromagnetic radiation (22) comprises THz radiation;the emitted electromagnetic radiation (22) comprises fluorescence generated by the sample (4) or the sub-surface region of the sample as a result of excitation of the sample or the sub-surface region of the sample by the incident electromagnetic radiation (46);the incident electromagnetic radiation (46) is configured for two-photon or three-photon excitation of the sample (4) or the sub-surface region of the sample, for example wherein the incident electromagnetic radiation (46) includes an appropriate wavelength or range of wavelengths for two-photon or three-photon excitation of the sample (4) or the sub-surface region of the sample;the emitted electromagnetic radiation (22) is generated by the sample (4) or the sub-surface region of the sample as a result of a non-linear optical interaction between the incident electromagnetic radiation (46) and the sample (4) or the sub-surface region of the sample;the emitted electromagnetic radiation (22) comprises a harmonic of the incident electromagnetic radiation (46), such as a second harmonic of the incident electromagnetic radiation (46) or a third harmonic of the incident electromagnetic radiation (46);the emitted electromagnetic radiation (22) is generated as a result of inelastic scattering by the sample (4) or the sub-surface region of the sample;the emitted electromagnetic radiation (22) is generated as a result of Raman scattering by the sample (4) or the sub-surface region of the sample;the emitted electromagnetic radiation (22) is generated as a result of coherent or stimulated Raman scattering by the sample (4) or the sub-surface region of the sample;the emitted electromagnetic radiation (22) is generated as a result of Coherent Anti-Stokes Raman Scattering (CARS) by the sample (4) or the sub-surface region of the sample;the sample (4) or the sub-surface region of the sample is fluorescent;the sample (4) or the sub-surface region of the sample comprises one or more exogenous fluorophores such as a green fluorescent protein or a red fluorescent protein and/or the fluorescent sample comprises one or more endogenous fluorophores such as NADH and/or flavins;the scattering medium (6) or the scattering surface region of the sample is fluorescent;the sample (4) or the sub-surface region of the sample scatters the incident electromagnetic radiation (46) and/or the emitted electromagnetic radiation (22) generated by the sample (4) or the sub-surface region of the sample;one or both of the sample (4) and the scattering medium (6) comprises biological material or wherein one or both of the sub-surface region of the sample and the scattering surface region of the sample comprise biological material;one or both of the sample (4) and the scattering medium (6) comprises human or animal tissue or wherein one or both of the sub-surface region of the sample and the scattering surface region of the sample comprises human or animal tissue;wherein each pulse of incident electromagnetic radiation (46) has a duration of 1 ps or less, 500 fs or less, 100 - 200 fs, or 10 - 100 fs;the incident electromagnetic radiation (46) has an average power in the range 100 - 500 mW, 10 mW - 100 mW or 1mW - 10 mW;the value representative of the quantity of at least a portion of the emitted electromagnetic radiation (22) comprises a power or intensity value of at least a portion of the emitted electromagnetic radiation (22) such as a relative or absolute power or intensity value of at least a portion of the emitted electromagnetic radiation (22); andthe sub-surface region of the sample comprises an extended region of the sample, for example a 2D region of the sample such as a plane, or a 3D region of the sample.
Applications Claiming Priority (2)
| Application Number | Priority Date | Filing Date | Title |
|---|---|---|---|
| GB1715385.9A GB2566115B (en) | 2017-09-22 | 2017-09-22 | Imaging of a sample through a scattering medium |
| PCT/GB2018/052684 WO2019058122A1 (en) | 2017-09-22 | 2018-09-20 | Imaging of a sample through a scattering medium |
Publications (3)
| Publication Number | Publication Date |
|---|---|
| EP3685205A1 EP3685205A1 (en) | 2020-07-29 |
| EP3685205C0 EP3685205C0 (en) | 2025-07-02 |
| EP3685205B1 true EP3685205B1 (en) | 2025-07-02 |
Family
ID=60244521
Family Applications (1)
| Application Number | Title | Priority Date | Filing Date |
|---|---|---|---|
| EP18778985.4A Active EP3685205B1 (en) | 2017-09-22 | 2018-09-20 | Imaging of a sample through a scattering medium |
Country Status (4)
| Country | Link |
|---|---|
| US (1) | US11204319B2 (en) |
| EP (1) | EP3685205B1 (en) |
| GB (1) | GB2566115B (en) |
| WO (1) | WO2019058122A1 (en) |
Families Citing this family (20)
| Publication number | Priority date | Publication date | Assignee | Title |
|---|---|---|---|---|
| WO2019148024A1 (en) * | 2018-01-26 | 2019-08-01 | Park Jong Kang | Systems and methods to reduce scattering in temporal focusing multiphoton microscopy |
| CN110132901B (en) * | 2019-05-21 | 2020-07-31 | 北京理工大学 | System and method for synthetic aperture through scattering media imaging |
| CN110208294A (en) * | 2019-06-18 | 2019-09-06 | 华东交通大学 | Single pixel micro imaging method and system based on Kohler illumination |
| CN110673336A (en) * | 2019-09-11 | 2020-01-10 | 南京理工大学 | Apparatus and method for imaging objects through disordered media |
| US11835733B2 (en) * | 2019-09-16 | 2023-12-05 | California Institute Of Technology | Control light intensity through scattering media with speckle intensity sequencing |
| CN111479097B (en) * | 2020-03-25 | 2022-02-22 | 清华大学 | Scattering lens imaging system based on deep learning |
| CN112153254B (en) * | 2020-08-31 | 2022-02-25 | 合肥工业大学 | Two-step phase-shift single-pixel imaging method based on base map |
| US12474283B2 (en) | 2020-11-21 | 2025-11-18 | Bar Ilan University | System and method for mapping chemical elements in a sample |
| US12066617B2 (en) * | 2021-04-09 | 2024-08-20 | Uchicago Argonne, Llc | Ghost imaging second harmonic generation microscopy |
| WO2022232210A1 (en) * | 2021-04-29 | 2022-11-03 | Arizona Board Of Regents On Behalf Of The University Of Arizona | All-optical light field sampling with attosecond resolution |
| CN118235174A (en) * | 2021-08-04 | 2024-06-21 | 库伊有限公司 | Silent speech detection |
| US12216749B2 (en) | 2021-08-04 | 2025-02-04 | Q (Cue) Ltd. | Using facial skin micromovements to identify a user |
| CN113884234B (en) * | 2021-09-06 | 2023-06-09 | 中国科学院合肥物质科学研究院 | A complementary single-pixel centroid detection system and method |
| TWI773603B (en) * | 2021-11-30 | 2022-08-01 | 國立清華大學 | Compressed sensing imaging method and compressed sensing imaging system |
| JP2024542786A (en) * | 2021-12-01 | 2024-11-15 | ザ レジェンツ オブ ザ ユニバーシティ オブ ミシガン | Apparatus and method for determining chiral optical properties from third harmonic Mie scattering of semiconductor nanohelices - Patents.com |
| IL318490A (en) | 2022-07-20 | 2025-03-01 | Q Cue Ltd | Detecting and utilizing facial micromovements |
| US12339223B2 (en) | 2022-12-06 | 2025-06-24 | Samsung Electronics Co., Ltd. | Measuring apparatus and testing apparatus having the same |
| JPWO2024210202A1 (en) * | 2023-04-05 | 2024-10-10 | ||
| CN117806036B (en) * | 2024-03-01 | 2024-05-17 | 中国科学院光电技术研究所 | Achromatic method of monolithic diffraction lens system based on compressed sensing |
| CN118518618B (en) * | 2024-07-24 | 2024-11-01 | 中国科学院上海高等研究院 | Ultra-high resolution terahertz imaging system and method |
Family Cites Families (11)
| Publication number | Priority date | Publication date | Assignee | Title |
|---|---|---|---|---|
| US7006231B2 (en) | 2001-10-18 | 2006-02-28 | Scimed Life Systems, Inc. | Diffraction grating based interferometric systems and methods |
| US10018818B2 (en) * | 2007-05-16 | 2018-07-10 | Photonanoscopy Corporation | Structured standing wave microscope |
| DE102007045897A1 (en) * | 2007-09-26 | 2009-04-09 | Carl Zeiss Microimaging Gmbh | Method for the microscopic three-dimensional imaging of a sample |
| WO2012050901A2 (en) * | 2010-09-28 | 2012-04-19 | The Regents Of The University Of Colorado, A Body Corporate | Fourier domain sensing |
| US8817255B2 (en) * | 2010-12-17 | 2014-08-26 | Canon Kabushiki Kaisha | Apparatus and method for irradiating a scattering medium |
| US9867525B2 (en) * | 2011-04-01 | 2018-01-16 | Nanyang Technological University | High sensitivity temporal focusing widefield multiphoton endoscope capable of deep imaging |
| US20140313315A1 (en) | 2011-11-15 | 2014-10-23 | Technion Research & Development Foundation Limited | Method and system for transmitting light |
| DE102014119255A1 (en) * | 2014-12-19 | 2016-06-23 | Carl Zeiss Microscopy Gmbh | Method for light-sheet microscopic examination of a sample |
| JP2016217860A (en) * | 2015-05-20 | 2016-12-22 | キヤノン株式会社 | Control device, measuring device, control method, program, and storage medium |
| CA3042229A1 (en) | 2016-10-30 | 2018-05-03 | University Of Vienna | High speed deep tissue imaging system using multiplexed scanned temporal focusing |
| CN107144955A (en) | 2017-05-15 | 2017-09-08 | 清华大学 | The structure light micro imaging system that space-time is focused on is scanned based on line |
-
2017
- 2017-09-22 GB GB1715385.9A patent/GB2566115B/en active Active
-
2018
- 2018-09-20 EP EP18778985.4A patent/EP3685205B1/en active Active
- 2018-09-20 WO PCT/GB2018/052684 patent/WO2019058122A1/en not_active Ceased
- 2018-09-20 US US16/649,563 patent/US11204319B2/en active Active
Non-Patent Citations (1)
| Title |
|---|
| DURÁN V. ET AL: "Compressive imaging in scattering media", OPTICS EXPRESS, vol. 23, no. 11, 1 June 2015 (2015-06-01), US, pages 14424, XP055948896, ISSN: 2161-2072, DOI: 10.1364/OE.23.014424 * |
Also Published As
| Publication number | Publication date |
|---|---|
| US11204319B2 (en) | 2021-12-21 |
| US20200284724A1 (en) | 2020-09-10 |
| GB2566115B (en) | 2020-04-01 |
| GB2566115A (en) | 2019-03-06 |
| EP3685205A1 (en) | 2020-07-29 |
| GB201715385D0 (en) | 2017-11-08 |
| EP3685205C0 (en) | 2025-07-02 |
| WO2019058122A1 (en) | 2019-03-28 |
Similar Documents
| Publication | Publication Date | Title |
|---|---|---|
| US11204319B2 (en) | Imaging of a sample through a scattering medium | |
| Calovi et al. | Super-resolution STED microscopy in live brain tissue | |
| DE112019004851B4 (en) | Device for fast volumetric fluorescence microscopy using time-multiplexed light sheets | |
| Fahrbach et al. | Light-sheet microscopy in thick media using scanned Bessel beams and two-photon fluorescence excitation | |
| US7542137B2 (en) | Pathogen detection using coherent anti-stokes Raman scattering microscopy | |
| Meng et al. | Optimizing signal collection efficiency of the VIPA-based Brillouin spectrometer | |
| JP2019521316A (en) | Fluorescence imaging flow cytometry with improved image resolution | |
| EP2780755A2 (en) | Method and system for transmitting light | |
| Bewerunge et al. | Experimental creation and characterization of random potential-energy landscapes exploiting speckle patterns | |
| WO2011128645A1 (en) | Optical eigenmode imaging | |
| Kosmeier et al. | Nonredundant Raman imaging using optical eigenmodes | |
| Chang et al. | Temporal focusing‐based widefield multiphoton microscopy with spatially modulated illumination for biotissue imaging | |
| WO2016189095A1 (en) | Apparatus for imaging at least one object | |
| EP2941662B1 (en) | Differential infra red nanoscopy system and method | |
| Inazawa et al. | Enhancement of optical sectioning capability of temporal focusing microscopy by using time-multiplexed multi-line focusing | |
| Wang et al. | Compressed ultrafast photography | |
| Field et al. | Differential multiphoton laser scanning microscopy | |
| CA2594444C (en) | Pathogen detection using coherent anti-stokes raman scattering microscopy | |
| Trifonov et al. | Limits to resolution of cw sted microscopy | |
| Cheng et al. | An excitation wavelength switching to enhance dual-color wide-field temporal-focusing multiphoton excitation fluorescence imaging | |
| Wijesinghe et al. | Widefield multiphoton imaging at depth with temporal focusing | |
| Ronchi | Enhanced light-harvesting and time-resolved detection in diffuse Raman spectroscopy | |
| Heffernan | Light with orbital angular momentum in optical fiber with applications in stimulated emission depletion microscopy | |
| Escobet-Montalbán et al. | Wide-field multiphoton imaging with TRAFIX | |
| Arpali et al. | Beam shaping on a fluorescent on-chip imaging system |
Legal Events
| Date | Code | Title | Description |
|---|---|---|---|
| STAA | Information on the status of an ep patent application or granted ep patent |
Free format text: STATUS: UNKNOWN |
|
| STAA | Information on the status of an ep patent application or granted ep patent |
Free format text: STATUS: THE INTERNATIONAL PUBLICATION HAS BEEN MADE |
|
| PUAI | Public reference made under article 153(3) epc to a published international application that has entered the european phase |
Free format text: ORIGINAL CODE: 0009012 |
|
| STAA | Information on the status of an ep patent application or granted ep patent |
Free format text: STATUS: REQUEST FOR EXAMINATION WAS MADE |
|
| 17P | Request for examination filed |
Effective date: 20200406 |
|
| AK | Designated contracting states |
Kind code of ref document: A1 Designated state(s): AL AT BE BG CH CY CZ DE DK EE ES FI FR GB GR HR HU IE IS IT LI LT LU LV MC MK MT NL NO PL PT RO RS SE SI SK SM TR |
|
| AX | Request for extension of the european patent |
Extension state: BA ME |
|
| DAV | Request for validation of the european patent (deleted) | ||
| DAX | Request for extension of the european patent (deleted) | ||
| STAA | Information on the status of an ep patent application or granted ep patent |
Free format text: STATUS: EXAMINATION IS IN PROGRESS |
|
| 17Q | First examination report despatched |
Effective date: 20220810 |
|
| P01 | Opt-out of the competence of the unified patent court (upc) registered |
Effective date: 20230529 |
|
| GRAP | Despatch of communication of intention to grant a patent |
Free format text: ORIGINAL CODE: EPIDOSNIGR1 |
|
| STAA | Information on the status of an ep patent application or granted ep patent |
Free format text: STATUS: GRANT OF PATENT IS INTENDED |
|
| RIC1 | Information provided on ipc code assigned before grant |
Ipc: G01N 21/47 20060101ALN20240529BHEP Ipc: G02B 21/36 20060101ALI20240529BHEP Ipc: G01N 21/64 20060101ALI20240529BHEP Ipc: G02B 21/00 20060101AFI20240529BHEP |
|
| INTG | Intention to grant announced |
Effective date: 20240624 |
|
| GRAJ | Information related to disapproval of communication of intention to grant by the applicant or resumption of examination proceedings by the epo deleted |
Free format text: ORIGINAL CODE: EPIDOSDIGR1 |
|
| STAA | Information on the status of an ep patent application or granted ep patent |
Free format text: STATUS: EXAMINATION IS IN PROGRESS |
|
| INTC | Intention to grant announced (deleted) | ||
| RAP1 | Party data changed (applicant data changed or rights of an application transferred) |
Owner name: THE UNIVERSITY OF ADELAIDE |
|
| GRAP | Despatch of communication of intention to grant a patent |
Free format text: ORIGINAL CODE: EPIDOSNIGR1 |
|
| STAA | Information on the status of an ep patent application or granted ep patent |
Free format text: STATUS: GRANT OF PATENT IS INTENDED |
|
| RIC1 | Information provided on ipc code assigned before grant |
Ipc: G01N 21/47 20060101ALN20250107BHEP Ipc: G02B 21/36 20060101ALI20250107BHEP Ipc: G01N 21/64 20060101ALI20250107BHEP Ipc: G02B 21/00 20060101AFI20250107BHEP |
|
| INTG | Intention to grant announced |
Effective date: 20250123 |
|
| GRAS | Grant fee paid |
Free format text: ORIGINAL CODE: EPIDOSNIGR3 |
|
| GRAA | (expected) grant |
Free format text: ORIGINAL CODE: 0009210 |
|
| STAA | Information on the status of an ep patent application or granted ep patent |
Free format text: STATUS: THE PATENT HAS BEEN GRANTED |
|
| AK | Designated contracting states |
Kind code of ref document: B1 Designated state(s): AL AT BE BG CH CY CZ DE DK EE ES FI FR GR HR HU IE IS IT LI LT LU LV MC MK MT NL NO PL PT RO RS SE SI SK SM TR |
|
| RBV | Designated contracting states (corrected) |
Designated state(s): AL AT BE BG CH CY CZ DE DK EE ES FI FR GR HR HU IE IS IT LI LT LU LV MC MK MT NL NO PL PT RO RS SE SI SK SM TR |
|
| REG | Reference to a national code |
Ref country code: CH Ref legal event code: EP |
|
| REG | Reference to a national code |
Ref country code: DE Ref legal event code: R096 Ref document number: 602018083208 Country of ref document: DE |
|
| REG | Reference to a national code |
Ref country code: IE Ref legal event code: FG4D |
|
| U01 | Request for unitary effect filed |
Effective date: 20250730 |
|
| U07 | Unitary effect registered |
Designated state(s): AT BE BG DE DK EE FI FR IT LT LU LV MT NL PT RO SE SI Effective date: 20250805 |
|
| U20 | Renewal fee for the european patent with unitary effect paid |
Year of fee payment: 8 Effective date: 20250922 |
|
| PG25 | Lapsed in a contracting state [announced via postgrant information from national office to epo] |
Ref country code: IS Free format text: LAPSE BECAUSE OF FAILURE TO SUBMIT A TRANSLATION OF THE DESCRIPTION OR TO PAY THE FEE WITHIN THE PRESCRIBED TIME-LIMIT Effective date: 20251102 |
|
| PG25 | Lapsed in a contracting state [announced via postgrant information from national office to epo] |
Ref country code: NO Free format text: LAPSE BECAUSE OF FAILURE TO SUBMIT A TRANSLATION OF THE DESCRIPTION OR TO PAY THE FEE WITHIN THE PRESCRIBED TIME-LIMIT Effective date: 20251002 |
|
| PG25 | Lapsed in a contracting state [announced via postgrant information from national office to epo] |
Ref country code: HR Free format text: LAPSE BECAUSE OF FAILURE TO SUBMIT A TRANSLATION OF THE DESCRIPTION OR TO PAY THE FEE WITHIN THE PRESCRIBED TIME-LIMIT Effective date: 20250702 |
|
| PG25 | Lapsed in a contracting state [announced via postgrant information from national office to epo] |
Ref country code: GR Free format text: LAPSE BECAUSE OF FAILURE TO SUBMIT A TRANSLATION OF THE DESCRIPTION OR TO PAY THE FEE WITHIN THE PRESCRIBED TIME-LIMIT Effective date: 20251003 |
|
| PG25 | Lapsed in a contracting state [announced via postgrant information from national office to epo] |
Ref country code: CZ Free format text: LAPSE BECAUSE OF FAILURE TO SUBMIT A TRANSLATION OF THE DESCRIPTION OR TO PAY THE FEE WITHIN THE PRESCRIBED TIME-LIMIT Effective date: 20250702 |
|
| PG25 | Lapsed in a contracting state [announced via postgrant information from national office to epo] |
Ref country code: PL Free format text: LAPSE BECAUSE OF FAILURE TO SUBMIT A TRANSLATION OF THE DESCRIPTION OR TO PAY THE FEE WITHIN THE PRESCRIBED TIME-LIMIT Effective date: 20250702 |
|
| PG25 | Lapsed in a contracting state [announced via postgrant information from national office to epo] |
Ref country code: RS Free format text: LAPSE BECAUSE OF FAILURE TO SUBMIT A TRANSLATION OF THE DESCRIPTION OR TO PAY THE FEE WITHIN THE PRESCRIBED TIME-LIMIT Effective date: 20251002 |
|
| PG25 | Lapsed in a contracting state [announced via postgrant information from national office to epo] |
Ref country code: ES Free format text: LAPSE BECAUSE OF FAILURE TO SUBMIT A TRANSLATION OF THE DESCRIPTION OR TO PAY THE FEE WITHIN THE PRESCRIBED TIME-LIMIT Effective date: 20250702 |
|
| PG25 | Lapsed in a contracting state [announced via postgrant information from national office to epo] |
Ref country code: SM Free format text: LAPSE BECAUSE OF FAILURE TO SUBMIT A TRANSLATION OF THE DESCRIPTION OR TO PAY THE FEE WITHIN THE PRESCRIBED TIME-LIMIT Effective date: 20250702 |
|
| PG25 | Lapsed in a contracting state [announced via postgrant information from national office to epo] |
Ref country code: SK Free format text: LAPSE BECAUSE OF FAILURE TO SUBMIT A TRANSLATION OF THE DESCRIPTION OR TO PAY THE FEE WITHIN THE PRESCRIBED TIME-LIMIT Effective date: 20250702 |
|
| U1N | Appointed representative for the unitary patent procedure changed after the registration of the unitary effect |
Representative=s name: MARKS & CLERK LLP; GB |
|
| REG | Reference to a national code |
Ref country code: CH Ref legal event code: H13 Free format text: ST27 STATUS EVENT CODE: U-0-0-H10-H13 (AS PROVIDED BY THE NATIONAL OFFICE) Effective date: 20260504 |
|
| PLBE | No opposition filed within time limit |
Free format text: ORIGINAL CODE: 0009261 |
|
| STAA | Information on the status of an ep patent application or granted ep patent |
Free format text: STATUS: NO OPPOSITION FILED WITHIN TIME LIMIT |
|
| REG | Reference to a national code |
Ref country code: CH Ref legal event code: L10 Free format text: ST27 STATUS EVENT CODE: U-0-0-L10-L00 (AS PROVIDED BY THE NATIONAL OFFICE) Effective date: 20260518 |
|
| 26N | No opposition filed |
Effective date: 20260407 |
|
| PG25 | Lapsed in a contracting state [announced via postgrant information from national office to epo] |
Ref country code: MC Free format text: LAPSE BECAUSE OF FAILURE TO SUBMIT A TRANSLATION OF THE DESCRIPTION OR TO PAY THE FEE WITHIN THE PRESCRIBED TIME-LIMIT Effective date: 20250702 |
|
| U1K | Transfer of rights of the unitary patent after the registration of the unitary effect |
Owner name: ADELAIDE UNIVERSITY; AU |
|
| PG25 | Lapsed in a contracting state [announced via postgrant information from national office to epo] |
Ref country code: CH Free format text: LAPSE BECAUSE OF NON-PAYMENT OF DUE FEES Effective date: 20250930 Ref country code: IE Free format text: LAPSE BECAUSE OF NON-PAYMENT OF DUE FEES Effective date: 20250920 |