EP3675129A1 - Processing reads of sequenced nucleic acid - Google Patents
Processing reads of sequenced nucleic acid Download PDFInfo
- Publication number
- EP3675129A1 EP3675129A1 EP18248105.1A EP18248105A EP3675129A1 EP 3675129 A1 EP3675129 A1 EP 3675129A1 EP 18248105 A EP18248105 A EP 18248105A EP 3675129 A1 EP3675129 A1 EP 3675129A1
- Authority
- EP
- European Patent Office
- Prior art keywords
- mers
- mer
- counts
- determining
- node
- Prior art date
- Legal status (The legal status is an assumption and is not a legal conclusion. Google has not performed a legal analysis and makes no representation as to the accuracy of the status listed.)
- Withdrawn
Links
- 150000007523 nucleic acids Chemical class 0.000 title claims abstract description 21
- 108020004707 nucleic acids Proteins 0.000 title claims abstract description 20
- 102000039446 nucleic acids Human genes 0.000 title claims abstract description 20
- 238000012545 processing Methods 0.000 title claims abstract description 10
- 238000000034 method Methods 0.000 claims abstract description 33
- 238000001228 spectrum Methods 0.000 claims abstract description 27
- 238000004590 computer program Methods 0.000 claims description 2
- 230000001419 dependent effect Effects 0.000 claims 2
- 108091028043 Nucleic acid sequence Proteins 0.000 description 47
- 238000012163 sequencing technique Methods 0.000 description 19
- 238000009826 distribution Methods 0.000 description 18
- 239000002773 nucleotide Substances 0.000 description 18
- 125000003729 nucleotide group Chemical group 0.000 description 18
- 238000004891 communication Methods 0.000 description 4
- 230000006870 function Effects 0.000 description 4
- 230000007246 mechanism Effects 0.000 description 4
- 238000006467 substitution reaction Methods 0.000 description 4
- 230000003993 interaction Effects 0.000 description 3
- 230000003068 static effect Effects 0.000 description 3
- 241001138501 Salmonella enterica Species 0.000 description 2
- 238000004422 calculation algorithm Methods 0.000 description 2
- OPTASPLRGRRNAP-UHFFFAOYSA-N cytosine Chemical compound NC=1C=CNC(=O)N=1 OPTASPLRGRRNAP-UHFFFAOYSA-N 0.000 description 2
- 238000012217 deletion Methods 0.000 description 2
- 230000037430 deletion Effects 0.000 description 2
- UYTPUPDQBNUYGX-UHFFFAOYSA-N guanine Chemical compound O=C1NC(N)=NC2=C1N=CN2 UYTPUPDQBNUYGX-UHFFFAOYSA-N 0.000 description 2
- 238000003780 insertion Methods 0.000 description 2
- 230000037431 insertion Effects 0.000 description 2
- 238000004088 simulation Methods 0.000 description 2
- RWQNBRDOKXIBIV-UHFFFAOYSA-N thymine Chemical compound CC1=CNC(=O)NC1=O RWQNBRDOKXIBIV-UHFFFAOYSA-N 0.000 description 2
- 229930024421 Adenine Natural products 0.000 description 1
- GFFGJBXGBJISGV-UHFFFAOYSA-N Adenine Chemical compound NC1=NC=NC2=C1N=CN2 GFFGJBXGBJISGV-UHFFFAOYSA-N 0.000 description 1
- 108020004414 DNA Proteins 0.000 description 1
- 102000053602 DNA Human genes 0.000 description 1
- 229960000643 adenine Drugs 0.000 description 1
- 238000004364 calculation method Methods 0.000 description 1
- 230000001413 cellular effect Effects 0.000 description 1
- 230000008859 change Effects 0.000 description 1
- 238000000205 computational method Methods 0.000 description 1
- 230000003750 conditioning effect Effects 0.000 description 1
- 239000004020 conductor Substances 0.000 description 1
- 229940104302 cytosine Drugs 0.000 description 1
- 230000003247 decreasing effect Effects 0.000 description 1
- 230000008030 elimination Effects 0.000 description 1
- 238000003379 elimination reaction Methods 0.000 description 1
- 238000005516 engineering process Methods 0.000 description 1
- 238000012986 modification Methods 0.000 description 1
- 230000004048 modification Effects 0.000 description 1
- 230000003287 optical effect Effects 0.000 description 1
- 238000005192 partition Methods 0.000 description 1
- 230000008569 process Effects 0.000 description 1
- 229920002477 rna polymer Polymers 0.000 description 1
- 239000007787 solid Substances 0.000 description 1
- 229940113082 thymine Drugs 0.000 description 1
Images


Classifications
-
- G—PHYSICS
- G16—INFORMATION AND COMMUNICATION TECHNOLOGY [ICT] SPECIALLY ADAPTED FOR SPECIFIC APPLICATION FIELDS
- G16B—BIOINFORMATICS, i.e. INFORMATION AND COMMUNICATION TECHNOLOGY [ICT] SPECIALLY ADAPTED FOR GENETIC OR PROTEIN-RELATED DATA PROCESSING IN COMPUTATIONAL MOLECULAR BIOLOGY
- G16B30/00—ICT specially adapted for sequence analysis involving nucleotides or amino acids
-
- G—PHYSICS
- G16—INFORMATION AND COMMUNICATION TECHNOLOGY [ICT] SPECIALLY ADAPTED FOR SPECIFIC APPLICATION FIELDS
- G16B—BIOINFORMATICS, i.e. INFORMATION AND COMMUNICATION TECHNOLOGY [ICT] SPECIALLY ADAPTED FOR GENETIC OR PROTEIN-RELATED DATA PROCESSING IN COMPUTATIONAL MOLECULAR BIOLOGY
- G16B5/00—ICT specially adapted for modelling or simulations in systems biology, e.g. gene-regulatory networks, protein interaction networks or metabolic networks
- G16B5/20—Probabilistic models
Definitions
- Various example embodiments relate to processing of reads of a sequenced nucleic acid such as a DNA or RNA sequence. More particular, they relate to determining the number of occurrences of respective k-mers in the nucleic acid from the reads.
- the order of nucleotides in the DNA sequence is determined. As there are four different nucleotides: adenine (A), cytosine (C), guanine (G) and thymine (T), the result of the sequencing may be represented as a string composed with letters of the four letter alphabet A, C, G and T.
- A adenine
- C cytosine
- G guanine
- T thymine
- Illumina dye sequencing is a popular sequencing technique because it offers a high throughput and low sequencing cost.
- the output of the Illumina dye sequencing are short reads wherein a single read represents a short subsequence, e.g. 100 to 250 nucleotides, of the DNA sequence.
- the output does not contain positional information for the reads, i.e., the location of the reads within the DNA sequence is unknown.
- Each nucleotide within the DNA sequence is typically covered by multiple fully or partially overlapping reads.
- the average number of reads that cover a nucleotide in the DNA sequence, the sequencing coverage typically ranges from 30 to 50.
- a problem with Illumina dye sequencing is that the reads contain sequencing errors, e.g. substitutions, insertions and deletions.
- the error rate is typically in the range of 1% to 2%, the vast majority being substitutions.
- k-mers are first derived from the reads, i.e., all possible sequences with a length of k nucleotides appearing in the reads. Each unique k-mer is then represented as a node of the graph wherein each node is associated with the number of occurrences of the respective k-mer in the reads, the read support of the node. Similarly, the number of k-1 overlaps from one k-mer to another one, the read support of an arc, is associated with the arc between the respective k-mers.
- the read support of the nodes and the arcs is then used to infer the occurrences of the k-mers in the original DNA sequence, further referred to as the multiplicities of the nodes and arcs.
- This inference may be based on the so-called k-mer spectrum, i.e. a histogram of the number of k-mers as a function of their read support. From this spectrum, thresholds are derived for classifying the read support of the nodes into multiplicities.
- a problem with the above technique is that the k-mer spectrum is a superposition of distributions corresponding to the different multiplicities. Because these distributions overlap, the multiplicities may be erroneously assigned. For example, an erroneous k-mer may be assigned a multiplicity of one because it occurs more often than average in the reads.
- this object is achieved by a computer-implemented method for processing reads of a sequenced nucleic acid comprising the following steps: i) determining k-mers from the reads; ii) determining first counts indicative for the respective number of occurrences of the respective k-mers in the reads, and second counts indicative for the respective number of overlaps between respective k-mers in the reads; iii) determining a k-mer spectrum from the first counts; iv) determining first output counts indicative for the respective number of occurrences of the respective k-mers in the nucleic acid based on a position of the k-mers in the k-mer spectrum and based on a constraint.
- the constraint comprising: i) a first output count of a respective k-mer equals the total number of overlaps of the respective k-mer with other k-mers in the nucleic acid; and/or ii) a first output count of a respective k-mer equals the total number of overlaps of other k-mers with the respective k-mer.
- the first counts when representing the k-mers by a directed graph, the first counts would correspond to the read support of the nodes and the second counts would correspond to the read support of the directed edges, the arcs, between the respective nodes.
- the first output counts then correspond with the determined multiplicity of the k-mers in the nucleic acid.
- the output counts are not solely based on the k-mer spectrum, i.e. on a fixed threshold obtained from the k-mer spectrum.
- a further constraint is applied taking into account the neighbourhood of the respective k-mer.
- the directed graph is a balanced directed graph, i.e., that for each node, its multiplicity is equal to the sum of the multiplicities of its incoming arcs and equal to the sum of the multiplicities of its outgoing arcs.
- This improves the statistical power of assigning multiplicities to nodes or arcs. Specifically, it also improves the accurate identification of nodes or arcs with multiplicity zero, and thus in a better identification of sequencing errors in the reads.
- the above method may further comprise determining second output counts indicative for the respective number of overlaps between respective k-mers in the nucleic acid based on the position of the k-mers in the k-mer spectrum and based on the constraint.
- the multiplicities of the arcs may be derived in a similar way.
- the first and/or second output counts may be determined by assigning probabilities for candidate output counts.
- the constraint may be used to further adapt the probabilities on a per node or arc basis. A candidate output count is then assigned a lower probability when violating the constraint.
- the determining the first and/or second output counts is performed by a probabilistic graphical model.
- a probabilistic graphical model allows deriving the constraint based multiplicities.
- the model may for example be a conditional random field, CRF.
- CRF conditional random field
- the output counts may be obtained by iteratively estimating the parameters of the k-mer spectrum and the node- and arc multiplicities in an expectation-maximization setting.
- the first output counts and/or second output counts may be the unobserved variables of the model.
- the first and/or second counts are the observed variables of the model.
- the determining the first and/or second output counts further comprises selecting a neighbourhood of a respective k-mer and constructing a probabilistic graphical model of the neighbourhood and determining the first output count and/or the second output count associated with the respective k-mer therefrom.
- the number of nodes By limiting the number of nodes to a neighbourhood of the k-mer, the number of random variables in the model is reduced. Moreover, as the multiplicities of the neighbouring node have the biggest impact on the constraint, the output counts are obtained faster without a significant loss in accuracy.
- the overlaps between the k-mers are k-1 overlaps.
- the invention relates to a data processing system configured to perform the method according to the first aspect.
- the invention relates to a computer program comprising instructions which, when the program is executed by a computer, cause the computer to perform the method according to the first aspect.
- the invention relates to a computer-readable medium comprising instructions which, when executed by a computer, cause the computer to perform the method according to the first aspect.
- Various example embodiments relate to processing of reads of a sequenced nucleic acid. More particular, they relate to determining the number of occurrences of respective k-mers in the nucleic acid from the reads.
- the below description uses a deoxyribonucleic acid, or shortly DNA sequence, as an example of a nucleic acid but the below description may also be applied to other forms of nucleic acid such as a ribonucleic acid, or shortly RNA sequence.
- Fig. 1 illustrates a DNA sequence 100 and reads 110 obtainable by sequencing the DNA sequence 100, e.g. by Illumina dye sequencing.
- a read 110 represents a short subsequence, e.g. 100 to 250 nucleotides, of the DNA sequence 100.
- the output of the sequencing does not contain positional information for the reads 110, i.e., the location of the reads 110 within the original DNA sequence 100 is unknown.
- Each nucleotide within the DNA sequence 100 is typically covered by multiple fully or partially overlapping reads 110.
- the average number of reads that cover a nucleotide in the DNA sequence, the coverage 121, 122, 123 typically ranges from 30 to 50.
- the reads 110 may further comprise sequencing errors 101 such as substitutions wherein a read comprises a different nucleotide in comparison with the DNA sequence 101; a deletion wherein a nucleotide is missing in a read in comparison with the DNA sequence 100; and an insertion wherein an extra nucleotide is present in the read in comparison with the DNA sequence.
- the error rate for Illumina dye sequencing is typically in the range of 1% to 2% wherein the vast majority of the errors are substitutions.
- Fig. 2 illustrates a representation of DNA sequence 210 in the form of a de Bruijn graph 220, i.e. a directed graph with nodes 221 and arcs 222 each being assigned a number or count.
- a node 221 of the de Bruijn graph represents a k-mer of a DNA sequence 210, i.e. a subsequence with a length of k nucleotides.
- An arc 222 of the de Bruijn graph between two nodes 223, 221 represents an overlap with a predefined number of nucleotides between the two nodes 223, 221.
- the overlap is (k - 1) nucleotides.
- the arcs also have a direction, representing the reading direction of the string representation of the DNA sequence 210.
- a node 223 is further associated with a node count which is indicative for the respective number of occurrences of the respective k-mer in the DNA sequence 210. For example, the k-mer 'TAG' of node 223 occurs one time in the DNA sequence 210.
- an arc 222 is further associated with an arc count (not shown in the figure) which is indicative for the respective number of occurrences of overlaps between the connecting nodes, i.e. between the connecting k-mers.
- the overlap 'TAGC' 222 between the k-mer 'TAG' 223 and the k-mer 'AGC' 221 occurs one time in the DNA sequence 210.
- the underlying sequence is present in the graph 220 as a path 224 through the graph.
- a node or arc count in a de Bruijn graph that represents a DNA sequence 210 is also referred to as the node or arc multiplicity.
- a de Bruijn graph may be constructed from the reads 110 obtained from a DNA sequence 100. This is illustrated in Fig. 3 , wherein example reads 310 obtained from DNA sequence 210 are shown. In the example of Fig. 3 , no sequencing errors are present in the reads 310.
- Fig. 3 illustrates a de Bruijn graph 320 constructed from the reads 310. As the reads 310 are directly obtained from DNA sequence 210, the node and arc counts of graph 320 are related to the node and arc multiplicities of graph 220. As the read coverage is not constant, this relationship will not be strictly linear. For example, nodes 322, 323 and 325 have a different node count while they all relate to a node multiplicity of one.
- Fig. 4 shows a de Bruijn graph 420 constructed from reads 410 obtained from sequencing DNA sequence 210 wherein the reads 410 contain various errors (underlined in Fig. 4 ). Because of these errors, additional arcs and nodes are introduced as illustrated by the dashed lines in graph 420.
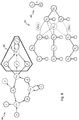
- Fig. 5 illustrates steps of a method for processing such reads according to an embodiment of the invention.
- a first step 501 reads 502 of a DNA sequence 500 are obtained.
- the reads 502 may for example be obtained by Illumina dye sequencing or any other suitable method.
- Reads 502 are used as an example for describing the steps.
- Reads 502 corresponds to the example of Fig. 4 and contain various read errors.
- k-mers 504 are determined from the reads 502. According to the illustrative example of Fig.
- k equals three resulting in k-mers 504: 'ATA', 'TAG', 'AGC'...
- k is preferably much larger, e.g. from 50% to 70% of the read length with absolute values ranging e.g. from 15 to 50.
- the arc and node counts 553, 554 of the k-mers are determined.
- the de Bruijn graph 550 is determined.
- the node and arc counts may for example also be stored in a table or database thereby representing the de Bruijn graph 550. Due to the errors in the reads, different errors are introduced in the graph 550. For example, a new intermediate node 555 and end node 558 is introduced together with connecting arcs 556, 557 and 559. Also, a new arc 580 is introduced.
- the arc and/or node multiplicities are determined based on the k-mer spectrum 508, 530 and based on the following constraints 509, 510: i) the multiplicity of a node should equal the sum of the multiplicities of the outgoing arcs of that node; and ii) the multiplicity of a node should equal the sum of the multiplicities of the arcs entering the node.
- This constraint relates to an inherent property of the de Bruijn graph representing the original DNA sequence.
- FIG. 5 An example 530 of a k-mer spectrum is also shown in Fig. 5 .
- the k-mer spectrum may be constructed by determining, for each possible k-mer node count, the number of k-mers 504 that have that respective node count. This results in a spectrum 530, i.e., the distribution of node counts. This is illustrated in plot 530 by a mixed distribution comprising sub-distributions 534-538 for each respective node multiplicity, i.e.
- distribution 530 is the sum of a first sub-distribution 534 of k-mers with node multiplicity zero, a second sub- distribution 535 for k-mers with node multiplicity one, a third sub-distribution 536 for k-mers with node multiplicity two, a fourth sub-distribution 537 for k-mers with node multiplicity three etc.
- These sub-distributions are not known but may be estimated from the obtained distribution by a fitting operation. With the estimated sub-distributions, for each node count, and thus for each node, a probability may be derived that the respective node is an error, has a multiplicity one, a multiplicity two etc.
- step 507 the constraints 509, 510 are further taken into account in assigning the multiplicities.
- this is done by, for each node and arc, assigning probabilities for the different multiplicities based on the k-mer spectrum and, additionally, increasing or decreasing the probability based on the how good the graph fulfils the constraint.
- each node is assigned a set of candidate output counts, each with a certain probability based on the k-mer spectrum.
- These probabilities are then further adjusted according to the constraints 509, 510. From these probabilities, a decision on the multiplicity of each node and arc may be taken.
- Fig. 6 illustrates a de Bruijn graph 650 with node and arc multiplicities determined from the graph 550 based on the steps of Fig. 5 .
- Fig. 7 illustrates a de Bruijn graph 750 with node and arc multiplicities determined from the graph 550 when only considering the k-mer spectrum 530, i.e. by deciding the multiplicity according to fixed thresholds 531, 532, 533.
- node 570 based on the k-mer spectrum cutoff 531, the node 570 and arc 571 would be assigned multiplicity zero as shown in Fig. 7 .
- assigning multiplicity zero to node 570 would further violate the constraint on node 572. Therefore, the probability that node 570 has multiplicity one is higher than the probability that is has multiplicity zero.
- node 555 According to the k-mer spectrum, node 555 would be assigned multiplicity one as shown in Fig. 7 . However, as the node count is four, the probability that node 555 has multiplicity one is only slightly higher than the probability that it has multiplicity zero.
- step 507 it is more likely that node 555 is due to an error and receives multiplicity zero.
- a probabilistic graphical model more particular a conditional random field, CRF, model
- CRF conditional random field
- determining multiplicities of nodes and arcs while also taking into account constraints 509, 510 information of neighbouring nodes and arcs must be taken into account as demonstrated in the simplified example above. This results in a high dimensional problem.
- conditional random fields By using conditional random fields, this high dimensional problem is transformed into probabilities that are products of factors and independencies are more easily represented.
- efficient computational methods may be used to infer the individual probabilities present in the model.
- the CRF model allows combining the information contained in the k-mer spectrum 530 with constraints 509, 510.
- a CRF model is a type of Probabilistic Graphical model or graph model wherein the nodes represent variables and the edges represent direct probabilistic interactions between these variables. These variables are further divided into a set of observed variables and a set of unobserved variables from which information is inferred.
- Probabilistic interactions may then be represented by factors ⁇ i ( D i )( D i ⁇ X ⁇ Y ; D i ⁇ X ) such that all variables in the scope D i of ⁇ i form a clique in the CRF.
- the joint conditional probability over all variables may then be calculated as P Y
- the first type referred to as the "singleton factors” ⁇ a
- the second type referred to as “conservation of flow factors” ⁇ flow
- Edges connect nodes such that all variables that are in the scope D i of a factor, form a clique in the CRF.
- the two different factor types will pull the belief, i.e. probability for a certain multiplicity in the graph, in a certain direction.
- the CRFs are built for small regions of the de Bruijn graph. This way, computational complexity is greatly reduced compared with the case where the whole de Bruijn graph is taken into account.
- a neighbourhood 860 around this node 861 is selected.
- Such a neighbourhood of size s comprises all nodes that are reachable by a path of length ⁇ s from node 860 and all of its incoming and outgoing arcs.
- the CRF contains a variable node Y m .
- the CRF contains variable nodes Y a and X a .
- ⁇ err the mean coverage of the erroneous k-mers, i.e. those with multiplicity 0, and ⁇ , the mean coverage of k-mers with multiplicity 1 in the DNA sequence.
- the negative binomial has mean m ⁇ .
- Each negative binomial may further be weighted according to the estimated number of k-mers with that multiplicity in the dataset, w m .
- an overdispersion factor f may be used such that the variance of a negative binomial with mean ⁇ is equal to f ⁇ .
- each node For each Y n corresponding to a node n in the de Bruijn graph, two "conservation of flow factors" are created. Each node generates a conservation of flow factor for the incoming arcs and one for the outgoing arcs. The scope of these factors then contains the corresponding CRF-node Y n and all Y a corresponding to incoming respectively outgoing arcs of node n, i.e., for the incoming arcs: ⁇ flow m n m a ...
- the parameters in the CRF that need to be determined are: i) the means of the negative binomial distributions ⁇ and ⁇ err , ii) the overdispersion factor f determining the variance of the negative binomial, and iii) the weights w i for possible multiplicities.
- the following values derived from the data may be used: cov( n ) denoting the k-mer coverage of a node n; cov( a ) denoting the k-mer coverage of an arc a ; wherein the representation of the de Bruijn graph concatenates nodes that have only one incoming and one outgoing arc, i.e.
- cov( n ) is the total k-mer coverage of all k-mers in the concatenated node.
- the set of all k-mers in node n is further denoted by k-mers( n ), and its size by
- the current multiplicity estimate for nodes and arcs is denoted by mult( n ) and mult( a ) respectively. Since nodes correspond to (concatenated) k-mers, while the arcs correspond to (k - 1)-mers, the underlying distributions will differ slightly. Therefore, all parameters are estimated separately for the nodes and the arcs of the de Bruijn graph.
- Table 1 shows results obtained by the above described method. The method was performed on reads obtained from a S.enterica genome for different read coverages (Coverage) and for different sizes of the CRF (CRF-size). The simulation where the CRF-size is zero corresponds to the case where only the k-mer spectrum static thresholds are used. All results were compared with a reference genome of the S.enterica to obtain an accuracy (Acc) measure for each simulation.
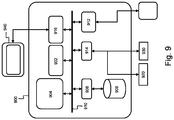
- Fig. 9 shows a suitable computing system 900 enabling to implement embodiments of the above described method according to the invention.
- Computing system 900 may in general be formed as a suitable general-purpose computer and comprise a bus 910, a processor 902, a local memory 904, one or more optional input interfaces 914, one or more optional output interfaces 916, a communication interface 912, a storage element interface 906, and one or more storage elements 908.
- Bus 910 may comprise one or more conductors that permit communication among the components of the computing system 900.
- Processor 902 may include any type of conventional processor or microprocessor that interprets and executes programming instructions.
- Local memory 904 may include a random-access memory (RAM) or another type of dynamic storage device that stores information and instructions for execution by processor 902 and/or a read only memory (ROM) or another type of static storage device that stores static information and instructions for use by processor 902.
- Input interface 914 may comprise one or more conventional mechanisms that permit an operator or user to input information to the computing device 900, such as a keyboard 920, a mouse 930, a pen, voice recognition and/or biometric mechanisms, a camera, etc.
- Output interface 916 may comprise one or more conventional mechanisms that output information to the operator or user, such as a display 940, etc.
- Communication interface 912 may comprise any transceiver-like mechanism such as for example one or more Ethernet interfaces that enables computing system 900 to communicate with other devices and/or systems.
- the communication interface 912 of computing system 900 may be connected to such another computing system by means of a local area network (LAN) or a wide area network (WAN) such as for example the internet.
- Storage element interface 906 may comprise a storage interface such as for example a Serial Advanced Technology Attachment (SATA) interface or a Small Computer System Interface (SCSI) for connecting bus 910 to one or more storage elements 908, such as one or more local disks, for example SATA disk drives, and control the reading and writing of data to and/or from these storage elements 908.
- SATA Serial Advanced Technology Attachment
- SCSI Small Computer System Interface
- the storage element(s) 908 above is/are described as a local disk, in general any other suitable computer-readable media such as a removable magnetic disk, optical storage media such as a CD or DVD, -ROM disk, solid state drives, flash memory cards, ... could be used.
- circuitry may refer to one or more or all of the following:
- circuitry also covers an implementation of merely a hardware circuit or processor (or multiple processors) or portion of a hardware circuit or processor and its (or their) accompanying software and/or firmware.
- circuitry also covers, for example and if applicable to the particular claim element, a baseband integrated circuit or processor integrated circuit for a mobile device or a similar integrated circuit in a server, a cellular network device, or other computing or network device.
- top, bottom, over, under, and the like are introduced for descriptive purposes and not necessarily to denote relative positions. It is to be understood that the terms so used are interchangeable under appropriate circumstances and embodiments of the invention are capable of operating according to the present invention in other sequences, or in orientations different from the one(s) described or illustrated above.
Landscapes
- Physics & Mathematics (AREA)
- Life Sciences & Earth Sciences (AREA)
- Bioinformatics & Cheminformatics (AREA)
- Health & Medical Sciences (AREA)
- Engineering & Computer Science (AREA)
- Biotechnology (AREA)
- General Health & Medical Sciences (AREA)
- Theoretical Computer Science (AREA)
- Spectroscopy & Molecular Physics (AREA)
- Bioinformatics & Computational Biology (AREA)
- Medical Informatics (AREA)
- Evolutionary Biology (AREA)
- Biophysics (AREA)
- Chemical & Material Sciences (AREA)
- Analytical Chemistry (AREA)
- Proteomics, Peptides & Aminoacids (AREA)
- Probability & Statistics with Applications (AREA)
- Physiology (AREA)
- Molecular Biology (AREA)
- Management, Administration, Business Operations System, And Electronic Commerce (AREA)
- Measuring Or Testing Involving Enzymes Or Micro-Organisms (AREA)
Abstract
Description
- Various example embodiments relate to processing of reads of a sequenced nucleic acid such as a DNA or RNA sequence. More particular, they relate to determining the number of occurrences of respective k-mers in the nucleic acid from the reads.
- When sequencing a DNA sequence, the order of nucleotides in the DNA sequence is determined. As there are four different nucleotides: adenine (A), cytosine (C), guanine (G) and thymine (T), the result of the sequencing may be represented as a string composed with letters of the four letter alphabet A, C, G and T.
- Illumina dye sequencing is a popular sequencing technique because it offers a high throughput and low sequencing cost. The output of the Illumina dye sequencing are short reads wherein a single read represents a short subsequence, e.g. 100 to 250 nucleotides, of the DNA sequence. The output does not contain positional information for the reads, i.e., the location of the reads within the DNA sequence is unknown. Each nucleotide within the DNA sequence is typically covered by multiple fully or partially overlapping reads. The average number of reads that cover a nucleotide in the DNA sequence, the sequencing coverage, typically ranges from 30 to 50.
- A problem with Illumina dye sequencing is that the reads contain sequencing errors, e.g. substitutions, insertions and deletions. The error rate is typically in the range of 1% to 2%, the vast majority being substitutions.
- Different techniques have been developed to derive information on the DNA sequence from such error-containing reads. One such technique uses a directed graph representation called a de Bruijn graph. According to this technique, k-mers are first derived from the reads, i.e., all possible sequences with a length of k nucleotides appearing in the reads. Each unique k-mer is then represented as a node of the graph wherein each node is associated with the number of occurrences of the respective k-mer in the reads, the read support of the node. Similarly, the number of k-1 overlaps from one k-mer to another one, the read support of an arc, is associated with the arc between the respective k-mers. The read support of the nodes and the arcs is then used to infer the occurrences of the k-mers in the original DNA sequence, further referred to as the multiplicities of the nodes and arcs. This inference may be based on the so-called k-mer spectrum, i.e. a histogram of the number of k-mers as a function of their read support. From this spectrum, thresholds are derived for classifying the read support of the nodes into multiplicities.
- A problem with the above technique is that the k-mer spectrum is a superposition of distributions corresponding to the different multiplicities. Because these distributions overlap, the multiplicities may be erroneously assigned. For example, an erroneous k-mer may be assigned a multiplicity of one because it occurs more often than average in the reads.
- It is an object, amongst others, to alleviate the above identified shortcomings and to provide a solution for processing reads of a sequenced nucleic acid that results in fewer errors in the obtained multiplicities.
- According to a first aspect, this object is achieved by a computer-implemented method for processing reads of a sequenced nucleic acid comprising the following steps: i) determining k-mers from the reads; ii) determining first counts indicative for the respective number of occurrences of the respective k-mers in the reads, and second counts indicative for the respective number of overlaps between respective k-mers in the reads; iii) determining a k-mer spectrum from the first counts; iv) determining first output counts indicative for the respective number of occurrences of the respective k-mers in the nucleic acid based on a position of the k-mers in the k-mer spectrum and based on a constraint. The constraint comprising: i) a first output count of a respective k-mer equals the total number of overlaps of the respective k-mer with other k-mers in the nucleic acid; and/or ii) a first output count of a respective k-mer equals the total number of overlaps of other k-mers with the respective k-mer.
- In other words, when representing the k-mers by a directed graph, the first counts would correspond to the read support of the nodes and the second counts would correspond to the read support of the directed edges, the arcs, between the respective nodes. The first output counts then correspond with the determined multiplicity of the k-mers in the nucleic acid. According to the above method, the output counts are not solely based on the k-mer spectrum, i.e. on a fixed threshold obtained from the k-mer spectrum. A further constraint is applied taking into account the neighbourhood of the respective k-mer. When representing the k-mers by a directed graph, this constraint imposes that the directed graph is a balanced directed graph, i.e., that for each node, its multiplicity is equal to the sum of the multiplicities of its incoming arcs and equal to the sum of the multiplicities of its outgoing arcs. This improves the statistical power of assigning multiplicities to nodes or arcs. Specifically, it also improves the accurate identification of nodes or arcs with multiplicity zero, and thus in a better identification of sequencing errors in the reads.
- The above method may further comprise determining second output counts indicative for the respective number of overlaps between respective k-mers in the nucleic acid based on the position of the k-mers in the k-mer spectrum and based on the constraint. In other words, also the multiplicities of the arcs may be derived in a similar way.
- According to an example embodiment, the first and/or second output counts may be determined by assigning probabilities for candidate output counts. In other words, as the k-mer spectrum already provides information on the probabilities for a certain multiplicity of a node or arc based on the read support, the constraint may be used to further adapt the probabilities on a per node or arc basis. A candidate output count is then assigned a lower probability when violating the constraint.
- According to an embodiment, the determining the first and/or second output counts is performed by a probabilistic graphical model. Such a model allows deriving the constraint based multiplicities. The model may for example be a conditional random field, CRF. This way, the output counts may be obtained by iteratively estimating the parameters of the k-mer spectrum and the node- and arc multiplicities in an expectation-maximization setting. More generally, the first output counts and/or second output counts may be the unobserved variables of the model. Similarly, the first and/or second counts are the observed variables of the model.
- According to a further embodiment, the determining the first and/or second output counts further comprises selecting a neighbourhood of a respective k-mer and constructing a probabilistic graphical model of the neighbourhood and determining the first output count and/or the second output count associated with the respective k-mer therefrom.
- By limiting the number of nodes to a neighbourhood of the k-mer, the number of random variables in the model is reduced. Moreover, as the multiplicities of the neighbouring node have the biggest impact on the constraint, the output counts are obtained faster without a significant loss in accuracy.
- According to various example embodiments, the overlaps between the k-mers are k-1 overlaps.
- According to a second aspect, the invention relates to a data processing system configured to perform the method according to the first aspect.
- According to a third aspect, the invention relates to a computer program comprising instructions which, when the program is executed by a computer, cause the computer to perform the method according to the first aspect.
- According to a fourth aspect, the invention relates to a computer-readable medium comprising instructions which, when executed by a computer, cause the computer to perform the method according to the first aspect.
- Some example embodiments will now be described with reference to the accompanying drawings.
-
Fig. 1 illustrates a DNA sequence, reads obtained therefrom, read coverage depth, and errors in the reads; and -
Fig. 2 illustrates an example DNA sequence and a corresponding directed graph representation of the DNA sequence; and -
Fig. 3 illustrates example reads obtained from the example DNA sequence and a corresponding directed graph representation of the reads; and -
Fig. 4 illustrates example reads containing read errors obtained from the example DNA sequence and a corresponding directed graph representation of the reads containing the errors; and -
Fig. 5 illustrates steps performed according to an example embodiment to obtain node and arc multiplicities of a DNA sequence from reads; and -
Fig. 6 illustrates a directed graph containing node and arc multiplicities of a DNA sequence obtained by the steps illustrated inFig. 5 ; and -
Fig. 7 illustrates a directed graph representation of a DNA sequence obtained by a method according to the state of the art; and -
Fig. 8 illustrates a probabilistic graphical model for obtaining node and arc multiplicities of a DNA sequence from reads according to an embodiment of the invention; and -
Fig. 9 shows an example embodiment of a suitable computing system for performing steps according to example aspects of the invention. - Various example embodiments relate to processing of reads of a sequenced nucleic acid. More particular, they relate to determining the number of occurrences of respective k-mers in the nucleic acid from the reads. The below description uses a deoxyribonucleic acid, or shortly DNA sequence, as an example of a nucleic acid but the below description may also be applied to other forms of nucleic acid such as a ribonucleic acid, or shortly RNA sequence.
-
Fig. 1 illustrates aDNA sequence 100 and reads 110 obtainable by sequencing theDNA sequence 100, e.g. by Illumina dye sequencing. Such aread 110 represents a short subsequence, e.g. 100 to 250 nucleotides, of theDNA sequence 100. The output of the sequencing does not contain positional information for thereads 110, i.e., the location of thereads 110 within theoriginal DNA sequence 100 is unknown. Each nucleotide within theDNA sequence 100 is typically covered by multiple fully or partially overlapping reads 110. The average number of reads that cover a nucleotide in the DNA sequence, thecoverage Fig.1 illustrates this by way of an example wherein different nucleotides have a coverage of respectively three, one and seven. The reads 110, may further comprise sequencingerrors 101 such as substitutions wherein a read comprises a different nucleotide in comparison with theDNA sequence 101; a deletion wherein a nucleotide is missing in a read in comparison with theDNA sequence 100; and an insertion wherein an extra nucleotide is present in the read in comparison with the DNA sequence. The error rate for Illumina dye sequencing is typically in the range of 1% to 2% wherein the vast majority of the errors are substitutions. -
Fig. 2 illustrates a representation ofDNA sequence 210 in the form of ade Bruijn graph 220, i.e. a directed graph withnodes 221 and arcs 222 each being assigned a number or count. Anode 221 of the de Bruijn graph represents a k-mer of aDNA sequence 210, i.e. a subsequence with a length of k nucleotides. Anarc 222 of the de Bruijn graph between twonodes nodes original DNA sequence 210 has a direction, i.e. a start and an end nucleotide, the arcs also have a direction, representing the reading direction of the string representation of theDNA sequence 210. Anode 223 is further associated with a node count which is indicative for the respective number of occurrences of the respective k-mer in theDNA sequence 210. For example, the k-mer 'TAG' ofnode 223 occurs one time in theDNA sequence 210. Similarly, anarc 222 is further associated with an arc count (not shown in the figure) which is indicative for the respective number of occurrences of overlaps between the connecting nodes, i.e. between the connecting k-mers. For example, the overlap 'TAGC' 222 between the k-mer 'TAG' 223 and the k-mer 'AGC' 221 occurs one time in theDNA sequence 210. When ade Bruijn graph 220 is built from aDNA sequence 210, the underlying sequence is present in thegraph 220 as apath 224 through the graph. A node or arc count in a de Bruijn graph that represents aDNA sequence 210 is also referred to as the node or arc multiplicity. - Similarly, a de Bruijn graph may be constructed from the
reads 110 obtained from aDNA sequence 100. This is illustrated inFig. 3 , wherein example reads 310 obtained fromDNA sequence 210 are shown. In the example ofFig. 3 , no sequencing errors are present in the reads 310. On the right side,Fig. 3 illustrates ade Bruijn graph 320 constructed from the reads 310. As the reads 310 are directly obtained fromDNA sequence 210, the node and arc counts ofgraph 320 are related to the node and arc multiplicities ofgraph 220. As the read coverage is not constant, this relationship will not be strictly linear. For example,nodes - Furthermore, by the introduction of read errors, different erroneous nodes and arcs may be introduced in the de Bruijn graph. This is illustrated in
Fig. 4 showing ade Bruijn graph 420 constructed from reads 410 obtained from sequencingDNA sequence 210 wherein thereads 410 contain various errors (underlined inFig. 4 ). Because of these errors, additional arcs and nodes are introduced as illustrated by the dashed lines ingraph 420. - The below example embodiments describe how to process the
reads 410 of a sequencedDNA sequence 210 in order to assign the node and/or arc multiplicities. To this respect,Fig. 5 illustrates steps of a method for processing such reads according to an embodiment of the invention. In afirst step 501, reads 502 of aDNA sequence 500 are obtained. The reads 502 may for example be obtained by Illumina dye sequencing or any other suitable method.Reads 502 are used as an example for describing the steps. Reads 502 corresponds to the example ofFig. 4 and contain various read errors. In anext step 503, k-mers 504 are determined from the reads 502. According to the illustrative example ofFig. 5 , k equals three resulting in k-mers 504: 'ATA', 'TAG', 'AGC'... In real-life circumstances, k is preferably much larger, e.g. from 50% to 70% of the read length with absolute values ranging e.g. from 15 to 50. - At a
next step 505, the arc and node counts 553, 554 of the k-mers are determined. In other words, thede Bruijn graph 550 is determined. Although the counts determine the de Bruijn graph, it is not essential that agraph 550 is constructed. The node and arc counts may for example also be stored in a table or database thereby representing thede Bruijn graph 550. Due to the errors in the reads, different errors are introduced in thegraph 550. For example, a newintermediate node 555 andend node 558 is introduced together with connectingarcs new arc 580 is introduced. - Then, in a
next step 507, the arc and/or node multiplicities are determined based on the k-mer spectrum constraints 509, 510: i) the multiplicity of a node should equal the sum of the multiplicities of the outgoing arcs of that node; and ii) the multiplicity of a node should equal the sum of the multiplicities of the arcs entering the node. This constraint relates to an inherent property of the de Bruijn graph representing the original DNA sequence. - An example 530 of a k-mer spectrum is also shown in
Fig. 5 . The k-mer spectrum may be constructed by determining, for each possible k-mer node count, the number of k-mers 504 that have that respective node count. This results in aspectrum 530, i.e., the distribution of node counts. This is illustrated inplot 530 by a mixed distribution comprising sub-distributions 534-538 for each respective node multiplicity, i.e.distribution 530 is the sum of afirst sub-distribution 534 of k-mers with node multiplicity zero, a second sub-distribution 535 for k-mers with node multiplicity one, athird sub-distribution 536 for k-mers with node multiplicity two, afourth sub-distribution 537 for k-mers with node multiplicity three etc. These sub-distributions are not known but may be estimated from the obtained distribution by a fitting operation. With the estimated sub-distributions, for each node count, and thus for each node, a probability may be derived that the respective node is an error, has a multiplicity one, a multiplicity two etc. - One way to determine the multiplicities therefrom is to determine
hard multiplicity intervals step 507, theconstraints constraints -
Fig. 6 illustrates ade Bruijn graph 650 with node and arc multiplicities determined from thegraph 550 based on the steps ofFig. 5 .Fig. 7 on the other hand, illustrates ade Bruijn graph 750 with node and arc multiplicities determined from thegraph 550 when only considering the k-mer spectrum 530, i.e. by deciding the multiplicity according to fixedthresholds - Regarding
node 570, based on the k-mer spectrum cutoff 531, thenode 570 andarc 571 would be assigned multiplicity zero as shown inFig. 7 . On the other hand, when further taking into account theconstraints node 570 would further violate the constraint onnode 572. Therefore, the probability thatnode 570 has multiplicity one is higher than the probability that is has multiplicity zero. A similar consideration applies tonode 555. According to the k-mer spectrum,node 555 would be assigned multiplicity one as shown inFig. 7 . However, as the node count is four, the probability thatnode 555 has multiplicity one is only slightly higher than the probability that it has multiplicity zero. Furthermore, assigning it with multiplicity one would further violate the constraint onnode 573 which already has a high probability for multiplicity one for both the node and arcs. Hence, according tostep 507, it is more likely thatnode 555 is due to an error and receives multiplicity zero. - Different techniques may be used to apply the
constraints account constraints mer spectrum 530 withconstraints - A CRF model is a type of Probabilistic Graphical model or graph model wherein the nodes represent variables and the edges represent direct probabilistic interactions between these variables. These variables are further divided into a set of observed variables and a set of unobserved variables from which information is inferred. When using a CRF model for performing
step 507, the observed variables X = {X1,..., Xm} may correspond to the coverage of arcs in thede Bruijn graph 550 and the unobserved variables Y = {Y 1,...,Y m} may correspond to the multiplicities of nodes and arcs in the resulting deBruijn graph 650. Probabilistic interactions may then be represented by factors ϕi (D i )(D i ⊆ X ∪ Y; D i ⊈ X) such that all variables in the scope D i of ϕi form a clique in the CRF. The joint conditional probability over all variables may then be calculated as
constraints Bruijn graph 650. Edges connect nodes such that all variables that are in the scope D i of a factor, form a clique in the CRF. The two different factor types will pull the belief, i.e. probability for a certain multiplicity in the graph, in a certain direction. In other words, the final multiplicity-probabilities will be the result of an interplay between the observed k-mer coverage ingraph 550, because of ϕa, and an implied conservation of flow according toconstraints - According to an embodiment, the CRFs are built for small regions of the de Bruijn graph. This way, computational complexity is greatly reduced compared with the case where the whole de Bruijn graph is taken into account. This is further illustrated in
Fig. 8 . To infer the multiplicity of acertain node 861 in ade Bruijn graph 850, aneighbourhood 860 around thisnode 861 is selected. Such a neighbourhood of size s comprises all nodes that are reachable by a path of length ≤ s fromnode 860 and all of its incoming and outgoing arcs. For each node m in theneighbourhood 860 the CRF contains a variable node Ym. For each arc a in the neighbourhood the CRF contains variable nodes Ya and Xa. Thede Bruijn graph 850 with a selectedneighbourhood 860 illustrates the case wherein s = 1 together with the associatedCRF 870. - For each Xa and Ya corresponding to an arc in the de Bruijn graph, a "singleton factor" 880

mer spectrum 530 of the data:
multiplicity 0, and λ, the mean coverage of k-mers withmultiplicity 1 in the DNA sequence. For each multiplicity with m > 1 the negative binomial has mean mλ. Each negative binomial may further be weighted according to the estimated number of k-mers with that multiplicity in the dataset, wm. To determine the variance of a negative binomial an overdispersion factor f may be used such that the variance of a negative binomial with mean λ is equal to fλ. - For each Yn corresponding to a node n in the de Bruijn graph, two "conservation of flow factors" are created. Each node generates a conservation of flow factor for the incoming arcs and one for the outgoing arcs. The scope of these factors then contains the corresponding CRF-node Yn and all Ya corresponding to incoming respectively outgoing arcs of node n, i.e., for the incoming arcs:


- The product of all factors is the joint probability of the multiplicities over all nodes and arcs in the selected
neighbourhood 860. To determine the probability distribution over the possible multiplicities of a node n (or similarly an arc a) the result of the following equation is needed:
- The values of the factors in the above CRF depend on parameters which also need to be estimated. These estimates depend on the multiplicities of the nodes and arcs in the de Bruijn graph, which are also unknown. Therefore, the CRF-model may be used in an Expectation-Maximisation setting as follows:
- 1) Use data heuristics to find a first estimate for these parameters.
- 2) Estimate (E) the most likely multiplicities for the nodes and arcs of the de Bruijn graph, using a CRF with factors based on the current parameters.
- 3) Estimate (M) new values for the parameters using the newly inferred multiplicities, weighted by their probability.
- Convergence is then reached when the estimated multiplicity of a certain percentage of the nodes and arcs does not change between different E-steps.
- The parameters in the CRF that need to be determined are: i) the means of the negative binomial distributions λ and λerr, ii) the overdispersion factor f determining the variance of the negative binomial, and iii) the weights wi for possible multiplicities. To calculate the values of these parameters the following values derived from the data may be used: cov(n) denoting the k-mer coverage of a node n; cov(a) denoting the k-mer coverage of an arc a; wherein the representation of the de Bruijn graph concatenates nodes that have only one incoming and one outgoing arc, i.e. cov(n) is the total k-mer coverage of all k-mers in the concatenated node. The set of all k-mers in node n is further denoted by k-mers(n), and its size by |k-mers(n)|. The current multiplicity estimate for nodes and arcs is denoted by mult(n) and mult(a) respectively. Since nodes correspond to (concatenated) k-mers, while the arcs correspond to (k - 1)-mers, the underlying distributions will differ slightly. Therefore, all parameters are estimated separately for the nodes and the arcs of the de Bruijn graph.
- The negative binomial means may be estimated as follows:


- The factor f may be calculated by taking a weighted mean of the sample variances based on the number of nodes/arcs that are assigned with a certain multiplicity:


- Table 1 shows results obtained by the above described method. The method was performed on reads obtained from a S.enterica genome for different read coverages (Coverage) and for different sizes of the CRF (CRF-size). The simulation where the CRF-size is zero corresponds to the case where only the k-mer spectrum static thresholds are used. All results were compared with a reference genome of the S.enterica to obtain an accuracy (Acc) measure for each simulation.
Table 1: Results Coverage 10 15 20 30 50 75 90 CRF-size Acc Iter Acc Iter Acc Iter Acc Iter Acc Iter Acc Iter Acc Iter 0 80.24 25 87.14 25 86.79 25 87.33 7 94.76 10 96.43 10 96.99 11 4 86.57 10 92.78 11 93.99 10 95.20 10 96.31 8 97.10 8 97.41 7 8 87.02 9 93.02 9 94.26 7 95.40 7 96.44 7 97.19 7 97.47 6 -
Fig. 9 shows asuitable computing system 900 enabling to implement embodiments of the above described method according to the invention.Computing system 900 may in general be formed as a suitable general-purpose computer and comprise abus 910, aprocessor 902, alocal memory 904, one or more optional input interfaces 914, one or moreoptional output interfaces 916, acommunication interface 912, astorage element interface 906, and one ormore storage elements 908.Bus 910 may comprise one or more conductors that permit communication among the components of thecomputing system 900.Processor 902 may include any type of conventional processor or microprocessor that interprets and executes programming instructions.Local memory 904 may include a random-access memory (RAM) or another type of dynamic storage device that stores information and instructions for execution byprocessor 902 and/or a read only memory (ROM) or another type of static storage device that stores static information and instructions for use byprocessor 902.Input interface 914 may comprise one or more conventional mechanisms that permit an operator or user to input information to thecomputing device 900, such as akeyboard 920, amouse 930, a pen, voice recognition and/or biometric mechanisms, a camera, etc.Output interface 916 may comprise one or more conventional mechanisms that output information to the operator or user, such as adisplay 940, etc.Communication interface 912 may comprise any transceiver-like mechanism such as for example one or more Ethernet interfaces that enablescomputing system 900 to communicate with other devices and/or systems. Thecommunication interface 912 ofcomputing system 900 may be connected to such another computing system by means of a local area network (LAN) or a wide area network (WAN) such as for example the internet.Storage element interface 906 may comprise a storage interface such as for example a Serial Advanced Technology Attachment (SATA) interface or a Small Computer System Interface (SCSI) for connectingbus 910 to one ormore storage elements 908, such as one or more local disks, for example SATA disk drives, and control the reading and writing of data to and/or from thesestorage elements 908. Although the storage element(s) 908 above is/are described as a local disk, in general any other suitable computer-readable media such as a removable magnetic disk, optical storage media such as a CD or DVD, -ROM disk, solid state drives, flash memory cards, ... could be used. - As used in this application, the term "circuitry" may refer to one or more or all of the following:
- (a) hardware-only circuit implementations such as implementations in only analog and/or digital circuitry and
- (b) combinations of hardware circuits and software, such as (as applicable):
- (i) a combination of analog and/or digital hardware circuit(s) with software/firmware and
- (ii) any portions of hardware processor(s) with software (including digital signal processor(s)), software, and memory(ies) that work together to cause an apparatus, such as a mobile phone or server, to perform various functions) and
- (c) hardware circuit(s) and/or processor(s), such as microprocessor(s) or a portion of a microprocessor(s), that requires software (e.g. firmware) for operation, but the software may not be present when it is not needed for operation.
- This definition of circuitry applies to all uses of this term in this application, including in any claims. As a further example, as used in this application, the term circuitry also covers an implementation of merely a hardware circuit or processor (or multiple processors) or portion of a hardware circuit or processor and its (or their) accompanying software and/or firmware. The term circuitry also covers, for example and if applicable to the particular claim element, a baseband integrated circuit or processor integrated circuit for a mobile device or a similar integrated circuit in a server, a cellular network device, or other computing or network device.
- Although the present invention has been illustrated by reference to specific embodiments, it will be apparent to those skilled in the art that the invention is not limited to the details of the foregoing illustrative embodiments, and that the present invention may be embodied with various changes and modifications without departing from the scope thereof. The present embodiments are therefore to be considered in all respects as illustrative and not restrictive, the scope of the invention being indicated by the appended claims rather than by the foregoing description, and all changes which come within the scope of the claims are therefore intended to be embraced therein.
- It will furthermore be understood by the reader of this patent application that the words "comprising" or "comprise" do not exclude other elements or steps, that the words "a" or "an" do not exclude a plurality, and that a single element, such as a computer system, a processor, or another integrated unit may fulfil the functions of several means recited in the claims. Any reference signs in the claims shall not be construed as limiting the respective claims concerned. The terms "first", "second", third", "a", "b", "c", and the like, when used in the description or in the claims are introduced to distinguish between similar elements or steps and are not necessarily describing a sequential or chronological order. Similarly, the terms "top", "bottom", "over", "under", and the like are introduced for descriptive purposes and not necessarily to denote relative positions. It is to be understood that the terms so used are interchangeable under appropriate circumstances and embodiments of the invention are capable of operating according to the present invention in other sequences, or in orientations different from the one(s) described or illustrated above.
Claims (14)
- A computer-implemented method for processing reads (110, 310, 410, 502) of a sequenced nucleic acid (100, 210, 500) comprising the following steps:- determining (503) k-mers (321, 421, 504, 551) from the reads;- determining (505) first counts (553) indicative for the respective number of occurrences of the respective k-mers (551) in the reads, and second counts (554) indicative for the respective number of overlaps (560) between respective k-mers in the reads;- determining (507) a k-mer spectrum (530) from the first counts;- determining (507) first output counts (653) indicative for the respective number of occurrences (651) of the respective k-mers in the nucleic acid based on a position (531, 532, 533) of the k-mers in the k-mer spectrum (530) and based on a constraint (509, 510) comprising:∘ a first output count of a respective k-mer equals the total number of overlaps of the respective k-mer with other k-mers in the nucleic acid; and/or∘ a first output count of a respective k-mer equals the total number of overlaps of other k-mers with the respective k-mer.
- The method according to claim 1 further comprising determining (507) second output counts (654) indicative for the respective number of overlaps (660) between respective k-mers in the nucleic acid based on the position (531, 532, 533) of the k-mers in the k-mer spectrum (530) and based on the constraint (509, 510).
- The method according to claim 1 or 2 wherein the determining (507) the first and, when dependent on claim 2, second output counts (653, 654) further comprises assigning probabilities for candidate output counts to the k-mers.
- The method according to claim 3 wherein a candidate output count is assigned a lower probability when violating the constraint (509, 510).
- The method according to any one of the preceding claims wherein the determining (505) the first and second counts further comprises determining a graph (550) comprising nodes (551, 555, 558) and directed edges (557, 556, 552, 560, 559); and wherein the k-mers (504) are represented by the respective nodes of the graph and the overlaps are represented by the respective edges of the graph.
- The method according to any one of the preceding claims wherein the determining (505) the first and, when depending on claim 2, second output counts is performed by a probabilistic graphical model (870).
- The method according to claim 6 wherein the probabilistic graphical model is a conditional random field, CRF, model (870).
- The method according to claim 6 or 7 wherein the model (870) comprises the first output counts (653) and, when dependent on claim 2, second output counts (654) as unobserved variables.
- The method according to any one of claims 6, 7 and 8 wherein the model (870) comprises the first and/or second counts as observed variables.
- The method according to any one of claims 6 to 9 wherein the determining the first output counts and, when depending on claim 2, the second output counts further comprises selecting a neighbourhood (860) of a respective k-mer and constructing a probabilistic graphical model (870) of the neighbourhood and determining the first output count and/or, when depending on claim 2, the second output count associated with the respective k-mer therefrom.
- The method according to any one of the preceding claims wherein the overlaps between the k-mers are k-1 overlaps.
- A data processing system configured to perform the method according to any one of claims 1 to 11.
- A computer program comprising instructions which, when the program is executed by a computer, cause the computer to perform the method according to any one of claims 1 to 11.
- A computer-readable medium comprising instructions which, when executed by a computer, cause the computer to perform the method according to any one of claims 1 to 11.
Priority Applications (2)
| Application Number | Priority Date | Filing Date | Title |
|---|---|---|---|
| EP18248105.1A EP3675129A1 (en) | 2018-12-27 | 2018-12-27 | Processing reads of sequenced nucleic acid |
| US16/727,278 US20200258596A1 (en) | 2018-12-27 | 2019-12-26 | Processing Reads of Sequenced Nucleic Acid |
Applications Claiming Priority (1)
| Application Number | Priority Date | Filing Date | Title |
|---|---|---|---|
| EP18248105.1A EP3675129A1 (en) | 2018-12-27 | 2018-12-27 | Processing reads of sequenced nucleic acid |
Publications (1)
| Publication Number | Publication Date |
|---|---|
| EP3675129A1 true EP3675129A1 (en) | 2020-07-01 |
Family
ID=65010450
Family Applications (1)
| Application Number | Title | Priority Date | Filing Date |
|---|---|---|---|
| EP18248105.1A Withdrawn EP3675129A1 (en) | 2018-12-27 | 2018-12-27 | Processing reads of sequenced nucleic acid |
Country Status (2)
| Country | Link |
|---|---|
| US (1) | US20200258596A1 (en) |
| EP (1) | EP3675129A1 (en) |
-
2018
- 2018-12-27 EP EP18248105.1A patent/EP3675129A1/en not_active Withdrawn
-
2019
- 2019-12-26 US US16/727,278 patent/US20200258596A1/en not_active Abandoned
Non-Patent Citations (4)
| Title |
|---|
| ANTOINE LIMASSET ET AL: "Toward perfect reads: self-correction of short reads via mapping on de Bruijn graphs", ARXIV.ORG, CORNELL UNIVERSITY LIBRARY, 201 OLIN LIBRARY CORNELL UNIVERSITY ITHACA, NY 14853, 9 November 2017 (2017-11-09), XP081319636 * |
| PEVZNER PAVEL A ET AL: "Fragment assembly with double-barreled data", BIOINFORMAT, OXFORD UNIVERSITY PRESS, SURREY, GB, vol. 17, no. suppl. 1, 1 June 2001 (2001-06-01), pages s225 - s233, XP008140748, ISSN: 1367-4803, DOI: 10.1093/BIOINFORMATICS/17.SUPPL_1.S225 * |
| PHILLIP E C COMPEAU ET AL: "Why are de Bruijn graphs useful for genome assembly?", NATURE BIOTECHNOLOGY, vol. 29, no. 11, 27 July 2017 (2017-07-27), New York, pages 987 - 991, XP055598024, ISSN: 1087-0156, DOI: 10.1038/nbt.2023 * |
| SARA EL-METWALLY ET AL: "Next-Generation Sequence Assembly: Four Stages of Data Processing and Computational Challenges", PLOS COMPUTATIONAL BIOLOGY, vol. 9, no. 12, 12 December 2013 (2013-12-12), pages e1003345, XP055597988, DOI: 10.1371/journal.pcbi.1003345 * |
Also Published As
| Publication number | Publication date |
|---|---|
| US20200258596A1 (en) | 2020-08-13 |
Similar Documents
| Publication | Publication Date | Title |
|---|---|---|
| US11568957B2 (en) | Methods and systems for copy number variant detection | |
| CN111916150B (en) | A method and device for detecting genome copy number variation | |
| Nielsen et al. | Bayesian inference of admixture graphs on Native American and Arctic populations | |
| US20040068332A1 (en) | Stochastic modeling of spatial distributed sequences | |
| US20190325990A1 (en) | Process for aligning targeted nucleic acid sequencing data | |
| Rau et al. | Reverse engineering gene regulatory networks using approximate Bayesian computation | |
| CN109166604B (en) | A computational method for predicting key proteins by fusing multi-data features | |
| Antunes et al. | Knee/elbow point estimation through thresholding | |
| Huang et al. | Estimating evolutionary and demographic parameters via ARG-derived IBD | |
| CN112861692B (en) | Method and device for constructing room classification model, and method and device for classifying rooms | |
| US20200258596A1 (en) | Processing Reads of Sequenced Nucleic Acid | |
| Shmilovici et al. | Using a VOM model for reconstructing potential coding regions in EST sequences | |
| Triay et al. | Fast and accurate imputation of genotypes from noisy low-coverage sequencing data in bi-parental populations | |
| CA3096353C (en) | Determination of frequency distribution of nucleotide sequence variants | |
| Wu et al. | Bi‐level structured functional analysis for genome‐wide association studies | |
| Zare et al. | Copy number variation detection using total variation | |
| Cheong et al. | The context sensitivity problem in biological sequence segmentation | |
| US20260018247A1 (en) | Systems and methods of determining a nucleic acid sequence based on mutated sequence reads | |
| Shen et al. | Iterative learning for reference-Guided DNA Sequence assembly from short reads: Algorithms and limits of performance | |
| Hosseini et al. | pHapCompass: Probabilistic Assembly and Uncertainty Quantification of Polyploid Haplotype Phase | |
| Lanc et al. | An unsupervised learning approach to assembly validation | |
| Nallaparaju | Constrained Secondary Structure Prediction Using Stem Detection | |
| Shen et al. | Algorithm for DNA copy number variation detection with read depth and paramorphism information | |
| Taliun | Efficient Whole Genome Haplotype Block Partitioning using Linkage Disequilibrium | |
| CN120853684A (en) | STR detection method and system based on context-aware motif recognition |
Legal Events
| Date | Code | Title | Description |
|---|---|---|---|
| PUAI | Public reference made under article 153(3) epc to a published international application that has entered the european phase |
Free format text: ORIGINAL CODE: 0009012 |
|
| STAA | Information on the status of an ep patent application or granted ep patent |
Free format text: STATUS: THE APPLICATION HAS BEEN PUBLISHED |
|
| AK | Designated contracting states |
Kind code of ref document: A1 Designated state(s): AL AT BE BG CH CY CZ DE DK EE ES FI FR GB GR HR HU IE IS IT LI LT LU LV MC MK MT NL NO PL PT RO RS SE SI SK SM TR |
|
| AX | Request for extension of the european patent |
Extension state: BA ME |
|
| STAA | Information on the status of an ep patent application or granted ep patent |
Free format text: STATUS: REQUEST FOR EXAMINATION WAS MADE |
|
| 17P | Request for examination filed |
Effective date: 20210106 |
|
| RBV | Designated contracting states (corrected) |
Designated state(s): AL AT BE BG CH CY CZ DE DK EE ES FI FR GB GR HR HU IE IS IT LI LT LU LV MC MK MT NL NO PL PT RO RS SE SI SK SM TR |
|
| STAA | Information on the status of an ep patent application or granted ep patent |
Free format text: STATUS: THE APPLICATION IS DEEMED TO BE WITHDRAWN |
|
| 18D | Application deemed to be withdrawn |
Effective date: 20230701 |