EP3647805A1 - Heart rate correction for relaxation time values of nuclear spins - Google Patents
Heart rate correction for relaxation time values of nuclear spins Download PDFInfo
- Publication number
- EP3647805A1 EP3647805A1 EP18203495.9A EP18203495A EP3647805A1 EP 3647805 A1 EP3647805 A1 EP 3647805A1 EP 18203495 A EP18203495 A EP 18203495A EP 3647805 A1 EP3647805 A1 EP 3647805A1
- Authority
- EP
- European Patent Office
- Prior art keywords
- value
- pulse rate
- coefficients
- function
- mathematical function
- Prior art date
- Legal status (The legal status is an assumption and is not a legal conclusion. Google has not performed a legal analysis and makes no representation as to the accuracy of the status listed.)
- Withdrawn
Links
- 238000012937 correction Methods 0.000 title description 15
- 238000000034 method Methods 0.000 claims abstract description 86
- 238000002595 magnetic resonance imaging Methods 0.000 claims abstract description 18
- 238000007620 mathematical function Methods 0.000 claims description 44
- 238000012886 linear function Methods 0.000 claims description 19
- 238000012887 quadratic function Methods 0.000 claims description 6
- 230000006870 function Effects 0.000 description 45
- 230000001419 dependent effect Effects 0.000 description 15
- 238000013459 approach Methods 0.000 description 12
- 239000008280 blood Substances 0.000 description 11
- 210000004369 blood Anatomy 0.000 description 11
- 230000005284 excitation Effects 0.000 description 11
- 230000014509 gene expression Effects 0.000 description 8
- 210000004165 myocardium Anatomy 0.000 description 7
- 230000008569 process Effects 0.000 description 7
- 238000013507 mapping Methods 0.000 description 5
- 238000001208 nuclear magnetic resonance pulse sequence Methods 0.000 description 5
- 230000005415 magnetization Effects 0.000 description 4
- 238000011084 recovery Methods 0.000 description 4
- 210000001519 tissue Anatomy 0.000 description 4
- 230000000747 cardiac effect Effects 0.000 description 3
- 238000010586 diagram Methods 0.000 description 3
- 238000002075 inversion recovery Methods 0.000 description 3
- 230000002107 myocardial effect Effects 0.000 description 3
- 208000031229 Cardiomyopathies Diseases 0.000 description 2
- 238000012307 MRI technique Methods 0.000 description 2
- 230000003205 diastolic effect Effects 0.000 description 2
- 238000005259 measurement Methods 0.000 description 2
- 230000000116 mitigating effect Effects 0.000 description 2
- 238000012545 processing Methods 0.000 description 2
- 238000004088 simulation Methods 0.000 description 2
- 210000004872 soft tissue Anatomy 0.000 description 2
- 208000009525 Myocarditis Diseases 0.000 description 1
- 230000005856 abnormality Effects 0.000 description 1
- 206010002022 amyloidosis Diseases 0.000 description 1
- 238000004458 analytical method Methods 0.000 description 1
- 238000003491 array Methods 0.000 description 1
- 230000001174 ascending effect Effects 0.000 description 1
- 230000008901 benefit Effects 0.000 description 1
- 230000008859 change Effects 0.000 description 1
- 238000004891 communication Methods 0.000 description 1
- 238000004590 computer program Methods 0.000 description 1
- 238000005094 computer simulation Methods 0.000 description 1
- 201000010099 disease Diseases 0.000 description 1
- 208000037265 diseases, disorders, signs and symptoms Diseases 0.000 description 1
- 238000007689 inspection Methods 0.000 description 1
- 230000003902 lesion Effects 0.000 description 1
- 239000000463 material Substances 0.000 description 1
- 238000012986 modification Methods 0.000 description 1
- 230000004048 modification Effects 0.000 description 1
- 230000002085 persistent effect Effects 0.000 description 1
- 230000003068 static effect Effects 0.000 description 1
- 230000001960 triggered effect Effects 0.000 description 1
- 230000000007 visual effect Effects 0.000 description 1
Images


Classifications
-
- G—PHYSICS
- G01—MEASURING; TESTING
- G01R—MEASURING ELECTRIC VARIABLES; MEASURING MAGNETIC VARIABLES
- G01R33/00—Arrangements or instruments for measuring magnetic variables
- G01R33/20—Arrangements or instruments for measuring magnetic variables involving magnetic resonance
- G01R33/44—Arrangements or instruments for measuring magnetic variables involving magnetic resonance using nuclear magnetic resonance [NMR]
- G01R33/48—NMR imaging systems
- G01R33/54—Signal processing systems, e.g. using pulse sequences ; Generation or control of pulse sequences; Operator console
- G01R33/56—Image enhancement or correction, e.g. subtraction or averaging techniques, e.g. improvement of signal-to-noise ratio and resolution
- G01R33/5602—Image enhancement or correction, e.g. subtraction or averaging techniques, e.g. improvement of signal-to-noise ratio and resolution by filtering or weighting based on different relaxation times within the sample, e.g. T1 weighting using an inversion pulse
-
- G—PHYSICS
- G01—MEASURING; TESTING
- G01R—MEASURING ELECTRIC VARIABLES; MEASURING MAGNETIC VARIABLES
- G01R33/00—Arrangements or instruments for measuring magnetic variables
- G01R33/20—Arrangements or instruments for measuring magnetic variables involving magnetic resonance
- G01R33/44—Arrangements or instruments for measuring magnetic variables involving magnetic resonance using nuclear magnetic resonance [NMR]
- G01R33/48—NMR imaging systems
- G01R33/50—NMR imaging systems based on the determination of relaxation times, e.g. T1 measurement by IR sequences; T2 measurement by multiple-echo sequences
-
- G—PHYSICS
- G01—MEASURING; TESTING
- G01R—MEASURING ELECTRIC VARIABLES; MEASURING MAGNETIC VARIABLES
- G01R33/00—Arrangements or instruments for measuring magnetic variables
- G01R33/20—Arrangements or instruments for measuring magnetic variables involving magnetic resonance
- G01R33/44—Arrangements or instruments for measuring magnetic variables involving magnetic resonance using nuclear magnetic resonance [NMR]
- G01R33/48—NMR imaging systems
- G01R33/54—Signal processing systems, e.g. using pulse sequences ; Generation or control of pulse sequences; Operator console
- G01R33/56—Image enhancement or correction, e.g. subtraction or averaging techniques, e.g. improvement of signal-to-noise ratio and resolution
- G01R33/5608—Data processing and visualization specially adapted for MR, e.g. for feature analysis and pattern recognition on the basis of measured MR data, segmentation of measured MR data, edge contour detection on the basis of measured MR data, for enhancing measured MR data in terms of signal-to-noise ratio by means of noise filtering or apodization, for enhancing measured MR data in terms of resolution by means for deblurring, windowing, zero filling, or generation of gray-scaled images, colour-coded images or images displaying vectors instead of pixels
-
- G—PHYSICS
- G01—MEASURING; TESTING
- G01R—MEASURING ELECTRIC VARIABLES; MEASURING MAGNETIC VARIABLES
- G01R33/00—Arrangements or instruments for measuring magnetic variables
- G01R33/20—Arrangements or instruments for measuring magnetic variables involving magnetic resonance
- G01R33/44—Arrangements or instruments for measuring magnetic variables involving magnetic resonance using nuclear magnetic resonance [NMR]
- G01R33/48—NMR imaging systems
- G01R33/54—Signal processing systems, e.g. using pulse sequences ; Generation or control of pulse sequences; Operator console
- G01R33/56—Image enhancement or correction, e.g. subtraction or averaging techniques, e.g. improvement of signal-to-noise ratio and resolution
- G01R33/567—Image enhancement or correction, e.g. subtraction or averaging techniques, e.g. improvement of signal-to-noise ratio and resolution gated by physiological signals, i.e. synchronization of acquired MR data with periodical motion of an object of interest, e.g. monitoring or triggering system for cardiac or respiratory gating
- G01R33/5673—Gating or triggering based on a physiological signal other than an MR signal, e.g. ECG gating or motion monitoring using optical systems for monitoring the motion of a fiducial marker
Definitions
- the present invention relates to a method of determining coefficients for use in correcting a magnetic relaxation time constant, T, value, and a method of correcting the T value using the determined coefficients.
- the present invention is concerned with a method of determining coefficients for use in correcting a T value obtained via magnetic resonance imaging when a pulse rate was at a first pulse rate value to a T value reflecting the T value that would have been obtained if the pulse rate was at a second pulse rate value.
- Magnetic resonance imaging based techniques for generating magnetic relaxation time constant, T, values for a subject are known.
- T1 is the longitudinal magnetic relaxation time constant, T1.
- the T1 time constant is also known as the spin-lattice relaxation time constant, and is a measure of how fast the nuclear spin magnetization returns to its equilibrium state after an excitation pulse.
- T1 is a key source of soft tissue contrast in MRI.
- T1 mapping is useful to characterize diffuse or infiltrative myocardial diseases, including cardiomyopathies, myocarditis, and amyloidosis.
- T1 mapping and in particular cardiac T1 mapping or myocardial T1 mapping, may be performed using specific MR pulse sequences.
- MOLLI MOdified Look-Locker Inversion recovery
- an inversion pulse is generated and followed by the acquisition of five images.
- the five images are acquired during the diastolic period of the cardiac cycle within five successive heartbeats.
- the diastolic period is the phase of the heartbeat when the myocardium relaxes to allow the chambers of the heart to fill with blood.
- the inversion pulse and the image acquisitions are electrocardiogram, ECG, triggered meaning that a cardiac event as measured by an ECG apparatus triggers the generation of the inversion pulse and the image acquisitions.
- an “inversion pulse” means a 180 degrees excitation pulse that acts to flip the initial longitudinal magnetization of a subject's tissue to point opposite to the direction of the main (e.g.,. static) magnetic field.
- the resultant images may then be sorted in ascending order with respect to the time after the generation of the inversion pulse, the inversion time (TI), and the signal intensity in each pixel of the image may be fit onto an apparent T1 recovery curve during a T1 fitting process.
- A, B and T1* are the parameters to be estimated by the curve fitting.
- T1* is the apparent recovery time rather than the actual recovery time T1.
- a T1 map for the region of interest may be generated.
- T2 time constant is also known as the spin-spin relaxation time constant.
- T2 values may also be estimated using known magnetic resonance imaging based techniques.
- a problem with existing magnetic resonance imaging techniques for generating T values is that the techniques may generate a different T value depending on the heart pulse rate of the subject. This is especially the case for inversion recovery based techniques such as MOLLI mentioned above. As the actual T value of the region being imaged is not dependent on the pulse rate of the subject, this may mean that the generated T values are even more inaccurate via this method which is generally considered to generate inaccurate T values.
- SAturation-recovery-Single-SHot Acquisition SASHA
- Saturation-Pulse Prepared Heart-rate independent Inversion-REcovery SAPPHIRE
- SAturation-recovery-Single-SHot Acquisition SASHA
- Saturation-Pulse Prepared Heart-rate independent Inversion-REcovery SAPPHIRE
- SAturation-recovery-Single-SHot Acquisition SASHA
- Saturation-Pulse Prepared Heart-rate independent Inversion-REcovery Saturation-rate independent Inversion-REcovery
- a saturation pulse refers to a 90 degrees excitation pulse that acts to tip the initial longitudinal magnetization of a subject's tissue into the transverse magnetization plane. This method is generally considered to generate inaccurate T values.
- Another existing approach for mitigating this problem involves correcting a T value obtained when a pulse rate of the subject was at a first pulse rate value to a T value reflecting the T value that would have been obtained if the pulse rate was at a 'standard' pulse rate value representative of a typical heart pulse rate (e.g. 60 bpm).
- This correction approach involves assuming that the relationship between the T value and the heart pulse rate is linear.
- This approach predefines a value for the slope and offset for this linear relationship and uses these predefined slope and offset values to correct obtained T values.
- the inventors of the present application have found that the slope and offset are not independent variables. Instead, the slope and offset are actually dependent on T. As such, the predefined slope and offset values used in existing approaches are limited in their effectiveness of correcting for heart rate variability in obtained T values.
- a method of determining coefficients for use in correcting a magnetic relaxation time constant, T, value obtained via magnetic resonance imaging when a pulse rate was at a first pulse rate value to a T value reflecting the T value that would have been obtained if the pulse rate was at a second pulse rate value there is provided a method of determining coefficients for use in correcting a magnetic relaxation time constant, T, value obtained via magnetic resonance imaging and corresponding to a first pulse rate value of an imaged pulsating subject, in which the corrected T value corresponds to a second pulse rate value differing from the first pulse rate value.
- the method comprises, for each of a plurality of different regions of interest of the imaged pulsating subject:
- the method comprises determining, from the polynomial mathematical function, the values of the coefficients A k n .
- the present invention determines the derivative (e.g. the slope) and the intercept (also referred to as the 'offset' herein)for each of a plurality of different regions of interest.
- the plurality of different regions of interest each have, at the same pulse rate (e.g. 60 bpm), a different T value.
- These determined derivative and offset values for the different regions of interest are fitted to a polynomial function so as to determine the value of coefficients that define the relationship between the derivative and the offset. The coefficients can then be used to determine the slope and offset for correcting a particular obtained T value.
- the derivative (the slope), m (1) , and the offset, c are dependent on the T value. In other words, they are functions of T.
- the slope, m, and the offset, c may be determined for correcting a particular region of interest based on the T value obtained for that particular region of interest at a particular heart pulse rate.
- n d n F P d P n
- P 0 .
- the T value may be a T1 value.
- the T value may be a T2 value.
- the plurality of different regions of interest may be magnetic resonance imaging phantoms. That is, the different regions of interest may comprise different materials designed to have different T values.
- the plurality of T values may be obtained using numerical simulations. That is, an actual magnetic resonance imaging operation is not required to be performed in all examples to obtain the T values, and instead computer simulation could be used to obtain simulated T values for different regions of interest/different pulse rates.
- the method may comprise using the determined coefficients to correct a magnetic relaxation time constant, T, value of a subject obtained via magnetic resonance imaging when a subject pulse rate was at a first pulse rate value to a corrected T value, T', reflecting the T value that would have been obtained if the subject pulse rate was at a second pulse rate value.
- T magnetic relaxation time constant
- the method may comprise modifying the monotonic function by substituting the derivative, m, in the monotonic function for an expression in terms of the intercept (offset), c, and the coefficients A.
- the method may comprise using the obtained T value, T, the first pulse rate value, P, and the coefficients A to determine, from the modified monotonic function, a value of the intercept (offset), c, at which the modified monotonic function is equal to the T value.
- the method may comprise using the determined offset c, to determine the corrected T value, T'.
- the offset is determined using the coefficients obtained previously and the particular T value obtained via magnetic resonance imaging of the subject. Because of this, a better correction of the T value to the correct T value, T', is provided than existing approaches which assume that the offset is independent of the T value.
- the method may include using the determined coefficients to correct a magnetic relaxation time constant, T, value corresponding to a first pulse rate value of an imaged pulsating subject, in which the corrected T value, T', corresponding to a second pulse rate value of the imaged pulsating subject differing from the first pulse rate value, the method comprising:
- T ⁇ T ⁇ P ⁇ sP P T ⁇ c
- T1' (A 1 c n + A 2 c n-1 + ...+An+1.sP + c may yield the same result.
- a higher order polynomial may be used as appreciated by the skilled person.
- the magnetic relaxation time constant, T may be a longitudinal magnetic relaxation time constant, T1.
- T1 transverse magnetic relaxation time constant
- T2 transverse magnetic relaxation time constant
- the method may comprise obtaining a second set of coefficients.
- the second set of coefficients may be obtained using the same method as mentioned above.
- the second set of coefficients may, however, be obtained using second plurality of regions of interest each having substantially the same T2 value at a given pulse rate. This T2 value being different to the T2 value of the plurality of regions of interest used to obtain the first set of coefficients.
- each may reflect a different T2 value.
- the first set of coefficients may reflect the T2 value for blood while the second set of coefficients may reflect the T2 value for the myocardium.
- the method may comprise correcting the obtained T1 value using some or all a plurality of sets of coefficients each reflecting a different T2 value. In this way, a plurality of corrected T1 values may be obtained each reflecting a different T2 value.
- the appropriate corrected T1 value may then be selected based on the measured or estimated T2 value of the region of the subject imaged in the process of obtaining the T1 value. For example, if the region of the subject imaged to obtain the T1 value is estimated or determined to contain blood, the corrected T1 obtained using the set of coefficients obtained from a region of interest having a T2 value corresponding to blood may be used.
- the method may comprise determining whether to correct the obtained T1 value using the determined coefficients according to whether an obtained T2 value of the subject is within a predetermined range of the T2 value of the regions of interest used in determining the coefficients.
- the magnetic relaxation time constant, T may be a transverse magnetic relaxation time constant, T2.
- T2 transverse magnetic relaxation time constant
- Each of the plurality of different regions of interest may have substantially the same longitudinal magnetic relaxation time constant, T1, value at a given pulse rate.
- the method may comprise obtaining a second set of coefficients.
- the second set of coefficients may be obtained using the same method as mentioned above.
- the second set of coefficients may, however, be obtained using second plurality of regions of interest each having substantially the same T1 value at a given pulse rate. This T1 value being different to the T1 value of the plurality of regions of interest used to obtain the first set of coefficients.
- each may reflect a different T1 value.
- the first set of coefficients may reflect the T1 value for blood while the second set of coefficients may reflect the T1 value for the myocardium.
- the method may comprise correcting the obtained T2 value using some or all a plurality of sets of coefficients each reflecting a different T1 value. In this way, a plurality of corrected T2 values may be obtained each reflecting a different T1 value.
- the appropriate corrected T2 value may then be selected based on the measured or estimated T1 value of the region of the subject imaged in the process of obtaining the T2 value. For example, if the region of the subject imaged to obtain the T2 value is estimated or determined to contain blood, the corrected T2 obtained using the set of coefficients obtained from a region of interest having a T1 value corresponding to blood may be used.
- the method may comprises determining whether to correct the obtained T2 value using the determined coefficients according to whether an obtained T1 value of the subject is within a predetermined range of the T2 value of the regions of interest used in determined the coefficients.
- the method may further comprise using the determined coefficients to correct a plurality of T values, wherein each of the plurality of T values represents a different pixel in a T map.
- the T map may be two-dimensional, but is not limited to two-dimensions and may be three-dimensional for example.
- the method comprises:
- the method comprises modifying the mathematical function by substituting the derivative, m, in the mathematical function for an expression in terms of the intercept (offset), c, and the coefficients A 1 , A 2,... A n+1
- the method comprises using the obtained T value, T, the first pulse rate value, P, and the coefficients A 1 , A 2,... A n+1 to determine, from the modified mathematical function, a value of the offset, c, at which the modified mathematical function is equal to the T value.
- the method comprises using the determined offset c, to determine the corrected T value, T'.
- a computer readable medium having instructions recorded thereon which, when executed by a computer, cause the computer to perform the method as described above in relation to the first or second aspect of the invention.
- an apparatus for performing the method as described above in relation to the first or second aspect of the invention may be a magnetic resonance (MR) apparatus.
- MR magnetic resonance
- FIG. 1 there is shown an example plot 100 of longitudinal magnetic relaxation time constant, T1, values for a region of interest recorded at different pulse rates, P.
- T1 longitudinal magnetic relaxation time constant
- This variation in the T1 value is not caused by a change in tissue properties within the region of interest but is instead caused by the susceptibility of the magnetic resonance imaging sequences used to obtain T1 values to heart rate variability.
- the obtained T1 value is corrected to a T value reflecting the T value that would have been obtained if the pulse rate was at a second pulse rate value.
- the second pulse rate may be a standard pulse rate value used by clinicians.
- the second pulse rate value will be referred to as 60 heartbeats per minute (bpm) in the following examples, but it will be appreciated that other second pulse rate values may be used.
- the second pulse rate value could be between 40 to 140 bpm, 40 to 120 bpm, 40 to 100 bpm, 40 to 80 bpm, or 40 to 60 bpm.
- the second pulse rate value could be between 60 to 140 bpm, 80 to 140 bpm, 100 to 140 bpm, or 120 to 140 bpm.
- the monotonic function comprises a derivative, m, of the dependent variable, T, with respect to the independent variable, P.
- the monotonic function also comprises an intercept (also referred to interchangeably as an 'offset'), c, corresponding to the T1 value when the independent variable, P, being equal to zero.
- the derivative, m, and the offset, c vary as a function of the determined T1 value. This means that a predefined offset used for subsequently correcting obtained T1 values generally results in low precision heart rate correct.
- the present invention provides a different approach or correcting T1 values.
- the present invention provides a calibration stage where coefficients are determined.
- the coefficients are for use in correcting a magnetic relaxation time constant, T1, value obtained via magnetic resonance imaging when a pulse rate was at a first pulse rate value to a T1 value reflecting the T1 value that would have been obtained if the pulse rate was at a second pulse rate value.
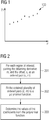
- FIG. 2 shows an overview of the calibration stage.
- the calibration stage comprises three main steps 201, 202, 203.
- step 201 a derivative value, m, and an offset value, c, are obtained for each of a plurality of regions of interest. This results in the generation of an ordered pair (c, m) for each region of interest.
- each region of interest has a different T1 value at the second pulse rate value of a typical heart pulse rate, say 60 bpm.
- Each region of interest has substantially the same T2 value at the second pulse rate value.
- step 202 the obtained plurality of ordered pairs (c, m) are fitted to a polynomial function.
- n 1 representing the first-order derivative
- N is a positive integer
- step 203 the values of the coefficients A k n are determined from the polynomial function.
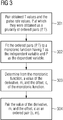
- Figure 3 shows a detailed overview of step 201 of the calibration stage in 201 as performed for each region of interest.
- step 301 the T1 values obtained for the region of interest and the pulse rate values, P, at which they were obtained are paired to obtain a plurality of ordered pairs (P, T).
- step 302 the ordered pairs (P, T) are fitted to a monotonic function having T as the dependent variable and P as the independent variable.
- step 303 a value of the derivative, m, of the dependent variable, T, with respect to the independent variable, P is determined from the monotonic function.
- step 304 the value of the derivative, m, and the value of the intercept (offset), c, are paired as a second ordered pair (c, m).
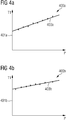
- FIG. 4a to 4c there are shown example plots example plots 400a, 400b, 400c, of T1 values for three different regions of interests obtained over a range of different pulse rates.
- Figure 4a shows an example plot 400a of T1 values obtained over a range of pulse rates, P, for a first region of interest.
- the first region of interest has a first T1 value at the second pulse rate value of a typical heart pulse rate, say 60 bpm.
- the T1 values and the corresponding pulse rate, P, at which they were obtained are paired to define a plurality of ordered pairs (P, T1). For example, if T1 values were obtained at five different pulse rates, five ordered pairs would be defined ⁇ (P 1 , T1 1 ), (P 2 , T1 2 ), (P 3 , T1 3 ), (P 4 , T1 4 ), (P 5 , T1 5 ) ⁇ .
- the dependent variable of the linear function is the T1 value
- the independent variable of the linear function is the pulse rate value, P.
- m denotes the value of the derivative of first order (i.e. the slope) of the dependent variable T1, with respect to the independent variable P.
- c denotes the value of the intercept (offset), c, of the monotonic function corresponding to the dependent variable, P, being equal to zero.
- the intercept (offset) is indicated by the reference numeral 401a in Figure 4a .
- the value of the slope, m, and the intercept (offset), c, are determined from the linear function and paired together to form an ordered pair (m 1 , c 1 ).
- Figure 4b shows an example plot 400b of T1 values obtained over a range of pulse rates, P, for a second region of interest.
- the second region of interest has a second T1 value at the second pulse rate value of a typical heart pulse rate, say 60 bpm.
- the T1 values and the corresponding pulse rates at which they were obtained form ordered pairs which are fitted to a linear function as indicated by the line 403b in Figure 4b .
- the value of the first-order derivative, m, and the intercept (offset)t c, are obtained from the linear function form an ordered pair (m 2 , c 2 ).
- the intercept (offset) is indicated by the reference numeral 401b in Figure 4b .
- Figure 4c shows an example plot 400c of T1 values obtained over a range of pulse rates, P, for a third region of interest.
- the third region of interest has a third T1 value at the second pulse rate value of a typical heart pulse rate, say 60 bpm.
- the T1 values and the corresponding pulse rates at which they were obtained form ordered pairs which are fitted to a linear function as indicated by the line 403c in Figure 4c .
- the value of the first-order derivative, m, and the intercept (offset), c, are obtained from the linear function form an ordered pair (m 3 , c 3 ).
- the intercept (offset) is indicated by the reference numeral 401c in Figure 4c .
- the three regions of interest result in three ordered pairs ⁇ (m 1 , c 1 ), (m 2, c 2 ), (m 3 , c 3 ) ⁇ .
- Figure 5 shows an example plot 500 of the obtained three ordered pairs ⁇ (m 1 , c 1 ), (m 2 , c 2 ), (m 3 , c 3 ) ⁇ . From this plot, it can be seen that there is a relationship between the slope, m, and the intercept (offset), c. This relationship may be represented by a polynomial function as indicated by the curve 501.
- a 2, and A 3 are the coefficients to be determined.
- the values of the coefficients are determined using the polynomial function.
- the values of the coefficients may be obtained using a least squares fitting procedure.
- the calibration stage may be performed using phantoms or even numerical simulations.
- the obtained coefficients may then be used to correct T1 values for a number of different subjects. This is because the present invention exploits the realisation that this relationship between slope, m, and intercept (offset), c, holds for different T1 values.
- a benefit of this is that extensive magnetic resonance imaging of the subject is not required, which can not only be expensive but also stressful for the subject.
- the present invention further provides a correction stage for correcting a magnetic relaxation time constant, T1, value obtained for a subject via magnetic resonance imaging when a pulse rate was at a first pulse rate value to a T1 value reflecting the T1 value that would have been obtained if the pulse rate was at a second pulse rate value.
- T1 magnetic relaxation time constant
- a subject is imaged to obtain T1 values which are generally arranged to form a 2D T1 map.
- the T1 map could be of a myocardial region of the subject.
- the obtained T1 values are then corrected using the coefficients determined in the calibration stage mentioned above.
- the obtained (uncorrected) T1 value and the pulse rate of the subject when the T1 value was obtained are known.
- the pulse rate may be measured using an ECG or other similar approach for measuring the pulse rate.
- the correction stage also knows that there is a monotonic relationship between the T1 value and the pulse rate.
- T1 is the obtained T1 value
- P is the known pulse rate of the subject when the T1 value was obtained.
- m refers to the first-order derivative which is currently unknown
- c refers to the intercept (offset) which is currently unknown.
- the objective of the correction stage is to correct the T1 value to a corrected T1 value, T1' that reflects the T1 value that would have been obtained if the pulse rate was at the second pulse rate value of 60 bpm.
- the correction stage comprises three main steps 601, 602, 603.
- Step 601 comprises modifying the monotonic function by substituting the first-order derivative, m, in the monotonic function for an expression in terms of the intercept (offset), c, and the coefficients A 1 , A 2, A 0 .
- T1 T1
- P the coefficients A 1 , A 2, A 0 are known.
- Step 602 comprises determining from this modified monotonic function, a value of the intercept (offset), c, at which the monotonic function is equal to the T value.
- a value of the intercept (offset), c at which the monotonic function is equal to the T value.
- c ⁇ A 1 + 1 P ⁇ A 1 + 1 P 2 ⁇ 4 A 2 A 0 ⁇ T 1 P 2 A 2
- Step 603 comprises using the determined intercept (offset), c, to determine the corrected T value, T'.
- the above example method for correcting the T1 value may be performed for each pixel of the obtained T1 map such that a corrected T1 map may be obtained.
- different pixels of the T1 map may be associated with subject tissue having different T2 values.
- some regions of the T1 map may relate to the myocardium while other regions of the T1 map may relate to blood.
- the myocardium usually has a short T2 value, and the blood usually has a longer T2 value.
- a plurality of different sets of coefficients may be determined.
- Each of the sets of coefficients may be obtained using regions of interest having a different T2 value at a particular pulse rate.
- a first set of coefficients may be obtained using a region of interest which has a short T2 value, reflecting the T2 value of the myocardium.
- a second set of coefficients may be obtained using a region of interest which has a long T2 value, reflecting the T2 value of blood.
- the T1 value may be corrected, separately, using both sets of coefficient values. This may result in the generation of two corrected T1 values. One T1 value corrected for a short T2 value, while the other T1 value corrected for a long T1 value.
- the pixel of the T1 map may be analysed to estimate its T2 value.
- the pixel of the T1 map may be processed to determine whether it has the visual properties of the myocardium or the blood. Based on this determination, an appropriate set of coefficient values may be selected for correcting the T1 value. This approach may result in the generation of only a single corrected T1 value.
- m ( n ) of order n
- P 0 .
- the values of P and T1 are known values obtained from measurements and the coefficients A k 2 and A k 1 are known from curve-fitting to measurements of m (1) ( c ), and m (2) ( c ), each when plotted as functions of measured values of c.
- the above equation is an Nth order polynomial in the variable 'c'.
- the root of this polynomial equation we shall denote as c 0 .
- T 1 ref 1 2 m 2 P ref 2 + m 1 P ref + c
- T1 ref in association with P ref
- T' is synonymous with T1 ref .
- T 1 ⁇ T 1 ref P ⁇ P ref 1 2 m 2 P ⁇ P ref + m 1
- T 1 ⁇ c P ⁇ 1 2 m 2 P 2 m 1
- T 1 ref T 1 + T 1 ⁇ c 0 P ⁇ P ref P ⁇ 1 2 m 2 c 0 P ⁇ P ref P ref
- the root c 0 of the polynomial is the value used for the intercept/offset variable c.
- m (2) (c 0 ) denotes the value of the second order differential as evaluated using the root c 0 . This allows the corrected value T1 ref (also referred to as T' in other examples above) to be obtained. It will be seen that if the second order differential (m (2) (c 0 )) is ignored/neglected, then the above equation reduces to the earlier expression derived above when the mathematical function is assumed to be purely linear.
- the MR apparatus 700 comprises a computing system 701, a gradient system 703, and an excitation system 705.
- the gradient system 703 is configured to apply a magnetic field gradient.
- the gradient system 703 may be configured to apply magnetic field gradients along three spatial axes.
- the excitation system 705 may comprise a transmitter (not shown) and a receiver (not shown).
- the excitation system 705 can be an RF system with one or more RF coils (not shown).
- the excitation system 705 is configured to apply an excitation pulse to the subject and to receive signals from the subject.
- the MR apparatus 700 includes a magnet (not shown) for establishing a stationary magnetic field.
- the magnet can include a permanent magnet, a superconducting magnet or other type of magnet.
- the computing system 701 is in communication with the excitation system 705, and the gradient system 703 for controlling these components.
- the computing system 701 is configured to receive the signals from the excitation system 705.
- the computing system 701 is further configured to execute program code to control the gradient system 703 and the excitation system 705 to generate a MR pulse sequence.
- the MR pulse sequence may be a pulse sequence for obtaining MR images for use in estimating T1 times in accordance with the present invention.
- the computing system 701 is configured to execute code to process the MR images so as to estimate the T1 time, and correct the T1 time to a standard pulse rate (e.g. 60 bpm) in accordance with the present invention.
- the computing system 701 could be an integrated component of the MR apparatus 700.
- the computing system 701 could be a unit of a desktop computer, a workstation, a server, or a laptop computer.
- the method in accordance with the present invention may be performed by a stand-alone computer or network of computers that are not directly associated with an MR apparatus.
- the computer or network of computers may have a central processing unit (CPU) of a graphics processing unit (GPU) for performing the method according to the present invention.
- the CPU or GPU may be a parallel processor. Some or all of the aspects of the present invention may be parallelised using the parallel processor.
- a method of determining coefficients for use in correcting a magnetic relaxation time constant, T, value obtained via magnetic resonance imaging when a pulse rate was at a first pulse rate value to a T value reflecting the T value that would have been obtained if the pulse rate was at a second pulse rate value comprising, for each region of interest, pairing an obtained derivative, m, and an obtained intercept (offset), c, as an ordered pair (c, m) 201.
- the method comprising fitting the obtained plurality of ordered pairs (c,m) to a polynomial function 202.
- the method comprising determining the values of the coefficients from the polynomial function 203.
- At least some of the example embodiments described herein may be constructed, partially or wholly, using dedicated special-purpose hardware.
- Terms such as 'component', 'module' or 'unit' used herein may include, but are not limited to, a hardware device, such as circuitry in the form of discrete or integrated components, a Field Programmable Gate Array (FPGA) or Application Specific Integrated Circuit (ASIC), which performs certain tasks or provides the associated functionality.
- FPGA Field Programmable Gate Array
- ASIC Application Specific Integrated Circuit
- the described elements may be configured to reside on a tangible, persistent, addressable storage medium and may be configured to execute on one or more processors.
- These functional elements may in some embodiments include, by way of example, components, such as software components, object-oriented software components, class components and task components, processes, functions, attributes, procedures, subroutines, segments of program code, drivers, firmware, microcode, circuitry, data, databases, data structures, tables, arrays, and variables.
- components such as software components, object-oriented software components, class components and task components, processes, functions, attributes, procedures, subroutines, segments of program code, drivers, firmware, microcode, circuitry, data, databases, data structures, tables, arrays, and variables.
Landscapes
- Physics & Mathematics (AREA)
- Health & Medical Sciences (AREA)
- Engineering & Computer Science (AREA)
- Condensed Matter Physics & Semiconductors (AREA)
- General Physics & Mathematics (AREA)
- High Energy & Nuclear Physics (AREA)
- General Health & Medical Sciences (AREA)
- Signal Processing (AREA)
- Radiology & Medical Imaging (AREA)
- Nuclear Medicine, Radiotherapy & Molecular Imaging (AREA)
- Physiology (AREA)
- Biophysics (AREA)
- Life Sciences & Earth Sciences (AREA)
- Pulmonology (AREA)
- Power Engineering (AREA)
- Cardiology (AREA)
- Artificial Intelligence (AREA)
- Computer Vision & Pattern Recognition (AREA)
- Magnetic Resonance Imaging Apparatus (AREA)
Abstract
Description
- The present invention relates to a method of determining coefficients for use in correcting a magnetic relaxation time constant, T, value, and a method of correcting the T value using the determined coefficients.
- In particular the present invention is concerned with a method of determining coefficients for use in correcting a T value obtained via magnetic resonance imaging when a pulse rate was at a first pulse rate value to a T value reflecting the T value that would have been obtained if the pulse rate was at a second pulse rate value.
- Magnetic resonance imaging based techniques for generating magnetic relaxation time constant, T, values for a subject are known.
- One example of the T value is the longitudinal magnetic relaxation time constant, T1. The T1 time constant is also known as the spin-lattice relaxation time constant, and is a measure of how fast the nuclear spin magnetization returns to its equilibrium state after an excitation pulse. T1 is a key source of soft tissue contrast in MRI.
- Estimating T1 times and using the T1 times to generate a T1 map of an examination area provides a useful tool for a medical professional to identify diseases, lesions and abnormalities in soft tissue that affect T1. T1 mapping is useful to characterize diffuse or infiltrative myocardial diseases, including cardiomyopathies, myocarditis, and amyloidosis.
- T1 mapping, and in particular cardiac T1 mapping or myocardial T1 mapping, may be performed using specific MR pulse sequences.
- One such MR pulse sequence is commonly known as the MOdified Look-Locker Inversion recovery (MOLLI) which may be used for myocardial T1 mapping. In an example MOLLI sequence, an inversion pulse is generated and followed by the acquisition of five images. The five images are acquired during the diastolic period of the cardiac cycle within five successive heartbeats. The diastolic period is the phase of the heartbeat when the myocardium relaxes to allow the chambers of the heart to fill with blood. After the acquisition of the five images, there is a rest period of three heartbeats, before the sequence is repeated for three heartbeats. The inversion pulse and the image acquisitions are electrocardiogram, ECG, triggered meaning that a cardiac event as measured by an ECG apparatus triggers the generation of the inversion pulse and the image acquisitions.
- Here, an "inversion pulse" means a 180 degrees excitation pulse that acts to flip the initial longitudinal magnetization of a subject's tissue to point opposite to the direction of the main (e.g.,. static) magnetic field.
- The resultant images may then be sorted in ascending order with respect to the time after the generation of the inversion pulse, the inversion time (TI), and the signal intensity in each pixel of the image may be fit onto an apparent T1 recovery curve during a T1 fitting process. The apparent T1 recovery curve may follow a three-parameter model S(t) = A - B exp (-t/T1*) where S(t) is the signal intensity at time t after application of the inversion pulse. A, B and T1* are the parameters to be estimated by the curve fitting. T1* is the apparent recovery time rather than the actual recovery time T1. T1 can be calculated by applying the correction T1 = T1*x ((B/A) - 1). In some examples, the correction T1 = T1*x ((B/A) - 1)/C may be applied where C is an inversion factor of the inversion pulse. After computing the T1 time for each pixel, a T1 map for the region of interest may be generated.
- Another example of the T value is the traverse magnetic relaxation time constant, T2. The T2 time constant is also known as the spin-spin relaxation time constant. T2 values may also be estimated using known magnetic resonance imaging based techniques.
- A problem with existing magnetic resonance imaging techniques for generating T values is that the techniques may generate a different T value depending on the heart pulse rate of the subject. This is especially the case for inversion recovery based techniques such as MOLLI mentioned above. As the actual T value of the region being imaged is not dependent on the pulse rate of the subject, this may mean that the generated T values are even more inaccurate via this method which is generally considered to generate inaccurate T values.
- One existing approach for mitigating this problem is to use particular magnetic resonance imaging techniques that are not, or are less dependent on the heart rate. For example, saturation pulse based techniques SAturation-recovery-Single-SHot Acquisition (SASHA) and Saturation-Pulse Prepared Heart-rate independent Inversion-REcovery (SAPPHIRE) are generally heart rate independent. Here, a saturation pulse refers to a 90 degrees excitation pulse that acts to tip the initial longitudinal magnetization of a subject's tissue into the transverse magnetization plane. This method is generally considered to generate inaccurate T values.
- However, these saturation pulse based techniques generally result in less precise T values as compared to inversion pulse based techniques. Robustness of generated T values to heart rate variation, has important clinical value.
- Another existing approach for mitigating this problem involves correcting a T value obtained when a pulse rate of the subject was at a first pulse rate value to a T value reflecting the T value that would have been obtained if the pulse rate was at a 'standard' pulse rate value representative of a typical heart pulse rate (e.g. 60 bpm). This correction approach involves assuming that the relationship between the T value and the heart pulse rate is linear. This approach predefines a value for the slope and offset for this linear relationship and uses these predefined slope and offset values to correct obtained T values.
- The inventors of the present application have found that the slope and offset are not independent variables. Instead, the slope and offset are actually dependent on T. As such, the predefined slope and offset values used in existing approaches are limited in their effectiveness of correcting for heart rate variability in obtained T values.
- It is an objective of the present invention to provide an improved approach for correcting for heart rate variability in obtained T values, or at least an alternative to the existing approaches.
- According to the present disclosure there is provided a method, computer program, and system as set forth in the appended claims. Other features of the invention will be apparent from the dependent claims, and the description which follows.
- According to a first aspect of the invention, there is provided a method of determining coefficients for use in correcting a magnetic relaxation time constant, T, value obtained via magnetic resonance imaging when a pulse rate was at a first pulse rate value to a T value reflecting the T value that would have been obtained if the pulse rate was at a second pulse rate value. According to this aspect, there is provided a method of determining coefficients for use in correcting a magnetic relaxation time constant, T, value obtained via magnetic resonance imaging and corresponding to a first pulse rate value of an imaged pulsating subject, in which the corrected T value corresponds to a second pulse rate value differing from the first pulse rate value. The method comprises, for each of a plurality of different regions of interest of the imaged pulsating subject:
- (i) obtaining a plurality of T values for the region of interest, each T value being associated with a different respective pulse rate value, P, to define a plurality of respective first ordered pairs (P, T);
- (ii) fitting a mathematical function, F(P), to the plurality of first ordered pairs (P, T) which is monotonic thereacross, wherein the independent variable of the mathematical function is the pulse rate value, P;
- (iii) determining a value of one or more derivatives of order n,

- (iv) determining an intercept value, c, of the mathematical function corresponding to the independent variable, P, being equal to zero;
- (v) pairing the value of a said derivative of order n and the value of the intercept, c, as a second ordered pair (c, m(n)).
- The method comprises fitting to a polynomial mathematical function of the form:


- Significantly, the present invention determines the derivative (e.g. the slope) and the intercept (also referred to as the 'offset' herein)for each of a plurality of different regions of interest. The plurality of different regions of interest each have, at the same pulse rate (e.g. 60 bpm), a different T value. These determined derivative and offset values for the different regions of interest are fitted to a polynomial function so as to determine the value of coefficients that define the relationship between the derivative and the offset. The coefficients can then be used to determine the slope and offset for correcting a particular obtained T value.
- The mathematical function may be a linear function of the form:

- The mathematical function may be a quadratic function of the form:

- The mathematical function may be a polynomial function of the form:

- The value of one or more derivatives of order n, is determined corresponding to the independent variable, P, being equal to zero:

- The T value may be a T1 value. The T value may be a T2 value.
- The plurality of different regions of interest may be magnetic resonance imaging phantoms. That is, the different regions of interest may comprise different materials designed to have different T values.
- The plurality of T values may be obtained using numerical simulations. That is, an actual magnetic resonance imaging operation is not required to be performed in all examples to obtain the T values, and instead computer simulation could be used to obtain simulated T values for different regions of interest/different pulse rates.
- The method may comprise using the determined coefficients to correct a magnetic relaxation time constant, T, value of a subject obtained via magnetic resonance imaging when a subject pulse rate was at a first pulse rate value to a corrected T value, T', reflecting the T value that would have been obtained if the subject pulse rate was at a second pulse rate value.
- The method may comprise modifying the monotonic function by substituting the derivative, m, in the monotonic function for an expression in terms of the intercept (offset), c, and the coefficients A.
- The method may comprise using the obtained T value, T, the first pulse rate value, P, and the coefficients A to determine, from the modified monotonic function, a value of the intercept (offset), c, at which the modified monotonic function is equal to the T value.
- The method may comprise using the determined offset c, to determine the corrected T value, T'.
- As such, the offset is determined using the coefficients obtained previously and the particular T value obtained via magnetic resonance imaging of the subject. Because of this, a better correction of the T value to the correct T value, T', is provided than existing approaches which assume that the offset is independent of the T value.
- The method may include using the determined coefficients to correct a magnetic relaxation time constant, T, value corresponding to a first pulse rate value of an imaged pulsating subject, in which the corrected T value, T', corresponding to a second pulse rate value of the imaged pulsating subject differing from the first pulse rate value, the method comprising:
- using the obtained T value, T, the first pulse rate value, P, and said polynomial function, m(n)(c), to modify the coefficients,

- determining a root of the modified polynomial function;
- using the determined root as the determined intercept value, c, in said mathematical function, F(P), to determine the corrected T value, T', corresponding to a second pulse rate value.
- The mathematical function may be a linear function of the form:

- For example, when the mathematical function (F(P)) is linear, (e.g. F(P) = m(1)P + c) the method may include using the determined intercept (offset), c, to determine the corrected T value, T', comprising determining T' such that:
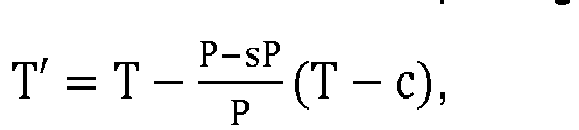
- wherein T' refers to the corrected T value,
- wherein T refers to the obtained T value,
- wherein P refers to the first pulse rate value,
- wherein sP refers to the second pulse rate value, and
- wherein c refers to the value of the intercept (offset).
- Here, determining T' such that

- The polynomial function may be a quadratic function of the form:

- A higher order polynomial may be used as appreciated by the skilled person.
- The magnetic relaxation time constant, T, may be a longitudinal magnetic relaxation time constant, T1. Each of the plurality of different regions of interest have substantially the same transverse magnetic relaxation time constant, T2, value at a given pulse rate. That is, each of the plurality of different regions of interest may have a different T1 value and substantially the same T2 value at a given pulse rate.
- The method may comprise obtaining a second set of coefficients. The second set of coefficients may be obtained using the same method as mentioned above. The second set of coefficients may, however, be obtained using second plurality of regions of interest each having substantially the same T2 value at a given pulse rate. This T2 value being different to the T2 value of the plurality of regions of interest used to obtain the first set of coefficients.
- In this way, two (or more) sets of coefficients may be obtained. Each may reflect a different T2 value. For example, the first set of coefficients may reflect the T2 value for blood while the second set of coefficients may reflect the T2 value for the myocardium.
- The method may comprise correcting the obtained T1 value using some or all a plurality of sets of coefficients each reflecting a different T2 value. In this way, a plurality of corrected T1 values may be obtained each reflecting a different T2 value. The appropriate corrected T1 value may then be selected based on the measured or estimated T2 value of the region of the subject imaged in the process of obtaining the T1 value. For example, if the region of the subject imaged to obtain the T1 value is estimated or determined to contain blood, the corrected T1 obtained using the set of coefficients obtained from a region of interest having a T2 value corresponding to blood may be used.
- The method may comprise determining whether to correct the obtained T1 value using the determined coefficients according to whether an obtained T2 value of the subject is within a predetermined range of the T2 value of the regions of interest used in determining the coefficients.
- The magnetic relaxation time constant, T, may be a transverse magnetic relaxation time constant, T2. Each of the plurality of different regions of interest may have substantially the same longitudinal magnetic relaxation time constant, T1, value at a given pulse rate.
- The method may comprise obtaining a second set of coefficients. The second set of coefficients may be obtained using the same method as mentioned above. The second set of coefficients may, however, be obtained using second plurality of regions of interest each having substantially the same T1 value at a given pulse rate. This T1 value being different to the T1 value of the plurality of regions of interest used to obtain the first set of coefficients.
- In this way, two (or more) sets of coefficients may be obtained. Each may reflect a different T1 value. For example, the first set of coefficients may reflect the T1 value for blood while the second set of coefficients may reflect the T1 value for the myocardium.
- The method may comprise correcting the obtained T2 value using some or all a plurality of sets of coefficients each reflecting a different T1 value. In this way, a plurality of corrected T2 values may be obtained each reflecting a different T1 value. The appropriate corrected T2 value may then be selected based on the measured or estimated T1 value of the region of the subject imaged in the process of obtaining the T2 value. For example, if the region of the subject imaged to obtain the T2 value is estimated or determined to contain blood, the corrected T2 obtained using the set of coefficients obtained from a region of interest having a T1 value corresponding to blood may be used.
- The method may comprises determining whether to correct the obtained T2 value using the determined coefficients according to whether an obtained T1 value of the subject is within a predetermined range of the T2 value of the regions of interest used in determined the coefficients.
- The method may further comprise using the determined coefficients to correct a plurality of T values, wherein each of the plurality of T values represents a different pixel in a T map. The T map may be two-dimensional, but is not limited to two-dimensions and may be three-dimensional for example.
- According to a second aspect of the present invention, there is provided a method of correcting a magnetic relaxation time constant, T, value obtained via magnetic resonance imaging when a pulse rate of a subject was at a first pulse rate value to a corrected T value, T', reflecting the T value that would have been obtained if the pulse rate of the subject was at a second pulse rate value.
- The method comprises:
- obtaining coefficient values A1, A2,...,An, An+1, of a polynomial function of the form m = A1 cn + A2 cn-1 + ... + An+1,
- wherein m refers to a derivative of a monotonic mathematical function, and wherein c refers to an intercept or offset of the mathematical function, wherein the dependent variable of the mathematical function is the T value, and the independent variable of the mathematical function is the pulse rate value, P.
- The method comprises modifying the mathematical function by substituting the derivative, m, in the mathematical function for an expression in terms of the intercept (offset), c, and the coefficients A1, A2,... An+1
- The method comprises using the obtained T value, T, the first pulse rate value, P, and the coefficients A1, A2,... An+1 to determine, from the modified mathematical function, a value of the offset, c, at which the modified mathematical function is equal to the T value.
- The method comprises using the determined offset c, to determine the corrected T value, T'.
- According to a third aspect of the present invention, there is provided a computer readable medium having instructions recorded thereon which, when executed by a computer, cause the computer to perform the method as described above in relation to the first or second aspect of the invention.
- According to a fourth aspect of the present invention, there is provided an apparatus for performing the method as described above in relation to the first or second aspect of the invention. The apparatus may be a magnetic resonance (MR) apparatus.
- Examples of the present disclosure will now be described with reference to the accompanying drawings, in which:
-
Figure 1 shows an example plot of T1 values against pulse rates according to aspects of the present invention; -
Figures 2a-2c shows further example plots of T1 values against pulse rates according to aspects of the present invention -
Figure 3 shows an example plot of determined derivative values against offset values according to aspects of the present invention; -
Figure 4 shows an example flow diagram according to aspects of the present invention; -
Figure 5 shows another example flow diagram according to aspects of the present invention; -
Figure 6 shows another example flow diagram according to aspects of the present invention; and -
Figure 7 shows an example magnetic resonance apparatus according to aspects of the present invention. - Referring to
Figure 1 , there is shown anexample plot 100 of longitudinal magnetic relaxation time constant, T1, values for a region of interest recorded at different pulse rates, P. In this example, it can be seen that the obtained T1 values for a region of interest indicated by 'x' inFigure 1 vary based on the pulse rate. In this example, the T1 value increases as the pulse rate increases. - This variation in the T1 value is not caused by a change in tissue properties within the region of interest but is instead caused by the susceptibility of the magnetic resonance imaging sequences used to obtain T1 values to heart rate variability.
- To increase the clinical relevance of the obtained T1 value, the obtained T1 value is corrected to a T value reflecting the T value that would have been obtained if the pulse rate was at a second pulse rate value. The second pulse rate may be a standard pulse rate value used by clinicians. The second pulse rate value will be referred to as 60 heartbeats per minute (bpm) in the following examples, but it will be appreciated that other second pulse rate values may be used. For example, the second pulse rate value could be between 40 to 140 bpm, 40 to 120 bpm, 40 to 100 bpm, 40 to 80 bpm, or 40 to 60 bpm. For example, the second pulse rate value could be between 60 to 140 bpm, 80 to 140 bpm, 100 to 140 bpm, or 120 to 140 bpm.
- It can be seen in
Figure 1 that the T1 value increases monotonically with the pulse rate. This means that a monotonic mathematical function with the T1 value as the independent variable and the pulse rate value, P, as the dependent variable may be defined. - The monotonic function comprises a derivative, m, of the dependent variable, T, with respect to the independent variable, P. The monotonic function also comprises an intercept (also referred to interchangeably as an 'offset'), c, corresponding to the T1 value when the independent variable, P, being equal to zero.
- In one example, the monotonic function is a linear function. That is, the T1 value is expressed in terms of the derivative, m, and the offset c, i.e. T1 = m x P + c.
- Other forms of monotonic function may have higher order differentials such as:


- In accordance with the present invention it has been realised that the derivative, m, and the offset, c, vary as a function of the determined T1 value. This means that a predefined offset used for subsequently correcting obtained T1 values generally results in low precision heart rate correct. The present invention provides a different approach or correcting T1 values.
- The present invention provides a calibration stage where coefficients are determined. The coefficients are for use in correcting a magnetic relaxation time constant, T1, value obtained via magnetic resonance imaging when a pulse rate was at a first pulse rate value to a T1 value reflecting the T1 value that would have been obtained if the pulse rate was at a second pulse rate value.
-
Figure 2 shows an overview of the calibration stage. The calibration stage comprises threemain steps - In step 201 a derivative value, m, and an offset value, c, are obtained for each of a plurality of regions of interest. This results in the generation of an ordered pair (c, m) for each region of interest.
- Generally, each region of interest has a different T1 value at the second pulse rate value of a typical heart pulse rate, say 60 bpm. Each region of interest has substantially the same T2 value at the second pulse rate value.
- In
step 202, the obtained plurality of ordered pairs (c, m) are fitted to a polynomial function. The polynomial function is of the form:
- Where n=1 representing the first-order derivative, and N is a positive integer.
- In
step 203, the values of the coefficients
-
Figure 3 shows a detailed overview ofstep 201 of the calibration stage in 201 as performed for each region of interest. - In
step 301, the T1 values obtained for the region of interest and the pulse rate values, P, at which they were obtained are paired to obtain a plurality of ordered pairs (P, T). - In
step 302, the ordered pairs (P, T) are fitted to a monotonic function having T as the dependent variable and P as the independent variable. - In
step 303, a value of the derivative, m, of the dependent variable, T, with respect to the independent variable, P is determined from the monotonic function. A value of the intercept (offset), c, of the monotonic function corresponding to the independent variable, P, being equal to zero is also determined. - In
step 304, the value of the derivative, m, and the value of the intercept (offset), c, are paired as a second ordered pair (c, m). - An example calibration stage will now be described through reference to the plots shown in
Figures 4a to 5 . - Referring to
Figures 4a to 4c , there are shown example plotsexample plots -
Figure 4a shows anexample plot 400a of T1 values obtained over a range of pulse rates, P, for a first region of interest. The first region of interest has a first T1 value at the second pulse rate value of a typical heart pulse rate, say 60 bpm. The T1 values and the corresponding pulse rate, P, at which they were obtained are paired to define a plurality of ordered pairs (P, T1). For example, if T1 values were obtained at five different pulse rates, five ordered pairs would be defined {(P1, T11), (P2, T12), (P3, T13), (P4, T14), (P5, T15)}. - The obtained ordered pairs (Pn, T1n) are fitted to a linear function as indicated by the
line 403a superimposed over the ordered pairs in the plot ofFigure 4a . The linear function is of the form:
- Thus, the dependent variable of the linear function is the T1 value, and the independent variable of the linear function is the pulse rate value, P.
- Here, m denotes the value of the derivative of first order (i.e. the slope) of the dependent variable T1, with respect to the independent variable P. Further, c denotes the value of the intercept (offset), c, of the monotonic function corresponding to the dependent variable, P, being equal to zero. The intercept (offset) is indicated by the
reference numeral 401a inFigure 4a . - The value of the slope, m, and the intercept (offset), c, are determined from the linear function and paired together to form an ordered pair (m1, c1).
-
Figure 4b shows anexample plot 400b of T1 values obtained over a range of pulse rates, P, for a second region of interest. The second region of interest has a second T1 value at the second pulse rate value of a typical heart pulse rate, say 60 bpm. - Again, the T1 values and the corresponding pulse rates at which they were obtained form ordered pairs which are fitted to a linear function as indicated by the
line 403b inFigure 4b . The value of the first-order derivative, m, and the intercept (offset)t c, are obtained from the linear function form an ordered pair (m2, c2). The intercept (offset) is indicated by thereference numeral 401b inFigure 4b . -
Figure 4c shows anexample plot 400c of T1 values obtained over a range of pulse rates, P, for a third region of interest. The third region of interest has a third T1 value at the second pulse rate value of a typical heart pulse rate, say 60 bpm. - Again, the T1 values and the corresponding pulse rates at which they were obtained form ordered pairs which are fitted to a linear function as indicated by the
line 403c inFigure 4c . The value of the first-order derivative, m, and the intercept (offset), c, are obtained from the linear function form an ordered pair (m3, c3). The intercept (offset) is indicated by the reference numeral 401c inFigure 4c . - The three regions of interest result in three ordered pairs {(m1, c1), (m2, c2), (m3, c3)}.
- Significantly, the values of the slope, m, and the offset, c, are dependent on the T1 value. This can be appreciated from
Figures 4a to 4c , because each of the plots for the three regions of interest has a different slope, m, and offset, c. This highlights that the slope, m, and the intercept (offset), c, are dependent on the T1 value. -
Figure 5 shows anexample plot 500 of the obtained three ordered pairs {(m1, c1), (m2, c2), (m3, c3)}. From this plot, it can be seen that there is a relationship between the slope, m, and the intercept (offset), c. This relationship may be represented by a polynomial function as indicated by thecurve 501. In this example, the polynomial function is a quadratic equation of the form:

- Here, A2, and A3 are the coefficients to be determined. The values of the coefficients are determined using the polynomial function. For example, the values of the coefficients may be obtained using a least squares fitting procedure.
- As a result of the calibration stage, values of the coefficients A1, A2, and A0. The coefficients define the relationship between the slope, m, and intercept (offset), c, values.
- Significantly, the calibration stage may be performed using phantoms or even numerical simulations. The obtained coefficients may then be used to correct T1 values for a number of different subjects. This is because the present invention exploits the realisation that this relationship between slope, m, and intercept (offset), c, holds for different T1 values. A benefit of this is that extensive magnetic resonance imaging of the subject is not required, which can not only be expensive but also stressful for the subject.
- The present invention further provides a correction stage for correcting a magnetic relaxation time constant, T1, value obtained for a subject via magnetic resonance imaging when a pulse rate was at a first pulse rate value to a T1 value reflecting the T1 value that would have been obtained if the pulse rate was at a second pulse rate value.
- In an example correction procedure, a subject is imaged to obtain T1 values which are generally arranged to form a 2D T1 map. The T1 map could be of a myocardial region of the subject. The obtained T1 values are then corrected using the coefficients determined in the calibration stage mentioned above.
- For the correction stage, the obtained (uncorrected) T1 value and the pulse rate of the subject when the T1 value was obtained are known. The pulse rate may be measured using an ECG or other similar approach for measuring the pulse rate.
- The correction stage also knows that there is a monotonic relationship between the T1 value and the pulse rate. In one example, the monotonic function is a linear function of the form:

- Here, T1 is the obtained T1 value, P is the known pulse rate of the subject when the T1 value was obtained. Here, m refers to the first-order derivative which is currently unknown, and c refers to the intercept (offset) which is currently unknown.
- The objective of the correction stage is to correct the T1 value to a corrected T1 value, T1' that reflects the T1 value that would have been obtained if the pulse rate was at the second pulse rate value of 60 bpm.
- This means that the correction stage involves solving the equation:

- Referring to
Figure 6 there is shown an overview of the correction stage. The correction stage comprises threemain steps - Step 601 comprises modifying the monotonic function by substituting the first-order derivative, m, in the monotonic function for an expression in terms of the intercept (offset), c, and the coefficients A1, A2, A0.
- In the example of the linear function for T1 (T1 = m × P + c) and the quadratic function for m (m = A2c2 + A1c + A0), the modified monotonic function is thus:

- Here, T1, P and the coefficients A1, A2, A0 are known.
- Step 602 comprises determining from this modified monotonic function, a value of the intercept (offset), c, at which the monotonic function is equal to the T value. As will be appreciated in the above example, the only unknown in the above equation is the intercept (offset), c. The value of the intercept (offset), c, may be determined using any appropriate numerical or analytical method as appreciated by the skilled person.
- For example, the modified monotonic function may be rearranged to form the equation:

- Or, in other words:

- The value of c can then be determined by finding the positive root of the above equation, e.g. by determining:

- It has been found that only the positive root leads to physiologically reasonable c values. Step 603 comprises using the determined intercept (offset), c, to determine the corrected T value, T'.
- For example, an expression of the corrected T value, T', in terms of T1 value, the first pulse rate value when the T1 value was obtained, the second pulse rate value, and the offset, c, can be obtained in the following way:



- Alternatively, an expression of the corrected T value, T', in terms of the T1 value, the coefficients A2, A1, A0, the second pulse rate value, and the intercept (offset), c, can be obtained in the following way:


- Both expressions of T1' are mathematically identical and thus equivalent ways of determining T1'.
- The above example method for correcting the T1 value may be performed for each pixel of the obtained T1 map such that a corrected T1 map may be obtained.
- It can be appreciated that different pixels of the T1 map may be associated with subject tissue having different T2 values. For example, some regions of the T1 map may relate to the myocardium while other regions of the T1 map may relate to blood. The myocardium usually has a short T2 value, and the blood usually has a longer T2 value.
- In view of this, a plurality of different sets of coefficients may be determined. Each of the sets of coefficients may be obtained using regions of interest having a different T2 value at a particular pulse rate.
- For example, two sets of coefficients may be determined. A first set of coefficients may be obtained using a region of interest which has a short T2 value, reflecting the T2 value of the myocardium. A second set of coefficients may be obtained using a region of interest which has a long T2 value, reflecting the T2 value of blood.
- The T1 value may be corrected, separately, using both sets of coefficient values. This may result in the generation of two corrected T1 values. One T1 value corrected for a short T2 value, while the other T1 value corrected for a long T1 value.
- In an alternative approach, the pixel of the T1 map may be analysed to estimate its T2 value. For example, the pixel of the T1 map may be processed to determine whether it has the visual properties of the myocardium or the blood. Based on this determination, an appropriate set of coefficient values may be selected for correcting the T1 value. This approach may result in the generation of only a single corrected T1 value.
- The above example refers to the correction of obtained T1 values. The present method also applies to the correction of obtained T2 values. That is, in the above examples, the skilled person will appreciate that the term T1 may be substituted for T2 and vice versa.
- The above examples refer to the monotonic function being a linear function of the form T1 = m × P + c. This is not required in all embodiments, and other monotonic mathematical functions are within the scope of the present invention. For example, the monotonic function may be any monotonic function of the form (L=positive integer):

- An example is:

- The above examples refer to the polynomial function being a quadratic function of the form m = A2c2 + A1c + 0. This is not required in all embodiments, and other polynomial functions are within the scope of the present invention. Any polynomial function of the following form is within the scope of the present invention (N=positive integer):

- The value of derivatives, m(n), of order n, may be determined corresponding to the independent variable, P, being equal to zero:

- In this sense, the mathematical function may be expressed in terms of a so-called 'Taylor Expansion' of itself, from the intercept point (P=0).
- As an illustrative example, consider the following set of equations:


- Here, let M=N for simplicity. Re-arranging the first equation gives:

- Substituting the full expressions for the derivatives (m) into this last equation gives:

- The values of P and T1 are known values obtained from measurements and the coefficients


- Given that, for an arbitrary P value, we have:

- For a selected 'reference' value denoted here as Pref (e.g. 60 bpm), we have:

- Here we have used the term T1 ref in association with Pref, but in earlier examples above, the quantity T' is synonymous with T1 ref . Thus,


- Combining these two equations and rearranging for T1 ref gives,

- Here the root c0, of the polynomial is the value used for the intercept/offset variable c. The term m(2)(c0) denotes the value of the second order differential as evaluated using the root c0. This allows the corrected value T1 ref (also referred to as T' in other examples above) to be obtained. It will be seen that if the second order differential (m(2)(c0)) is ignored/neglected, then the above equation reduces to the earlier expression derived above when the mathematical function is assumed to be purely linear.
- Referring to
Figure 7 , there is shown anexample MR apparatus 700 according the second aspect of the disclosure. TheMR apparatus 700 comprises acomputing system 701, agradient system 703, and anexcitation system 705. - The
gradient system 703 is configured to apply a magnetic field gradient. Thegradient system 703 may be configured to apply magnetic field gradients along three spatial axes. - The
excitation system 705 may comprise a transmitter (not shown) and a receiver (not shown). Theexcitation system 705 can be an RF system with one or more RF coils (not shown). Theexcitation system 705 is configured to apply an excitation pulse to the subject and to receive signals from the subject. - The
MR apparatus 700 includes a magnet (not shown) for establishing a stationary magnetic field. The magnet can include a permanent magnet, a superconducting magnet or other type of magnet. - The
computing system 701 is in communication with theexcitation system 705, and thegradient system 703 for controlling these components. Thecomputing system 701 is configured to receive the signals from theexcitation system 705. - The
computing system 701 is further configured to execute program code to control thegradient system 703 and theexcitation system 705 to generate a MR pulse sequence. The MR pulse sequence may be a pulse sequence for obtaining MR images for use in estimating T1 times in accordance with the present invention. - The
computing system 701 is configured to execute code to process the MR images so as to estimate the T1 time, and correct the T1 time to a standard pulse rate (e.g. 60 bpm) in accordance with the present invention. Thecomputing system 701 could be an integrated component of theMR apparatus 700. Thecomputing system 701 could be a unit of a desktop computer, a workstation, a server, or a laptop computer. - The method in accordance with the present invention may be performed by a stand-alone computer or network of computers that are not directly associated with an MR apparatus. The computer or network of computers may have a central processing unit (CPU) of a graphics processing unit (GPU) for performing the method according to the present invention. The CPU or GPU may be a parallel processor. Some or all of the aspects of the present invention may be parallelised using the parallel processor.
- In summary, there I provided a method of determining coefficients for use in correcting a magnetic relaxation time constant, T, value obtained via magnetic resonance imaging when a pulse rate was at a first pulse rate value to a T value reflecting the T value that would have been obtained if the pulse rate was at a second pulse rate value. The method comprising, for each region of interest, pairing an obtained derivative, m, and an obtained intercept (offset), c, as an ordered pair (c, m) 201. The method comprising fitting the obtained plurality of ordered pairs (c,m) to a
polynomial function 202. The method comprising determining the values of the coefficients from thepolynomial function 203. - At least some of the example embodiments described herein may be constructed, partially or wholly, using dedicated special-purpose hardware. Terms such as 'component', 'module' or 'unit' used herein may include, but are not limited to, a hardware device, such as circuitry in the form of discrete or integrated components, a Field Programmable Gate Array (FPGA) or Application Specific Integrated Circuit (ASIC), which performs certain tasks or provides the associated functionality. In some embodiments, the described elements may be configured to reside on a tangible, persistent, addressable storage medium and may be configured to execute on one or more processors. These functional elements may in some embodiments include, by way of example, components, such as software components, object-oriented software components, class components and task components, processes, functions, attributes, procedures, subroutines, segments of program code, drivers, firmware, microcode, circuitry, data, databases, data structures, tables, arrays, and variables. Although the example embodiments have been described with reference to the components, modules and units discussed herein, such functional elements may be combined into fewer elements or separated into additional elements.
- The described and illustrated embodiments are to be considered as illustrative and not restrictive in character, it being understood that only the preferred embodiments have been shown and described and that all changes and modifications that come within the scope of the inventions as defined in the claims are desired to be protected. It should be understood that while the use of words such as "preferable", "preferably", "preferred" or "more preferred" in the description suggest that a feature so described may be desirable, it may nevertheless not be necessary and embodiments lacking such a feature may be contemplated as within the scope of the invention as defined in the appended claims. In relation to the claims, it is intended that when words such as "a," "an," "at least one," or "at least one portion" are used to preface a feature there is no intention to limit the claim to only one such feature unless specifically stated to the contrary in the claim. When the language "at least a portion" and/or "a portion" is used the item can include a portion and/or the entire item unless specifically stated to the contrary.
- Attention is directed to all papers and documents which are filed concurrently with or previous to this specification in connection with this application and which are open to public inspection with this specification, and the contents of all such papers and documents are incorporated herein by reference.
- All of the features disclosed in this specification (including any accompanying claims, abstract and drawings), and/or all of the steps of any method or process so disclosed, may be combined in any combination, except combinations where at least some of such features and/or steps are mutually exclusive.
- Each feature disclosed in this specification (including any accompanying claims, abstract and drawings) may be replaced by alternative features serving the same, equivalent or similar purpose, unless expressly stated otherwise. Thus, unless expressly stated otherwise, each feature disclosed is one example only of a generic series of equivalent or similar features.
- The invention is not restricted to the details of the foregoing embodiment(s). The invention extends to any novel one, or any novel combination, of the features disclosed in this specification (including any accompanying claims, abstract and drawings), or to any novel one, or any novel combination, of the steps of any method or process so disclosed.
Claims (16)
- A method of determining coefficients for use in correcting a magnetic relaxation time constant, T, value obtained via magnetic resonance imaging and corresponding to a first pulse rate value of an imaged pulsating subject, in which the corrected T value corresponds to a second pulse rate value differing from the first pulse rate value, the method comprising:(a) for each of a plurality of different regions of interest of the imaged pulsating subject:(vi) obtaining a plurality of T values for the region of interest, each T value being associated with a different respective pulse rate value, P, to define a plurality of respective first ordered pairs (P, T);(vii)fitting a mathematical function, F(P), to the plurality of first ordered pairs (P, T) which is monotonic thereacross, wherein the independent variable of the mathematical function is the pulse rate value, P;(viii) determining a value of one or more derivatives of order n,
 (ix) determining an intercept value, c, of the mathematical function corresponding to the independent variable, P, being equal to zero;(x) pairing the value of a said derivative of order n and the value of the intercept, c, as a second ordered pair (c, m(n));(b) fitting to a polynomial mathematical function of the form:
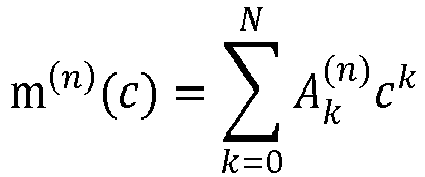 (c) determining, from the polynomial mathematical function, the values of the coefficients
- A method as claimed in any preceding claim wherein the mathematical function is a linear function of the form:

- A method as claimed in any preceding claim wherein the mathematical function is a quadratic function of the form:

- A method as claimed in any preceding claim wherein the mathematical function is a polynomial function of the form:

- A method as claimed in any preceding claim wherein said value of one or more derivatives of order n, is determined corresponding to the independent variable, P, being equal to zero:

- A method as claimed in any preceding claim, further comprising using the determined coefficients to correct a magnetic relaxation time constant, T, value corresponding to a first pulse rate value of an imaged pulsating subject, in which the corrected T value, T', corresponding to a second pulse rate value of the imaged pulsating subject differing from the first pulse rate value, the method comprising:using the obtained T value, T, the first pulse rate value, P, and said polynomial function, m(n)(c), to modify the coefficients,
 determining a root of the modified polynomial function;using the determined root as the determined intercept value, c, in said mathematical function, F(P), to determine the corrected T value, T', corresponding to a second pulse rate value.
 - A method as claimed in claim 6, wherein the mathematical function is a linear function of the form:

- A method as claimed in any preceding claim , wherein the mathematical function is a linear function and the method includes using the determined intercept, c, to determine the corrected T value, T', comprises determining T' such that:
 wherein T' refers to the corrected T value,wherein T refers to the obtained T value,wherein P refers to the first pulse rate value,wherein sP refers to the second pulse rate value, andwherein c refers to the value of the intercept.
 - A method as claimed in any preceding claim, wherein the polynomial function is a quadratic function of the form:

- A method as claimed in any preceding claim, further comprising determining a plurality of sets of coefficients, wherein each of the plurality of sets of coefficients is determined using a different group of regions of interest.
- A method as claimed in any preceding claim, wherein the magnetic relaxation time constant, T, is a longitudinal magnetic relaxation time constant, T1, and, wherein each of the plurality of different regions of interest have substantially the same transverse magnetic relaxation time constant, T2, value at a given pulse rate.
- A method as claimed in claim 11, wherein the method further comprises determining whether to correct the obtained T1 value using the determined coefficients according to whether an obtained T2 value of the subject is within a predetermined range of the T2 value of the regions of interest used in determining the coefficients.
- A method as claimed in any of claims 1 to 10, wherein the magnetic relaxation time constant, T, is a transverse magnetic relaxation time constant, T2, and wherein each of the plurality of different regions of interest have substantially the same longitudinal magnetic relaxation time constant, T1, value at a given pulse rate.
- A method as claimed in claim 13, wherein the method further comprises determining whether to correct the obtained T2 value using the determined coefficients according to whether an obtained T1 value of the subject is within a predetermined range of the T2 value of the regions of interest used in determined the coefficients.
- A method as claimed in any preceding claim, further comprising using the determined coefficients to correct a plurality of T values, wherein each of the plurality of T values represents a different pixel in a T map.
- A computer readable medium having instructions recorded thereon which, when executed by a computer, cause the computer to perform the method as claimed in any preceding claim.
Priority Applications (2)
| Application Number | Priority Date | Filing Date | Title |
|---|---|---|---|
| EP18203495.9A EP3647805A1 (en) | 2018-10-30 | 2018-10-30 | Heart rate correction for relaxation time values of nuclear spins |
| US16/668,089 US10775465B2 (en) | 2018-10-30 | 2019-10-30 | Method for use in correcting a magnetic relaxation time constant value |
Applications Claiming Priority (1)
| Application Number | Priority Date | Filing Date | Title |
|---|---|---|---|
| EP18203495.9A EP3647805A1 (en) | 2018-10-30 | 2018-10-30 | Heart rate correction for relaxation time values of nuclear spins |
Publications (1)
| Publication Number | Publication Date |
|---|---|
| EP3647805A1 true EP3647805A1 (en) | 2020-05-06 |
Family
ID=64316273
Family Applications (1)
| Application Number | Title | Priority Date | Filing Date |
|---|---|---|---|
| EP18203495.9A Withdrawn EP3647805A1 (en) | 2018-10-30 | 2018-10-30 | Heart rate correction for relaxation time values of nuclear spins |
Country Status (2)
| Country | Link |
|---|---|
| US (1) | US10775465B2 (en) |
| EP (1) | EP3647805A1 (en) |
Families Citing this family (2)
| Publication number | Priority date | Publication date | Assignee | Title |
|---|---|---|---|---|
| GB2574232B (en) * | 2018-05-31 | 2020-10-21 | Siemens Healthcare Ltd | A method of processing MR images to estimate a longitudinal relaxation time constant. |
| JP2024530732A (en) * | 2021-08-27 | 2024-08-23 | スピンテック インコーポレイテッド | System and method for constrained reconstruction of images using white noise - Patents.com |
Family Cites Families (1)
| Publication number | Priority date | Publication date | Assignee | Title |
|---|---|---|---|---|
| US8106655B2 (en) * | 2009-05-29 | 2012-01-31 | The Invention Science Fund I, Llc | Multiplex imaging systems, devices, methods, and compositions including ferromagnetic structures |
-
2018
- 2018-10-30 EP EP18203495.9A patent/EP3647805A1/en not_active Withdrawn
-
2019
- 2019-10-30 US US16/668,089 patent/US10775465B2/en not_active Expired - Fee Related
Non-Patent Citations (6)
| Title |
|---|
| D. R. MESSROGHLI ET AL: "Human Myocardium: Single-Breath-hold MR T1 Mapping with High Spatial Resolution--Reproducibility Study", RADIOLOGY, vol. 238, no. 3, 1 March 2006 (2006-03-01), pages 1004 - 1012, XP055070143, ISSN: 0033-8419, DOI: 10.1148/radiol.2382041903 * |
| JAMES W. GOLDFARB: "A Method to Remove Heart Rate Dependence with Modified Look Locker Inversion Recovery (MOLLI) T1 Quantification", PROCEEDINGS OF THE INTERNATIONAL SOCIETY FOR MAGNETIC RESONANCE IN MEDICINE, ISMRM, 20TH ANNUAL MEETING AND EXHIBITION, MELBOURNE, AUSTRALIA, 5-11 MAY 2012, 21 April 2012 (2012-04-21), XP040623660 * |
| JASON J LEE ET AL: "Myocardial T1 and extracellular volume fraction mapping at 3 tesla", JOURNAL OF CARDIOVASCULAR MAGNETIC RESONANCE, BIOMED CENTRAL LTD, LONDON UK, vol. 13, no. 1, 28 November 2011 (2011-11-28), pages 75, XP021130939, ISSN: 1532-429X, DOI: 10.1186/1532-429X-13-75 * |
| LI HUANG ET AL: "Fast myocardial T 1 mapping using shortened inversion recovery based schemes : Fast Myocardial T 1 Mapping", JOURNAL OF MAGNETIC RESONANCE IMAGING, 22 January 2019 (2019-01-22), US, XP055583066, ISSN: 1053-1807, DOI: 10.1002/jmri.26649 * |
| NEVILLE D. GAI ET AL.: "Correction for heart rate bias of post-contrast myocardial T1 values derived using MOLLI sequence", PROCEEDINGS OF THE INTERNATIONAL SOCIETY FOR MAGNETIC RESONANCE IN MEDICINE, ISMRM, JOINT ANNUAL MEETING ISMRM-ESMRMB, MILAN, ITALY, 10-16 MAY 2014, no. 2421, 28 April 2014 (2014-04-28), XP040663490 * |
| SHIRO NAKAMORI ET AL: "Online Appendix of "Native T1 Mapping and Extracellular Volume Mapping for the Assessment of Diffuse Myocardial Fibrosis in Dilated Cardiomyopathy"", JACC: CARDIOVASCULAR IMAGING, 14 June 2017 (2017-06-14), XP055583175, Retrieved from the Internet <URL:http://imaging.onlinejacc.org/content/jimg/11/1/48/DC1/embed/media-1.docx?download=true> [retrieved on 20190424] * |
Also Published As
| Publication number | Publication date |
|---|---|
| US20200132796A1 (en) | 2020-04-30 |
| US10775465B2 (en) | 2020-09-15 |
Similar Documents
| Publication | Publication Date | Title |
|---|---|---|
| US8957681B2 (en) | System and method for magnetic resonance imaging water-fat separation with full dynamic range using in-phase images | |
| US10520570B2 (en) | System and method for tissue characterization using multislice magnetic resonance imaging | |
| US10531812B2 (en) | System and method for improved cardiac imaging of subjects with adverse cardiac conditions | |
| US10459058B2 (en) | System and method for magnetic resonance imaging with prospective motion control | |
| US10045741B2 (en) | System and method for real-time frequency correction for magnetic resonance imaging | |
| US10845446B2 (en) | System and method for determining patient parameters using radio frequency phase increments in magnetic resonance imaging | |
| US10393838B2 (en) | Method for correcting phase offsets in quantitative chemical shift encoded magnetic resonance imaging | |
| US10451700B2 (en) | System and method for reducing partial voluming artifacts in quantitative myocardial tissue characterization | |
| US10948559B2 (en) | Method of processing MR images to estimate a longitudinal relaxation time constant | |
| WO2014151596A2 (en) | System and method for inhomogeneous magnetization transfer magnetic resonance imaging | |
| US8995738B2 (en) | System and method for magnetic resonance imaging parametric mapping using confidence maps | |
| US20120134565A1 (en) | Method and magnetic resonance system to determine system-dependent phase information | |
| US10775465B2 (en) | Method for use in correcting a magnetic relaxation time constant value | |
| EP3542175B1 (en) | Method for proton density mapping and receiver coil sensitivity bias correction using magnetic resonance fingerprinting (mrf) | |
| US20240369663A1 (en) | Motion correction for spatiotemporal time-resolved magnetic resonance imaging | |
| US10401459B2 (en) | Systems and methods for imaging vascular calcifications with magnetic resonance imaging | |
| JP7237612B2 (en) | Magnetic resonance imaging device and image processing device | |
| US11467238B2 (en) | Method for uniform reconstruction of multi-channel surface-coil magnetic resonance data without use of a reference scan | |
| US20180028273A1 (en) | Magnetic resonance imaging apparatus and quantitative-value computing program | |
| US10186032B2 (en) | Simultaneous multi-slice phase pulse wave velocity measurement in a vessel | |
| US10314548B2 (en) | Method for T1 mapping with incomplete tissue magnetization recovery | |
| US20250244430A1 (en) | Systems and methods for rf pulse design for mri pulse sequences | |
| Endo et al. | Using Dictionary Matching to Improve the Accuracy of MOLLI Myocardial T1 Analysis and Measurements of Heart Rate Variability |
Legal Events
| Date | Code | Title | Description |
|---|---|---|---|
| PUAI | Public reference made under article 153(3) epc to a published international application that has entered the european phase |
Free format text: ORIGINAL CODE: 0009012 |
|
| STAA | Information on the status of an ep patent application or granted ep patent |
Free format text: STATUS: THE APPLICATION HAS BEEN PUBLISHED |
|
| AK | Designated contracting states |
Kind code of ref document: A1 Designated state(s): AL AT BE BG CH CY CZ DE DK EE ES FI FR GB GR HR HU IE IS IT LI LT LU LV MC MK MT NL NO PL PT RO RS SE SI SK SM TR |
|
| AX | Request for extension of the european patent |
Extension state: BA ME |
|
| STAA | Information on the status of an ep patent application or granted ep patent |
Free format text: STATUS: REQUEST FOR EXAMINATION WAS MADE |
|
| 17P | Request for examination filed |
Effective date: 20200903 |
|
| RBV | Designated contracting states (corrected) |
Designated state(s): AL AT BE BG CH CY CZ DE DK EE ES FI FR GB GR HR HU IE IS IT LI LT LU LV MC MK MT NL NO PL PT RO RS SE SI SK SM TR |
|
| GRAP | Despatch of communication of intention to grant a patent |
Free format text: ORIGINAL CODE: EPIDOSNIGR1 |
|
| STAA | Information on the status of an ep patent application or granted ep patent |
Free format text: STATUS: GRANT OF PATENT IS INTENDED |
|
| INTG | Intention to grant announced |
Effective date: 20221216 |
|
| RAP3 | Party data changed (applicant data changed or rights of an application transferred) |
Owner name: KING'S COLLEGE LONDON Owner name: SIEMENS HEALTHCARE GMBH |
|
| STAA | Information on the status of an ep patent application or granted ep patent |
Free format text: STATUS: THE APPLICATION IS DEEMED TO BE WITHDRAWN |
|
| 18D | Application deemed to be withdrawn |
Effective date: 20230427 |