EP3629197A1 - System and method for binned inter-quartile range analysis in anomaly detection of a data series - Google Patents
System and method for binned inter-quartile range analysis in anomaly detection of a data series Download PDFInfo
- Publication number
- EP3629197A1 EP3629197A1 EP19199413.6A EP19199413A EP3629197A1 EP 3629197 A1 EP3629197 A1 EP 3629197A1 EP 19199413 A EP19199413 A EP 19199413A EP 3629197 A1 EP3629197 A1 EP 3629197A1
- Authority
- EP
- European Patent Office
- Prior art keywords
- data
- quartile
- testing data
- inter
- testing
- Prior art date
- Legal status (The legal status is an assumption and is not a legal conclusion. Google has not performed a legal analysis and makes no representation as to the accuracy of the status listed.)
- Ceased
Links
- 238000001514 detection method Methods 0.000 title claims abstract description 32
- 238000000034 method Methods 0.000 title claims description 57
- 238000004458 analytical method Methods 0.000 title claims description 42
- 238000012360 testing method Methods 0.000 claims abstract description 156
- 230000001419 dependent effect Effects 0.000 claims abstract description 16
- 238000007418 data mining Methods 0.000 claims abstract description 14
- 238000013450 outlier detection Methods 0.000 claims abstract description 12
- 230000002708 enhancing effect Effects 0.000 claims abstract description 7
- 230000009471 action Effects 0.000 claims description 38
- 238000003860 storage Methods 0.000 claims description 12
- 230000004044 response Effects 0.000 claims description 10
- 230000008569 process Effects 0.000 claims description 9
- 230000000246 remedial effect Effects 0.000 claims description 9
- 238000009826 distribution Methods 0.000 claims description 6
- 238000004519 manufacturing process Methods 0.000 description 8
- 238000012545 processing Methods 0.000 description 8
- 238000004891 communication Methods 0.000 description 6
- 238000010586 diagram Methods 0.000 description 5
- 230000006399 behavior Effects 0.000 description 4
- 238000001228 spectrum Methods 0.000 description 4
- 230000000694 effects Effects 0.000 description 3
- 230000006870 function Effects 0.000 description 3
- 239000000470 constituent Substances 0.000 description 2
- 238000000926 separation method Methods 0.000 description 2
- 239000007787 solid Substances 0.000 description 2
- 238000004378 air conditioning Methods 0.000 description 1
- 230000002547 anomalous effect Effects 0.000 description 1
- 238000003491 array Methods 0.000 description 1
- 238000012217 deletion Methods 0.000 description 1
- 230000037430 deletion Effects 0.000 description 1
- 238000010438 heat treatment Methods 0.000 description 1
- 238000005259 measurement Methods 0.000 description 1
- 230000003287 optical effect Effects 0.000 description 1
- 230000000737 periodic effect Effects 0.000 description 1
- 238000009423 ventilation Methods 0.000 description 1
Images


Classifications
-
- G—PHYSICS
- G06—COMPUTING; CALCULATING OR COUNTING
- G06F—ELECTRIC DIGITAL DATA PROCESSING
- G06F16/00—Information retrieval; Database structures therefor; File system structures therefor
- G06F16/30—Information retrieval; Database structures therefor; File system structures therefor of unstructured textual data
- G06F16/35—Clustering; Classification
- G06F16/353—Clustering; Classification into predefined classes
-
- G—PHYSICS
- G06—COMPUTING; CALCULATING OR COUNTING
- G06F—ELECTRIC DIGITAL DATA PROCESSING
- G06F11/00—Error detection; Error correction; Monitoring
- G06F11/07—Responding to the occurrence of a fault, e.g. fault tolerance
- G06F11/0703—Error or fault processing not based on redundancy, i.e. by taking additional measures to deal with the error or fault not making use of redundancy in operation, in hardware, or in data representation
- G06F11/0751—Error or fault detection not based on redundancy
-
- G—PHYSICS
- G06—COMPUTING; CALCULATING OR COUNTING
- G06F—ELECTRIC DIGITAL DATA PROCESSING
- G06F11/00—Error detection; Error correction; Monitoring
- G06F11/07—Responding to the occurrence of a fault, e.g. fault tolerance
- G06F11/0703—Error or fault processing not based on redundancy, i.e. by taking additional measures to deal with the error or fault not making use of redundancy in operation, in hardware, or in data representation
- G06F11/079—Root cause analysis, i.e. error or fault diagnosis
-
- G—PHYSICS
- G06—COMPUTING; CALCULATING OR COUNTING
- G06F—ELECTRIC DIGITAL DATA PROCESSING
- G06F11/00—Error detection; Error correction; Monitoring
- G06F11/07—Responding to the occurrence of a fault, e.g. fault tolerance
- G06F11/0703—Error or fault processing not based on redundancy, i.e. by taking additional measures to deal with the error or fault not making use of redundancy in operation, in hardware, or in data representation
- G06F11/0793—Remedial or corrective actions
-
- G—PHYSICS
- G06—COMPUTING; CALCULATING OR COUNTING
- G06F—ELECTRIC DIGITAL DATA PROCESSING
- G06F16/00—Information retrieval; Database structures therefor; File system structures therefor
- G06F16/20—Information retrieval; Database structures therefor; File system structures therefor of structured data, e.g. relational data
- G06F16/24—Querying
- G06F16/245—Query processing
- G06F16/2458—Special types of queries, e.g. statistical queries, fuzzy queries or distributed queries
- G06F16/2465—Query processing support for facilitating data mining operations in structured databases
-
- G—PHYSICS
- G06—COMPUTING; CALCULATING OR COUNTING
- G06F—ELECTRIC DIGITAL DATA PROCESSING
- G06F18/00—Pattern recognition
- G06F18/20—Analysing
- G06F18/24—Classification techniques
- G06F18/243—Classification techniques relating to the number of classes
- G06F18/2433—Single-class perspective, e.g. one-against-all classification; Novelty detection; Outlier detection
-
- G—PHYSICS
- G06—COMPUTING; CALCULATING OR COUNTING
- G06N—COMPUTING ARRANGEMENTS BASED ON SPECIFIC COMPUTATIONAL MODELS
- G06N20/00—Machine learning
Definitions
- This disclosure is generally related to detecting anomalies. More specifically, this disclosure is related to a system and method for binned inter-quartile range analysis in anomaly detection of a data series.
- Anomaly detection is a data mining method which identifies items or events that do not conform to an expected pattern or others in a data set.
- Anomaly detection is relevant in various fields, e.g., manufacturing, medical areas, and energy-related fields. For example, in manufacturing, energy usage can incur a significant cost, such as in running a factory with machines or a data center with many machines. To this end, identifying anomalies may provide a more efficient manufacturing system, which can in turn reduce costs and improve the overall efficiency of the system as well as its constituent components or parts.
- the type of anomaly detection method used can differ based on the type of classification needed.
- One method is the Inter-quartile Range (IQR) method.
- the IQR is a measure of variability based on dividing a data set into four parts, separated by three "quartiles.”
- the IQR is the first quartile subtracted from the third quartile, and is also called the “midspread” or the “middle 50%.”
- An IQR analysis or method can be used to identify anomalies or outliers, and is typically used for given data of only one class, i.e., one-dimensional data.
- an IQR analysis may not perform well by itself.
- a standard IQR analysis may provide a robust measure of scale and identify outliers in a one-dimensional data set
- a standard IQR analysis in a two-dimensional data set may not provide an accurate measure of scale.
- a standard IQR analysis may potentially miss identifying outliers or may incorrectly identify normal data points as outliers. This can result in an inefficient system for data mining and anomaly detection.
- One embodiment provides a system for facilitating anomaly detection.
- the system determines, by a computing device, a set of testing data which includes a plurality of data points, wherein the set includes a data series for a first variable and one or more second variables, and wherein the one or more second variables are dependent on the first variable.
- the system divides the set of testing data into a number of groups based on a type of the data series.
- the system determines an inter-quartile range for a respective group.
- the system classifies a first testing data point in the respective group as an anomaly based on the inter-quartile range for the respective group, thereby enhancing data mining and outlier detection for the data series for multiple variables.
- the system performs, by a user of the computing device, an action to address the classified anomaly.
- the action includes one or more of: a remedial or corrective action to ensure that the classified anomaly no longer occurs; adjusting a physical parameter which affects the first variable or the one or more second variables; and adjusting a physical component of a device from which the data series is obtained.
- the system receives, by the computing device, a request to detect anomalies for a new set of testing data, wherein the new set includes a new data series for the first variable and the one or more second variables, wherein the new set of testing data is obtained by the computing device subsequent to the user performing the action to address the classified anomaly.
- the system divides the new set of testing data into a same number of new groups as the number of groups of the set of testing data.
- the system determines an inter-quartile range for a respective new group which corresponds to the respective group in which the first testing data point was classified as an anomaly.
- the system determines whether the first testing data point in the respective group still occurs in the respective new group, which indicates whether the action performed by the user to address the classified anomaly is successful or not.
- dividing the set of testing data into the number of groups is based on one or more of: an automatic process which is based on an algorithm; a resolution of a sensor or a machine involved in obtaining the set of testing data; previous or historical data relating to the set of testing data, wherein the previous or historical data is obtained by the computing device; prior or historical knowledge of a user of the computing device, wherein the prior or historical knowledge is related to the set of testing data and is obtained by the user of the computing device; and decomposing a data distribution of the set of testing data based on a component which is representative of key variables for a higher-dimensional data set, wherein the component includes one or more of a principal component, a derived combination of components, and a linear combination of components, wherein determining the inter-quartile range for the respective group further comprises performing an inter-quartile analysis based on the component.
- dividing the set of testing data and determining the inter-quartile range for the respective group further comprise: automatically classifying a normal distribution in the set of testing data based on multiple dependent variables across the divided groups in the set of testing data, including a presence of testing data points which are classified as an anomaly.
- the data series comprises time-series data for the first variable and the one or more second variables
- the time-series data for the first variable is an objective of the anomaly detection
- the time-series data for the one or more second variables affects the time-series data for the first variable
- determining the inter-quartile range for the respective group further comprises: dividing a second set of testing data in the respective group into four parts based on a median of the second set of testing data, wherein three values which separate the four parts are a first quartile, a second quartile, and a third quartile, and wherein the inter-quartile range is a difference between the first quartile and the third quartile.
- Determining the inter-quartile range for the respective group further comprises: identifying a lower bound for the second set of testing data by subtracting from the first quartile a first amount equal to the inter-quartile range scaled by a predetermined value; and identifying an upper bound for the second set of testing data by adding to the third quartile a second amount equal to the inter-quartile range scaled by the predetermined value.
- classifying the first testing data point in the respective group as an anomaly is further based on determining that the first testing data point does not fall between the lower bound and the upper bound.
- the system in response to determining that a number of data points in the second set of testing data is an even number 2n, the system: sets the first quartile as a median of n smallest data points in the second set; and sets the third quartile as a median of n largest data points in the second set.
- the system sets the first quartile as a median of m smallest data points in the second set; sets the third quartile as a median of m largest data points in the second set; and sets the second quartile as an ordinary median of data points in the second set.
- the embodiments described herein solve the problem of efficiently and accurately identifying anomalies in a data series for at least two interdependent variables based on dividing the data into "bins" and performing an IQR analysis on each bin.
- identifying anomalies may provide a more efficient system in many areas (e.g., manufacturing, medical fields, and energy-related fields), and can in turn reduce costs and improve the overall efficiency of the system as well as its constituent components or parts.
- the type of anomaly detection method used can differ based on the type of classification needed.
- One method is the Inter-quartile Range (IQR) method.
- the IQR is a measure of variability based on dividing a data set into four parts, separated by three “quartiles.”
- the IQR is the first quartile subtracted from the third quartile, and is also called the “midspread” or the “middle 50%.”
- An IQR analysis or method can be used to identify anomalies or outliers, and is typically used for given data of only one class, i.e., one-dimensional data.
- an IQR analysis may not perform well by itself.
- a standard IQR analysis may provide a robust measure of scale and identify outliers in a one-dimensional data set
- a standard IQR analysis in a two-dimensional data set may not provide an accurate measure of scale.
- a standard IQR analysis may potentially miss identifying outliers or may incorrectly identify normal data points as outliers. This can result in an inefficient system for data mining and anomaly detection.
- the embodiments described herein address this challenge by providing a system which first divides multiple sets of data series (where each set represents data for an interdependent variable) into a number of distinct groups or "bins,” and subsequently performs the IQR analysis on the data in each bin to detect anomalies in the data series, as described below in relation to FIG. 3 . That is, the system performs the IQR analysis over a range for at least one other dimension or dependent variable of the data.
- the embodiments described herein provide a computer system which improves the efficiency of detecting anomalies in a data series over at least two dimensions or variables using a "binned" IQR analysis.
- the data series e.g., can include time-series data or can cover a frequency spectra.
- the system enhances and improves data mining and outlier detection in a data series for multiple interdependent variables or dimensions, where the improvements are fundamentally technological.
- the improvements can result in a more efficient manufacturing system or other physical system by more effectively identifying anomalies.
- a system administrator or other user can take a remedial, corrective, or other action based on the identified anomalies to improve the overall efficiency of the manufacturing or other physical system. For example, subsequently obtained time-series data may indicate to the user that the previously detected anomaly or anomalies no longer occur.
- the embodiments described herein provide a technological solution (e.g., dividing a set of time-series data over multiple interdependent variables or dimensions into bins and then performing an IQR analysis on each bin to classify anomalies) to a technological problem (improving the efficiency of a manufacturing or other physical system by allowing a user to take an action based on the detected anomalies to, e.g., remove or address the anomalies).
- a technological solution e.g., dividing a set of time-series data over multiple interdependent variables or dimensions into bins and then performing an IQR analysis on each bin to classify anomalies
- a technological problem improving the efficiency of a manufacturing or other physical system by allowing a user to take an action based on the detected anomalies to, e.g., remove or address the anomalies.
- bins and “groups” are used interchangeably in this disclosure, and refer to a plurality of data sets, which are created by dividing a (larger or parent) set of testing data.
- a set of testing data (or a divided/binned set of testing data) can include a plurality of data points.
- a set of testing data can be divided into a number of bins or groups based on a "type" of the set of testing data.
- the type of the set of testing data can depend, e.g., a physical parameter being measured, a physical device or sensor from which a measurement is obtained, a physical component of such a device or sensor, or a category determined by the user or the system.
- IQR method and “IQR analysis” are used interchangeably in this disclosure, and refer to a process which: detects the inter-quartile range; determines a median, a lower bound, and an upper bound; and classifies outliers or detect anomalies based on the inter-quartile range, including the lower bound and the upper bound.
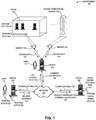
- FIG. 1 illustrates an exemplary environment 100 for facilitating anomaly detection, in accordance with an embodiment of the present invention.
- Environment 100 can include: a device 102 and an associated user 112; a device 104 and an associated user 114; and a device 106.
- Devices 102, 104, and 106 can communicate with each other via a network 120.
- Environment 100 can also include a physical object with sensors which can record data over a period of time and at periodic intervals.
- environment 100 can include: a room 130 which can include devices 132.1-132.m and sensors 134.1-134.n; and an outside temperature sensor 136. Sensors 134.1-134.
- n can monitor a physical feature of the room, such as an amount of heating, ventilation, and air conditioning (HVAC) energy consumed in room 130 or the amount of HVAC energy consumed or used by a specific device in room 130.
- HVAC heating, ventilation, and air conditioning
- Outside temperature sensor 136 can monitor the temperature of the air outside the room, whether inside a same building or outside of a building in which room 130 resides.
- the sensors can send their respective measured testing data to device 104.
- device 104 can obtain testing data 142 from sensor 134.1, and can also obtain testing data 144 from sensor 136.
- Testing data 142 and 144 can include time-series data and can also cover a frequency spectra.
- user 112 can send a command to request anomalies 152 for certain testing data related to sensors 134.1-134.n of room 130 and outside temperature sensor 136, which can result in sending a get testing data 154 command to device 104.
- Device 104 can obtain testing data 142 and 144, and can combine testing data 142 and 144. Device 104 can send combined testing data 146 to device 106 via network 120. Upon receiving request anomalies 152 command along with combined testing data 146, device 106 can divide combined testing data 146 into a number of bins (function 154). Device 106 can subsequently perform an IQR analysis on the data in each bin (function 156). During the IQR analysis, device 106 can identify testing data points from combined testing data 146 (and specifically, from the testing data points in each divided bin or group of testing data) which are not within a range defined by a lower bound and an upper bound for a respective bin, where the lower bound and the upper bound are determined based on the IQR analysis. Device 106 can send classification(s) 158 of the data points in the testing data back to device 102, via network 120.
- device 102 can perform an action 160, which can include executing a predetermined rule based on the classification(s).
- the predetermined rule can include automatically adjusting a physical component or unit related to the sensors or devices involved in obtaining the testing data.
- User 112 can also perform an action 162, which can include reviewing the classified anomaly in light of other historical data.
- User 112 can also perform an action which results in remediating or discovering a reason for the classified anomaly, and can take measures to prevent such anomalies from occurring again.
- classification(s) 158 allows both device 102 and user 112 to use the results of the enhanced data mining and outlier detection based on the IQR analysis performed on the discrete bins or groups. For example, based on the response (i.e., classification(s) 158) to request anomalies 152 command, user 112 can perform or take an action which can affect and improve the operation and performance of a manufacturing system or other physical system associated with room 130 and devices 132.1-132. m in room 130. The action can be a remedial or a corrective action to ensure that the classified anomaly no longer occurs. User 112 can also monitor, observe, and classify subsequent testing data to determine whether the actions of user 112 have the intended effect, including the removal or deletion of any previously detected anomalies.
- user 112 can send a new request anomalies command which, along with new combined testing data obtained from the sensors, can be received by device 106.
- Device 106 can divide the data into bins and perform an IQR analysis on the newly binned data.
- Device 106 can send new classifications back to device 102 and user 112, which allows device 102 and user 112 to determine whether the previously performed actions (i.e., actions 160 and 162, respectively) has the intended effect (i.e., whether the previously detected anomalies no longer occur).
- the embodiments described herein provide a system which improves and enhances anomaly detection in time-series data over at least two variables or dimensions, and further improves the efficiency of the overall system for data mining and outlier detection.
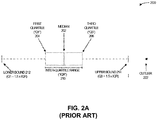
- FIG. 2A illustrates an exemplary diagram 200 for determining the inter-quartile range, in accordance with the prior art.
- Diagram 200 can include data represented in a horizontal fashion, as indicated by the dashed blue line.
- the system can divide the represented data set into "quartiles," where a quartile divides a rank-ordered data set into four equal parts.
- a quartile is a value which separates the parts.
- the first, second, and third quartiles can be referred to as "Q1," "Q2,” and "Q3,” respectively.
- the system can determine a median 202, and can further determine a first quartile ("Q1") 204 and a third quartile ("Q3”) 206.
- An inter-quartile range (“IQR”) 210 can be defined as a difference between Q3 and Q1.
- the IQR (which is sometimes called the “midspread” or the “middle 50%”) is equal to the difference between the 75 th and 25 th percentiles, or between upper quartile Q3 and lower quartile Q1.
- the system can determine a lower bound 212, by subtracting from the first quartile Q1 a first amount equal to the inter-quartile range scaled by a predetermined value, such as 1.5 (i.e., Q1 - 1.5 x IQR).
- the system can also determine an upper bound 214, by adding to the third quartile a second amount equal to the inter-quartile range scaled by the predetermined value (i.e., Q3 + 1.5 x IQR).
- Any data which falls outside of the range defined by lower bound 212 and upper bound 214 may be considered to be an anomaly or an outlier. That is, any data point which does not fall between lower bound 212 and upper bound 214 may be classified as an anomaly or an outlier.
- an outlier 222 is a data point which is greater than upper bound 214 (i.e., which does not fall between lower bound 212 and upper bound 214). Thus, data point 222 is classified as an outlier.
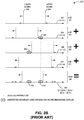
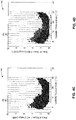
- FIG. 2B illustrates an exemplary diagram 230 for a result of unsuccessfully detecting anomalies based on inter-quartile range analysis, in accordance with the prior art. As shown in the index, a detected anomaly 292 is indicated with a small black circle, while undetected anomalies using IQR analysis on one-dimensional data 294 are indicated with a bold oval shape surrounding the black circles.
- one-dimensional data y is composed as a sum of y
- x x 1 , y
- x x 2 , y
- x x 3 , and y
- x x 4 , based on the effects from the other factor or variable x, as shown in diagram 230.
- Each row can represent an individual IQR analysis on one-dimensional data y based on one value (e.g., x i ) of the other dependent variable x.
- the system can perform an IQR 241 analysis on the data y
- x x 1 (240).
- IQR 241 can include a lower bound 242 and an upper bound 244, where data which falls outside of these bounds may be considered an anomaly.
- the system can: perform an IQR 251 analysis on the data y
- x x 2 (250) and determine anomalies for that data set; perform an IQR 261 analysis on the data y
- x x 3 (260) and determine anomalies for that data set; and perform an IQR 271 analysis on the data y
- x x 4 (270) and determine anomalies for that data set.
- the system can determine a sum 281 of these four IQR analyses, including determining a lower bound and an upper bound for the whole two-dimensional data set.
- detected anomalies from the individual IQRs 241, 251, 261, and 271 also appear as detected anomalies in sum 281, there are still some detected anomalies from the individual IQRs which do not appear in sum 281.
- detected anomalies 252 from IQR 251 and anomalies 262 from IQR 261 no longer appear as detected anomalies in sum 281. Instead, these previously detected anomalies now appear between the lower and upper bound of the sum 281 as data 263 and data 253.
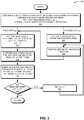
- FIG. 3 presents a flow chart 300 illustrating a method for facilitating anomaly detection, in accordance with an embodiment of the present invention.
- the system determines a set of testing data which includes a data series for a first variable and one or more second variables (e.g., two time-series data, y and x , wherein y is the objective for anomaly detection) (operation 302). It is known that the second data x affects the behaviors of the first data y.
- the system divides the data into n bins (operation 304).
- the system takes the indices of the data in the i th bin (operation 306) (where i is a value from 0 to n ), and passes that into the next operation.
- the system determines the data with the selected indices ( y
- x x i ) (operation 312).
- the system performs an IQR analysis on the data with the selected index (i.e., the data in the i th bin) (operation 314).
- the system determines the anomalies in the i th bin (operation 316). The system can also save the determined anomalies.
- the operation returns. If there are remaining bins (i.e., the current index i is not less than the number of bins n ) (decision 318), the operation returns. If there are remaining bins (i.e., the current index i is less than the number of bins n ) (decision 318), the system increments i (by setting i to i +1), and the operation returns to operation 306.
- FIG. 4A presents a graph 400 of an exemplary probability density for an original set of one-dimensional data, in accordance with an embodiment of the present invention.
- Graph 400 can include an x-axis which indicates the probability density, and a y -axis which indicates the sum of the AC energy consumed in "Room 1" (as measured in Kilowatt hours (kWh)).
- the red color in graph 400 indicates the one-dimensional data.
- FIG. 4B presents a graph 420 of exemplary testing data for the one-dimensional data of FIG. 4A with the addition of another variable, in accordance with an embodiment of the present invention.
- Graph 420 can include an x-axis which indicates the outside temperature (as measured via a temperature sensor in degrees Celsius), and a y -axis which indicates the sum of the AC energy consumed in Room 1 (as measured via multiple sensors in kWh).
- another dimension or variable of data is added to the one-dimensional data of graph 400.
- the red color in graph 420 indicates the two-dimensional data.
- FIG. 4C presents a graph 440 of the exemplary testing data of FIG. 4B , including dividing the exemplary testing data into bins or groups, in accordance with an embodiment of the present invention.
- Graph 440 can include an x -axis which indicates the outside temperature (as measured via a temperature sensor in degrees Celsius), and a y -axis which indicates the sum of the AC energy consumed in Room 1 (as measured via multiple sensors in kWh).
- the vertical dashed blue lines indicate separations between bins or groups.
- the system determines a number n of bins, which can be based on, e.g., an automatic process, an algorithm, a resolution of a sensor or a machine involved in obtaining the data, or historical data or knowledge related to the data and obtained by a computing device or a user.
- the unit of measure or size for each bin is 2 degrees Celsius.
- a bin 442 includes data from graph 440 for the sum of the room AC energy based on the outside temperature from 6 to 8 degrees Celsius.
- FIG. 4D presents a graph 460 of the exemplary testing data of FIG. 4C , including performing an inter-quartile range analysis on the testing data of the divided bins or groups, in accordance with an embodiment of the present invention.
- Graph 460 can include an x -axis which indicates the outside temperature (as measured via a temperature sensor in degrees Celsius), and a y -axis which indicates the sum of the AC energy consumed in Room 1 (as measured via multiple sensors in kWh).
- the vertical dashed blue lines indicate separations between bins or groups.
- the system can perform an IQR analysis on each bin. In each bin, the solid black lines indicate an upper bound and a lower bound, while the green "+" symbol indicates the median for the respective bin.
- the red color in graph 460 indicates the two-dimensional data which is classified as normal or not classified as an anomaly or an outlier based on the IQR analysis for the respective bin.
- the blue color in graph 460 indicates the two-dimensional data which is classified as an anomaly or an outlier based on the IQR analysis for the respective bin.
- the red-colored data which falls between the upper bound and the lower bound may be considered as normal data points, while the blue-colored data which falls above the upper bound (or outside of the range between the upper bound and the lower bound) may be considered as anomalous data points or as outliers.
- FIG. 5 presents a flow chart 500 illustrating a method for facilitating anomaly detection, in accordance with an embodiment of the present invention.
- the system determines, by a computing device, a set of testing data which includes a plurality of data points, wherein the set includes a data series for a first variable and one or more second variables, wherein the one or more second variables are dependent on the first variable (operation 502).
- the data series can include time-series data or can cover a frequency spectra.
- the system divides the set of testing data into a number of groups based on a type of the data series (operation 504).
- the system determines an inter-quartile range for a respective group (operation 506).
- the system classifies a first testing data point in the respective group as an anomaly based on the inter-quartile range for the respective group (operation 508), thereby enhancing data mining and outlier detection for the data series for multiple variables.
- FIG. 6A presents a flow chart 600 illustrating a method for facilitating anomaly detection, in accordance with an embodiment of the present invention.
- the system determines, by a computing device, a set of testing data which includes a plurality of data points, wherein the set includes a data series for a first variable and one or more second variables (operation 602).
- the one or more second variables are dependent on the first variable.
- the system divides the set of testing data into a number of groups based on a type of the data series (operation 604).
- the system divides a second set of testing data in a respective group into four parts based on a median of the second set of testing data, wherein three values which separate the four parts are a first quartile, a second quartile, and a third quartile, and wherein an inter-quartile range is a difference between the first quartile and the third quartile (operation 606).
- the system determines, for the respective group, based on the median of the second set of testing data, the first quartile, the second quartile, the third quartile, and the inter-quartile range (operation 608).
- the system identifies a lower bound for the second set of testing data by subtracting from the first quartile a first amount equal to the inter-quartile range scaled by a predetermined value (operation 610).
- the system also identifies a lower bound for the second set of testing data by adding to the third quartile a second amount equal to the inter-quartile range scaled by the predetermined value (operation 612).
- the system determines, for a respective data point in the second set of testing data, whether a respective testing data point falls between the lower bound and the upper bound (operation 614). The operation continues as described at Label A of FIG. 6A .
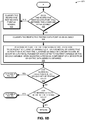
- FIG. 6B presents a flow chart 620 illustrating a method for facilitating anomaly detection, in accordance with an embodiment of the present invention.
- the system determines that the respective testing data point falls between the lower and upper bound (decision 622), the system classifies the respective testing data point as normal (decision 632), and the operation continues at decision 628.
- the system classifies the respective testing data point as an anomaly (operation 624).
- the system performs, by a user of the computing device, an action to address the classified anomaly (e.g., via a remedial or corrective action to ensure that the classified anomaly no longer occurs, by adjusting a physical parameter which affects the first variable or the second variable, or by adjusting a physical component of a device from which the data series (e.g., time-series data) is obtained) (operation 626).
- operation 626 can occur after all anomalies have been classified for a respective group (e.g., for the second set of testing data in the respective group, after decision 628 returns a "no" response), or after all anomalies have been classified for the whole set of testing data (e.g., after decision 630 returns a "no" response).
- the operation returns to operation 614 of FIG. 6A . If there are no remaining data points in the second set of testing data (decision 628), the system determines whether there are any remaining groups in the set of testing data (decision 630). If there are, the operation returns to operation 606 of FIG. 6A . If there are no remaining groups in the set of testing data (decision 630), the operation returns.
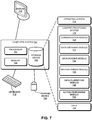
- FIG. 7 illustrates an exemplary distributed computer and communication system 702 that facilitates anomaly detection, in accordance with an embodiment of the present invention.
- Computer system 702 includes a processor 704, a memory 706, and a storage device 708.
- Memory 706 can include a volatile memory (e.g., RAM) that serves as a managed memory, and can be used to store one or more memory pools.
- computer system 702 can be coupled to a display device 710, a keyboard 712, and a pointing device 714.
- Storage device 708 can store an operating system 716, a content-processing system 718, and data 732.
- Content-processing system 718 can include instructions, which when executed by computer system 702, can cause computer system 702 to perform methods and/or processes described in this disclosure. Specifically, content-processing system 718 may include instructions for sending and/or receiving data packets to/from other network nodes across a computer network (communication module 720).
- a data packet can include data, a data series, time-series data, testing data, a set of data, data points, a request, a command, and a response.
- Content-processing system 718 can further include instructions for determining, by a computing device, a set of testing data which includes a plurality of data points, wherein the set includes a data series for a first variable and one or more second variables, and wherein the one or more second variables are dependent on the first variable (communication module 720 and data-obtaining module 722).
- Content-processing system 718 can further include instructions for dividing the set of testing data into a number of groups based on a type of the data series (data-dividing module 724).
- Content-processing system 718 can further include instructions for determining an inter-quartile range for a respective group (IQR-performing module 726).
- Content-processing system 718 can further include instructions for classifying a first testing data point in the respective group as an anomaly based on the inter-quartile range for the respective group (data-classifying module 728), thereby enhancing data mining and outlier detection for the data series for multiple variables (data-classifying module 728).
- Content-processing system 718 can also include instructions for performing, by a user of the computing device, an action to address the classified anomaly, wherein the action includes one or more of: a remedial or corrective action to ensure that the classified anomaly no longer occurs; adjusting a physical parameter which affects the first variable or the one or more second variables; and adjusting a physical component of a device from which the data series is obtained (action-performing module 730).
- Data 732 can include any data that is required as input or that is generated as output by the methods and/or processes described in this disclosure. Specifically, data 732 can store at least: data; a set of testing data; a plurality of data points; a first variable; one or more second variables; time-series data or a frequency spectra for a first and a second variable; a number of groups or bins; a type of the time-series data; an inter-quartile range; a classification for a testing data point; a testing data point which is classified as an anomaly; a testing data point which is classified as a normal data point; an indicator of an enhanced data mining and outlier detection for time-series data for multiple variables; an indicator of an action; a remedial or corrective action; an indicator of a physical parameter which affects the first variable or the second variable; an indicator of a physical component of a device from which the time-series data is obtained; an objective of anomaly detection; an automatic process; an algorithm; an automatic process which is based on
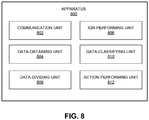
- FIG. 8 illustrates an exemplary apparatus 800 that facilitates anomaly detection, in accordance with an embodiment of the present invention.
- Apparatus 800 can comprise a plurality of units or apparatuses which may communicate with one another via a wired, wireless, quantum light, or electrical communication channel.
- Apparatus 800 may be realized using one or more integrated circuits, and may include fewer or more units or apparatuses than those shown in FIG. 8 .
- apparatus 800 may be integrated in a computer system, or realized as a separate device which is capable of communicating with other computer systems and/or devices.
- apparatus 800 can comprise units 802-812 which perform functions or operations similar to modules 720-730 of computer system 702 of FIG. 7 , including: a communication unit 802; a data-obtaining unit 804; a data-dividing unit 806; an IQR-performing unit 808; a data-classifying unit 810; and an action-performing unit 812.
- the data structures and code described in this detailed description are typically stored on a computer-readable storage medium, which may be any device or medium that can store code and/or data for use by a computer system.
- the computer-readable storage medium includes, but is not limited to, volatile memory, non-volatile memory, a non-transitory computer-readable storage medium, magnetic and optical storage devices such as disk drives, magnetic tape, CDs (compact discs), DVDs (digital versatile discs or digital video discs), or other media capable of storing computer-readable media now known or later developed.
- the methods and processes described in the detailed description section can be embodied as code and/or data, which can be stored in a computer-readable storage medium as described above.
- a computer system reads and executes the code and/or data stored on the computer-readable storage medium, the computer system performs the methods and processes embodied as data structures and code and stored within the computer-readable storage medium.
- the methods and processes described above can be included in hardware modules or apparatus.
- the hardware modules or apparatus can include, but are not limited to, application-specific integrated circuit (ASIC) chips, field-programmable gate arrays (FPGAs), dedicated or shared processors that execute a particular software module or a piece of code at a particular time, and other programmable-logic devices now known or later developed.
- ASIC application-specific integrated circuit
- FPGA field-programmable gate arrays
- dedicated or shared processors that execute a particular software module or a piece of code at a particular time
- other programmable-logic devices now known or later developed.
Abstract
Description
- This disclosure is generally related to detecting anomalies. More specifically, this disclosure is related to a system and method for binned inter-quartile range analysis in anomaly detection of a data series.
- Anomaly detection, or outlier detection, is a data mining method which identifies items or events that do not conform to an expected pattern or others in a data set. Anomaly detection is relevant in various fields, e.g., manufacturing, medical areas, and energy-related fields. For example, in manufacturing, energy usage can incur a significant cost, such as in running a factory with machines or a data center with many machines. To this end, identifying anomalies may provide a more efficient manufacturing system, which can in turn reduce costs and improve the overall efficiency of the system as well as its constituent components or parts.
- The type of anomaly detection method used can differ based on the type of classification needed. One method is the Inter-quartile Range (IQR) method. The IQR is a measure of variability based on dividing a data set into four parts, separated by three "quartiles." The IQR is the first quartile subtracted from the third quartile, and is also called the "midspread" or the "middle 50%." An IQR analysis or method can be used to identify anomalies or outliers, and is typically used for given data of only one class, i.e., one-dimensional data.
- However, in a two-dimensional or higher dimensional data set (such as two sets of time-series data) which shows different behaviors based on other factors or dependent variables, an IQR analysis may not perform well by itself. Thus, while a standard IQR analysis may provide a robust measure of scale and identify outliers in a one-dimensional data set, a standard IQR analysis in a two-dimensional data set may not provide an accurate measure of scale. Furthermore, in a two-dimensional or higher dimensional data set, a standard IQR analysis may potentially miss identifying outliers or may incorrectly identify normal data points as outliers. This can result in an inefficient system for data mining and anomaly detection.
- One embodiment provides a system for facilitating anomaly detection. During operation, the system determines, by a computing device, a set of testing data which includes a plurality of data points, wherein the set includes a data series for a first variable and one or more second variables, and wherein the one or more second variables are dependent on the first variable. The system divides the set of testing data into a number of groups based on a type of the data series. The system determines an inter-quartile range for a respective group. The system classifies a first testing data point in the respective group as an anomaly based on the inter-quartile range for the respective group, thereby enhancing data mining and outlier detection for the data series for multiple variables.
- In some embodiments, the system performs, by a user of the computing device, an action to address the classified anomaly. The action includes one or more of: a remedial or corrective action to ensure that the classified anomaly no longer occurs; adjusting a physical parameter which affects the first variable or the one or more second variables; and adjusting a physical component of a device from which the data series is obtained.
- In some embodiments, the system receives, by the computing device, a request to detect anomalies for a new set of testing data, wherein the new set includes a new data series for the first variable and the one or more second variables, wherein the new set of testing data is obtained by the computing device subsequent to the user performing the action to address the classified anomaly. The system divides the new set of testing data into a same number of new groups as the number of groups of the set of testing data. The system determines an inter-quartile range for a respective new group which corresponds to the respective group in which the first testing data point was classified as an anomaly. The system determines whether the first testing data point in the respective group still occurs in the respective new group, which indicates whether the action performed by the user to address the classified anomaly is successful or not.
- In some embodiments, dividing the set of testing data into the number of groups is based on one or more of: an automatic process which is based on an algorithm; a resolution of a sensor or a machine involved in obtaining the set of testing data; previous or historical data relating to the set of testing data, wherein the previous or historical data is obtained by the computing device; prior or historical knowledge of a user of the computing device, wherein the prior or historical knowledge is related to the set of testing data and is obtained by the user of the computing device; and decomposing a data distribution of the set of testing data based on a component which is representative of key variables for a higher-dimensional data set, wherein the component includes one or more of a principal component, a derived combination of components, and a linear combination of components, wherein determining the inter-quartile range for the respective group further comprises performing an inter-quartile analysis based on the component.
- In some embodiments, dividing the set of testing data and determining the inter-quartile range for the respective group further comprise: automatically classifying a normal distribution in the set of testing data based on multiple dependent variables across the divided groups in the set of testing data, including a presence of testing data points which are classified as an anomaly.
- In some embodiments, the data series comprises time-series data for the first variable and the one or more second variables, the time-series data for the first variable is an objective of the anomaly detection, and the time-series data for the one or more second variables affects the time-series data for the first variable.
- In some embodiments, determining the inter-quartile range for the respective group further comprises: dividing a second set of testing data in the respective group into four parts based on a median of the second set of testing data, wherein three values which separate the four parts are a first quartile, a second quartile, and a third quartile, and wherein the inter-quartile range is a difference between the first quartile and the third quartile. Determining the inter-quartile range for the respective group further comprises: identifying a lower bound for the second set of testing data by subtracting from the first quartile a first amount equal to the inter-quartile range scaled by a predetermined value; and identifying an upper bound for the second set of testing data by adding to the third quartile a second amount equal to the inter-quartile range scaled by the predetermined value.
- In some embodiments, classifying the first testing data point in the respective group as an anomaly is further based on determining that the first testing data point does not fall between the lower bound and the upper bound.
- In some embodiments, in response to determining that a number of data points in the second set of testing data is an even number 2n, the system: sets the first quartile as a median of n smallest data points in the second set; and sets the third quartile as a median of n largest data points in the second set. In response to determining that a number of data points in the second set of testing data is an odd number 2m+1, the system: sets the first quartile as a median of m smallest data points in the second set; sets the third quartile as a median of m largest data points in the second set; and sets the second quartile as an ordinary median of data points in the second set.
-
FIG. 1 illustrates an exemplary environment for facilitating anomaly detection, in accordance with an embodiment of the present invention. -
FIG. 2A illustrates an exemplary diagram for determining the inter-quartile range, in accordance with the prior art. -
FIG. 2B illustrates an exemplary result of unsuccessfully detecting anomalies based on an inter-quartile range analysis, in accordance with the prior art. -
FIG. 3 presents a flow chart illustrating a method for facilitating anomaly detection, in accordance with an embodiment of the present invention. -
FIG. 4A presents an exemplary probability density for an original set of one-dimensional data, in accordance with an embodiment of the present invention. -
FIG. 4B presents exemplary testing data for the one-dimensional data ofFIG. 4A with the addition of another variable, in accordance with an embodiment of the present invention. -
FIG. 4C presents the exemplary testing data ofFIG. 4B , including dividing the exemplary testing data into bins or groups, in accordance with an embodiment of the present invention. -
FIG. 4D presents the exemplary testing data ofFIG. 4C , including performing an inter-quartile range analysis on the testing data of the divided bins or groups, in accordance with an embodiment of the present invention. -
FIG. 5 presents a flow chart illustrating a method for facilitating anomaly detection, in accordance with an embodiment of the present invention. -
FIG. 6A presents a flow chart illustrating a method for facilitating anomaly detection, in accordance with an embodiment of the present invention. -
FIG. 6B presents a flow chart illustrating a method for facilitating anomaly detection, in accordance with an embodiment of the present invention. -
FIG. 7 illustrates an exemplary distributed computer and communication system that facilitates anomaly detection, in accordance with an embodiment of the present invention. -
FIG. 8 illustrates an exemplary apparatus that facilitates anomaly detection, in accordance with an embodiment of the present invention. - The embodiments described herein solve the problem of efficiently and accurately identifying anomalies in a data series for at least two interdependent variables based on dividing the data into "bins" and performing an IQR analysis on each bin.
- As discussed above, identifying anomalies may provide a more efficient system in many areas (e.g., manufacturing, medical fields, and energy-related fields), and can in turn reduce costs and improve the overall efficiency of the system as well as its constituent components or parts. The type of anomaly detection method used can differ based on the type of classification needed. One method is the Inter-quartile Range (IQR) method. The IQR is a measure of variability based on dividing a data set into four parts, separated by three "quartiles." The IQR is the first quartile subtracted from the third quartile, and is also called the "midspread" or the "middle 50%." An IQR analysis or method can be used to identify anomalies or outliers, and is typically used for given data of only one class, i.e., one-dimensional data.
- However, in a two-dimensional or higher dimensional data set (such as two sets of time-series data) which shows different behaviors based on other factors or dependent variables, an IQR analysis may not perform well by itself. Thus, while a standard IQR analysis may provide a robust measure of scale and identify outliers in a one-dimensional data set, a standard IQR analysis in a two-dimensional data set may not provide an accurate measure of scale. Furthermore, in a two-dimensional or higher dimensional data set, a standard IQR analysis may potentially miss identifying outliers or may incorrectly identify normal data points as outliers. This can result in an inefficient system for data mining and anomaly detection.
- The embodiments described herein address this challenge by providing a system which first divides multiple sets of data series (where each set represents data for an interdependent variable) into a number of distinct groups or "bins," and subsequently performs the IQR analysis on the data in each bin to detect anomalies in the data series, as described below in relation to
FIG. 3 . That is, the system performs the IQR analysis over a range for at least one other dimension or dependent variable of the data. - Thus, the embodiments described herein provide a computer system which improves the efficiency of detecting anomalies in a data series over at least two dimensions or variables using a "binned" IQR analysis. The data series, e.g., can include time-series data or can cover a frequency spectra. The system enhances and improves data mining and outlier detection in a data series for multiple interdependent variables or dimensions, where the improvements are fundamentally technological. The improvements can result in a more efficient manufacturing system or other physical system by more effectively identifying anomalies. A system administrator or other user can take a remedial, corrective, or other action based on the identified anomalies to improve the overall efficiency of the manufacturing or other physical system. For example, subsequently obtained time-series data may indicate to the user that the previously detected anomaly or anomalies no longer occur.
- Furthermore, the embodiments described herein provide a technological solution (e.g., dividing a set of time-series data over multiple interdependent variables or dimensions into bins and then performing an IQR analysis on each bin to classify anomalies) to a technological problem (improving the efficiency of a manufacturing or other physical system by allowing a user to take an action based on the detected anomalies to, e.g., remove or address the anomalies).
- The terms "bins" and "groups" are used interchangeably in this disclosure, and refer to a plurality of data sets, which are created by dividing a (larger or parent) set of testing data. A set of testing data (or a divided/binned set of testing data) can include a plurality of data points.
- A set of testing data can be divided into a number of bins or groups based on a "type" of the set of testing data. The type of the set of testing data can depend, e.g., a physical parameter being measured, a physical device or sensor from which a measurement is obtained, a physical component of such a device or sensor, or a category determined by the user or the system.
- The terms "IQR method" and "IQR analysis" are used interchangeably in this disclosure, and refer to a process which: detects the inter-quartile range; determines a median, a lower bound, and an upper bound; and classifies outliers or detect anomalies based on the inter-quartile range, including the lower bound and the upper bound.
-
FIG. 1 illustrates anexemplary environment 100 for facilitating anomaly detection, in accordance with an embodiment of the present invention.Environment 100 can include: adevice 102 and an associateduser 112; adevice 104 and an associateduser 114; and adevice 106.Devices network 120.Environment 100 can also include a physical object with sensors which can record data over a period of time and at periodic intervals. For example,environment 100 can include: a room 130 which can include devices 132.1-132.m and sensors 134.1-134.n; and anoutside temperature sensor 136. Sensors 134.1-134.n can monitor a physical feature of the room, such as an amount of heating, ventilation, and air conditioning (HVAC) energy consumed in room 130 or the amount of HVAC energy consumed or used by a specific device in room 130.Outside temperature sensor 136 can monitor the temperature of the air outside the room, whether inside a same building or outside of a building in which room 130 resides. - During operation, the sensors can send their respective measured testing data to
device 104. For example,device 104 can obtain testing data 142 from sensor 134.1, and can also obtaintesting data 144 fromsensor 136.Testing data 142 and 144 can include time-series data and can also cover a frequency spectra. At the same or a different time,user 112 can send a command to requestanomalies 152 for certain testing data related to sensors 134.1-134.n of room 130 andoutside temperature sensor 136, which can result in sending aget testing data 154 command todevice 104. -
Device 104 can obtaintesting data 142 and 144, and can combinetesting data 142 and 144.Device 104 can send combinedtesting data 146 todevice 106 vianetwork 120. Upon receivingrequest anomalies 152 command along with combinedtesting data 146,device 106 can divide combinedtesting data 146 into a number of bins (function 154).Device 106 can subsequently perform an IQR analysis on the data in each bin (function 156). During the IQR analysis,device 106 can identify testing data points from combined testing data 146 (and specifically, from the testing data points in each divided bin or group of testing data) which are not within a range defined by a lower bound and an upper bound for a respective bin, where the lower bound and the upper bound are determined based on the IQR analysis.Device 106 can send classification(s) 158 of the data points in the testing data back todevice 102, vianetwork 120. - Upon receiving classification(s) 158,
device 102 can perform anaction 160, which can include executing a predetermined rule based on the classification(s). For example, the predetermined rule can include automatically adjusting a physical component or unit related to the sensors or devices involved in obtaining the testing data.User 112 can also perform anaction 162, which can include reviewing the classified anomaly in light of other historical data.User 112 can also perform an action which results in remediating or discovering a reason for the classified anomaly, and can take measures to prevent such anomalies from occurring again. - That is, classification(s) 158 allows both
device 102 anduser 112 to use the results of the enhanced data mining and outlier detection based on the IQR analysis performed on the discrete bins or groups. For example, based on the response (i.e., classification(s) 158) to requestanomalies 152 command,user 112 can perform or take an action which can affect and improve the operation and performance of a manufacturing system or other physical system associated with room 130 and devices 132.1-132.m in room 130. The action can be a remedial or a corrective action to ensure that the classified anomaly no longer occurs.User 112 can also monitor, observe, and classify subsequent testing data to determine whether the actions ofuser 112 have the intended effect, including the removal or deletion of any previously detected anomalies. - That is,
user 112 can send a new request anomalies command which, along with new combined testing data obtained from the sensors, can be received bydevice 106.Device 106 can divide the data into bins and perform an IQR analysis on the newly binned data.Device 106 can send new classifications back todevice 102 anduser 112, which allowsdevice 102 anduser 112 to determine whether the previously performed actions (i.e.,actions - Thus, the embodiments described herein provide a system which improves and enhances anomaly detection in time-series data over at least two variables or dimensions, and further improves the efficiency of the overall system for data mining and outlier detection.
-
FIG. 2A illustrates an exemplary diagram 200 for determining the inter-quartile range, in accordance with the prior art. Diagram 200 can include data represented in a horizontal fashion, as indicated by the dashed blue line. The system can divide the represented data set into "quartiles," where a quartile divides a rank-ordered data set into four equal parts. A quartile is a value which separates the parts. The first, second, and third quartiles can be referred to as "Q1," "Q2," and "Q3," respectively. The system can determine a median 202, and can further determine a first quartile ("Q1") 204 and a third quartile ("Q3") 206. An inter-quartile range ("IQR") 210 can be defined as a difference between Q3 and Q1. The IQR (which is sometimes called the "midspread" or the "middle 50%") is equal to the difference between the 75th and 25th percentiles, or between upper quartile Q3 and lower quartile Q1. - Furthermore, the system can determine a lower bound 212, by subtracting from the first quartile Q1 a first amount equal to the inter-quartile range scaled by a predetermined value, such as 1.5 (i.e., Q1 - 1.5 x IQR). The system can also determine an upper bound 214, by adding to the third quartile a second amount equal to the inter-quartile range scaled by the predetermined value (i.e., Q3 + 1.5 x IQR). Any data which falls outside of the range defined by lower bound 212 and upper bound 214 may be considered to be an anomaly or an outlier. That is, any data point which does not fall between lower bound 212 and upper bound 214 may be classified as an anomaly or an outlier. For example, an
outlier 222 is a data point which is greater than upper bound 214 (i.e., which does not fall between lower bound 212 and upper bound 214). Thus,data point 222 is classified as an outlier. - As discussed above, the IQR method is typically used for given data of only one class, i.e., one-dimensional data. However, in a two-dimensional data set which shows different behaviors based on other factors or dependent variables, the IQR method may not perform well by itself.
FIG. 2B illustrates an exemplary diagram 230 for a result of unsuccessfully detecting anomalies based on inter-quartile range analysis, in accordance with the prior art. As shown in the index, a detectedanomaly 292 is indicated with a small black circle, while undetected anomalies using IQR analysis on one-dimensional data 294 are indicated with a bold oval shape surrounding the black circles. - Assume that one-dimensional data y is composed as a sum of y|x=x1 , y|x=x2, y|x=x3 , and y|x=x4 , based on the effects from the other factor or variable x, as shown in diagram 230. Each row can represent an individual IQR analysis on one-dimensional data y based on one value (e.g., xi ) of the other dependent variable x. For example, the system can perform an
IQR 241 analysis on the data y|x=x1 (240).IQR 241 can include a lower bound 242 and an upper bound 244, where data which falls outside of these bounds may be considered an anomaly. Similarly, the system can: perform anIQR 251 analysis on the data y|x=x2 (250) and determine anomalies for that data set; perform anIQR 261 analysis on the data y|x=x3 (260) and determine anomalies for that data set; and perform anIQR 271 analysis on the data y|x=x4 (270) and determine anomalies for that data set. The system can determine asum 281 of these four IQR analyses, including determining a lower bound and an upper bound for the whole two-dimensional data set. Note that while some of the detected anomalies from theindividual IQRs sum 281, there are still some detected anomalies from the individual IQRs which do not appear insum 281. For example, detectedanomalies 252 fromIQR 251 andanomalies 262 fromIQR 261 no longer appear as detected anomalies insum 281. Instead, these previously detected anomalies now appear between the lower and upper bound of thesum 281 asdata 263 anddata 253. - Thus, using the IQR method directly on two-dimensional data may result in the inaccurate identification of anomalies, e.g., missing or not correctly detecting (previously detected)
anomalies -
FIG. 3 presents aflow chart 300 illustrating a method for facilitating anomaly detection, in accordance with an embodiment of the present invention. During operation, the system determines a set of testing data which includes a data series for a first variable and one or more second variables (e.g., two time-series data, y and x, wherein y is the objective for anomaly detection) (operation 302). It is known that the second data x affects the behaviors of the first data y. For the second data x, the system divides the data into n bins (operation 304). The system takes the indices of the data in the ith bin (operation 306) (where i is a value from 0 to n), and passes that into the next operation. For the first data y, the system determines the data with the selected indices (y|x=xi ) (operation 312). The system performs an IQR analysis on the data with the selected index (i.e., the data in the ith bin) (operation 314). Based on the IQR analysis for the selected index (i.e., for the data in the ith bin), the system determines the anomalies in the ith bin (operation 316). The system can also save the determined anomalies. - If there are no remaining bins (i.e., the current index i is not less than the number of bins n) (decision 318), the operation returns. If there are remaining bins (i.e., the current index i is less than the number of bins n) (decision 318), the system increments i (by setting i to i+1), and the operation returns to
operation 306. -
FIG. 4A presents agraph 400 of an exemplary probability density for an original set of one-dimensional data, in accordance with an embodiment of the present invention.Graph 400 can include an x-axis which indicates the probability density, and a y-axis which indicates the sum of the AC energy consumed in "Room 1" (as measured in Kilowatt hours (kWh)). The red color ingraph 400 indicates the one-dimensional data. -
FIG. 4B presents agraph 420 of exemplary testing data for the one-dimensional data ofFIG. 4A with the addition of another variable, in accordance with an embodiment of the present invention.Graph 420 can include an x-axis which indicates the outside temperature (as measured via a temperature sensor in degrees Celsius), and a y-axis which indicates the sum of the AC energy consumed in Room 1 (as measured via multiple sensors in kWh). Ingraph 420, another dimension or variable of data is added to the one-dimensional data ofgraph 400. The red color ingraph 420 indicates the two-dimensional data. -
FIG. 4C presents agraph 440 of the exemplary testing data ofFIG. 4B , including dividing the exemplary testing data into bins or groups, in accordance with an embodiment of the present invention.Graph 440 can include an x-axis which indicates the outside temperature (as measured via a temperature sensor in degrees Celsius), and a y-axis which indicates the sum of the AC energy consumed in Room 1 (as measured via multiple sensors in kWh). Ingraph 440, the vertical dashed blue lines indicate separations between bins or groups. That is, the system determines a number n of bins, which can be based on, e.g., an automatic process, an algorithm, a resolution of a sensor or a machine involved in obtaining the data, or historical data or knowledge related to the data and obtained by a computing device or a user. Ingraph 440, the unit of measure or size for each bin is 2 degrees Celsius. For example, abin 442 includes data fromgraph 440 for the sum of the room AC energy based on the outside temperature from 6 to 8 degrees Celsius. -
FIG. 4D presents agraph 460 of the exemplary testing data ofFIG. 4C , including performing an inter-quartile range analysis on the testing data of the divided bins or groups, in accordance with an embodiment of the present invention.Graph 460 can include an x-axis which indicates the outside temperature (as measured via a temperature sensor in degrees Celsius), and a y-axis which indicates the sum of the AC energy consumed in Room 1 (as measured via multiple sensors in kWh). Ingraph 460, the vertical dashed blue lines indicate separations between bins or groups. The system can perform an IQR analysis on each bin. In each bin, the solid black lines indicate an upper bound and a lower bound, while the green "+" symbol indicates the median for the respective bin. The red color ingraph 460 indicates the two-dimensional data which is classified as normal or not classified as an anomaly or an outlier based on the IQR analysis for the respective bin. The blue color ingraph 460 indicates the two-dimensional data which is classified as an anomaly or an outlier based on the IQR analysis for the respective bin. - For example, in a bin 462 (which corresponds to
bin 442 of graph 440), the red-colored data which falls between the upper bound and the lower bound (i.e., the solid black lines) may be considered as normal data points, while the blue-colored data which falls above the upper bound (or outside of the range between the upper bound and the lower bound) may be considered as anomalous data points or as outliers. -
FIG. 5 presents aflow chart 500 illustrating a method for facilitating anomaly detection, in accordance with an embodiment of the present invention. During operation, the system determines, by a computing device, a set of testing data which includes a plurality of data points, wherein the set includes a data series for a first variable and one or more second variables, wherein the one or more second variables are dependent on the first variable (operation 502). The data series can include time-series data or can cover a frequency spectra. The system divides the set of testing data into a number of groups based on a type of the data series (operation 504). The system determines an inter-quartile range for a respective group (operation 506). The system classifies a first testing data point in the respective group as an anomaly based on the inter-quartile range for the respective group (operation 508), thereby enhancing data mining and outlier detection for the data series for multiple variables. -
FIG. 6A presents aflow chart 600 illustrating a method for facilitating anomaly detection, in accordance with an embodiment of the present invention. During operation, the system determines, by a computing device, a set of testing data which includes a plurality of data points, wherein the set includes a data series for a first variable and one or more second variables (operation 602). The one or more second variables are dependent on the first variable. The system divides the set of testing data into a number of groups based on a type of the data series (operation 604). The system divides a second set of testing data in a respective group into four parts based on a median of the second set of testing data, wherein three values which separate the four parts are a first quartile, a second quartile, and a third quartile, and wherein an inter-quartile range is a difference between the first quartile and the third quartile (operation 606). The system determines, for the respective group, based on the median of the second set of testing data, the first quartile, the second quartile, the third quartile, and the inter-quartile range (operation 608). The system identifies a lower bound for the second set of testing data by subtracting from the first quartile a first amount equal to the inter-quartile range scaled by a predetermined value (operation 610). The system also identifies a lower bound for the second set of testing data by adding to the third quartile a second amount equal to the inter-quartile range scaled by the predetermined value (operation 612). The system determines, for a respective data point in the second set of testing data, whether a respective testing data point falls between the lower bound and the upper bound (operation 614). The operation continues as described at Label A ofFIG. 6A . -
FIG. 6B presents aflow chart 620 illustrating a method for facilitating anomaly detection, in accordance with an embodiment of the present invention. During operation, if the system determines that the respective testing data point falls between the lower and upper bound (decision 622), the system classifies the respective testing data point as normal (decision 632), and the operation continues atdecision 628. - If the system determines that the respective testing data point does not fall between the lower and upper bound (decision 622), the system classifies the respective testing data point as an anomaly (operation 624). The system performs, by a user of the computing device, an action to address the classified anomaly (e.g., via a remedial or corrective action to ensure that the classified anomaly no longer occurs, by adjusting a physical parameter which affects the first variable or the second variable, or by adjusting a physical component of a device from which the data series (e.g., time-series data) is obtained) (operation 626). Note that
operation 626 can occur after all anomalies have been classified for a respective group (e.g., for the second set of testing data in the respective group, afterdecision 628 returns a "no" response), or after all anomalies have been classified for the whole set of testing data (e.g., afterdecision 630 returns a "no" response). - If there are any remaining data points in the second set of testing data (decision 628), the operation returns to
operation 614 ofFIG. 6A . If there are no remaining data points in the second set of testing data (decision 628), the system determines whether there are any remaining groups in the set of testing data (decision 630). If there are, the operation returns tooperation 606 ofFIG. 6A . If there are no remaining groups in the set of testing data (decision 630), the operation returns. -
FIG. 7 illustrates an exemplary distributed computer andcommunication system 702 that facilitates anomaly detection, in accordance with an embodiment of the present invention.Computer system 702 includes aprocessor 704, amemory 706, and astorage device 708.Memory 706 can include a volatile memory (e.g., RAM) that serves as a managed memory, and can be used to store one or more memory pools. Furthermore,computer system 702 can be coupled to adisplay device 710, akeyboard 712, and apointing device 714.Storage device 708 can store anoperating system 716, a content-processing system 718, anddata 732. - Content-
processing system 718 can include instructions, which when executed bycomputer system 702, can causecomputer system 702 to perform methods and/or processes described in this disclosure. Specifically, content-processing system 718 may include instructions for sending and/or receiving data packets to/from other network nodes across a computer network (communication module 720). A data packet can include data, a data series, time-series data, testing data, a set of data, data points, a request, a command, and a response. - Content-
processing system 718 can further include instructions for determining, by a computing device, a set of testing data which includes a plurality of data points, wherein the set includes a data series for a first variable and one or more second variables, and wherein the one or more second variables are dependent on the first variable (communication module 720 and data-obtaining module 722). Content-processing system 718 can further include instructions for dividing the set of testing data into a number of groups based on a type of the data series (data-dividing module 724). Content-processing system 718 can further include instructions for determining an inter-quartile range for a respective group (IQR-performing module 726). Content-processing system 718 can further include instructions for classifying a first testing data point in the respective group as an anomaly based on the inter-quartile range for the respective group (data-classifying module 728), thereby enhancing data mining and outlier detection for the data series for multiple variables (data-classifying module 728). - Content-
processing system 718 can also include instructions for performing, by a user of the computing device, an action to address the classified anomaly, wherein the action includes one or more of: a remedial or corrective action to ensure that the classified anomaly no longer occurs; adjusting a physical parameter which affects the first variable or the one or more second variables; and adjusting a physical component of a device from which the data series is obtained (action-performing module 730). -
Data 732 can include any data that is required as input or that is generated as output by the methods and/or processes described in this disclosure. Specifically,data 732 can store at least: data; a set of testing data; a plurality of data points; a first variable; one or more second variables; time-series data or a frequency spectra for a first and a second variable; a number of groups or bins; a type of the time-series data; an inter-quartile range; a classification for a testing data point; a testing data point which is classified as an anomaly; a testing data point which is classified as a normal data point; an indicator of an enhanced data mining and outlier detection for time-series data for multiple variables; an indicator of an action; a remedial or corrective action; an indicator of a physical parameter which affects the first variable or the second variable; an indicator of a physical component of a device from which the time-series data is obtained; an objective of anomaly detection; an automatic process; an algorithm; an automatic process which is based on an algorithm; a resolution of a sensor or a machine; previous or historical data; prior or historical knowledge; a median; a first quartile; a second quartile; a third quartile; an indicator of four parts; a lower bound; an upper bound; an even number; and an odd number. -
FIG. 8 illustrates an exemplary apparatus 800 that facilitates anomaly detection, in accordance with an embodiment of the present invention. Apparatus 800 can comprise a plurality of units or apparatuses which may communicate with one another via a wired, wireless, quantum light, or electrical communication channel. Apparatus 800 may be realized using one or more integrated circuits, and may include fewer or more units or apparatuses than those shown inFIG. 8 . Further, apparatus 800 may be integrated in a computer system, or realized as a separate device which is capable of communicating with other computer systems and/or devices. Specifically, apparatus 800 can comprise units 802-812 which perform functions or operations similar to modules 720-730 ofcomputer system 702 ofFIG. 7 , including: acommunication unit 802; a data-obtainingunit 804; a data-dividingunit 806; an IQR-performingunit 808; a data-classifyingunit 810; and an action-performingunit 812. - The data structures and code described in this detailed description are typically stored on a computer-readable storage medium, which may be any device or medium that can store code and/or data for use by a computer system. The computer-readable storage medium includes, but is not limited to, volatile memory, non-volatile memory, a non-transitory computer-readable storage medium, magnetic and optical storage devices such as disk drives, magnetic tape, CDs (compact discs), DVDs (digital versatile discs or digital video discs), or other media capable of storing computer-readable media now known or later developed.
- The methods and processes described in the detailed description section can be embodied as code and/or data, which can be stored in a computer-readable storage medium as described above. When a computer system reads and executes the code and/or data stored on the computer-readable storage medium, the computer system performs the methods and processes embodied as data structures and code and stored within the computer-readable storage medium.
- Furthermore, the methods and processes described above can be included in hardware modules or apparatus. The hardware modules or apparatus can include, but are not limited to, application-specific integrated circuit (ASIC) chips, field-programmable gate arrays (FPGAs), dedicated or shared processors that execute a particular software module or a piece of code at a particular time, and other programmable-logic devices now known or later developed. When the hardware modules or apparatus are activated, they perform the methods and processes included within them.
Claims (20)
- A computer-implemented method for facilitating anomaly detection, the method comprising:determining, by a computing device, a set of testing data which includes a plurality of data points, wherein the set includes a data series for a first variable and one or more second variables, and wherein the one or more second variables are dependent on the first variable;dividing the set of testing data into a number of groups based on a type of the data series;determining an inter-quartile range for a respective group; andclassifying a first testing data point in the respective group as an anomaly based on the inter-quartile range for the respective group,thereby enhancing data mining and outlier detection for the data series for multiple variables.
- The method of claim 1, further comprising:performing, by a user of the computing device, an action to address the classified anomaly,wherein the action includes one or more of:a remedial or corrective action to ensure that the classified anomaly no longer occurs;adjusting a physical parameter which affects the first variable or the one or more second variables; andadjusting a physical component of a device from which the data series is obtained.
- The method of claim 2, further comprising:receiving, by the computing device, a request to detect anomalies for a new set of testing data, wherein the new set includes a new data series for the first variable and the one or more second variables,wherein the new set of testing data is obtained by the computing device subsequent to the user performing the action to address the classified anomaly;dividing the new set of testing data into a same number of new groups as the number of groups of the set of testing data;determining an inter-quartile range for a respective new group which corresponds to the respective group in which the first testing data point was classified as an anomaly; anddetermining whether the first testing data point in the respective group still occurs in the respective new group, which indicates whether the action performed by the user to address the classified anomaly is successful or not.
- The method of claim 1, wherein dividing the set of testing data into the number of groups is based on one or more of:an automatic process which is based on an algorithm;a resolution of a sensor or a machine involved in obtaining the set of testing data;previous or historical data relating to the set of testing data, wherein the previous or historical data is obtained by the computing device;prior or historical knowledge of a user of the computing device, wherein the prior or historical knowledge is related to the set of testing data and is obtained by the user of the computing device; anddecomposing a data distribution of the set of testing data based on a component which is representative of key variables for a higher-dimensional data set, wherein the component includes one or more of a principal component, a derived combination of components, and a linear combination of components,wherein determining the inter-quartile range for the respective group further comprises performing an inter-quartile analysis based on the component.
- The method of claim 1, wherein dividing the set of testing data and determining the inter-quartile range for the respective group further comprise:
automatically classifying a normal distribution in the set of testing data based on multiple dependent variables across the divided groups in the set of testing data, including a presence of testing data points which are classified as an anomaly. - The method of claim 1,
wherein the data series comprises time-series data for the first variable and the one or more second variables,
wherein the time-series data for the first variable is an objective of the anomaly detection, and
wherein the time-series data for the one or more second variables affects the time-series data for the first variable. - The method of claim 1, wherein determining the inter-quartile range for the respective group further comprises:dividing a second set of testing data in the respective group into four parts based on a median of the second set of testing data,wherein three values which separate the four parts are a first quartile, a second quartile, and a third quartile, andwherein the inter-quartile range is a difference between the first quartile and the third quartile;identifying a lower bound for the second set of testing data by subtracting from the first quartile a first amount equal to the inter-quartile range scaled by a predetermined value; andidentifying an upper bound for the second set of testing data by adding to the third quartile a second amount equal to the inter-quartile range scaled by the predetermined value.
- The method of claim 7, wherein classifying the first testing data point in the respective group as an anomaly is further based on determining that the first testing data point does not fall between the lower bound and the upper bound.
- The method of claim 7,
wherein in response to determining that a number of data points in the second set of testing data is an even number 2n, the method further comprises:setting the first quartile as a median of n smallest data points in the second set; andsetting the third quartile as a median of n largest data points in the second set; andwherein in response to determining that a number of data points in the second set of testing data is an odd number 2m+1, the method further comprises:setting the first quartile as a median of m smallest data points in the second set;setting the third quartile as a median of m largest data points in the second set; andsetting the second quartile as an ordinary median of data points in the second set. - A computer system for facilitating anomaly detection, the computer system comprising:a processor; anda storage device storing instructions that when executed by the processor cause the processor to perform a method, the method comprising:determining, by the computer system, a set of testing data which includes a plurality of data points, wherein the set includes a data series for a first variable and one or more second variables, and wherein the one or more second variables are dependent on the first variable;dividing the set of testing data into a number of groups based on a type of the data series;determining an inter-quartile range for a respective group; andclassifying a first testing data point in the respective group as an anomaly based on the inter-quartile range for the respective group,thereby enhancing data mining and outlier detection for the data series for multiple variables.
- The computer system of claim 10, wherein the method further comprises:performing, by a user of the computer system, an action to address the classified anomaly,wherein the action includes one or more of:a remedial or corrective action to ensure that the classified anomaly no longer occurs;adjusting a physical parameter which affects the first variable or the one or more second variables; andadjusting a physical component of a device from which the data series is obtained.
- The computer system of claim 11, wherein the method further comprises:receiving, by the computing device, a request to detect anomalies for a new set of testing data, wherein the new set includes a new data series for the first variable and the one or more second variables,wherein the new set of testing data is obtained by the computing device subsequent to the user performing the action to address the classified anomaly;dividing the new set of testing data into a same number of new groups as the number of groups of the set of testing data;determining an inter-quartile range for a respective new group which corresponds to the respective group in which the first testing data point was classified as an anomaly; anddetermining whether the first testing data point in the respective group still occurs in the respective new group, which indicates whether the action performed by the user to address the classified anomaly is successful or not.
- The computer system of claim 10, wherein dividing the set of testing data into the number of groups is based on one or more of:an automatic process which is based on an algorithm;a resolution of a sensor or a machine involved in obtaining the set of testing data;previous or historical data relating to the set of testing data, wherein the previous or historical data is obtained by the computing device;prior or historical knowledge of a user of the computing device, wherein the prior or historical knowledge is related to the set of testing data and is obtained by the user of the computing device; anddecomposing a data distribution of the set of testing data based on a component which is representative of key variables for a higher-dimensional data set, wherein the component includes one or more of a principal component, a derived combination of components, and a linear combination of components,wherein determining the inter-quartile range for the respective group further comprises performing an inter-quartile analysis based on the component.
- The computer system of claim 10, wherein dividing the set of testing data and determining the inter-quartile range for the respective group further comprise:
automatically classifying a normal distribution in the set of testing data based on multiple dependent variables across the divided groups in the set of testing data, including a presence of testing data points which are classified as an anomaly. - The computer system of claim 10,
wherein the data series comprises time-series data for the first variable and the one or more second variables,
wherein the time-series data for the first variable is an objective of the anomaly detection, and
wherein the time-series data for the one or more second variables affects the time-series data for the first variable. - The computer system of claim 10, wherein determining the inter-quartile range for the respective group further comprises:dividing a second set of testing data in the respective group into four parts based on a median of the second set of testing data,wherein three values which separate the four parts are a first quartile, a second quartile, and a third quartile, andwherein the inter-quartile range is a difference between the first quartile and the third quartile;identifying a lower bound for the second set of testing data by subtracting from the first quartile a first amount equal to the inter-quartile range scaled by a predetermined value; andidentifying an upper bound for the second set of testing data by adding to the third quartile a second amount equal to the inter-quartile range scaled by the predetermined value.
- The computer system of claim 16, wherein classifying the first testing data point in the respective group as an anomaly is further based on determining that the first testing data point does not fall between the lower bound and the upper bound.
- The computer system of claim 16,
wherein in response to determining that a number of data points in the second set of testing data is an even number 2n, the method further comprises:setting the first quartile as a median of n smallest data points in the second set; andsetting the third quartile as a median of n largest data points in the second set; andwherein in response to determining that a number of data points in the second set of testing data is an odd number 2m+1, the method further comprises:setting the first quartile as a median of m smallest data points in the second set;setting the third quartile as a median of m largest data points in the second set; andsetting the second quartile as an ordinary median of data points in the second set. - A non-transitory computer-readable storage medium storing instructions that when executed by a computer cause the computer to perform a method, the method comprising:determining, by the computer, a set of testing data which includes a plurality of data points, wherein the set includes a data series for a first variable and one or more second variables, and wherein the one or more second variables are dependent on the first variable;dividing the set of testing data into a number of groups based on a type of the data series;determining an inter-quartile range for a respective group; andclassifying a first testing data point in the respective group as an anomaly based on the inter-quartile range for the respective group,thereby enhancing data mining and outlier detection for the data series for multiple variables.
- The storage medium of claim 19, wherein the method further comprises:performing, by a user of the computer, an action to address the classified anomaly, wherein the action includes one or more of:a remedial or corrective action to ensure that the classified anomaly no longer occurs;adjusting a physical parameter which affects the first variable or the second variable; andadjusting a physical component of a device from which the time-series data is obtained;receiving, by the computer, a request to detect anomalies for a new set of testing data, wherein the new set includes a new data series for the first variable and the one or more second variables,wherein the new set of testing data is obtained by the computing device subsequent to the user performing the action to address the classified anomaly;dividing the new set of testing data into a same number of new groups as the number of groups of the set of testing data;determining an inter-quartile range for a respective new group which corresponds to the respective group in which the first testing data point was classified as an anomaly; anddetermining whether the first testing data point in the respective group still occurs in the respective new group, which indicates whether the action performed by the user to address the classified anomaly is successful or not.
Applications Claiming Priority (1)
| Application Number | Priority Date | Filing Date | Title |
|---|---|---|---|
| US16/143,223 US11157346B2 (en) | 2018-09-26 | 2018-09-26 | System and method for binned inter-quartile range analysis in anomaly detection of a data series |
Publications (1)
| Publication Number | Publication Date |
|---|---|
| EP3629197A1 true EP3629197A1 (en) | 2020-04-01 |
Family
ID=68165425
Family Applications (1)
| Application Number | Title | Priority Date | Filing Date |
|---|---|---|---|
| EP19199413.6A Ceased EP3629197A1 (en) | 2018-09-26 | 2019-09-24 | System and method for binned inter-quartile range analysis in anomaly detection of a data series |
Country Status (3)
| Country | Link |
|---|---|
| US (1) | US11157346B2 (en) |
| EP (1) | EP3629197A1 (en) |
| JP (1) | JP7346176B2 (en) |
Cited By (1)
| Publication number | Priority date | Publication date | Assignee | Title |
|---|---|---|---|---|
| WO2022001379A1 (en) * | 2020-07-02 | 2022-01-06 | 上海电气风电集团股份有限公司 | Data processing method, and performance evaluation method and system of wind generating set |
Families Citing this family (6)
| Publication number | Priority date | Publication date | Assignee | Title |
|---|---|---|---|---|
| US20220176943A1 (en) * | 2020-12-07 | 2022-06-09 | Ford Global Technologies, Llc | Detecting vehicle presence at a site |
| CN112883056B (en) * | 2021-03-11 | 2023-08-11 | 杭州广立微电子股份有限公司 | Semiconductor test data processing method and device |
| CN115188186B (en) * | 2022-06-28 | 2024-02-20 | 公安部交通管理科学研究所 | Method for monitoring traffic flow in area |
| CN115098740B (en) * | 2022-07-25 | 2022-11-04 | 广州市海捷计算机科技有限公司 | Data quality detection method and device based on multi-source heterogeneous data source |
| CN115858894B (en) * | 2023-02-14 | 2023-05-16 | 温州众成科技有限公司 | Visual big data analysis method |
| CN116070150B (en) * | 2023-03-06 | 2023-06-09 | 济南市计量检定测试院 | Abnormality monitoring method based on operation parameters of breathing machine |
Citations (5)
| Publication number | Priority date | Publication date | Assignee | Title |
|---|---|---|---|---|
| WO2007098426A2 (en) * | 2006-02-17 | 2007-08-30 | Test Advantage, Inc. | Methods and apparatus for data analysis |
| US8417477B2 (en) * | 2001-05-24 | 2013-04-09 | Test Acuity Solutions, Inc. | Methods and apparatus for local outlier detection |
| US20140269339A1 (en) * | 2013-03-13 | 2014-09-18 | Telekom Malaysia Berhad | System for analysing network traffic and a method thereof |
| EP3156941A1 (en) * | 2015-10-12 | 2017-04-19 | Siemens Aktiengesellschaft | System, method and a computer program product for analyzing data |
| US20170193078A1 (en) * | 2016-01-06 | 2017-07-06 | International Business Machines Corporation | Hybrid method for anomaly Classification |
Family Cites Families (27)
| Publication number | Priority date | Publication date | Assignee | Title |
|---|---|---|---|---|
| DE19811574A1 (en) * | 1998-03-17 | 1999-09-23 | Siemens Ag | Vehicle internal combustion (IC) engine catalyst functionability monitoring method |
| US20030191723A1 (en) * | 2002-03-28 | 2003-10-09 | Foretich James Christopher | System and method for valuing real property |
| US20070257017A1 (en) * | 2006-05-04 | 2007-11-08 | Deangelis Alfred R | Calibrated thermal sensing system |
| US8014880B2 (en) * | 2006-09-29 | 2011-09-06 | Fisher-Rosemount Systems, Inc. | On-line multivariate analysis in a distributed process control system |
| US7919973B2 (en) * | 2007-06-22 | 2011-04-05 | Microchip Technology Incorporated | Method and apparatus for monitoring via's in a semiconductor fab |
| JP5609176B2 (en) * | 2010-03-12 | 2014-10-22 | 富士通株式会社 | Configuration method and configuration control circuit |
| EP2543840B1 (en) * | 2011-07-06 | 2015-01-28 | Ford Global Technologies, LLC | Method for estimating the actual efficiency of catalysts placed in an exhaust path of a combustion engine during the operation time |
| US8688620B2 (en) * | 2011-09-23 | 2014-04-01 | Hewlett-Packard Development Company, L.P. | Anomaly detection in data centers |
| US8914317B2 (en) * | 2012-06-28 | 2014-12-16 | International Business Machines Corporation | Detecting anomalies in real-time in multiple time series data with automated thresholding |
| WO2015095974A1 (en) * | 2013-12-27 | 2015-07-02 | Metafor Software Inc. | System and method for anomaly detection in information technology operations |
| US20180268264A1 (en) * | 2015-01-28 | 2018-09-20 | Hewlett Packard Enterprise Development Lp | Detecting anomalous sensor data |
| JP6313730B2 (en) * | 2015-04-10 | 2018-04-18 | タタ コンサルタンシー サービシズ リミテッドTATA Consultancy Services Limited | Anomaly detection system and method |
| US9747152B2 (en) * | 2015-04-27 | 2017-08-29 | Splunk Inc. | Tracking incomplete transactions in correlation with application errors |
| EP3096253A1 (en) * | 2015-05-19 | 2016-11-23 | Universidad de Vigo | System, computer-implemented method and computer program product for individualized multiple-disease quantitative risk assessment |
| US10042697B2 (en) * | 2015-05-28 | 2018-08-07 | Oracle International Corporation | Automatic anomaly detection and resolution system |
| US9913583B2 (en) * | 2015-07-01 | 2018-03-13 | Rememdia LC | Health monitoring system using outwardly manifested micro-physiological markers |
| US10472206B2 (en) * | 2015-12-04 | 2019-11-12 | Otis Elevator Company | Sensor failure detection and fusion system for a multi-car ropeless elevator system |
| US9753935B1 (en) * | 2016-08-02 | 2017-09-05 | Palantir Technologies Inc. | Time-series data storage and processing database system |
| US11165856B2 (en) * | 2017-04-25 | 2021-11-02 | Citrix Systems, Inc. | Detecting uneven load balancing through multi-level outlier detection |
| US10216695B1 (en) * | 2017-09-21 | 2019-02-26 | Palantir Technologies Inc. | Database system for time series data storage, processing, and analysis |
| US20190102361A1 (en) * | 2017-09-29 | 2019-04-04 | Linkedin Corporation | Automatically detecting and managing anomalies in statistical models |
| US10867455B2 (en) * | 2017-10-20 | 2020-12-15 | Appliedea, Inc. | Diagnostics, prognostics, and health management for vehicles using kinematic clusters, behavioral sensor data, and maintenance impact data |
| US10496460B2 (en) * | 2017-11-15 | 2019-12-03 | Bank Of America Corporation | System for technology anomaly detection, triage and response using solution data modeling |
| US10929258B1 (en) * | 2017-12-21 | 2021-02-23 | Innovative Defense Technologies, LLC | Method and system for model-based event-driven anomalous behavior detection |
| JP7019796B2 (en) * | 2018-03-30 | 2022-02-15 | 株式会社日立製作所 | Physical function independence support device and its method |
| US10832196B2 (en) * | 2018-08-31 | 2020-11-10 | Kinaxis Inc. | Analysis and correction of supply chain design through machine learning |
| US11061915B2 (en) * | 2018-10-25 | 2021-07-13 | Palo Alto Research Center Incorporated | System and method for anomaly characterization based on joint historical and time-series analysis |
-
2018
- 2018-09-26 US US16/143,223 patent/US11157346B2/en active Active
-
2019
- 2019-09-04 JP JP2019160779A patent/JP7346176B2/en active Active
- 2019-09-24 EP EP19199413.6A patent/EP3629197A1/en not_active Ceased
Patent Citations (5)
| Publication number | Priority date | Publication date | Assignee | Title |
|---|---|---|---|---|
| US8417477B2 (en) * | 2001-05-24 | 2013-04-09 | Test Acuity Solutions, Inc. | Methods and apparatus for local outlier detection |
| WO2007098426A2 (en) * | 2006-02-17 | 2007-08-30 | Test Advantage, Inc. | Methods and apparatus for data analysis |
| US20140269339A1 (en) * | 2013-03-13 | 2014-09-18 | Telekom Malaysia Berhad | System for analysing network traffic and a method thereof |
| EP3156941A1 (en) * | 2015-10-12 | 2017-04-19 | Siemens Aktiengesellschaft | System, method and a computer program product for analyzing data |
| US20170193078A1 (en) * | 2016-01-06 | 2017-07-06 | International Business Machines Corporation | Hybrid method for anomaly Classification |
Cited By (1)
| Publication number | Priority date | Publication date | Assignee | Title |
|---|---|---|---|---|
| WO2022001379A1 (en) * | 2020-07-02 | 2022-01-06 | 上海电气风电集团股份有限公司 | Data processing method, and performance evaluation method and system of wind generating set |
Also Published As
| Publication number | Publication date |
|---|---|
| JP2020053036A (en) | 2020-04-02 |
| JP7346176B2 (en) | 2023-09-19 |
| US20200097351A1 (en) | 2020-03-26 |
| US11157346B2 (en) | 2021-10-26 |
Similar Documents
| Publication | Publication Date | Title |
|---|---|---|
| EP3629197A1 (en) | System and method for binned inter-quartile range analysis in anomaly detection of a data series | |
| US10068176B2 (en) | Defect prediction method and apparatus | |
| EP3644184A1 (en) | System and method for anomaly characterization based on joint historical and time-series analysis | |
| JP2017126363A (en) | Operation management device, operation management method, and program | |
| JP6871877B2 (en) | Information processing equipment, information processing methods and computer programs | |
| KR101733708B1 (en) | Method and system for rating measured values taken from a system | |
| JP2018169994A (en) | Information processing device, information processing method, and computer program | |
| US20230125203A1 (en) | Network anomaly detection | |
| GB2593735A (en) | Network Anomaly Detection | |
| US20190064789A1 (en) | System analyzing device, system analyzing method, and computer-readable recording medium | |
| US20190004923A1 (en) | Non-transitory computer-readable storage medium, display control method, and display control device | |
| CN110471945B (en) | Active data processing method, system, computer equipment and storage medium | |
| JP2007164346A (en) | Decision tree changing method, abnormality determination method, and program | |
| US10372719B2 (en) | Episode mining device, method and non-transitory computer readable medium of the same | |
| JP7315022B2 (en) | Machine learning device, machine learning method, and machine learning program | |
| WO2017110996A1 (en) | Log analysis system, log analysis method, and recording medium storing program | |
| CN109710476B (en) | System interface robustness testing method and device | |
| US9054995B2 (en) | Method of detecting measurements in service level agreement based systems | |
| Behzadi et al. | Dependency anomaly detection for heterogeneous time series: A Granger-Lasso approach | |
| US20190197046A1 (en) | Operational status classification device | |
| CN116859272A (en) | Battery capacity variation detection method, device, computer equipment and storage medium | |
| CN114167223B (en) | Power supply abnormity detection method and device and computer readable storage medium | |
| JP6973445B2 (en) | Display method, display device, and program | |
| CN115086156B (en) | Method for positioning abnormal application in storage area network | |
| JP7318711B2 (en) | Anomaly detection device, anomaly detection method, and program |
Legal Events
| Date | Code | Title | Description |
|---|---|---|---|
| PUAI | Public reference made under article 153(3) epc to a published international application that has entered the european phase |
Free format text: ORIGINAL CODE: 0009012 |
|
| STAA | Information on the status of an ep patent application or granted ep patent |
Free format text: STATUS: THE APPLICATION HAS BEEN PUBLISHED |
|
| AK | Designated contracting states |
Kind code of ref document: A1 Designated state(s): AL AT BE BG CH CY CZ DE DK EE ES FI FR GB GR HR HU IE IS IT LI LT LU LV MC MK MT NL NO PL PT RO RS SE SI SK SM TR |
|
| AX | Request for extension of the european patent |
Extension state: BA ME |
|
| STAA | Information on the status of an ep patent application or granted ep patent |
Free format text: STATUS: REQUEST FOR EXAMINATION WAS MADE |
|
| 17P | Request for examination filed |
Effective date: 20201001 |
|
| RBV | Designated contracting states (corrected) |
Designated state(s): AL AT BE BG CH CY CZ DE DK EE ES FI FR GB GR HR HU IE IS IT LI LT LU LV MC MK MT NL NO PL PT RO RS SE SI SK SM TR |
|
| STAA | Information on the status of an ep patent application or granted ep patent |
Free format text: STATUS: EXAMINATION IS IN PROGRESS |
|
| 17Q | First examination report despatched |
Effective date: 20211021 |
|
| STAA | Information on the status of an ep patent application or granted ep patent |
Free format text: STATUS: THE APPLICATION HAS BEEN REFUSED |
|
| 18R | Application refused |
Effective date: 20230728 |