EP3627478A1 - Data processing apparatus and method, program, and method for data processing system - Google Patents
Data processing apparatus and method, program, and method for data processing system Download PDFInfo
- Publication number
- EP3627478A1 EP3627478A1 EP19197460.9A EP19197460A EP3627478A1 EP 3627478 A1 EP3627478 A1 EP 3627478A1 EP 19197460 A EP19197460 A EP 19197460A EP 3627478 A1 EP3627478 A1 EP 3627478A1
- Authority
- EP
- European Patent Office
- Prior art keywords
- data
- sensor
- information
- sets
- sensor data
- Prior art date
- Legal status (The legal status is an assumption and is not a legal conclusion. Google has not performed a legal analysis and makes no representation as to the accuracy of the status listed.)
- Ceased
Links
Images






Classifications
-
- G—PHYSICS
- G06—COMPUTING OR CALCULATING; COUNTING
- G06F—ELECTRIC DIGITAL DATA PROCESSING
- G06F16/00—Information retrieval; Database structures therefor; File system structures therefor
- G06F16/20—Information retrieval; Database structures therefor; File system structures therefor of structured data, e.g. relational data
- G06F16/24—Querying
- G06F16/245—Query processing
- G06F16/2457—Query processing with adaptation to user needs
-
- G—PHYSICS
- G06—COMPUTING OR CALCULATING; COUNTING
- G06F—ELECTRIC DIGITAL DATA PROCESSING
- G06F15/00—Digital computers in general; Data processing equipment in general
- G06F15/02—Digital computers in general; Data processing equipment in general manually operated with input through keyboard and computation using a built-in program, e.g. pocket calculators
- G06F15/0225—User interface arrangements, e.g. keyboard, display; Interfaces to other computer systems
-
- G—PHYSICS
- G06—COMPUTING OR CALCULATING; COUNTING
- G06F—ELECTRIC DIGITAL DATA PROCESSING
- G06F15/00—Digital computers in general; Data processing equipment in general
- G06F15/02—Digital computers in general; Data processing equipment in general manually operated with input through keyboard and computation using a built-in program, e.g. pocket calculators
-
- G—PHYSICS
- G06—COMPUTING OR CALCULATING; COUNTING
- G06F—ELECTRIC DIGITAL DATA PROCESSING
- G06F15/00—Digital computers in general; Data processing equipment in general
- G06F15/02—Digital computers in general; Data processing equipment in general manually operated with input through keyboard and computation using a built-in program, e.g. pocket calculators
- G06F15/0208—Digital computers in general; Data processing equipment in general manually operated with input through keyboard and computation using a built-in program, e.g. pocket calculators for combination with other devices having a different main function, e.g. watches, pens
-
- G—PHYSICS
- G06—COMPUTING OR CALCULATING; COUNTING
- G06F—ELECTRIC DIGITAL DATA PROCESSING
- G06F15/00—Digital computers in general; Data processing equipment in general
- G06F15/02—Digital computers in general; Data processing equipment in general manually operated with input through keyboard and computation using a built-in program, e.g. pocket calculators
- G06F15/025—Digital computers in general; Data processing equipment in general manually operated with input through keyboard and computation using a built-in program, e.g. pocket calculators adapted to a specific application
- G06F15/0275—Digital computers in general; Data processing equipment in general manually operated with input through keyboard and computation using a built-in program, e.g. pocket calculators adapted to a specific application for measuring
-
- G—PHYSICS
- G06—COMPUTING OR CALCULATING; COUNTING
- G06F—ELECTRIC DIGITAL DATA PROCESSING
- G06F15/00—Digital computers in general; Data processing equipment in general
- G06F15/02—Digital computers in general; Data processing equipment in general manually operated with input through keyboard and computation using a built-in program, e.g. pocket calculators
- G06F15/025—Digital computers in general; Data processing equipment in general manually operated with input through keyboard and computation using a built-in program, e.g. pocket calculators adapted to a specific application
- G06F15/0283—Digital computers in general; Data processing equipment in general manually operated with input through keyboard and computation using a built-in program, e.g. pocket calculators adapted to a specific application for data storage and retrieval
-
- G—PHYSICS
- G06—COMPUTING OR CALCULATING; COUNTING
- G06Q—INFORMATION AND COMMUNICATION TECHNOLOGY [ICT] SPECIALLY ADAPTED FOR ADMINISTRATIVE, COMMERCIAL, FINANCIAL, MANAGERIAL OR SUPERVISORY PURPOSES; SYSTEMS OR METHODS SPECIALLY ADAPTED FOR ADMINISTRATIVE, COMMERCIAL, FINANCIAL, MANAGERIAL OR SUPERVISORY PURPOSES, NOT OTHERWISE PROVIDED FOR
- G06Q50/00—Information and communication technology [ICT] specially adapted for implementation of business processes of specific business sectors, e.g. utilities or tourism
- G06Q50/10—Services
- G06Q50/20—Education
- G06Q50/205—Education administration or guidance
-
- G—PHYSICS
- G09—EDUCATION; CRYPTOGRAPHY; DISPLAY; ADVERTISING; SEALS
- G09B—EDUCATIONAL OR DEMONSTRATION APPLIANCES; APPLIANCES FOR TEACHING, OR COMMUNICATING WITH, THE BLIND, DEAF OR MUTE; MODELS; PLANETARIA; GLOBES; MAPS; DIAGRAMS
- G09B5/00—Electrically-operated educational appliances
- G09B5/02—Electrically-operated educational appliances with visual presentation of the material to be studied, e.g. using film strip
-
- G—PHYSICS
- G09—EDUCATION; CRYPTOGRAPHY; DISPLAY; ADVERTISING; SEALS
- G09B—EDUCATIONAL OR DEMONSTRATION APPLIANCES; APPLIANCES FOR TEACHING, OR COMMUNICATING WITH, THE BLIND, DEAF OR MUTE; MODELS; PLANETARIA; GLOBES; MAPS; DIAGRAMS
- G09B5/00—Electrically-operated educational appliances
- G09B5/08—Electrically-operated educational appliances providing for individual presentation of information to a plurality of student stations
- G09B5/12—Electrically-operated educational appliances providing for individual presentation of information to a plurality of student stations different stations being capable of presenting different information simultaneously
- G09B5/125—Electrically-operated educational appliances providing for individual presentation of information to a plurality of student stations different stations being capable of presenting different information simultaneously the stations being mobile
Definitions
- the technical field relates to a data processing apparatus and method, program, and a method for data processing system for displaying at once, for example, a plurality of data items obtained separately by a plurality of sensors.
- a graphing scientific calculator is a calculator capable of drawing graphs, calculating simultaneous equations, and performing calculation using variables. This type of graphing scientific calculator has a display for displaying a few lines of text or a graph of a calculation result. A graphing scientific calculator is thus provided with a calculation function and a display function.
- a graphing scientific calculator having a function for direct or indirect connection to a sensor has been manufactured in recent years.
- this type of graphing scientific calculator when, for example, a sensor-connected data logger is connected, sensor data detected by the sensor can be acquired after the necessary settings are made.
- Jpn. Pat. Appln. KOKAI Publication No. 2003-281671 discloses a data logger capable of controlling automatic measurement, and reading, editing, and transmitting measurement conditions.
- a teacher checks if the experiment has been appropriately conducted by each student or group of students through receiving, with his or her own device, sensor data acquired during the experiment, which is transmitted from each student or each group of students, and then checking a result of the experiment. Furthermore, a teacher causes the display of the student terminals to display a list of the experiment results from each student (or some of the students who participate in the experiment) or each group, in a form of graphs generated from sensor data, for example. It is thereby possible for the students who participate in the experiment to check or compare the experiment results acquired by other students or groups.
- each student or a representative of each group acquires sensor data detected by the sensor, and transmits the acquired sensor data to the teacher terminal with the use of a graphic scientific calculator in which an application such as the aforementioned is installed.
- Such transmission of sensor data from the graphic scientific calculator can be directly made to the teacher terminal, if the graphing scientific calculator is provided with a communication function.
- the transmission of sensor data can be achieved by generating a QR code (registered trademark) corresponding to the sensor data, reading the QR code by a smart phone or a tablet device, and transmitting the sensor data to a teacher terminal from the calculator itself as a proxy.
- QR code registered trademark
- a teacher first needs to check if the sensor data transmitted from a student is sensor data relating to a currently-conducted class.
- an experiment under the same theme may be conducted in another class of which the same teacher is in charge. In such a case, sensor data relating to the same theme would be transmitted from a student in another class. In another case, an experiment under a different theme may be conducted in the same class on a different day. In such a case, sensor data relating to the different theme would be transmitted from a student of the same class.
- the present invention is proposed in view of such circumstances, and an objective of the present invention is to provide a data processing apparatus and method, a program, and a method for a data processing system capable of automatically determining whether or not sensor data transmitted from a plurality of transmission sources are desired sensor data.
- a data processing apparatus including a processor, the processor is configured to: receive one or more sets of data output from at least one data output apparatus via a communication network, each set of the data including sensor data obtained by at least one sensor and first specifying information that specifies the data processing apparatus; determine whether or not the first specifying information included in the received one or more sets of data satisfies a predetermined condition; classify the one or more sets of data determined to satisfy the condition into a same group; and generate and output an output file based on the one or more sets of data classified into the same group.
- a data processing method performed by a processor of a data processing apparatus, the method includes: receiving one or more sets of data output from at least one data output apparatus via a communication network, each set of the data including sensor data obtained by at least one sensor and first specifying information that specifies the data processing apparatus; determining whether or not the first specifying information included in the received one or more sets of data satisfies a predetermined condition; classifying the one or more sets of data determined to satisfy the condition into a same group; and generating and outputting an output file based on the one or more sets of data classified into the same group.
- a program which instructs a controller of a data processing apparatus to perform: receiving one or more sets of data output from each of a plurality of information processing terminal via a communication network, the data processing apparatus and the plurality of information processing terminal being communicably connected to the data processing apparatus via the communication network, each set of the data including sensor data obtained by at least one sensor and first specifying information that specifies the data processing apparatus; determining whether or not the first specifying information included in the received one or more sets of data satisfies a predetermined condition; classifying the one or more sets of data determined to satisfy the condition into a same group; and generating and outputting an output file based on the one or more sets of data classified into the same group.
- a method performed by a data processing system that includes a data processing apparatus, and a plurality of information processing terminals being communicably connected to the data processing apparatus via a communication network, the method includes: each controller of the information processing terminals: transmitting one or more sets of data via the communication network, each set of the data including sensor data acquired by at least one sensor and first specifying information that specifies the data processing apparatus; a controller of the data processing apparatus: receiving the one or more sets of data output from each of the information processing terminals via the communication network; determining whether or not the first specifying information included in the received one or more sets of data satisfies a predetermined condition; classifying the one or more sets of data determined to satisfy the condition into a same group; and generating and outputting an output file based on the one or more sets of data classified into the same group.
- a program, and a method for a data processing system of the present invention it is possible to automatically determine whether or not sensor data transmitted from a plurality of transmission sources is desired sensor data.
- a display system according to a first embodiment will be described.
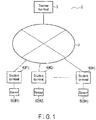
- FIG. 1 is a conceptual drawing showing a configuration example of a display system according to a first embodiment.
- the display system 1 consists of a teacher terminal 3 and a plurality of student terminals 4 (#1 through #n) which are connected via a communication network 2, such as the Internet or a school intranet.
- the teacher terminal 3 herein is a device used by teacher A who is in charge of an experiment conducted by the students of class B.
- the student terminals 4 (#1 through #n) are devices used by the students of class B during the experiment.
- the student terminal 4 is a device that transmits sensor data obtained by a sensor 50 (a result of detection by the sensor 50) to the teacher terminal 3 via the communication network 2, and can be realized by, for example, an electronic device, such as a graphing scientific calculator 10 shown in FIG. 2 .
- FIG. 2 is a front view of an appearance constitution of the graphing scientific calculator 10 which is an example of an electronic device that may be used as a student terminal 4.
- a graphing scientific calculator 10 such as the one shown in FIG. 2 will be explained as the student terminal 4; however, the student terminal 4 is not limited to the graphing scientific calculator 10, and may be configured as an electronic device, such as a tablet device, a personal computer, a smart phone, a mobile phone, a touch panel-type personal digital assistants (PDA), an electronic book, or a mobile game player, etc.
- an electronic device such as a tablet device, a personal computer, a smart phone, a mobile phone, a touch panel-type personal digital assistants (PDA), an electronic book, or a mobile game player, etc.
- PDA personal digital assistants
- An electronic device such as a tablet device not equipped with physical keys (buttons) like those provided in the graphing scientific calculator 10, displays a software keyboard similar to the keys of the graphing scientific calculator 10, and performs processing in response to key operations on the software keyboard.
- the graphing scientific calculator 10 comes in a small size out of a need of portability so that a user can easily hold and operate it in one hand, and is provided with a key input unit 11 and a display 12 on its main body front surface.
- a number and mathematical symbol key group 111 for inputting numerical values, mathematical expressions, and program commands and for instructing execution of calculation or a program
- a mathematical function key group 112 for inputting various functions and for activating a memory function
- a mode setting key group 113 for causing a display of a menu screen in various operation modes, such as a calculation mode and an algorithm mode, and for instructing setting of these operation modes
- the function key group 114 for activating various functions displayed along the bottom of the display 12 by one-time key operation
- a cursor key 115 for moving a cursor displayed on the display 12 and selecting data items.
- [F1] key through [F6] key are arranged.
- Pressing the [SHIFT] key followed by any key of the number and mathematical symbol key group 111, the mathematical function key group 112, the mode setting key group 113, or the function key group 114 performs an alternate function indicated above the key, not the function indicated on the keycap.
- pressing the [SHIFT] key followed by the [AC] key hereinafter, such a key operation will be written as "[SHIFT] + [AC]" function as the [OFF] ("power off”) key.
- Pressing [SHIFT] + [MENU] functions as the [SET UP] ("set up") key
- pressing [SHIFT] + [F3] key functions as the [V-Window] ("view window”; instruction to display a drawing region setting screen) key.
- the display 12 is composed of a dot-matrix type liquid crystal display unit, for example. If the student terminal 4 is a tablet device, the display 12 is composed of a liquid crystal display unit provided with a touch panel thereon.
- the display 12 displays, in a form of graph, a result of computation obtained by executing a data acquisition program (the data acquisition program 22a shown in FIG. 3 , which will be described later) on sensor data detected by the sensor 50.
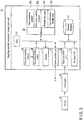
- FIG. 3 is a block diagram illustrating a configuration example of an electronic circuit of the graphing scientific calculator 10.
- the electronic circuit of the graphing scientific calculator 10 includes a CPU 21 which is a computer, a memory 22, a recording medium reader 24, a communication unit 25, a data acquisition unit 26, and a network database 27.
- the CPU 21 controls operations in each part of the circuit in accordance with the data acquisition program 22a and the information addition program 22b stored in the memory 22, and executes various computing processing in accordance with a key input signal from the key input unit 11.
- the data acquisition program 22a and the information addition program 22b may be either stored in the memory 22 in advance, or read from an external recording medium 23, such as a memory card, via the recording medium reader 24, and stored in the memory 22.
- the data acquisition program 22a and the information addition program 22b are write-protected from a user's operation on the key input unit 11.
- a writable data area 22c is reserved for storing data, such as various data consisting of key-code data subsequently-input through the keys of the key input unit 11, and intermediate data generated by processing performed by the data acquisition program 22a and the information addition program 22b.
- the user information storage area 22d is also reserved in the memory 22; it is thus possible to store information of students who use the graphing scientific calculator 10 (user information) prior to, for example, the start of an experiment.
- the user information consists of, at least one of a student's name, a group conducting an experiment (an experiment group to which a student belongs), or a class to which a student belongs.
- the graphing scientific calculator 10 (the student terminal 4) configured as described above realizes the functions described below when the CPU 21 controls the operations in each part of the circuit in accordance with an instruction written by the data acquisition program 22a and the information addition program 22b, in such a manner that hardware and software operate in conjunction with each other.
- the data acquisition unit 26 communicates with the data logger 40 via a wire or wirelessly.
- One or more sensors 50 are connected to the data logger 40. Examples of the sensor 50 include a temperature sensor, a voltage sensor, an electric current sensor, a pH sensor, an audio sensor, a photo gate sensor, and a pressure sensor, and the like; however, the examples are not limited thereto.
- One or more sensors 50 can be connected to the data logger 40, and if connected, a sensor type of each connected sensor 50 is recognized, and sensor type information as a result of the recognition is transmitted to the data acquisition unit 26.
- the sensor data detected by each sensor 50 is acquired from each sensor 50, and the acquired sensor data is transmitted to the data acquisition unit 26.
- the data logger 40 may have a storing function (not shown) for temporarily storing the sensor data acquired from the sensor 50 before sending it to the data acquisition unit 26.
- the data acquisition unit 26 Upon receipt of the sensor type information and sensor data transmitted from the data logger 40, the data acquisition unit 26 generates a time stamp, and outputs the generated time stamp to the data acquisition program 22a, along with the received sensor type information and sensor data.
- the time stamp can be regarded as acquisition time information indicating a time when the sensor data is acquired by the sensor 50.
- the data logger 40 is externally provided in the example shown in FIG. 3 , it may be built in the graphing scientific calculator 10.
- the data acquisition unit 26 can directly obtain from the sensor 50 the sensor data detected by the sensor 50, and if the sensor data can be accumulated in the writable data area 22c, the data logger 40 can be omitted and the sensor 50 can be directly connected to the data acquisition unit 26.
- one teacher may be in charge of all classes, or responsibility for the classes may be shared by a plurality of teachers.
- responsibility for the classes may be shared by a plurality of teachers.
- a teacher terminal such as the teacher terminal 3 and the communication network 2 for a case where an experiment is conducted in a certain class.
- the network database 27 preferably stores a single piece of network identification information for identifying predetermined communication network 2 and teacher terminal 3 as a network and a teacher terminal with which the graphing scientific calculator 10 communicate.
- One communication network 2 with which the graphing scientific calculator 10 communicates can be designated by teacher A in advance, for example.
- a teacher A's designation of a communication network 2 (e.g., the Internet or a school intranet) to be used during an experiment can be conveyed to the students of class B verbally or in writing on a blackboard, and in this case, the students of class B individually set the communication network 2 to be used during an experiment with their student terminals 4 (#1 through #n).
- a communication network 2 e.g., the Internet or a school intranet
- teacher A can inform the students of the communication network 2 to be used in an experiment (for example, the Internet and a school intranet) through delivery of information regarding the communication network 2 to the student terminals 4 (#1 through #n) via an email or a messenger application, etc. Also in this case, the students of class B individually set the communication network 2 to be used during an experiment with their student terminals 4 (#1 through #n).
- the students of class B set the communication network 2 informed by teacher A with their student terminal 4 (#1 through #n)
- the network database 27 may preferably store a plurality of network identification information items for identifying a communication network 2 and a teacher terminal 3 as those with which the graphing scientific calculator 10 communicate.
- the network database 27 may store a plurality of network identification information items for identifying a predetermined teacher terminal, such as the teacher terminal 3, and a communication network 2 with which the graphing scientific calculator 10 communicate.
- the teacher A's determination of a communication network 2 can be informed to the students of class B in a manner similar to the above-described manner.
- the students of class B When the students of class B receive from teacher A an instruction regarding a communication network 2 to be used during an experiment, the students may select and set, based on the instruction, a corresponding combination from multiple combinations of a teacher terminal, such as the teacher terminal 3, and a communication network 2. If the network database 27 stores a plurality of network identification information items, the student terminal 4 may automatically determine and set a combination of a communication network 2 to be used during an experiment by teacher A and the students of class B and the teacher terminal 3, in accordance with a predetermined determination condition, as described above.
- Combinations of a teacher terminal, such as the teacher terminal 3, and a communication network 2 to be used when an experiment is conducted in a predetermined class may be stored in the network database 27 in advance, and when the students of class B receive an instruction from teacher A regarding a communication network 2 to be used, the students may select and set a corresponding combination from the combinations.
- the data acquisition program 22a Upon acquisition of the sensor type information, the sensor data, and the time stamp from the data acquisition unit 26, the data acquisition program 22a acquires network identification information from the network database 27. If the network database 27 stores only a predetermined network identification information item, the data acquisition unit 26 acquires this network identification information.
- the data acquisition program 22a determines the communication network 2 and the teacher terminal 3 with which the graphing scientific calculator 10 should communicate based on at least one of the sensor type information or the time stamp in accordance with a predetermined determination reference, and obtains corresponding network identification information.
- the network identification information in which the teacher terminal 3 of teacher A and its dedicated communication network 2 are designated is network identification information to be acquired from the network database 27.
- FIG. 4 is a drawing showing a data configuration of the network database 27 storing a plurality of network identification information items.
- network identification information including the information specifying the teacher terminal 3 of teacher A and the information specifying the communication network 2 that the students of class B can connect to, as network identification information that needs to be acquired.
- the network database 27 does not necessarily include the other of the time stamp and the sensor type.
- the network database 27 does not have to include both of the time stamp and the sensor type.
- specified network identification information may include at least only minimum information necessary for specifying a group (to be described later), for example information for specifying the teacher terminal 3 of teacher A.
- the data acquisition program 22a further obtains user information from the user information storage area 22d, and outputs the obtained network identification information and user information to the information addition program 22b, along with the sensor type information, the sensor data, and the time stamp.
- the information addition program 22b Upon receipt of the network identification information, sensor type information, sensor data, time stamp, and user information output from the data acquisition program 22a, the information addition program 22b adds the sensor type information, time stamp, network identification information, and user information to the sensor data, and outputs the sensor data to which those information items are added to the communication unit 25.
- the communication unit 25 When the sensor data to which the network identification information, the sensor type information, the time stamp, and the user information are added is output from the information addition program 22b, the communication unit 25 knows the communication network 2 and the teacher terminal 3 from the network identification information added to the sensor data. Then, upon receipt of the sensor data to which the network identification information, the sensor type information, the time stamp, and the user information are added, the communication unit 25 transmits the received sensor data to the teacher terminal 3 via the communication network 2 known from the sensor data.
- FIG. 5 is a block diagram illustrating a configuration example of an electronic circuit of the teacher terminal 3.
- the electronic circuit of the teacher terminal 3 includes a CPU 31 which is a computer, a recording medium reader 32, a display 33, a communication unit 34, a key input unit 35, a memory 36, a determination condition database 37, and a sensor database 38.
- the teacher terminal 3 can also be configured as an electronic device, such as a tablet device, a personal computer, a smart phone, a mobile phone, a touch panel-type personal digital assistant (PDA), an electronic book, or a mobile game player, etc.
- an electronic device such as a tablet device, a personal computer, a smart phone, a mobile phone, a touch panel-type personal digital assistant (PDA), an electronic book, or a mobile game player, etc.
- the memory 36 stores the determination program 36a, the classification program 36b, and the display control program 36c.
- the CPU 31 controls operations in each parts of the circuit in accordance with the determination program 36a, the classification program 36b, and the display control program 36c, and executes various computing processing in accordance with a key input signal from the key input unit 35.
- the determination program 36a, the classification program 36b, and the display control program 36c may be either stored in the memory 36 in advance, or read from an external recording medium 39, such as a memory card, via the recording medium reader 32, and stored in the memory 36.
- the determination program 36a, the classification program 36b, and the display control program 36c are write-protected from a user's operation of the key input unit 35.
- a writable data area 36d is reserved for storing data, such as various data consisting of key-code data subsequently input through the keys of the key input unit 35, and intermediate data generated by processing performed by the determination program 36a, the classification program 36b, and the display control program 36c.
- the functions described below are realized when the CPU 31 controls the operations in each part of the circuit in accordance with an instruction written by the determination program 36a, the classification program 36b, and the display control program 36c in such a manner that hardware and software operate in conjunction with each other.
- the communication unit 34 receives the sensor data transmitted from the student terminal 4 via the communication network 2. As described above, the sensor type information, the time stamp, the network identification information, and the user information are added to the sensor data transmitted from the student terminal 4. Upon receipt of such sensor data, the communication unit 34 outputs the sensor data to the determination program 36a.
- the determination condition database 37 stores determination conditions generated in advance by a user who is in a supervisory position, such as a teacher. As an example of generation of determination conditions, if teacher A wants to collect sensor data obtained in a current-voltage experiment conducted in the class during the second period (from 9:35 a.m. to 10:20 a.m.) of today from the student terminals 4, teacher A generates a determination condition, through operating the key input unit 35 of the teacher terminal 3, in which the following information items are designated: the network identification information including a communication network 2 used by the student terminals 4 and information regarding the teacher terminal 3; the time range of the time stamp (between 9:35 a.m. and 10:20 a.m. of today); and the sensor type information (for example, "multimeter"). The determination conditions thus generated are stored in the determination condition database 37.
- the determination program 36a determines whether or not the sensor type information, the time stamp, and the network identification information satisfy the determination condition by referring to the determination condition stored in the determination condition database 37.
- the determination program 36a determines that the sensor data satisfies the determination condition; otherwise, it is determined that the sensor data does not satisfy the determination condition.
- the determination program 36a Upon determination that the sensor data satisfies the determination condition, the determination program 36a outputs the sensor data to the classification program 36b along with the added information. On the other hand, if it is determined that the sensor data does not satisfy the determination condition, the determination program 36a determines that the sensor data is inappropriate, and discards it.
- the classification program 36b classifies the sensor data output from the determination program 36a into groups, such as classes according to the content of the determination condition used in the determination made in the determination program 36a, that is, the network identification information, the acquisition time information, and the sensor type information. Classification information designating a group (class) is added to each sensor data output from the determination program 36a, and the sensor data is stored in the sensor database 38.
- the teacher would normally cause the determination condition database 37 of the teacher terminal 3 to store many determination conditions.
- the classification program 36b classifies the sensor data into groups through adding, to said sensor data, classification information indicating which determination condition the sensor data satisfies, and thereafter outputs the classified sensor data to the sensor data database 38, causing the database 38 to store the sensor data.
- FIG. 6 is a drawing showing a data configuration of the determination condition database 37
- FIG. 7 is a drawing showing a data configuration of the sensor data database 38.
- the determination condition database 37 includes a determination conditions 371 and classification names 372, which are prepared by a teacher in advance.
- the classification names are group names into which sensor data is classified if the sensor data satisfies a determination condition. With such a data configuration of the determination condition database 37, it is possible to specify a group into which the sensor data is classified, based on the time stamp and sensor type information received from each student terminal 4, and the obtained network identification information.
- the network identification information is uniquely determined regardless of the time stamp and the sensor type information, and the network identification information includes only the information specifying the teacher terminal 3, in other words, does not include information specifying a communication network 2, a group into which the sensor data is classified can be specified based only on the information specifying the teacher terminal 3.
- the sensor data identification information that identifies each of a plurality of sensor data items received from a plurality of the student terminals 4 (in FIG. 7 , student a, b, ...) is associated with identification information of the specified group (class ID), and they are stored in the sensor data database 38 having the data configuration shown in FIG. 7 .
- the display control program 36c acquires the sensor data belonging to the same group, namely a plurality of sensor data items to which the same classification information is added, from the sensor database 38, and displays a list of the graphs generated from the sensor data items on the display 12.
- FIG. 8 is a conceptual drawing showing a display example of a list of a plurality of graphs generated based on the sensor data items belonging to the same class displayed on the display 33 of the teacher terminal 3.
- FIG. 8 shows an example of three voltage-current graphs (a), (b), and (c) generated from the sensor data respectively acquired by three students ( ⁇ , ⁇ , and ⁇ ) in the voltage-current experiment conducted in the same class to provide students' understanding of Ohm's law.
- the voltage-current graph is associated with student's information (user information) based on the sensor data acquired by each student and the user information added to the sensor data, and these are displayed.
- a voltage-current graph corresponding to a result of the experiment conducted by the student ⁇ , and student ⁇ 's information (user information) 33a are displayed together;
- a voltage-current graph corresponding to a result of the experiment conducted by the student ⁇ , and student ⁇ 's information (user information) 33b are displayed together;
- a voltage-current graph corresponding to a result of the experiment conducted by the student ⁇ , and student ⁇ 's information (user information) 33c are displayed together.
- the teacher terminal 3 displays a list of results of the experiment conducted by the students on the display 33.
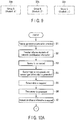
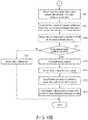
- FIGS. 10A and 10B show a flow chart showing an operation example of the display system 1 according to the first embodiment.
- teacher A first generates, through an operation of the key input unit 35 of the teacher terminal 3, a determination condition in which network identification information C, which in turn includes the information regarding the teacher terminal 3 and the information regarding the communication network 2 to be used by teacher A and the students of class B, a time range of a time stamp (2018:XX:##:09:35:00:00 through 2018:XX:##:10:25:59:59) D, and the sensor type information E (multimeter) are designated, and causes the determination condition database 37 to store the generated condition (S1) .
- Teacher A informs the graphing scientific calculator 10 of each student of class B of the network identification information C through the communication unit 34 of the teacher terminal 3 with the use of, for example, emails or a messenger application, etc., and causes the network database 27 of the graphing scientific calculator 10 of each student to store the network identification information C.
- teacher A informs the students of class B of the network identification information C verbally or via writing on a black board, etc., and each of the students causes the network database 27 of the graphing scientific calculator 10 to store the network identification information C (S2). The preparation before the data acquisition is thus finished.
- step S1 and step S2 show an example in which step S1 and step S2 are performed before the experiment begins; however, step S1 and step S2 may be performed during or after the experiment, as long as the steps are performed before the sensor data is transmitted to the teacher terminal 3.
- a method of storing the network identification information C in the network database 27 of the graphing scientific calculator 10 of each student is not limited to the above-described method, and any appropriate method well known to a person with ordinary skill in the art may be adopted.
- the student may connect the graphing scientific calculator 10 to the communication network 2 (the network 2 informed by teacher A) through a manual operation based on the network identification information C so as to bring the calculator in a state where sensor data, etc. can be transmitted to the teacher terminal 3.
- the data logger 40 is connected to the data acquisition unit 26 of the graphing scientific calculator 10 (student terminal 4), and the sensor 50 is connected to the data logger 40 (S3).
- the sensor 50 is connected to the data logger 40 (S3).
- a multimeter is connected to the data logger 40 as a sensor 50.
- a type of the connected sensor 50 is recognized by the data logger 40, and sensor type information (multimeter) is generated and transmitted to the data acquisition unit 26 as a recognition result (S4).
- sensor data which is a detection result, is transmitted to the data acquisition unit 26 from the sensor 50 (multimeter) via the data logger 40 (S5).
- the data acquisition unit 26 when the sensor type information (multimeter) and the sensor data (a current value and a voltage value) are transmitted from the data logger 40, a time stamp is generated, and the generated time stamp is output to the data acquisition program 22a along with the sensor type information (multimeter) and the sensor data (a current value and a voltage value) (S6).
- the time stamp can be regarded as acquisition time information indicating a time when the sensor data is acquired by the sensor 50.
- the network identification information C is obtained from the network database 27 (S7).
- the present embodiment is not limited to the case where only one network identification information item (e.g., network identification information C) is stored in the network database 27, and a plurality of network identification information items may be stored therein. If a plurality of network identification information items are stored, network identification information, in which a communication network 2 determined based on either the sensor type information or the time stamp, and a teacher terminal 3 are defined, is obtained by the data acquisition program 22a in accordance with a predetermined determination reference. In the foregoing step S2, if the graphing scientific calculator 10 is connected to the communication network 2 informed by teacher A through a manual operation of the student of class B and is in a state where sensor data, etc. can be transmitted to the teacher terminal 3, the network identification information including the information regarding the connected communication network 2 and the teacher terminal 3 of teacher A may be acquired.
- network identification information including the information regarding the connected communication network 2 and the teacher terminal 3 of teacher A may be acquired.
- the network identification information C in which the teacher terminal 3 of teacher A and its dedicated communication network 2 are designated, is network identification information to be acquired by the graphing scientific calculator 10.
- the data acquisition program 22a once the network identification information C is acquired, user information is further acquired from the user information storage area 22d, and the acquired network identification information C and user information are output to the information addition program 22b, along with corresponding sensor information (multimeter), sensor data (a current value and a voltage value) and time stamp.
- the sensor data a current value and a voltage value
- the sensor type information multimeter
- the time stamp the time stamp
- the network identification information C the user information
- the sensor data is then output to the communication unit 25 (S8).
- a communication network 2 to be used by teacher A and the students of class B e.g., the Internet or a school intranet
- a teacher terminal 3 of teacher A e.g., the Internet or a school intranet
- the sensor data to which the network identification information C, the sensor type information (multimeter), the time stamp, and the user information are added
- the graphing scientific calculator 10 is connected to the communication network 2 informed by teacher A through a manual operation of the student of class B and is in a state where sensor data, etc. can be transmitted to the teacher terminal 3, the processing herein of knowing the communication network 2 to be used by teacher A and the students of class B and the teacher terminal 3 of teacher A is omitted.
- the sensor data (a current value and a voltage value) transmitted from the student terminal 4 of a student of class B via the communication network 2 is received by the communication unit 34.
- the sensor type information multimeter
- the time stamp the time stamp
- the network identification information C communication network
- the user information are added, as described above.
- Such sensor data is further output to the determination program 36a from the communication unit 34.
- the determination program 36a determines that the network identification information C, time stamp, and sensor type information added to the sensor data satisfy the determination condition; otherwise, it is determined that those information items do not satisfy the determination condition.
- the sensor data (a current value and a voltage value) is output to the classification program 36b, along with the information items added to the sensor data, namely the network identification information C, the time stamp, the sensor type information (multimeter), and the user information (S13).
- the sensor data is determined not to be appropriate and discarded by the determination program 36a (S12).
- the sensor data (a current vale and a voltage value) output from the determination program 36a is classified into groups (for example, classes) according to the content of the determination condition used in the determination made in the determination program 36a, namely the network identification information C, the acquisition time information, and the sensor type information (multimeter) E (S14). Then, classification information designating a group (class) is added to each sensor data (a current value and a voltage value) output from the determination program 36a, and the sensor data is stored in the sensor database 38. Thus, the sensor data (a current value and a voltage value) is stored in the sensor data database 38 with an identification of a group to which the sensor data belongs (S15) .
- groups for example, classes
- the sensor data (a current value and a voltage value) acquired in the same class is acquired from the sensor data database 38, and a list of graphs generated based on the sensor data is displayed on the display 33, as shown in FIG. 8 for example (S16).
- FIG. 8 is a conceptual drawing showing a display example of a list of graphs generated based on sensor data acquired in a same class on the display 33.
- FIG. 8 shows three voltage-current graphs (a), (b), and (c) generated from the sensor data (a current value and a voltage value) respectively acquired by three students ( ⁇ , ⁇ , and ⁇ ) in the voltage-current experiment in the same class to provide students' understanding of Ohm's law.
- a voltage-current graph corresponding to a result of the experiment conducted by the student ⁇ , and student ⁇ 's information (user information) 33a are together displayed; in the voltage-current graph (b), a voltage-current graph corresponding to a result of the experiment conducted by the student ⁇ , and student ⁇ 's information (user information) 33b are displayed together; and in the voltage-current graph (c), a voltage-current graph corresponding to a result of the experiment conducted by the student ⁇ , and student ⁇ 's information (user information) 33c are displayed together.
- Information of each of students ⁇ , ⁇ , and ⁇ is displayed in the periphery of (above in the present embodiment) the voltage-current graph corresponding to an experiment result obtained by each of students ⁇ , ⁇ , and ⁇ .
- resistors having different resistance values are respectively given to students ⁇ , ⁇ , and ⁇ , and a current and a voltage flowing on serial circuit via the resistor are measured by a multimeter which serves as the sensor 50 and obtained as sensor data.
- the voltage-current graphs (a), (b), and (c) shown in FIG. 8 are generated based on the thus-measured sensor data.
- the display system 1 it is possible to automatically determine, through the above-described operation, whether or not the sensor data transmitted from the student terminals 4 of the students of class B is sensor data acquired in the same class conducted in the same classroom, based on three conditions, namely network identification information, acquisition time information, and sensor type information.
- a display of a list of the graphs on the display 33 allows teacher A to comprehensively check a plurality of voltage-current graphs generated from the sensor data acquired by the students of class B. Consequently, for example, it becomes easy to determine from the displayed user information which student was able to conduct an experiment properly and which student was not. Furthermore, for example, through showing a list of the voltage-current graphs displayed on the display 33 as shown in FIG. 8 to the students of class B, it becomes easier to explain the Ohm's law to the students.
- the display system 1 of the present embodiment it is possible to eliminate teacher's troubles, increase the time used for delivering an effective class, and immediately and easily provide information necessary to aid students' understanding. It is thereby possible to contribute to the realization of more effective class.
- a display system according to a second embodiment will be described.
- the second embodiment is a modification of the first embodiment. Accordingly, repetitive descriptions will be avoided hereinafter, and only differences between the first and second embodiments will be described. For this reason, the same constituent elements will be referred to by the same reference numerals as in the first embodiment.
- FIG. 11 is a conceptual drawing showing a configuration example of a display system 1 according to the second embodiment.
- FIG. 12 is a block diagram of a configuration example of an electronic circuit of a graphing scientific calculator 10 that can be used as a student terminal 4 in the second embodiment.
- FIG. 11 a camera 60, such as a digital camera, is connected to the student terminal 4.
- FIG. 12 shows a configuration in a case where the camera 60 is connected to the graphing scientific calculator 10, which is an example of the student terminal 4.
- FIG. 11 shows the same as FIG. 1 , except that the camera 60 is connected to the student terminal 4.
- FIG. 12 is the same as FIG. 3 , except that the camera 60 is connected to the data acquisition unit 26.
- the camera 60 takes a still picture or a video in accordance with a user's (student's) operation, and the imaging data to which imaging time information is added is output to the data acquisition unit 26.
- the camera 60 is not necessarily connected to the data acquisition unit 26 for the entire duration, and only when imaging data is transferred to the data acquisition unit 26 does the camera 60 need to be connected to the data acquisition unit 26.
- imaging data to which imaging time information is added from the camera 60 to the data acquisition unit 26, in addition to the sensor type information and the sensor data from the data logger 40.
- the data acquisition unit 26 If the data acquisition unit 26 outputs the sensor type information and the sensor data to the data acquisition program 22a along with the time stamp, the data acquisition unit 26 also outputs the imaging data obtained from the camera 60 and to which the imaging time information is added.
- the data acquisition program 22a acquires, from the data acquisition unit 26, the imaging data to which the imaging time information is added in addition to the sensor type information, the sensor data, and the time stamp.
- the data acquisition program 22a obtains the network identification information C from the network database 27, and further obtains the user information from the user information storage area 22d, and outputs the obtained network identification information C and the user information to the information addition program 22b, along with the sensor type information, the sensor type, the time stamp, and the imaging time information.
- the information addition program 22b Upon receipt of the network identification information C, the sensor type information, the sensor data, the time stamp, the user information, and the imaging data, output from the data acquisition program 22a, to which the imaging time information is added, the information addition program 22b adds the sensor type information, the time stamp, the network identification information, and the user information to the sensor data, and outputs the sensor data to the communication unit 25.
- the imaging data to which the imaging time information is added is also output to the communication unit 25.
- the communication unit 25 can know the communication network 2 and the teacher terminal 3 from the network identification information added to the sensor data. Then, the communication unit 25 transmits the sensor data to which the network identification information, the sensor type information, the time stamp, and the user information are added, and the imaging data to which the imaging time information is added to the teacher terminal 3 via the known communication network 2. Similar to the first embodiment, if the graphing scientific calculator 10 is connected to the communication network 2 informed by teacher A through a manual operation of the student of class B and is in a state where sensor data, etc. can be transmitted to the teacher terminal 3, the processing of knowing the communication network 2 to be used by teacher A and the students of class B, and the teacher terminal 3 of teacher A becomes unnecessary.
- the communication unit 34 outputs, to the determination program 36a, the sensor data to which the network identification information, the sensor type information, the time stamp, and the user information are added, along with the imaging data to which the imaging time information is added.
- the determination program 36a performs processing similar to that described in the first embodiment. In this processing, imaging data to which the imaging time information is added is not used.
- classification information is added to each sensor data output from the determination program 36a, and the sensor data is stored in the sensor data database 38.
- the sensor data to which the classification information is added is stored in the sensor data database 38, along with the imaging data to which the imaging time information is added, which has been received by the communication unit 34 along with the sensor data.
- the display control program 36c acquires, from the sensor data database 38, a plurality of sensor data items to which the same classification information is added, and displays a list of graphs generated from the sensor data items on the display 33.
- the imaging data which has been received by the communication unit 34 along with the sensor data, is respectively associated with the graphs and displayed in list form on the display 33, along with the added imaging time information.
- FIG. 13 is a conceptual drawing showing a display example of a list of graphs generated based on the sensor data to which the same classification information (e.g., the same class) is added, along with the imaging data and the imaging time information, which have been received along with the sensor data by the communication unit 34.
- the same classification information e.g., the same class
- three neutralization curves (a-1), (b-1), and (c-1) generated based on the sensor data acquired by three students, namely students ⁇ , ⁇ , and ⁇ , imaging data (a-2), (b-2), and (c-2) during the experiment, and the imaging time information (a-3), (b-3), and (c-3) are displayed.
- the imaging data may be a still image or a video. If the imaging data is a video, seek bars (a-4), (b-4), and (c-4) indicating replay positions of the videos are respectively displayed in the periphery of the imaging time information (a-3), (b-3), and (c-3), for example below the imaging time information (a-3), (b-3), and (c-3).
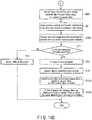
- FIGS. 14A and 14B show a flow chart showing an operation example of the display system 1 according to the second embodiment.
- FIGS. 14A and 14B the same operations as those in FIGS. 10A and 10B are indicated by the same step numbers, and hereinafter repetitive descriptions will be avoided.
- an operation similar to the step of "S3" is labeled as "S3A”, so that the operations similar to those in FIGS. 10A and 10B can be clearly distinguished in FIGS. 14A and 14B .
- teacher A holds class B during a second period (9:35 a.m. to 10:20 a.m.) on XX (month)/##(day)/2018, and during the class, an acid-base titration experiment in which an acetic acid solution, to which a small amount of phenolphthalein solution is added in advance, is titrated with a sodium hydroxide (NaOH) solution, and each student transmits, from the student terminal 4 to the teacher terminal 3, sensor data (pH) obtained in the experiment and imaging data (video data during the titration) to which imaging time information is added.
- acetic acid solution to which a small amount of phenolphthalein solution is added in advance
- NaOH sodium hydroxide
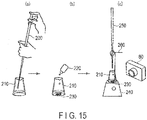
- a teacher's-designated volume of acetic acid is precisely measured with a volumetric pipette 200, and transported into a conical flask 210.
- a phenolphthalein solution 220 are added into the acetic acid solution in the conical flask 210, and a rotator 230 is further added thereto.
- the conical flask 210 is put on a stirrer 240, which is to be activated to stir the solution with the rotator 230, and a drop of aqueous sodium hydroxide is dropped from the burette 250 into the conical flask 210, while the acetic acid solution therein is being stirred.
- the pH sensor 260 measures a pH of the solution in the conical flask 210.
- a phenolphthalein solution is transparent in an acidic solution, and exhibits a dark red color in an alkaline solution. Accordingly, the stopping of a neutralization reaction can be checked through observation of the color of the solution.
- the camera 60 takes a video of the solution in the conical flask 210 under the titration process.
- Teacher A first generates, through an operation of the key input unit 35 of the teacher terminal 3, a determination condition in which network identification information C, which in turn includes the information regarding the teacher terminal 3 and the information regarding the communication network 2 to be used by teacher A and the students of class B, a time range of a time stamp (2018:XX:##:09:35:00:00 through 2018:XX:##:10:25:59:59) D, and the sensor type information E (pH sensor) are designated, and causes the determination condition database 37 to store the generated determination condition (S1A).
- network identification information C which in turn includes the information regarding the teacher terminal 3 and the information regarding the communication network 2 to be used by teacher A and the students of class B
- a time range of a time stamp 2018:XX:##:09:35:00:00 through 2018:XX:##:10:25:59:59
- E pH sensor
- Teacher A informs the graphing scientific calculator 10 of each student of class B of the network identification information C through the communication unit 34 of the teacher terminal 3 through, for example, emails or a messenger application, etc., and causes the network database 27 of the graphing scientific calculator 10 of each student to store the network identification information C.
- teacher A informs the students of class B of the network identification information C verbally or via writing on a black board, etc., and each of the students causes the network database 27 of the graphing scientific calculator 10 to store the network identification information C (S2). Similar to the first embodiment, steps S1A and S2 may be performed either during or after the experiment, as long as the sensor data has not been yet transmitted to the teacher terminal 3.
- the student may connect the graphing scientific calculator 10 to the communication network 2 informed by teacher A through a manual operation so as to bring the calculator in a state where sensor data, etc. can be transmitted to the teacher terminal 3.
- the data logger 40 is connected to the data acquisition unit 26 of the graphing scientific calculator 10, and the sensor 50 (pH sensor) is connected to the data logger 40 (S3).
- the data logger 40 recognizes that the connected sensor 50 is a pH sensor, and sensor type information (pH sensor), which is a recognition result, is transmitted to the data acquisition unit 26 (S4).
- sensor data which is a detection result
- sensor data is transmitted to the data acquisition unit 26 from the sensor 50 (pH sensor) via the data logger 40.
- a user can take a still image or a video during the experiment by operating the camera 60.
- image data is generated by the camera 60, and imaging time information is added to the imaging data.
- the imaging data to which imaging time information is added can then be output to the data acquisition unit 26 from the camera 60 (S5A).
- a time stamp is generated in the data acquisition unit 26 (S6A).
- the generated time stamp is output from the data acquisition unit 26 to the data acquisition program 22a, along with the sensor type information (pH sensor) and the sensor data (pH).
- the imaging data to which the imaging time information is added is also output to the data acquisition program 22a.
- the network identification information C is obtained from the network database 27 (S7).
- the user information is further obtained from the user information storage area 22d, and the obtained network identification information C and the user information are output to the information addition program 22b, along with the sensor type information (pH sensor), the sensor data (pH), the time stamp, and the imaging time information.
- the sensor type information (pH sensor), the sensor data (pH), the time stamp, and the user information which are output from the data acquisition program 22a
- the sensor type information (pH sensor), the time stamp, the network identification information C, and the user information are added to the sensor data (pH), and the sensor data is output to the communication unit 25.
- the imaging data to which the imaging time information is added is also output to the communication unit 25 (S8A).
- a communication network 2 to be used by teacher A and the students of class B e.g., the Internet or a school intranet
- a teacher terminal 3 of teacher A e.g., the Internet or a school intranet
- the sensor data (pH) to which the network identification information C, the sensor type information (pH sensor), the time stamp, and the user information are added, is then transmitted, along with the imaging data to which the imaging time information is added, to the teacher terminal 3 of teacher A, via the known communication network 2 (S10A).
- step S2 if the graphing scientific calculator 10 is connected to the communication network 2 informed by teacher A through a manual operation of the student of class B and is in a state where sensor data, etc. can be transmitted to the teacher terminal 3, the processing herein of knowing the communication network 2 to be used by teacher A and the students of class B, and the teacher terminal 3 of teacher A is omitted.
- these information items transmitted from the student terminal 4 of a student of class B via the communication network 2 are received by the communication unit 34. Furthermore, the sensor data (pH) to which the network identification information C, the sensor type information (pH sensor), the time stamp, and the user information are added is output from the communication unit 34 to the determination program 36a, along with the imaging data to which the imaging time information is added.
- the determination program 36a determines whether or not the network identification information C, time stamp, and sensor type information (pH sensor) added to the sensor data satisfy the determination condition by referring to the determination condition stored in the determination condition database 37 (S11).
- the sensor data (pH) is output to the classification program 36b, along with the information items added to the sensor data, namely the network identification information C, the time stamp, the sensor type information (pH sensor), and the user information (S13) .
- the sensor data is determined not to be appropriate and discarded by the determination program 36a (S12).
- each sensor data (pH) output from the determination program 36a is classified into groups, such as classes, according to the network identification information C, the acquisition time information, and the sensor type information (pH sensor) E (S14), and the sensor data is stored in the sensor data database 38.
- the sensor data (pH) classified into the same group is stored in the sensor data database 38, along with the imaging data to which the imaging time information received by the communication unit 34 along with the sensor data (pH) is added (S15A).
- the sensor data (pH) acquired in the same class in other words, the sensor data to which the same classification information is added, is acquired from the sensor data database 38, and a list of graphs generated based on the sensor data (pH) and associated with the user information is displayed on the display 33, as shown as (a-1), (b-1), and (c-1) in FIG. 13 for example.
- the imaging data (a-2), (b-2), and (c-2) received by the communication unit 34 along with the sensor data (pH) and stored in the sensor data database 38 are displayed as a list on the display 33, being associated with the graphs, along with the imaging time information (a-3), (b-3), and (c-3) respectively added to the imaging data (a-2), (b-2), and (c-2) (S16A).
- the imaging data is video data
- seek bars (a-4), (b-4), and (c-4) indicating replay positions of the videos are also respectively displayed in the periphery of the imaging time information (a-3), (b-3), and (c-3), for example below the imaging time information (a-3), (b-3), and (c-3) in the present embodiment.
- the curve (a-1) shows an example in which a titre of sodium hydroxide was insufficient and the experiment was terminated before a point of neutralization was reached.
- the pH changes only to approximately 6, and it can be understood from the video data (a-2) showing the experiment under the process that the color of the solution remains transparent throughout the experiment, even before and after the experiment.
- the curve (b-1) shows an example in which a titre of sodium hydroxide (approximately 10 ml) was appropriate, and a point of neutralization was not reached. At a point of neutralization obtained through the titration with a sodium hydroxide solution, the pH rapidly changes from approximately 6 to approximately 12. The curve (b-1) shows this rapid change of pH. From the video data (b-2) showing the experiment under the process, it can be understood that the color of the solution was transparent before the experiment started, but it eventually changed to light red.
- the curve (c-1) shows an example in which the solution became alkaline because a drop of sodium hydroxide was continuously added even after the point of neutralization was reached. It can be seen from the curve that a pH increased as a sodium hydroxide solution was further added after a point where a titre of sodium hydroxide (approximately 10 ml) was completed and the pH rapidly rose from approximately 6 to approximately 12, and the solution became more alkaline.
- an imaging time that indicates a time when the replay should start can be set as appropriate through operating the seek bars (a-4), (b-4), and (c-4), which are displayed around (below, in this example) the video data.
- Teacher A comprehensively checks a list of curves of neutralization based on the sensor data (pH) obtained by each of the students of class B, and imaging data, etc. displayed on the display 33 along with the user information, as illustrated in FIG. 13 , so as to know which student properly conducted the experiment, and which student did not. Furthermore, teacher A can provide effective classes through, for example, showing, to the students of class B, a list of information displayed on the display 33 as shown in FIG. 13 .
- the students of class B can also better understand the content of the experiment through looking at the list of information displayed on the display 33 of the teacher terminal 3, as shown in FIG. 13 .
- the present embodiment not only graphs but also imaging data can be displayed, thereby producing visual effects; thus, each student can more deeply understand content of an experiment with the aid of such visual effects.
- the imaging data is video data
- the present embodiment can be realized even when the imaging data is still image data.
- the display of the seek bars (a-4), (b-4), and (c-4) is omitted.
- imaging data is still image data
- still image data corresponding to a single curve of neutralization among the obtained curves is not limited to one data item.
- the display control program 36c knows the chronological order of the still images from the imaging time information added to the still image data, and displays the sets of two still images, (a-2), (b-2), and (c-2), around (below, in this example) the corresponding curves (a-1), (b-1), and (c-1), so that the still images in each set are displayed in the chronological order.
- the display control program 36c may determine a chronological order of the still images from the imaging time information added to the sill image data, and perform a slide show of the still images in the chronological order around (below in this example) a corresponding curve (a-1), (b-1), or (c-1).
- the present invention is not limited to the above-described embodiment and various modifications can be made without departing from the scope of the present invention in practical stages.
- the above-described embodiments include inventions at various stages, and a variety of inventions can be derived by properly combining structural elements disclosed in connection with the embodiments. For example, even if some of the constituent elements disclosed in the above-described embodiments are deleted, or some of the constituent elements are combined in a different aspect, these variations can be derived as inventions as long as the problem to be solved by the invention can still be solved and the advantageous effects can still be achieved.
Landscapes
- Engineering & Computer Science (AREA)
- Theoretical Computer Science (AREA)
- General Physics & Mathematics (AREA)
- Physics & Mathematics (AREA)
- General Engineering & Computer Science (AREA)
- Business, Economics & Management (AREA)
- Computing Systems (AREA)
- Computer Hardware Design (AREA)
- Educational Technology (AREA)
- Educational Administration (AREA)
- Tourism & Hospitality (AREA)
- Strategic Management (AREA)
- Human Computer Interaction (AREA)
- Economics (AREA)
- Computational Linguistics (AREA)
- Databases & Information Systems (AREA)
- Health & Medical Sciences (AREA)
- Data Mining & Analysis (AREA)
- General Health & Medical Sciences (AREA)
- Human Resources & Organizations (AREA)
- Marketing (AREA)
- Primary Health Care (AREA)
- General Business, Economics & Management (AREA)
- Electrically Operated Instructional Devices (AREA)
- Management, Administration, Business Operations System, And Electronic Commerce (AREA)
Abstract
Description
- The technical field relates to a data processing apparatus and method, program, and a method for data processing system for displaying at once, for example, a plurality of data items obtained separately by a plurality of sensors.
- A graphing scientific calculator is a calculator capable of drawing graphs, calculating simultaneous equations, and performing calculation using variables. This type of graphing scientific calculator has a display for displaying a few lines of text or a graph of a calculation result. A graphing scientific calculator is thus provided with a calculation function and a display function.
- In addition to such functions, a graphing scientific calculator having a function for direct or indirect connection to a sensor has been manufactured in recent years. With this type of graphing scientific calculator, when, for example, a sensor-connected data logger is connected, sensor data detected by the sensor can be acquired after the necessary settings are made.
- In more recent years, in order to simplify the necessary settings, a measurement application that automatically performs the settings once the calculator is connected to a sensor-connected data logger has been developed. For example, Jpn. Pat. Appln. KOKAI Publication No.
2003-281671 - With the measurement application, not only the sensor data detected by the sensor is acquired but also a sensor type is automatically recognized.
- It is assumed that a graphing scientific calculator in which such a measurement application is installed is used in an educational setting, such as scientific experiments.
- In a scientific experiment, a teacher checks if the experiment has been appropriately conducted by each student or group of students through receiving, with his or her own device, sensor data acquired during the experiment, which is transmitted from each student or each group of students, and then checking a result of the experiment. Furthermore, a teacher causes the display of the student terminals to display a list of the experiment results from each student (or some of the students who participate in the experiment) or each group, in a form of graphs generated from sensor data, for example. It is thereby possible for the students who participate in the experiment to check or compare the experiment results acquired by other students or groups.
- To deliver such an efficient class, each student or a representative of each group acquires sensor data detected by the sensor, and transmits the acquired sensor data to the teacher terminal with the use of a graphic scientific calculator in which an application such as the aforementioned is installed.
- Such transmission of sensor data from the graphic scientific calculator can be directly made to the teacher terminal, if the graphing scientific calculator is provided with a communication function.
- If, on the other hand, the graphing scientific calculator does not have a communication function, as long as the calculator has an online sharing function, the transmission of sensor data can be achieved by generating a QR code (registered trademark) corresponding to the sensor data, reading the QR code by a smart phone or a tablet device, and transmitting the sensor data to a teacher terminal from the calculator itself as a proxy.
- However, there are problems in a class where the above-described communication technique is adopted, as will be pointed out below.
- To deliver a class as described above, a teacher first needs to check if the sensor data transmitted from a student is sensor data relating to a currently-conducted class.
- For example, an experiment under the same theme may be conducted in another class of which the same teacher is in charge. In such a case, sensor data relating to the same theme would be transmitted from a student in another class. In another case, an experiment under a different theme may be conducted in the same class on a different day. In such a case, sensor data relating to the different theme would be transmitted from a student of the same class.
- Accordingly, if sensor data is transmitted from a student, the teacher needs to check which class the transmitted sensor data is acquired from, and such checking requires considerable time and efforts, thus preventing a teacher from giving efficient classes.
- The present invention is proposed in view of such circumstances, and an objective of the present invention is to provide a data processing apparatus and method, a program, and a method for a data processing system capable of automatically determining whether or not sensor data transmitted from a plurality of transmission sources are desired sensor data.
- According to one aspect of the invention, there is provided a data processing apparatus including a processor, the processor is configured to: receive one or more sets of data output from at least one data output apparatus via a communication network, each set of the data including sensor data obtained by at least one sensor and first specifying information that specifies the data processing apparatus; determine whether or not the first specifying information included in the received one or more sets of data satisfies a predetermined condition; classify the one or more sets of data determined to satisfy the condition into a same group; and generate and output an output file based on the one or more sets of data classified into the same group.
- According to another aspect of the invention, there is provided a data processing method performed by a processor of a data processing apparatus, the method includes: receiving one or more sets of data output from at least one data output apparatus via a communication network, each set of the data including sensor data obtained by at least one sensor and first specifying information that specifies the data processing apparatus; determining whether or not the first specifying information included in the received one or more sets of data satisfies a predetermined condition; classifying the one or more sets of data determined to satisfy the condition into a same group; and generating and outputting an output file based on the one or more sets of data classified into the same group.
- According to another aspect of the invention, there is provided a program which instructs a controller of a data processing apparatus to perform: receiving one or more sets of data output from each of a plurality of information processing terminal via a communication network, the data processing apparatus and the plurality of information processing terminal being communicably connected to the data processing apparatus via the communication network, each set of the data including sensor data obtained by at least one sensor and first specifying information that specifies the data processing apparatus; determining whether or not the first specifying information included in the received one or more sets of data satisfies a predetermined condition; classifying the one or more sets of data determined to satisfy the condition into a same group; and generating and outputting an output file based on the one or more sets of data classified into the same group.
- According to another aspect of the invention, there is provided a method performed by a data processing system that includes a data processing apparatus, and a plurality of information processing terminals being communicably connected to the data processing apparatus via a communication network, the method includes: each controller of the information processing terminals: transmitting one or more sets of data via the communication network, each set of the data including sensor data acquired by at least one sensor and first specifying information that specifies the data processing apparatus; a controller of the data processing apparatus: receiving the one or more sets of data output from each of the information processing terminals via the communication network; determining whether or not the first specifying information included in the received one or more sets of data satisfies a predetermined condition; classifying the one or more sets of data determined to satisfy the condition into a same group; and generating and outputting an output file based on the one or more sets of data classified into the same group.
- According to the data processing apparatus and method, a program, and a method for a data processing system of the present invention, it is possible to automatically determine whether or not sensor data transmitted from a plurality of transmission sources is desired sensor data.
- The components in the drawings are not necessarily to scale relative to each other.
-
FIG. 1 is a conceptual drawing showing a configuration example of a display system according to a first embodiment. -
FIG. 2 is a front view of an appearance constitution of a graphing scientific calculator which is an example of an electronic device that may be used as a student terminal in the first embodiment. -
FIG. 3 is a block diagram of a configuration example of an electronic circuit of a graphing scientific calculator that can be used as a student terminal in the first embodiment. -
FIG. 4 is a drawing showing a data configuration of a network database storing a plurality of network identification information items. -
FIG. 5 is a block diagram illustrating a configuration example of an electronic circuit of a teacher terminal. -
FIG. 6 is a diagram showing a data configuration of a determination condition database. -
FIG. 7 is a diagram showing a data configuration of a sensor data base. -
FIG. 8 is a conceptual drawing showing a display example of a list of graphs generated based on sensor data acquired in the same class. -
FIG. 9 is a drawing showing another display example of the student's information (user information) inFIG. 8 . -
FIG. 10A is a flow chart (1/2) showing an operation example of the display system according to the first embodiment. -
FIG. 10B is a flow chart (2/2) showing an operation example of the display system according to the first embodiment. -
FIG. 11 is a conceptual drawing showing a configuration example of a display system according to a second embodiment. -
FIG. 12 is a block diagram of a configuration example of an electronic circuit of a graphing scientific calculator that can be used as a student terminal in the second embodiment. -
FIG. 13 is a conceptual drawing showing a display example of a list of a plurality of graphs with accompanying imaging data and imaging time information. -
FIG. 14A is a flow chart (1/2) showing an operation example of the display system according to the second embodiment. -
FIG. 14B is a flow chart (2/2) showing an operation example of the display system according to the second embodiment. -
FIG. 15 is a schematic drawing showing common procedures of an acid-base titration experiment. -
FIG. 16 is a conceptual drawing showing a display example of a list of a plurality of graphs with accompanying imaging data and imaging time information. - A display system according to a first embodiment will be described.
-
FIG. 1 is a conceptual drawing showing a configuration example of a display system according to a first embodiment. - In the present embodiment, an example where data acquired in a scientific experiment is received by teacher A from each student of class B through the
display system 1 will be described. - In this example, the
display system 1 consists of ateacher terminal 3 and a plurality of student terminals 4 (#1 through #n) which are connected via acommunication network 2, such as the Internet or a school intranet. Theteacher terminal 3 herein is a device used by teacher A who is in charge of an experiment conducted by the students of class B. The student terminals 4 (#1 through #n) are devices used by the students of class B during the experiment. - The
student terminal 4 is a device that transmits sensor data obtained by a sensor 50 (a result of detection by the sensor 50) to theteacher terminal 3 via thecommunication network 2, and can be realized by, for example, an electronic device, such as a graphingscientific calculator 10 shown inFIG. 2 . -
FIG. 2 is a front view of an appearance constitution of the graphingscientific calculator 10 which is an example of an electronic device that may be used as astudent terminal 4. - Hereinafter, a graphing
scientific calculator 10 such as the one shown inFIG. 2 will be explained as thestudent terminal 4; however, thestudent terminal 4 is not limited to the graphingscientific calculator 10, and may be configured as an electronic device, such as a tablet device, a personal computer, a smart phone, a mobile phone, a touch panel-type personal digital assistants (PDA), an electronic book, or a mobile game player, etc. - An electronic device (not shown), such as a tablet device not equipped with physical keys (buttons) like those provided in the graphing
scientific calculator 10, displays a software keyboard similar to the keys of the graphingscientific calculator 10, and performs processing in response to key operations on the software keyboard. - The graphing
scientific calculator 10 comes in a small size out of a need of portability so that a user can easily hold and operate it in one hand, and is provided with akey input unit 11 and adisplay 12 on its main body front surface. - In the
key input unit 11, there exists a number and mathematical symbolkey group 111 for inputting numerical values, mathematical expressions, and program commands and for instructing execution of calculation or a program; a mathematical functionkey group 112 for inputting various functions and for activating a memory function; a mode settingkey group 113 for causing a display of a menu screen in various operation modes, such as a calculation mode and an algorithm mode, and for instructing setting of these operation modes; thefunction key group 114 for activating various functions displayed along the bottom of thedisplay 12 by one-time key operation; and acursor key 115 for moving a cursor displayed on thedisplay 12 and selecting data items. - As the number and mathematical symbol
key group 111, [0] through [9] (numerical values) keys, [+], [-], [×], and [÷] (four arithmetic operations symbols) keys, [EXE] ("execution") key, and [AC] ("clear") key, etc., are arranged. - As the mathematical function
key group 112, [sin] ("sine") key, [cos] ("cosine") key, [tan] ("tangent") key, etc., are arranged. - As the mode setting
key group 113, [MENU] ("menu") key, [SHIFT] ("shift") key, and [OPTN] ("option") key, etc., are arranged. - As the
function key group 114, [F1] key through [F6] key are arranged. - Pressing the [SHIFT] key followed by any key of the number and mathematical symbol
key group 111, the mathematical functionkey group 112, the mode settingkey group 113, or thefunction key group 114 performs an alternate function indicated above the key, not the function indicated on the keycap. For example, pressing the [SHIFT] key followed by the [AC] key (hereinafter, such a key operation will be written as "[SHIFT] + [AC]") function as the [OFF] ("power off") key. Pressing [SHIFT] + [MENU] functions as the [SET UP] ("set up") key, and pressing [SHIFT] + [F3] key functions as the [V-Window] ("view window"; instruction to display a drawing region setting screen) key. - The
display 12 is composed of a dot-matrix type liquid crystal display unit, for example. If thestudent terminal 4 is a tablet device, thedisplay 12 is composed of a liquid crystal display unit provided with a touch panel thereon. Thedisplay 12 displays, in a form of graph, a result of computation obtained by executing a data acquisition program (thedata acquisition program 22a shown inFIG. 3 , which will be described later) on sensor data detected by thesensor 50. -
FIG. 3 is a block diagram illustrating a configuration example of an electronic circuit of the graphingscientific calculator 10. - In addition to the
key input unit 11 and thedisplay 12, the electronic circuit of the graphingscientific calculator 10 includes aCPU 21 which is a computer, amemory 22, arecording medium reader 24, acommunication unit 25, adata acquisition unit 26, and anetwork database 27. - The
CPU 21 controls operations in each part of the circuit in accordance with thedata acquisition program 22a and theinformation addition program 22b stored in thememory 22, and executes various computing processing in accordance with a key input signal from thekey input unit 11. Thedata acquisition program 22a and theinformation addition program 22b may be either stored in thememory 22 in advance, or read from anexternal recording medium 23, such as a memory card, via therecording medium reader 24, and stored in thememory 22. Thedata acquisition program 22a and theinformation addition program 22b are write-protected from a user's operation on thekey input unit 11. - In the
memory 22, as an area for storing rewritable data other than the write-protected information, awritable data area 22c is reserved for storing data, such as various data consisting of key-code data subsequently-input through the keys of thekey input unit 11, and intermediate data generated by processing performed by thedata acquisition program 22a and theinformation addition program 22b. The userinformation storage area 22d is also reserved in thememory 22; it is thus possible to store information of students who use the graphing scientific calculator 10 (user information) prior to, for example, the start of an experiment. The user information consists of, at least one of a student's name, a group conducting an experiment (an experiment group to which a student belongs), or a class to which a student belongs. - The graphing scientific calculator 10 (the student terminal 4) configured as described above realizes the functions described below when the
CPU 21 controls the operations in each part of the circuit in accordance with an instruction written by thedata acquisition program 22a and theinformation addition program 22b, in such a manner that hardware and software operate in conjunction with each other. - The
data acquisition unit 26 communicates with thedata logger 40 via a wire or wirelessly. One ormore sensors 50 are connected to thedata logger 40. Examples of thesensor 50 include a temperature sensor, a voltage sensor, an electric current sensor, a pH sensor, an audio sensor, a photo gate sensor, and a pressure sensor, and the like; however, the examples are not limited thereto. - One or
more sensors 50 can be connected to thedata logger 40, and if connected, a sensor type of eachconnected sensor 50 is recognized, and sensor type information as a result of the recognition is transmitted to thedata acquisition unit 26. The sensor data detected by eachsensor 50 is acquired from eachsensor 50, and the acquired sensor data is transmitted to thedata acquisition unit 26. Thedata logger 40 may have a storing function (not shown) for temporarily storing the sensor data acquired from thesensor 50 before sending it to thedata acquisition unit 26. - Upon receipt of the sensor type information and sensor data transmitted from the
data logger 40, thedata acquisition unit 26 generates a time stamp, and outputs the generated time stamp to thedata acquisition program 22a, along with the received sensor type information and sensor data. - Since a time required for transmitting the sensor data detected by the
sensor 50 from thesensor 50 to thedata acquisition unit 26 via thedata logger 40 is very short, the time stamp can be regarded as acquisition time information indicating a time when the sensor data is acquired by thesensor 50. - Although the
data logger 40 is externally provided in the example shown inFIG. 3 , it may be built in the graphingscientific calculator 10. - The
data acquisition unit 26 can directly obtain from thesensor 50 the sensor data detected by thesensor 50, and if the sensor data can be accumulated in thewritable data area 22c, thedata logger 40 can be omitted and thesensor 50 can be directly connected to thedata acquisition unit 26. - Herein, for a teacher in charge of an experiment, if there are multiple classes in which an experiment is conducted, one teacher (teacher A) may be in charge of all classes, or responsibility for the classes may be shared by a plurality of teachers. In other words, there are two cases: (A) one teacher (teacher A) is responsible for all the classes in which an experiment is conducted; and (B) a plurality of teachers share responsibility for the classes during which an experiment is conducted. As for a place where the students of class B conduct an experiment, (C) there may be only one classroom where an experiment can be held, or (D) there may be multiple classrooms where an experiment can be held (in other words, there is a possibility that an experiment may be conducted in not only class B but also other classes during the same period under supervision of the teachers who are respectively in charge of the classes). As for the
communication network 2, (E) there may be only one communication network available for students' use, or (F) there may be multiple communication networks available for students' use, such as the Internet and a school intranet. In consideration of these circumstances, there are multiple combinations of a teacher terminal such as theteacher terminal 3 and thecommunication network 2 for a case where an experiment is conducted in a certain class. Accordingly, in order to set a combination of acommunication network 2 used by the students of class B and ateacher terminal 3 of teacher A, who is in charge of an experiment in class B, thenetwork database 27 preferably stores a single piece of network identification information for identifyingpredetermined communication network 2 andteacher terminal 3 as a network and a teacher terminal with which the graphingscientific calculator 10 communicate. Onecommunication network 2 with which the graphingscientific calculator 10 communicates can be designated by teacher A in advance, for example. - A teacher A's designation of a communication network 2 (e.g., the Internet or a school intranet) to be used during an experiment can be conveyed to the students of class B verbally or in writing on a blackboard, and in this case, the students of class B individually set the
communication network 2 to be used during an experiment with their student terminals 4 (#1 through #n). Alternatively, if thestudent terminal 4 of each student of class B is operating under a circumstance where theterminal 4 can communicate with theteacher terminal 3 of teacher A through an e-mail or a messenger application, etc., teacher A can inform the students of thecommunication network 2 to be used in an experiment (for example, the Internet and a school intranet) through delivery of information regarding thecommunication network 2 to the student terminals 4 (#1 through #n) via an email or a messenger application, etc. Also in this case, the students of class B individually set thecommunication network 2 to be used during an experiment with their student terminals 4 (#1 through #n). As another alternative, if the students of class B set thecommunication network 2 informed by teacher A with their student terminal 4 (#1 through #n), it is preferable not only that the students have thenetwork database 27 store the information regarding thecommunication network 2 delivered from teacher A but also that the students manually connect the student terminals 4 (#1 through #n) to thecommunication network 2 designated by teacher A , so that the sensor data etc. can be transmitted to theteacher terminal 3. If sensor data, etc. can be transmitted to theteacher terminal 3 after the students manually connect the student terminals 4 (#1 through #n) to thecommunication network 2 designated by teacher A, at the very least it no longer becomes necessary to perform the processing thereafter (to be described later) to connect the student terminals 4 (#1 through #n) to thecommunication network 2 using at least network identification information. - In a case where
multiple communication networks 2 are available for the students of class B, in order to deal with any combination of acommunication network 2 available for the students of class B and ateacher terminal 3 of teacher A, thenetwork database 27 may preferably store a plurality of network identification information items for identifying acommunication network 2 and ateacher terminal 3 as those with which the graphingscientific calculator 10 communicate. In order to deal with any combination of acommunication network 2 available for the students of a predetermined class and any one of the teacher terminals of a plurality of teachers who are in charge of an experiment (namely, not only theteacher terminal 3 of teacher A but also the other teachers' terminals), thenetwork database 27 may store a plurality of network identification information items for identifying a predetermined teacher terminal, such as theteacher terminal 3, and acommunication network 2 with which the graphingscientific calculator 10 communicate. The teacher A's determination of acommunication network 2 can be informed to the students of class B in a manner similar to the above-described manner. When the students of class B receive from teacher A an instruction regarding acommunication network 2 to be used during an experiment, the students may select and set, based on the instruction, a corresponding combination from multiple combinations of a teacher terminal, such as theteacher terminal 3, and acommunication network 2. If thenetwork database 27 stores a plurality of network identification information items, thestudent terminal 4 may automatically determine and set a combination of acommunication network 2 to be used during an experiment by teacher A and the students of class B and theteacher terminal 3, in accordance with a predetermined determination condition, as described above. - Combinations of a teacher terminal, such as the
teacher terminal 3, and acommunication network 2 to be used when an experiment is conducted in a predetermined class may be stored in thenetwork database 27 in advance, and when the students of class B receive an instruction from teacher A regarding acommunication network 2 to be used, the students may select and set a corresponding combination from the combinations. - Upon acquisition of the sensor type information, the sensor data, and the time stamp from the
data acquisition unit 26, thedata acquisition program 22a acquires network identification information from thenetwork database 27. If thenetwork database 27 stores only a predetermined network identification information item, thedata acquisition unit 26 acquires this network identification information. - In contrast, if the
network database 27 stores a plurality of network identification information items, thedata acquisition program 22a determines thecommunication network 2 and theteacher terminal 3 with which the graphingscientific calculator 10 should communicate based on at least one of the sensor type information or the time stamp in accordance with a predetermined determination reference, and obtains corresponding network identification information. - As an example of a determination reference, in a case where a current-voltage experiment is conducted in teacher A's class in a second period (from 9:35 a.m. to 10:20 a.m.) of today, if the time stamp indicates a time between 9:35 a.m. and 10:20 a.m. of today, and the sensor type information indicates "multimeter", the network identification information in which the
teacher terminal 3 of teacher A and itsdedicated communication network 2 are designated is network identification information to be acquired from thenetwork database 27. -
FIG. 4 is a drawing showing a data configuration of thenetwork database 27 storing a plurality of network identification information items. With such a data configuration of thenetwork database 27, it is possible to specify, based on the time stamp and sensor type information received from eachstudent terminal 4, network identification information including the information specifying theteacher terminal 3 of teacher A and the information specifying thecommunication network 2 that the students of class B can connect to, as network identification information that needs to be acquired. If network identification information is uniquely determined based on one of the time stamp or the sensor type information, thenetwork database 27 does not necessarily include the other of the time stamp and the sensor type. If network identification information is uniquely determined regardless of the time stamp and the sensor type information, thenetwork database 27 does not have to include both of the time stamp and the sensor type. Furthermore, specified network identification information may include at least only minimum information necessary for specifying a group (to be described later), for example information for specifying theteacher terminal 3 of teacher A. - After network identification information is thus obtained from the
network database 27, thedata acquisition program 22a further obtains user information from the userinformation storage area 22d, and outputs the obtained network identification information and user information to theinformation addition program 22b, along with the sensor type information, the sensor data, and the time stamp. - Upon receipt of the network identification information, sensor type information, sensor data, time stamp, and user information output from the
data acquisition program 22a, theinformation addition program 22b adds the sensor type information, time stamp, network identification information, and user information to the sensor data, and outputs the sensor data to which those information items are added to thecommunication unit 25. - When the sensor data to which the network identification information, the sensor type information, the time stamp, and the user information are added is output from the
information addition program 22b, thecommunication unit 25 knows thecommunication network 2 and theteacher terminal 3 from the network identification information added to the sensor data. Then, upon receipt of the sensor data to which the network identification information, the sensor type information, the time stamp, and the user information are added, thecommunication unit 25 transmits the received sensor data to theteacher terminal 3 via thecommunication network 2 known from the sensor data. -
FIG. 5 is a block diagram illustrating a configuration example of an electronic circuit of theteacher terminal 3. - The electronic circuit of the
teacher terminal 3 includes aCPU 31 which is a computer, arecording medium reader 32, adisplay 33, acommunication unit 34, akey input unit 35, amemory 36, adetermination condition database 37, and asensor database 38. - Similar to the
student terminal 4, theteacher terminal 3 can also be configured as an electronic device, such as a tablet device, a personal computer, a smart phone, a mobile phone, a touch panel-type personal digital assistant (PDA), an electronic book, or a mobile game player, etc. - The
memory 36 stores thedetermination program 36a, theclassification program 36b, and thedisplay control program 36c. - The
CPU 31 controls operations in each parts of the circuit in accordance with thedetermination program 36a, theclassification program 36b, and thedisplay control program 36c, and executes various computing processing in accordance with a key input signal from thekey input unit 35. Thedetermination program 36a, theclassification program 36b, and thedisplay control program 36c may be either stored in thememory 36 in advance, or read from anexternal recording medium 39, such as a memory card, via therecording medium reader 32, and stored in thememory 36. Thedetermination program 36a, theclassification program 36b, and thedisplay control program 36c are write-protected from a user's operation of thekey input unit 35. - In the
memory 36, as an area for storing rewritable data other than the write-protected information, awritable data area 36d is reserved for storing data, such as various data consisting of key-code data subsequently input through the keys of thekey input unit 35, and intermediate data generated by processing performed by thedetermination program 36a, theclassification program 36b, and thedisplay control program 36c. - In the
teacher terminal 3, the functions described below are realized when theCPU 31 controls the operations in each part of the circuit in accordance with an instruction written by thedetermination program 36a, theclassification program 36b, and thedisplay control program 36c in such a manner that hardware and software operate in conjunction with each other. - The
communication unit 34 receives the sensor data transmitted from thestudent terminal 4 via thecommunication network 2. As described above, the sensor type information, the time stamp, the network identification information, and the user information are added to the sensor data transmitted from thestudent terminal 4. Upon receipt of such sensor data, thecommunication unit 34 outputs the sensor data to thedetermination program 36a. - The
determination condition database 37 stores determination conditions generated in advance by a user who is in a supervisory position, such as a teacher. As an example of generation of determination conditions, if teacher A wants to collect sensor data obtained in a current-voltage experiment conducted in the class during the second period (from 9:35 a.m. to 10:20 a.m.) of today from thestudent terminals 4, teacher A generates a determination condition, through operating thekey input unit 35 of theteacher terminal 3, in which the following information items are designated: the network identification information including acommunication network 2 used by thestudent terminals 4 and information regarding theteacher terminal 3; the time range of the time stamp (between 9:35 a.m. and 10:20 a.m. of today); and the sensor type information (for example, "multimeter"). The determination conditions thus generated are stored in thedetermination condition database 37. - When the sensor data to which the sensor type information, time stamp, network identification information, and user information are added is output from the
communication unit 34, thedetermination program 36a determines whether or not the sensor type information, the time stamp, and the network identification information satisfy the determination condition by referring to the determination condition stored in thedetermination condition database 37. - If the network identification information and sensor type information added to the sensor data match those designated in the determination condition, and the time stamp added to the sensor data is included in the time range designated in the determination condition, the
determination program 36a determines that the sensor data satisfies the determination condition; otherwise, it is determined that the sensor data does not satisfy the determination condition. - Upon determination that the sensor data satisfies the determination condition, the
determination program 36a outputs the sensor data to theclassification program 36b along with the added information. On the other hand, if it is determined that the sensor data does not satisfy the determination condition, thedetermination program 36a determines that the sensor data is inappropriate, and discards it. - The
classification program 36b classifies the sensor data output from thedetermination program 36a into groups, such as classes according to the content of the determination condition used in the determination made in thedetermination program 36a, that is, the network identification information, the acquisition time information, and the sensor type information. Classification information designating a group (class) is added to each sensor data output from thedetermination program 36a, and the sensor data is stored in thesensor database 38. - If the teacher were to conduct many classes, sensor data would be transmitted from a large number of
student terminals 4 to theteacher terminal 3 every time a class is conducted. Accordingly, the teacher would normally cause thedetermination condition database 37 of theteacher terminal 3 to store many determination conditions. In this case, it is necessary to identify the class from which the sensor data is acquired, even if the sensor data satisfies a determination condition. For this reason, theclassification program 36b classifies the sensor data into groups through adding, to said sensor data, classification information indicating which determination condition the sensor data satisfies, and thereafter outputs the classified sensor data to thesensor data database 38, causing thedatabase 38 to store the sensor data. -
FIG. 6 is a drawing showing a data configuration of thedetermination condition database 37, andFIG. 7 is a drawing showing a data configuration of thesensor data database 38. Thedetermination condition database 37 includes adetermination conditions 371 andclassification names 372, which are prepared by a teacher in advance. The classification names are group names into which sensor data is classified if the sensor data satisfies a determination condition. With such a data configuration of thedetermination condition database 37, it is possible to specify a group into which the sensor data is classified, based on the time stamp and sensor type information received from eachstudent terminal 4, and the obtained network identification information. As described above, if the network identification information is uniquely determined regardless of the time stamp and the sensor type information, and the network identification information includes only the information specifying theteacher terminal 3, in other words, does not include information specifying acommunication network 2, a group into which the sensor data is classified can be specified based only on the information specifying theteacher terminal 3. The sensor data identification information that identifies each of a plurality of sensor data items received from a plurality of the student terminals 4 (inFIG. 7 , student a, b, ...) is associated with identification information of the specified group (class ID), and they are stored in thesensor data database 38 having the data configuration shown inFIG. 7 . - The
display control program 36c acquires the sensor data belonging to the same group, namely a plurality of sensor data items to which the same classification information is added, from thesensor database 38, and displays a list of the graphs generated from the sensor data items on thedisplay 12. -
FIG. 8 is a conceptual drawing showing a display example of a list of a plurality of graphs generated based on the sensor data items belonging to the same class displayed on thedisplay 33 of theteacher terminal 3. -
FIG. 8 shows an example of three voltage-current graphs (a), (b), and (c) generated from the sensor data respectively acquired by three students (α, β, and γ) in the voltage-current experiment conducted in the same class to provide students' understanding of Ohm's law. In the present embodiment, the voltage-current graph is associated with student's information (user information) based on the sensor data acquired by each student and the user information added to the sensor data, and these are displayed. Specifically, in the voltage-current graph (a), a voltage-current graph corresponding to a result of the experiment conducted by the student α, and student α's information (user information) 33a are displayed together; in the voltage-current graph (b), a voltage-current graph corresponding to a result of the experiment conducted by the student β, and student β's information (user information) 33b are displayed together; and in the voltage-current graph (c), a voltage-current graph corresponding to a result of the experiment conducted by the student γ, and student γ's information (user information) 33c are displayed together. If the experiment is not conducted by each student of class B but by a plurality of groups of the students, it is preferable that, as shown inFIG. 9 , not only the name of a student who transmits sensor data, etc. to theteacher terminal 3 through the operation of thestudent terminal 4 but also, for example, a group to which the student belongs are displayed in the student α's information (user information) 33a, the student β's information (user information) 33b, and the student γ's information (user information) 33c. As described above, theteacher terminal 3 displays a list of results of the experiment conducted by the students on thedisplay 33. - Next, an example of the operation of the
display system 1 according to the present embodiment, and having the above-described configuration, will be described. -
FIGS. 10A and10B show a flow chart showing an operation example of thedisplay system 1 according to the first embodiment. - Herein, an example where a current-voltage experiment is conducted in class B, of which teacher A is in charge, during a second period (from 9:35 a.m. to 10:20 a.m.) on XX(month)/##(date)/2018, and the students of class B transmit sensor data obtained during the experiment from the
student terminals 4 to theteacher terminal 3, will be described. - In this example, teacher A first generates, through an operation of the
key input unit 35 of theteacher terminal 3, a determination condition in which network identification information C, which in turn includes the information regarding theteacher terminal 3 and the information regarding thecommunication network 2 to be used by teacher A and the students of class B, a time range of a time stamp (2018:XX:##:09:35:00:00 through 2018:XX:##:10:25:59:59) D, and the sensor type information E (multimeter) are designated, and causes thedetermination condition database 37 to store the generated condition (S1) . - Teacher A informs the graphing
scientific calculator 10 of each student of class B of the network identification information C through thecommunication unit 34 of theteacher terminal 3 with the use of, for example, emails or a messenger application, etc., and causes thenetwork database 27 of the graphingscientific calculator 10 of each student to store the network identification information C. Alternatively, teacher A informs the students of class B of the network identification information C verbally or via writing on a black board, etc., and each of the students causes thenetwork database 27 of the graphingscientific calculator 10 to store the network identification information C (S2). The preparation before the data acquisition is thus finished.FIG. 10A shows an example in which step S1 and step S2 are performed before the experiment begins; however, step S1 and step S2 may be performed during or after the experiment, as long as the steps are performed before the sensor data is transmitted to theteacher terminal 3. A method of storing the network identification information C in thenetwork database 27 of the graphingscientific calculator 10 of each student is not limited to the above-described method, and any appropriate method well known to a person with ordinary skill in the art may be adopted. Herein, in a case where a student of class B stores the network identification information C informed by teacher A in thenetwork database 27 of the graphingscientific calculator 10, the student may connect the graphingscientific calculator 10 to the communication network 2 (thenetwork 2 informed by teacher A) through a manual operation based on the network identification information C so as to bring the calculator in a state where sensor data, etc. can be transmitted to theteacher terminal 3. - When an experiment actually begins, first, the
data logger 40 is connected to thedata acquisition unit 26 of the graphing scientific calculator 10 (student terminal 4), and thesensor 50 is connected to the data logger 40 (S3). In this example, as a current-voltage experiment is conducted, a multimeter is connected to thedata logger 40 as asensor 50. - Once the sensor 50 (multimeter) is connected to the
data logger 40, a type of the connectedsensor 50 is recognized by thedata logger 40, and sensor type information (multimeter) is generated and transmitted to thedata acquisition unit 26 as a recognition result (S4). - Furthermore, when a current value and a voltage value are detected by the sensor 50 (multimeter), sensor data, which is a detection result, is transmitted to the
data acquisition unit 26 from the sensor 50 (multimeter) via the data logger 40 (S5). - In the
data acquisition unit 26, when the sensor type information (multimeter) and the sensor data (a current value and a voltage value) are transmitted from thedata logger 40, a time stamp is generated, and the generated time stamp is output to thedata acquisition program 22a along with the sensor type information (multimeter) and the sensor data (a current value and a voltage value) (S6). - Since a time required for transmitting the sensor data detected by the
sensor 50 from thesensor 50 to thedata acquisition unit 26 via thedata logger 40 is very short, the time stamp can be regarded as acquisition time information indicating a time when the sensor data is acquired by thesensor 50. - In the
data acquisition program 22a, when the sensor type information (multimeter), the sensor data (a current value and a voltage value), and the time stamp are output from thedata acquisition unit 26, the network identification information C is obtained from the network database 27 (S7). - Herein, the present embodiment is not limited to the case where only one network identification information item (e.g., network identification information C) is stored in the
network database 27, and a plurality of network identification information items may be stored therein. If a plurality of network identification information items are stored, network identification information, in which acommunication network 2 determined based on either the sensor type information or the time stamp, and ateacher terminal 3 are defined, is obtained by thedata acquisition program 22a in accordance with a predetermined determination reference. In the foregoing step S2, if the graphingscientific calculator 10 is connected to thecommunication network 2 informed by teacher A through a manual operation of the student of class B and is in a state where sensor data, etc. can be transmitted to theteacher terminal 3, the network identification information including the information regarding theconnected communication network 2 and theteacher terminal 3 of teacher A may be acquired. - As an example of a determination reference, in a case where a current-voltage experiment is conducted in teacher A's class during a second period (from 9:35 a.m. to 10:20 a.m.) of today, if the time stamp indicates a time between 9:35 a.m. and 10:20 a.m. of today, and the sensor type information indicates "multimeter", the network identification information C, in which the
teacher terminal 3 of teacher A and itsdedicated communication network 2 are designated, is network identification information to be acquired by the graphingscientific calculator 10. - In the
data acquisition program 22a, once the network identification information C is acquired, user information is further acquired from the userinformation storage area 22d, and the acquired network identification information C and user information are output to theinformation addition program 22b, along with corresponding sensor information (multimeter), sensor data (a current value and a voltage value) and time stamp. - In the
information addition program 22b, when the sensor data (a current value and a voltage value), the sensor type information (multimeter), the time stamp, the network identification information C, and the user information are output from thedata acquisition program 22a, the sensor type information (multimeter), the time stamp, the network identification information C, and the user information are added to the sensor data, and the sensor data is then output to the communication unit 25 (S8). - In the
communication unit 25, from the network identification information C added to the sensor data output from theinformation addition program 22b, acommunication network 2 to be used by teacher A and the students of class B (e.g., the Internet or a school intranet), and ateacher terminal 3 of teacher A are known (S9). Then, the sensor data (to which the network identification information C, the sensor type information (multimeter), the time stamp, and the user information are added) is transmitted to theteacher terminal 3 of teacher A, via the known communication network 2 (S10). In the foregoing step S2, if the graphingscientific calculator 10 is connected to thecommunication network 2 informed by teacher A through a manual operation of the student of class B and is in a state where sensor data, etc. can be transmitted to theteacher terminal 3, the processing herein of knowing thecommunication network 2 to be used by teacher A and the students of class B and theteacher terminal 3 of teacher A is omitted. - In the
teacher terminal 3 of teacher A, the sensor data (a current value and a voltage value) transmitted from thestudent terminal 4 of a student of class B via thecommunication network 2 is received by thecommunication unit 34. To this sensor data (a current value and a voltage value), the sensor type information (multimeter), the time stamp, the network identification information C (communication network), and the user information are added, as described above. Such sensor data is further output to thedetermination program 36a from thecommunication unit 34. - When such sensor data (a current value and a voltage value) is output from the
communication unit 34, it is determined in thedetermination program 36a whether or not the network identification information C, time stamp, and sensor type information (multimeter) added to the sensor data satisfy the determination condition by referring to the determination condition stored in the determination condition database 37 (S11). Herein, the user information is not used. - If the network identification information C and sensor type information E (multimeter) added to the sensor data match those designated in the determination condition, and the time stamp added to the sensor data is included in the time range D designated in the determination condition, the
determination program 36a determines that the network identification information C, time stamp, and sensor type information added to the sensor data satisfy the determination condition; otherwise, it is determined that those information items do not satisfy the determination condition. - In the
determination program 36a, when it is determined that the determination condition is satisfied (Yes in S11), the sensor data (a current value and a voltage value) is output to theclassification program 36b, along with the information items added to the sensor data, namely the network identification information C, the time stamp, the sensor type information (multimeter), and the user information (S13). - If it is determined that the determination condition is not satisfied on the other hand (No in S11), the sensor data is determined not to be appropriate and discarded by the
determination program 36a (S12). - After step S13, in the
classification program 36b, the sensor data (a current vale and a voltage value) output from thedetermination program 36a is classified into groups (for example, classes) according to the content of the determination condition used in the determination made in thedetermination program 36a, namely the network identification information C, the acquisition time information, and the sensor type information (multimeter) E (S14). Then, classification information designating a group (class) is added to each sensor data (a current value and a voltage value) output from thedetermination program 36a, and the sensor data is stored in thesensor database 38. Thus, the sensor data (a current value and a voltage value) is stored in thesensor data database 38 with an identification of a group to which the sensor data belongs (S15) . - Thereafter, courtesy of the
display control program 36c, the sensor data (a current value and a voltage value) acquired in the same class, in other words, the sensor data to which the same classification information is added, is acquired from thesensor data database 38, and a list of graphs generated based on the sensor data is displayed on thedisplay 33, as shown inFIG. 8 for example (S16). -
FIG. 8 is a conceptual drawing showing a display example of a list of graphs generated based on sensor data acquired in a same class on thedisplay 33. -
FIG. 8 shows three voltage-current graphs (a), (b), and (c) generated from the sensor data (a current value and a voltage value) respectively acquired by three students (α, β, and γ) in the voltage-current experiment in the same class to provide students' understanding of Ohm's law. Herein, for example, in the voltage-current graph (a), a voltage-current graph corresponding to a result of the experiment conducted by the student α, and student α's information (user information) 33a are together displayed; in the voltage-current graph (b), a voltage-current graph corresponding to a result of the experiment conducted by the student β, and student β's information (user information) 33b are displayed together; and in the voltage-current graph (c), a voltage-current graph corresponding to a result of the experiment conducted by the student γ, and student γ's information (user information) 33c are displayed together. Information of each of students α, β, and γ (user information) is displayed in the periphery of (above in the present embodiment) the voltage-current graph corresponding to an experiment result obtained by each of students α, β, and γ. - In the present voltage-current experiment, resistors having different resistance values are respectively given to students α, β, and γ, and a current and a voltage flowing on serial circuit via the resistor are measured by a multimeter which serves as the
sensor 50 and obtained as sensor data. The voltage-current graphs (a), (b), and (c) shown inFIG. 8 are generated based on the thus-measured sensor data. - As described above, in the
display system 1 according to the present embodiment, it is possible to automatically determine, through the above-described operation, whether or not the sensor data transmitted from thestudent terminals 4 of the students of class B is sensor data acquired in the same class conducted in the same classroom, based on three conditions, namely network identification information, acquisition time information, and sensor type information. - Accordingly, it no longer becomes necessary for teacher A to check whether or not the sensor data transmitted from the
student terminals 4 of the students of class B is acquired in the same class. It is thereby possible for teacher A to make the most of limited time for his or her class, without wasting the time for checking the students' sensor data. - Furthermore, a display of a list of the graphs on the
display 33 allows teacher A to comprehensively check a plurality of voltage-current graphs generated from the sensor data acquired by the students of class B. Consequently, for example, it becomes easy to determine from the displayed user information which student was able to conduct an experiment properly and which student was not. Furthermore, for example, through showing a list of the voltage-current graphs displayed on thedisplay 33 as shown inFIG. 8 to the students of class B, it becomes easier to explain the Ohm's law to the students. - On the students' side, through looking at a list, like the one shown in
FIG. 8 , displayed on thedisplay 33 of theteacher terminal 3, the students can easily understand that a current and a voltage are in a proportional relationship, and a slope of the relationship is determined by a type of a resistor (resistance value). - Thus, according to the
display system 1 of the present embodiment, it is possible to eliminate teacher's troubles, increase the time used for delivering an effective class, and immediately and easily provide information necessary to aid students' understanding. It is thereby possible to contribute to the realization of more effective class. - A display system according to a second embodiment will be described.
- The second embodiment is a modification of the first embodiment. Accordingly, repetitive descriptions will be avoided hereinafter, and only differences between the first and second embodiments will be described. For this reason, the same constituent elements will be referred to by the same reference numerals as in the first embodiment.
-
FIG. 11 is a conceptual drawing showing a configuration example of adisplay system 1 according to the second embodiment. -
FIG. 12 is a block diagram of a configuration example of an electronic circuit of a graphingscientific calculator 10 that can be used as astudent terminal 4 in the second embodiment. - In the present embodiment, as shown in
FIG. 11 , acamera 60, such as a digital camera, is connected to thestudent terminal 4.FIG. 12 shows a configuration in a case where thecamera 60 is connected to the graphingscientific calculator 10, which is an example of thestudent terminal 4. -
FIG. 11 shows the same asFIG. 1 , except that thecamera 60 is connected to thestudent terminal 4.FIG. 12 is the same asFIG. 3 , except that thecamera 60 is connected to thedata acquisition unit 26. - The
camera 60 takes a still picture or a video in accordance with a user's (student's) operation, and the imaging data to which imaging time information is added is output to thedata acquisition unit 26. Thecamera 60 is not necessarily connected to thedata acquisition unit 26 for the entire duration, and only when imaging data is transferred to thedata acquisition unit 26 does thecamera 60 need to be connected to thedata acquisition unit 26. - It is thereby possible to output imaging data to which imaging time information is added from the
camera 60 to thedata acquisition unit 26, in addition to the sensor type information and the sensor data from thedata logger 40. - If the
data acquisition unit 26 outputs the sensor type information and the sensor data to thedata acquisition program 22a along with the time stamp, thedata acquisition unit 26 also outputs the imaging data obtained from thecamera 60 and to which the imaging time information is added. - It is thereby possible for the
data acquisition program 22a to acquire, from thedata acquisition unit 26, the imaging data to which the imaging time information is added in addition to the sensor type information, the sensor data, and the time stamp. - As described in the first embodiment, the
data acquisition program 22a obtains the network identification information C from thenetwork database 27, and further obtains the user information from the userinformation storage area 22d, and outputs the obtained network identification information C and the user information to theinformation addition program 22b, along with the sensor type information, the sensor type, the time stamp, and the imaging time information. - Upon receipt of the network identification information C, the sensor type information, the sensor data, the time stamp, the user information, and the imaging data, output from the
data acquisition program 22a, to which the imaging time information is added, theinformation addition program 22b adds the sensor type information, the time stamp, the network identification information, and the user information to the sensor data, and outputs the sensor data to thecommunication unit 25. The imaging data to which the imaging time information is added is also output to thecommunication unit 25. - As described in the first embodiment, the
communication unit 25 can know thecommunication network 2 and theteacher terminal 3 from the network identification information added to the sensor data. Then, thecommunication unit 25 transmits the sensor data to which the network identification information, the sensor type information, the time stamp, and the user information are added, and the imaging data to which the imaging time information is added to theteacher terminal 3 via the knowncommunication network 2. Similar to the first embodiment, if the graphingscientific calculator 10 is connected to thecommunication network 2 informed by teacher A through a manual operation of the student of class B and is in a state where sensor data, etc. can be transmitted to theteacher terminal 3, the processing of knowing thecommunication network 2 to be used by teacher A and the students of class B, and theteacher terminal 3 of teacher A becomes unnecessary. - As shown in
FIG. 5 , when these information items transmitted from thecommunication unit 25 of each student terminal of class B are received by thecommunication unit 34 of theteacher terminal 3, thecommunication unit 34 outputs, to thedetermination program 36a, the sensor data to which the network identification information, the sensor type information, the time stamp, and the user information are added, along with the imaging data to which the imaging time information is added. - The
determination program 36a performs processing similar to that described in the first embodiment. In this processing, imaging data to which the imaging time information is added is not used. - In the
classification program 36b, as described in the first embodiment, classification information is added to each sensor data output from thedetermination program 36a, and the sensor data is stored in thesensor data database 38. In the present embodiment, the sensor data to which the classification information is added is stored in thesensor data database 38, along with the imaging data to which the imaging time information is added, which has been received by thecommunication unit 34 along with the sensor data. - As described in the first embodiment, the
display control program 36c acquires, from thesensor data database 38, a plurality of sensor data items to which the same classification information is added, and displays a list of graphs generated from the sensor data items on thedisplay 33. In the present embodiment, in addition to the graphs, the imaging data, which has been received by thecommunication unit 34 along with the sensor data, is respectively associated with the graphs and displayed in list form on thedisplay 33, along with the added imaging time information. -
FIG. 13 is a conceptual drawing showing a display example of a list of graphs generated based on the sensor data to which the same classification information (e.g., the same class) is added, along with the imaging data and the imaging time information, which have been received along with the sensor data by thecommunication unit 34. - In the example of
FIG. 13 , three neutralization curves (a-1), (b-1), and (c-1) generated based on the sensor data acquired by three students, namely students α, β, and γ, imaging data (a-2), (b-2), and (c-2) during the experiment, and the imaging time information (a-3), (b-3), and (c-3) are displayed. The imaging data may be a still image or a video. If the imaging data is a video, seek bars (a-4), (b-4), and (c-4) indicating replay positions of the videos are respectively displayed in the periphery of the imaging time information (a-3), (b-3), and (c-3), for example below the imaging time information (a-3), (b-3), and (c-3). - Next, an example of the operation of the
display system 1 according to the present embodiment having the above-described configuration will be described. -
FIGS. 14A and14B show a flow chart showing an operation example of thedisplay system 1 according to the second embodiment. - In
FIGS. 14A and14B , the same operations as those inFIGS. 10A and10B are indicated by the same step numbers, and hereinafter repetitive descriptions will be avoided. As for the operations similar to those inFIGS. 10A and10B , for example an operation similar to the step of "S3" is labeled as "S3A", so that the operations similar to those inFIGS. 10A and10B can be clearly distinguished inFIGS. 14A and14B . - In the example described hereinafter, teacher A holds class B during a second period (9:35 a.m. to 10:20 a.m.) on XX (month)/##(day)/2018, and during the class, an acid-base titration experiment in which an acetic acid solution, to which a small amount of phenolphthalein solution is added in advance, is titrated with a sodium hydroxide (NaOH) solution, and each student transmits, from the
student terminal 4 to theteacher terminal 3, sensor data (pH) obtained in the experiment and imaging data (video data during the titration) to which imaging time information is added. - Hereinafter, procedures of a typical acid-base titration experiment will be briefly described with reference to
FIG. 15 . - As shown in
FIG. 15 (a) , a teacher's-designated volume of acetic acid is precisely measured with avolumetric pipette 200, and transported into aconical flask 210. - Next, as shown in
FIG. 15 (b) , one or two drops of aphenolphthalein solution 220 are added into the acetic acid solution in theconical flask 210, and arotator 230 is further added thereto. - Next, as shown in
FIG. 15 (c) , theconical flask 210 is put on astirrer 240, which is to be activated to stir the solution with therotator 230, and a drop of aqueous sodium hydroxide is dropped from theburette 250 into theconical flask 210, while the acetic acid solution therein is being stirred. ThepH sensor 260 measures a pH of the solution in theconical flask 210. - A phenolphthalein solution is transparent in an acidic solution, and exhibits a dark red color in an alkaline solution. Accordingly, the stopping of a neutralization reaction can be checked through observation of the color of the solution. The
camera 60 takes a video of the solution in theconical flask 210 under the titration process. - Teacher A first generates, through an operation of the
key input unit 35 of theteacher terminal 3, a determination condition in which network identification information C, which in turn includes the information regarding theteacher terminal 3 and the information regarding thecommunication network 2 to be used by teacher A and the students of class B, a time range of a time stamp (2018:XX:##:09:35:00:00 through 2018:XX:##:10:25:59:59) D, and the sensor type information E (pH sensor) are designated, and causes thedetermination condition database 37 to store the generated determination condition (S1A). - Teacher A informs the graphing
scientific calculator 10 of each student of class B of the network identification information C through thecommunication unit 34 of theteacher terminal 3 through, for example, emails or a messenger application, etc., and causes thenetwork database 27 of the graphingscientific calculator 10 of each student to store the network identification information C. Alternatively, teacher A informs the students of class B of the network identification information C verbally or via writing on a black board, etc., and each of the students causes thenetwork database 27 of the graphingscientific calculator 10 to store the network identification information C (S2). Similar to the first embodiment, steps S1A and S2 may be performed either during or after the experiment, as long as the sensor data has not been yet transmitted to theteacher terminal 3. Herein, in a case where a student of class B causes thenetwork database 27 of the graphingscientific calculator 10 to store the network identification information C informed from teacher A, the student may connect the graphingscientific calculator 10 to thecommunication network 2 informed by teacher A through a manual operation so as to bring the calculator in a state where sensor data, etc. can be transmitted to theteacher terminal 3. - When an experiment actually begins, the
data logger 40 is connected to thedata acquisition unit 26 of the graphingscientific calculator 10, and the sensor 50 (pH sensor) is connected to the data logger 40 (S3). - When the sensor 50 (pH sensor) is connected to the
data logger 40, thedata logger 40 recognizes that theconnected sensor 50 is a pH sensor, and sensor type information (pH sensor), which is a recognition result, is transmitted to the data acquisition unit 26 (S4). - Furthermore, when a pH of the solution is detected by the sensor 50 (pH sensor), sensor data, which is a detection result, is transmitted to the
data acquisition unit 26 from the sensor 50 (pH sensor) via thedata logger 40. Furthermore, a user (student) can take a still image or a video during the experiment by operating thecamera 60. When the user (student) operates thecamera 60 to take a still image or a video during the experiment, image data is generated by thecamera 60, and imaging time information is added to the imaging data. When thecamera 60 is connected to thedata acquisition unit 26, the imaging data to which imaging time information is added can then be output to thedata acquisition unit 26 from the camera 60 (S5A). - Upon transmission of the sensor type information (pH sensor) ad sensor data (pH) from the
data logger 40, a time stamp is generated in the data acquisition unit 26 (S6A). The generated time stamp is output from thedata acquisition unit 26 to thedata acquisition program 22a, along with the sensor type information (pH sensor) and the sensor data (pH). The imaging data to which the imaging time information is added is also output to thedata acquisition program 22a. - In the
data acquisition program 22a, when the sensor type information (pH sensor), the sensor data (pH), and the time stamp are output from thedata acquisition unit 26, the network identification information C is obtained from the network database 27 (S7). - In the
data acquisition program 22a, once the network identification information C is obtained, the user information is further obtained from the userinformation storage area 22d, and the obtained network identification information C and the user information are output to theinformation addition program 22b, along with the sensor type information (pH sensor), the sensor data (pH), the time stamp, and the imaging time information. - In the
information addition program 22b, upon receipt of the network identification information C, the sensor type information (pH sensor), the sensor data (pH), the time stamp, and the user information (which are output from thedata acquisition program 22a), the sensor type information (pH sensor), the time stamp, the network identification information C, and the user information are added to the sensor data (pH), and the sensor data is output to thecommunication unit 25. The imaging data to which the imaging time information is added is also output to the communication unit 25 (S8A). - In the
communication unit 25, from the network identification information C added to the sensor data (pH) output from theinformation addition program 22b, acommunication network 2 to be used by teacher A and the students of class B (e.g., the Internet or a school intranet), and ateacher terminal 3 of teacher A are known (S9). The sensor data (pH), to which the network identification information C, the sensor type information (pH sensor), the time stamp, and the user information are added, is then transmitted, along with the imaging data to which the imaging time information is added, to theteacher terminal 3 of teacher A, via the known communication network 2 (S10A). In the foregoing step S2, if the graphingscientific calculator 10 is connected to thecommunication network 2 informed by teacher A through a manual operation of the student of class B and is in a state where sensor data, etc. can be transmitted to theteacher terminal 3, the processing herein of knowing thecommunication network 2 to be used by teacher A and the students of class B, and theteacher terminal 3 of teacher A is omitted. - In the
teacher terminal 3 of teacher A, these information items transmitted from thestudent terminal 4 of a student of class B via thecommunication network 2 are received by thecommunication unit 34. Furthermore, the sensor data (pH) to which the network identification information C, the sensor type information (pH sensor), the time stamp, and the user information are added is output from thecommunication unit 34 to thedetermination program 36a, along with the imaging data to which the imaging time information is added. - When the sensor data (pH) is output from the
communication unit 34, it is determined in thedetermination program 36a whether or not the network identification information C, time stamp, and sensor type information (pH sensor) added to the sensor data satisfy the determination condition by referring to the determination condition stored in the determination condition database 37 (S11). - In the
determination program 36a, when it is determined that the determination condition is satisfied (Yes in S11), the sensor data (pH) is output to theclassification program 36b, along with the information items added to the sensor data, namely the network identification information C, the time stamp, the sensor type information (pH sensor), and the user information (S13) . - If it is determined that the determination condition is not satisfied on the other hand (No in S11), the sensor data is determined not to be appropriate and discarded by the
determination program 36a (S12). - After step S13, in the
classification program 36b, each sensor data (pH) output from thedetermination program 36a is classified into groups, such as classes, according to the network identification information C, the acquisition time information, and the sensor type information (pH sensor) E (S14), and the sensor data is stored in thesensor data database 38. The sensor data (pH) classified into the same group is stored in thesensor data database 38, along with the imaging data to which the imaging time information received by thecommunication unit 34 along with the sensor data (pH) is added (S15A). - Thereafter, courtesy of the
display control program 36c, the sensor data (pH) acquired in the same class, in other words, the sensor data to which the same classification information is added, is acquired from thesensor data database 38, and a list of graphs generated based on the sensor data (pH) and associated with the user information is displayed on thedisplay 33, as shown as (a-1), (b-1), and (c-1) inFIG. 13 for example. In the present embodiment, the imaging data (a-2), (b-2), and (c-2) received by thecommunication unit 34 along with the sensor data (pH) and stored in thesensor data database 38 are displayed as a list on thedisplay 33, being associated with the graphs, along with the imaging time information (a-3), (b-3), and (c-3) respectively added to the imaging data (a-2), (b-2), and (c-2) (S16A). - In the example of
FIG. 13 , three neutralization curves (a-1), (b-1), and (c-1) generated based on the sensor data acquired during the acid-base titration experiment conducted in the same class by three students, namely students α, β, and γ, theuser information - The curve (a-1) shows an example in which a titre of sodium hydroxide was insufficient and the experiment was terminated before a point of neutralization was reached. In this case, the pH changes only to approximately 6, and it can be understood from the video data (a-2) showing the experiment under the process that the color of the solution remains transparent throughout the experiment, even before and after the experiment.
- The curve (b-1) shows an example in which a titre of sodium hydroxide (approximately 10 ml) was appropriate, and a point of neutralization was not reached. At a point of neutralization obtained through the titration with a sodium hydroxide solution, the pH rapidly changes from approximately 6 to approximately 12. The curve (b-1) shows this rapid change of pH. From the video data (b-2) showing the experiment under the process, it can be understood that the color of the solution was transparent before the experiment started, but it eventually changed to light red.
- The curve (c-1) shows an example in which the solution became alkaline because a drop of sodium hydroxide was continuously added even after the point of neutralization was reached. It can be seen from the curve that a pH increased as a sodium hydroxide solution was further added after a point where a titre of sodium hydroxide (approximately 10 ml) was completed and the pH rapidly rose from approximately 6 to approximately 12, and the solution became more alkaline.
- From the video data (c-2) showing the experiment under the process corresponding to the curve (c-1), it can be seen that the color of the solution, which was transparent before the experiment started, changed to light red after an addition of a sodium hydroxide solution (approximately 10 ml), and the red color darkened as the drop of the sodium hydroxide solution continuously was added.
- In the video data (a-2), (b-2), and (c-2), an imaging time that indicates a time when the replay should start can be set as appropriate through operating the seek bars (a-4), (b-4), and (c-4), which are displayed around (below, in this example) the video data.
- Teacher A comprehensively checks a list of curves of neutralization based on the sensor data (pH) obtained by each of the students of class B, and imaging data, etc. displayed on the
display 33 along with the user information, as illustrated inFIG. 13 , so as to know which student properly conducted the experiment, and which student did not. Furthermore, teacher A can provide effective classes through, for example, showing, to the students of class B, a list of information displayed on thedisplay 33 as shown inFIG. 13 . - On the other hand, the students of class B can also better understand the content of the experiment through looking at the list of information displayed on the
display 33 of theteacher terminal 3, as shown inFIG. 13 . Particularly, in the present embodiment, not only graphs but also imaging data can be displayed, thereby producing visual effects; thus, each student can more deeply understand content of an experiment with the aid of such visual effects. - An example where the imaging data is video data has been described; however, the present embodiment can be realized even when the imaging data is still image data. In this case, the display of the seek bars (a-4), (b-4), and (c-4) is omitted.
- If the imaging data is still image data, still image data corresponding to a single curve of neutralization among the obtained curves is not limited to one data item. For example, if it is important to check the change of color of a solution as in the foregoing acid-base titration experiment described above, it is desirable to obtain and display at least two still images showing the "before and after" of the change of the color of the solution on the
display 12 of theteacher terminal 3. - In this case, as illustrated in
FIG. 16 , thedisplay control program 36c knows the chronological order of the still images from the imaging time information added to the still image data, and displays the sets of two still images, (a-2), (b-2), and (c-2), around (below, in this example) the corresponding curves (a-1), (b-1), and (c-1), so that the still images in each set are displayed in the chronological order. - Alternatively, if there are many still images relating to a single curve of neutralization, and it is difficult to display all the images at the same time as shown in
FIG. 16 , thedisplay control program 36c may determine a chronological order of the still images from the imaging time information added to the sill image data, and perform a slide show of the still images in the chronological order around (below in this example) a corresponding curve (a-1), (b-1), or (c-1). - According to the
display system 1 of the second embodiment, as described above, not only graphs generated based on sensor data obtained in an experiment but also still or video images relating to the experiment can be displayed on thedisplay 33 of theteacher terminal 3, as illustrated inFIGS. 13 and16 ; therefore, not only can a teacher provide a productive class but students can also understand content of the experiment more deeply. - The present invention is not limited to the above-described embodiment and various modifications can be made without departing from the scope of the present invention in practical stages. The above-described embodiments include inventions at various stages, and a variety of inventions can be derived by properly combining structural elements disclosed in connection with the embodiments. For example, even if some of the constituent elements disclosed in the above-described embodiments are deleted, or some of the constituent elements are combined in a different aspect, these variations can be derived as inventions as long as the problem to be solved by the invention can still be solved and the advantageous effects can still be achieved.
Claims (8)
- A data processing apparatus comprising a processor,
the processor configured to:receive one or more sets of data output from at least one data output apparatus via a communication network, each set of the data including sensor data obtained by at least one sensor and first specifying information that specifies the data processing apparatus;determine whether or not the first specifying information included in the received one or more sets of data satisfies a predetermined condition;classify the one or more sets of data determined to satisfy the condition into a same group; andgenerate and output an output file based on the one or more sets of data classified into the same group. - The data processing apparatus according to claim 1, wherein
the predetermined condition that includes the first specifying information is generated, and
in the determination processing, it is determined whether or not the first specifying information in any of the received one or more sets of data satisfies the generated predetermined condition. - The data processing apparatus according to claim 2, wherein
in the receiving processing, the one or more sets of data is received, each set of the data further including a piece of second specifying information that specifies one communication network connected to one of the at least one data output apparatus that outputs one set of the data,
in the generation processing, the predetermined condition that includes the first specifying information and the second specifying information is generated, and
in the determination processing, it is determined whether or not the first specification information and the second specification information in any of the received one or more sets of data satisfies the generated predetermined condition. - The data processing apparatus according to any one of claims 1 to 3, wherein
in the receiving processing, the one or more sets of data is received, each set of the data further including at least one of at least one piece of acquisition time information indicating a time when the sensor data is acquired by the at least one sensor, and at least one piece of sensor type information indicating a type of the at least one sensor,
in the generation processing, the predetermined condition that includes at least one of time range information indicating a range of time and the sensor type information indicating a type of the sensor, is generated, and
in the determination processing, it is determined whether or not the first specifying information, the acquisition time information, and the sensor type information in any of the received one or more sets of data satisfies the generated predetermined condition. - The data processing apparatus according to any one of claims 1 to 4, wherein
in the receiving processing, the one or more sets of data are received, each set of the data further including at least one imaging data item, each imaging data item including imaging time information,
in the outputting processing, the output file, in which the at least one sensor data item is associated with the at least one imaging data item, is generated and output based on at least one piece of acquisition time information indicating a time when the at least one sensor data item is acquired, and at least one piece of the imaging time information included in the at least one imaging data item. - A data processing method performed by a processor of a data processing apparatus, the method comprising:
receiving one or more sets of data output from at least one data output apparatus via a communication network, each set of the data including sensor data obtained by at least one sensor and first specifying information that specifies the data processing apparatus;
determining whether or not the first specifying information included in the received one or more sets of data satisfies a predetermined condition;
classifying the one or more sets of data determined to satisfy the condition into a same group; and
generating and outputting an output file based on the one or more sets of data classified into the same group. - A program which instructs a controller of a data processing apparatus to perform:receiving one or more sets of data output from each of a plurality of information processing terminal via a communication network, the data processing apparatus and the plurality of information processing terminal being communicably connected to the data processing apparatus via the communication network, each set of the data including sensor data obtained by at least one sensor and first specifying information that specifies the data processing apparatus;determining whether or not the first specifying information included in the received one or more sets of data satisfies a predetermined condition;classifying the one or more sets of data determined to satisfy the condition into a same group; andgenerating and outputting an output file based on the one or more sets of data classified into the same group.
- A method performed by a data processing system that includes a data processing apparatus, and a plurality of information processing terminals being communicably connected to the data processing apparatus via a communication network, the method comprising:each controller of the information processing terminals:
transmitting one or more sets of data via the communication network, each set of the data including sensor data acquired by at least one sensor and first specifying information that specifies the data processing apparatus;a controller of the data processing apparatus:receiving the one or more sets of data output from each of the information processing terminals via the communication network;determining whether or not the first specifying information included in the received one or more sets of data satisfies a predetermined condition;classifying the one or more sets of data determined to satisfy the condition into a same group; andgenerating and outputting an output file based on the one or more sets of data classified into the same group.
Applications Claiming Priority (2)
| Application Number | Priority Date | Filing Date | Title |
|---|---|---|---|
| JP2018174130 | 2018-09-18 | ||
| JP2019163224A JP7521181B2 (en) | 2018-09-18 | 2019-09-06 | DATA PROCESSING APPARATUS, DATA PROCESSING SYSTEM, DATA PROCESSING METHOD, AND PROGRAM |
Publications (1)
| Publication Number | Publication Date |
|---|---|
| EP3627478A1 true EP3627478A1 (en) | 2020-03-25 |
Family
ID=68158857
Family Applications (1)
| Application Number | Title | Priority Date | Filing Date |
|---|---|---|---|
| EP19197460.9A Ceased EP3627478A1 (en) | 2018-09-18 | 2019-09-16 | Data processing apparatus and method, program, and method for data processing system |
Country Status (3)
| Country | Link |
|---|---|
| US (1) | US11971843B2 (en) |
| EP (1) | EP3627478A1 (en) |
| CN (1) | CN110909033B (en) |
Families Citing this family (1)
| Publication number | Priority date | Publication date | Assignee | Title |
|---|---|---|---|---|
| WO2022049943A1 (en) * | 2020-09-04 | 2022-03-10 | 株式会社ワコム | Position detection device |
Citations (7)
| Publication number | Priority date | Publication date | Assignee | Title |
|---|---|---|---|---|
| JP2003281671A (en) | 2002-03-20 | 2003-10-03 | Nippon Telegr & Teleph Corp <Ntt> | Multi-sensing atmospheric environment monitoring system device and monitoring method |
| JP2004354725A (en) * | 2003-05-29 | 2004-12-16 | Casio Comput Co Ltd | Learning support device and program |
| US20100198903A1 (en) * | 2009-01-31 | 2010-08-05 | Brady Corey E | Network-supported experiment data collection in an instructional setting |
| US20140267753A1 (en) * | 2013-03-15 | 2014-09-18 | Fluke Corporation | Measurement System With Image Capture Capabilities |
| EP2860596A2 (en) * | 2013-10-10 | 2015-04-15 | ABB Limited | Methods and apparatus relating to measurement instruments |
| US20160080667A1 (en) * | 2014-09-17 | 2016-03-17 | Fluke Corporation | Triggered operation and/or recording of test and measurement or imaging tools |
| WO2017165421A1 (en) * | 2016-03-22 | 2017-09-28 | Board Of Regents, The University Of Texas System | Portable system for providing broad access to micro- and nano-scale technologies |
Family Cites Families (24)
| Publication number | Priority date | Publication date | Assignee | Title |
|---|---|---|---|---|
| JP4385959B2 (en) * | 2005-02-02 | 2009-12-16 | 三菱電機株式会社 | Information collection system |
| JP2006323440A (en) * | 2005-05-17 | 2006-11-30 | Mitsubishi Electric Corp | Information collection system |
| US20120182832A1 (en) * | 2006-09-29 | 2012-07-19 | INOVA, Ltd. | Seismic data acquisition systems and method utilizing a wireline repeater unit |
| CN101458739A (en) * | 2008-11-21 | 2009-06-17 | 杭州义盛祥通信技术有限公司 | Student sport statistic evaluating and managing system and method |
| JP5499342B2 (en) * | 2008-11-28 | 2014-05-21 | 株式会社日立製作所 | Sensor node, sensor network system, and data collection method |
| FI20096232A0 (en) * | 2009-11-23 | 2009-11-23 | Valtion Teknillinen | Physical activity-based control for a device |
| KR101192443B1 (en) * | 2010-12-20 | 2012-10-18 | 주식회사 케이티 | Sensor data collecting apparatus, sensor middleware apparatus and method for processing sensor data |
| JP2014026378A (en) * | 2012-07-25 | 2014-02-06 | Nec Casio Mobile Communications Ltd | Terminal device, a server device, information process system, information processing method, and program |
| US20150347680A1 (en) * | 2013-01-10 | 2015-12-03 | Emory University | Systems, methods and computer readable storage media for analyzing a sample |
| JP6041141B2 (en) * | 2013-01-29 | 2016-12-07 | 清水建設株式会社 | Data collection system and method |
| US20140313303A1 (en) * | 2013-04-18 | 2014-10-23 | Digimarc Corporation | Longitudinal dermoscopic study employing smartphone-based image registration |
| CN104299177A (en) * | 2013-07-20 | 2015-01-21 | 郑州学生宝电子科技有限公司 | Individual student behavior acquisition system and analysis method |
| US20160063873A1 (en) * | 2014-08-29 | 2016-03-03 | Enable Training And Consulting, Inc. | System and method for integrated learning |
| WO2016203543A1 (en) * | 2015-06-16 | 2016-12-22 | 株式会社日立製作所 | Data collection device and method |
| JP6172219B2 (en) | 2015-06-29 | 2017-08-02 | カシオ計算機株式会社 | Server device, communication device, server device control method, and program |
| JP6168108B2 (en) | 2015-06-29 | 2017-07-26 | カシオ計算機株式会社 | COMMUNICATION DEVICE, SERVER DEVICE, COMMUNICATION DEVICE CONTROL METHOD, AND PROGRAM |
| US20180231946A1 (en) * | 2015-08-05 | 2018-08-16 | Tetrascience, Inc. | Methods, Systems, and Devices for Monitoring and Controlling Tools |
| US10747768B2 (en) * | 2016-06-14 | 2020-08-18 | Fuji Xerox Co., Ltd. | Data processing system and data processing method |
| JP6887146B2 (en) | 2016-08-18 | 2021-06-16 | アイキューブド研究所株式会社 | Work support equipment, work support methods, and programs |
| US20180077092A1 (en) * | 2016-09-09 | 2018-03-15 | Tariq JALIL | Method and system for facilitating user collaboration |
| US20180114377A1 (en) * | 2016-10-25 | 2018-04-26 | Finova, Inc. | Method for digital processing of automotive data and a system for implementing the same |
| JP6939135B2 (en) | 2017-06-23 | 2021-09-22 | カシオ計算機株式会社 | Electronic devices, programs, servers, graph image generation methods and graph image generation systems |
| JP6750573B2 (en) | 2017-06-28 | 2020-09-02 | カシオ計算機株式会社 | Communication device, server device, communication device control method, program, and data processing system control method |
| JP6965659B2 (en) | 2017-09-26 | 2021-11-10 | カシオ計算機株式会社 | Electronics, measurement mode setting methods, and programs |
-
2019
- 2019-09-12 CN CN201910863193.6A patent/CN110909033B/en active Active
- 2019-09-13 US US16/570,557 patent/US11971843B2/en active Active
- 2019-09-16 EP EP19197460.9A patent/EP3627478A1/en not_active Ceased
Patent Citations (7)
| Publication number | Priority date | Publication date | Assignee | Title |
|---|---|---|---|---|
| JP2003281671A (en) | 2002-03-20 | 2003-10-03 | Nippon Telegr & Teleph Corp <Ntt> | Multi-sensing atmospheric environment monitoring system device and monitoring method |
| JP2004354725A (en) * | 2003-05-29 | 2004-12-16 | Casio Comput Co Ltd | Learning support device and program |
| US20100198903A1 (en) * | 2009-01-31 | 2010-08-05 | Brady Corey E | Network-supported experiment data collection in an instructional setting |
| US20140267753A1 (en) * | 2013-03-15 | 2014-09-18 | Fluke Corporation | Measurement System With Image Capture Capabilities |
| EP2860596A2 (en) * | 2013-10-10 | 2015-04-15 | ABB Limited | Methods and apparatus relating to measurement instruments |
| US20160080667A1 (en) * | 2014-09-17 | 2016-03-17 | Fluke Corporation | Triggered operation and/or recording of test and measurement or imaging tools |
| WO2017165421A1 (en) * | 2016-03-22 | 2017-09-28 | Board Of Regents, The University Of Texas System | Portable system for providing broad access to micro- and nano-scale technologies |
Also Published As
| Publication number | Publication date |
|---|---|
| CN110909033A (en) | 2020-03-24 |
| US20200089646A1 (en) | 2020-03-19 |
| US11971843B2 (en) | 2024-04-30 |
| CN110909033B (en) | 2023-10-27 |
Similar Documents
| Publication | Publication Date | Title |
|---|---|---|
| US11704085B2 (en) | Augmented reality quick-start and user guide | |
| CN105389252B (en) | The method and device of feedback test problem | |
| JP2022141398A (en) | Information processing device, control method, and program | |
| Dutta et al. | Smart and secure fingerprint attendance system using arduino UNO with GSM alert | |
| US11971843B2 (en) | Data processing apparatus and method, recording medium, and method for data processing system | |
| CN107786769A (en) | Message processing device, image forming apparatus and information processing method | |
| CN107924407A (en) | System, method and information processing equipment for processing information | |
| JP7521181B2 (en) | DATA PROCESSING APPARATUS, DATA PROCESSING SYSTEM, DATA PROCESSING METHOD, AND PROGRAM | |
| US11657350B2 (en) | Information processing apparatus, workflow test apparatus, and non-transitory computer readable medium | |
| KR102342110B1 (en) | Control method of lecture providing system utilizing keypad apparatus for receiving correct answer information within time limit | |
| CN113495772A (en) | Experiment operation information display method, device, equipment and readable storage medium | |
| JP7481822B2 (en) | Learning support system, learning support method and program | |
| CN111951133A (en) | Method, device and storage medium for assisting problem solving | |
| US20240312201A1 (en) | Method and apparatus for recycling feedstock identification | |
| CN110598527A (en) | Machine learning-based claims insurance policy number identification method and related equipment | |
| JP7500661B2 (en) | COMPUTER DEVICE, CONTROL METHOD, AND COMPUTER PROGRAM | |
| KR100952123B1 (en) | Method and apparatus for controlling presentation application for multi-party electronic conference system | |
| US10528362B2 (en) | Utilizing function apparatus and recording medium | |
| CN102541717A (en) | Network status displaying system and method | |
| Sun et al. | Too smart to make a phone call: a focus group study on the use of smartphones among older adults | |
| KR102706982B1 (en) | Automatic generation system of thermal image distribution measurement report and automatic generation method using the same | |
| US20180176393A1 (en) | Comparing printer models | |
| JP2008070252A (en) | Test apparatus and test method thereof | |
| CN114647346A (en) | Information display method and device, computer equipment and storage medium | |
| CN117911209A (en) | Job management method, apparatus, device and storage medium |
Legal Events
| Date | Code | Title | Description |
|---|---|---|---|
| PUAI | Public reference made under article 153(3) epc to a published international application that has entered the european phase |
Free format text: ORIGINAL CODE: 0009012 |
|
| STAA | Information on the status of an ep patent application or granted ep patent |
Free format text: STATUS: REQUEST FOR EXAMINATION WAS MADE |
|
| 17P | Request for examination filed |
Effective date: 20190916 |
|
| AK | Designated contracting states |
Kind code of ref document: A1 Designated state(s): AL AT BE BG CH CY CZ DE DK EE ES FI FR GB GR HR HU IE IS IT LI LT LU LV MC MK MT NL NO PL PT RO RS SE SI SK SM TR |
|
| AX | Request for extension of the european patent |
Extension state: BA ME |
|
| STAA | Information on the status of an ep patent application or granted ep patent |
Free format text: STATUS: EXAMINATION IS IN PROGRESS |
|
| 17Q | First examination report despatched |
Effective date: 20210504 |
|
| STAA | Information on the status of an ep patent application or granted ep patent |
Free format text: STATUS: THE APPLICATION HAS BEEN REFUSED |
|
| 18R | Application refused |
Effective date: 20221213 |