EP3616096B1 - Anomaly and causation detection in computing environments - Google Patents
Anomaly and causation detection in computing environments Download PDFInfo
- Publication number
- EP3616096B1 EP3616096B1 EP18791513.7A EP18791513A EP3616096B1 EP 3616096 B1 EP3616096 B1 EP 3616096B1 EP 18791513 A EP18791513 A EP 18791513A EP 3616096 B1 EP3616096 B1 EP 3616096B1
- Authority
- EP
- European Patent Office
- Prior art keywords
- anomaly
- data
- data instances
- segments
- tokenized
- Prior art date
- Legal status (The legal status is an assumption and is not a legal conclusion. Google has not performed a legal analysis and makes no representation as to the accuracy of the status listed.)
- Active
Links
Images


Classifications
-
- G—PHYSICS
- G06—COMPUTING OR CALCULATING; COUNTING
- G06F—ELECTRIC DIGITAL DATA PROCESSING
- G06F21/00—Security arrangements for protecting computers, components thereof, programs or data against unauthorised activity
- G06F21/50—Monitoring users, programs or devices to maintain the integrity of platforms, e.g. of processors, firmware or operating systems
- G06F21/57—Certifying or maintaining trusted computer platforms, e.g. secure boots or power-downs, version controls, system software checks, secure updates or assessing vulnerabilities
- G06F21/577—Assessing vulnerabilities and evaluating computer system security
-
- G—PHYSICS
- G06—COMPUTING OR CALCULATING; COUNTING
- G06F—ELECTRIC DIGITAL DATA PROCESSING
- G06F21/00—Security arrangements for protecting computers, components thereof, programs or data against unauthorised activity
- G06F21/50—Monitoring users, programs or devices to maintain the integrity of platforms, e.g. of processors, firmware or operating systems
- G06F21/55—Detecting local intrusion or implementing counter-measures
- G06F21/552—Detecting local intrusion or implementing counter-measures involving long-term monitoring or reporting
-
- G—PHYSICS
- G06—COMPUTING OR CALCULATING; COUNTING
- G06N—COMPUTING ARRANGEMENTS BASED ON SPECIFIC COMPUTATIONAL MODELS
- G06N20/00—Machine learning
-
- G—PHYSICS
- G06—COMPUTING OR CALCULATING; COUNTING
- G06N—COMPUTING ARRANGEMENTS BASED ON SPECIFIC COMPUTATIONAL MODELS
- G06N20/00—Machine learning
- G06N20/20—Ensemble learning
-
- H—ELECTRICITY
- H04—ELECTRIC COMMUNICATION TECHNIQUE
- H04L—TRANSMISSION OF DIGITAL INFORMATION, e.g. TELEGRAPHIC COMMUNICATION
- H04L63/00—Network architectures or network communication protocols for network security
- H04L63/14—Network architectures or network communication protocols for network security for detecting or protecting against malicious traffic
- H04L63/1408—Network architectures or network communication protocols for network security for detecting or protecting against malicious traffic by monitoring network traffic
- H04L63/1425—Traffic logging, e.g. anomaly detection
-
- G—PHYSICS
- G06—COMPUTING OR CALCULATING; COUNTING
- G06F—ELECTRIC DIGITAL DATA PROCESSING
- G06F2221/00—Indexing scheme relating to security arrangements for protecting computers, components thereof, programs or data against unauthorised activity
- G06F2221/03—Indexing scheme relating to G06F21/50, monitoring users, programs or devices to maintain the integrity of platforms
- G06F2221/034—Test or assess a computer or a system
-
- G—PHYSICS
- G06—COMPUTING OR CALCULATING; COUNTING
- G06N—COMPUTING ARRANGEMENTS BASED ON SPECIFIC COMPUTATIONAL MODELS
- G06N5/00—Computing arrangements using knowledge-based models
- G06N5/02—Knowledge representation; Symbolic representation
- G06N5/022—Knowledge engineering; Knowledge acquisition
- G06N5/025—Extracting rules from data
-
- G—PHYSICS
- G06—COMPUTING OR CALCULATING; COUNTING
- G06N—COMPUTING ARRANGEMENTS BASED ON SPECIFIC COMPUTATIONAL MODELS
- G06N5/00—Computing arrangements using knowledge-based models
- G06N5/04—Inference or reasoning models
- G06N5/046—Forward inferencing; Production systems
Definitions
- the present technology relates generally to digital security, and more particularly, but not by limitation, to systems and methods that detect anomalies in computing environments that are indicative of malicious or otherwise unwanted behavior within, or performed by, the computing environment.
- This anomaly detection process is enhanced using methodologies for detecting and isolating sources of the anomalies.
- These methods and systems include processes for using unstructured log files to detect computing environment anomalies.
- a security platform employs a variety of techniques and mechanisms to detect security related anomalies and threats in a computer network environment.
- the security platform is "big data” driven and employs machine learning to perform security analytics.
- the security platform performs user/entity behavioral analytics (UEBA) to detect the security related anomalies and threats, regardless of whether such anomalies/threats were previously known.
- UEBA user/entity behavioral analytics
- the security platform can include both real-time and batch paths/modes for detecting anomalies and threats. By visually presenting analytical results scored with risk ratings and supporting evidence, the security platform enables network security administrators to respond to a detected anomaly or threat, and to take action promptly.
- U.S. Patent Application Publication No. US 2006/167917 A1 proposes a system that automates the self-organization of collectives of computational entities.
- One variant of the proposed solution provides a multi-agent system architecture with a plurality of interconnected system layers, including structural components, analytical functions, active functions and functional applications.
- these system layers consist of a distributed computer and communications network of multi-functional Intelligent Mobile Software Agents (IMSAs) in a multi-agent system.
- IMSA analytical methods and group learning processes are organized.
- active IMSA simulation modeling and group scenario generation and decision-making processes are organized.
- IMSA cooperation for aggregation and re-aggregation processes is organized on a further layer.
- IMSA inter-team rivalry and coalition formation and evolution are organized in an additional layer. The combination of these complex processes allows active network plasticity and automated programming functionality of later layers.
- functional applications are at the final layer.
- an electronic device that performs counterfactual testing.
- the electronic device accesses a functional representation of a financial history of a user, where the functional representation specifies a financial output value based on input values and a behavioral pattern, and the behavioral pattern specifies a relationship between at least a pair of the variables associated with a dimension in the financial history.
- the electronic device modifies the functional representation based on a financial circumstance that is different than financial circumstances in the financial history.
- the electronic device calculates the financial output value using the functional representation and the input values, and a modified financial output value using the modified functional representation and the input values.
- the electronic device compares the financial output value and the modified financial output value. Based on the comparison and a testing metric, the electronic device determines a result of the counterfactual testing.
- the present disclosure is directed to various embodiments of systems and methods that use unsupervised machine learning to detect anomalous activity and isolate a source or sources thereof.
- an input stream of data instances is received.
- the input stream can include data instances of behavior or activity of a computer environment.
- a computer environment can include an individual computing system as well as a plurality of computers or other computing devices such as a network.
- the input stream can be obtained from any method that would be known to one skilled in the art.
- the data instances are obtained over a period of time and each of the data instances are time stamped.
- Various analyses described herein examine the data instances over all or a portion of the period of time for which the input stream is collected. Anomalies can be detected within this input stream by examining and comparing principal values (or at least one principal value) and their corresponding categorical attributes as they changed over time. These changes are identified as anomalies, according to various embodiments. Further inspection of the anomalies may confirm or eliminate the anomalies as indicative of malicious behavior or other computing environment issues.
- a cause or causes of the anomaly are located through a process of counterfactual processing.
- An exemplary process of counterfactual processing uses reductionism and elimination to isolate principal values and/or corresponding categorical attributes that contribute to the anomaly.
- these anomalous principal values and/or corresponding categorical attributes are then traced back to a source such as a user, a computing system, a network component, or the like (generally referred to as a source point).
- This source point can then be identified and flagged for further review.
- the source point is automatically remediated. For example, if the source point is a computing system and the anomaly that is detected is a spike in traffic between the computing system and a foreign server, the remediation can comprise automatically blocking network access for the computing system until a full review of the computing system has been conducted.
- FIG. 1 is a high level schematic diagram of an exemplary computing architecture (hereinafter architecture 100) of the present technology.
- the exemplary architecture 100 comprises an exemplary anomaly detection and causation detection system 105 (hereinafter also referred to as exemplary system 105 or system 105 for short), which in some embodiments comprises a server or cloud-based computing device configured specifically to perform the analyses described herein. That is, the system 105 in some embodiments is a particular purpose computing device that is specifically designed and programmed (e.g., configured or adapted) to perform any of the methods described herein.
- the system 105 can also comprise a plurality of distributed computing systems that cooperatively provide the features of the system 105. For example, individual ones of the plurality of distributed computing systems can provide one or more unique functions or services.
- the system 105 can comprise a cloud computing environment or other similar networked computing system.
- the system 105 can be coupled with an input source 110 that provides an input stream to the system 105.
- An input source 110 can comprise, for example, a computing system, an enterprise network, a plurality of computing systems arranged as a network, virtual machines, application(s), network tap(s), services, a cloud, containers, or other similar computing environment that creates data instances.
- the input source 110 comprises a database or data store that stores pre-obtained data from any of the aforementioned sources for use in accordance with the present disclosure.
- the system 105 comprises a processor 115 and memory 120 for storing instructions.
- the memory 120 can include an input stream interface module 125, an input stream parser module 130, an anomaly detection module 135, a counterfactual processing module 140, and a remediation module 145.
- the terms "module” may also refer to any of an application-specific integrated circuit ("ASIC"), an electronic circuit, a processor (shared, dedicated, or group) that executes one or more software or firmware programs, a combinational logic circuit, and/or other suitable components that provide the described functionality.
- ASIC application-specific integrated circuit
- the system 105 receives an input stream from the input source 110 via the input stream interface module 125.
- An input stream may include a plurality of data instances that are collected over a period of time.
- the individual data instances (or components thereof) may be time stamped so that a chronological order can be maintained for the data instances.
- the exemplary system 105 can evaluate the data instances over time to detect anomalous behavior.
- anomalous behavior can include any deviation in the data instances as viewed over time. For example, if the data instances are collected for a network such as a cloud, changes in resource utilization of a service within the cloud can be identified as anomalous. In another example, a brief spike in file transfer rates between a computing device and another computing device (possibly in a foreign country) can be flagged as anomalous.
- the present disclosure is not intended to be limited to unsupervised machine learning and in some embodiments can incorporate other machine learning methods.
- user feedback can be incorporated into an anomaly score via supervised machine learning techniques, or at least partially supervised or a mixture that is based on how unusual the deviation/anomaly is relative to models of historical behavior of the system 105, as well as how it compares to other anomaly instances that have been indicated as important.
- unsupervised machine learning allows the system 105 to evaluate only the data instances available and examine these data instances for anomalous behavior in a self-referential manner. That is, in various embodiments, the data instances are modeled for the time period for which data instances are collected and these data instances are used without referencing pre-generated behavior profiles or other similar profiles.
- pre-generated behavior profiles may be advantageous in some embodiments, if available, but these profiles are not required.
- Changes in data instances over time can be flagged as anomalous if the changes have a magnitude that is unexpected.
- the exemplary system 105 need not rely on rigid thresholds or rules for determining if changes in the data instances are anomalous, but such information can be used to confirm or validate the anomaly.
- the system 105 can calculate a probability of a current behavior based on historical behavior, where low probability events are classified as anomalies. Again, the use of thresholds or rules is not required, but is also not prohibited.
- each data instance is comprised of at least one principal value that represents an aspect or object of the computing environment that is to be measured for anomalies.
- principal values include network traffic volume, memory access and/or usage, processor usage rates, file transfer, file access, device access, and so forth.
- the at least one principal values selected can be a subset of all available principal values in the data instances.
- the principal values selected for the data instances can be user-selected or user-defined, or can be based on prior knowledge, such as prior instances of anomalous network activity. For example, if prior anomalies in increased CPU usage in a cloud were linked to malicious behavior, the principal values could include CPU usage aspects.
- the data instances can be selected based on predefined understanding of the data type, or automatically by the system 105 based on data characteristics.
- a principal value comprises corresponding categorical attributes and values thereof.
- categorical attributes could include users, system ID, login locations, and so forth.
- the exemplary input stream parser module 130 may be executed to separate or parse the input stream into data instances that are ordered in time. That is, in various embodiments, the data instances are collected over a period of time and time stamped as noted above.
- the input stream parser module 130 can determine the influence that instances of the collected data have on the computing environment using the principal values ⁇ (or at least one principal value) and corresponding set of categorical attributes a j i .
- a principal value v is log on time and two categorical attributes a j 1 ⁇ jim jill greg , which are indicative of users and a j 2 ⁇ home work , which are indicative of a location. Additional or fewer categorical attributes can be considered.
- the input stream parser module 130 converts the principal value and categorical attributes into a collection of sets (8:50am, jim, work); (7:40am, jill, work); and (6:45pm greg, home).
- Other similar tuples can be created for other types of data sets, and can include a combination of numerical and/or non-numerical values.
- anomaly influence aims to understand the way that the categorical attributes are influencing the anomalies that are located by analyzing the principal value v.
- bucketing e.g., grouping
- the anomaly detection module 135 then applies one or more set functions f : U ⁇ R where U ⁇ v i : t i v i , ... ⁇ D to generate a set of features.
- the value of a feature for the kth bucket is thus f B k .
- the principal value can include any of numerical values, categorical values, combinations thereof, or other similar principal value types that would be known to one of ordinary skill in the art with the present disclosure before them.
- Examples of a numerical principal values as provided above would include 8:50 (am), 100 (gigabits of data), 30 (memory access operations), 80% (CPU usage), and so forth.
- Examples of categorical principal values include names, locations, or other non-numerical data.
- the suitable anomaly detection algorithm will take as inputs bucket features f B i for buckets chronologically earlier in time than a current bucket j, i.e., for i ⁇ j, and then generate an anomaly score which corresponds to how anomalous is the value f B j for the current bucket j.
- the operation for the exemplary algorithm can be expressed as f B j , f ( B i : i ⁇ j ⁇ s where s is the anomaly score.
- an exemplary anomaly detection algorithm tries to predict a distribution for a new feature value based on relevant historical data and the time the feature value occurs.
- the exemplary anomaly detection algorithm can account for multiple effects, such as slowly changing level, periodic patterns, weekday/weekend differences and recurrent patterns that relate to the calendar. For example, if a prediction is being made for 10 am on Monday morning, the anomaly distribution algorithm will estimate the probability distribution of values for the feature based on historical behavior for Monday mornings around that time and may also account for differences between days of the month or Mondays of the month. In some embodiments, a test is made to check if there is a statistically significant over occurrence of large predictions errors which coincide with a particular calendar feature.
- the exemplary algorithm can calculate the chance of seeing a given count (or higher) of large prediction errors for a particular day of month, day of week and week of month, say the 2nd Monday of each month, and so on. In various embodiments, if this chance is small then it is typically appropriate to estimate a correction to the predicted distribution which depends on this feature, i.e., correct the predictions with information about previous of the same type of calendar day.
- a ⁇ 1 denotes any value from the set of possible values for the first type of categorical attribute.
- Examples of the type of categorical attribute include user and location.
- the exemplary counterfactual processing module 140 may selectively remove portions of the data instances corresponding to each categorical attribute, recalculate the anomaly scores, and determine if removal of the categorical attributes reduces or removes the anomaly. If removal does reduce or remove the anomaly, it can be determined that the object of the computing environment responsible for producing the removed categorical attributes is likely a source (could be one of many) for the anomaly. This process, in various embodiments, does not categorize the detection of an anomaly as a malicious or nefarious event, but instead detects the anomaly and flags associated portions of the computing environment for further consideration or review.
- the counterfactual processing module 140 can provide a mechanism for asking and answering questions such as, for example, what would the situation be like if all the data labelled with a given attribute were removed, or what it would be like if all the data except that labelled with a given attribute were removed.
- these counterfactual processing can be executed very efficiently depending on the function.
- a mean e.g., numerical principal value
- the system 105 is not required to store all the data in a bucket, but only additionally maintain a count and mean of values for each distinct value of each categorical attribute.
- various embodiments ask whether the anomaly scores are lower when a portion of the data instances with specific categorical attributes are removed and the remaining data instances are rescored. If yes, the specific categorical attributes whose data instances were removed likely contributed to the discrepant anomaly score.
- counterfactual reasoning agrees with knowledge available for countably additive functions like count or sum. For example, if it is observed first that the count is unusually high, and then observed that, if a particular category had not occurred, the count is normal. In this example, it seems reasonable to conclude that the "behavior" of that particular category caused the anomalous score.
- the system 105 may use a regularity approach for understanding causation (i.e. "B causes C” if "whenever B occurs C occurs"). More specifically, it is known that the categorical attribute a j i influences an anomaly score of a bucket B k if the output of an anomaly detection algorithm (i.e., score of the bucket) is roughly the same in all alternative worlds (such as removing any subset of the data instances which are not labeled with a j i ) in which all the data instances labeled a j i exist (e.g., whenever B occurred, C also occurred).
- a regularity approach for understanding causation i.e. "B causes C” if "whenever B occurs C occurs”
- the categorical attribute a j i influences an anomaly score of a bucket B k if the output of an anomaly detection algorithm (i.e., score of the bucket) is roughly the same in all alternative worlds (such as removing any subset of the data instances which
- Examples of such set functions include determining maximum or minimum values of the principal values in the bucket, i.e., max v i : t i v i , ... ⁇ B k and min ⁇ v i : t i v i , ... ⁇ B k ⁇ .
- the system 105 may determine that a bucket minimum is unusually low and that the bucket minimum coincides with a particular categorical attribute. In that case, it seems reasonable to conclude that the "behavior" of that categorical attribute caused the anomalously low score in this example.
- exemplary processes above can be generally referred to as a process for creating and using a behavioral profile of a computing environment.
- the behaviors of the computing environment are assessed for anomalous activity/behaviors.
- the remediation module 145 may be executed to remediate the cause or causes in some embodiments.
- the specific methods by which the remediation module 145 remediates a cause are highly dependent upon the type of anomaly detected. For example, if the anomaly includes a high rate of access to a particular database, the remediation module 145 may restrict access privileges for the database until the anomaly is reviewed. If the anomaly is unusually frequent file transfers (e.g., exfiltration) of high volumes of data outside a protected network, the remediation module 145 may restrict file transfers by specifically identified machines in the network. This could occur through changing firewall policies or preventing access to any external network by the machines.
- the present disclosure provides various embodiments of systems and methods to detect anomalies within computing environments and deduce the cause or causes of those anomalies.
- the systems and methods can detect unusual events, rates, metrics and so forth for any computing environment.
- multiple anomalies can be present and detected by the systems and methods herein.
- the systems and methods can detect both exfiltration of data and excessive login attempts.
- FIG. 2 is a flowchart of an example method 200 of detecting anomalous activity in a computing environment and determining one or more causes for the anomalous activity.
- the example method 200 comprises a step 205 of receiving an input stream of data instances for a time series.
- an input stream can be received from a computing environment.
- the time series can include any span of time desired.
- the method includes evaluating the input stream that includes data that spans over a period of time.
- the example method 200 can involve using unsupervised machine learning, inasmuch as the data utilized is that which is included in the input stream only. That is, the entirety of the analysis, in some embodiments, involves the input stream without using pre-determined or pre-configured metrics for assessing the data instances of the input stream.
- the data instances of the input stream are time stamped.
- the data instances also comprise at least one principal value, and each principal value comprises a set of categorical attributes.
- the example method 200 includes a step 210 of generating anomaly scores for each of the data instances over continuous time intervals. That is, the data instances may be scored in a chronological manner such that anomaly scores along the timeline are calculated.
- the example method 200 then includes a step 215 of detecting a change in the anomaly scores over the continuous time intervals for the data instances. Stated otherwise, the example method 200 examines the scores calculated for the buckets of data instances (as described above) and locates variances in the scores that are indicative of an anomaly. In some embodiments, the user can specify how much scores can deviate over time before the deviations are flagged as an anomaly.
- the principal value is network traffic volume
- the network traffic volume rates change only slightly (e.g., +/- 5%)
- these discrepancies in network traffic volume are not anomalous, whereas a change of more than 10% may be flagged as anomalous.
- an anomaly score is a normalized measure of how big the deviation is, and the larger the score the more unusual the deviation.
- the system 105 characterizes historical deviations using a density function, i.e., a chance f(x) of seeing a deviation x in the value of the set function.
- the anomaly score in some embodiments, is related to the chance of seeing a deviation which is at least as unlikely, i.e. the total chance of seeing any value y for which f(y) ⁇ f(x).
- a fixed cutoff on the anomaly score can be utilized, i.e., an anomaly is something which should occur rarely based on historical data, so has a score greater than a fixed threshold.
- the score may therefore amount to a dynamic threshold since it is based on the data characteristics.
- the system 105 separately and precisely controls the rate at which the system 105 generate alerts at a specific severity based on the anomaly score, i.e., the system 105 does not allow this to exceed (over a very long time frame, although it can exceed it for shorter time frames) more than a certain value. Higher severity alerts are allowed less frequently, according to some embodiments.
- the example method 200 includes a step 220 of identifying which of the set of categorical attributes of the data instances caused the change in the anomaly scores using a counterfactual analysis.
- FIG. 3 illustrates an example method 300 of counterfactual analysis.
- the example method 200 can include an optional step 225 of generating recommendations for remediating the set of categorical attributes to remediate a malicious behavior or other underlying cause of the anomaly.
- the system can suggest that users not be allowed to log in from remote locations if categorical attributes indicate that users are logging in after permissible log in hours when remote.
- the system can suggest that all devices that are used to access a particular database use a higher level of authentication in response to detecting anomalous activity (e.g., high level of access requests) with respect to the database.
- FIG. 3 is a flowchart of an example method 300 of counterfactual analysis, which is an example embodiment of the identifying step 220 in FIG. 2 .
- the example method 300 comprises a step 305 of removing at least a portion of the data instances. For example, data instances associated with a device on a network can be removed.
- the example method 300 includes a step 310 of regenerating anomaly scores for each of the data instances over the continuous time intervals.
- a determination is made in step 315 if the regenerated anomaly scores are improved (e.g., by the removal that used "counterfactual" processing) compared to the anomaly scores.
- anomaly scores are improved (e.g., variances in anomaly scores are removed and the anomaly scores are substantially consistent with one another), then at least a portion of the categorical attributes are identified as anomalous categorical attributes and a cause of the anomalous activity in step 320 of the example in FIG. 3 . Stated otherwise, an improvement in an anomaly store is a lower score (e.g., the deviation is less unusual), according to various embodiments.
- the example method 300 returns to step 305 and a second portion of the categorical attributes are removed and steps 310 and 315 are repeated. This process may continue until a cause or causes of an anomaly are determined.
- the system 105 allows for multiple causes of an anomaly, i.e. it is possible that two distinct categorical attributes both contribute to the anomaly, and the system 105 will report each cause.
- the system 105 can order the attributes in such a way that testing can terminate when the system 105 locates an attribute which doesn't "cause" an anomaly.
- the system 105 can compute a positive score for how influential a categorical attribute is, with zero meaning not influential at all.
- the counterfactual processing comprises efficiently subtracting components from a behavioral profile (e.g., analysis of the input stream) until the component contributing to the unusual behavior is isolated and located.
- a behavioral profile e.g., analysis of the input stream
- the systems and methods can utilize a regularity analysis rather than a counterfactual analysis.
- the regularity analysis comprises identifying when a specific categorical attribute of the set of categorical attributes influences the anomaly score for the data instances if an output of an anomaly detection algorithm is approximately identical for alternative cases in which all the data instances with that specific categorical attribute exist.
- FIG. 4 is a flowchart of another example method, example method 400, of anomaly and causation detection according to various embodiments.
- the example method 400 includes a step 405 of receiving an input stream of data instances.
- the data instances in the input stream are time stamped.
- the example method 400 includes a step 410 of separating the data instances into at least one principal value and a set of categorical attributes, as well as a step 415 of grouping the data instances into groups based on continuous time intervals. It will be understood that, in various embodiments, each of the continuous time intervals has a length that represents a duration of the interval.
- the example method 400 includes a step 420 of applying set functions to each of the groups to generate features related to the principal value for that interval, and a step 425 of generating an anomaly score for each of the groups using an anomaly detection algorithm.
- the example method 400 comprises either (or both) a step 430 of applying a counterfactual analysis to identify which of the set of specific categorical attributes for a group is influencing the one or more anomalies in the groups that are indicative of the anomalous activity in the computing environment; or a step 435 of performing a regularity analysis to identify which of the set of specific categorical attributes for a group is influencing the one or more anomalies in the groups.
- Some embodiments disclosed herein can, but are not required to implement counterfactual processing. Also, some embodiments, such as the following embodiments, contemplate the use of unstructured log files in anomaly detection.
- the input stream of data instances used in an analysis can include unstructured log files or data streams. These unstructured log files and/or individual data instances are time stamped, the exact classification or composition of data instances may not be readily ascertainable without additional information or analysis.
- the present disclosure provides a means for taking these unstructured log files and converting them into an input stream that is useful for anomaly detection.
- classification of unstructured log files is useful for anomaly detection
- the systems and methods disclosed herein are also useful for more general time series analysis methods as well. For example, it can be used for computing device forecasting such as predicting log data occurrences over the next week, or summarization such as providing a clear condensed view of the types of data that exist in a log file.
- the present disclosure includes embodiments that are configured to obtain the unstructured log files and covert the same into input that is valuable for anomaly detection.
- the present disclosure provides methods and system for classifying and grouping unstructured data instances together in order to convert the unstructured data instances into a format that is usable for anomaly detection.
- unstructured data is defined as data that is obtained from a computing environment, where the unstructured data is not in a format that is utilizable in anomaly detection. If the monitored data of a computing environment is unstructured, it is possible that relevant data (e.g., data that would be indicative of an anomaly) in the input stream may go undetected. The resultant anomaly detection processes that use these erroneous input streams may result in deleterious effects, such as increases in malware distribution or poor computing environment performance.
- requiring system administrators and/or application developers to output computing environment data in a format that is acceptable for anomaly detection may be onerous or performed improperly.
- unstructured log files are unique to computing technologies. Each computing system has a unique permutation of software, firmware, hardware, network configurations, and so forth that generate unstructured log files (e.g., input streams). Even variances between individual computing environments can result in the computing environments creating unstructured log files that are dissimilar. Thus, a need is present for systems and methods that can utilize machine learning to convert these unstructured log files into a format that is acceptable for anomaly detection. Again, a large proportion of log data from computing environments is unstructured. Unstructured logs are difficult, if not impossible to understand, summarize, visualize or analyze without post-processing. Generic processes for adding structure via parsing is time consuming and error prone.
- the systems and methods herein utilize field time search extraction and UI visualization based on machine learning as compelling tool for managing and converting unstructured log files.
- These systems and methods can reverse engineer and categorize contents of an unstructured log file.
- these systems and methods take advantage of an inherent property of many unstructured log files, which is that word ordering in log files is generally a predictive and repeatable metric.
- a network traffic log will present the same types of content fields in a particular order based on an application that generates the network traffic log. That is, log files typically possess repeating patterns of data, although the values of these patterns of data may vary.
- these methods comprise an analysis phase that is performed on received unstructured log files.
- unstructured log files comprise a time stamp and unstructured text.
- Machine learning is used to classify the unstructured text prior to anomaly detection.
- the process of classifying comprises grouping and characterizing the unstructured test data so as to provide the structure necessary for anomaly detection. Based on the classifications, anomaly detection algorithms are performed on the converted or structured log files.
- a dashboard is also provided to the user to provide understanding and visualization of the unstructured logs file for identification of anomalous unstructured log files.
- the machine learning-based classification processes disclosed herein can assist in supporting additional data analysis and filtering tools such as grok filter.
- the machine learning classification can be used to seed and maintain the input to a grok filter.
- the machine learning capabilities disclosed herein for classifying unstructured log files provides a set of candidate patterns for categorical messages.
- machine learning will not know what entity is represented by a token.
- a token may be a user or a host.
- some embodiments contemplate manual intervention to add this context.
- the classified output of machine learning in this disclosed can be used to 'seed' grok pattern creation where the machine learning patterns can be augmented and edited by users.
- the present disclosure allows for the conversion of unstructured log files by machine learning processes that include, but are not limited to, classification of unstructured data that also includes content grouping and characterization.
- machine learning processes that include, but are not limited to, classification of unstructured data that also includes content grouping and characterization.
- While some embodiments are utilized for time-series anomaly detection and forecasting, some embodiments disclosed herein can also be utilized for operations such as outlier data detection, data imputation analyses, data clustering, and other similar operations.
- FIG. 5 illustrates an example method of processing an unstructured log file into a form that is usable for anomaly detection.
- the unstructured log file conversion processes disclosed herein allow for grouping of "similar" messages together into categories.
- Machine learning processes are implemented to essentially reverse engineering unstructured log statements, which allows for grouping and classification.
- the use of a training dataset is permissible but not required as machine learning is utilized across the entire the unstructured log file.
- the conversion of an unstructured log file to a structured representation that can be utilized for anomaly detection can include steps such as tokenization, filtering, weighting, comparing, category assigning, and category defining - just to name a few.
- steps such as tokenization, filtering, weighting, comparing, category assigning, and category defining - just to name a few.
- the unstructured log file is not required to be converted or transformed into a structured log file per se, but the contents of the unstructured log file are processed through categorized and/or grouping so as to be usable in an anomaly detection process.
- Unstructured log file categorization allows for more granularity in terms of determining the types of messages that are anomalous, and also identifying anomalies such as rare messages that may be lost in overall detection.
- an unstructured log file belonging to a computing environment is received in step 502.
- the unstructured log file includes the output of a computing process. Examples include a runtime software log file, a hardware log file, network traffic, or any other log file that would be generated in or by a computing environment or a component thereof.
- the unstructured log file is time stamped. In some processes, data instances inside the unstructured log file are individually time stamped. In other embodiments, each data instance in the unstructured log file is assigned or attributed the time stamp of the unstructured log file. In general, the unstructured log file is associated with temporal data that is indicative of a time frame for the data instances within the log file.
- segments of an unstructured log file are tokenized in step 504.
- tokenization rules are implemented to initially identify sets of characters in the unstructured log file.
- the tokenization rules involve breaking a message down into segments or words.
- a message could include an entire unstructured log file or a portion of an unstructured log file.
- only certain components of a message are tokenized. For example, letters and numbers are tokenized while whitespaces or blank entries are not tokenized. Other characters such as underscores, dots, hyphens, and punctuation are individually evaluated. Underscores are not tokenized if at the beginning or end of a message, but are tokenized if present elsewhere. Dots are not tokenized if at the beginning or end of a message, but are tokenized if present elsewhere. The same rules apply for hyphens as those that apply to underscores and dots. Other types of punctuation are not tokenized.
- the following examples are segments that would be tokenized based on the rules: started; starting; David; packets_sent; www.prelert.com; gb030976; and prelert-solaris.
- the tokenization configurations and rules can be tuned as desired, or could be adapted based on feedback into the system. For example, if certain information that is not tokenized or is excluded, the rules can be adjusted to ensure that these data are correctly identified.
- the method includes a step 506 of filtering or removing a portion of the tokens based on a set of filtering criteria.
- filtering rules will remove from consideration a portion of the tokens generated in the prior steps. While tokenization removes a portion of unwanted data from the unstructured log file, the filtering process can further refine or strip data.
- tokens corresponding to numbers up to and including base 16; including dots
- tokens corresponding to date words such as Jan, Feb, Wednesday, etc. are filtered out.
- tokens corresponding to numbers with trailing units, such as 10214K are filtered out.
- the filter can be tuned to exclude or remove other field names based on user-defined input.
- filter enhancements can be utilized that account for binary-to-text encoding schemes such as base 64, or a length heuristic plus character frequencies. Other enhancements allow for SQL truncated statements, usernames and/or hostnames, or user-defined and configurable filtering.
- Heuristics apply on a case-by-case or type basis.
- tokens will likely be long and will use a specific character set. Therefore, to detect tokens which are encoded strings the system is configured to exclude strings less than a certain character count and to check for strings which only contain characters from an appropriate set.
- character frequency histograms are a useful feature vector for identifying a variety of data types.
- the system will use pre-trained classifiers for data types that the system is intended to identify. These would be provided to the user with the product and the user would select one (or more) from a list to add to a given filtering specification, based on their understanding of the data types present in their log files.
- the system may not possess, a-priori the complete list of possible data types this is not a case of choosing between a set of alternatives.
- the system can allow for the possibility that a token isn't one of the defined types or is ambiguous. False positives are particularly damaging for this case (since the token would be removed) and this would be reflected by the system in the training objective.
- the plan is, using a corpus of training data comprising a diverse set of example log files, to train a collection of binary classifiers that identify if a token belongs to a given type, for example, SQL fragment, Base 64 encoded blob, and so forth. These would be trained to strongly penalize FP at the expense of FN, i.e. a given classifier will only suggest a category if it is confident. Then, the system will test each token against the collection of selected classifiers and identify it as having a given type only if it is unambiguous.
- the system will evaluate the viability of this approach by examining how well the classifier generalizes across our corpus. Only classifiers for data types that have good error characteristics on the test set would be provided to end users. As a possible refinement the system can be configured to train margin classifiers on combinations of possible data types and use these (if the margin is large) to decide between ambiguous types suggested above.
- FIG. 6 illustrates an example unstructured data segment 600 from an unstructured log file that is tokenized 602, and filtered 604.
- the method can include a step 508 of applying a weight to one or more of the filtered, tokenized segments. That is, the segments of the unstructured log files have been both tokenized and then filtered to produce the filtered, tokenized segments.
- tokens/words that can be found in a dictionary are more likely to define a category than non-dictionary tokens.
- parts of speech, such as verbs are more important to categorization than other parts of speech.
- a dictionary can include any collection of defined terms such as a traditional dictionary, a technical dictionary such as a user manual, or other similar knowledgebase or definitional authority.
- FIG. 7 illustrates an example weighting of filtered, tokenized segments 702 and 704.
- weightings are applied as follows: info has a weighting of (3) three; service has a weighting of (3) three; IA_FTSPOS has a weighting of (1) one; starting has a weighting of (6) six; and started has a weighting of (6) six.
- FIG. 8 illustrates an example comparison between two segments 802 and 804.
- Filtered tokens 806 and 808 are created using example rules set forth above. While being similar in appearance, the only comparison match by position is the "A" character when filtered tokens 806 and 808 are compared.
- segment analysis can be improved using distance matching techniques such as Levenshtein distances.
- distance matching techniques such as Levenshtein distances.
- these "distance” represent how many changes are required to transform one set of characters into a match for a second set of characters. For example, only one character change or transposition is required to convert 'cat' into 'mat'.
- Levenshtein distances the systems and methods can be adapted to calculate Levenshtein distance with an "alphabet" consisting of tokens rather than letters.
- This process includes determining how many single token edits are needed to change one token sequence to another. For example, the segment service starting is transposed to service started by one token replacement.
- the filtered tokens 806 and 808 above "A TCPCOM2 AJBSVC2 Connected to remote” is converted or transposed to "A AJBSVC4 Connected to remote” by two operations (one delete operation; one replace operation).
- each insert or delete operation costs the token weight.
- each replacement costs the higher of the replaced and replacement token weights. For example, service starting is transposed to service started with a score of six since a verb was replaced. In another example, "A TCPCOM2 AJBSVC2 Connected to remote” is transposed to "A AJBSVC4 Connected to remote” using two operations of one deletion of a non-dictionary word and replacement of a non-dictionary.
- the systems will be configured to cluster strings using a distance metric that is tailored for log messages then automatically extract regular expressions that uniquely match each cluster.
- custom weightings are applied for verbs, as these parts of speech are most important.
- a sampling technique can be utilized that attempts to maximize a probability of sampling every distinct message class with fixed maximum space.
- the systems sample a message with probability proportional to its distance to nearest message in sample set and evict with a probability inversely proportional to its distance to nearest message.
- a clustering technique is utilized that is suitable to apply to pairwise distances. Also, a user is allowed to write custom regular expressions to partition the data, which are preserved by the clustering performed by the systems of the present disclosure.
- the systems disclosed herein can automatically extract a sequence of tokens ⁇ (t_1 ⁇ ((i) ),t_2 ⁇ ((i) ),...,t_n ⁇ ((i) ) ) ⁇ which uniquely identifies each cluster i and map them to regular expressions ⁇ t_1 ⁇ ((i) ).*t_2 ⁇ ((i) ).*....*t_n ⁇ ((i) ) ⁇ .
- the method can then begin a categorization process in step 512 of the method of FIG. 6 .
- this process can include searching through a corpus or database of known categories. This can be done on a token-by-token basis.
- the search for a category can terminate if a category is found where a weighted edit distance is less than 15% of total token weight.
- a match can be accepted as a "best match" among categories where a weighted edit distance is less than 30% of total token weight.
- FIG. 10 illustrates an example best match weighting selection data set.
- the initial data instances 1002 are defined into categories 1004 based on weighting.
- thresholds are based on empirical data, these thresholds can be adjusted as desired and/or as feedback into the system when a matching heuristic is used within the machine learning. It will be understood that the thresholds selected should not result in all tokens, segments, or messages being placed into one single category. When a match does not fall within the specified thresholds, a new category can be created. In some embodiments, the categories that are available for matching are based on examples provided to the system, reverse engineering of the original segment/message content, regular expressions, and so forth.
- the unstructured log file could be raw network traffic data obtained from a network resource, such as a DNS server, a network switch, or a cloud.
- FIG. 9 is a method of anomaly detection that employs unstructured log file analysis disclosed above.
- the method includes a step 902 of receiving an unstructured input stream of data instances from the computing environment. Again, the unstructured input stream is time stamped or the contents thereof are individually time stamped.
- the method includes a step 904 of categorizing the data instances of the unstructured input stream of data instances.
- the data instances comprise any of at least one principal value or the categorical attribute.
- the principal value is determined to be a categorical attribute.
- a principal value may be a categorical attribute determined through machine learning.
- multiple principal values and/or associated categorical attributes can be present in an unstructured log file and determined through machine learning.
- the categorizations are determined through machine learning techniques.
- the method includes a step 906 of generating anomaly scores for each of the data instances collected over a period of time.
- This can include any of the anomaly score generation processes disclosed herein.
- the system can be triggered to begin a process or method of determining which of the one or more categorical attributes are causing the change in anomaly scores.
- this process can include counterfactual processing or any other evaluation as disclosed herein.
- the method includes a step 908 of detecting a change in the categorical attribute that is indicative of an anomaly.
- the systems and methods disclosed herein can generate anomaly scores for data instances in a temporal bucket (e.g. a five min window or other selectable period of time), and then evaluate the categorical attribute(s) that influenced the anomaly. Additional details on anomaly detection can be found in United States Patent Application Serial Number 15/498,406 .
- the systems and methods disclosed herein can augment data instances with a new categorical attribute due to the classification of the unstructured data into categories.
- the disclosure above related to collectively to FIGs. 5-9 can be equally applied to any of the methods for anomaly detection disclosed herein. That is, while some embodiments comprise an input stream that is time stamped and the input stream can comprise structured data, other embodiments allow for the use of unstructured data such as an unstructured log file.
- unstructured data such as an unstructured log file.
- the contents of the unstructured log file Prior to evaluation of the values and attributes included in the unstructured log file, the contents of the unstructured log file are categorized and extracted using the methods disclosed above.
- this categorized content can then be evaluated as provided above to determine values, attributes, and the like. These values can be compared with respect to a time frame to determine anomalies in the data included in the unstructured log file, which is in turn indicative of anomalies in the computing environment.
- FIG. 11 is a diagrammatic representation of an example machine in the form of a computer system 1, within which a set of instructions for causing the machine to perform any one or more of the methodologies discussed herein may be executed.
- the machine operates as a standalone device or may be connected (e.g., networked) to other machines.
- the machine may operate in the capacity of a server or a client machine in a server-client network environment, or as a peer machine in a peer-to-peer (or distributed) network environment.
- the machine may be a personal computer (PC), a tablet PC, a set-top box (STB), a personal digital assistant (PDA), a cellular telephone, a portable music player (e.g., a portable hard drive audio device such as an Moving Picture Experts Group Audio Layer 3 (MP3) player), a web appliance, a network router, switch or bridge, or any machine capable of executing a set of instructions (sequential or otherwise) that specify actions to be taken by that machine.
- PC personal computer
- PDA personal digital assistant
- MP3 Moving Picture Experts Group Audio Layer 3
- MP3 Moving Picture Experts Group Audio Layer 3
- web appliance e.g., a web appliance, a network router, switch or bridge, or any machine capable of executing a set of instructions (sequential or otherwise) that specify actions to be taken by that machine.
- machine shall also be taken to include any collection of machines that individually or jointly execute a set (or multiple sets) of instructions to perform any one or more of the methodologies discussed herein.
- the example computer system 1 includes a processor or multiple processor(s) 5 (e.g., a central processing unit (CPU), a graphics processing unit (GPU), or both), and a main memory 10 and static memory 15, which communicate with each other via a bus 20.
- the computer system 1 may further include a video display 35 (e.g., a liquid crystal display (LCD)).
- a processor or multiple processor(s) 5 e.g., a central processing unit (CPU), a graphics processing unit (GPU), or both
- main memory 10 and static memory 15 which communicate with each other via a bus 20.
- the computer system 1 may further include a video display 35 (e.g., a liquid crystal display (LCD)).
- LCD liquid crystal display
- the computer system 1 may also include input device(s) 30 (also referred to as alpha-numeric input device(s), e.g., a keyboard), a cursor control device (e.g., a mouse), a voice recognition or biometric verification unit (not shown), a drive unit 37 (also referred to as disk drive unit), a signal generation device 40 (e.g., a speaker), and a network interface device 45.
- the computer system 1 may further include a data encryption module (not shown) to encrypt data.
- the drive unit 37 includes a machine-readable medium 50 (which may be a computer readable medium) on which is stored one or more sets of instructions and data structures (e.g., instructions 55) embodying or utilizing any one or more of the methodologies or functions described herein.
- the instructions 55 may also reside, completely or at least partially, within the main memory 10 and/or within the processor(s) 5 during execution thereof by the computer system 1.
- the main memory 10 and the processor(s) 5 may also constitute machine-readable media.
- the instructions 55 may further be transmitted or received over a network (e.g., network 150 or network 520, see FIG. 1 and FIG. 5 , respectively) via the network interface device 45 utilizing any one of a number of well-known transfer protocols (e.g., Hyper Text Transfer Protocol (HTTP)).
- HTTP Hyper Text Transfer Protocol
- machine-readable medium 50 is shown in an example embodiment to be a single medium, the term "computer-readable medium" should be taken to include a single medium or multiple media (e.g., a centralized or distributed database and/or associated caches and servers) that store the one or more sets of instructions.
- computer-readable medium shall also be taken to include any medium that is capable of storing, encoding, or carrying a set of instructions for execution by the machine and that causes the machine to perform any one or more of the methodologies of the present application, or that is capable of storing, encoding, or carrying data structures utilized by or associated with such a set of instructions.
- the term “computer-readable medium” shall accordingly be taken to include, but not be limited to, solid-state memories, optical and magnetic media, and carrier wave signals. Such media may also include, without limitation, hard disks, floppy disks, flash memory cards, digital video disks, random access memory (RAM), read only memory (ROM), and the like.
- RAM random access memory
- ROM read only memory
- the example embodiments described herein may be implemented in an operating environment comprising software installed on a computer, in hardware, or in a combination of software and hardware.
- the Internet service may be configured to provide Internet access to one or more computing devices that are coupled to the Internet service, and that the computing devices may include one or more processors, buses, memory devices, display devices, input/output devices, and the like.
- the Internet service may be coupled to one or more databases, repositories, servers, and the like, which may be utilized in order to implement any of the embodiments of the disclosure as described herein.
- These computer program instructions may also be stored in a computer readable medium that can direct a computer, other programmable data processing apparatus, or other devices to function in a particular manner, such that the instructions stored in the computer readable medium produce an article of manufacture including instructions which implement the function/act specified in the flowchart and/or block diagram block or blocks.
- the computer program instructions may also be loaded onto a computer, other programmable data processing apparatus, or other devices to cause a series of operational steps to be performed on the computer, other programmable apparatus or other devices to produce a computer implemented process such that the instructions which execute on the computer or other programmable apparatus provide processes for implementing the functions/acts specified in the flowchart and/or block diagram block or blocks.
- each block in the flowchart or block diagrams may represent a module, segment, or portion of code, which comprises one or more executable instructions for implementing the specified logical function(s).
- the functions noted in the block may occur out of the order noted in the figures. For example, two blocks shown in succession may, in fact, be executed substantially concurrently, or the blocks may sometimes be executed in the reverse order, depending upon the functionality involved.
- a hyphenated term (e.g., "on-demand”) may be occasionally interchangeably used with its non-hyphenated version (e.g., "on demand")
- a capitalized entry e.g., "Software”
- a non-capitalized version e.g., "software”
- a plural term may be indicated with or without an apostrophe (e.g., PE's or PEs)
- an italicized term e.g., "N+1” may be interchangeably used with its non-italicized version (e.g., "N+1”).
- Such occasional interchangeable uses shall not be considered inconsistent with each other.
- a “means for” performing a task or set of tasks. It will be understood that a “means for” may be expressed herein in terms of a structure, such as a processor, a memory, an I/O device such as a camera, or combinations thereof. Alternatively, the “means for” may include an algorithm that is descriptive of a function or method step, while in yet other embodiments the “means for” is expressed in terms of a mathematical formula, prose, or as a flow chart or signal diagram.
- Coupled means “coupled,” “connected”, “connecting,” “electrically connected,” etc., are used interchangeably herein to generally refer to the condition of being electrically/electronically connected.
- a first entity is considered to be in "communication” with a second entity (or entities) when the first entity electrically sends and/or receives (whether through wireline or wireless means) information signals (whether containing data information or non-data/control information) to the second entity regardless of the type (analog or digital) of those signals.
- various figures (including component diagrams) shown and discussed herein are for illustrative purpose only, and are not drawn to scale.
Landscapes
- Engineering & Computer Science (AREA)
- Theoretical Computer Science (AREA)
- Software Systems (AREA)
- General Engineering & Computer Science (AREA)
- Computer Security & Cryptography (AREA)
- Computer Hardware Design (AREA)
- Physics & Mathematics (AREA)
- General Physics & Mathematics (AREA)
- Computing Systems (AREA)
- Computer Vision & Pattern Recognition (AREA)
- Artificial Intelligence (AREA)
- Data Mining & Analysis (AREA)
- Evolutionary Computation (AREA)
- Medical Informatics (AREA)
- Mathematical Physics (AREA)
- Computer Networks & Wireless Communication (AREA)
- Signal Processing (AREA)
- Information Retrieval, Db Structures And Fs Structures Therefor (AREA)
- Debugging And Monitoring (AREA)
Description
- The present technology relates generally to digital security, and more particularly, but not by limitation, to systems and methods that detect anomalies in computing environments that are indicative of malicious or otherwise unwanted behavior within, or performed by, the computing environment. This anomaly detection process is enhanced using methodologies for detecting and isolating sources of the anomalies. These methods and systems include processes for using unstructured log files to detect computing environment anomalies.
- In
U.S. Patent 9,516,053 - U.S. Patent Application Publication No.
US 2006/167917 A1 proposes a system that automates the self-organization of collectives of computational entities. One variant of the proposed solution provides a multi-agent system architecture with a plurality of interconnected system layers, including structural components, analytical functions, active functions and functional applications. Specifically, these system layers consist of a distributed computer and communications network of multi-functional Intelligent Mobile Software Agents (IMSAs) in a multi-agent system. In additional layers, IMSA analytical methods and group learning processes are organized. In further layers, active IMSA simulation modeling and group scenario generation and decision-making processes are organized. IMSA cooperation for aggregation and re-aggregation processes is organized on a further layer. IMSA inter-team rivalry and coalition formation and evolution are organized in an additional layer. The combination of these complex processes allows active network plasticity and automated programming functionality of later layers. Finally, functional applications are at the final layer. - In U.S. Patent Application Publication No.
US 2013/0238476 A1 , an electronic device that performs counterfactual testing is disclosed. During operation, the electronic device accesses a functional representation of a financial history of a user, where the functional representation specifies a financial output value based on input values and a behavioral pattern, and the behavioral pattern specifies a relationship between at least a pair of the variables associated with a dimension in the financial history. Then, the electronic device modifies the functional representation based on a financial circumstance that is different than financial circumstances in the financial history. Moreover, the electronic device calculates the financial output value using the functional representation and the input values, and a modified financial output value using the modified functional representation and the input values. Next, the electronic device compares the financial output value and the modified financial output value. Based on the comparison and a testing metric, the electronic device determines a result of the counterfactual testing. - Further, an approach for anomaly detection for large scale networks or an internet service provider is described in the scientific paper with the title "Combining Filtering and Statistical Methods for Anomaly Detection" by Soule et al..
- The invention is defined in the independent claims. Particular embodiments are set out in the dependent claims.
- Certain embodiments of the present technology are illustrated by the accompanying figures. It will be understood that the figures are not necessarily to scale and that details not necessary for an understanding of the technology or that render other details difficult to perceive may be omitted. It will be understood that the technology is not necessarily limited to the particular embodiments illustrated herein.
-
FIG. 1 is a high level schematic diagram of computing architecture for practicing aspects of the present technology. -
FIG. 2 is a flowchart of an example method for detecting anomalous activity in a computing environment and determining a cause(s) thereof. -
FIG. 3 is a flowchart of an example method of counterfactual analysis for determining a cause or causes of an anomalous activity. -
FIG. 4 is a flowchart of another example method of anomaly and causation detection. -
FIG. 5 is a flowchart of an example method for categorizing the contents of an unstructured log file and using the same for anomaly detection in a computing environment. -
FIG. 6 illustrates a process for converting an unstructured log file message/segment into a tokenized segment, and further into a tokenized and filtered segment. -
FIG. 7 illustrates an example process for calculating and applying a weight to tokens in two filtered, tokenized segments. -
FIG. 8 illustrates a process for comparing unstructured log file messages/segments and their corresponding filtered, tokenized segments. -
FIG. 9 is a flowchart of an example method that classification of an unstructured log file message/segment in combination with an anomaly detection method. -
FIG. 10 illustrates an example best match weighting selection data set. -
FIG. 11 is a schematic diagram of a computing system that is used to implement embodiments according to the present technology. - The present disclosure is directed to various embodiments of systems and methods that use unsupervised machine learning to detect anomalous activity and isolate a source or sources thereof. In more detail, an input stream of data instances is received. The input stream can include data instances of behavior or activity of a computer environment. Generally, a computer environment can include an individual computing system as well as a plurality of computers or other computing devices such as a network. The input stream can be obtained from any method that would be known to one skilled in the art.
- In various embodiments, the data instances are obtained over a period of time and each of the data instances are time stamped. Various analyses described herein examine the data instances over all or a portion of the period of time for which the input stream is collected. Anomalies can be detected within this input stream by examining and comparing principal values (or at least one principal value) and their corresponding categorical attributes as they changed over time. These changes are identified as anomalies, according to various embodiments. Further inspection of the anomalies may confirm or eliminate the anomalies as indicative of malicious behavior or other computing environment issues.
- In accordance with various embodiments of the present disclosure, when an anomaly is detected, a cause or causes of the anomaly are located through a process of counterfactual processing. An exemplary process of counterfactual processing uses reductionism and elimination to isolate principal values and/or corresponding categorical attributes that contribute to the anomaly. In various embodiments, these anomalous principal values and/or corresponding categorical attributes are then traced back to a source such as a user, a computing system, a network component, or the like (generally referred to as a source point). This source point can then be identified and flagged for further review. In some embodiments, the source point is automatically remediated. For example, if the source point is a computing system and the anomaly that is detected is a spike in traffic between the computing system and a foreign server, the remediation can comprise automatically blocking network access for the computing system until a full review of the computing system has been conducted.
- These and other advantages of the present technology are provided below with reference to the collective drawings.
-
FIG. 1 is a high level schematic diagram of an exemplary computing architecture (hereinafter architecture 100) of the present technology. Theexemplary architecture 100 comprises an exemplary anomaly detection and causation detection system 105 (hereinafter also referred to as exemplary system 105 or system 105 for short), which in some embodiments comprises a server or cloud-based computing device configured specifically to perform the analyses described herein. That is, the system 105 in some embodiments is a particular purpose computing device that is specifically designed and programmed (e.g., configured or adapted) to perform any of the methods described herein. The system 105 can also comprise a plurality of distributed computing systems that cooperatively provide the features of the system 105. For example, individual ones of the plurality of distributed computing systems can provide one or more unique functions or services. In some embodiments, the system 105 can comprise a cloud computing environment or other similar networked computing system. - The system 105 can be coupled with an input source 110 that provides an input stream to the system 105. An input source 110 can comprise, for example, a computing system, an enterprise network, a plurality of computing systems arranged as a network, virtual machines, application(s), network tap(s), services, a cloud, containers, or other similar computing environment that creates data instances. In some embodiments, the input source 110 comprises a database or data store that stores pre-obtained data from any of the aforementioned sources for use in accordance with the present disclosure.
- In one embodiment, the system 105 comprises a
processor 115 andmemory 120 for storing instructions. Thememory 120 can include an inputstream interface module 125, an inputstream parser module 130, ananomaly detection module 135, acounterfactual processing module 140, and aremediation module 145. As used herein, the terms "module" may also refer to any of an application-specific integrated circuit ("ASIC"), an electronic circuit, a processor (shared, dedicated, or group) that executes one or more software or firmware programs, a combinational logic circuit, and/or other suitable components that provide the described functionality. - In some embodiments, the system 105 receives an input stream from the input source 110 via the input
stream interface module 125. An input stream may include a plurality of data instances that are collected over a period of time. The individual data instances (or components thereof) may be time stamped so that a chronological order can be maintained for the data instances. - In some embodiments, using unsupervised machine learning, the exemplary system 105 can evaluate the data instances over time to detect anomalous behavior. In general, anomalous behavior can include any deviation in the data instances as viewed over time. For example, if the data instances are collected for a network such as a cloud, changes in resource utilization of a service within the cloud can be identified as anomalous. In another example, a brief spike in file transfer rates between a computing device and another computing device (possibly in a foreign country) can be flagged as anomalous. The present disclosure is not intended to be limited to unsupervised machine learning and in some embodiments can incorporate other machine learning methods. In one embodiment, user feedback can be incorporated into an anomaly score via supervised machine learning techniques, or at least partially supervised or a mixture that is based on how unusual the deviation/anomaly is relative to models of historical behavior of the system 105, as well as how it compares to other anomaly instances that have been indicated as important.
- The use of unsupervised machine learning in various embodiments allows the system 105 to evaluate only the data instances available and examine these data instances for anomalous behavior in a self-referential manner. That is, in various embodiments, the data instances are modeled for the time period for which data instances are collected and these data instances are used without referencing pre-generated behavior profiles or other similar profiles. The use of pre-generated behavior profiles may be advantageous in some embodiments, if available, but these profiles are not required.
- Changes in data instances over time can be flagged as anomalous if the changes have a magnitude that is unexpected. The exemplary system 105 need not rely on rigid thresholds or rules for determining if changes in the data instances are anomalous, but such information can be used to confirm or validate the anomaly. In some embodiments, the system 105 can calculate a probability of a current behavior based on historical behavior, where low probability events are classified as anomalies. Again, the use of thresholds or rules is not required, but is also not prohibited.
- In various embodiments, each data instance is comprised of at least one principal value that represents an aspect or object of the computing environment that is to be measured for anomalies. Non-limiting examples of principal values include network traffic volume, memory access and/or usage, processor usage rates, file transfer, file access, device access, and so forth. In various embodiments, the at least one principal values selected can be a subset of all available principal values in the data instances. The principal values selected for the data instances can be user-selected or user-defined, or can be based on prior knowledge, such as prior instances of anomalous network activity. For example, if prior anomalies in increased CPU usage in a cloud were linked to malicious behavior, the principal values could include CPU usage aspects.
- In other embodiments, the data instances can be selected based on predefined understanding of the data type, or automatically by the system 105 based on data characteristics.
- In some embodiments, a principal value comprises corresponding categorical attributes and values thereof. In one example, if the principal value is "log on time", categorical attributes could include users, system ID, login locations, and so forth.
- When the input stream is received, the exemplary input
stream parser module 130, shown in the example inFIG. 1 , may be executed to separate or parse the input stream into data instances that are ordered in time. That is, in various embodiments, the data instances are collected over a period of time and time stamped as noted above. The inputstream parser module 130 can determine the influence that instances of the collected data have on the computing environment using the principal values υ (or at least one principal value) and corresponding set of categorical attributes
stream parser module 130 considers the data as a collection


stream parser module 130 converts the principal value and categorical attributes into a collection of sets (8:50am, jim, work); (7:40am, jill, work); and (6:45pm greg, home). Other similar tuples can be created for other types of data sets, and can include a combination of numerical and/or non-numerical values. - In some embodiments, anomaly influence aims to understand the way that the categorical attributes are influencing the anomalies that are located by analyzing the principal value v.
- Anomaly detection as disclosed in various embodiments herein involves the comparison and evaluation of the at least one principal value changing over time. According to some embodiments, once sets are created from the data instances, the
anomaly detection module 135 is executed to detect anomalies for the data:
- In various embodiments, the
anomaly detection module 135 creates features in order to perform anomaly detection by bucketing (e.g., grouping) the data instances into continuous time intervals, where a kth bucket or group is defined according to the equation:
- The
anomaly detection module 135 then applies one or more set functions f :


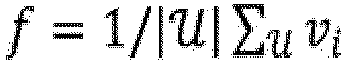

- The
anomaly detection module 135, in the above example, then applies a suitable anomaly detection algorithm to the bucketed data instances. - In various embodiments, the suitable anomaly detection algorithm will take as inputs bucket features


- In various embodiments, an exemplary anomaly detection algorithm tries to predict a distribution for a new feature value based on relevant historical data and the time the feature value occurs. The exemplary anomaly detection algorithm can account for multiple effects, such as slowly changing level, periodic patterns, weekday/weekend differences and recurrent patterns that relate to the calendar. For example, if a prediction is being made for 10 am on Monday morning, the anomaly distribution algorithm will estimate the probability distribution of values for the feature based on historical behavior for Monday mornings around that time and may also account for differences between days of the month or Mondays of the month. In some embodiments, a test is made to check if there is a statistically significant over occurrence of large predictions errors which coincide with a particular calendar feature. For example, it is expected on average there to be "n" x "p"/100 "p" percentile prediction errors given "n" predictions. Furthermore, (assuming independence), this must follow a binomial distribution. Therefore, the exemplary algorithm can calculate the chance of seeing a given count (or higher) of large prediction errors for a particular day of month, day of week and week of month, say the 2nd Monday of each month, and so on. In various embodiments, if this chance is small then it is typically appropriate to estimate a correction to the predicted distribution which depends on this feature, i.e., correct the predictions with information about previous of the same type of calendar day.
- In order to understand what the impact of one of the categorical attributes is on an anomaly, it is noted that the distinct values of the attribute create a partition of the data instances in the bucket, i.e., the data instances for which the ith categorical attribute is


- Using the aforementioned algorithms and the separation of data instances by their categorical attributes, the exemplary
counterfactual processing module 140 may selectively remove portions of the data instances corresponding to each categorical attribute, recalculate the anomaly scores, and determine if removal of the categorical attributes reduces or removes the anomaly. If removal does reduce or remove the anomaly, it can be determined that the object of the computing environment responsible for producing the removed categorical attributes is likely a source (could be one of many) for the anomaly. This process, in various embodiments, does not categorize the detection of an anomaly as a malicious or nefarious event, but instead detects the anomaly and flags associated portions of the computing environment for further consideration or review. - In various embodiments, the
counterfactual processing module 140 can provide a mechanism for asking and answering questions such as, for example, what would the situation be like if all the data labelled with a given attribute were removed, or what it would be like if all the data except that labelled with a given attribute were removed. - In various embodiments, these counterfactual processing can be executed very efficiently depending on the function. For example, to do this process for a mean (e.g., numerical principal value) the system 105 is not required to store all the data in a bucket, but only additionally maintain a count and mean of values for each distinct value of each categorical attribute. Specifically, for each equivalence class we need

- This counterfactual approach for understanding causation, according to various embodiments, falls under logical principles of "if B does not happen, C does not happen" and thus "B causes C" by logical extension. Specifically, for certain types of set functions (e.g., countably additive functions) it is understood that the attribute


- In general, counterfactual reasoning agrees with knowledge available for countably additive functions like count or sum. For example, if it is observed first that the count is unusually high, and then observed that, if a particular category had not occurred, the count is normal. In this example, it seems reasonable to conclude that the "behavior" of that particular category caused the anomalous score.
- For other types of set functions, for example, where the presence of a single example data instance can cause an anomaly of a similar score, then the system 105 may use a regularity approach for understanding causation (i.e. "B causes C" if "whenever B occurs C occurs"). More specifically, it is known that the categorical attribute


- Examples of such set functions include determining maximum or minimum values of the principal values in the bucket, i.e.,


- These exemplary processes above can be generally referred to as a process for creating and using a behavioral profile of a computing environment. In various embodiments, the behaviors of the computing environment are assessed for anomalous activity/behaviors.
- Once an anomaly has been detected and a cause or causes isolated, the
remediation module 145 may be executed to remediate the cause or causes in some embodiments. In various embodiments, the specific methods by which theremediation module 145 remediates a cause are highly dependent upon the type of anomaly detected. For example, if the anomaly includes a high rate of access to a particular database, theremediation module 145 may restrict access privileges for the database until the anomaly is reviewed. If the anomaly is unusually frequent file transfers (e.g., exfiltration) of high volumes of data outside a protected network, theremediation module 145 may restrict file transfers by specifically identified machines in the network. This could occur through changing firewall policies or preventing access to any external network by the machines. - In sum, the present disclosure provides various embodiments of systems and methods to detect anomalies within computing environments and deduce the cause or causes of those anomalies. The systems and methods can detect unusual events, rates, metrics and so forth for any computing environment. In some embodiments, multiple anomalies can be present and detected by the systems and methods herein. For example, the systems and methods can detect both exfiltration of data and excessive login attempts.
-
FIG. 2 is a flowchart of anexample method 200 of detecting anomalous activity in a computing environment and determining one or more causes for the anomalous activity. Theexample method 200 comprises astep 205 of receiving an input stream of data instances for a time series. For example, an input stream can be received from a computing environment. The time series can include any span of time desired. The method includes evaluating the input stream that includes data that spans over a period of time. Theexample method 200 can involve using unsupervised machine learning, inasmuch as the data utilized is that which is included in the input stream only. That is, the entirety of the analysis, in some embodiments, involves the input stream without using pre-determined or pre-configured metrics for assessing the data instances of the input stream. - In some embodiments, the data instances of the input stream are time stamped. The data instances also comprise at least one principal value, and each principal value comprises a set of categorical attributes.
- After the input stream is received, the
example method 200 includes astep 210 of generating anomaly scores for each of the data instances over continuous time intervals. That is, the data instances may be scored in a chronological manner such that anomaly scores along the timeline are calculated. Theexample method 200 then includes a step 215 of detecting a change in the anomaly scores over the continuous time intervals for the data instances. Stated otherwise, theexample method 200 examines the scores calculated for the buckets of data instances (as described above) and locates variances in the scores that are indicative of an anomaly. In some embodiments, the user can specify how much scores can deviate over time before the deviations are flagged as an anomaly. For example, if the principal value is network traffic volume, and the network traffic volume rates change only slightly (e.g., +/- 5%), these discrepancies in network traffic volume are not anomalous, whereas a change of more than 10% may be flagged as anomalous. - In various embodiments, an anomaly score is a normalized measure of how big the deviation is, and the larger the score the more unusual the deviation. In some embodiments, the system 105 characterizes historical deviations using a density function, i.e., a chance f(x) of seeing a deviation x in the value of the set function. The anomaly score, in some embodiments, is related to the chance of seeing a deviation which is at least as unlikely, i.e. the total chance of seeing any value y for which f(y) < f(x). A fixed cutoff on the anomaly score can be utilized, i.e., an anomaly is something which should occur rarely based on historical data, so has a score greater than a fixed threshold. The score may therefore amount to a dynamic threshold since it is based on the data characteristics. In various embodiments, the system 105 separately and precisely controls the rate at which the system 105 generate alerts at a specific severity based on the anomaly score, i.e., the system 105 does not allow this to exceed (over a very long time frame, although it can exceed it for shorter time frames) more than a certain value. Higher severity alerts are allowed less frequently, according to some embodiments.
- The
example method 200 includes astep 220 of identifying which of the set of categorical attributes of the data instances caused the change in the anomaly scores using a counterfactual analysis.FIG. 3 illustrates anexample method 300 of counterfactual analysis. - In some embodiments, the
example method 200 can include anoptional step 225 of generating recommendations for remediating the set of categorical attributes to remediate a malicious behavior or other underlying cause of the anomaly. For example, the system can suggest that users not be allowed to log in from remote locations if categorical attributes indicate that users are logging in after permissible log in hours when remote. In another example, the system can suggest that all devices that are used to access a particular database use a higher level of authentication in response to detecting anomalous activity (e.g., high level of access requests) with respect to the database. -
FIG. 3 is a flowchart of anexample method 300 of counterfactual analysis, which is an example embodiment of the identifyingstep 220 inFIG. 2 . Theexample method 300 comprises astep 305 of removing at least a portion of the data instances. For example, data instances associated with a device on a network can be removed. Next, theexample method 300 includes astep 310 of regenerating anomaly scores for each of the data instances over the continuous time intervals. Next, a determination is made instep 315 if the regenerated anomaly scores are improved (e.g., by the removal that used "counterfactual" processing) compared to the anomaly scores. If the anomaly scores are improved (e.g., variances in anomaly scores are removed and the anomaly scores are substantially consistent with one another), then at least a portion of the categorical attributes are identified as anomalous categorical attributes and a cause of the anomalous activity instep 320 of the example inFIG. 3 . Stated otherwise, an improvement in an anomaly store is a lower score (e.g., the deviation is less unusual), according to various embodiments. - If the anomaly scores are not improved, the
example method 300 returns to step 305 and a second portion of the categorical attributes are removed andsteps - The counterfactual processing, in various embodiments, e.g., as used in
step 220 andmethod 300, comprises efficiently subtracting components from a behavioral profile (e.g., analysis of the input stream) until the component contributing to the unusual behavior is isolated and located. - In some embodiments, the systems and methods can utilize a regularity analysis rather than a counterfactual analysis. In various embodiments, the regularity analysis comprises identifying when a specific categorical attribute of the set of categorical attributes influences the anomaly score for the data instances if an output of an anomaly detection algorithm is approximately identical for alternative cases in which all the data instances with that specific categorical attribute exist.
-
FIG. 4 is a flowchart of another example method,example method 400, of anomaly and causation detection according to various embodiments. Theexample method 400 includes astep 405 of receiving an input stream of data instances. In various embodiments, the data instances in the input stream are time stamped. Theexample method 400 includes astep 410 of separating the data instances into at least one principal value and a set of categorical attributes, as well as astep 415 of grouping the data instances into groups based on continuous time intervals. It will be understood that, in various embodiments, each of the continuous time intervals has a length that represents a duration of the interval. - Next, the
example method 400 includes astep 420 of applying set functions to each of the groups to generate features related to the principal value for that interval, and astep 425 of generating an anomaly score for each of the groups using an anomaly detection algorithm. - In some embodiments, the
example method 400 comprises either (or both) astep 430 of applying a counterfactual analysis to identify which of the set of specific categorical attributes for a group is influencing the one or more anomalies in the groups that are indicative of the anomalous activity in the computing environment; or astep 435 of performing a regularity analysis to identify which of the set of specific categorical attributes for a group is influencing the one or more anomalies in the groups. - Some embodiments disclosed herein can, but are not required to implement counterfactual processing. Also, some embodiments, such as the following embodiments, contemplate the use of unstructured log files in anomaly detection. In more detail, the input stream of data instances used in an analysis can include unstructured log files or data streams. These unstructured log files and/or individual data instances are time stamped, the exact classification or composition of data instances may not be readily ascertainable without additional information or analysis. The present disclosure provides a means for taking these unstructured log files and converting them into an input stream that is useful for anomaly detection.
- Also, it will be appreciated that while classification of unstructured log files is useful for anomaly detection, the systems and methods disclosed herein are also useful for more general time series analysis methods as well. For example, it can be used for computing device forecasting such as predicting log data occurrences over the next week, or summarization such as providing a clear condensed view of the types of data that exist in a log file.
- The present disclosure includes embodiments that are configured to obtain the unstructured log files and covert the same into input that is valuable for anomaly detection. The present disclosure provides methods and system for classifying and grouping unstructured data instances together in order to convert the unstructured data instances into a format that is usable for anomaly detection.
- For context, a large percentage of monitored output (e.g., input stream of data instances) that is received from a computing environment will be received as unstructured data. Generally described, unstructured data is defined as data that is obtained from a computing environment, where the unstructured data is not in a format that is utilizable in anomaly detection. If the monitored data of a computing environment is unstructured, it is possible that relevant data (e.g., data that would be indicative of an anomaly) in the input stream may go undetected. The resultant anomaly detection processes that use these erroneous input streams may result in deleterious effects, such as increases in malware distribution or poor computing environment performance.
- Also, requiring system administrators and/or application developers to output computing environment data in a format that is acceptable for anomaly detection may be onerous or performed improperly.
- The problem of unstructured log files is unique to computing technologies. Each computing system has a unique permutation of software, firmware, hardware, network configurations, and so forth that generate unstructured log files (e.g., input streams). Even variances between individual computing environments can result in the computing environments creating unstructured log files that are dissimilar. Thus, a need is present for systems and methods that can utilize machine learning to convert these unstructured log files into a format that is acceptable for anomaly detection. Again, a large proportion of log data from computing environments is unstructured. Unstructured logs are difficult, if not impossible to understand, summarize, visualize or analyze without post-processing. Generic processes for adding structure via parsing is time consuming and error prone. In response, the systems and methods herein utilize field time search extraction and UI visualization based on machine learning as compelling tool for managing and converting unstructured log files. These systems and methods can reverse engineer and categorize contents of an unstructured log file. In general, these systems and methods take advantage of an inherent property of many unstructured log files, which is that word ordering in log files is generally a predictive and repeatable metric. For example, a network traffic log will present the same types of content fields in a particular order based on an application that generates the network traffic log. That is, log files typically possess repeating patterns of data, although the values of these patterns of data may vary.
- In general, these methods comprise an analysis phase that is performed on received unstructured log files. In some embodiments, unstructured log files comprise a time stamp and unstructured text. Machine learning is used to classify the unstructured text prior to anomaly detection. In various embodiments, the process of classifying comprises grouping and characterizing the unstructured test data so as to provide the structure necessary for anomaly detection. Based on the classifications, anomaly detection algorithms are performed on the converted or structured log files. In some embodiments a dashboard is also provided to the user to provide understanding and visualization of the unstructured logs file for identification of anomalous unstructured log files.
- In some embodiments, the machine learning-based classification processes disclosed herein can assist in supporting additional data analysis and filtering tools such as grok filter. Thus, the machine learning classification can be used to seed and maintain the input to a grok filter. In some embodiments, the machine learning capabilities disclosed herein for classifying unstructured log files provides a set of candidate patterns for categorical messages. However, machine learning will not know what entity is represented by a token. For example, a token may be a user or a host. Thus, some embodiments contemplate manual intervention to add this context. Thus, the classified output of machine learning in this disclosed can be used to 'seed' grok pattern creation where the machine learning patterns can be augmented and edited by users.
- Generally speaking, the present disclosure allows for the conversion of unstructured log files by machine learning processes that include, but are not limited to, classification of unstructured data that also includes content grouping and characterization. Once the unstructured data has been converted into a structured format, the methods of anomaly detection disclosed above, with or without the counterfactual processing can be used to determine anomalies.
- While some embodiments are utilized for time-series anomaly detection and forecasting, some embodiments disclosed herein can also be utilized for operations such as outlier data detection, data imputation analyses, data clustering, and other similar operations.
-
FIG. 5 illustrates an example method of processing an unstructured log file into a form that is usable for anomaly detection. - According to some embodiments, the unstructured log file conversion processes disclosed herein allow for grouping of "similar" messages together into categories. Machine learning processes are implemented to essentially reverse engineering unstructured log statements, which allows for grouping and classification. Advantageously, the use of a training dataset is permissible but not required as machine learning is utilized across the entire the unstructured log file.
- Broadly, the conversion of an unstructured log file to a structured representation that can be utilized for anomaly detection can include steps such as tokenization, filtering, weighting, comparing, category assigning, and category defining - just to name a few. To be sure, the unstructured log file is not required to be converted or transformed into a structured log file per se, but the contents of the unstructured log file are processed through categorized and/or grouping so as to be usable in an anomaly detection process.
- Also, it will be understood that even without unstructured log file categorization the systems and methods disclosed herein can be configured to perform anomaly detection on an overall event rate. Unstructured log file categorization allows for more granularity in terms of determining the types of messages that are anomalous, and also identifying anomalies such as rare messages that may be lost in overall detection.
- Initially, an unstructured log file belonging to a computing environment is received in
step 502. In general, the unstructured log file includes the output of a computing process. Examples include a runtime software log file, a hardware log file, network traffic, or any other log file that would be generated in or by a computing environment or a component thereof. It will be understood that the unstructured log file is time stamped. In some processes, data instances inside the unstructured log file are individually time stamped. In other embodiments, each data instance in the unstructured log file is assigned or attributed the time stamp of the unstructured log file. In general, the unstructured log file is associated with temporal data that is indicative of a time frame for the data instances within the log file. - Next, segments of an unstructured log file are tokenized in
step 504. With regard to tokenization, a set of tokenization rules are implemented to initially identify sets of characters in the unstructured log file. In one embodiment, the tokenization rules involve breaking a message down into segments or words. A message could include an entire unstructured log file or a portion of an unstructured log file. In some embodiments, only certain components of a message are tokenized. For example, letters and numbers are tokenized while whitespaces or blank entries are not tokenized. Other characters such as underscores, dots, hyphens, and punctuation are individually evaluated. Underscores are not tokenized if at the beginning or end of a message, but are tokenized if present elsewhere. Dots are not tokenized if at the beginning or end of a message, but are tokenized if present elsewhere. The same rules apply for hyphens as those that apply to underscores and dots. Other types of punctuation are not tokenized. - The following examples are segments that would be tokenized based on the rules: started; starting; David; packets_sent; www.prelert.com; gb030976; and prelert-solaris. Again, the tokenization configurations and rules can be tuned as desired, or could be adapted based on feedback into the system. For example, if certain information that is not tokenized or is excluded, the rules can be adjusted to ensure that these data are correctly identified.
- Additionally, in some embodiments, once tokens are identified, the method includes a
step 506 of filtering or removing a portion of the tokens based on a set of filtering criteria. In some embodiments, filtering rules will remove from consideration a portion of the tokens generated in the prior steps. While tokenization removes a portion of unwanted data from the unstructured log file, the filtering process can further refine or strip data. In one embodiment, tokens corresponding to numbers (up to and includingbase 16; including dots) are filtered out. Also, tokens corresponding to date words such as Jan, Feb, Wednesday, etc. are filtered out. Next, tokens corresponding to numbers with trailing units, such as 10214K, are filtered out. - In some embodiments, the filter can be tuned to exclude or remove other field names based on user-defined input. In various embodiments, filter enhancements can be utilized that account for binary-to-text encoding schemes such as base 64, or a length heuristic plus character frequencies. Other enhancements allow for SQL truncated statements, usernames and/or hostnames, or user-defined and configurable filtering.
- Heuristics apply on a case-by-case or type basis. In an example use case that considers Base 64 encoded data blobs, it will be understood that tokens will likely be long and will use a specific character set. Therefore, to detect tokens which are encoded strings the system is configured to exclude strings less than a certain character count and to check for strings which only contain characters from an appropriate set.
- In addition, character frequency histograms are a useful feature vector for identifying a variety of data types. When incorporating this into the filtering process the system will use pre-trained classifiers for data types that the system is intended to identify. These would be provided to the user with the product and the user would select one (or more) from a list to add to a given filtering specification, based on their understanding of the data types present in their log files.
- In some embodiments, because the system may not possess, a-priori the complete list of possible data types this is not a case of choosing between a set of alternatives. As such the system can allow for the possibility that a token isn't one of the defined types or is ambiguous. False positives are particularly damaging for this case (since the token would be removed) and this would be reflected by the system in the training objective. The plan is, using a corpus of training data comprising a diverse set of example log files, to train a collection of binary classifiers that identify if a token belongs to a given type, for example, SQL fragment, Base 64 encoded blob, and so forth. These would be trained to strongly penalize FP at the expense of FN, i.e. a given classifier will only suggest a category if it is confident. Then, the system will test each token against the collection of selected classifiers and identify it as having a given type only if it is unambiguous.
- As part of this process the system will evaluate the viability of this approach by examining how well the classifier generalizes across our corpus. Only classifiers for data types that have good error characteristics on the test set would be provided to end users. As a possible refinement the system can be configured to train margin classifiers on combinations of possible data types and use these (if the margin is large) to decide between ambiguous types suggested above.
-
FIG. 6 illustrates an exampleunstructured data segment 600 from an unstructured log file that is tokenized 602, and filtered 604. - Next, the method can include a
step 508 of applying a weight to one or more of the filtered, tokenized segments. That is, the segments of the unstructured log files have been both tokenized and then filtered to produce the filtered, tokenized segments. In general, it is presumed that tokens/words that can be found in a dictionary are more likely to define a category than non-dictionary tokens. It is also presumed that parts of speech, such as verbs are more important to categorization than other parts of speech. A dictionary can include any collection of defined terms such as a traditional dictionary, a technical dictionary such as a user manual, or other similar knowledgebase or definitional authority. -
FIG. 7 illustrates an example weighting of filtered,tokenized segments - Next, the method includes a
step 510 of comparing segments to one another to determine if a match exists.FIG. 8 illustrates an example comparison between twosegments tokens tokens - In some embodiments, segment analysis can be improved using distance matching techniques such as Levenshtein distances. In general, these "distance" represent how many changes are required to transform one set of characters into a match for a second set of characters. For example, only one character change or transposition is required to convert 'cat' into 'mat'.
- Using the Levenshtein distances principle, the systems and methods can be adapted to calculate Levenshtein distance with an "alphabet" consisting of tokens rather than letters. This process includes determining how many single token edits are needed to change one token sequence to another. For example, the segment service starting is transposed to service started by one token replacement. Thus, using the filtered
tokens - In general, each insert or delete operation costs the token weight. Also, each replacement costs the higher of the replaced and replacement token weights. For example, service starting is transposed to service started with a score of six since a verb was replaced. In another example, "A TCPCOM2 AJBSVC2 Connected to remote" is transposed to "A AJBSVC4 Connected to remote" using two operations of one deletion of a non-dictionary word and replacement of a non-dictionary.
- In general, if the "distance" between two segments is small, it may be inferred that these filtered, tokenized segments are close enough to one another to consider them to be a match, despite the differences/distances.
- In some embodiments, the systems will be configured to cluster strings using a distance metric that is tailored for log messages then automatically extract regular expressions that uniquely match each cluster. In some embodiments, a Levenshtein distance is calculated on alphabet of tokens T={t_i}. In some instances, custom weightings are applied for verbs, as these parts of speech are most important. In some embodiments, a sampling technique can be utilized that attempts to maximize a probability of sampling every distinct message class with fixed maximum space. In particular, the systems sample a message with probability proportional to its distance to nearest message in sample set and evict with a probability inversely proportional to its distance to nearest message.
- In some embodiments, a clustering technique is utilized that is suitable to apply to pairwise distances. Also, a user is allowed to write custom regular expressions to partition the data, which are preserved by the clustering performed by the systems of the present disclosure. In some embodiments, the systems disclosed herein can automatically extract a sequence of tokens {(t_1^((i) ),t_2^((i) ),...,t_n^((i) ) )} which uniquely identifies each cluster i and map them to regular expressions {t_1^((i) ).*t_2^((i) ).*....*t_n^((i) ) }.
- After the steps disclosed above, the method can then begin a categorization process in
step 512 of the method ofFIG. 6 . In some embodiments, this process can include searching through a corpus or database of known categories. This can be done on a token-by-token basis. In one or more embodiments, the search for a category can terminate if a category is found where a weighted edit distance is less than 15% of total token weight. A match can be accepted as a "best match" among categories where a weighted edit distance is less than 30% of total token weight.FIG. 10 illustrates an example best match weighting selection data set. Theinitial data instances 1002 are defined intocategories 1004 based on weighting. - While these thresholds are based on empirical data, these thresholds can be adjusted as desired and/or as feedback into the system when a matching heuristic is used within the machine learning. It will be understood that the thresholds selected should not result in all tokens, segments, or messages being placed into one single category. When a match does not fall within the specified thresholds, a new category can be created. In some embodiments, the categories that are available for matching are based on examples provided to the system, reverse engineering of the original segment/message content, regular expressions, and so forth.
- Again, these methods provide for advantages. For example, no training data is required in order to classify the contents of an unstructured log file. The heuristics and feedback into the machine learning of the system ensure that the system learns over time in order to improve classification and other processes such as tokenization, weighting, matching, and so forth. Also, the system enables real-time analytics in certain scenarios. For example, an event such as detection of a completely new category can considered an anomaly that would trigger a real-time notification and/or adjustment of a classification model used by the system. In another example, detection of a high event rate of a category considered an anomaly. For example, if the unstructured log file is processed according to the methods above, and the unstructured log file is related to network traffic data, a large spike in network traffic data can be flagged as an anomaly. The unstructured log file could be raw network traffic data obtained from a network resource, such as a DNS server, a network switch, or a cloud.
-
FIG. 9 is a method of anomaly detection that employs unstructured log file analysis disclosed above. The method includes astep 902 of receiving an unstructured input stream of data instances from the computing environment. Again, the unstructured input stream is time stamped or the contents thereof are individually time stamped. - Next, the method includes a
step 904 of categorizing the data instances of the unstructured input stream of data instances. As noted above, the data instances comprise any of at least one principal value or the categorical attribute. In some embodiments, the principal value is determined to be a categorical attribute. With respect to unstructured log file categorization, a principal value may be a categorical attribute determined through machine learning. In some embodiments, multiple principal values and/or associated categorical attributes can be present in an unstructured log file and determined through machine learning. - The categorizations are determined through machine learning techniques.
- The method includes a
step 906 of generating anomaly scores for each of the data instances collected over a period of time. This can include any of the anomaly score generation processes disclosed herein. When the anomaly scores are evaluated and changes occur, the system can be triggered to begin a process or method of determining which of the one or more categorical attributes are causing the change in anomaly scores. As noted above, this process can include counterfactual processing or any other evaluation as disclosed herein. - Thus, the method includes a
step 908 of detecting a change in the categorical attribute that is indicative of an anomaly. - In more detail, the systems and methods disclosed herein can generate anomaly scores for data instances in a temporal bucket (e.g. a five min window or other selectable period of time), and then evaluate the categorical attribute(s) that influenced the anomaly. Additional details on anomaly detection can be found in
United States Patent . In some embodiments, in addition to the anomaly detection disclosed in the '406 Application, the systems and methods disclosed herein can augment data instances with a new categorical attribute due to the classification of the unstructured data into categories.Application Serial Number 15/498,406 - Again, the disclosure above related to collectively to
FIGs. 5-9 can be equally applied to any of the methods for anomaly detection disclosed herein. That is, while some embodiments comprise an input stream that is time stamped and the input stream can comprise structured data, other embodiments allow for the use of unstructured data such as an unstructured log file. Prior to evaluation of the values and attributes included in the unstructured log file, the contents of the unstructured log file are categorized and extracted using the methods disclosed above. Thus, after processing the unstructured log file to categorize the content included therein (e.g., data instances), this categorized content can then be evaluated as provided above to determine values, attributes, and the like. These values can be compared with respect to a time frame to determine anomalies in the data included in the unstructured log file, which is in turn indicative of anomalies in the computing environment. -
FIG. 11 is a diagrammatic representation of an example machine in the form of acomputer system 1, within which a set of instructions for causing the machine to perform any one or more of the methodologies discussed herein may be executed. In various example embodiments, the machine operates as a standalone device or may be connected (e.g., networked) to other machines. In a networked deployment, the machine may operate in the capacity of a server or a client machine in a server-client network environment, or as a peer machine in a peer-to-peer (or distributed) network environment. The machine may be a personal computer (PC), a tablet PC, a set-top box (STB), a personal digital assistant (PDA), a cellular telephone, a portable music player (e.g., a portable hard drive audio device such as an Moving Picture Experts Group Audio Layer 3 (MP3) player), a web appliance, a network router, switch or bridge, or any machine capable of executing a set of instructions (sequential or otherwise) that specify actions to be taken by that machine. Further, while only a single machine is illustrated, the term "machine" shall also be taken to include any collection of machines that individually or jointly execute a set (or multiple sets) of instructions to perform any one or more of the methodologies discussed herein. - The
example computer system 1 includes a processor or multiple processor(s) 5 (e.g., a central processing unit (CPU), a graphics processing unit (GPU), or both), and amain memory 10 andstatic memory 15, which communicate with each other via abus 20. Thecomputer system 1 may further include a video display 35 (e.g., a liquid crystal display (LCD)). Thecomputer system 1 may also include input device(s) 30 (also referred to as alpha-numeric input device(s), e.g., a keyboard), a cursor control device (e.g., a mouse), a voice recognition or biometric verification unit (not shown), a drive unit 37 (also referred to as disk drive unit), a signal generation device 40 (e.g., a speaker), and anetwork interface device 45. Thecomputer system 1 may further include a data encryption module (not shown) to encrypt data. - The
drive unit 37 includes a machine-readable medium 50 (which may be a computer readable medium) on which is stored one or more sets of instructions and data structures (e.g., instructions 55) embodying or utilizing any one or more of the methodologies or functions described herein. Theinstructions 55 may also reside, completely or at least partially, within themain memory 10 and/or within the processor(s) 5 during execution thereof by thecomputer system 1. Themain memory 10 and the processor(s) 5 may also constitute machine-readable media. - The
instructions 55 may further be transmitted or received over a network (e.g.,network 150 ornetwork 520, seeFIG. 1 andFIG. 5 , respectively) via thenetwork interface device 45 utilizing any one of a number of well-known transfer protocols (e.g., Hyper Text Transfer Protocol (HTTP)). While the machine-readable medium 50 is shown in an example embodiment to be a single medium, the term "computer-readable medium" should be taken to include a single medium or multiple media (e.g., a centralized or distributed database and/or associated caches and servers) that store the one or more sets of instructions. The term "computer-readable medium" shall also be taken to include any medium that is capable of storing, encoding, or carrying a set of instructions for execution by the machine and that causes the machine to perform any one or more of the methodologies of the present application, or that is capable of storing, encoding, or carrying data structures utilized by or associated with such a set of instructions. The term "computer-readable medium" shall accordingly be taken to include, but not be limited to, solid-state memories, optical and magnetic media, and carrier wave signals. Such media may also include, without limitation, hard disks, floppy disks, flash memory cards, digital video disks, random access memory (RAM), read only memory (ROM), and the like. The example embodiments described herein may be implemented in an operating environment comprising software installed on a computer, in hardware, or in a combination of software and hardware. - One skilled in the art will recognize that the Internet service may be configured to provide Internet access to one or more computing devices that are coupled to the Internet service, and that the computing devices may include one or more processors, buses, memory devices, display devices, input/output devices, and the like. Furthermore, those skilled in the art may appreciate that the Internet service may be coupled to one or more databases, repositories, servers, and the like, which may be utilized in order to implement any of the embodiments of the disclosure as described herein.
- The corresponding structures, materials, acts, and equivalents of all means or step plus function elements in the claims below are intended to include any structure, material, or act for performing the function in combination with other claimed elements as specifically claimed. The description of the present technology has been presented for purposes of illustration and description, but is not intended to be exhaustive or limited to the present technology in the form disclosed. Many modifications and variations will be apparent to those of ordinary skill in the art without departing from the scope of the present technology, as defined by the appended claims. Exemplary embodiments were chosen and described in order to best explain the principles of the present technology and its practical application, and to enable others of ordinary skill in the art to understand the present technology for various embodiments with various modifications as are suited to the particular use contemplated.
- Aspects of the present technology are described above with reference to flowchart illustrations and/or block diagrams of methods, apparatus (systems) and computer program products according to embodiments of the present technology. It will be understood that each block of the flowchart illustrations and/or block diagrams, and combinations of blocks in the flowchart illustrations and/or block diagrams, can be implemented by computer program instructions. These computer program instructions may be provided to a processor of a general purpose computer, special purpose computer, or other programmable data processing apparatus to produce a machine, such that the instructions, which execute via the processor of the computer or other programmable data processing apparatus, create means for implementing the functions/acts specified in the flowchart and/or block diagram block or blocks.
- These computer program instructions may also be stored in a computer readable medium that can direct a computer, other programmable data processing apparatus, or other devices to function in a particular manner, such that the instructions stored in the computer readable medium produce an article of manufacture including instructions which implement the function/act specified in the flowchart and/or block diagram block or blocks.
- The computer program instructions may also be loaded onto a computer, other programmable data processing apparatus, or other devices to cause a series of operational steps to be performed on the computer, other programmable apparatus or other devices to produce a computer implemented process such that the instructions which execute on the computer or other programmable apparatus provide processes for implementing the functions/acts specified in the flowchart and/or block diagram block or blocks.
- The flowchart and block diagrams in the Figures illustrate the architecture, functionality, and operation of possible implementations of systems, methods and computer program products according to various embodiments of the present technology. In this regard, each block in the flowchart or block diagrams may represent a module, segment, or portion of code, which comprises one or more executable instructions for implementing the specified logical function(s). It should also be noted that, in some alternative implementations, the functions noted in the block may occur out of the order noted in the figures. For example, two blocks shown in succession may, in fact, be executed substantially concurrently, or the blocks may sometimes be executed in the reverse order, depending upon the functionality involved. It will also be noted that each block of the block diagrams and/or flowchart illustration, and combinations of blocks in the block diagrams and/or flowchart illustration, can be implemented by special purpose hardware-based systems that perform the specified functions or acts, or combinations of special purpose hardware and computer instructions.
- In the following description, for purposes of explanation and not limitation, specific details are set forth, such as particular embodiments, procedures, techniques, etc. in order to provide a thorough understanding of the present invention. However, it will be apparent to one skilled in the art that the present invention may be practiced in other embodiments that depart from these specific details.
- Reference throughout this specification to "one embodiment" or "an embodiment" means that a particular feature, structure, or characteristic described in connection with the embodiment is included in at least one embodiment of the present invention. Thus, the appearances of the phrases "in one embodiment" or "in an embodiment" or "according to one embodiment" (or other phrases having similar import) at various places throughout this specification are not necessarily all referring to the same embodiment. Furthermore, the particular features, structures, or characteristics may be combined in any suitable manner in one or more embodiments. Furthermore, depending on the context of discussion herein, a singular term may include its plural forms and a plural term may include its singular form. Similarly, a hyphenated term (e.g., "on-demand") may be occasionally interchangeably used with its non-hyphenated version (e.g., "on demand"), a capitalized entry (e.g., "Software") may be interchangeably used with its non-capitalized version (e.g., "software"), a plural term may be indicated with or without an apostrophe (e.g., PE's or PEs), and an italicized term (e.g., "N+1") may be interchangeably used with its non-italicized version (e.g., "N+1"). Such occasional interchangeable uses shall not be considered inconsistent with each other.
- Also, some embodiments may be described in terms of "means for" performing a task or set of tasks. It will be understood that a "means for" may be expressed herein in terms of a structure, such as a processor, a memory, an I/O device such as a camera, or combinations thereof. Alternatively, the "means for" may include an algorithm that is descriptive of a function or method step, while in yet other embodiments the "means for" is expressed in terms of a mathematical formula, prose, or as a flow chart or signal diagram.
- The terminology used herein is for the purpose of describing particular embodiments only and is not intended to be limiting of the invention. As used herein, the singular forms "a", "an" and "the" are intended to include the plural forms as well, unless the context clearly indicates otherwise. It will be further understood that the terms "comprises" and/ or "comprising," when used in this specification, specify the presence of stated features, integers, steps, operations, elements, and/or components, but do not preclude the presence or addition of one or more other features, integers, steps, operations, elements, components, and/or groups thereof.
- It is noted at the outset that the terms "coupled," "connected", "connecting," "electrically connected," etc., are used interchangeably herein to generally refer to the condition of being electrically/electronically connected. Similarly, a first entity is considered to be in "communication" with a second entity (or entities) when the first entity electrically sends and/or receives (whether through wireline or wireless means) information signals (whether containing data information or non-data/control information) to the second entity regardless of the type (analog or digital) of those signals. It is further noted that various figures (including component diagrams) shown and discussed herein are for illustrative purpose only, and are not drawn to scale.
- While specific embodiments of, and examples for, the system are described above for illustrative purposes, various equivalent modifications are possible within the scope of the system, as those skilled in the relevant art will recognize. For example, while processes or steps are presented in a given order, alternative embodiments may perform routines having steps in a different order, and some processes or steps may be deleted, moved, added, subdivided, combined, and/or modified to provide alternative or sub-combinations. Each of these processes or steps may be implemented in a variety of different ways. Also, while processes or steps are at times shown as being performed in series, these processes or steps may instead be performed in parallel, or may be performed at different times.
Claims (15)
- A computer-implemented method for detecting anomalous activity in a computing environment (100), the method comprising:receiving (205, 902) an unstructured input stream of data instances from the computing environment (100), the unstructured input stream being time stamped;categorizing (904) the data instances of the unstructured input stream of data instances, the data instances comprising a categorical attribute determined through machine learning;generating (210, 906) anomaly scores for each of the data instances collected over a period of time; andexamining the anomaly scores and locating variances in the anomaly scores that are indicative of an anomaly by detecting (215, 908) a change in the anomaly scores over time for the data instances.
- The method of claim 1, further comprising identifying (220, 910) which of the categorical attribute of the data instances caused the change in the anomaly scores using a counterfactual analysis (220), and wherein the counterfactual analysis comprises:removing (305) at least a portion of the data instances;regenerating (310) the anomaly scores for each of the data instances which remain after the removing over continuous time intervals; andwherein if the regenerated anomaly scores are improved compared to the anomaly scores, at least a portion of the categorical attributes are identified (320) as anomalous categorical attributes and a cause of the anomalous activity.
- The method of claim 1 or 2, wherein categorizing (904) the data instances of the unstructured input stream of data instances comprises:tokenizing (504) segments (600, 802, 804) within the unstructured input stream;filtering or removing (506) a portion of the tokenized segments (602) based on a set of filtering criteria;applying (508) a weight to one or more of the filtered, tokenized segments (604, 702, 704, 806, 808);comparing (510) the filtered, tokenized segments (604, 702, 704, 806, 808) to one another to determine if a match exists therebetween; andcategorizing (512) the filtered, tokenized segments (604, 702, 704, 806, 808) based on the comparison.
- The method of claim 3, wherein when a match does not exist, a new category is created and attributed to one or more of the filtered, tokenized segments (604, 702, 704, 806, 808).
- The method of claim 3 or 4, further comprising applying tokenization rules to exclude at least a portion of the segments (600, 802, 804) of the unstructured log file.
- The method of claim 3, 4 or 5, further comprising applying filtering rules to remove tokenized segments (602) corresponding to only numerical values or tokenized segments (602) corresponding to date-related words, or tokenized segments (602) corresponding to numbers with trailing units.
- The method of claim 3, 4, 5 or 6, wherein comparing (510) the filtered, tokenized segments (604, 702, 704, 806, 808) to one another further comprises determining distances between the filtered, tokenized segments (604, 702, 704, 806, 808) based on deletions and replacements, further wherein the distances between the filtered, tokenized segments (604, 702, 704, 806, 808) indicates if they are close enough to match.
- The method of any of the preceding claims, wherein generating (210, 906) the anomaly scores comprises:creating features for a current group of the data instances;applying an anomaly detection algorithm that takes as inputs the features for the current group, and group features calculated using set functions for groups earlier than the current group; andgenerating the anomaly scores, the anomaly scores being indicative of how anomalous are the features for the current group.
- The method of any of the preceding claims, further comprising enacting (225) changes in the computing environment (100) relative to at least a portion of the categorical attributes to prevent future instances of the anomalous activity.
- The method of any of the preceding claims, wherein the unstructured input stream is an unstructured log file of the computing environment (100), the unstructured log file comprising temporal data.
- The method of any of the preceding claims, wherein the data instances further comprise at least one principal value and a set of categorical attributes; and
wherein the method further comprises:grouping (415) the data instances into groups based on continuous time intervals, each of the continuous time intervals having a length;applying (420) set functions to each of the groups;generating (425) an anomaly score for each of the groups using the set functions; andapplying (430, 435) a counterfactual analysis or a regularity analysis to identify which of the set of categorical attributes for a group is influencing one or more anomalies in the groups that are indicative of the anomalous activity in the computing environment (100). - The method of claim 11, wherein generating (425) the anomaly score further comprises applying an anomaly detection algorithm to values generated using the set function to detect changes in the groups over the continuous time intervals.
- The method of claim 11, wherein the regularity analysis further comprises identifying when a categorical attribute of the set of categorical attributes influences the anomaly score for the set of categorical attributes if an output of an anomaly detection algorithm is approximately identical to alternative instances in which the set of categorical attributes exists.
- A system comprising a processor (115) configured to perform the method of any of claims 1-13.
- A computer-readable storage medium comprising instructions which, when executed by a computer, cause the computer to carry out the method of any of claims 1-13.
Applications Claiming Priority (3)
| Application Number | Priority Date | Filing Date | Title |
|---|---|---|---|
| US15/498,406 US10986110B2 (en) | 2017-04-26 | 2017-04-26 | Anomaly and causation detection in computing environments using counterfactual processing |
| US15/855,748 US11783046B2 (en) | 2017-04-26 | 2017-12-27 | Anomaly and causation detection in computing environments |
| PCT/US2018/024671 WO2018200113A1 (en) | 2017-04-26 | 2018-03-27 | Anomaly and causation detection in computing environments |
Publications (4)
| Publication Number | Publication Date |
|---|---|
| EP3616096A1 EP3616096A1 (en) | 2020-03-04 |
| EP3616096A4 EP3616096A4 (en) | 2020-10-14 |
| EP3616096B1 true EP3616096B1 (en) | 2023-11-15 |
| EP3616096B8 EP3616096B8 (en) | 2024-01-17 |
Family
ID=63916724
Family Applications (1)
| Application Number | Title | Priority Date | Filing Date |
|---|---|---|---|
| EP18791513.7A Active EP3616096B8 (en) | 2017-04-26 | 2018-03-27 | Anomaly and causation detection in computing environments |
Country Status (4)
| Country | Link |
|---|---|
| US (1) | US11783046B2 (en) |
| EP (1) | EP3616096B8 (en) |
| ES (1) | ES2968622T3 (en) |
| WO (1) | WO2018200113A1 (en) |
Families Citing this family (44)
| Publication number | Priority date | Publication date | Assignee | Title |
|---|---|---|---|---|
| US11017330B2 (en) | 2014-05-20 | 2021-05-25 | Elasticsearch B.V. | Method and system for analysing data |
| US10986110B2 (en) | 2017-04-26 | 2021-04-20 | Elasticsearch B.V. | Anomaly and causation detection in computing environments using counterfactual processing |
| US11783046B2 (en) | 2017-04-26 | 2023-10-10 | Elasticsearch B.V. | Anomaly and causation detection in computing environments |
| US11621969B2 (en) | 2017-04-26 | 2023-04-04 | Elasticsearch B.V. | Clustering and outlier detection in anomaly and causation detection for computing environments |
| US11449786B2 (en) * | 2017-05-10 | 2022-09-20 | Intel Corporation | Methods and apparatus to generate anomaly detection datasets |
| US10726128B2 (en) * | 2017-07-24 | 2020-07-28 | Crowdstrike, Inc. | Malware detection using local computational models |
| US10043036B1 (en) * | 2017-08-22 | 2018-08-07 | TokenEx, LLC | Systems and methods for tokenization to support pseudononymization of sensitive data |
| WO2019176062A1 (en) * | 2018-03-15 | 2019-09-19 | 日本電気株式会社 | Analysis device, analysis method, and recording medium |
| US11575688B2 (en) * | 2018-05-02 | 2023-02-07 | Sri International | Method of malware characterization and prediction |
| WO2020043267A1 (en) * | 2018-08-27 | 2020-03-05 | Huawei Technologies Co., Ltd. | Device and method for anomaly detection on an input stream of events |
| US10878018B1 (en) * | 2018-09-13 | 2020-12-29 | Architecture Technology Corporation | Systems and methods for classification of data streams |
| US11652841B2 (en) * | 2018-09-21 | 2023-05-16 | Kaalbi Technologies Private Limited | System and method for detecting bots based on iterative clustering and feedback-driven adaptive learning techniques |
| US20220147614A1 (en) * | 2019-03-05 | 2022-05-12 | Siemens Industry Software Inc. | Machine learning-based anomaly detections for embedded software applications |
| US11580442B2 (en) * | 2019-04-30 | 2023-02-14 | Cylance Inc. | Machine learning model score obfuscation using time-based score oscillations |
| US11762950B1 (en) * | 2019-05-27 | 2023-09-19 | ExSano, Inc. | Automatic and blind segmentation of diverse data |
| US11341581B2 (en) * | 2019-07-09 | 2022-05-24 | Digits Financial, Inc. | System and method for regular expression generation for improved data transfer |
| US20210027167A1 (en) * | 2019-07-26 | 2021-01-28 | Cisco Technology, Inc. | Model structure extraction for analyzing unstructured text data |
| US10691728B1 (en) * | 2019-08-13 | 2020-06-23 | Datadog, Inc. | Transforming a data stream into structured data |
| US11630902B2 (en) | 2020-01-22 | 2023-04-18 | Forcepoint Llc | Representing sets of behaviors within an entity behavior catalog |
| US11636202B2 (en) | 2020-02-21 | 2023-04-25 | Cylance Inc. | Projected vector overflow penalty as mitigation for machine learning model string stuffing |
| US11604871B2 (en) * | 2020-03-27 | 2023-03-14 | Cylance Inc. | Projected vector modification as mitigation for machine learning model string stuffing |
| US12039276B2 (en) | 2020-04-29 | 2024-07-16 | Cisco Technology, Inc. | Anomaly classification with attendant word enrichment |
| US11210775B1 (en) | 2020-09-18 | 2021-12-28 | International Business Machines Corporation | Gradient-embedded video anomaly detection |
| US12254388B2 (en) * | 2020-10-27 | 2025-03-18 | Accenture Global Solutions Limited | Generation of counterfactual explanations using artificial intelligence and machine learning techniques |
| US12182067B2 (en) | 2020-11-04 | 2024-12-31 | Netapp, Inc. | Containerization and serverless thread implementation for processing objects |
| US12169483B2 (en) | 2020-11-04 | 2024-12-17 | Netapp, Inc. | On-demand parallel processing of objects using data connector components |
| US12174789B2 (en) * | 2020-11-04 | 2024-12-24 | Netapp, Inc. | Sibling object generation for storing results of operations performed upon base objects |
| US11755590B2 (en) | 2020-11-04 | 2023-09-12 | Netapp, Inc. | Data connector component for implementing integrity checking, anomaly detection, and file system metadata analysis |
| US12164381B2 (en) | 2020-11-04 | 2024-12-10 | Netapp, Inc. | Data connector component for implementing management requests |
| US11625306B2 (en) | 2020-11-04 | 2023-04-11 | Netapp, Inc. | Data connector component for implementing data requests |
| US20220253733A1 (en) * | 2021-02-05 | 2022-08-11 | Mingming Zuo | Abnormality detection based on causal graphs representing causal relationships of abnormalities |
| US20220318118A1 (en) * | 2021-03-31 | 2022-10-06 | Hewlett Packard Enterprise Development Lp | Detecting changes in application behavior using anomaly corroboration |
| US11847111B2 (en) * | 2021-04-09 | 2023-12-19 | Bitdefender IPR Management Ltd. | Anomaly detection systems and methods |
| US11640387B2 (en) * | 2021-04-23 | 2023-05-02 | Capital One Services, Llc | Anomaly detection data workflow for time series data |
| US11856014B2 (en) * | 2021-04-23 | 2023-12-26 | Capital One Services, Llc | Anomaly detection in computing computing system events |
| CN113824725B (en) * | 2021-09-24 | 2023-04-07 | 中国人民解放军国防科技大学 | Network safety monitoring analysis method and system based on causal machine learning |
| CN116185752A (en) * | 2021-11-26 | 2023-05-30 | 中兴通讯股份有限公司 | A log-based abnormality monitoring method, system, device and storage medium |
| US11741486B1 (en) * | 2022-05-31 | 2023-08-29 | Intuit, Inc. | Machine learning technique with targeted feature sets for categorical anomaly detection |
| EP4369679B1 (en) * | 2022-11-10 | 2025-05-21 | Nokia Solutions and Networks Oy | Data analytics on measurement data |
| US20240168822A1 (en) * | 2022-11-18 | 2024-05-23 | Tangoe Us, Inc. | System and Method Of Annotating Data Models Allowing The Factoring In Or Out Of Recurring Events To Improve The Outcome Of Predictive Systems |
| US12619734B2 (en) * | 2023-03-27 | 2026-05-05 | Sap Se | Automatic classification of security vulnerabilities |
| US12549498B2 (en) * | 2024-01-30 | 2026-02-10 | Salesforce, Inc. | Data management in a public cloud network |
| US12452127B2 (en) * | 2024-01-30 | 2025-10-21 | Salesforce, Inc. | Data management in a public cloud network |
| CN117914954B (en) * | 2024-03-20 | 2024-06-21 | 南通阳鸿石化储运有限公司 | Data transmission method and system in dangerous chemical storage and transportation process |
Family Cites Families (50)
| Publication number | Priority date | Publication date | Assignee | Title |
|---|---|---|---|---|
| US6012152A (en) | 1996-11-27 | 2000-01-04 | Telefonaktiebolaget Lm Ericsson (Publ) | Software fault management system |
| US8126779B2 (en) | 1999-04-11 | 2012-02-28 | William Paul Wanker | Machine implemented methods of ranking merchants |
| US6260041B1 (en) | 1999-09-30 | 2001-07-10 | Netcurrents, Inc. | Apparatus and method of implementing fast internet real-time search technology (first) |
| US20030065409A1 (en) | 2001-09-28 | 2003-04-03 | Raeth Peter G. | Adaptively detecting an event of interest |
| US20030101076A1 (en) | 2001-10-02 | 2003-05-29 | Zaleski John R. | System for supporting clinical decision making through the modeling of acquired patient medical information |
| US9306966B2 (en) | 2001-12-14 | 2016-04-05 | The Trustees Of Columbia University In The City Of New York | Methods of unsupervised anomaly detection using a geometric framework |
| CA2471013C (en) | 2001-12-19 | 2011-07-26 | David Helsper | Method and system for analyzing and predicting the behavior of systems |
| US7089250B2 (en) | 2003-10-08 | 2006-08-08 | International Business Machines Corporation | Method and system for associating events |
| US7451210B2 (en) | 2003-11-24 | 2008-11-11 | International Business Machines Corporation | Hybrid method for event prediction and system control |
| US20060020923A1 (en) | 2004-06-15 | 2006-01-26 | K5 Systems Inc. | System and method for monitoring performance of arbitrary groupings of network infrastructure and applications |
| GB2434670B (en) | 2004-08-13 | 2008-06-11 | Remasys Pty Ltd | Monitoring and management of distributed information systems |
| US20060167917A1 (en) | 2005-01-21 | 2006-07-27 | Solomon Research Llc | System, methods and apparatus for complex behaviors of collectives of intelligent mobile software agents |
| US7881535B1 (en) | 2006-06-29 | 2011-02-01 | Capital One Financial Corporation | System and method for managing statistical models |
| US8027439B2 (en) | 2006-09-18 | 2011-09-27 | Fair Isaac Corporation | Self-calibrating fraud detection |
| US8326819B2 (en) | 2006-11-13 | 2012-12-04 | Exegy Incorporated | Method and system for high performance data metatagging and data indexing using coprocessors |
| US7310590B1 (en) | 2006-11-15 | 2007-12-18 | Computer Associates Think, Inc. | Time series anomaly detection using multiple statistical models |
| US7539593B2 (en) | 2007-04-27 | 2009-05-26 | Invensys Systems, Inc. | Self-validated measurement systems |
| US20090077663A1 (en) | 2007-09-17 | 2009-03-19 | Alcatel Lucent | Score-based intrusion prevention system |
| US8433542B2 (en) | 2008-02-27 | 2013-04-30 | Wurldtech Security Technologies | Testing framework for control devices |
| US8214308B2 (en) | 2007-10-23 | 2012-07-03 | Sas Institute Inc. | Computer-implemented systems and methods for updating predictive models |
| US20090177692A1 (en) | 2008-01-04 | 2009-07-09 | Byran Christopher Chagoly | Dynamic correlation of service oriented architecture resource relationship and metrics to isolate problem sources |
| US10031829B2 (en) | 2009-09-30 | 2018-07-24 | International Business Machines Corporation | Method and system for it resources performance analysis |
| US20120137367A1 (en) | 2009-11-06 | 2012-05-31 | Cataphora, Inc. | Continuous anomaly detection based on behavior modeling and heterogeneous information analysis |
| EP2360590A3 (en) | 2009-12-10 | 2011-10-26 | Prelert Ltd. | Apparatus and method for analysing a computer infrastructure |
| US8654655B2 (en) * | 2009-12-17 | 2014-02-18 | Thomson Licensing | Detecting and classifying anomalies in communication networks |
| US20150235312A1 (en) | 2014-02-14 | 2015-08-20 | Stephen Dodson | Method and Apparatus for Detecting Rogue Trading Activity |
| US20130031130A1 (en) | 2010-12-30 | 2013-01-31 | Charles Wilbur Hahm | System and method for interactive querying and analysis of data |
| US9038172B2 (en) | 2011-05-06 | 2015-05-19 | The Penn State Research Foundation | Robust anomaly detection and regularized domain adaptation of classifiers with application to internet packet-flows |
| US20130096170A1 (en) | 2011-10-14 | 2013-04-18 | Hospira, Inc. | Methods of treating pediatric patients using dexmedetomidine |
| US9224067B1 (en) | 2012-01-23 | 2015-12-29 | Hrl Laboratories, Llc | System and methods for digital artifact genetic modeling and forensic analysis |
| US8832120B2 (en) | 2012-01-30 | 2014-09-09 | Mastercard International Incorporated | Methods and systems for analyzing weirdness of variables |
| US8650110B2 (en) * | 2012-03-12 | 2014-02-11 | Intuit Inc. | Counterfactual testing of finances using financial objects |
| US20150047026A1 (en) | 2012-03-22 | 2015-02-12 | Los Alamos National Security, Llc | Anomaly detection to identify coordinated group attacks in computer networks |
| EP2645257A3 (en) | 2012-03-29 | 2014-06-18 | Prelert Ltd. | System and method for visualisation of behaviour within computer infrastructure |
| US20130325584A1 (en) | 2012-06-04 | 2013-12-05 | David Taylor Bogaty | Methods and systems for attributing changes in an advertising metric of interest to other advertising metrics |
| US8914317B2 (en) * | 2012-06-28 | 2014-12-16 | International Business Machines Corporation | Detecting anomalies in real-time in multiple time series data with automated thresholding |
| US9197511B2 (en) | 2012-10-12 | 2015-11-24 | Adobe Systems Incorporated | Anomaly detection in network-site metrics using predictive modeling |
| US20150302310A1 (en) | 2013-03-15 | 2015-10-22 | Nordic Technology Group | Methods for data collection and analysis for event detection |
| US9215240B2 (en) | 2013-07-25 | 2015-12-15 | Splunk Inc. | Investigative and dynamic detection of potential security-threat indicators from events in big data |
| GB2519941B (en) | 2013-09-13 | 2021-08-25 | Elasticsearch Bv | Method and apparatus for detecting irregularities on device |
| US9210183B2 (en) * | 2013-12-19 | 2015-12-08 | Microsoft Technology Licensing, Llc | Detecting anomalous activity from accounts of an online service |
| US11017330B2 (en) | 2014-05-20 | 2021-05-25 | Elasticsearch B.V. | Method and system for analysing data |
| US9269162B1 (en) * | 2014-08-25 | 2016-02-23 | Raytheon Company | Rapid anomaly detection (RAND) |
| US9565203B2 (en) | 2014-11-13 | 2017-02-07 | Cyber-Ark Software Ltd. | Systems and methods for detection of anomalous network behavior |
| US9544321B2 (en) | 2015-01-30 | 2017-01-10 | Securonix, Inc. | Anomaly detection using adaptive behavioral profiles |
| US9699205B2 (en) | 2015-08-31 | 2017-07-04 | Splunk Inc. | Network security system |
| US10679008B2 (en) * | 2016-12-16 | 2020-06-09 | Microsoft Technology Licensing, Llc | Knowledge base for analysis of text |
| US11783046B2 (en) | 2017-04-26 | 2023-10-10 | Elasticsearch B.V. | Anomaly and causation detection in computing environments |
| US10986110B2 (en) | 2017-04-26 | 2021-04-20 | Elasticsearch B.V. | Anomaly and causation detection in computing environments using counterfactual processing |
| US11621969B2 (en) | 2017-04-26 | 2023-04-04 | Elasticsearch B.V. | Clustering and outlier detection in anomaly and causation detection for computing environments |
-
2017
- 2017-12-27 US US15/855,748 patent/US11783046B2/en active Active
-
2018
- 2018-03-27 ES ES18791513T patent/ES2968622T3/en active Active
- 2018-03-27 WO PCT/US2018/024671 patent/WO2018200113A1/en not_active Ceased
- 2018-03-27 EP EP18791513.7A patent/EP3616096B8/en active Active
Also Published As
| Publication number | Publication date |
|---|---|
| EP3616096A1 (en) | 2020-03-04 |
| EP3616096B8 (en) | 2024-01-17 |
| EP3616096A4 (en) | 2020-10-14 |
| ES2968622T3 (en) | 2024-05-13 |
| US20180314835A1 (en) | 2018-11-01 |
| WO2018200113A1 (en) | 2018-11-01 |
| US11783046B2 (en) | 2023-10-10 |
Similar Documents
| Publication | Publication Date | Title |
|---|---|---|
| US11783046B2 (en) | Anomaly and causation detection in computing environments | |
| EP3616062B1 (en) | Anomaly and causation detection in computing environments using counterfactual processing | |
| CN118656870B (en) | Enterprise sensitive data security access management method and system | |
| US20220327409A1 (en) | Real Time Detection of Cyber Threats Using Self-Referential Entity Data | |
| Aljawarneh et al. | An enhanced J48 classification algorithm for the anomaly intrusion detection systems | |
| CN119071052A (en) | Network anomaly monitoring method and system for switch | |
| Rashidi et al. | Android malicious application detection using support vector machine and active learning | |
| Singh et al. | User behaviour based insider threat detection in critical infrastructures | |
| US20250238306A1 (en) | Interactive data processing system failure management using hidden knowledge from predictive models | |
| CN119358039B (en) | Sensitive data dynamic desensitization method and related equipment in cloud environment | |
| US20250238303A1 (en) | Interactive data processing system failure management using hidden knowledge from predictive models | |
| US20230205839A1 (en) | Bias mitigating machine learning training system | |
| Dentamaro et al. | Ensemble Consensus: An Unsupervised Algorithm for Anomaly Detection in Network Security data. | |
| CN121210854B (en) | A method for noise reduction and automatic handling of security alarms based on intelligent agents | |
| Sarker et al. | Natural language processing-based ensemble technique to predict potential accident severity | |
| CN119358007B (en) | Machine Learning-Based Industrial Information Data Security Protection Methods and Systems | |
| US20250238307A1 (en) | Interactive data processing system failure management using hidden knowledge from predictive models | |
| Plasse et al. | Streaming changepoint detection for transition matrices | |
| CN117786232A (en) | Software management method and software platform in software platform | |
| Kim et al. | AI-Driven Prioritization and Filtering of Windows Artifacts for Enhanced Digital Forensics | |
| Martins et al. | Adaptive Online Learning Approaches for Detecting Unknown Attacks in Network Traffic: A Systematic Literature Review | |
| Sivakrishna et al. | An Adaptive Insider Threat Detection Framework Using Causal Analysis and Liquid Neural Networks | |
| Ramkissoon et al. | An ensemble based computational social system for fake news detection in MANET messaging | |
| Cabri | Quantum inspired approach for early classification of time series | |
| US12164409B1 (en) | Machine learning systems and methods to corroborate and forecast user experience issues on web or mobile applications utilizing user verbatim, machine logs and user interface interaction analytics |
Legal Events
| Date | Code | Title | Description |
|---|---|---|---|
| STAA | Information on the status of an ep patent application or granted ep patent |
Free format text: STATUS: THE INTERNATIONAL PUBLICATION HAS BEEN MADE |
|
| PUAI | Public reference made under article 153(3) epc to a published international application that has entered the european phase |
Free format text: ORIGINAL CODE: 0009012 |
|
| STAA | Information on the status of an ep patent application or granted ep patent |
Free format text: STATUS: REQUEST FOR EXAMINATION WAS MADE |
|
| 17P | Request for examination filed |
Effective date: 20191120 |
|
| AK | Designated contracting states |
Kind code of ref document: A1 Designated state(s): AL AT BE BG CH CY CZ DE DK EE ES FI FR GB GR HR HU IE IS IT LI LT LU LV MC MK MT NL NO PL PT RO RS SE SI SK SM TR |
|
| AX | Request for extension of the european patent |
Extension state: BA ME |
|
| DAV | Request for validation of the european patent (deleted) | ||
| DAX | Request for extension of the european patent (deleted) | ||
| A4 | Supplementary search report drawn up and despatched |
Effective date: 20200914 |
|
| RIC1 | Information provided on ipc code assigned before grant |
Ipc: H04L 29/06 20060101ALI20200908BHEP Ipc: G06F 21/56 20130101ALI20200908BHEP Ipc: G06F 21/55 20130101ALI20200908BHEP Ipc: G06F 21/50 20130101ALI20200908BHEP Ipc: G06F 11/00 20060101AFI20200908BHEP |
|
| STAA | Information on the status of an ep patent application or granted ep patent |
Free format text: STATUS: EXAMINATION IS IN PROGRESS |
|
| 17Q | First examination report despatched |
Effective date: 20220309 |
|
| REG | Reference to a national code |
Ref country code: DE Ref legal event code: R079 Ipc: H04L0009400000 Ref country code: DE Ref legal event code: R079 Ref document number: 602018061165 Country of ref document: DE Free format text: PREVIOUS MAIN CLASS: G06F0017300000 Ipc: H04L0009400000 |
|
| GRAP | Despatch of communication of intention to grant a patent |
Free format text: ORIGINAL CODE: EPIDOSNIGR1 |
|
| RIC1 | Information provided on ipc code assigned before grant |
Ipc: G06F 21/56 20130101ALI20230324BHEP Ipc: G06F 21/55 20130101ALI20230324BHEP Ipc: G06F 11/00 20060101ALI20230324BHEP Ipc: H04L 9/40 20220101AFI20230324BHEP |
|
| STAA | Information on the status of an ep patent application or granted ep patent |
Free format text: STATUS: GRANT OF PATENT IS INTENDED |
|
| INTG | Intention to grant announced |
Effective date: 20230504 |
|
| GRAS | Grant fee paid |
Free format text: ORIGINAL CODE: EPIDOSNIGR3 |
|
| GRAA | (expected) grant |
Free format text: ORIGINAL CODE: 0009210 |
|
| STAA | Information on the status of an ep patent application or granted ep patent |
Free format text: STATUS: THE PATENT HAS BEEN GRANTED |
|
| AK | Designated contracting states |
Kind code of ref document: B1 Designated state(s): AL AT BE BG CH CY CZ DE DK EE ES FI FR GB GR HR HU IE IS IT LI LT LU LV MC MK MT NL NO PL PT RO RS SE SI SK SM TR |
|
| RAP3 | Party data changed (applicant data changed or rights of an application transferred) |
Owner name: ELASTICSEARCH B.V. |
|
| REG | Reference to a national code |
Ref country code: CH Ref legal event code: EP Ref country code: GB Ref legal event code: FG4D |
|
| RIN1 | Information on inventor provided before grant (corrected) |
Inventor name: ROBERTS, DAVID MARK Inventor name: VEASEY, THOMAS Inventor name: DODSON, STEPHEN |
|
| REG | Reference to a national code |
Ref country code: DE Ref legal event code: R096 Ref document number: 602018061165 Country of ref document: DE |
|
| REG | Reference to a national code |
Ref country code: IE Ref legal event code: FG4D |
|
| GRAT | Correction requested after decision to grant or after decision to maintain patent in amended form |
Free format text: ORIGINAL CODE: EPIDOSNCDEC |
|
| REG | Reference to a national code |
Ref country code: CH Ref legal event code: PK Free format text: BERICHTIGUNG B8 |
|
| REG | Reference to a national code |
Ref country code: NL Ref legal event code: FP |
|
| REG | Reference to a national code |
Ref country code: LT Ref legal event code: MG9D |
|
| PG25 | Lapsed in a contracting state [announced via postgrant information from national office to epo] |
Ref country code: GR Free format text: LAPSE BECAUSE OF FAILURE TO SUBMIT A TRANSLATION OF THE DESCRIPTION OR TO PAY THE FEE WITHIN THE PRESCRIBED TIME-LIMIT Effective date: 20240216 |
|
| PG25 | Lapsed in a contracting state [announced via postgrant information from national office to epo] |
Ref country code: IS Free format text: LAPSE BECAUSE OF FAILURE TO SUBMIT A TRANSLATION OF THE DESCRIPTION OR TO PAY THE FEE WITHIN THE PRESCRIBED TIME-LIMIT Effective date: 20240315 |
|
| PG25 | Lapsed in a contracting state [announced via postgrant information from national office to epo] |
Ref country code: LT Free format text: LAPSE BECAUSE OF FAILURE TO SUBMIT A TRANSLATION OF THE DESCRIPTION OR TO PAY THE FEE WITHIN THE PRESCRIBED TIME-LIMIT Effective date: 20231115 |
|
| REG | Reference to a national code |
Ref country code: AT Ref legal event code: MK05 Ref document number: 1632772 Country of ref document: AT Kind code of ref document: T Effective date: 20231115 |
|
| PG25 | Lapsed in a contracting state [announced via postgrant information from national office to epo] |
Ref country code: AT Free format text: LAPSE BECAUSE OF FAILURE TO SUBMIT A TRANSLATION OF THE DESCRIPTION OR TO PAY THE FEE WITHIN THE PRESCRIBED TIME-LIMIT Effective date: 20231115 |
|
| PG25 | Lapsed in a contracting state [announced via postgrant information from national office to epo] |
Ref country code: LT Free format text: LAPSE BECAUSE OF FAILURE TO SUBMIT A TRANSLATION OF THE DESCRIPTION OR TO PAY THE FEE WITHIN THE PRESCRIBED TIME-LIMIT Effective date: 20231115 Ref country code: IS Free format text: LAPSE BECAUSE OF FAILURE TO SUBMIT A TRANSLATION OF THE DESCRIPTION OR TO PAY THE FEE WITHIN THE PRESCRIBED TIME-LIMIT Effective date: 20240315 Ref country code: GR Free format text: LAPSE BECAUSE OF FAILURE TO SUBMIT A TRANSLATION OF THE DESCRIPTION OR TO PAY THE FEE WITHIN THE PRESCRIBED TIME-LIMIT Effective date: 20240216 Ref country code: BG Free format text: LAPSE BECAUSE OF FAILURE TO SUBMIT A TRANSLATION OF THE DESCRIPTION OR TO PAY THE FEE WITHIN THE PRESCRIBED TIME-LIMIT Effective date: 20240215 Ref country code: AT Free format text: LAPSE BECAUSE OF FAILURE TO SUBMIT A TRANSLATION OF THE DESCRIPTION OR TO PAY THE FEE WITHIN THE PRESCRIBED TIME-LIMIT Effective date: 20231115 Ref country code: PT Free format text: LAPSE BECAUSE OF FAILURE TO SUBMIT A TRANSLATION OF THE DESCRIPTION OR TO PAY THE FEE WITHIN THE PRESCRIBED TIME-LIMIT Effective date: 20240315 |
|
| REG | Reference to a national code |
Ref country code: ES Ref legal event code: FG2A Ref document number: 2968622 Country of ref document: ES Kind code of ref document: T3 Effective date: 20240513 |
|
| PG25 | Lapsed in a contracting state [announced via postgrant information from national office to epo] |
Ref country code: SE Free format text: LAPSE BECAUSE OF FAILURE TO SUBMIT A TRANSLATION OF THE DESCRIPTION OR TO PAY THE FEE WITHIN THE PRESCRIBED TIME-LIMIT Effective date: 20231115 Ref country code: RS Free format text: LAPSE BECAUSE OF FAILURE TO SUBMIT A TRANSLATION OF THE DESCRIPTION OR TO PAY THE FEE WITHIN THE PRESCRIBED TIME-LIMIT Effective date: 20231115 Ref country code: PL Free format text: LAPSE BECAUSE OF FAILURE TO SUBMIT A TRANSLATION OF THE DESCRIPTION OR TO PAY THE FEE WITHIN THE PRESCRIBED TIME-LIMIT Effective date: 20231115 Ref country code: NO Free format text: LAPSE BECAUSE OF FAILURE TO SUBMIT A TRANSLATION OF THE DESCRIPTION OR TO PAY THE FEE WITHIN THE PRESCRIBED TIME-LIMIT Effective date: 20240215 Ref country code: LV Free format text: LAPSE BECAUSE OF FAILURE TO SUBMIT A TRANSLATION OF THE DESCRIPTION OR TO PAY THE FEE WITHIN THE PRESCRIBED TIME-LIMIT Effective date: 20231115 Ref country code: HR Free format text: LAPSE BECAUSE OF FAILURE TO SUBMIT A TRANSLATION OF THE DESCRIPTION OR TO PAY THE FEE WITHIN THE PRESCRIBED TIME-LIMIT Effective date: 20231115 |
|
| PG25 | Lapsed in a contracting state [announced via postgrant information from national office to epo] |
Ref country code: DK Free format text: LAPSE BECAUSE OF FAILURE TO SUBMIT A TRANSLATION OF THE DESCRIPTION OR TO PAY THE FEE WITHIN THE PRESCRIBED TIME-LIMIT Effective date: 20231115 |
|
| PG25 | Lapsed in a contracting state [announced via postgrant information from national office to epo] |
Ref country code: CZ Free format text: LAPSE BECAUSE OF FAILURE TO SUBMIT A TRANSLATION OF THE DESCRIPTION OR TO PAY THE FEE WITHIN THE PRESCRIBED TIME-LIMIT Effective date: 20231115 |
|
| PG25 | Lapsed in a contracting state [announced via postgrant information from national office to epo] |
Ref country code: SK Free format text: LAPSE BECAUSE OF FAILURE TO SUBMIT A TRANSLATION OF THE DESCRIPTION OR TO PAY THE FEE WITHIN THE PRESCRIBED TIME-LIMIT Effective date: 20231115 |
|
| PG25 | Lapsed in a contracting state [announced via postgrant information from national office to epo] |
Ref country code: SM Free format text: LAPSE BECAUSE OF FAILURE TO SUBMIT A TRANSLATION OF THE DESCRIPTION OR TO PAY THE FEE WITHIN THE PRESCRIBED TIME-LIMIT Effective date: 20231115 Ref country code: SK Free format text: LAPSE BECAUSE OF FAILURE TO SUBMIT A TRANSLATION OF THE DESCRIPTION OR TO PAY THE FEE WITHIN THE PRESCRIBED TIME-LIMIT Effective date: 20231115 Ref country code: RO Free format text: LAPSE BECAUSE OF FAILURE TO SUBMIT A TRANSLATION OF THE DESCRIPTION OR TO PAY THE FEE WITHIN THE PRESCRIBED TIME-LIMIT Effective date: 20231115 Ref country code: IT Free format text: LAPSE BECAUSE OF FAILURE TO SUBMIT A TRANSLATION OF THE DESCRIPTION OR TO PAY THE FEE WITHIN THE PRESCRIBED TIME-LIMIT Effective date: 20231115 Ref country code: EE Free format text: LAPSE BECAUSE OF FAILURE TO SUBMIT A TRANSLATION OF THE DESCRIPTION OR TO PAY THE FEE WITHIN THE PRESCRIBED TIME-LIMIT Effective date: 20231115 Ref country code: DK Free format text: LAPSE BECAUSE OF FAILURE TO SUBMIT A TRANSLATION OF THE DESCRIPTION OR TO PAY THE FEE WITHIN THE PRESCRIBED TIME-LIMIT Effective date: 20231115 Ref country code: CZ Free format text: LAPSE BECAUSE OF FAILURE TO SUBMIT A TRANSLATION OF THE DESCRIPTION OR TO PAY THE FEE WITHIN THE PRESCRIBED TIME-LIMIT Effective date: 20231115 |
|
| REG | Reference to a national code |
Ref country code: DE Ref legal event code: R097 Ref document number: 602018061165 Country of ref document: DE |
|
| PLBE | No opposition filed within time limit |
Free format text: ORIGINAL CODE: 0009261 |
|
| STAA | Information on the status of an ep patent application or granted ep patent |
Free format text: STATUS: NO OPPOSITION FILED WITHIN TIME LIMIT |
|
| 26N | No opposition filed |
Effective date: 20240819 |
|
| PG25 | Lapsed in a contracting state [announced via postgrant information from national office to epo] |
Ref country code: SI Free format text: LAPSE BECAUSE OF FAILURE TO SUBMIT A TRANSLATION OF THE DESCRIPTION OR TO PAY THE FEE WITHIN THE PRESCRIBED TIME-LIMIT Effective date: 20231115 |
|
| PG25 | Lapsed in a contracting state [announced via postgrant information from national office to epo] |
Ref country code: SI Free format text: LAPSE BECAUSE OF FAILURE TO SUBMIT A TRANSLATION OF THE DESCRIPTION OR TO PAY THE FEE WITHIN THE PRESCRIBED TIME-LIMIT Effective date: 20231115 |
|
| REG | Reference to a national code |
Ref country code: CH Ref legal event code: PL |
|
| PG25 | Lapsed in a contracting state [announced via postgrant information from national office to epo] |
Ref country code: LU Free format text: LAPSE BECAUSE OF NON-PAYMENT OF DUE FEES Effective date: 20240327 |
|
| PG25 | Lapsed in a contracting state [announced via postgrant information from national office to epo] |
Ref country code: MC Free format text: LAPSE BECAUSE OF FAILURE TO SUBMIT A TRANSLATION OF THE DESCRIPTION OR TO PAY THE FEE WITHIN THE PRESCRIBED TIME-LIMIT Effective date: 20231115 |
|
| PG25 | Lapsed in a contracting state [announced via postgrant information from national office to epo] |
Ref country code: MC Free format text: LAPSE BECAUSE OF FAILURE TO SUBMIT A TRANSLATION OF THE DESCRIPTION OR TO PAY THE FEE WITHIN THE PRESCRIBED TIME-LIMIT Effective date: 20231115 Ref country code: LU Free format text: LAPSE BECAUSE OF NON-PAYMENT OF DUE FEES Effective date: 20240327 |
|
| REG | Reference to a national code |
Ref country code: BE Ref legal event code: MM Effective date: 20240331 |
|
| PG25 | Lapsed in a contracting state [announced via postgrant information from national office to epo] |
Ref country code: BE Free format text: LAPSE BECAUSE OF NON-PAYMENT OF DUE FEES Effective date: 20240331 |
|
| PG25 | Lapsed in a contracting state [announced via postgrant information from national office to epo] |
Ref country code: BE Free format text: LAPSE BECAUSE OF NON-PAYMENT OF DUE FEES Effective date: 20240331 Ref country code: CH Free format text: LAPSE BECAUSE OF NON-PAYMENT OF DUE FEES Effective date: 20240331 |
|
| PGFP | Annual fee paid to national office [announced via postgrant information from national office to epo] |
Ref country code: ES Payment date: 20250414 Year of fee payment: 8 |
|
| PG25 | Lapsed in a contracting state [announced via postgrant information from national office to epo] |
Ref country code: CY Free format text: LAPSE BECAUSE OF FAILURE TO SUBMIT A TRANSLATION OF THE DESCRIPTION OR TO PAY THE FEE WITHIN THE PRESCRIBED TIME-LIMIT; INVALID AB INITIO Effective date: 20180327 |
|
| PG25 | Lapsed in a contracting state [announced via postgrant information from national office to epo] |
Ref country code: HU Free format text: LAPSE BECAUSE OF FAILURE TO SUBMIT A TRANSLATION OF THE DESCRIPTION OR TO PAY THE FEE WITHIN THE PRESCRIBED TIME-LIMIT; INVALID AB INITIO Effective date: 20180327 |
|
| PG25 | Lapsed in a contracting state [announced via postgrant information from national office to epo] |
Ref country code: FI Free format text: LAPSE BECAUSE OF FAILURE TO SUBMIT A TRANSLATION OF THE DESCRIPTION OR TO PAY THE FEE WITHIN THE PRESCRIBED TIME-LIMIT Effective date: 20231115 |
|
| PG25 | Lapsed in a contracting state [announced via postgrant information from national office to epo] |
Ref country code: TR Free format text: LAPSE BECAUSE OF FAILURE TO SUBMIT A TRANSLATION OF THE DESCRIPTION OR TO PAY THE FEE WITHIN THE PRESCRIBED TIME-LIMIT Effective date: 20231115 |
|
| PGFP | Annual fee paid to national office [announced via postgrant information from national office to epo] |
Ref country code: GB Payment date: 20260325 Year of fee payment: 9 |
|
| PGFP | Annual fee paid to national office [announced via postgrant information from national office to epo] |
Ref country code: DE Payment date: 20260317 Year of fee payment: 9 Ref country code: IE Payment date: 20260324 Year of fee payment: 9 |
|
| PGFP | Annual fee paid to national office [announced via postgrant information from national office to epo] |
Ref country code: NL Payment date: 20260327 Year of fee payment: 9 |
|
| PGFP | Annual fee paid to national office [announced via postgrant information from national office to epo] |
Ref country code: FR Payment date: 20260323 Year of fee payment: 9 |