EP3588382A1 - A deep learning method for tumor cell scoring on cancer biopsies - Google Patents
A deep learning method for tumor cell scoring on cancer biopsies Download PDFInfo
- Publication number
- EP3588382A1 EP3588382A1 EP19182560.3A EP19182560A EP3588382A1 EP 3588382 A1 EP3588382 A1 EP 3588382A1 EP 19182560 A EP19182560 A EP 19182560A EP 3588382 A1 EP3588382 A1 EP 3588382A1
- Authority
- EP
- European Patent Office
- Prior art keywords
- tissue
- image
- score
- stained
- diagnostic antibody
- Prior art date
- Legal status (The legal status is an assumption and is not a legal conclusion. Google has not performed a legal analysis and makes no representation as to the accuracy of the status listed.)
- Granted
Links
Images
















Classifications
-
- G—PHYSICS
- G06—COMPUTING OR CALCULATING; COUNTING
- G06V—IMAGE OR VIDEO RECOGNITION OR UNDERSTANDING
- G06V10/00—Arrangements for image or video recognition or understanding
- G06V10/70—Arrangements for image or video recognition or understanding using pattern recognition or machine learning
- G06V10/764—Arrangements for image or video recognition or understanding using pattern recognition or machine learning using classification, e.g. of video objects
-
- A—HUMAN NECESSITIES
- A61—MEDICAL OR VETERINARY SCIENCE; HYGIENE
- A61B—DIAGNOSIS; SURGERY; IDENTIFICATION
- A61B5/00—Measuring for diagnostic purposes; Identification of persons
- A61B5/72—Signal processing specially adapted for physiological signals or for diagnostic purposes
- A61B5/7235—Details of waveform analysis
- A61B5/7264—Classification of physiological signals or data, e.g. using neural networks, statistical classifiers, expert systems or fuzzy systems
- A61B5/7267—Classification of physiological signals or data, e.g. using neural networks, statistical classifiers, expert systems or fuzzy systems involving training the classification device
-
- G—PHYSICS
- G06—COMPUTING OR CALCULATING; COUNTING
- G06T—IMAGE DATA PROCESSING OR GENERATION, IN GENERAL
- G06T7/00—Image analysis
- G06T7/0002—Inspection of images, e.g. flaw detection
- G06T7/0012—Biomedical image inspection
-
- G—PHYSICS
- G06—COMPUTING OR CALCULATING; COUNTING
- G06V—IMAGE OR VIDEO RECOGNITION OR UNDERSTANDING
- G06V10/00—Arrangements for image or video recognition or understanding
- G06V10/70—Arrangements for image or video recognition or understanding using pattern recognition or machine learning
- G06V10/82—Arrangements for image or video recognition or understanding using pattern recognition or machine learning using neural networks
-
- G—PHYSICS
- G06—COMPUTING OR CALCULATING; COUNTING
- G06V—IMAGE OR VIDEO RECOGNITION OR UNDERSTANDING
- G06V20/00—Scenes; Scene-specific elements
- G06V20/60—Type of objects
- G06V20/69—Microscopic objects, e.g. biological cells or cellular parts
- G06V20/695—Preprocessing, e.g. image segmentation
-
- G—PHYSICS
- G06—COMPUTING OR CALCULATING; COUNTING
- G06V—IMAGE OR VIDEO RECOGNITION OR UNDERSTANDING
- G06V20/00—Scenes; Scene-specific elements
- G06V20/60—Type of objects
- G06V20/69—Microscopic objects, e.g. biological cells or cellular parts
- G06V20/698—Matching; Classification
-
- G—PHYSICS
- G06—COMPUTING OR CALCULATING; COUNTING
- G06T—IMAGE DATA PROCESSING OR GENERATION, IN GENERAL
- G06T2200/00—Indexing scheme for image data processing or generation, in general
- G06T2200/24—Indexing scheme for image data processing or generation, in general involving graphical user interfaces [GUIs]
-
- G—PHYSICS
- G06—COMPUTING OR CALCULATING; COUNTING
- G06T—IMAGE DATA PROCESSING OR GENERATION, IN GENERAL
- G06T2207/00—Indexing scheme for image analysis or image enhancement
- G06T2207/20—Special algorithmic details
- G06T2207/20081—Training; Learning
-
- G—PHYSICS
- G06—COMPUTING OR CALCULATING; COUNTING
- G06T—IMAGE DATA PROCESSING OR GENERATION, IN GENERAL
- G06T2207/00—Indexing scheme for image analysis or image enhancement
- G06T2207/20—Special algorithmic details
- G06T2207/20084—Artificial neural networks [ANN]
-
- G—PHYSICS
- G06—COMPUTING OR CALCULATING; COUNTING
- G06T—IMAGE DATA PROCESSING OR GENERATION, IN GENERAL
- G06T2207/00—Indexing scheme for image analysis or image enhancement
- G06T2207/30—Subject of image; Context of image processing
- G06T2207/30004—Biomedical image processing
- G06T2207/30024—Cell structures in vitro; Tissue sections in vitro
-
- G—PHYSICS
- G06—COMPUTING OR CALCULATING; COUNTING
- G06T—IMAGE DATA PROCESSING OR GENERATION, IN GENERAL
- G06T2207/00—Indexing scheme for image analysis or image enhancement
- G06T2207/30—Subject of image; Context of image processing
- G06T2207/30004—Biomedical image processing
- G06T2207/30061—Lung
-
- G—PHYSICS
- G06—COMPUTING OR CALCULATING; COUNTING
- G06V—IMAGE OR VIDEO RECOGNITION OR UNDERSTANDING
- G06V2201/00—Indexing scheme relating to image or video recognition or understanding
- G06V2201/03—Recognition of patterns in medical or anatomical images
Definitions
- the present invention relates to a method for generating a score of a histological diagnosis of a cancer patient by training a model to determine how many pixels of a digital image belong to a tissue that has been positively stained by a diagnostic antibody.
- Identifying tumor regions in digital images of cancer tissue is often a prerequisite to performing diagnostic and treatment measures, such as classifying cancers using standard grading schemes.
- the digital images of tissue slices used in histopathology are very large. Individual images require gigabytes to store. Manual annotation of the tumor regions in whole slides through the visual assessment of a pathologist is laborious considering the high volume of data. Therefore, "chemical annotation" has been used to substitute the marking of tumor regions by a pathologist with image recognition of regions stained by biomarkers that identify tissue that tends to be cancerous. Annotating tumor regions using specific antibody staining decreases the subjectivity of the pathologist's evaluation and accelerates the otherwise tedious process.
- Immunohistochemical staining can be used to distinguish marker-positive cells that express a particular protein from marker-negative cells that do not express the protein.
- IHC staining typically involves multiple dyes, which includes one or more dyes connected to protein-specific antibodies and another dye that is a counterstain.
- a common counterstain is hematoxylin, which labels DNA and thus stains nuclei.
- a protein specific stain or biomarker can be used to identify the regions of the tissue that are likely cancerous. For example, a biomarker that stains epithelial cells can help to identify the suspected tumor regions. Then other protein specific biomarkers are used to characterize the cancerous tissue. The regions stained by a specific biomarker can be identified and quantified and subsequently a score indicating the amount of positively stained tissue and negatively stained tissue can be visually estimated by pathologists. However, visual assessment by pathologists is prone to variability and subjectivity.
- a computer-based method for generating a repeatable and objective score of a histological diagnosis of a cancer patient, based on a precise estimation of tissue stained by a diagnostic antibody labeling cells that express a specific, cancer-treatment-related protein.
- the disclosed method uses a convolutional neural network model to determine how many pixels of an image patch that is cropped from a digital image of an immunohistochemically stained tissue belong to tissue that has been positively stained by a diagnostic antibody.
- the tissue that has been positively stained by the diagnostic antibody can be a specific cell, a specific group of cells or a specific type of cells present in the immunohistochemically stained tissue, for example, a macrophage or an epithelial cell or another cell that positively stains for the diagnostic antibody.
- a first image patch that is cropped from a digital image of a tissue slice immunohistochemically stained using a diagnostic antibody is loaded into a processing unit.
- the first image patch is processed using a convolutional neural network to determine how many pixels of the first image patch belong to a first tissue that both belongs to tumor epithelium and that has been positively stained using the diagnostic antibody.
- the pixel-wise analysis of the image patch allows for high spatial resolution and precision in identifying tumor epithelium tissue that is positively stained using the diagnostic antibody.
- additional image patches that have been cropped from the digital image are processed to determine how many pixels of each additional image patch belong to the first tissue.
- the score of the histopathological diagnosis is computed based on the total number of pixels of the digital image that belong to the first tissue.
- the digital image and the score are displayed on a graphical user interface.
- the score is the Tumor Cell (TC) score.
- Another embodiment of the method includes performing image processing on an image patch using a generative adversarial network (GAN) to train a convolutional neural network to determine how many pixels of the image patch belong to (a) a first tissue that is both tumor epithelium and has been positively stained using a diagnostic antibody, (b) a second tissue that is both tumor epithelium and has been negatively stained using the diagnostic antibody, or (c) a third tissue that is neither the first tissue nor the second tissue. Consequently, both the first tissue and the second tissue are tumor epithelium.
- the second tissue is considered to be negatively stained if the tissue is not positively stained using the diagnostic antibody.
- the score of the histopathological diagnosis is computed based on the total number of pixels that belong to the first tissue.
- the digital image and the score are displayed on a graphical user interface.
- the convolutional neural network is trained using a generative adversarial network that transforms image patches generated on a stain domain A into fake patches of a stain domain B.
- a stain domain refers to the region of a digital image of tissue that has been stained for a specific biomarker.
- the stain domain A is the tissue or the region of a digital image of a tissue that stains for a specific biomarker or stain such as cytokeratin (CK).
- the stain domain B for example, is the tissue or the region of the digital image of the tissue that stains for a different specific biomarker or stain, such as programmed death ligand 1 (PD-L1).
- the generative adversarial network then transforms image patches generated by CK staining into fake patches that are realistic fakes of PD-L1 staining.
- a generative adversarial network is used to train a convolutional neural network to transform image patches generated on a stain domain A into fake patches of a stain domain B and then to perform segmentation on the stain domain B.
- the generative adversarial network performs segmentation on the fake PD-L1 patches generated using CK staining to make realistic fakes of PD-L1 staining.
- Another embodiment of the method involves training a convolutional neural network using two generative adversarial networks.
- a first of the two generative adversarial networks transforms image patches generated on a stain domain A into fake patches of a stain domain B.
- a second of the two generative adversarial networks transforms image patches generated on the stain domain B into fake patches of the stain domain A.
- the first generative adversarial network transforms image patches generated by CK staining into fake patches that are realistic fakes of PD-L1 staining
- the second generative adversarial network transforms image patches generated using PD-L1 staining into fake patches that are realistic fakes of CK staining.
- the diagnostic system includes code that loads an image patch into a processing unit.
- the image patch is cropped from a digital image of a tissue slice.
- the image was acquired by scanning cancer tissue that was immunohistochemically stained using a diagnostic antibody.
- the system also includes code that processes the image patch using a convolutional neural network to determine whether each pixel of the image patch belongs to (a) a tumor epithelium tissue that has been positively stained using the diagnostic antibody, (b) a tumor epithelium tissue that was negatively stained using the diagnostic antibody, or (c) other tissue.
- the system also includes code for processing multiple image patches cropped from the image so as to compute a score for the histopathological diagnosis based on a total number of pixels determined to belong to the tumor epithelium tissue that was positively stained using the diagnostic antibody.
- the image and the score are then displayed on a graphical user interface of the system.
- the present invention relates to a method of generating a score of a histopathological diagnosis of a cancer patient, comprising:
- the determining how many pixels of the first image patch belong to the first tissue also involves determining how many pixels of the first image patch belong to a second tissue that has been negatively stained by the diagnostic antibody and to a third tissue that is neither the first tissue nor the second tissue.
- the convolutional neural network is trained using generative adversarial learning.
- the convolutional neural network is trained using a generative adversarial network that transforms image patches generated on a stain domain A into fake patches of a stain domain B.
- the convolutional neural network is trained using a generative adversarial network that is trained to transform image patches generated on a stain domain A into fake patches of a stain domain B and then to perform segmentation on the stain domain B.
- the convolutional neural network is trained using two generative adversarial networks, wherein a first of the two generative adversarial networks transforms image patches generated on a stain domain A into fake patches of a stain domain B, and wherein a second of the two generative adversarial networks transforms image patches generated on the stain domain B into fake patches of the stain domain A.
- the convolutional neural network is trained using two generative adversarial networks, wherein a first of the two generative adversarial networks transforms image patches generated on a stain domain A into fake patches of a stain domain B and then performs segmentation on the stain domain B, and wherein a second of the two generative adversarial networks transforms image patches generated on the stain domain B into fake patches of the stain domain A and then performs segmentation on the stain domain A.
- the slice of tissue is taken from a biopsy of lung cancer.
- the diagnostic antibody is taken from the group consisting of: HER2, PD-L1, PD-L2, and CD73.
- the score is a ratio of the total number of pixels that belong to the first tissue to a total number of pixels that belong to either the first tissue or the second tissue.
- the score is a ratio of the total number of pixels that belong to the first tissue to a total number of pixels that belong to a selected tissue type, and wherein the selected tissue type is taken from the group consisting of: the first tissue, the second tissue and the third tissue.
- the diagnostic antibody targets a protein, further comprising: selecting a therapy if the score obtained using the diagnostic antibody is larger than a predetermined threshold, wherein the therapy that is selected uses a therapeutic antibody that binds to the protein targeted by the diagnostic antibody.
- the diagnostic antibody is PD-L1
- the selected therapy uses a PD-L1 medication if the score is larger than the predetermined threshold.
- the first tissue that has been positively stained by the diagnostic antibody includes cells taken from the group consisting of: epithelial cells, endothelial cells, stromal cells, macrophages, T cells and B cells.
- the present invention further relates to a method of generating a score of a histopathological diagnosis of a cancer patient, comprising:
- the slice of tissue is lung tissue.
- the diagnostic antibody is taken from the group consisting of: HER2, PD-L1, PD-L2, and CD73.
- the convolutional neural network is trained using a cycle of two generative adversarial networks that jointly perform domain adaptation and segmentation.
- the score is a ratio of the total number of pixels that belong to the first tissue to a total number of pixels that belong to the second tissue.
- the method further comprises: recommending a therapy for the cancer patient that uses a therapeutic antibody that targets the same protein as that targeted by the diagnostic antibody if the score obtained using the diagnostic antibody is larger than a predetermined threshold.
- the diagnostic antibody is PD-L1
- the therapy uses an anti-PD-Ll drug.
- the present invention further relates to a system that generates a histopathological diagnosis for a cancer patient, comprising:
- the convolutional neural network is trained using a cycle of two generative adversarial networks that jointly perform domain adaptation and segmentation.
- the system recommends a therapy that uses a therapeutic antibody that targets the same protein as that targeted by the diagnostic antibody.
- the diagnostic antibody is PD-L1
- the therapy uses a drug targeting a protein of the group consisting of PD L1, PD-1.
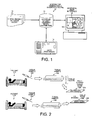
- FIG. 1 shows a system 10 for generating a histopathological score for a cancer patient by computing a score for the histopathological diagnosis based on a total number of pixels determined to belong to tumor epithelial tissue that is positively stained by the diagnostic antibody.
- the histopathological score is the Tumor Cell (TC) score.
- the diagnostic antibody binds to the programmed death ligand 1 (PD-L1), and system 10 calculates a histopathological score for the cancer patient based on the total number of pixels of a digital image that have been determined to belong to tumor epithelium and to have been positively stained using the PD-L1 antibody.
- PD-L1 programmed death ligand 1
- a high concentration of PD-L1 and thus a greater number of pixels determined to belong to tumor epithelium tissue that is positively stained by the PD-L1 antibody in solid tumors is indicative of a positive prognosis for patients treated by a PD-1/PD-L1 checkpoint inhibitor.
- system 10 analyzes digital images 11 to determine the total number of pixels that belong to first tissue that is positively stained using the diagnostic antibody PD-L1 and that is tumor epithelium.
- the first tissue is a specific group of tumor epithelial cells that are positively stained by the diagnostic antibody, in this embodiment by the PD-L1 antibody.
- System 10 also identifies tissue that has been negatively stained by the diagnostic antibody. Tissue is considered to be "negatively stained” if the tissue is not positively stained by the diagnostic antibody.
- the negatively stained tissue is tumor epithelial tissue that has not been positively stained by the PD-L1 antibody.
- the second tissue is a specific group of tumor epithelial cells that is negatively stained by the diagnostic antibody, in this embodiment by the PD-L1 antibody.
- the first and second tissues that are positively and negatively stained by the diagnostic antibody belong to the same group of tumor epithelial cells.
- System 10 also identifies other tissue that belongs to different types of cells than the first and second tissues. The other tissue can be immune cells, necrotic cells, or any other cell type that is not the first or second tissue.
- the histopathological score computed by system 10 is displayed on a graphical user interface 15 of a user work station 16.
- System 10 includes a convolutional neural network used for processing digital images and computing a score for the histopathological diagnosis of a cancer patient.
- the convolutional neural network is trained, wherein the training calculations are performed by a data processor 14.
- data processor 14 is a specialized processor that can simultaneously perform multiple convolution operations between a plurality of pixel matrices and corresponding kernels.
- the logical operations of the model are implemented on data processor 14 as hardware, firmware, software, and/or a combination thereof to provide a means for characterizing regions of tissue in the digital image.
- Each trained model comprising an optimized set of parameters and associated mathematical operations is then stored in the database 13.
- system 10 reliably and precisely determines the total number of pixels that belong to tumor epithelium and that have been positively stained by the diagnostic antibody PD-L1.
- Training the convolutional neural network of system 10 by using a generative adversarial network obviates the need for extensive manual annotations of the digital images 11 that make up the training data set by transferring semi-automatically generated annotations on digital images of tissue stained with the epithelial cell marker CK to the PD-L1 domain.
- the biomarker CK specifically labels tumor epithelium, thereby allowing for a semi-automated segmentation of tumor epithelial regions based on the CK staining.
- the digital images of tissue stained with the epithelial cell marker CK are transformed into the PD-LI domain.
- synthetic or fake images are generated.
- the regions identified as epithelial cells (positive for CK staining) are labeled as being either positive for PD-L1 staining (PD-L1 expressing cells) or negative for PD-L1 staining (non-PD-Ll expressing cells).
- the resulting fake images of tissue stained with PD-L1 antibody that are generated based on the images of tissue stained using CK are then used in conjunction with a reduced number of images with manual annotations to train the convolutional neural network of system 10 to identify positively stained tissue in digital images of tissue stained with the PD-L1 antibody.
- FIG. 2 illustrates tissue samples 18A and 18B being taken from cancer patients 17A and 17B, respectively.
- a tissue slice 19A from tissue sample 18A is placed on a slide 20A and stained with a diagnostic antibody, such as the PD-L1 antibody.
- the tissue slice 19B is placed on the slide 20B and stained with a helper antibody, such as the CK antibody.
- the helper antibody is used only to train system 10, whereas the diagnostic antibody is used to compute the histopathological score in a clinical application of system 10.
- High resolution digital images are acquired from slice 19A and slice 19B of the tissue from cancer patients 17A and 17B.
- the tissue samples 18A and 18B can be taken from a patient suffering from non-small-cell lung cancer, other types of lung cancer, breast cancer, prostate cancer, pancreatic cancer or another type of cancer.
- the tissue sample 18A is taken from a solid tumor.
- the tissue sample has been stained with a PD-L1 antibody, and in yet another embodiment with an HER2 antibody.
- regions comprising normal epithelial cells are excluded from the digital images acquired from slice 19A and slice 19B.
- FIG. 3 shows a digital image acquired from slice 19B of the tissue from cancer patient 17B that has been stained using the CK antibody.
- Epithelial cells 21 are stained positive by the CK stain.
- Non-epithelial region 22 is not stained positively by the CK stain.
- the identification and segmentation of CK-positive epithelial cells and non- CK-positive other tissue is a first substep of the overall task of identifying epithelial cells that are positively stained using PD-L1.
- FIG. 4 shows the digital image of FIG. 3 in which the regions have been identified and segmented.
- the region 21 corresponding to CK-positively stained tissue has been marked with cross hatching and corresponds to tumor epithelium.
- FIG. 5 shows a digital image acquired from slice 19A of the tissue from cancer patient 17A that has been stained for the PD-L1 antibody.
- the digital image has been segmented into regions corresponding to regions 23 of tumor epithelial cells positively stained using the PD-L1 antibody, regions 24 of tumor epithelial cells that are not positively stained by the PD-L1 antibody, and regions 22 of other tissue (e.g., immune cells such as macrophages, necrotic tissue etc.).
- System 10 uses a convolutional neural network to determine for each pixel of the digital image whether that pixel belongs to tumor epithelial tissue positively stained by the PD-L1 antibody and thus belonging to region 23, tissue negatively (non-positively) stained by the PD-L1 antibody and thus belonging to region 24, or other tissue belonging to region 22.
- the score for the histopathological prognosis is calculated by dividing the total number of pixels determined to belong to the tumor epithelial tissue that is positively stained by the diagnostic antibody PD-L1 by the total number of pixels determined to belong both to the tumor epithelial tissue that is positively stained by the diagnostic antibody PD-L1 as well as to the tumor epithelial tissue that is not positively stained by the diagnostic antibody PD-L1 (regions 23 and 24).
- FIG. 6 shows the image of FIG. 5 segmented into the regions 22, 23 and 24.
- the region 23 corresponding to PD-L1-positively stained tumor epithelium is marked with cross hatching.
- the region 24 of tumor epithelium that is not PD-L1-positively stained is marked with horizontal lines.
- the region 22 that is non-epithelial tissue is marked with vertical lines.
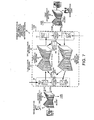
- FIG. 7 illustrates a convolutional neural network 25 used in a clinical application for determining how many pixels of a first image patch belong to a first tissue that has been positively stained by the diagnostic antibody PD-L1 and that belongs to tumor epithelium, and a generative adversarial network 26 used for training the convolutional neural network 25.
- the convolutional neural network 25 acts as a discriminator in the framework of the domain adaptation and semantic segmentation generative adversarial network (DASGAN) 26.
- the DASGAN includes two generative adversarial networks that operate as a cycle forming a CycleGAN 27.
- the tissue slides stained with CK and PD-L1 that are used to train network 25 need not be from tissue of the same patient.
- FIG. 7 illustrates a convolutional neural network 25 used in a clinical application for determining how many pixels of a first image patch belong to a first tissue that has been positively stained by the diagnostic antibody PD-L1 and that belongs to tumor epithelium, and a generative adversarial
- FIG. 2 shows the PD-L1-stained tissue slice 19A coming from patient 17A and the CK-stained tissue slice 19B coming from patient 17B.
- network 25 When network 25 is deployed to generate a score, only the images of tissue slices stained by the diagnostic antibody, such as PD-L1, are used. Images of tissue slices stained by the helper antibody, such as CK, are used only for training the algorithm of the convolutional neural network 25. Network 25 is trained to recognize pixels of a first tissue that is associated with both fake CK positive staining and real PD-L1 positive staining.
- the CycleGAN 27 includes two generative adversarial networks.
- the first of the two generative adversarial networks includes a first generator network 28 and a first discriminator network 25.
- the first generator network 28 transforms image patches generated on CK-stained tissue slices into fake patches of digital images of PD-L1 stained tissue slices.
- the first discriminator network 25 learns to distinguish digital images of real PD-L1 stained tissue slices from the fake images of PD-L1 stained tissue slices generated by the first generator network 28 and segments the PD-L1 positive and the PD-L1 negative regions in the digital images.
- the first generator network 28 transforms image patches generated on the stain domain of CK into fake patches of the stain domain of PD-L1.
- the first discriminator network 25 is used to determine how many pixels of an image patch belong to tumor epithelium tissue that has been positively stained by a diagnostic antibody, for example, by the PD-L1 antibody.
- the second of the two generative adversarial networks includes a second generator network 29 and a second discriminator network 30.
- the second generator network 29 transforms image patches generated on PD-L1-stained tissue slices into fake patches of digital images of CK stained tissue slices.
- the second discriminator network 30 learns to distinguish digital images of real CK-stained tissue slices from the fake images of CK-stained tissue slices generated by the second generator network 29 and segments the CK positive and the CK negative regions in the digital images.
- the second generator network 29 transforms image patches generated on the stain domain of PD-L1 into fake patches of the stain domain of CK.
- the first generator network 28, the second generator network 29, the first discriminator network 25 and the second discriminator network 30 each contain a convolution network and a deconvolution network that perform several layers of convolution and deconvolution steps, respectively.
- the first generator network 28 includes a convolution network 31 and a deconvolution network 32.
- the fake images of PD-L1 stained tissue slices generated by the first generator network 28 together with real images of PD-L1 stained tissue slices are fed into the second generator network 29 that generates fake images of CK stained tissue slices.
- the fake images of CK stained tissue slices generated by the second generator network 29 together with real images of CK stained tissue slices are fed into the first generator network 28 that generates fake images of PD-L1 stained tissue slices.
- network 28 generates first fake images of tumor epithelium positively stained with the PD-L1 antibody as well as second fake images of PD-L1 negatively stained tumor epithelium.
- the CycleGAN 27 also includes cycle consistency losses 33-34.
- the network 28 transforms the fake CK images that have been generated by the network 29 from tissue slices that have been stained with PD-L1 back into the PD-L1 stain domain, thereby creating fake PD-L1 images from the fake CK images.
- the fake PD-L1 images generated by successively applying the generator network 29 and the generator network 28 are also referred to as "cyclic PD-L1" in FIG. 7 .
- the network 29 transforms the fake PD-L1 images that have been generated by the network 28 from tissue slices that have been stained with CK back into the CK stain domain, thereby creating fake CK images from the fake PD-L1 images.
- the fake CK images generated by successively applying the generator network 28 and the generator network 29 are also referred to as "cyclic CK" in FIG. 7 .
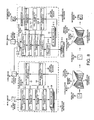
- FIG. 8 illustrates the first generator network 28 and the first discriminator network 25 of FIG. 7 in more detail.
- the first generator network 28 and the first discriminator network 25 form one of the generative adversarial networks of the CycleGAN 27.
- a real image 35 in this example a digital image of a CK-stained tissue slice, is input into the first generator network 28.
- the first generator network 28 includes a series of convolution blocks 36, of a series of residual network (ResNet) blocks 37 and of a series of deconvolution blocks 38.
- First generator network 28 performs several convolution, normalization and activation steps in convolution blocks 36.
- a convolution operation is carried out using a 3X3 operator with a stride of seven giving rise to a pixel patch with sixty-four convolution layers.
- convolution is carried out using a 3x3 operator with a stride of two giving rise to pixels with 128 feature layers.
- convolution is carried out on the 128 feature layers using a 3x3 operator with a stride of two giving rise to pixels with 256 feature layers.
- convolution is carried out on the 256 feature layers using a 3x3 operator with a stride of one giving rise to pixels with 512 feature layers.
- Each convolution step is followed by an instance normalization step and a rectified linear unit (ReLu) activation step.
- step S5 six ResNet blocks 37 are applied before deconvolution commences in deconvolution block 38.
- the operations of the ResNet block 37 enable deep-layered networks to be trained with less computational burden on the network processing by allowing the information flow to bypass selected layers of the network.
- deconvolution is carried out using a 4x4 operator with a stride of two giving rise to pixels with 64 feature layers.
- step S7 deconvolution is carried out using a 4x4 operator with a stride of two giving rise to pixels with 64 feature layers.
- deconvolution block 38 generates a fake image 39 in a different stain domain, in this example in the new domain of PD-L1 staining.
- the first discriminator network 25 is then trained to segment PL-L1 images, whether fake or real, and to classify individual pixels as being stained by PL-L1 by using the fake PD-L1 images 39 generated by generator network 28 along with real PD-L1 images 40.
- the fake image 39 output in step S7 is input into the first discriminator network 25 together with the real image 40 of the same stain domain, for example, a digital image that has been acquired from a tissue slice stained with PD-L1 antibody.
- the first discriminator network 25 can be trained based on the fake PD-L1 images generated by the first generator network 28 and the associated ground-truth masks.
- the fake PD-L1 images generated by the first generator network 28 are then used for training in conjunction with manual annotations on real PD-L1 images acquired from tissue slices stained with PD-L1 antibody.
- the complete DASGAN network 26, consisting of the network 27 (CycleGAN) and of the two SegNet networks 25 (PD-L1 SegNet) and 30 (CK SegNet) are trained simultaneously.
- “simultaneous" training still involves sequential steps on a computer, the individual optimizing steps of training both networks are interwoven.
- the first discriminator network includes a convolution block 41, a ResNet block 42 and a deconvolution block 43.
- convolution block 41 convolution is carried out using a 3x3 operator with a stride of two giving rise to pixels with 64 feature layers.
- convolution is carried out using a 3x3 operator with a stride of two giving rise to pixels with 128 feature layers.
- convolution is carried out using a 3x3 operator with a stride of 2 giving rise to pixels with 256 feature layers.
- Each convolution step is followed by an instance normalization step and a rectified linear unit (ReLu) activation step.
- ReLu rectified linear unit
- step S13 convolution is carried out using a 3x3 operator with a stride of one giving rise to pixels with one feature layer.
- the first discriminator network 25 determines the source of the input data, i.e., whether the image input into the discriminator 25 was a fake image of an PD-L1 staining generated by the generator 28 based on images of CK-stained tissue slices or a real image acquired from a tissue slice stained by PD-L1 antibody.
- step S15 three ResNet blocks 42 are applied to the convoluted image output by convolution block 41 in step S12. Then deconvolution block 43 performs deconvolution operations on the output of the ResNet blocks 42.
- step S16 deconvolution is carried out using a 4x4 operator with a stride of 2 giving rise to pixels with 64 convolution layers.
- step S17 deconvolution is carried out using a 4x4 operator with a stride of two giving rise to pixels with 128 layers.
- step S18 deconvolution is carried out using a 4x4 operator with a stride of two giving rise to pixels with 64 layers.
- the first discriminator network 25 performs segmentation to determine which pixels of the image patch belong to the first tissue that has been identified as positively stained for PD-L1.
- the classification as being positively stained for PD-L1 is performed on a pixel-by-pixel basis.
- the first discriminator network 25 also determines which pixels of the image patch belong to the second tissue that has been identified as not being positively stained (also known as being "negatively stained") for PD-L1.
- the first discriminator network 25 can also determine which pixels of the image patch belong to other tissue that corresponds to a different group of cells or cell type other than the first tissue or the second tissue.
- the first tissue and second tissue can both be epithelial cells, and the other tissue can be immune cells.
- FIG. 9A shows a real digital image 45 of a tissue slice stained with CK, with segmented regions of CK-positive epithelial cells. Because of the specificity of the CK biomarker to epithelium, epithelium regions are segmented on CK stained images using heuristic-based image analysis, for example color deconvolution followed by Otsu thresholding and morphological operations. Any remaining false positive detections are removed by manual annotation.
- the digital image 45 has 256x256 pixels. Epithelial cells are marked with the reference numeral 46, and non-epithelial tissue is marked with the reference numeral 48.
- Segmented images of tissue slices stained with CK are then input into the first generator network 28, which transforms the images of tissue slices stained for CK into synthetic or fake images corresponding to tissue stained with the PD-L1 antibody.
- the first generator network 28 thus performs image-to-image translation.
- FIG. 9B shows a fake or synthetic image 49 of the PD-L1 antibody generated to be PD-L1 positive by the generator 28 from the real image 45 of FIG. 9A , with segmented regions 50 of PD-L1 positive cells generated from the segmented regions 46 of epithelium cells of FIG. 9A . Pixels in the regions of epithelium cells 46 in FIG. 9A are generated to be positively stained by PD-L1 in FIG. 9B , yielding the regions 50 to be classified as positively stained with PD-L1.
- FIG. 9C shows a fake or synthetic image 51 of the PD-L1 antibody generated to be PD-L1 negative by the generator 28 from the real image 45 of FIG. 9A , with segmented regions 52 of PD-L1 negative cells generated from the segmented regions 46 of epithelium cells of FIG. 9A .
- Pixels in the regions of epithelium cells 46 in FIG. 9A are generated to be negatively stained by PD-L1 in FIG. 9C , yielding the regions 52 to be classified as negatively stained with PD-L1.
- Regions of fake image 51 are synthesized as PD-L1 negative using the knowledge of which cells were positively stained with CK in FIG.
- the fake images 49 and 51 have 128x128 pixels each.
- the first generator network 28 performs a "domain adaptation" from the CK stain domain to the PD-L1 stain domain by using segmented input images of CK-stained tissue.
- FIG. 10A shows another example of a real digital image 53 of a tissue slice stained for CK, with segmented regions of CK-positive epithelial cells.
- Real image 53 has smaller regions of contiguous CK-stained epithelial cells than does real image 45 of FIG. 9A .
- Image 53 shows epithelial cells 54 stained positively for CK, and other tissue 48 that is not epithelial cells 54.
- These segmented images of tissue slices stained for CK are then input into the first generator network 28 that transforms the images of tissue slices stained for CK into fake images of tissue slices stained with the PD-L1 antibody.
- FIG. 10B shows a fake or synthetic image 55 of the PD-L1 antibody generated to be PD-L1 positive by the generator 28 from the real image 53 of FIG. 10A , with segmented regions 56 of PD-L1 positive cells generated from the segmented regions 54 of epithelium cells of FIG. 10A . Pixels in the regions of epithelium cells 54 in FIG. 10A are generated to be positively stained by PD-L1 in FIG. 10B , yielding the regions 56 to be classified as positively stained with PD-L1.
- FIG. 10C shows a fake or synthetic image 57 of the PD-L1 antibody generated to be PD-L1 negative by the generator 28 from the real image 53 of FIG.
- segmented regions 58 of PD-L1 negative cells generated from the segmented regions 54 of epithelium cells of FIG. 10A .
- Pixels in the regions of epithelium cells 54 in FIG. 10A are generated to be negatively stained by PD-L1 in FIG. 10B , yielding the regions 57 to be classified as negatively stained with PD-L1.
- the stain used to make the real images operated upon by DASGAN 26 can be an antibody with a dye or a direct stain.
- the antibody can be a polyclonal antibody or a monoclonal antibody and can be directly conjugated with an entity allowing detection of the antibody or can be detected by use of a secondary antibody conjugated with an entity allowing detection of the antibody.
- the first tissue that has been positively stained by the diagnostic antibody includes tumor epithelial cell types. Examples of the diagnostic antibody include PD-L1, human epidermal growth factor receptor 2 (HER2), PD-L2, CTLA4 and CD73 antibodies.
- the scoring is performed on cell types other than the CK positive epithelial cells.
- the CK antibody is replaced by other cell-type-specific antibodies, such as CD20 for B-cells, CD34 for endothelial cells, CD3 for T-cells and CD68 for macrophages.
- fake images of tissue slices stained with the PD-L1 antibody which are generated by the first generator network 28, are input alongside real images of tissue slices stained with the PD-L1 antibody into the first discriminator network 25 at step S8 of FIG. 8 .
- the first discriminator network 25 is trained to distinguish in step S14 the fake images of tissue slices stained with the PD-L1 antibody as generated by the first generator network 28 from the real images of tissue slices stained with the PD-L1 antibody.
- the first discriminator network 25 is also trained to perform segmentation on the PD-L1 images, both fake and real, to identify which pixels of the images belong to PD-L1 positive epithelial cells. Each pixel of the segmented image 44 of FIG.
- the second discriminator network 30 performs the same operations on real and fake images in the CK stain domain.
- the first discriminator network 25 is deployed as a convolutional network to carry out the step of determining how many pixels of a first image patch belong to a first tissue that has been positively stained by the diagnostic antibody and that belongs to tumor epithelium.
- the first tissue corresponds to tumor epithelial cells
- the diagnostic antibody is the PD-L1 antibody.
- the convolutional neural network determines which pixels of the first image patch belong to epithelial cells positively stained by the PD-L1 antibody.
- a score of the histopathological diagnosis of the patient 17 is computed based on the total number of pixels of the image patch that have been determined to belong to a first tissue.
- the score can be the Tumor Cell (TC) score.
- the method involves selecting a therapy if the score obtained using the diagnostic antibody is larger than a predetermined threshold.
- the therapy that is selected uses a therapeutic antibody that binds to the protein targeted by the diagnostic antibody, e.g., to the PD-L1 protein targeted by the diagnostic antibody PD-L1.
- a score of 0.6 is indicative of 60% of the pixels in the image patch belonging to tumor epithelial tissue that has been positively stained by the PD-L1 antibody.
- the score is computed as the percentage of tumor epithelial cells that are PD-L1 positive.
- the score is calculated as the ratio of the total number of pixels that belong to the first tissue (e.g., tumor epithelial cells positively stained by the PD-L1 antibody) in relation to the total number of pixels that belong to the first tissue plus the second tissue (e.g., all tumor epithelial cells, including positively stained by the PD-L1 antibody as well as not positively stained by the PD-L1 antibody).
- a score of 0.6 indicates that 60% of the tumor epithelial cells in the tissue slice from which the digital image was acquired express the PD-L1 protein.
- Evaluation of the score is performed using the predetermined threshold. For example, if the threshold of the score is set to 0.5, the computed score of 0.6 is above the threshold. In that case, a therapy is selected that uses a therapeutic antibody that binds to the protein (e.g., PD-L1) targeted by the diagnostic antibody (PD-L1). In this example, a PD1/PD-L1 check point inhibitor therapy would be selected.
- a therapeutic antibody that binds to the protein e.g., PD-L1 targeted by the diagnostic antibody (PD-L1).
- a PD1/PD-L1 check point inhibitor therapy would be selected.
- the score is calculated as follows: the number of pixels in an image determined as belonging to the first tissue stained positively for the diagnostic antibody and belonging to tumor epithelium (e.g., PD-L1 positive epithelial cells) is 4,648,680. The number of pixels determined to correspond to the second tissue that belongs to tumor epithelium but that is not stained positively by the diagnostic antibody (e.g., PD-L1 negative epithelial cells) is 1,020,158. The Tumor Cell (TC) score is then calculated to be 0.820, which equals 4648680/(4648680+1020158).
- TC Tumor Cell
- the automated analysis of the tumor microenvironment on digital histopathology slides is becoming key for the understanding of the immune response against cancer, supporting the development of novel immuno-therapies.
- the inventors propose a novel deep learning solution to the related problem of tumor epithelial region detection. While most existing deep learning segmentation approaches are trained on time-consuming and costly manual annotation on single stain domain (PD-L1), the inventors leverage here semi-automatically labeled images from a second stain domain (Cytokeratin).
- the inventors introduce an end-to-end trainable model that jointly performs image-to-image translation between the two stain domains while segmenting tumor epithelium.
- Histopathology is key to many clinical decisions taken in oncology, based on the visual quantification of biomarkers on stained slides of suspected tumor tissue.
- TC Tumor Cell
- NSCLC Non Small Cell Lung Cancer
- TC Tumor Cell
- NSCLC Non Small Cell Lung Cancer
- a key challenge is the non-specificity of PD-L1 staining, which includes tumor epithelial regions as well as immune cells and necrotic regions.
- the performance of deep learning approaches for histopathology image analysis leads us towards this field.
- Previous attempts at TC scoring are based on patch-classification and are restricted by their low resolution segmentation output. Moving towards pixelwise semantic segmentation leads to the challenge of generating large, time-consuming and costly datasets of boundary-precise manual annotations of tumor epithelium[12].
- the inventors lower the annotation burden by transferring semi-automatically generated annotations on slides stained with the well-established epithelial marker cytokeratin (CK) ( Fig.
- CK specifically labels tumor epithelium, which makes a semi-automated segmentation of epithelial regions in this domain possible using coarse manual input combined with simple heuristic rules. This enables the generation of large and boundary-precise datasets for semantic segmentation. After transfer to the PD-L1 stain domain, the resulting synthetic CK-based dataset is used for training in conjunction with manual annotations on true PD-L1 images.
- the inventors synthesize fake but realistic looking PD-L1 images from real CK images by exploiting recent advances of generative adversarial networks (GANs) and in particular of image-to-image translation.
- GANs generative adversarial networks
- Unpaired image-to-image translation using CycleGAN makes the transformation of CK stained images into synthetic PD-L1 stained images possible. This enables the use of semi-automatically generated annotations from CK without the need for co-registration between consecutive or restained slides.
- CycleGAN was first introduced for normalization of HE stained images. The inventors present here what is to their knowledge the first application of domain adaptation based semantic segmentation in this field.
- DASGAN Domain Adaptation and Segmentation GAN
- the inventors' main contribution is the extension of the CycleGAN towards an end-to-end trainable network for joint domain adaptation and segmentation. While the proposed network enables merging annotations from any two arbitrary stain domains, the inventors specifically apply it to transfer from the CK stain domain to PD-L1 stain domain with the objective of limiting the burden of manual annotations for epithelium detection.
- the good specificity of CK helps in accurate segmentation of epithelial regions in CK stain domain using heuristic rules, more precisely color deconvolution followed by automatic thresholding and closing morphological operations (cf. Fig. 10D (a) ).
- the following paragraphs detail how these CK-based annotations are leveraged in the PD-L1 stain domain.
- G BA X B ⁇ X A ⁇ and G AB : X A ⁇ X B ⁇ are trained to synthesize samples in domain A (PD-L1) from real samples in domain B (CK) and vice versa.
- Two discriminators D A and D B are trained in opposition to identify synthetic from real samples in the two domains. The necessity of having image pairs for image translation between A and B can be bypassed using a cycle consistent loss cycle .
- auxiliary class GAN AC-GAN
- the inventors extend the Cycle-GAN model to obtain segmentation maps as auxiliary from the two discriminators D A and D B (cf. Fig. 10D (c) ).
- the inventors condition the input images of G AB and G BA with the respective ground truth segmentation class mask by concatenating the mask across the input image channel axis.
- the respective concatenated volumes go through a series of transformations by G AB and G BA to produce synthetic images in the respective target domains B and A.
- the two discriminator networks are extended to predict pixel-wise class probability maps in addition to predicting the correct source of image.
- L seg : L CE y A true y A pred + L CE y B true y B pred
- L CE y true y pred ⁇ ⁇ y true log y pred denotes the categorical cross-entropy loss and where y true and y pred correspond to the ground truth and the predicted label maps respectively.
- the proposed DASGAN model is used to leverage annotations on CK stained images for the segmentation of epithelial regions in PD-L1 stained images.
- the inventors perform three-class pixelwise mask conditioning and transform the tumor epithelial annotations obtained in the CK domain into both a negative and a positive tumor epithelial synthetic example in the PD-L1 domain (cf. Fig. 10D (a) ).
- the inventors After describing the train, test and validation datasets as well as the network architectures, the inventors present results of quantitative evaluation against pathologist manual annotations for the two problems of tumor epithelial segmentation and PD-L1 positive and negative tumor epithelial region detection.
- n 56 CK stained images of NSCLC samples
- n 69 whole slide images of the same indication stained with SP263 PD-L1 clone.
- the samples are exclusively created on tumor center regions delineated by pathologists and regions with non-specific staining are discarded.
- this manual input is typically provided at a macroscopic scale (1x or 2x)
- the associated effort is minimal compared to the annotation of fine epithelium structure at high resolution (20x).
- Positive (TC+) and negative (TC-) tumor epithelium regions were manually delineated at high resolution on PD-L1 images, together with non-epithelium regions (e.g. immune, necrotic, and stromal regions).
- the manually annotated PD-L1 dataset is split between training, test and validation sets on the slide level.
- the validation set was chosen to cover a high variability of different cancer types (adeno, squamous) and growth patterns (acinar, papillary and solid). While the validation dataset used for quantitative evaluation remains unchanged, and in order to study the effect of increasing availability of labeled images and patches for training, three different configurations are reported for the training set: (i) 44K patches from 22 slides, (ii) 103K patches from 49 slides and (iii) 149K patches from 69 slides.
- the test set used for model selection, is constant and consists of 16K patches from 8 PD-L1 stained slides. Patches of 128 x 128 pixels were sampled at a uniform grid from the manually annotated regions on the PD-L1 stained slides and from the detected epithelium regions on the CK stained slides at a 10x magnification (1 ⁇ m/px).
- the architectures of the two generators are similar to that in the original Cycle-GAN with minor modifications: the inventors concatenate the input images and the segmentation mask.
- weights between the prediction of the source distribution and of the semantic segmentation posterior maps are shared in the first three convolutional layers and the branch for semantic segmentation extended to include three resnet blocks and three deconvolutional layers.
- Spectral normalization and self-attention blocks are added in both the discriminators and generators to increase training stability and to model long structural dependencies respectively.
- Network definition, training and inference are performed using the Tensor ow library.
- the inventors first consider the configuration (i) corresponding to a relative shortage of manual annotations.
- the proposed end-to-end trainable DASGAN outperforms the two models trained solely on real/synthetic PD-L1 images as well as the model trained on both real and synthetic PD-L1 images using a two step methodology.
- the proposed DASGAN model systematically out-performs the baseline model trained only on real PD-L1 samples, the relative improvement in accuracy metrics tends to decrease with the availability of manual annotations.
- PD-L1 status which is predictive for survival of NSCLC patients receiving PD1/PD-L1 checkpoint inhibitor therapy, is determined based on the Tumor Cell score, defined as the percentage of tumor epithelial cells that are PD-L1 positive.
- Fig. 13a displays an example of epithelial segmentation output by the proposed DASGAN model.
- the inventors consider a set of 704 PD-L1 stained images unseen for training nor model selection.
- the inventors introduce a novel method to leverage data from two stain domains - CK and PD-L1, and use them in conjunction for the semantic segmentation of tumor epithelium in PD-L1 stained images.
- the proposed DASGAN model which leverages information from the CK stain domain by jointly solving the two sub-problems of semantic segmentation and domain translation, outperforms previous state-of-the-art approaches and enables both the precise segmentation of tumor epithelium regions and the replication of the clinically relevant PD-L1 Tumor Cell (TC) score.
- TC Tumor Cell
- the level of PD-L1 expression in immunohistochemistry (IHC) assays is a key biomarker for the identification of Non-Small-Cell-Lung-Cancer (NSCLC) patients that may respond to anti PD-1/PD-L1 treatments.
- the quantification of PD-L1 expression currently includes the visual estimation of a Tumor Cell (TC) score by a pathologist and consists of evaluating the ratio of PD-L1 positive and PD-L1 negative tumor cells.
- TC Tumor Cell
- the inventors propose a novel deep learning solution that enables the first automated and objective scoring of PD-L1 expression in late stage NSCLC needle biopsies.
- the inventors explore the use of semi-supervised approaches against standard fully supervised methods.
- the inventors consolidate the manual annotations used for training as well the visual TC scores used for quantitative evaluation with multiple pathologists. Concordance measures computed on a set of slides unseen during training provide evidence that the present automatic scoring method matches visual scoring on the considered dataset.
- the programmed death receptor 1 (PD-1) checkpoint protein with its ligand - programmed death ligand 1 (PD-L1) plays a major role in the immune escape of the cancerous tumor cells, i.e. in the inhibition of the human immune system responses. More precisely, the proliferation and activation of T-cells as well as the production of the cytokine signaling proteins are inhibited by the binding of PD-L1 proteins to (i) the PD-1 receptors of activated T-cells and (ii) to the CD80/B7-1 receptors on T-cells and antigen presenting cell. Immunotherapeutic drugs aim at restoring the ability of immune cells to kill tumor cells by blocking this escape pathway.
- Tumor level of PD-L1 is estimated by a trained pathologist on biopsies, often obtained with small needles, stained with a PD-L1 antibody.
- NSCLC non-small cell lung carcinoma
- TC Tumor Cell
- the tumor level of PD-L1 is then compared to a specific cut-off value, which sets the negative or positive PD-L1 status of the patient.
- TC Tumor Cell
- PD-L1 staining is not restricted to the membrane of tumor cells: tumor cells with strong cytoplasmic but no membrane staining, immune cells (e.g. macrophage and lymphocyte) as well as necrotic and stromal regions are not included in the score calculation despite possible PD-L1 staining.
- a challenge specific to visual scoring is moreover the difficulty for any human observer to estimate heterogeneous distribution of cell populations, with positive and negative tumor regions being often spatially inter-mixed.
- the inventors propose an automatic scoring solution based on image analysis which achieves an accuracy similar to visual scoring while ensuring objective and reproducible scores and could potentially be used as a computer aided system to help pathologists make a better decision.
- the complexity of the scene and the difficulty of the task naturally lead us to opt for a deep learning-based solution.
- the proposed TC scoring algorithm consists of two main steps, i) the detection of positive tumor cell regions (TC(+)) and negative tumor cell regions (TC(-)) using a semi-supervised architecture trained on both labeled and unlabeled data and ii) the computation of the TC score as the ratio between the pixel count of TC(+) regions to the pixel count of the complete tumor cell region. Since area-based approaches often show higher performance than count-based quantification and enable an easier annotation workflow, the inventors estimate the TC scores from the pixel counts of PD-L1 positive and negative tumor regions.
- a small subset of slides is selected and partially annotated by two pathologists for positive tumor cells TC(+), negative tumor cells TC(-), positive lymphocytes, negative lymphocytes, macrophages, necrosis and stromal regions.
- a simple detection of the tissue and background regions based on Otsu thresholding32 and morphological filtering is performed, leading to the introduction of another class corresponding to non-tissue regions.
- Labeled image patches are generated on a regular grid defined on the annotated regions that are concordant between the two pathologists. This leads regions with different classes to be discarded from the analysis.
- unlabeled patches are generated on a regular grid defined on the detected tissue.
- AC-GAN Auxiliary Classifier Generative Adversarial Networks
- GANs consist of two neural networks, a generator network (G) and a discriminator network (D).
- the network D classifies an input image as real or fake.
- the discriminator outputs the probability distribution over the sources P S
- X real + E logP S fake
- the discriminator is trained to differentiate whether the image is coming from real image distribution or fake image distribution from G.
- G is trained to produce images which are more and more difficult to be identified by the discriminator as real or fake images.
- the generator creates images so close to the real images that they cannot be differentiated by the discriminator.
- the GAN architecture is, however, strictly unsupervised and generative in nature i.e. it can only be used to generate realistic new samples, leading its current main application in digital pathology to be stain normalization.
- Some recent works in the computer vision community proposed its extension to the AC-GAN variant.
- the AC-GAN leverages the side information on the class labels by two means.
- the generator is conditioned with class labels to perform conditional image generation: the generator network takes as input a noise vector concatenated with the one-hot embedded class labels.
- the discriminator in addition to predicting the correct source probability P(SIX), also performs class label recovery.
- the discriminator contains an auxiliary classifier network which outputs the probability distribution of the class P(CIX).
- the two networks D and G are trained by a minimax game with slight modification.
- the discriminator D is trained to maximize LC + LS and the generator G to minimize LS - LC. Since the maximization and minimization problems are interlaced, the AC-GAN model is trained by alternatively updating the two models G and D.
- the exact AC-GAN architecture used in this work is displayed in Fig. 14 .
- the inventors test the semi-supervised generative AC-GAN architecture against two baseline classification networks for fully-supervised learning and two baseline non-generative networks for semi-supervised learning.
- the two chosen fully-supervised architectures, the inception network v2 and a shallow VGG network modified to be fully-convolutional and to include batch-normalization are commonly employed for the analysis of digital pathology images.
- the two non-generative semi-supervised networks are vanilla auto-encoder networks built on the two aforementioned classification networks.
- the inventors' dataset consists of 270 NSCLC needle biopsy slides from a subset of the clinical trials (NCT01693562) and (NCT02000947).
- the slides are stained with the Ventana PD-L1 (SP263) assay and scanned on an Aperio scanner. Scene resolution is 0:198mm per pixel.
- N score 60 slides, visual TC scoring has been performed on the scanned digital slides by two in-house pathologists. This completes the visual TC scoring on glass-slides obtained from an external source (Ventana Medical System Inc.).
- Patches of size 128 x 128 pixels are extracted on a regular grid of 20 pixel stride defined on the concordant annotated regions and are augmented using 90 degree rotation.
- the inventors sample unlabeled patches on a regular grid of 60 pixel stride defined on the tissue area of the 210 slides which have not been scored by all pathologists as well as on the 15 annotated slides which are used for generating the labeled training database. This yields a total of around 180k labeled and 400k unlabeled patches for training as well as 40k labeled patches for testing. All models are trained using the same patches. Batches with 64 labeled patches are used for training the fully-supervised networks.
- Batches with 32 labeled patches and 32 unlabeled patches are used for training the three semi-supervised networks.
- the reconstruction loss is computed on the complete batch and the classification loss on the labeled patches only.
- the AC-GAN the generative loss is computed on the complete batch and the classification loss on the labeled patches only.
- the inventors select the model weights that maximize the accuracy on the test dataset in order to avoid overfitting on the training set.
- the developed framework is based on the open-source Keras API and Tensorflow framework.
- the prediction is restricted to the detected tissue regions and performed in a sliding window manner with a stride of 32 pixels.
- An example of region detection results is provided in Fig. 15 .
- the inventors predict the different class probabilities and assign each pixel to the class label of the maximum probability.
- the inventors then compute for each slide the consolidated visual score TC ref . as the median of the three visual scores.
- the following concordance measures between the automated TC score and the consolidated visual score is calculated on the set of 40 unseen slides only to ensure an independent estimation of the performance: Lin's concordance coefficient (Lcc), Pearson correlation coefficient (Pcc) and Mean Absolute Error (MAE).
- Lcc Lin's concordance coefficient
- Pcc Pearson correlation coefficient
- MAE Mean Absolute Error
- ⁇ path . 1 6 ⁇ 1 ⁇ i ⁇ 3 i ⁇ j ⁇ 3 TC path i ⁇ TC path j .
- the inventors compare hereby in more detail the performance of the automated score based on the AC-GAN detection to the three visual scores by pathologists. Table 1 reports the same concordance measures as above between all the visual scores and the AC-GAN score. To study the ability of the proposed automated solution to determine the patient status, the inventors additionally compute the Overall Percent Agreement (OPA), Negative Percent Agreement (NPA) and Positive Percent Agreement (PPA) at the 25% cut-off (cf. Table 2). This cut-off value has been shown to optimize the probability of responses to durvalumab in NSCLC.
- OPA Overall Percent Agreement
- NPA Negative Percent Agreement
- PPA Positive Percent Agreement
- the aim of anti-PDLl therapies is to revive the immune response to cancer cells: inhibiting the PD-L1 pathway reverses T-cell exhaustion and restores T cell's cytotoxic activity.
- Patients with high expression generally showing higher response rates and longer progression free survival than patients with low expression, an accurate testing of PD-L1 expression may help take the best treatment decision on whether or not to follow such therapy.
- There is a significant heterogeneity between the existing PD-L1 expression tests different antibodies being employed as companion and complementary diagnostics for different immunotherapeutic drugs, different patterns of staining (tumor cells only or tumor cells and tumor infiltrating immune cells) being considered for different indications (NSCL resp. urothelial carcinoma) and finally different cutoffs being used for different antibodies for a given indication.
- Example 3 further information relating to various aspects of Example 3 is provided.
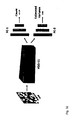
- FIG. 21 shows an overview of the method of generating a Tumor Cell (TC) score of a cancer patient.
- TC Tumor Cell
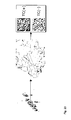
- FIG. 22 shows the variability of region annotation of tumor tissue biopsy slides between two pathologists (pathol, patho2). Partial region annotation (class assignment) of 20 biopsy slides was performed by two pathologists. Seven classes of objects were annotated: positive tumor cells (TC(+)), negative tumor cells (TC(-)), positive lymphocytes (Lymph(+)), negative lymphocytes (Lymph(-)), macrophages (Mac(+)), stroma and necrosis. Additional automatic detection of background class was performed. It was found that inter-pathologist variability with a very high variability (about 20% disagreement) exists. To reduce noise, only concordant annotations are kept. The Veritrova setup and patch generation workflows were adapted.
- FIG. 23 relates to Strongly Supervised Learning. Only annotated images are considered. Success depends on the availability of a large amount of manual annotations.
- TC tumor cell.
- FIG. 24 relates to Semi-Supervised Learning. In contrast to Strongly Supervised Learning, only a few images are annotated. The use of unlabeled images improves the learning of visual features.
- Semi-Supervised Learning involves classification networks, autoencoders and semi-supervised autoencoders.
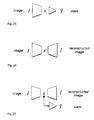
- FIG. 25 relates to classification networks with compression of the input image into a low dimensional representation (feature space), classification network from the low dimensional reduction to the class label, and minimizing the classification error.
- FIG. 26 relates to autoencoders with compression of the input image into a low dimensional representation, decompression back into a "reconstructed input", and minimizing the reconstruction error between the original and the reconstructed inputs.
- FIG. 27 relates to semi-supervised autoencoders with minimizing both the reconstruction error and the classification error.
- FIG. 28 relates to Generative Adversarial Networks (GANs). Artificial but real-looking images are generated.
- the Generator serves to "forge” artificial images from noise.
- the Discriminator serves to "find out” if True or Fake image.
- FIG. 29 shows generated artificial but real-looking PD-L1 images.
- FIG. 30 relates to Auxiliary Classifier GANs (AC-GANs). Real-looking images are generated and class is predicted.
- the Generator serves to "forge” artificial images from noise.
- the Discriminator serves to "find out” if True or Fake image and to predict the class label.
- FIG. 31 relates to Semantic Segmentation Networks. It is taken from Long et al. 2014.
- the network can be adapted for dense prediction by replacing the fully connected layers by convolutional layers.
- the resulting network outputs a coarse classification heatmap, i.e. provides class prediction not only for the center pixel of the image patch but a subset of equally spaced pixels in the image patch.
- Applying the network multiple times and aggregating the resulting coarse heatmap in a "shift and stich" fashion or applying a deconvolution enable the generation of dense classification heatmaps.
- FIG. 32 relates to Regression networks. It is taken from Hernández et al. 2018.
- the network can be adapted for regression instead of classification by replacing the classification layer e.g. by a regression layer at the end of the network. While the classification network enables the identification of the class of the center pixel (resp. of all individual pixels) in the image patch, the regression network is used to directly estimate the number of pixels or the number of cells in the image patch.
- Model Training involves patches with class label, patches without class label and comparing five different networks. Patches with class label are based on 20 partially annotated biopsy images (15 for train, 5 for test), only on samples for which both pathologists agree on the class. There are 8 classes, currently unbalanced. This leads to 187k training patches and 42k testing patches for supervised learning. Patches without class label are based on 210 slides without manual annotations nor TC score by all the three pathologists, the 15 slides with class label which are also used for training the supervised training networks. This leads to 390k patches from unsupervised learning. Comparing five different networks involves Strongly Supervised (LeNet, InceptionV2) and Semi-Supervised (AE-LeNet, AE-InceptionV2, AC-GAN).
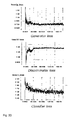
- FIG. 33 shows Generator loss, Discriminator loss and Classifier loss.
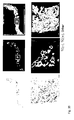
- FIG. 34 and FIG. 35 show examples of region segmentation.
- FIG. 36 relates to inter-pathologist variability.
- the inter-pathologist variability is unknown.
- the inventors analyzed whether TC scores based on image analysis can be distinguished from TC scores by a human pathologist.
- the mean of the TC scores by the three human pathologists is computed and the consolidated TC score is set as the TC score which is the closest to this mean.
- the semi-supervised model AC-GAN was compared with a pathologist. To this end, the AC-GAN model is considered to be a fourth pathologist. To see whether it can be distinguished from the three human pathologists, for each of the four (3+1) pathologists:
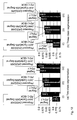
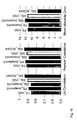
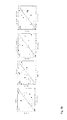
- Lin concordance (LinCC) and Pearson correlation (PearsonCC) are computed. The results are shown in FIG. 40 and FIG. 41 .
- AC-GAN model is as good as a human pathologist with respect to Lin concordance, Pearson correlation, and mean absolute difference.
Landscapes
- Engineering & Computer Science (AREA)
- Health & Medical Sciences (AREA)
- Theoretical Computer Science (AREA)
- Physics & Mathematics (AREA)
- General Health & Medical Sciences (AREA)
- Artificial Intelligence (AREA)
- Evolutionary Computation (AREA)
- General Physics & Mathematics (AREA)
- Medical Informatics (AREA)
- Computer Vision & Pattern Recognition (AREA)
- Life Sciences & Earth Sciences (AREA)
- Multimedia (AREA)
- Computing Systems (AREA)
- Databases & Information Systems (AREA)
- Software Systems (AREA)
- Molecular Biology (AREA)
- Biomedical Technology (AREA)
- Fuzzy Systems (AREA)
- Heart & Thoracic Surgery (AREA)
- Physiology (AREA)
- Psychiatry (AREA)
- Signal Processing (AREA)
- Nuclear Medicine, Radiotherapy & Molecular Imaging (AREA)
- Biophysics (AREA)
- Pathology (AREA)
- Radiology & Medical Imaging (AREA)
- Mathematical Physics (AREA)
- Quality & Reliability (AREA)
- Surgery (AREA)
- Animal Behavior & Ethology (AREA)
- Public Health (AREA)
- Veterinary Medicine (AREA)
- Image Analysis (AREA)
- Investigating Or Analysing Biological Materials (AREA)
Abstract
Description
- The present invention relates to a method for generating a score of a histological diagnosis of a cancer patient by training a model to determine how many pixels of a digital image belong to a tissue that has been positively stained by a diagnostic antibody.
- Identifying tumor regions in digital images of cancer tissue is often a prerequisite to performing diagnostic and treatment measures, such as classifying cancers using standard grading schemes. The digital images of tissue slices used in histopathology are very large. Individual images require gigabytes to store. Manual annotation of the tumor regions in whole slides through the visual assessment of a pathologist is laborious considering the high volume of data. Therefore, "chemical annotation" has been used to substitute the marking of tumor regions by a pathologist with image recognition of regions stained by biomarkers that identify tissue that tends to be cancerous. Annotating tumor regions using specific antibody staining decreases the subjectivity of the pathologist's evaluation and accelerates the otherwise tedious process. Immunohistochemical (IHC) staining can be used to distinguish marker-positive cells that express a particular protein from marker-negative cells that do not express the protein. IHC staining typically involves multiple dyes, which includes one or more dyes connected to protein-specific antibodies and another dye that is a counterstain. A common counterstain is hematoxylin, which labels DNA and thus stains nuclei.
- A protein specific stain or biomarker can be used to identify the regions of the tissue that are likely cancerous. For example, a biomarker that stains epithelial cells can help to identify the suspected tumor regions. Then other protein specific biomarkers are used to characterize the cancerous tissue. The regions stained by a specific biomarker can be identified and quantified and subsequently a score indicating the amount of positively stained tissue and negatively stained tissue can be visually estimated by pathologists. However, visual assessment by pathologists is prone to variability and subjectivity.
- Thus, a computer-based method is sought for generating a repeatable and objective score of a histological diagnosis of a cancer patient, based on a precise estimation of tissue stained by a diagnostic antibody labeling cells that express a specific, cancer-treatment-related protein.
- The disclosed method uses a convolutional neural network model to determine how many pixels of an image patch that is cropped from a digital image of an immunohistochemically stained tissue belong to tissue that has been positively stained by a diagnostic antibody. The tissue that has been positively stained by the diagnostic antibody can be a specific cell, a specific group of cells or a specific type of cells present in the immunohistochemically stained tissue, for example, a macrophage or an epithelial cell or another cell that positively stains for the diagnostic antibody.
- In a first step, a first image patch that is cropped from a digital image of a tissue slice immunohistochemically stained using a diagnostic antibody is loaded into a processing unit. In a second step, the first image patch is processed using a convolutional neural network to determine how many pixels of the first image patch belong to a first tissue that both belongs to tumor epithelium and that has been positively stained using the diagnostic antibody. The pixel-wise analysis of the image patch allows for high spatial resolution and precision in identifying tumor epithelium tissue that is positively stained using the diagnostic antibody. In a third step, additional image patches that have been cropped from the digital image are processed to determine how many pixels of each additional image patch belong to the first tissue. Then, the score of the histopathological diagnosis is computed based on the total number of pixels of the digital image that belong to the first tissue. The digital image and the score are displayed on a graphical user interface. In some embodiments, the score is the Tumor Cell (TC) score.
- Another embodiment of the method includes performing image processing on an image patch using a generative adversarial network (GAN) to train a convolutional neural network to determine how many pixels of the image patch belong to (a) a first tissue that is both tumor epithelium and has been positively stained using a diagnostic antibody, (b) a second tissue that is both tumor epithelium and has been negatively stained using the diagnostic antibody, or (c) a third tissue that is neither the first tissue nor the second tissue. Consequently, both the first tissue and the second tissue are tumor epithelium. In one aspect, the second tissue is considered to be negatively stained if the tissue is not positively stained using the diagnostic antibody. Then, the score of the histopathological diagnosis is computed based on the total number of pixels that belong to the first tissue. The digital image and the score are displayed on a graphical user interface.
- The convolutional neural network is trained using a generative adversarial network that transforms image patches generated on a stain domain A into fake patches of a stain domain B. A stain domain refers to the region of a digital image of tissue that has been stained for a specific biomarker. For example, the stain domain A is the tissue or the region of a digital image of a tissue that stains for a specific biomarker or stain such as cytokeratin (CK). The stain domain B, for example, is the tissue or the region of the digital image of the tissue that stains for a different specific biomarker or stain, such as programmed death ligand 1 (PD-L1). The generative adversarial network then transforms image patches generated by CK staining into fake patches that are realistic fakes of PD-L1 staining.
- In another embodiment, a generative adversarial network is used to train a convolutional neural network to transform image patches generated on a stain domain A into fake patches of a stain domain B and then to perform segmentation on the stain domain B. For example, the generative adversarial network performs segmentation on the fake PD-L1 patches generated using CK staining to make realistic fakes of PD-L1 staining.
- Another embodiment of the method involves training a convolutional neural network using two generative adversarial networks. A first of the two generative adversarial networks transforms image patches generated on a stain domain A into fake patches of a stain domain B. A second of the two generative adversarial networks transforms image patches generated on the stain domain B into fake patches of the stain domain A. For example, the first generative adversarial network transforms image patches generated by CK staining into fake patches that are realistic fakes of PD-L1 staining, and the second generative adversarial network transforms image patches generated using PD-L1 staining into fake patches that are realistic fakes of CK staining.
- Another aspect of the disclosure concerns a system that generates a histopathological diagnosis for a cancer patient. The diagnostic system includes code that loads an image patch into a processing unit. The image patch is cropped from a digital image of a tissue slice. The image was acquired by scanning cancer tissue that was immunohistochemically stained using a diagnostic antibody. The system also includes code that processes the image patch using a convolutional neural network to determine whether each pixel of the image patch belongs to (a) a tumor epithelium tissue that has been positively stained using the diagnostic antibody, (b) a tumor epithelium tissue that was negatively stained using the diagnostic antibody, or (c) other tissue. The system also includes code for processing multiple image patches cropped from the image so as to compute a score for the histopathological diagnosis based on a total number of pixels determined to belong to the tumor epithelium tissue that was positively stained using the diagnostic antibody. The image and the score are then displayed on a graphical user interface of the system.
- Other embodiments and advantages are described in the detailed description below. This summary does not purport to define the invention. The invention is defined by the claims.
- The accompanying drawings, where like numerals indicate like components, illustrate embodiments of the invention.
-
FIG. 1 is a diagram of a novel system for generating a histopathological diagnosis for a cancer patient by computing a sore for the histopathological diagnosis based on a total number of pixels determined to belong to tumor epithelium tissue that has been positively stained by a diagnostic antibody. -
FIG. 2 illustrates the process of acquiring a digital image of a slice of tissue from a cancer patient that is stained with a diagnostic antibody, and the process of acquiring a digital image of a slice of tissue from another cancer patient that is stained with an antibody specific for epithelium. -
FIG. 3 is a digital image showing epithelial cells have been stained with cytokeratin (CK) and nuclei that have been stained with hematoxylin. -
FIG. 4 shows the image ofFIG. 3 in which the regions stained positively by CK are identified and segmented. -
FIG. 5 is a digital image showing tissue that has been stained with a diagnostic antibody that stains PD-L1 and thus identifies regions in which the cells are positively stained epithelium, not-positively stained epithelium and non-epithelial. -
FIG. 6 shows the image ofFIG. 5 with the region that is positively stained tumor epithelium marked with cross hatching, the region that is not not-positively stained tumor epithelium marked with horizontal lines and the region that is non-tumor epithelial tissue marked with vertical lines. -
FIG. 7 illustrates (i) a convolutional neural network used to determine how many pixels of a first image patch belong to a first tissue that both belongs to tumor epithelium and that has been positively stained using a diagnostic antibody, and (ii) a generative adversarial network used to train the convolutional neural network. -
FIG. 8 shows in more detail the network architecture of the generative adversarial network (GAN) used to train the convolutional neural network. -
FIG. 9A is a real image of epithelial tissue with regions that have been positively stained with CK. -
FIG. 9B is a synthetic image representing epithelial tissue positively stained with PD-L1 that was generated from the image ofFIG. 9A by a convolutional neural network trained by a generative adversarial network. -
FIG. 9C is a synthetic image representing epithelial tissue not positively stained with PD-L1 that was generated from the image ofFIG. 9A . -
FIG. 10A is a second real image of epithelial tissue with regions that have been positively stained with CK. -
FIG. 10B is a second fake image representing epithelial tissue positively stained with PD-L1 that was generated from the real image ofFIG. 10A . -
FIG. 10C is another fake image representing epithelial tissue not positively stained with PD-L1 that was generated from the real image ofFIG. 10A . -
FIG. 10D is an overview of the synthetic (a) and real (b) PD-L1 datasets generated from the analysis of CK stained images and manual annotations respectively.FIG. 10D (c) is an overview of the proposed DASGAN model for joint domain adaptation and semantic segmentation. Pixelwise mask conditioning is added to the generators GAB and GBA. The discriminators DA and DB are designed with a U-Net like architecture in order to predict both the source of the image (real/synthetic) and to perform the segmentation task. -
FIG. 11 shows segmentation accuracy on the validation set, for the three baseline models (in gray, blue and yellow) and for the proposed DASGAN model (in orange) under the condition (i) of low availability of manual annotations on real PD-L1 images. F1 scores are reported for each class of interest - tumor epithelium (TC), tumor epithelium positive (TC+), tumor epithelium negative (TC-) and other, together with their average score Avg. in both scenarios of tumor epithelium detection and replication of TC score. -
FIG. 12 shows segmentation accuracy on the validation set (avg. f1-score), for the baseline model trained only on real PD-L1 samples and for the proposed DASGAN model trained on both real and synthetic PD-L1 samples, for increasing availability (i)-(ii)-(iii) of manual annotations on real PD-L1 images. -
FIG. 13 shows (a) an example of negative (red) and positive (blue) tumor epithelial regions as well as of non-epithelial regions (green) segmented by the proposed DASGAN model.FIG. 13(b) shows a bar plot showing mean and standard deviation of the TC scores estimated by the proposed approach on unseen cases (n=704), on the following TC score bins: TC < 1, 1 <= TC < 10, 10n <= TC < 10(n + 1) for 1 < n < 10 and TC = 100. The inverted histogram at the top shows the distribution of cases w.r.t. pathologist TC score. -
FIG. 14 shows the proposed AC-GAN architecture. The noise z and the class one-hot encoding c are concatenated and sent to the generator (G). The generator creates class-conditioned fake images. The classes c and the source information s are jointly predicted by the discriminator (D) given a fake (left) or a real (right) input. SNConv implies convolutional layers using spectral normalization, which introduces a minor modification to the original AC-GAN architecture. -
FIG. 15 shows an example of class probability maps obtained with AC-GAN model. Left: Original images. Right: Predicted probabilities associated to positive tumor cell region TC(+) (red channel), negative tumor cell region (green channel) and to other classes (blue channel) superimposed to the original grayscale layer. The two yellow boxes overlaid to the far left images correspond to the regions of interest displayed on the right. -
FIG. 16 shows concordance measures between the consolidated visual TC score and the TC scores automatically estimated from the tumor regions detected using the different supervised and semi-supervised network architectures: fully-supervised shallow VGG net (FS-VGG), fully-supervised inception net v2 (FS-InceptionV2), semi-supervised VGG net (SSL-VGG), semi-supervised inception net v2 (SSL-InceptionV2), and semi-supervised AC-GAN (SLL-ACGAN). Values are computed on the Ntest cases unseen during training or testing of the networks. -
FIG. 17 shows a pairwise scatter plot between three visual TC scores where each disk represents one of the 60 visually scored slides. For a given case, the size of the disk is proportional to the inter-rater variability Δpath. -
FIG. 18 shows concordance measures between the consolidated visual TC score and the TC scores automatically estimated from the tumor regions detected using the different supervised and semi-supervised network architectures, for increasing maximum levels of inter-rater variability Δpatho on the x-axis. The green curve indicates the percentage of slides for which the inter-rater variability stays below the given level. -
FIG. 19 shows, considering the three visual TC scores and the TC score estimated using the region detected by the AC-GAN network, concordance measures between each TC score and the median of the three remaining TC scores for increasing maximum levels of inter-rater variability Δpath. on the x-axis. The green curve indicates the percentage of slides for which the inter-rater variability stays below the given level. -
FIG. 20 shows, considering the three visual TC scores and the TC score estimated using the region detected by the AC-GAN network, concordance measures between the patient status estimated from each TC score and patient status estimated from the median of the three remaining TC scores for increasing maximum levels of inter-rater variability Δpath. on the x-axis. The green curve indicates the percentage of slides for which the inter-rater variability stays below the given level. -
FIG. 21 shows an overview of the method of generating a Tumor Cell (TC) score of a cancer patient. -
FIG. 22 shows the variability of region annotation of tumor tissue biopsy slides between two pathologists. -
FIG. 23 relates to Strongly Supervised Learning (TC, tumor cell). -
FIG. 24 relates to Semi-Supervised Learning. -
FIG. 25 relates to classification networks. -
FIG. 26 relates to autoencoders. -
FIG. 27 relates to semi-supervised autoencoders. -
FIG. 28 relates to Generative Adversarial Networks (GANs). -
FIG. 29 shows generated artificial but real-looking PD-L1 images. -
FIG. 30 relates to Auxiliary Classifier GANs (AC-GANs). -
FIG. 31 relates to Semantic Segmentation Networks. -
FIG. 32 relates to Regression Networks. -
FIG. 33 shows Generator loss, Discriminator loss and Classifier loss. -
FIG. 34 shows an example of region segmentation. -
FIG. 35 shows another example of region segmentation -
FIG. 36 relates to inter-pathologist variability. -
FIG. 37 shows the results of computing Lin and Pearson correlations for increasing value of allowed inter-pathologist variabilty (Δpatho). -
FIG. 38 shows the Lin and Pearson correlations for Δpatho < 30. -
FIG. 39 shows the results of comparing the semi-supervised model AC-GAN with a pathologist. -
FIG. 40 shows the results of computing Lin concordance (LinCC) and Pearson correlation (PearsonCC) for the three human pathologists and the AC-GAN model. -
FIG. 41 shows the Lin concordances and Pearson correlations. -
FIG. 42 shows the results of computing Overall Percent Agreement (OPA), Negative Percent Agreement (NPA), and Positive Percent Agreement (PPA) for the three human pathologists and the AC-GAN model. -
FIG. 43 shows the Overall Percent Agreement (OPA), Negative Percent Agreement (NPA), and Positive Percent Agreement (PPA). - The present invention relates to a method of generating a score of a histopathological diagnosis of a cancer patient, comprising:
- loading a first image patch into a processing unit, wherein the first image patch is cropped from a digital image of a slice of tissue, and wherein the slice of tissue has been immunohistochemically stained using a diagnostic antibody;
- determining how many pixels of the first image patch belong to a first tissue that has been positively stained by the diagnostic antibody, wherein the determining is performed by processing the first image patch using a convolutional neural network;
- processing additional image patches that have been cropped from the digital image to determine how many pixels of each additional image patch belong to the first tissue;
- computing the score of the histopathological diagnosis based on a total number of pixels that belong to the first tissue; and
- displaying the digital image and the score on a graphical user interface.
- In a preferred embodiment, the determining how many pixels of the first image patch belong to the first tissue also involves determining how many pixels of the first image patch belong to a second tissue that has been negatively stained by the diagnostic antibody and to a third tissue that is neither the first tissue nor the second tissue.
- In a preferred embodiment, the convolutional neural network is trained using generative adversarial learning.
- In a preferred embodiment, the convolutional neural network is trained using a generative adversarial network that transforms image patches generated on a stain domain A into fake patches of a stain domain B.
- In a preferred embodiment, the convolutional neural network is trained using a generative adversarial network that is trained to transform image patches generated on a stain domain A into fake patches of a stain domain B and then to perform segmentation on the stain domain B.
- In a preferred embodiment, the convolutional neural network is trained using two generative adversarial networks, wherein a first of the two generative adversarial networks transforms image patches generated on a stain domain A into fake patches of a stain domain B, and wherein a second of the two generative adversarial networks transforms image patches generated on the stain domain B into fake patches of the stain domain A.
- In a preferred embodiment, the convolutional neural network is trained using two generative adversarial networks, wherein a first of the two generative adversarial networks transforms image patches generated on a stain domain A into fake patches of a stain domain B and then performs segmentation on the stain domain B, and wherein a second of the two generative adversarial networks transforms image patches generated on the stain domain B into fake patches of the stain domain A and then performs segmentation on the stain domain A.
- In a preferred embodiment, the slice of tissue is taken from a biopsy of lung cancer.
- In a preferred embodiment, the diagnostic antibody is taken from the group consisting of: HER2, PD-L1, PD-L2, and CD73.
- In a preferred embodiment, the score is a ratio of the total number of pixels that belong to the first tissue to a total number of pixels that belong to either the first tissue or the second tissue.
- In a preferred embodiment, the score is a ratio of the total number of pixels that belong to the first tissue to a total number of pixels that belong to a selected tissue type, and wherein the selected tissue type is taken from the group consisting of: the first tissue, the second tissue and the third tissue.
- In a preferred embodiment, the diagnostic antibody targets a protein, further comprising:
selecting a therapy if the score obtained using the diagnostic antibody is larger than a predetermined threshold, wherein the therapy that is selected uses a therapeutic antibody that binds to the protein targeted by the diagnostic antibody. - In a preferred embodiment, the diagnostic antibody is PD-L1, and wherein the selected therapy uses a PD-L1 medication if the score is larger than the predetermined threshold.
- In a preferred embodiment, the first tissue that has been positively stained by the diagnostic antibody includes cells taken from the group consisting of: epithelial cells, endothelial cells, stromal cells, macrophages, T cells and B cells.
- The present invention further relates to a method of generating a score of a histopathological diagnosis of a cancer patient, comprising:
- loading an image patch into a processing unit, wherein the image patch is cropped from a digital image of a slice of tissue, and wherein the slice of tissue has been immunohistochemically stained using a diagnostic antibody;
- performing image processing on the image patch using a generative adversarial network to train a convolutional neural network to determine how many pixels of the image patch belong to (a) a first tissue that has been positively stained by the diagnostic antibody, (b) a second tissue that has been negatively stained by the diagnostic antibody, or (c) a third tissue that is neither the first tissue nor the second tissue;
- computing the score of the histopathological diagnosis based on a total number of pixels that belong to the first tissue; and
- displaying the score on a graphical user interface.
- In a preferred embodiment, the slice of tissue is lung tissue.
- In a preferred embodiment, the diagnostic antibody is taken from the group consisting of: HER2, PD-L1, PD-L2, and CD73.
- In a preferred embodiment, the convolutional neural network is trained using a cycle of two generative adversarial networks that jointly perform domain adaptation and segmentation.
- In a preferred embodiment, the score is a ratio of the total number of pixels that belong to the first tissue to a total number of pixels that belong to the second tissue.
- In a preferred embodiment, the method further comprises:
recommending a therapy for the cancer patient that uses a therapeutic antibody that targets the same protein as that targeted by the diagnostic antibody if the score obtained using the diagnostic antibody is larger than a predetermined threshold. - In a preferred embodiment, the diagnostic antibody is PD-L1, and wherein the therapy uses an anti-PD-Ll drug.
- The present invention further relates to a system that generates a histopathological diagnosis for a cancer patient, comprising:
- code for loading an image patch into a processing unit, wherein the image patch is cropped from an image of a tissue slice, and wherein the image was acquired by scanning cancer tissue that was immunohistochemically stained using a diagnostic antibody;
- code for processing the image patch using a convolutional neural network to determine whether each pixel of the image patch belongs to (a) a tissue positively stained by the diagnostic antibody, (b) a tissue negatively stained by the diagnostic antibody, or (c) other tissue;
- code for processing multiple image patches cropped from the image so as to compute a score for the histopathological diagnosis based on a total number of pixels determined to belong to the tissue that is positively stained by the diagnostic antibody; and
- a graphical user interface that displays the image and the score.
- In a preferred embodiment, the convolutional neural network is trained using a cycle of two generative adversarial networks that jointly perform domain adaptation and segmentation.
- In a preferred embodiment, if the score is larger than a predetermined threshold, then the system recommends a therapy that uses a therapeutic antibody that targets the same protein as that targeted by the diagnostic antibody.
- In a preferred embodiment, the diagnostic antibody is PD-L1, and wherein the therapy uses a drug targeting a protein of the group consisting of PD L1, PD-1.
- Reference will now be made in detail to some embodiments of the invention, examples of which are illustrated in the accompanying drawings.
-
FIG. 1 shows asystem 10 for generating a histopathological score for a cancer patient by computing a score for the histopathological diagnosis based on a total number of pixels determined to belong to tumor epithelial tissue that is positively stained by the diagnostic antibody. For example, the histopathological score is the Tumor Cell (TC) score. In one embodiment, the diagnostic antibody binds to the programmed death ligand 1 (PD-L1), andsystem 10 calculates a histopathological score for the cancer patient based on the total number of pixels of a digital image that have been determined to belong to tumor epithelium and to have been positively stained using the PD-L1 antibody. A high concentration of PD-L1 and thus a greater number of pixels determined to belong to tumor epithelium tissue that is positively stained by the PD-L1 antibody in solid tumors is indicative of a positive prognosis for patients treated by a PD-1/PD-L1 checkpoint inhibitor. Thus,system 10 analyzesdigital images 11 to determine the total number of pixels that belong to first tissue that is positively stained using the diagnostic antibody PD-L1 and that is tumor epithelium. The first tissue is a specific group of tumor epithelial cells that are positively stained by the diagnostic antibody, in this embodiment by the PD-L1 antibody. -
System 10 also identifies tissue that has been negatively stained by the diagnostic antibody. Tissue is considered to be "negatively stained" if the tissue is not positively stained by the diagnostic antibody. In this embodiment, the negatively stained tissue is tumor epithelial tissue that has not been positively stained by the PD-L1 antibody. The second tissue is a specific group of tumor epithelial cells that is negatively stained by the diagnostic antibody, in this embodiment by the PD-L1 antibody. In one embodiment, the first and second tissues that are positively and negatively stained by the diagnostic antibody belong to the same group of tumor epithelial cells.System 10 also identifies other tissue that belongs to different types of cells than the first and second tissues. The other tissue can be immune cells, necrotic cells, or any other cell type that is not the first or second tissue. The histopathological score computed bysystem 10 is displayed on a graphical user interface 15 of auser work station 16. -
System 10 includes a convolutional neural network used for processing digital images and computing a score for the histopathological diagnosis of a cancer patient. The convolutional neural network is trained, wherein the training calculations are performed by adata processor 14. In one embodiment,data processor 14 is a specialized processor that can simultaneously perform multiple convolution operations between a plurality of pixel matrices and corresponding kernels. The logical operations of the model are implemented ondata processor 14 as hardware, firmware, software, and/or a combination thereof to provide a means for characterizing regions of tissue in the digital image. Each trained model comprising an optimized set of parameters and associated mathematical operations is then stored in the database 13. - Once trained,
system 10 reliably and precisely determines the total number of pixels that belong to tumor epithelium and that have been positively stained by the diagnostic antibody PD-L1. Training the convolutional neural network ofsystem 10 by using a generative adversarial network obviates the need for extensive manual annotations of thedigital images 11 that make up the training data set by transferring semi-automatically generated annotations on digital images of tissue stained with the epithelial cell marker CK to the PD-L1 domain. The biomarker CK specifically labels tumor epithelium, thereby allowing for a semi-automated segmentation of tumor epithelial regions based on the CK staining. After semantic segmentation, the digital images of tissue stained with the epithelial cell marker CK are transformed into the PD-LI domain. During this step, synthetic or fake images are generated. The regions identified as epithelial cells (positive for CK staining) are labeled as being either positive for PD-L1 staining (PD-L1 expressing cells) or negative for PD-L1 staining (non-PD-Ll expressing cells). The resulting fake images of tissue stained with PD-L1 antibody that are generated based on the images of tissue stained using CK are then used in conjunction with a reduced number of images with manual annotations to train the convolutional neural network ofsystem 10 to identify positively stained tissue in digital images of tissue stained with the PD-L1 antibody. -
FIG. 2 illustratestissue samples cancer patients tissue slice 19A fromtissue sample 18A is placed on aslide 20A and stained with a diagnostic antibody, such as the PD-L1 antibody. Thetissue slice 19B is placed on theslide 20B and stained with a helper antibody, such as the CK antibody. The helper antibody is used only to trainsystem 10, whereas the diagnostic antibody is used to compute the histopathological score in a clinical application ofsystem 10. High resolution digital images are acquired fromslice 19A and slice 19B of the tissue fromcancer patients tissue samples tissue sample 18A is taken from a solid tumor. In another embodiment, the tissue sample has been stained with a PD-L1 antibody, and in yet another embodiment with an HER2 antibody. In one embodiment, regions comprising normal epithelial cells (as opposed to tumor epithelium) are excluded from the digital images acquired fromslice 19A and slice 19B. -
FIG. 3 shows a digital image acquired fromslice 19B of the tissue fromcancer patient 17B that has been stained using the CK antibody.Epithelial cells 21 are stained positive by the CK stain.Non-epithelial region 22 is not stained positively by the CK stain. The identification and segmentation of CK-positive epithelial cells and non- CK-positive other tissue is a first substep of the overall task of identifying epithelial cells that are positively stained using PD-L1. -
FIG. 4 shows the digital image ofFIG. 3 in which the regions have been identified and segmented. Theregion 21 corresponding to CK-positively stained tissue has been marked with cross hatching and corresponds to tumor epithelium. -
FIG. 5 shows a digital image acquired fromslice 19A of the tissue fromcancer patient 17A that has been stained for the PD-L1 antibody. The digital image has been segmented into regions corresponding toregions 23 of tumor epithelial cells positively stained using the PD-L1 antibody,regions 24 of tumor epithelial cells that are not positively stained by the PD-L1 antibody, andregions 22 of other tissue (e.g., immune cells such as macrophages, necrotic tissue etc.).System 10 uses a convolutional neural network to determine for each pixel of the digital image whether that pixel belongs to tumor epithelial tissue positively stained by the PD-L1 antibody and thus belonging toregion 23, tissue negatively (non-positively) stained by the PD-L1 antibody and thus belonging toregion 24, or other tissue belonging toregion 22. The score for the histopathological prognosis is calculated by dividing the total number of pixels determined to belong to the tumor epithelial tissue that is positively stained by the diagnostic antibody PD-L1 by the total number of pixels determined to belong both to the tumor epithelial tissue that is positively stained by the diagnostic antibody PD-L1 as well as to the tumor epithelial tissue that is not positively stained by the diagnostic antibody PD-L1 (regions 23 and 24). -
FIG. 6 shows the image ofFIG. 5 segmented into theregions region 23 corresponding to PD-L1-positively stained tumor epithelium is marked with cross hatching. Theregion 24 of tumor epithelium that is not PD-L1-positively stained is marked with horizontal lines. Theregion 22 that is non-epithelial tissue is marked with vertical lines. -
FIG. 7 illustrates a convolutionalneural network 25 used in a clinical application for determining how many pixels of a first image patch belong to a first tissue that has been positively stained by the diagnostic antibody PD-L1 and that belongs to tumor epithelium, and a generativeadversarial network 26 used for training the convolutionalneural network 25. The convolutionalneural network 25 acts as a discriminator in the framework of the domain adaptation and semantic segmentation generative adversarial network (DASGAN) 26. In one embodiment, the DASGAN includes two generative adversarial networks that operate as a cycle forming aCycleGAN 27. The tissue slides stained with CK and PD-L1 that are used to trainnetwork 25 need not be from tissue of the same patient. Thus,FIG. 2 shows the PD-L1-stainedtissue slice 19A coming frompatient 17A and the CK-stainedtissue slice 19B coming frompatient 17B. Whennetwork 25 is deployed to generate a score, only the images of tissue slices stained by the diagnostic antibody, such as PD-L1, are used. Images of tissue slices stained by the helper antibody, such as CK, are used only for training the algorithm of the convolutionalneural network 25.Network 25 is trained to recognize pixels of a first tissue that is associated with both fake CK positive staining and real PD-L1 positive staining. - The
CycleGAN 27 includes two generative adversarial networks. The first of the two generative adversarial networks includes afirst generator network 28 and afirst discriminator network 25. Thefirst generator network 28 transforms image patches generated on CK-stained tissue slices into fake patches of digital images of PD-L1 stained tissue slices. Thefirst discriminator network 25 learns to distinguish digital images of real PD-L1 stained tissue slices from the fake images of PD-L1 stained tissue slices generated by thefirst generator network 28 and segments the PD-L1 positive and the PD-L1 negative regions in the digital images. Thefirst generator network 28 transforms image patches generated on the stain domain of CK into fake patches of the stain domain of PD-L1. In one embodiment, thefirst discriminator network 25 is used to determine how many pixels of an image patch belong to tumor epithelium tissue that has been positively stained by a diagnostic antibody, for example, by the PD-L1 antibody. - The second of the two generative adversarial networks includes a
second generator network 29 and asecond discriminator network 30. Thesecond generator network 29 transforms image patches generated on PD-L1-stained tissue slices into fake patches of digital images of CK stained tissue slices. Thesecond discriminator network 30 learns to distinguish digital images of real CK-stained tissue slices from the fake images of CK-stained tissue slices generated by thesecond generator network 29 and segments the CK positive and the CK negative regions in the digital images. Thesecond generator network 29 transforms image patches generated on the stain domain of PD-L1 into fake patches of the stain domain of CK. - The
first generator network 28, thesecond generator network 29, thefirst discriminator network 25 and thesecond discriminator network 30 each contain a convolution network and a deconvolution network that perform several layers of convolution and deconvolution steps, respectively. For example, thefirst generator network 28 includes aconvolution network 31 and adeconvolution network 32. - The fake images of PD-L1 stained tissue slices generated by the
first generator network 28 together with real images of PD-L1 stained tissue slices are fed into thesecond generator network 29 that generates fake images of CK stained tissue slices. The fake images of CK stained tissue slices generated by thesecond generator network 29 together with real images of CK stained tissue slices are fed into thefirst generator network 28 that generates fake images of PD-L1 stained tissue slices. For example,network 28 generates first fake images of tumor epithelium positively stained with the PD-L1 antibody as well as second fake images of PD-L1 negatively stained tumor epithelium. - To ensure the invertibility of the transformed domains (e.g., the domain of CK staining and the domain of PD-L1 staining), the
CycleGAN 27 also includes cycle consistency losses 33-34. Thenetwork 28 transforms the fake CK images that have been generated by thenetwork 29 from tissue slices that have been stained with PD-L1 back into the PD-L1 stain domain, thereby creating fake PD-L1 images from the fake CK images. The fake PD-L1 images generated by successively applying thegenerator network 29 and thegenerator network 28 are also referred to as "cyclic PD-L1" inFIG. 7 . Thenetwork 29 transforms the fake PD-L1 images that have been generated by thenetwork 28 from tissue slices that have been stained with CK back into the CK stain domain, thereby creating fake CK images from the fake PD-L1 images. The fake CK images generated by successively applying thegenerator network 28 and thegenerator network 29 are also referred to as "cyclic CK" inFIG. 7 . -
FIG. 8 illustrates thefirst generator network 28 and thefirst discriminator network 25 ofFIG. 7 in more detail. Thefirst generator network 28 and thefirst discriminator network 25 form one of the generative adversarial networks of theCycleGAN 27. Areal image 35, in this example a digital image of a CK-stained tissue slice, is input into thefirst generator network 28. Thefirst generator network 28 includes a series of convolution blocks 36, of a series of residual network (ResNet) blocks 37 and of a series of deconvolution blocks 38.First generator network 28 performs several convolution, normalization and activation steps in convolution blocks 36. In a step S1, a convolution operation is carried out using a 3X3 operator with a stride of seven giving rise to a pixel patch with sixty-four convolution layers. In step S2, convolution is carried out using a 3x3 operator with a stride of two giving rise to pixels with 128 feature layers. In step S3, convolution is carried out on the 128 feature layers using a 3x3 operator with a stride of two giving rise to pixels with 256 feature layers. In step S4, convolution is carried out on the 256 feature layers using a 3x3 operator with a stride of one giving rise to pixels with 512 feature layers. Each convolution step is followed by an instance normalization step and a rectified linear unit (ReLu) activation step. - In step S5, six ResNet blocks 37 are applied before deconvolution commences in
deconvolution block 38. The operations of theResNet block 37 enable deep-layered networks to be trained with less computational burden on the network processing by allowing the information flow to bypass selected layers of the network. In step S6, deconvolution is carried out using a 4x4 operator with a stride of two giving rise to pixels with 64 feature layers. In step S7, deconvolution is carried out using a 4x4 operator with a stride of two giving rise to pixels with 64 feature layers. In step S7,deconvolution block 38 generates afake image 39 in a different stain domain, in this example in the new domain of PD-L1 staining. - The
first discriminator network 25 is then trained to segment PL-L1 images, whether fake or real, and to classify individual pixels as being stained by PL-L1 by using the fake PD-L1 images 39 generated bygenerator network 28 along with real PD-L1 images 40. In step S8, thefake image 39 output in step S7 is input into thefirst discriminator network 25 together with thereal image 40 of the same stain domain, for example, a digital image that has been acquired from a tissue slice stained with PD-L1 antibody. For example, thefirst discriminator network 25 can be trained based on the fake PD-L1 images generated by thefirst generator network 28 and the associated ground-truth masks. The fake PD-L1 images generated by thefirst generator network 28 are then used for training in conjunction with manual annotations on real PD-L1 images acquired from tissue slices stained with PD-L1 antibody. In one embodiment, thecomplete DASGAN network 26, consisting of the network 27 (CycleGAN) and of the two SegNet networks 25 (PD-L1 SegNet) and 30 (CK SegNet) are trained simultaneously. Although "simultaneous" training still involves sequential steps on a computer, the individual optimizing steps of training both networks are interwoven. - The first discriminator network includes a
convolution block 41, aResNet block 42 and adeconvolution block 43. Several convolution, normalization and activation steps are performed in theconvolution block 41. In step S9, convolution is carried out using a 3x3 operator with a stride of two giving rise to pixels with 64 feature layers. In step S10, convolution is carried out using a 3x3 operator with a stride of two giving rise to pixels with 128 feature layers. In step S11, convolution is carried out using a 3x3 operator with a stride of 2 giving rise to pixels with 256 feature layers. Each convolution step is followed by an instance normalization step and a rectified linear unit (ReLu) activation step. In step S13, convolution is carried out using a 3x3 operator with a stride of one giving rise to pixels with one feature layer. In step S14, thefirst discriminator network 25 determines the source of the input data, i.e., whether the image input into thediscriminator 25 was a fake image of an PD-L1 staining generated by thegenerator 28 based on images of CK-stained tissue slices or a real image acquired from a tissue slice stained by PD-L1 antibody. - In step S15, three
ResNet blocks 42 are applied to the convoluted image output byconvolution block 41 in step S12. Thendeconvolution block 43 performs deconvolution operations on the output of the ResNet blocks 42. In step S16, deconvolution is carried out using a 4x4 operator with a stride of 2 giving rise to pixels with 64 convolution layers. In step S17, deconvolution is carried out using a 4x4 operator with a stride of two giving rise to pixels with 128 layers. In step S18, deconvolution is carried out using a 4x4 operator with a stride of two giving rise to pixels with 64 layers. In step S19, thefirst discriminator network 25 performs segmentation to determine which pixels of the image patch belong to the first tissue that has been identified as positively stained for PD-L1. The classification as being positively stained for PD-L1 is performed on a pixel-by-pixel basis. Thefirst discriminator network 25 also determines which pixels of the image patch belong to the second tissue that has been identified as not being positively stained (also known as being "negatively stained") for PD-L1. Thefirst discriminator network 25 can also determine which pixels of the image patch belong to other tissue that corresponds to a different group of cells or cell type other than the first tissue or the second tissue. For example, the first tissue and second tissue can both be epithelial cells, and the other tissue can be immune cells. -
FIG. 9A shows a realdigital image 45 of a tissue slice stained with CK, with segmented regions of CK-positive epithelial cells. Because of the specificity of the CK biomarker to epithelium, epithelium regions are segmented on CK stained images using heuristic-based image analysis, for example color deconvolution followed by Otsu thresholding and morphological operations. Any remaining false positive detections are removed by manual annotation. In one example, thedigital image 45 has 256x256 pixels. Epithelial cells are marked with thereference numeral 46, and non-epithelial tissue is marked with thereference numeral 48. Segmented images of tissue slices stained with CK are then input into thefirst generator network 28, which transforms the images of tissue slices stained for CK into synthetic or fake images corresponding to tissue stained with the PD-L1 antibody. Thefirst generator network 28 thus performs image-to-image translation. -
FIG. 9B shows a fake orsynthetic image 49 of the PD-L1 antibody generated to be PD-L1 positive by thegenerator 28 from thereal image 45 ofFIG. 9A , withsegmented regions 50 of PD-L1 positive cells generated from thesegmented regions 46 of epithelium cells ofFIG. 9A . Pixels in the regions ofepithelium cells 46 inFIG. 9A are generated to be positively stained by PD-L1 inFIG. 9B , yielding theregions 50 to be classified as positively stained with PD-L1. -
FIG. 9C shows a fake orsynthetic image 51 of the PD-L1 antibody generated to be PD-L1 negative by thegenerator 28 from thereal image 45 ofFIG. 9A , withsegmented regions 52 of PD-L1 negative cells generated from thesegmented regions 46 of epithelium cells ofFIG. 9A . Pixels in the regions ofepithelium cells 46 inFIG. 9A are generated to be negatively stained by PD-L1 inFIG. 9C , yielding theregions 52 to be classified as negatively stained with PD-L1. Regions offake image 51 are synthesized as PD-L1 negative using the knowledge of which cells were positively stained with CK inFIG. 9A combined with the trained deep learning knowledge of how the CK staining would correspond to negative PD-L1 staining. Thefake images first generator network 28 performs a "domain adaptation" from the CK stain domain to the PD-L1 stain domain by using segmented input images of CK-stained tissue. -
FIG. 10A shows another example of a realdigital image 53 of a tissue slice stained for CK, with segmented regions of CK-positive epithelial cells.Real image 53 has smaller regions of contiguous CK-stained epithelial cells than doesreal image 45 ofFIG. 9A .Image 53 showsepithelial cells 54 stained positively for CK, andother tissue 48 that is notepithelial cells 54. These segmented images of tissue slices stained for CK are then input into thefirst generator network 28 that transforms the images of tissue slices stained for CK into fake images of tissue slices stained with the PD-L1 antibody. -
FIG. 10B shows a fake orsynthetic image 55 of the PD-L1 antibody generated to be PD-L1 positive by thegenerator 28 from thereal image 53 ofFIG. 10A , withsegmented regions 56 of PD-L1 positive cells generated from thesegmented regions 54 of epithelium cells ofFIG. 10A . Pixels in the regions ofepithelium cells 54 inFIG. 10A are generated to be positively stained by PD-L1 inFIG. 10B , yielding theregions 56 to be classified as positively stained with PD-L1.FIG. 10C shows a fake orsynthetic image 57 of the PD-L1 antibody generated to be PD-L1 negative by thegenerator 28 from thereal image 53 ofFIG. 10A , withsegmented regions 58 of PD-L1 negative cells generated from thesegmented regions 54 of epithelium cells ofFIG. 10A . Pixels in the regions ofepithelium cells 54 inFIG. 10A are generated to be negatively stained by PD-L1 inFIG. 10B , yielding theregions 57 to be classified as negatively stained with PD-L1. - The stain used to make the real images operated upon by DASGAN 26 can be an antibody with a dye or a direct stain. The antibody can be a polyclonal antibody or a monoclonal antibody and can be directly conjugated with an entity allowing detection of the antibody or can be detected by use of a secondary antibody conjugated with an entity allowing detection of the antibody. The first tissue that has been positively stained by the diagnostic antibody includes tumor epithelial cell types. Examples of the diagnostic antibody include PD-L1, human epidermal growth factor receptor 2 (HER2), PD-L2, CTLA4 and CD73 antibodies. In other embodiments, the scoring is performed on cell types other than the CK positive epithelial cells. In those applications, the CK antibody is replaced by other cell-type-specific antibodies, such as CD20 for B-cells, CD34 for endothelial cells, CD3 for T-cells and CD68 for macrophages.
- In order to train the
first discriminator network 25, fake images of tissue slices stained with the PD-L1 antibody, which are generated by thefirst generator network 28, are input alongside real images of tissue slices stained with the PD-L1 antibody into thefirst discriminator network 25 at step S8 ofFIG. 8 . Thefirst discriminator network 25 is trained to distinguish in step S14 the fake images of tissue slices stained with the PD-L1 antibody as generated by thefirst generator network 28 from the real images of tissue slices stained with the PD-L1 antibody. Thefirst discriminator network 25 is also trained to perform segmentation on the PD-L1 images, both fake and real, to identify which pixels of the images belong to PD-L1 positive epithelial cells. Each pixel of thesegmented image 44 ofFIG. 8 is classified as belonging to a PD-L1 positively stained epithelial cell (the first tissue), an epithelial cell that is not positively stained by PD-L1, or other non-epithelial tissue. Segmentation maps are thus obtained as an output of thefirst discriminator network 25 in addition to the determination of whether an image is real or fake. Thesecond discriminator network 30 performs the same operations on real and fake images in the CK stain domain. - In one embodiment, the
first discriminator network 25 is deployed as a convolutional network to carry out the step of determining how many pixels of a first image patch belong to a first tissue that has been positively stained by the diagnostic antibody and that belongs to tumor epithelium. For example, the first tissue corresponds to tumor epithelial cells, and the diagnostic antibody is the PD-L1 antibody. In this case, the convolutional neural network determines which pixels of the first image patch belong to epithelial cells positively stained by the PD-L1 antibody. - Subsequently, a score of the histopathological diagnosis of the patient 17 is computed based on the total number of pixels of the image patch that have been determined to belong to a first tissue. For example, the score can be the Tumor Cell (TC) score. In one embodiment, the method involves selecting a therapy if the score obtained using the diagnostic antibody is larger than a predetermined threshold. The therapy that is selected uses a therapeutic antibody that binds to the protein targeted by the diagnostic antibody, e.g., to the PD-L1 protein targeted by the diagnostic antibody PD-L1.
- For example, if a score of 0.6 is computed, this is indicative of 60% of the pixels in the image patch belonging to tumor epithelial tissue that has been positively stained by the PD-L1 antibody. The score is computed as the percentage of tumor epithelial cells that are PD-L1 positive. The score is calculated as the ratio of the total number of pixels that belong to the first tissue (e.g., tumor epithelial cells positively stained by the PD-L1 antibody) in relation to the total number of pixels that belong to the first tissue plus the second tissue (e.g., all tumor epithelial cells, including positively stained by the PD-L1 antibody as well as not positively stained by the PD-L1 antibody). In other words, a score of 0.6 indicates that 60% of the tumor epithelial cells in the tissue slice from which the digital image was acquired express the PD-L1 protein.
- Evaluation of the score is performed using the predetermined threshold. For example, if the threshold of the score is set to 0.5, the computed score of 0.6 is above the threshold. In that case, a therapy is selected that uses a therapeutic antibody that binds to the protein (e.g., PD-L1) targeted by the diagnostic antibody (PD-L1). In this example, a PD1/PD-L1 check point inhibitor therapy would be selected.
- In one example, the score is calculated as follows: the number of pixels in an image determined as belonging to the first tissue stained positively for the diagnostic antibody and belonging to tumor epithelium (e.g., PD-L1 positive epithelial cells) is 4,648,680. The number of pixels determined to correspond to the second tissue that belongs to tumor epithelium but that is not stained positively by the diagnostic antibody (e.g., PD-L1 negative epithelial cells) is 1,020,158. The Tumor Cell (TC) score is then calculated to be 0.820, which equals 4648680/(4648680+1020158).
- Although the present invention has been described in connection with certain specific embodiments for instructional purposes, the present invention is not limited thereto. Various modifications, adaptations, and combinations of various features of the described embodiments can be practiced without departing from the scope of the invention as set forth in the claims.
- DASGAN - Joint Domain Adaptation and Segmentation for the Analysis of Epithelial Regions in Histopathology PD-L1 Images
- The automated analysis of the tumor microenvironment on digital histopathology slides is becoming key for the understanding of the immune response against cancer, supporting the development of novel immuno-therapies. The inventors propose a novel deep learning solution to the related problem of tumor epithelial region detection. While most existing deep learning segmentation approaches are trained on time-consuming and costly manual annotation on single stain domain (PD-L1), the inventors leverage here semi-automatically labeled images from a second stain domain (Cytokeratin). The inventors introduce an end-to-end trainable model that jointly performs image-to-image translation between the two stain domains while segmenting tumor epithelium. Extending the method to differentiate between the PD-L1 positive and negative tumor epithelium regions enables the automated estimation of the PD-L1 Tumor Cell (TC) score. Quantitative experimental results demonstrate the accuracy of the inventors' approach against state-of-the-art segmentation methods.
- Histopathology is key to many clinical decisions taken in oncology, based on the visual quantification of biomarkers on stained slides of suspected tumor tissue. In a clinical setting, the PD-L1 Tumor Cell (TC) score for Non Small Cell Lung Cancer (NSCLC) is for instance predictive of response for patients treated with an anti-PD1/PD-L1 checkpoint inhibitor therapy. In a more exploratory setting, several studies have shown the importance of tumor immune contexture and of epithelial immune cell infiltration as measures of patient prognosis.
While different from the PD-L1 scoring setting, these applications also depend on the precise estimation of the tumor epithelial compartment. These common problems lead us to introduce a novel method for the automatic and precise segmentation of epithelium in histopathology images. - As illustrated in
Fig. 10D (b) , a key challenge is the non-specificity of PD-L1 staining, which includes tumor epithelial regions as well as immune cells and necrotic regions. The performance of deep learning approaches for histopathology image analysis leads us towards this field. Previous attempts at TC scoring are based on patch-classification and are restricted by their low resolution segmentation output. Moving towards pixelwise semantic segmentation leads to the challenge of generating large, time-consuming and costly datasets of boundary-precise manual annotations of tumor epithelium[12]. Here, the inventors lower the annotation burden by transferring semi-automatically generated annotations on slides stained with the well-established epithelial marker cytokeratin (CK) (Fig. 10D (a) ) to the PD-L1 stain domain. CK specifically labels tumor epithelium, which makes a semi-automated segmentation of epithelial regions in this domain possible using coarse manual input combined with simple heuristic rules. This enables the generation of large and boundary-precise datasets for semantic segmentation. After transfer to the PD-L1 stain domain, the resulting synthetic CK-based dataset is used for training in conjunction with manual annotations on true PD-L1 images. - The inventors synthesize fake but realistic looking PD-L1 images from real CK images by exploiting recent advances of generative adversarial networks (GANs) and in particular of image-to-image translation. Unpaired image-to-image translation using CycleGAN makes the transformation of CK stained images into synthetic PD-L1 stained images possible. This enables the use of semi-automatically generated annotations from CK without the need for co-registration between consecutive or restained slides. In pathology image analysis, CycleGAN was first introduced for normalization of HE stained images. The inventors present here what is to their knowledge the first application of domain adaptation based semantic segmentation in this field. Other studies recently described similar ideas for medical image analysis, in particular to convert CT images into synthetic MRI data and train a semantic segmentation model on both real and synthetic MRI images. However, while these prior approaches follow a two-step methodology, the inventors introduce here an end-to-end trainable network (cf.
Fig. 10D (c) ) named DASGAN (Domain Adaptation and Segmentation GAN) that jointly performs image-to-image translation and semantic segmentation. The inventors show superiority of the proposed DASGAN model compared to (i) models trained on manual annotations on real PD-L1 images only and (ii) models trained separately for domain adaptation and for semantic segmentation. - The inventors' main contribution is the extension of the CycleGAN towards an end-to-end trainable network for joint domain adaptation and segmentation. While the proposed network enables merging annotations from any two arbitrary stain domains, the inventors specifically apply it to transfer from the CK stain domain to PD-L1 stain domain with the objective of limiting the burden of manual annotations for
epithelium detection. The good specificity of CK helps in accurate segmentation of epithelial regions in CK stain domain using heuristic rules, more precisely color deconvolution followed by automatic thresholding and closing morphological operations (cf.Fig. 10D (a) ). The following paragraphs detail how these CK-based annotations are leveraged in the PD-L1 stain domain. -

 cycle . The parameters of the discriminator and generator networks are learned in an adversarial manner following a min-max game:


- To avoid mode collapse and enable invertability of the translated domains, a cycle consistency loss is defined by re-translating the synthesized samples


- Following the auxiliary class GAN (AC-GAN) model, the inventors extend the Cycle-GAN model to obtain segmentation maps as auxiliary from the two discriminators DA and DB (cf.
Fig. 10D (c) ). The inventors condition the input images of GAB and GBA with the respective ground truth segmentation class mask by concatenating the mask across the input image channel axis. The respective concatenated volumes go through a series of transformations by GAB and GBA to produce synthetic images in the respective target domains B and A. The two discriminator networks are extended to predict pixel-wise class probability maps in addition to predicting the correct source of image. To this end, and to propagate the class specific information through to the generator, a segmentation loss is introduced to the discriminator in addition to the original adversarial loss:



Fig. 10D (a) ). - After describing the train, test and validation datasets as well as the network architectures, the inventors present results of quantitative evaluation against pathologist manual annotations for the two problems of tumor epithelial segmentation and PD-L1 positive and negative tumor epithelial region detection.
- The training dataset consists of n = 56 CK stained images of NSCLC samples and of n = 69 whole slide images of the same indication stained with SP263 PD-L1 clone. To ensure purity of the samples generated on the CK stained slides, the samples are exclusively created on tumor center regions delineated by pathologists and regions with non-specific staining are discarded. Note that, because this manual input is typically provided at a macroscopic scale (1x or 2x), the associated effort is minimal compared to the annotation of fine epithelium structure at high resolution (20x). Positive (TC+) and negative (TC-) tumor epithelium regions were manually delineated at high resolution on PD-L1 images, together with non-epithelium regions (e.g. immune, necrotic, and stromal regions).
- The manually annotated PD-L1 dataset is split between training, test and validation sets on the slide level. The validation set consists of n = 106 fields of view (500 x 500 µm) densely annotated by pathologists and taken from 25 PD-L1 stained whole slide images. The validation set was chosen to cover a high variability of different cancer types (adeno, squamous) and growth patterns (acinar, papillary and solid). While the validation dataset used for quantitative evaluation remains unchanged, and in order to study the effect of increasing availability of labeled images and patches for training, three different configurations are reported for the training set: (i) 44K patches from 22 slides, (ii) 103K patches from 49 slides and (iii) 149K patches from 69 slides. The test set, used for model selection, is constant and consists of 16K patches from 8 PD-L1 stained slides.
Patches of 128 x 128 pixels were sampled at a uniform grid from the manually annotated regions on the PD-L1 stained slides and from the detected epithelium regions on the CK stained slides at a 10x magnification (1 µm/px). - The architectures of the two generators are similar to that in the original Cycle-GAN with minor modifications: the inventors concatenate the input images and the segmentation mask. For the two discriminators, weights between the prediction of the source distribution and of the semantic segmentation posterior maps are shared in the first three convolutional layers and the branch for semantic segmentation extended to include three resnet blocks and three deconvolutional layers. Spectral normalization and self-attention blocks are added in both the discriminators and generators to increase training stability and to model long structural dependencies respectively. Network definition, training and inference are performed using the Tensor ow library. All models are trained on a single Nvidia V100 GPU with 32GB of memory and Adam optimization performed for both the generators (lr=1e-4, beta1=0.5) and the discriminators (lr=5e-4, beta1=0.5) for 150k iterations. The model is picked based on the best segmentation f1-score on the test set.
- The inventors first consider the configuration (i) corresponding to a relative shortage of manual annotations. As illustrated in
Fig. 11 , the proposed end-to-end trainable DASGAN outperforms the two models trained solely on real/synthetic PD-L1 images as well as the model trained on both real and synthetic PD-L1 images using a two step methodology. Mean f1 scores of f1 = 0.886/0.850 are achieved with the proposed DASGAN approach on the binary problem of tumor epithelium detection and on the three class problem of positive and negative tumor epithelial regions respectively. The inventors note that, in their scenario, adding synthetic PD-L1 samples from the CK stained images improves the segmentation accuracy if and only if domain adaptation and semantic segmentation are jointly trained: the two-step methodology does not yield higher accuracy values (f1 = 0.805/0.804) compared to training only on real PD-L1 manual annotations (f1 = 0.807/0.805). As shown inFig. 12 , while the proposed DASGAN model systematically out-performs the baseline model trained only on real PD-L1 samples, the relative improvement in accuracy metrics tends to decrease with the availability of manual annotations. In the configuration (iii) of highest availability, accuracy metrics of f1 = (0.894/0.890) and f1 = (0.916/0.899) are reached by the baseline model trained only on real PD-L1 samples and by the present approach respectively. This quantitatively confirms the expectation that the use of synthetic data is most relevant in case of relative shortage of manually labeled data. - PD-L1 status, which is predictive for survival of NSCLC patients receiving PD1/PD-L1 checkpoint inhibitor therapy, is determined based on the Tumor Cell score, defined as the percentage of tumor epithelial cells that are PD-L1 positive. The TC score is approximated as the relative area of the detected TC(+) regions:

-
Fig. 13a displays an example of epithelial segmentation output by the proposed DASGAN model. To quantitatively assess the clinical relevance of the proposed approach, the inventors consider a set of 704 PD-L1 stained images unseen for training nor model selection.Fig. 13b shows the bar plot of mean and standard deviation of the estimated TCCNN scores against the true TC scores visually estimated by pathologists. Lin's concordance coefficient of Lcc = 0.93, Pearson correlation coefficient of Pcc = 0.94 and mean absolute error of MAE = 7.30 are reported between the estimated and the true TC score values, showing the high concordance of the proposed method with pathologist scoring. - The inventors introduce a novel method to leverage data from two stain domains - CK and PD-L1, and use them in conjunction for the semantic segmentation of tumor epithelium in PD-L1 stained images. The possibility to semi-automatically generate large amount of boundary precise annotation in CK stained images, which is enabled by the specificity of this stain to epithelium regions, coupled with the possibility to translate CK stained images into fake but realistic-looking images PD-L1 stained images, which is enabled by the recent advances in the field of unpaired image translation, yields the possible generation of semi-automatically generated dataset for training in the PD-L1 stain domain. As shown experimentally, the proposed DASGAN model, which leverages information from the CK stain domain by jointly solving the two sub-problems of semantic segmentation and domain translation, outperforms previous state-of-the-art approaches and enables both the precise segmentation of
tumor epithelium regions and the replication of the clinically relevant PD-L1 Tumor Cell (TC) score. Upon confirmation that the presented results can match survival predictive ability of manual scoring and replication of the findings in a prospective trial, the inventors envision that the proposed method could be used in a clinical setting to identify patients which may benefit from an anti-PD1/PD-L1 therapy. More generally, the inventors believe that the novelty of the proposed DASGAN model for joint domain adaptation and segmentation makes it of interest to the medical image analysis community beyond the analysis of PD-L1 stained histopathology images. - The level of PD-L1 expression in immunohistochemistry (IHC) assays is a key biomarker for the identification of Non-Small-Cell-Lung-Cancer (NSCLC) patients that may respond to anti PD-1/PD-L1 treatments. The quantification of PD-L1 expression currently includes the visual estimation of a Tumor Cell (TC) score by a pathologist and consists of evaluating the ratio of PD-L1 positive and PD-L1 negative tumor cells. Known challenges like differences in positivity estimation around clinically relevant cut-offs and sub-optimal quality of samples makes visual scoring tedious and subjective, yielding a scoring variability between pathologists. In this work, the inventors propose a novel deep learning solution that enables the first automated and objective scoring of PD-L1 expression in late stage NSCLC needle biopsies. To account for the low amount of tissue available in biopsy images and to restrict the amount of manual annotations necessary for training, the inventors explore the use of semi-supervised approaches against standard fully supervised methods. The inventors consolidate the manual annotations used for training as well the visual TC scores used for quantitative evaluation with multiple pathologists. Concordance measures computed on a set of slides unseen during training provide evidence that the present automatic scoring method matches visual scoring on the considered dataset.
- The programmed death receptor 1 (PD-1) checkpoint protein with its ligand - programmed death ligand 1 (PD-L1) plays a major role in the immune escape of the cancerous tumor cells, i.e. in the inhibition of the human immune system responses. More precisely, the proliferation and activation of T-cells as well as the production of the cytokine signaling proteins are inhibited by the binding of PD-L1 proteins to (i) the PD-1 receptors of activated T-cells and (ii) to the CD80/B7-1 receptors on T-cells and antigen presenting cell. Immunotherapeutic drugs aim at restoring the ability of immune cells to kill tumor cells by blocking this escape pathway. The role of complementary or companion diagnostics assays is, in this context, to help the identification of patients which are likely to benefit from a checkpoint inhibitor therapy, i.e. patients with high tumor levels of PD-L1. Tumor level of PD-L1 is estimated by a trained pathologist on biopsies, often obtained with small needles, stained with a PD-L1 antibody. For non-small cell lung carcinoma (NSCLC), which accounts for 85% of all lung cancer related deaths, the Tumor Cell (TC) score is defined as the frequency of PD-L1 expressing tumor cells, i.e. of tumor cells with specifically stained membrane. The tumor level of PD-L1 is then compared to a specific cut-off value, which sets the negative or positive PD-L1 status of the patient.
- There are known challenges to an accurate estimation of the Tumor Cell (TC) score. First, PD-L1 staining is not restricted to the membrane of tumor cells: tumor cells with strong cytoplasmic but no membrane staining, immune cells (e.g. macrophage and lymphocyte) as well as necrotic and stromal regions are not included in the score calculation despite possible PD-L1 staining. A challenge specific to visual scoring is moreover the difficulty for any human observer to estimate heterogeneous distribution of cell populations, with positive and negative tumor regions being often spatially inter-mixed. These challenges make TC scoring a subject to some variability among pathologists. In this work, the inventors propose an automatic scoring solution based on image analysis which achieves an accuracy similar to visual scoring while ensuring objective and reproducible scores and could potentially be used as a computer aided system to help pathologists make a better decision. The complexity of the scene and the difficulty of the task naturally lead us to opt for a deep learning-based solution.
- Previous works have shown the ability of deep learning-based methods to solve complex tasks in general image analysis and understanding field as well as in the more specific field of digital pathology image analysis. As a first example, it was shown in a pioneering study the potential of deep learning for the detection of prostate cancer regions and of breast cancer metastasis in lymph nodes on digital images of H&E stained slides. More specially, two fully supervised convolutional neural networks (CNN) were independently trained on the complete manual annotations of 200 and 170 tissue slides respectively. Further, a similar fully supervised CNN-based approach for the detection of invasive breast cancer region in H&E stained slides was proposed, relying on the annotations of nearly 400 slides from multiple different sites for training. Most previous works in the field of digital pathology image analysis build on fully supervised networks, which are trained only on labeled information obtained through very extensive manual annotations. Collecting the necessary amount of annotations is however a well-known problem in this field. This is because images with the level of complexity observed in digital pathology can and should only be interpreted by experts with several years of training and experience. This is a key difference to other fields of application of deep learning methods, for instance in robotics, for which the complexity arises more from the number and diversity of the classes than on the ability of untrained humans to recognize these classes. Because pathologists can disagree on the interpretation of a given slide, it is often necessary to collect manual annotations of the same slide from different pathologists. While being often necessary in order to reduce ambiguity in the training set, annotating the same slide multiple times significantly increases the burden of manual annotation.
- To bypass the need of manual annotation for region segmentation or object detection, some recent works proposed to directly infer the patient label. A long short term memory (LSTM) network to directly predict patient outcome on tissue microarrays was introduced. A multiple instance learning (MIL) solution to predict prostate cancer diagnosis on needle biopsies was developed, the training of the system requiring a huge dataset of more than 12000 slides. The use of needle biopsies and the small size of datasets available in clinical trial studies make however the use of the aforementioned weakly supervised learning approaches challenging in the present scenario.
- As previously shown for the Her2 scoring of breast cancer slides, scores do not have to be learned and can be accurately replicated using the heuristic definition given in the scoring guidelines and an intermediate detection step. To keep the intermediate detection step while reducing the amount of manual annotation, the inventors propose a semi-supervised learning solution. These approaches still employ manual annotations but make use of raw unlabeled data to lower the necessary amount of labeled data. Only a few previous works have used semi-supervised learning for digital pathology image analysis. Recently, a cluster-then-label method based on support vector machine classifier that is shown to outperform classical supervised classifiers was introduced. Further, an image query approach based on semi-supervised manifold learning was proposed. Other works focus on transfer learning where the model weights are initialized on other classification task or learned on raw unlabeled data using representation learning, the labeled data being then used for model refinement only. Given the recent advances in the field of generative adversarial networks (GAN), the inventors' work build on class auxiliary generative adversarial networks (AC-GANs). To the best of the inventors' knowledge, this study introduces the first application of AC-GAN networks for digital pathology image analysis as well as the first computer-aided diagnostic tool for PD-L1 scoring on needle biopsies.
- The proposed TC scoring algorithm consists of two main steps, i) the detection of positive tumor cell regions (TC(+)) and negative tumor cell regions (TC(-)) using a semi-supervised architecture trained on both labeled and unlabeled data and ii) the computation of the TC score as the ratio between the pixel count of TC(+) regions to the pixel count of the complete tumor cell region. Since area-based approaches often show higher performance than count-based quantification and enable an easier annotation workflow, the inventors estimate the TC scores from the pixel counts of PD-L1 positive and negative tumor regions.
- A small subset of slides is selected and partially annotated by two pathologists for positive tumor cells TC(+), negative tumor cells TC(-), positive lymphocytes, negative lymphocytes, macrophages, necrosis and stromal regions. A simple detection of the tissue and background regions based on Otsu thresholding32 and morphological filtering is performed, leading to the introduction of another class corresponding to non-tissue regions. Labeled image patches are generated on a regular grid defined on the annotated regions that are concordant between the two pathologists. This leads regions with different classes to be discarded from the analysis. On the remaining set of non-annotated slides, unlabeled patches are generated on a regular grid defined on the detected tissue.
- It is first recalled the principle and architecture of Generative Adversarial Networks. GANs consist of two neural networks, a generator network (G) and a discriminator network (D). The network G transforms a noise vector z, which is sampled from a simple distribution such as an uniform or normal distribution, into an fake image Xfake = G(z) using a series of deconvolution and activation layers. The network D classifies an input image as real or fake. More formally, the discriminator outputs the probability distribution over the sources


- The two networks are trained in opposition following a minimax game34 formally defined as follows:

- More intuitively, the discriminator is trained to differentiate whether the image is coming from real image distribution or fake image distribution from G. In the opposition, G is trained to produce images which are more and more difficult to be identified by the discriminator as real or fake images. When the optimum of this minimax game is reached, the generator creates images so close to the real images that they cannot be differentiated by the discriminator.
- The GAN architecture is, however, strictly unsupervised and generative in nature i.e. it can only be used to generate realistic new samples, leading its current main application in digital pathology to be stain normalization. Some recent works in the computer vision community proposed its extension to the AC-GAN variant. The AC-GAN leverages the side information on the class labels by two means. First, the generator is conditioned with class labels to perform conditional image generation: the generator network takes as input a noise vector concatenated with the one-hot embedded class labels. The concatenated vector goes through a series of transformations by a CNN to create fake images Xfake = G(c; z). Second, the discriminator, in addition to predicting the correct source probability P(SIX), also performs class label recovery. The discriminator contains an auxiliary classifier network which outputs the probability distribution of the class P(CIX).
- The network parameters between the auxiliary classifier and the discriminator are shared, which enables joint learning of P(CIX) and P(SIX). This requires the introduction of a second cost function as the log-likelihood of the correct class:

- Similar to the vanilla GAN formulation, the two networks D and G are trained by a minimax game with slight modification. The discriminator D is trained to maximize LC + LS and the generator G to minimize LS - LC. Since the maximization and minimization problems are interlaced, the AC-GAN model is trained by alternatively updating the two models G and D. The exact AC-GAN architecture used in this work is displayed in
Fig. 14 . - In the inventors' application, the inventors are only interested in the classification performance of the network. While the inventors investigate the discriminator performance in more detail, further quantitative assessment of generator has not been performed. Some qualitative examples of images produced by the generator are however displayed in
Fig. 14 . - The inventors test the semi-supervised generative AC-GAN architecture against two baseline classification networks for fully-supervised learning and two baseline non-generative networks for semi-supervised learning. The two chosen fully-supervised architectures, the inception network v2 and a shallow VGG network modified to be fully-convolutional and to include batch-normalization are commonly employed for the analysis of digital pathology images. The two non-generative semi-supervised networks are vanilla auto-encoder networks built on the two aforementioned classification networks.
- The inventors' dataset consists of 270 NSCLC needle biopsy slides from a subset of the clinical trials (NCT01693562) and (NCT02000947). The slides are stained with the Ventana PD-L1 (SP263) assay and scanned on an Aperio scanner. Scene resolution is 0:198mm per pixel. On a subset of Nscore = 60 slides, visual TC scoring has been performed on the scanned digital slides by two in-house pathologists. This completes the visual TC scoring on glass-slides obtained from an external source (Ventana Medical System Inc.). A smaller subset Ncnn = 20 is selected across the range of TC scores for training and testing the supervised part of the region detection model and have as such been partially manually annotated by the two in-house pathologists using an in-house annotation software. More specifically, 15 slides are used for training and 5 slides for testing and optimizing the model parameters. The accuracy of the resulting automated TC score is estimated against the three visual TC scores on the remaining Ntest = 40 unseen slides, i.e. unused for training or testing the supervised nor the unsupervised part of the region detection model.
- Patches of size 128 x 128 pixels are extracted on a regular grid of 20 pixel stride defined on the concordant annotated regions and are augmented using 90 degree rotation. The inventors sample unlabeled patches on a regular grid of 60 pixel stride defined on the tissue area of the 210 slides which have not been scored by all pathologists as well as on the 15 annotated slides which are used for generating the labeled training database. This yields a total of around 180k labeled and 400k unlabeled patches for training as well as 40k labeled patches for testing. All models are trained using the same patches. Batches with 64 labeled patches are used for training the fully-supervised networks. Batches with 32 labeled patches and 32 unlabeled patches are used for training the three semi-supervised networks. For the two non-generative semi-supervised networks, the reconstruction loss is computed on the complete batch and the classification loss on the labeled patches only. For the AC-GAN, the generative loss is computed on the complete batch and the classification loss on the labeled patches only. Training of the four baseline networks and of the generator and discriminator of the AC-GAN network is performed for 100k and 200k iterations respectively using the Adam optimizer with the following learning parameters: lr = 0.0001, beta1 = 0.5, beta2 = 0.999. For each network, the inventors select the model weights that maximize the accuracy on the test dataset in order to avoid overfitting on the training set. The developed framework is based on the open-source Keras API and Tensorflow framework.
- The prediction is restricted to the detected tissue regions and performed in a sliding window manner with a stride of 32 pixels. An example of region detection results is provided in
Fig. 15 . On each of the Nscore = 60 slides for which the three visual TC scores are available, the inventors predict the different class probabilities and assign each pixel to the class label of the maximum probability. Given the resulting TC(+) and TC(-) pixels in a given slide, the inventors approximate the corresponding TC score as the ratio of the number of tumor positive cell pixels to the total number of tumor cell pixels:
- The inventors then compute for each slide the consolidated visual score TCref. as the median of the three visual scores. The following concordance measures between the automated TC score and the consolidated visual score is calculated on the set of 40 unseen slides only to ensure an independent estimation of the performance: Lin's concordance coefficient (Lcc), Pearson correlation coefficient (Pcc) and Mean Absolute Error (MAE). As reported in
Fig. 16 , the AC-GAN achieves on all measures a higher level of agreement to the visual scores (Lcc = 0.94, Pcc = 0.95, MSE = 8.03) than any other fully-supervised and semi-supervised network. - To quantify the variability between the visual scores (cf.
Fig. 17 ), the inventors additionally estimate for each slide the inter-rater variability Δpath. as the mean absolute pairwise difference between the associated visual scores:
- The very high concordance of PD-L1 scoring on glass slides and digital slides has recently been confirmed, leading the inventors to pool of all data to estimate inter-rater variability independently of a glass/digital scoring. Given increasing maximum levels of inter-rater variability, the inventors restrict the computation of the aforementioned concordance measures to the slides whose associated value stays below the given maximum. As displayed in
Fig. 18 , the automated TC scores become more concordant to the consolidated visual scores the more concordant the visual scores are. A Lin's concordance coefficient of 0.96 is for example reached on the TC scores obtained with the AC-GAN architecture on cases for which the inter-rater variability is smaller than 40%. The better performance of the semi-supervised generative AC-GAN network over the other networks is consistent across highly-concordant and low-concordant cases. - The inventors compare hereby in more detail the performance of the automated score based on the AC-GAN detection to the three visual scores by pathologists. Table 1 reports the same concordance measures as above between all the visual scores and the AC-GAN score. To study the ability of the proposed automated solution to determine the patient status, the inventors additionally compute the Overall Percent Agreement (OPA), Negative Percent Agreement (NPA) and Positive Percent Agreement (PPA) at the 25% cut-off (cf. Table 2). This cut-off value has been shown to optimize the probability of responses to durvalumab in NSCLC.
- The TC score computed from the AC-GAN predicted regions yields for all but one case to the highest correlation and the lowest absolute error. Note that in the only case where this does not hold, the Pearson correlation of the automated score TCcnn = 89 is very close to the highest value TC1 = 0.90. Computing the concordance to the visual scores TC3 estimated on the microscope, the inventors note that the automated TC scores leads to a higher agreement (Lcc=0.88, Pcc=0.89, MAE=11.3) than the two pathologist scores estimated on digital slides (TC1:Lcc=0.81, Pcc=0.82, MAE=13.2) - (TC2:Lcc=0.79, Pcc=0.82, MAE=16.6). These observations are confirmed on the reported OPA values of the low/high PD-L1 status at 25% cut-off. The automated scoring systematically yields the highest agreement with the visual TC score. In particular, considering the third visual TC scoring, automated scoring achieves an OPA of 0.88 to be compared with OPAs of 0.88 and 0.80 observed for the first and second pathologists visually scoring on digital slides.
- To further analyze the concordance of automated scoring versus visual scoring, the inventors consider the AC-GAN score and the three visual scores independently of their source and compute for each of the four resulting scores all concordance measures between each score and the median of the three remaining scores. Results displayed in Table 3 and
Fig. 19 provide further evidence of the good performance of the automated TC score. In all measures, the automated TC scores systematically outperform the visual scores.Table 1. Pairwise Lin's concordance / Pearson correlation coefficients and Mean Absolute Error (Lcc/Pcc/MAE) between all visual TC scores and estimated TC score based on AC-GAN. The star indicates for each concordance measure the TC score yielding the best performance, i.e. the maximum value for Lcc and Pcc and the minimum value for the MAE. Values are computed on the Ntest cases unseen during training or testing of the AC-GAN model. TC 1 TC 2 TC 3 TCcnn Lcc Pcc MAE Lcc Pcc MAE Lcc Pcc MAE Lcc Pcc MAE TC 1 - - - 0.84* 0.90* 15.3 0.81 0.82 13.2 0.95* 0.95* 7.4* TC 2 0.84 0.90 15.3 - - - 0.79 0.82 16.6 0.84 0.89 15.0 TC 3 0.81 0.82 13.2 0.79 0.82 16.6 - - - 0.88 0.89 11.3 TCcnn 0.95* 0.95* 7.4* 0.84* 0.89 15.0* 0.88* 0.89* 11.3* - - - Table 2. Pairwise Overall, Negative and Positive Percent Agreement (OPA/NPA/PPA) at the 25% cut-off between all visual TC scores and estimated TC score based on AC-GAN. The star indicates for each concordance measure the TC score yielding the best performance, i.e. the maximum value. TC 1 TC 2 TC 3 TCcnn OPA NPA PPA OPA NPA PPA OPA NPA PPA OPA SPA PPA TC 1 - - - 0.78 0.62 1.00 0.88* 0.88 0.88* 0.90* 0.88 0.94* TC1 0.78 1.00* 0.65 - - - 0.80 1.00* 0.69 0.83 1.00* 0.73 TC 3 0.88 0.91 0.83 0.80 0.65 1.00 - - - 0.88 0.87 0.89 TCcnn 0.90* 0.95 0.84* 0.83* 0.68* 1.00* 0.88* 0.91 0.84 - - - - Values are computed on the Ntest cases unseen during training or testing of the AC-GAN model.
Table 3. Concordance measures between the visual and automated TC scores against the median of the other scores on the Ntest cases unseen during training or testing of the AC-GAN model. - TC 1 TC 2 TC 3 TCcnn Lin/Pearson/MAE 0.83/0.94/9.14 0.85/0.40/14.65 0.85/0.85/ 11.73 0.94/0.95/8.00 OPA/NPA/PPA 0.85/0.95/0.76 0.78/0.63/1.0 0.85/0.90/0.80 0.88/0.90/0.85 - The aim of anti-PDLl therapies is to revive the immune response to cancer cells: inhibiting the PD-L1 pathway reverses T-cell exhaustion and restores T cell's cytotoxic activity. Patients with high expression generally showing higher response rates and longer progression free survival than patients with low expression, an accurate testing of PD-L1 expression may help take the best treatment decision on whether or not to follow such therapy. There is a significant heterogeneity between the existing PD-L1 expression tests, different antibodies being employed as companion and complementary diagnostics for different immunotherapeutic drugs, different patterns of staining (tumor cells only or tumor cells and tumor infiltrating immune cells) being considered for different indications (NSCL resp. urothelial carcinoma) and finally different cutoffs being used for different antibodies for a given indication.
- While the focus of this work is only to replicate the test corresponding to the antibody clone SP263 on NSCLC patients, the inventors present what is to the inventors' knowledge the first proof of concept study showing that deep learning enables an accurate and automated estimation of the PD-L1 expression level and PD-L1 status on biopsies samples. The performed analysis of inter-rater variability suggests that the accuracy achieved by the proposed automated scoring method is concordant with visual scoring by pathologists on the present dataset. This work focuses on the automated estimation of the PD-L1 TC score yet, it more generally introduces the first application of deep semi-supervised and generative learning networks (AC-GAN) in the field of digital pathology. It also provides first evidence of the good performance of this model against standard fully supervised learning networks.
- Going beyond the presented proof of concept, the inventors believe that further evidence could be provided by increasing the size of the unseen dataset on which the agreement of the automated and visual TC scores has been computed as well as ensuring that the comparison between the visual scores is not biased by external parameters such as (i) the heterogeneous experience of the pathologists and (ii) if the scoring is performed on digital or glass slides. The presented work also opens the way for PD-L1 scoring in bladder cancer which involves the scoring of both tumor cells and immune cell regions and for which the reliability among pathologists is extremely weak8. In general, the inventors envision that the success of checkpoint inhibitor related immune therapies can be increased by automated profiling of tumor and immune cells with respect to their cluster of differentiation (CD) protein expression levels. This study on CD274 (PD-L1) in NSCLC is the first conclusive step in this journey.
- In the following, further information relating to various aspects of Example 3 is provided.
-
FIG. 21 shows an overview of the method of generating a Tumor Cell (TC) score of a cancer patient. -
FIG. 22 shows the variability of region annotation of tumor tissue biopsy slides between two pathologists (pathol, patho2). Partial region annotation (class assignment) of 20 biopsy slides was performed by two pathologists. Seven classes of objects were annotated: positive tumor cells (TC(+)), negative tumor cells (TC(-)), positive lymphocytes (Lymph(+)), negative lymphocytes (Lymph(-)), macrophages (Mac(+)), stroma and necrosis. Additional automatic detection of background class was performed. It was found that inter-pathologist variability with a very high variability (about 20% disagreement) exists. To reduce noise, only concordant annotations are kept. The Veritrova setup and patch generation workflows were adapted. -
FIG. 23 relates to Strongly Supervised Learning. Only annotated images are considered. Success depends on the availability of a large amount of manual annotations. TC, tumor cell. -
FIG. 24 relates to Semi-Supervised Learning. In contrast to Strongly Supervised Learning, only a few images are annotated. The use of unlabeled images improves the learning of visual features. - Semi-Supervised Learning involves classification networks, autoencoders and semi-supervised autoencoders.
-
FIG. 25 relates to classification networks with compression of the input image into a low dimensional representation (feature space), classification network from the low dimensional reduction to the class label, and minimizing the classification error. -
FIG. 26 relates to autoencoders with compression of the input image into a low dimensional representation, decompression back into a "reconstructed input", and minimizing the reconstruction error between the original and the reconstructed inputs. -
FIG. 27 relates to semi-supervised autoencoders with minimizing both the reconstruction error and the classification error. -
FIG. 28 relates to Generative Adversarial Networks (GANs). Artificial but real-looking images are generated. The Generator serves to "forge" artificial images from noise. The Discriminator serves to "find out" if True or Fake image. -
FIG. 29 shows generated artificial but real-looking PD-L1 images. -
FIG. 30 relates to Auxiliary Classifier GANs (AC-GANs). Real-looking images are generated and class is predicted. The Generator serves to "forge" artificial images from noise. The Discriminator serves to "find out" if True or Fake image and to predict the class label. - Regarding region segmentation, fully convolutional networks for semantic segmentation are described in Long et al. 2014, learning deconvolution networks for semantic segmentation are described in Noh et al. 2015, and the use of deep learning for segmentation and counting within microscopy data is described in Hernández et al. 2018.
-
FIG. 31 relates to Semantic Segmentation Networks. It is taken from Long et al. 2014. The network can be adapted for dense prediction by replacing the fully connected layers by convolutional layers. The resulting network outputs a coarse classification heatmap, i.e. provides class prediction not only for the center pixel of the image patch but a subset of equally spaced pixels in the image patch. Applying the network multiple times and aggregating the resulting coarse heatmap in a "shift and stich" fashion or applying a deconvolution enable the generation of dense classification heatmaps. -
FIG. 32 relates to Regression networks. It is taken from Hernández et al. 2018. The network can be adapted for regression instead of classification by replacing the classification layer e.g. by a regression layer at the end of the network. While the classification network enables the identification of the class of the center pixel (resp. of all individual pixels) in the image patch, the regression network is used to directly estimate the number of pixels or the number of cells in the image patch. - Model Training involves patches with class label, patches without class label and comparing five different networks. Patches with class label are based on 20 partially annotated biopsy images (15 for train, 5 for test), only on samples for which both pathologists agree on the class. There are 8 classes, currently unbalanced. This leads to 187k training patches and 42k testing patches for supervised learning. Patches without class label are based on 210 slides without manual annotations nor TC score by all the three pathologists, the 15 slides with class label which are also used for training the supervised training networks. This leads to 390k patches from unsupervised learning. Comparing five different networks involves Strongly Supervised (LeNet, InceptionV2) and Semi-Supervised (AE-LeNet, AE-InceptionV2, AC-GAN).
-
FIG. 33 shows Generator loss, Discriminator loss and Classifier loss. -
FIG. 34 andFIG. 35 show examples of region segmentation. -
FIG. 36 relates to inter-pathologist variability. In case of a TC score by a single pathologist, the inter-pathologist variability is unknown. In case of TC scores by three pathologists, there is an additional scoring by two pathologists. This enable the estimation of inter-pathologist variability. The inventors analyzed whether TC scores based on image analysis can be distinguished from TC scores by a human pathologist. To estimate inter-pathologist variability, the mean divergence between TC scores by two pathologists was computed as follows:
- For a consolidated pathologist, the mean of the TC scores by the three human pathologists is computed and the consolidated TC score is set as the TC score which is the closest to this mean.
- For choosing the best model, Lin and Pearson correlations for increasing value of allowed inter-pathologist variabilty (Δpatho) was computed. The results are shown in
FIG. 37 andFIG. 38 . It was found that the semi-supervised model AC-GAN systematically yields the best accuracy. - The semi-supervised model AC-GAN was compared with a pathologist. To this end, the AC-GAN model is considered to be a fourth pathologist. To see whether it can be distinguished from the three human pathologists, for each of the four (3+1) pathologists:
- (1) the TC scores by the current pathologist is discarded,
- (2) for each patient, the mean of the TC scores by the three remaining pathologists is computed,
- (3) the consolidated TC score is set as the TC score which is the closest to this mean, and
- (4) OPA, NPA, PPA, LinCC, between the current TC scores and the consolidated TC scores are computed.
- Lin concordance (LinCC) and Pearson correlation (PearsonCC) are computed. The results are shown in
FIG. 40 andFIG. 41 . - It was found that the AC-GAN model is as good as a human pathologist with respect to Lin concordance, Pearson correlation, and mean absolute difference.
- Overall Percent Agreement (OPA), Negative Percent Agreement (NPA), and Positive Percent Agreement (PPA) are computed at 25% cut-off. The results are shown in
FIG. 42 andFIG. 43 . It was found that the AC-GAN model is as good as a human pathologist with respect to OPA, NPA, PPA at 25% cut-off. - Further disclosed are methods and systems as defined by the following clauses:
- 1. A method of generating a score of a histopathological diagnosis of a cancer patient, comprising:
- loading a first image patch into a graphical processing unit (GPU), wherein the first image patch is cropped from a digital image of a slice of tissue, wherein the first image patch has a center, and wherein the slice of tissue has been immunohistochemically stained using a diagnostic antibody;
- determining whether the center of the first image patch belongs to (a) a cancer cell that has been positively stained by the diagnostic antibody, (b) a cancer cell that has been negatively stained by the diagnostic antibody, or (c) other tissue, by processing the first image patch using a convolutional neural network;
- processing other image patches that have been cropped from the digital image to determine whether the center of each of the other image patches belongs to (a) a cancer cell that has been positively stained by the diagnostic antibody, (b) a cancer cell that has been negatively stained by the diagnostic antibody, or (c) other tissue;
- computing the score of the histopathological diagnosis based on the number of image patches having a positively stained cancer cell at the center and the number of image patches having a negatively stained cancer cell at the center; and
- displaying the digital image and the score on a graphical user interface.
- 2. The method of
clause 1, wherein the slice of tissue is taken from a biopsy of lung cancer. - 3. The method of
clause 1 orclause 2, wherein the diagnostic antibody is taken from the group consisting of: anti-HER2, anti-PDLl, anti-PD-L2, and anti-CD73. - 4. The method of any of
clauses 1 to 3, wherein the convolutional neural network is trained using a semi-supervised method based on auxiliary classifier generative adversarial networks (AC-GANs). - 5. The method of any of
clauses 1 to 4, wherein the score is a ratio of image patches having a positively stained cancer cell at the center to image patches having a positively or negatively stained cancer cell at the center. - 6. The method of any of
clauses 1 to 5, further comprising:
displaying a recommended therapy that uses a therapeutic antibody targeting the same protein as the diagnostic antibody if the score obtained using the diagnostic antibody is larger than a predetermined threshold. - 7. The method of
clause 6, wherein the score is a ratio of image patches having a positively stained cancer cell at the center to image patches having a positively or negatively stained cancer cell at the center, wherein the diagnostic antibody is PD-L1, and wherein the recommended therapy uses IMFINZI (anti-PD-Ll drug by MedI/AZ) if the score is 0.25 or larger. - 8. A method of generating a score of a histopathological diagnosis of a cancer patient, comprising:
- loading an image patch into a processing unit, wherein
the image patch is cropped from a digital image of a slice of tissue, wherein the image patch has a center, and wherein the slice of tissue has been immunohistochemically stained using a diagnostic antibody; - performing image processing on the image patch using a convolutional neural network to determine whether the center of the image patch belongs to (a) cancer cells that have been positively stained by the diagnostic antibody, (b) cancer cells that have been negatively stained by the diagnostic antibody, or (c) other tissue;
- performing image processing on other image patches from the digital image so as to compute the score of the histopathological diagnosis based on how many of the image patches have positively stained cancer cells at their centers and how many of the image patches have negatively stained cancer cells at their centers; and
- displaying the digital image and the score on a graphical user interface.
- loading an image patch into a processing unit, wherein
- 9. The method of
clause 8, wherein the slice of tissue is lung tissue. - 10. The method of
clause 8 or clause 9, wherein the diagnostic antibody is taken from the group consisting of: anti-HER2, anti-PDL1, anti-PD-L2, and anti-CD73. - 11. The method of any of
clauses 8 to 10, wherein the convolutional neural network is trained using AC-GAN. - 12. The method of any of
clauses 8 to 11, wherein the score is a ratio of those image patches having a positively stained cancer cell at their centers to those image patches having a positively or negatively stained cancer cell at their centers. - 13. The method of any of
clauses 8 to 12, further comprising:
recommending a therapy for the cancer patient that uses a therapeutic antibody that targets the same protein as the diagnostic antibody if the score obtained using the diagnostic antibody is larger than a predetermined threshold. - 14. The method of clause 13, wherein the score is a ratio of those image patches having a positively stained cancer cell at their centers to those image patches having a positively or negatively stained cancer cell at their centers, wherein the diagnostic antibody is PD-L1, and wherein the recommended therapy uses IMFINZI (anti-PD-Ll drug by MedI/AZ) if the score is 0.25 or larger.
- 15. A system that generates a histopathological diagnosis of a cancer patient using a score, comprising:
- loading an image patch into a graphical processing unit (GPU), wherein the image patch is cropped from a digital tissue slide, and wherein the digital tissue slide was acquired by scanning a cancer tissue section immunohistochemically stained using a diagnostic antibody;
- determining if the center of the image patch belongs to (a) a cancer cell positively stained by the diagnostic antibody, (b) a cancer cell negatively stained by the diagnostic antibody, (c) other tissue, by processing the image patch using a convolutional neural network;
- computing a score based on the number of image patches
with a positively stained cancer cell and the number of image patches with a negatively stained cancer cell by processing multiple image patches sampled from the digital tissue slide; and - displaying the digital tissue image and the score on a graphical user interface.
- 16. The system of clause 15, wherein the cancer tissue section is sectioned from a lung cancer biopsy.
- 17. The system of clause 15 or
clause 16, wherein the diagnostic antibody is selected from the group: anti-HER2, anti-PD-L1, anti-PD-L2, anti-CD73. - 18. The system of any of clauses 15 to 17, wherein the convolutional neural network was trained using a semi-supervised method based on the AC-GAN.
- 19. The system of any of clauses 15 to 18, wherein the score is the ratio of image patches with a positively stained cancer cell to images patches with positively or negatively stained cancer cells.
- 20. The system of any of clauses 15 to 19, wherein if the score related to the antibody is larger than a predetermined threshold, then the system recommends a personalized, cancer specific therapy that involves a therapeutic antibody targeting the same protein as the diagnostic antibody.
- 21. The system of
clause 20, wherein the diagnostic antibody is PD-L1, and wherein the recommended therapy involves IMFINZI (anti-PD-Ll drug by MedI/AZ) if the score is equal to or larger than 25%. - 22. A method of generating a score of a histopathological diagnosis of a cancer patient, comprising:
- loading a first image patch into a processing unit, wherein the first image patch is cropped from a digital image of a slice of tissue, and wherein the slice of tissue has been immunohistochemically stained using a diagnostic antibody;
- determining which pixels of the first image patch belong to (a) a cancer cell that has been positively stained by the diagnostic antibody, (b) a cancer cell that has been negatively stained by the diagnostic antibody, and (c) other tissue, by processing the first image patch using a semantic segmentation neural network;
- processing other image patches that have been cropped from the digital image to determine which pixels of each of the other image patches belong to (a) a cancer cell that has been positively stained by the diagnostic antibody, (b)a cancer cell that has been negatively stained by the diagnostic antibody, and (c) other tissue;
- computing the score of the histopathological diagnosis based on the total number of pixels that belong to a positively stained cancer cell and the number of pixels that belong to a negatively stained cancer cell on the processed image patches; and
- displaying the digital image and the score on a graphical user interface.
- 23. A method of generating a score of a histopathological diagnosis of a cancer patient, comprising:
- loading a first image patch into a processing unit, wherein the first image patch is cropped from a digital image of a slice of tissue that has been immunohistochemically
stained using a diagnostic antibody; - processing the first image patch using a semantic segmentation neural network to determine how many pixels of the first image patch belong to cancer cells that have been positively stained by the diagnostic antibody and how many pixels of the first image patch belong to cancer cells that has been negatively stained by the diagnostic antibody;
- processing other image patches using the semantic segmentation neural network to determine how many pixels of the other image patches belong to cancer cells that have been positively stained by the diagnostic antibody and how many pixels of the other image patches belong to cancer cells that has been negatively stained by the diagnostic antibody;
- computing the score of the histopathological diagnosis based on a first total number of pixels of the first image patch and the other image patches that belong to positively stained cancer cells and a second total number of pixels of the first image patch and the other image patches that belong to negatively stained cancer cells; and
- displaying the digital image and the score on a graphical user interface.
- loading a first image patch into a processing unit, wherein the first image patch is cropped from a digital image of a slice of tissue that has been immunohistochemically
- 24. A method of generating a score of a histopathological diagnosis of a cancer patient, comprising:
- loading a first image patch into a processing unit, wherein the first image patch is cropped from a digital image of a slice of tissue, and wherein the slice of tissue has been immunohistochemically stained using a diagnostic antibody;
- processing the first image patch using a cell counting convolutional neural network to determine in the first image patch (a) a number of cancer cells that have been positively stained by the diagnostic antibody, (b) a number of cancers cells that have been negatively stained by the diagnostic antibody;
- processing other image patches that have been cropped from the digital image to determine in each of the other image patches (a) the number of cancer cells that have been positively stained by the diagnostic antibody and (b) the number of cancer cells that have been negatively stained by the diagnostic antibody;
- computing the score of the histopathological diagnosis based on the total number of positively stained cancer cells and on the total number of negatively stained cancer cells on the processed image patches; and
- displaying the digital image and the score on a graphical user interface.
- 25. A method of generating a score of a histopathological diagnosis of a cancer patient, comprising:
- loading a first image patch into a processing unit, wherein the first image patch is cropped from a digital image of a slice of tissue, and wherein the slice of tissue has been immunohistochemically stained using a diagnostic antibody;
- using a convolutional neural network to determine in the first image patch (a) how many cancer cells have been positively stained by the diagnostic antibody, and (b) how many cancers cells have been negatively stained by the diagnostic antibody;
- using the convolutional neural network to determine in other image patches that have been cropped from the digital image (a) how many cancer cells have been positively stained by the diagnostic antibody, and (b) how many cancers cells have been negatively stained by the diagnostic antibody;
- computing the score of the histopathological diagnosis based on a total number of positively stained cancer cells and on a total number of negatively stained cancer cells; and
- displaying the digital image and the score on a graphical user interface.
-
- Hernández, C. X., Sultan, M. M., and Pande, V. S. Using deep learning for segmentation and counting within microscopy data. arXiv preprint arXiv: 1802.10548, 2018.
- Long, J., Shelhamer, E., and Darrel, T. Fully convolutional networks for semantic segmentation. CoRR, abs/1411.4038, 2014.
- Noh, H., Hong, S., and Han, B. Learning deconvolution network for semantic segmentation. In: ICCV. pp. 1520-1528, 2015.
Claims (25)
- A method of generating a score of a histopathological diagnosis of a cancer patient, comprising:loading a first image patch into a processing unit, wherein the first image patch is cropped from a digital image of a slice of tissue, and wherein the slice of tissue has been immunohistochemically stained using a diagnostic antibody;determining how many pixels of the first image patch belong to a first tissue that has been positively stained by the diagnostic antibody, wherein the determining is performed by processing the first image patch using a convolutional neural network;processing additional image patches that have been cropped from the digital image to determine how many pixels of each additional image patch belong to the first tissue;computing the score of the histopathological diagnosis based on a total number of pixels that belong to the first tissue; anddisplaying the digital image and the score on a graphical user interface.
- The method of claim 1, wherein the determining how many pixels of the first image patch belong to the first tissue also involves determining how many pixels of the first image patch belong to a second tissue that has been negatively stained by the diagnostic antibody and to a third tissue that is neither the first tissue nor the second tissue.
- The method of claim 1 or claim 2, wherein the convolutional neural network is trained using generative adversarial learning.
- The method of claim 3, wherein the convolutional neural network is trained using a generative adversarial network that transforms image patches generated on a stain domain A into fake patches of a stain domain B.
- The method of claim 3, wherein the convolutional neural network is trained using a generative adversarial network that is trained to transform image patches generated on a stain domain A into fake patches of a stain domain B and then to perform segmentation on the stain domain B.
- The method of claim 4, wherein the convolutional neural network is trained using two generative adversarial networks, wherein a first of the two generative adversarial networks transforms image patches generated on a stain domain A into fake patches of a stain domain B, and wherein a second of the two generative adversarial networks transforms image patches generated on the stain domain B into fake patches of the stain domain A.
- The method of claim 5, wherein the convolutional neural network is trained using two generative adversarial networks, wherein a first of the two generative adversarial networks transforms image patches generated on a stain domain A into fake patches of a stain domain B and then performs segmentation on the stain domain B, and wherein a second of the two generative adversarial networks transforms image patches generated on the stain domain B into fake patches of the stain domain A and then performs segmentation on the stain domain A.
- The method of any of claims 1 to 7, wherein the slice of tissue is taken from a biopsy of lung cancer.
- The method of any of claims 1 to 8, wherein the diagnostic antibody is taken from the group consisting of: HER2, PD-L1, PD-L2, and CD73.
- The method of any of claims 2 to 9, wherein the score is a ratio of the total number of pixels that belong to the first tissue to a total number of pixels that belong to either the first tissue or the second tissue.
- The method of any of claims 2 to 9, wherein the score is a ratio of the total number of pixels that belong to the first tissue to a total number of pixels that belong to a selected tissue type, and wherein the selected tissue type is taken from the group consisting of: the first tissue, the second tissue and the third tissue.
- The method of any of claims 1 to 11, wherein the diagnostic antibody targets a protein, further comprising:
selecting a therapy if the score obtained using the diagnostic antibody is larger than a predetermined threshold, wherein the therapy that is selected uses a therapeutic antibody that binds to the protein targeted by the diagnostic antibody. - The method of claim 12, wherein the diagnostic antibody is PD-L1, and wherein the selected therapy uses a PD-L1 medication if the score is larger than the predetermined threshold.
- The method of any of claims 1 to 13, wherein the first tissue that has been positively stained by the diagnostic antibody includes cells taken from the group consisting of: epithelial cells, endothelial cells, stromal cells, macrophages, T cells and B cells.
- A method of generating a score of a histopathological diagnosis of a cancer patient, comprising:loading an image patch into a processing unit, wherein the image patch is cropped from a digital image of a slice of tissue, and wherein the slice of tissue has been immunohistochemically stained using a diagnostic antibody;performing image processing on the image patch using a generative adversarial network to train a convolutional neural network to determine how many pixels of the image patch belong to (a) a first tissue that has been positively stained by the diagnostic antibody, (b) a second tissue that has been negatively stained by the diagnostic antibody, or (c) a third tissue that is neither the first tissue nor the second tissue;computing the score of the histopathological diagnosis based on a total number of pixels that belong to the first tissue; anddisplaying the score on a graphical user interface.
- The method of claim 15, wherein the slice of tissue is lung tissue.
- The method of claim 15 or claim 16, wherein the diagnostic antibody is taken from the group consisting of: HER2, PD-L1, PD-L2, and CD73.
- The method of any of claims 15 to 17, wherein the convolutional neural network is trained using a cycle of two generative adversarial networks that jointly perform domain adaptation and segmentation.
- The method of any of claims 15 to 18, wherein the score is a ratio of the total number of pixels that belong to the first tissue to a total number of pixels that belong to the second tissue.
- The method of any of claims 15 to 19, further comprising:
recommending a therapy for the cancer patient that uses a therapeutic antibody that targets the same protein as that targeted by the diagnostic antibody if the score obtained using the diagnostic antibody is larger than a predetermined threshold. - The method of claim 20, wherein the diagnostic antibody is PD-L1, and wherein the therapy uses an anti-PD-Ll drug.
- A system that generates a histopathological diagnosis for a cancer patient, comprising:code for loading an image patch into a processing unit, wherein the image patch is cropped from an image of a tissue slice, and wherein the image was acquired by scanning cancer tissue that was immunohistochemically stained using a diagnostic antibody;code for processing the image patch using a convolutional neural network to determine whether each pixel of the image patch belongs to (a) a tissue positively stained by the diagnostic antibody, (b) a tissue negatively stained by the diagnostic antibody, or (c) other tissue;code for processing multiple image patches cropped from the image so as to compute a score for the histopathological diagnosis based on a total number of pixels determined to belong to the tissue that is positively stained by the diagnostic antibody; anda graphical user interface that displays the image and the score.
- The system of claim 22, wherein the convolutional neural network is trained using a cycle of two generative adversarial networks that jointly perform domain adaptation and segmentation.
- The system of claim 22 or claim 23, wherein if the score is larger than a predetermined threshold, then the system recommends a therapy that uses a therapeutic antibody that targets the same protein as that targeted by the diagnostic antibody.
- The system of claim 24, wherein the diagnostic antibody is PD-L1, and wherein the therapy uses a drug targeting a protein of the group consisting of PD-L1, PD-1.
Applications Claiming Priority (1)
| Application Number | Priority Date | Filing Date | Title |
|---|---|---|---|
| US201862690329P | 2018-06-26 | 2018-06-26 |
Publications (2)
| Publication Number | Publication Date |
|---|---|
| EP3588382A1 true EP3588382A1 (en) | 2020-01-01 |
| EP3588382B1 EP3588382B1 (en) | 2026-02-25 |
Family
ID=67070750
Family Applications (1)
| Application Number | Title | Priority Date | Filing Date |
|---|---|---|---|
| EP19182560.3A Active EP3588382B1 (en) | 2018-06-26 | 2019-06-26 | A deep learning method for tumor cell scoring on cancer biopsies |
Country Status (2)
| Country | Link |
|---|---|
| US (1) | US11030744B2 (en) |
| EP (1) | EP3588382B1 (en) |
Cited By (7)
| Publication number | Priority date | Publication date | Assignee | Title |
|---|---|---|---|---|
| WO2021198279A1 (en) | 2020-03-30 | 2021-10-07 | Carl Zeiss Ag | Methods and devices for virtual scoring of tissue samples |
| US20230206601A1 (en) * | 2020-09-15 | 2023-06-29 | Robert Bosch Gmbh | Device and method for classifying images and accessing the robustness of the classification |
| WO2023192972A1 (en) * | 2022-03-31 | 2023-10-05 | Dasisimulations Llc | Artificial intelligence-based systems and methods for automatic measurements for pre-procedural planning |
| WO2023203234A1 (en) * | 2022-04-22 | 2023-10-26 | Tribun Health | Method for determining a region of interest in an image of a biological sample |
| EP4275052A1 (en) | 2021-01-07 | 2023-11-15 | Memorial Sloan Kettering Cancer Center | Quantification of conditions on biomedical images across staining modalities using a multi-task deep learning framework |
| WO2024227067A1 (en) * | 2023-04-28 | 2024-10-31 | Ventana Medical Systems, Inc. | Domain swap and artificial generated virtual images |
| US12266196B2 (en) * | 2021-07-14 | 2025-04-01 | Lunit Inc. | Method and system for analyzing pathology image |
Families Citing this family (39)
| Publication number | Priority date | Publication date | Assignee | Title |
|---|---|---|---|---|
| KR102403494B1 (en) * | 2017-04-27 | 2022-05-27 | 에스케이텔레콤 주식회사 | Method for learning Cross-domain Relations based on Generative Adversarial Network |
| WO2019191697A1 (en) | 2018-03-30 | 2019-10-03 | The Regents Of The University Of California | Method and system for digital staining of label-free fluorescence images using deep learning |
| US11348240B2 (en) | 2018-05-14 | 2022-05-31 | Tempus Labs, Inc. | Predicting total nucleic acid yield and dissection boundaries for histology slides |
| US11348661B2 (en) | 2018-05-14 | 2022-05-31 | Tempus Labs, Inc. | Predicting total nucleic acid yield and dissection boundaries for histology slides |
| US10957041B2 (en) | 2018-05-14 | 2021-03-23 | Tempus Labs, Inc. | Determining biomarkers from histopathology slide images |
| US11348239B2 (en) | 2018-05-14 | 2022-05-31 | Tempus Labs, Inc. | Predicting total nucleic acid yield and dissection boundaries for histology slides |
| WO2019222289A1 (en) | 2018-05-14 | 2019-11-21 | Tempus Labs, Inc. | A generalizable and interpretable deep learning framework for predicting msi from histopathology slide images |
| US12106552B2 (en) * | 2018-07-19 | 2024-10-01 | The Regents Of The University Of California | Method and system for digital staining of label-free phase images using deep learning |
| WO2020081463A1 (en) * | 2018-10-18 | 2020-04-23 | Verily Life Sciences Llc | Systems and methods for using image processing to generate inferences of biomarker for immunotherapy |
| EP3644228B1 (en) * | 2018-10-23 | 2024-08-14 | The Chinese University Of Hong Kong | Method and apparatus for segmenting cellular image |
| EP3906503A4 (en) * | 2018-12-31 | 2022-08-31 | Tempus Labs, Inc. | TISSUE IMAGE SEGMENTATION BY ARTIFICIAL INTELLIGENCE |
| BR112022002651A2 (en) * | 2019-08-13 | 2022-05-03 | Univ Of Hertfordshire Higher Education Corporation | Methods of translating an input image r to an output image v* and predicting the visible infrared band images, e, imaging apparatus |
| US20210056432A1 (en) * | 2019-08-21 | 2021-02-25 | Dspace Digital Signal Processing And Control Engineering Gmbh | Method for training an artificial neural generator network, method for training an artificial neural discriminator network, and test unit |
| KR20220132544A (en) * | 2020-01-24 | 2022-09-30 | 제넨테크, 인크. | Weak supervised lesion segmentation |
| CN113192150B (en) * | 2020-01-29 | 2022-03-15 | 上海交通大学 | Magnetic resonance interventional image reconstruction method based on cyclic neural network |
| WO2021158952A1 (en) * | 2020-02-05 | 2021-08-12 | Origin Labs, Inc. | Systems configured for area-based histopathological learning and prediction and methods thereof |
| CN111401214B (en) * | 2020-03-12 | 2023-04-18 | 四川大学华西医院 | Multi-resolution integrated HER2 interpretation method based on deep learning |
| CN112883770A (en) * | 2020-04-20 | 2021-06-01 | 深圳裕策生物科技有限公司 | PD-1/PD-L1 pathological picture identification method and device based on deep learning |
| KR102504722B1 (en) * | 2020-06-24 | 2023-02-28 | 영남대학교 산학협력단 | Learning apparatus and method for creating emotion expression video and apparatus and method for emotion expression video creation |
| EP4675555A3 (en) * | 2020-08-13 | 2026-03-04 | Ventana Medical Systems, Inc. | Machine learning models for cell localization and classification learned using repel coding |
| WO2022035943A1 (en) * | 2020-08-13 | 2022-02-17 | Ventana Medical Systems, Inc. | Automated identification of necrotic regions in digital images of multiplex immunofluorescence stained tissue |
| CN116601713A (en) * | 2020-09-12 | 2023-08-15 | 阿斯利康(英国)有限公司 | Scoring method for anti-HER2 antibody-drug conjugate therapy |
| KR20230066095A (en) * | 2020-09-12 | 2023-05-12 | 메디뮨 리미티드 | Scoring Methods for Anti-B7H4 Antibody-Drug Conjugate Therapy |
| CN112330625B (en) * | 2020-11-03 | 2023-03-24 | 杭州迪英加科技有限公司 | Immunohistochemical nuclear staining section cell positioning multi-domain co-adaptation training method |
| CA3200162A1 (en) * | 2020-12-15 | 2022-06-23 | Mark Justin Parkinson | Systems and methods for identifying cancer in pets |
| CN112991263B (en) * | 2021-02-06 | 2022-07-22 | 杭州迪英加科技有限公司 | Method and equipment for improving TPS (tissue specific differentiation) calculation accuracy of PD-L1 immunohistochemical pathological section |
| CN113096086B (en) * | 2021-04-01 | 2022-05-17 | 中南大学 | A method and system for determining ki67 index |
| CN113221903B (en) * | 2021-05-11 | 2021-10-15 | 中国科学院自动化研究所 | Cross-domain adaptive semantic segmentation method and system |
| CN117529750A (en) * | 2021-06-17 | 2024-02-06 | 文塔纳医疗系统公司 | Digital synthesis of histological staining using multiplex immunofluorescence imaging |
| CN113642518B (en) * | 2021-08-31 | 2023-08-22 | 山东省计算中心(国家超级计算济南中心) | Discrimination method of cell membrane coloring integrity in HER2 pathological images based on migration learning |
| US12475564B2 (en) | 2022-02-16 | 2025-11-18 | Proscia Inc. | Digital pathology artificial intelligence quality check |
| JP2025525054A (en) * | 2022-07-28 | 2025-08-01 | アプライド マテリアルズ インコーポレイテッド | Methods and systems for automated HER2 scoring |
| JP2025526652A (en) * | 2022-08-08 | 2025-08-15 | ヴェンタナ メディカル システムズ, インク. | Systems and methods for quantification of digitized pathology slides |
| CN115330722B (en) * | 2022-08-15 | 2025-06-17 | 福州大学 | A method for intelligently predicting the efficacy of PD-L1 inhibitors using H&E staining images of gastric cancer |
| JP2024077476A (en) * | 2022-11-28 | 2024-06-07 | 公益財団法人がん研究会 | AI diagnostic support method and diagnostic support system for cytological diagnosis images |
| CN116228907A (en) * | 2023-02-21 | 2023-06-06 | 中国科学院苏州生物医学工程技术研究所 | Medical image electronic dyeing method, storage medium and computer equipment |
| US12700249B2 (en) | 2023-07-06 | 2026-08-04 | Pictor Labs, Inc. | Systems and methods for training machine learning on noisy and inaccurate immunostains |
| CN117495742B (en) * | 2023-08-01 | 2024-05-31 | 西交利物浦大学 | Method, device, equipment and medium for transferring image dyeing |
| WO2025199457A1 (en) * | 2024-03-22 | 2025-09-25 | Emory University | Artificial intelligence (ai)-based assessment of immune cells from digitized pathology images of cancer patients |
Family Cites Families (3)
| Publication number | Priority date | Publication date | Assignee | Title |
|---|---|---|---|---|
| US10941176B2 (en) * | 2015-07-28 | 2021-03-09 | Caris Science, Inc. | Therapeutic oligonucleotides |
| US10121245B2 (en) * | 2015-09-14 | 2018-11-06 | University Of Notre Dame | Identification of inflammation in tissue images |
| EP3203413A1 (en) * | 2016-02-08 | 2017-08-09 | Ecole Polytechnique Federale De Lausanne (Epfl) | Method for quantitative measurement of a biomarker by in situ immunofluorescence and uses thereof |
-
2019
- 2019-06-25 US US16/452,511 patent/US11030744B2/en active Active
- 2019-06-26 EP EP19182560.3A patent/EP3588382B1/en active Active
Non-Patent Citations (8)
| Title |
|---|
| CARLOS X HERN\'ANDEZ ET AL: "Using Deep Learning for Segmentation and Counting within Microscopy Data", ARXIV.ORG, CORNELL UNIVERSITY LIBRARY, 201 OLIN LIBRARY CORNELL UNIVERSITY ITHACA, NY 14853, 28 February 2018 (2018-02-28), XP081213794 * |
| HAVAEI MOHAMMAD ET AL: "Brain tumor segmentation with Deep Neural Networks", MEDICAL IMAGE ANALYSIS, vol. 35, 1 January 2017 (2017-01-01), pages 18 - 31, XP029801693, ISSN: 1361-8415, DOI: 10.1016/J.MEDIA.2016.05.004 * |
| HERNANDEZ, C. X.SULTAN, M. M.PANDE, V. S: "Using deep learning for segmentation and counting within microscopy data", ARXIV PREPRINT ARXIV: 1802.10548, 2018 |
| LE HOU ET AL: "Patch-Based Convolutional Neural Network for Whole Slide Tissue Image Classification", 9 March 2016 (2016-03-09), XP055523985, Retrieved from the Internet <URL:https://arxiv.org/pdf/1504.07947.pdf> [retrieved on 20181114] * |
| LI ZEJU ET AL: "Brain Tumor Segmentation Using an Adversarial Network", 17 February 2018, INTELLIGENT VIRTUAL AGENT. IVA 2015. LNCS; [LECTURE NOTES IN COMPUTER SCIENCE; LECT.NOTES COMPUTER], SPRINGER, BERLIN, HEIDELBERG, PAGE(S) 123 - 132, ISBN: 978-3-642-17318-9, XP047464663 * |
| LONG, J.SHELHAMER, E.DARREL, T.: "Fully convolutional networks for semantic segmentation", CORR, ABS/1411.4038, 2014 |
| NOH, H.HONG, S.HAN, B.: "Learning deconvolution network for semantic segmentation", ICCV., 2015, pages 1520 - 1528, XP055558488, DOI: doi:10.1109/ICCV.2015.178 |
| RIKU TURKKI ET AL: "Antibody-supervised deep learning for quantification of tumor-infiltrating immune cells in hematoxylin and eosin stained breast cancer samples", JOURNAL OF PATHOLOGY INFORMATICS, 1 September 2016 (2016-09-01), XP055587403, Retrieved from the Internet <URL:https://www.ncbi.nlm.nih.gov/pmc/articles/PMC5027738/> [retrieved on 20190509], DOI: 10.4103/2153-3539.189703 * |
Cited By (11)
| Publication number | Priority date | Publication date | Assignee | Title |
|---|---|---|---|---|
| WO2021198279A1 (en) | 2020-03-30 | 2021-10-07 | Carl Zeiss Ag | Methods and devices for virtual scoring of tissue samples |
| US20230206601A1 (en) * | 2020-09-15 | 2023-06-29 | Robert Bosch Gmbh | Device and method for classifying images and accessing the robustness of the classification |
| US12456284B2 (en) * | 2020-09-15 | 2025-10-28 | Robert Bosch Gmbh | Device and method for classifying images and accessing the robustness of the classification |
| EP4275052A1 (en) | 2021-01-07 | 2023-11-15 | Memorial Sloan Kettering Cancer Center | Quantification of conditions on biomedical images across staining modalities using a multi-task deep learning framework |
| EP4275052A4 (en) * | 2021-01-07 | 2025-04-09 | Memorial Sloan Kettering Cancer Center | Quantification of conditions on biomedical images across staining modalities using a multi-task deep learning framework |
| US12266196B2 (en) * | 2021-07-14 | 2025-04-01 | Lunit Inc. | Method and system for analyzing pathology image |
| WO2023192972A1 (en) * | 2022-03-31 | 2023-10-05 | Dasisimulations Llc | Artificial intelligence-based systems and methods for automatic measurements for pre-procedural planning |
| US12629209B2 (en) | 2022-03-31 | 2026-05-19 | Dasisimulations Llc | Artificial intelligence-based systems and methods for automatic measurements for pre-procedural planning |
| WO2023203234A1 (en) * | 2022-04-22 | 2023-10-26 | Tribun Health | Method for determining a region of interest in an image of a biological sample |
| FR3134911A1 (en) * | 2022-04-22 | 2023-10-27 | Tribun Health | METHOD FOR DETERMINING A REGION OF INTEREST IN AN IMAGE OF A BIOLOGICAL SAMPLE |
| WO2024227067A1 (en) * | 2023-04-28 | 2024-10-31 | Ventana Medical Systems, Inc. | Domain swap and artificial generated virtual images |
Also Published As
| Publication number | Publication date |
|---|---|
| EP3588382B1 (en) | 2026-02-25 |
| US11030744B2 (en) | 2021-06-08 |
| US20190392580A1 (en) | 2019-12-26 |
Similar Documents
| Publication | Publication Date | Title |
|---|---|---|
| EP3588382B1 (en) | A deep learning method for tumor cell scoring on cancer biopsies | |
| US11901077B2 (en) | Multiple instance learner for prognostic tissue pattern identification | |
| JP7427080B2 (en) | Weakly supervised multitask learning for cell detection and segmentation | |
| US11727674B2 (en) | Systems and methods for generating histology image training datasets for machine learning models | |
| US20250061149A1 (en) | System and method for tumor characterization | |
| US20200388033A1 (en) | System and method for automatic labeling of pathology images | |
| Senaras et al. | Optimized generation of high-resolution phantom images using cGAN: Application to quantification of Ki67 breast cancer images | |
| KR20210145778A (en) | Method for Determination of Biomarkers from Histopathology Slide Images | |
| EP3871183B1 (en) | Distance-based tissue state determination | |
| Niyas et al. | Automated molecular subtyping of breast carcinoma using deep learning techniques | |
| Xu et al. | Using transfer learning on whole slide images to predict tumor mutational burden in bladder cancer patients | |
| US12597133B2 (en) | Training end-to-end weakly supervised networks at the specimen (supra-image) level | |
| CN119169012B (en) | A method for analyzing multiple immunohistochemical fluorescence staining images and related equipment | |
| Barricelli et al. | ki67 nuclei detection and ki67-index estimation: a novel automatic approach based on human vision modeling | |
| Salvi et al. | Deep learning approach for accurate prostate cancer identification and stratification using combined immunostaining of cytokeratin, p63, and racemase | |
| Nabi et al. | Explainable deep learning models for HER2 IHC scoring in breast cancer diagnosis | |
| Saurav et al. | A SSIM guided cGAN architecture for clinically driven generative image synthesis of multiplexed spatial proteomics channels | |
| Saranyaraj et al. | Early prediction of breast cancer based on the classification of HER‐2 and ER biomarkers using deep neural network | |
| Johny et al. | Optimization of CNN model with hyper parameter tuning for enhancing sturdiness in classification of histopathological images | |
| Parvatikar et al. | Prototypical models for classifying high-risk atypical breast lesions | |
| WO2024118842A1 (en) | Systems and methods for detecting tertiary lymphoid structures | |
| Bannah et al. | Real-time nuclei classification and Allred scoring in PR-IHC stained breast cancer histopathology images | |
| Tang et al. | The Current Challenges Review of Deep Learning-Based Nuclei Segmentation of Diffuse Large B-Cell Lymphoma. | |
| Bhattacharjee et al. | Detection and classification of prostate cancer using dual-channel parallel convolution neural network | |
| Joshi et al. | An Improved ResNet Architecture for Accurate Patch-Level HER2 Overexpression Classification in Breast Cancer Tissue Images |
Legal Events
| Date | Code | Title | Description |
|---|---|---|---|
| PUAI | Public reference made under article 153(3) epc to a published international application that has entered the european phase |
Free format text: ORIGINAL CODE: 0009012 |
|
| STAA | Information on the status of an ep patent application or granted ep patent |
Free format text: STATUS: THE APPLICATION HAS BEEN PUBLISHED |
|
| AK | Designated contracting states |
Kind code of ref document: A1 Designated state(s): AL AT BE BG CH CY CZ DE DK EE ES FI FR GB GR HR HU IE IS IT LI LT LU LV MC MK MT NL NO PL PT RO RS SE SI SK SM TR |
|
| AX | Request for extension of the european patent |
Extension state: BA ME |
|
| STAA | Information on the status of an ep patent application or granted ep patent |
Free format text: STATUS: REQUEST FOR EXAMINATION WAS MADE |
|
| 17P | Request for examination filed |
Effective date: 20200507 |
|
| RBV | Designated contracting states (corrected) |
Designated state(s): AL AT BE BG CH CY CZ DE DK EE ES FI FR GB GR HR HU IE IS IT LI LT LU LV MC MK MT NL NO PL PT RO RS SE SI SK SM TR |
|
| RAP1 | Party data changed (applicant data changed or rights of an application transferred) |
Owner name: ASTRAZENECA COMPUTATIONAL PATHOLOGY GMBH |
|
| STAA | Information on the status of an ep patent application or granted ep patent |
Free format text: STATUS: EXAMINATION IS IN PROGRESS |
|
| 17Q | First examination report despatched |
Effective date: 20210204 |
|
| P01 | Opt-out of the competence of the unified patent court (upc) registered |
Effective date: 20230522 |
|
| REG | Reference to a national code |
Ref country code: DE Ref legal event code: R079 Free format text: PREVIOUS MAIN CLASS: G06K0009620000 Ipc: G06V0010820000 Ref document number: 602019081712 Country of ref document: DE |
|
| GRAP | Despatch of communication of intention to grant a patent |
Free format text: ORIGINAL CODE: EPIDOSNIGR1 |
|
| STAA | Information on the status of an ep patent application or granted ep patent |
Free format text: STATUS: GRANT OF PATENT IS INTENDED |
|
| RIC1 | Information provided on ipc code assigned before grant |
Ipc: G06V 10/82 20220101AFI20250717BHEP Ipc: G06V 10/764 20220101ALI20250717BHEP |
|
| INTG | Intention to grant announced |
Effective date: 20250729 |
|
| GRAJ | Information related to disapproval of communication of intention to grant by the applicant or resumption of examination proceedings by the epo deleted |
Free format text: ORIGINAL CODE: EPIDOSDIGR1 |
|
| STAA | Information on the status of an ep patent application or granted ep patent |
Free format text: STATUS: EXAMINATION IS IN PROGRESS |
|
| GRAP | Despatch of communication of intention to grant a patent |
Free format text: ORIGINAL CODE: EPIDOSNIGR1 |
|
| STAA | Information on the status of an ep patent application or granted ep patent |
Free format text: STATUS: GRANT OF PATENT IS INTENDED |
|
| INTC | Intention to grant announced (deleted) | ||
| INTG | Intention to grant announced |
Effective date: 20250925 |
|
| GRAS | Grant fee paid |
Free format text: ORIGINAL CODE: EPIDOSNIGR3 |
|
| GRAA | (expected) grant |
Free format text: ORIGINAL CODE: 0009210 |
|
| STAA | Information on the status of an ep patent application or granted ep patent |
Free format text: STATUS: THE PATENT HAS BEEN GRANTED |
|
| AK | Designated contracting states |
Kind code of ref document: B1 Designated state(s): AL AT BE BG CH CY CZ DE DK EE ES FI FR GB GR HR HU IE IS IT LI LT LU LV MC MK MT NL NO PL PT RO RS SE SI SK SM TR |
|
| REG | Reference to a national code |
Ref country code: CH Ref legal event code: F10 Free format text: ST27 STATUS EVENT CODE: U-0-0-F10-F00 (AS PROVIDED BY THE NATIONAL OFFICE) Effective date: 20260225 Ref country code: GB Ref legal event code: FG4D |
|
| REG | Reference to a national code |
Ref country code: DE Ref legal event code: R096 Ref document number: 602019081712 Country of ref document: DE |
|
| REG | Reference to a national code |
Ref country code: IE Ref legal event code: FG4D |
|
| PGFP | Annual fee paid to national office [announced via postgrant information from national office to epo] |
Ref country code: FR Payment date: 20260302 Year of fee payment: 8 |
|
| REG | Reference to a national code |
Ref country code: NL Ref legal event code: MP Effective date: 20260225 |
|
| PG25 | Lapsed in a contracting state [announced via postgrant information from national office to epo] |
Ref country code: RS Free format text: LAPSE BECAUSE OF FAILURE TO SUBMIT A TRANSLATION OF THE DESCRIPTION OR TO PAY THE FEE WITHIN THE PRESCRIBED TIME-LIMIT Effective date: 20260525 |
|
| PG25 | Lapsed in a contracting state [announced via postgrant information from national office to epo] |
Ref country code: ES Free format text: LAPSE BECAUSE OF FAILURE TO SUBMIT A TRANSLATION OF THE DESCRIPTION OR TO PAY THE FEE WITHIN THE PRESCRIBED TIME-LIMIT Effective date: 20260225 |
|
| PG25 | Lapsed in a contracting state [announced via postgrant information from national office to epo] |
Ref country code: PL Free format text: LAPSE BECAUSE OF FAILURE TO SUBMIT A TRANSLATION OF THE DESCRIPTION OR TO PAY THE FEE WITHIN THE PRESCRIBED TIME-LIMIT Effective date: 20260225 |
|
| PGFP | Annual fee paid to national office [announced via postgrant information from national office to epo] |
Ref country code: GB Payment date: 20260407 Year of fee payment: 8 |
|
| PG25 | Lapsed in a contracting state [announced via postgrant information from national office to epo] |
Ref country code: GR Free format text: LAPSE BECAUSE OF FAILURE TO SUBMIT A TRANSLATION OF THE DESCRIPTION OR TO PAY THE FEE WITHIN THE PRESCRIBED TIME-LIMIT Effective date: 20260526 |
|
| REG | Reference to a national code |
Ref country code: LT Ref legal event code: MG9D |
|
| PG25 | Lapsed in a contracting state [announced via postgrant information from national office to epo] |
Ref country code: LT Free format text: LAPSE BECAUSE OF FAILURE TO SUBMIT A TRANSLATION OF THE DESCRIPTION OR TO PAY THE FEE WITHIN THE PRESCRIBED TIME-LIMIT Effective date: 20260225 |
|
| PGFP | Annual fee paid to national office [announced via postgrant information from national office to epo] |
Ref country code: DE Payment date: 20260303 Year of fee payment: 8 |
|
| PG25 | Lapsed in a contracting state [announced via postgrant information from national office to epo] |
Ref country code: NO Free format text: LAPSE BECAUSE OF FAILURE TO SUBMIT A TRANSLATION OF THE DESCRIPTION OR TO PAY THE FEE WITHIN THE PRESCRIBED TIME-LIMIT Effective date: 20260525 |
|
| PG25 | Lapsed in a contracting state [announced via postgrant information from national office to epo] |
Ref country code: AT Free format text: LAPSE BECAUSE OF FAILURE TO SUBMIT A TRANSLATION OF THE DESCRIPTION OR TO PAY THE FEE WITHIN THE PRESCRIBED TIME-LIMIT Effective date: 20260225 Ref country code: SE Free format text: LAPSE BECAUSE OF FAILURE TO SUBMIT A TRANSLATION OF THE DESCRIPTION OR TO PAY THE FEE WITHIN THE PRESCRIBED TIME-LIMIT Effective date: 20260225 Ref country code: FI Free format text: LAPSE BECAUSE OF FAILURE TO SUBMIT A TRANSLATION OF THE DESCRIPTION OR TO PAY THE FEE WITHIN THE PRESCRIBED TIME-LIMIT Effective date: 20260225 |
|
| REG | Reference to a national code |
Ref country code: AT Ref legal event code: MK05 Ref document number: 1891827 Country of ref document: AT Kind code of ref document: T Effective date: 20260225 |
|
| PG25 | Lapsed in a contracting state [announced via postgrant information from national office to epo] |
Ref country code: HR Free format text: LAPSE BECAUSE OF FAILURE TO SUBMIT A TRANSLATION OF THE DESCRIPTION OR TO PAY THE FEE WITHIN THE PRESCRIBED TIME-LIMIT Effective date: 20260225 |
|
| PG25 | Lapsed in a contracting state [announced via postgrant information from national office to epo] |
Ref country code: IS Free format text: LAPSE BECAUSE OF FAILURE TO SUBMIT A TRANSLATION OF THE DESCRIPTION OR TO PAY THE FEE WITHIN THE PRESCRIBED TIME-LIMIT Effective date: 20260625 Ref country code: PT Free format text: LAPSE BECAUSE OF FAILURE TO SUBMIT A TRANSLATION OF THE DESCRIPTION OR TO PAY THE FEE WITHIN THE PRESCRIBED TIME-LIMIT Effective date: 20260625 |
|
| PG25 | Lapsed in a contracting state [announced via postgrant information from national office to epo] |
Ref country code: NL Free format text: LAPSE BECAUSE OF FAILURE TO SUBMIT A TRANSLATION OF THE DESCRIPTION OR TO PAY THE FEE WITHIN THE PRESCRIBED TIME-LIMIT Effective date: 20260225 |
|
| PG25 | Lapsed in a contracting state [announced via postgrant information from national office to epo] |
Ref country code: LV Free format text: LAPSE BECAUSE OF FAILURE TO SUBMIT A TRANSLATION OF THE DESCRIPTION OR TO PAY THE FEE WITHIN THE PRESCRIBED TIME-LIMIT Effective date: 20260225 |
|
| PG25 | Lapsed in a contracting state [announced via postgrant information from national office to epo] |
Ref country code: BG Free format text: LAPSE BECAUSE OF FAILURE TO SUBMIT A TRANSLATION OF THE DESCRIPTION OR TO PAY THE FEE WITHIN THE PRESCRIBED TIME-LIMIT Effective date: 20260225 |