EP3547217A1 - Data-driven features via signal clustering - Google Patents
Data-driven features via signal clustering Download PDFInfo
- Publication number
- EP3547217A1 EP3547217A1 EP19166196.6A EP19166196A EP3547217A1 EP 3547217 A1 EP3547217 A1 EP 3547217A1 EP 19166196 A EP19166196 A EP 19166196A EP 3547217 A1 EP3547217 A1 EP 3547217A1
- Authority
- EP
- European Patent Office
- Prior art keywords
- time
- signal
- cluster
- signals
- feature values
- Prior art date
- Legal status (The legal status is an assumption and is not a legal conclusion. Google has not performed a legal analysis and makes no representation as to the accuracy of the status listed.)
- Withdrawn
Links
Images


Classifications
-
- G—PHYSICS
- G06—COMPUTING OR CALCULATING; COUNTING
- G06F—ELECTRIC DIGITAL DATA PROCESSING
- G06F18/00—Pattern recognition
- G06F18/20—Analysing
- G06F18/23—Clustering techniques
-
- G—PHYSICS
- G06—COMPUTING OR CALCULATING; COUNTING
- G06F—ELECTRIC DIGITAL DATA PROCESSING
- G06F16/00—Information retrieval; Database structures therefor; File system structures therefor
- G06F16/20—Information retrieval; Database structures therefor; File system structures therefor of structured data, e.g. relational data
- G06F16/22—Indexing; Data structures therefor; Storage structures
- G06F16/2228—Indexing structures
-
- G—PHYSICS
- G06—COMPUTING OR CALCULATING; COUNTING
- G06F—ELECTRIC DIGITAL DATA PROCESSING
- G06F16/00—Information retrieval; Database structures therefor; File system structures therefor
- G06F16/20—Information retrieval; Database structures therefor; File system structures therefor of structured data, e.g. relational data
- G06F16/28—Databases characterised by their database models, e.g. relational or object models
- G06F16/284—Relational databases
- G06F16/285—Clustering or classification
-
- B—PERFORMING OPERATIONS; TRANSPORTING
- B64—AIRCRAFT; AVIATION; COSMONAUTICS
- B64D—EQUIPMENT FOR FITTING IN OR TO AIRCRAFT; FLIGHT SUITS; PARACHUTES; ARRANGEMENT OR MOUNTING OF POWER PLANTS OR PROPULSION TRANSMISSIONS IN AIRCRAFT
- B64D45/00—Aircraft indicators or protectors not otherwise provided for
- B64D2045/0085—Devices for aircraft health monitoring, e.g. monitoring flutter or vibration
Definitions
- the present disclosure is generally related to aircraft analytics and, more specifically, to identifying data with predictive capability.
- a systematic and robust methodology is needed for identifying which full-flight time-series signals can be used to predict maintenance and thereby avoid unplanned aircraft service interruptions, while minimizing the need for years' worth of subject-matter expertise.
- a method is described of identifying time-series signals that contain information useful for predicting impending event messages relating to one or more of safety, maintenance, and system operation information, before they occur.
- the method includes loading a plurality of time-series signals with assigned signal name and associated time-series data into a machine-readable storage medium and grouping the plurality of time-series signals based on textual similarity of the corresponding signal names into a signal cluster.
- a method of minimizing service interruption of an aircraft includes loading a plurality of time-series signals with an assigned signal name and associated time-series data into a machine-readable storage medium, grouping the plurality of time-series signals based on textual similarity of the corresponding signal names into a signal cluster, extracting a plurality of feature values from the signal cluster, correlating the cluster feature values with event message time-stamps to identify cluster feature values that change in a manner that indicates within an actionable alerting time period that the event message will occur, and using the feature values to predict the event message before it occurs and provide an actionable recommendation.
- the event messages relate to at least one of safety, maintenance, and engine operation.
- time-series signals e.g., signals that carry data collected by on-board sensors, etc.
- the present disclosure provides a systematic, robust methodology for identifying which full-flight time-series signals carry relevant information that is prognostic.
- the current invention leverages information contained within signal names to identify logical groupings in an automated fashion and assesses grouping features against all events where time-stamps indicate system failures, maintenance needs, operation status, safety hazards, and other information tending to require attention in the immediate, near-term, or foreseeable future, to identify useful combinations of signals that could be used to predict the particular events before they occur.
- event time-stamps are referred to as engine-indication and crew-alerting system (EICAS) messages.
- EICAS messages and “event messages” and “EICAS message time-stamp” and “event time-stamp” are used interchangeably herein.
- the ability to predict event messages before they occur will allow for actionable recommendations to be provided to airlines and/or component supply chains to prevent unscheduled service interruptions and to minimize service interruptions when they occur. For instance, if an event message can be predicted, necessary replacement parts can be pre-positioned so that they are available when the service interruption does occur, or the maintenance can be performed at a more opportune time and/or location.
- FIG. 1 is a flow chart of method 10 for identifying time-series signals that contain information useful for predicting impending event messages. Individual steps of method 10 are described in further detail in FIGS. 2A, 2B , 3A, 3B , and 4 .
- method 10 includes loading full in-flight time-series signals into a machine-readable storage system (step 12), automatically identifying logical groupings of time-series signals based on textual similarity of signal names and grouping the signals into clusters (step 14), extracting a feature value from the signal cluster (step 16), and correlating cluster feature values extracted over time to event message time-stamps to identify those with prognostic ability (step 18).
- Steps 14, 16, and 18 are conducted by a processor with a machine-readable memory and encoded with instructions for executing the steps.
- the machine-readable memory can include volatile and non-volatile memories. Examples of volatile memories can include random access memories (RAM), dynamic random access memories (DRAM), static random access memories (SRAM), and other forms of volatile memories. Examples of non-volatile memories can include magnetic hard discs, optical discs, floppy discs, flash memories, or forms of electrically programmable memories (EPROM) or electrically erasable and programmable (EEPROM) memories.
- FIG. 2A is graphical representation of textual signal clustering (step 14), in which a list of time-series signal names is plotted on both the x- and y-axes with the list of time-series signal names arranged in the same order on each axis.
- a processor is used to compare each signal name on the x-axis with each signal name on the y-axis character-by-character and to assign a similarity score to indicate the textual similarity between each pair of signal names (i.e., each signal name on the x-axis paired with each signal name on the y-axis).
- the similarity score ranges from a defined value indicating no similarity between the signal names to a defined value indicating an exact match of the signal names.
- a similarity score of zero may indicate that there are no characters that are the same or no character groupings that are the same (e.g., "EMU_N1_VIB_ACCEL_B_R” as compared to "WING ANTI-ICE SW POS"), whereas a similarity score of one may indicate an exact match in signal names (e.g., "WING ANTI-ICE SW POS” as compared to "WING ANTI-ICE SW POS").
- a threshold similarity score is defined between the no match and exact match values, indicating a high enough degree of similarity that the likelihood that the signals contain related data is more favorable than not.
- signal names containing the same name of a component and feature are more likely to have related data than signal names containing different components and/or different features (e.g., "THRUST_REV” and "ANTI-ICE”).
- An algorithm used for assigning the similarity score can be developed based on the names of signals used in a particular aircraft or a standard naming convention. Every combination of signal names is assigned a similarity score.
- a light gray box in FIG. 2A indicates pairs of signal names that have a similarity score exceeding the defined threshold value.
- the diagonal line across FIG. 2A indicates exact matches in signal names. All other light gray boxes indicate pairs of non-identical signal names that have a similarity score exceeding the defined threshold value.
- FIG. 2B is a graphical representation of textual signal clustering in which the signal pairs of FIG. 2A , having non-identical signal names that have a similarity score exceeding the defined threshold, have been sorted according to signal name into clusters.
- the signal names on the x- and y-axes in FIG. 2B are the same, but are not arranged in the same order relative to the pre-sorted order in FIG. 2A .
- the signal pairs are sorted using the reverse Cuthill-Mckee ordering algorithm, so that the light gray boxes far from the diagonal move toward the diagonal such that filled-in blocks tend to form.
- the larger light gray filled-in blocks are referred to herein as clusters.
- Each cluster contains at least two unique signal names (i.e., not exact matches) and up to an undefined number of signal names. As such, clusters can vary significantly in size. Because the signals are sorted into clusters according to textual similarity of signal names, the size of each cluster is generally defined by the number of signals related to particular component and/or feature (e.g., "THRUST_REV"). For example, there are multiple accelerometers to measure engine vibration, which produces a relatively large cluster as illustrated in the upper left-hand corner of FIG. 2B .
- FIGS. 2A and 2B While the process of textual signal clustering is represented graphically in FIGS. 2A and 2B , it will be understood by one of ordinary skill in the art that the graphs of FIGS. 2A and 2B are merely used to illustrate one embodiment of the disclosed process and that there is no requirement to plot or display the clustering of signal names in the exact manner disclosed.
- time-series signals within a cluster are extracted and the associated time-series data compared to obtain one or more cluster feature values (step 16).
- Each time-series signal has an associated data file that contains data collected during an event, which, as used herein, refers to a discrete occurrence.
- the event is a single flight of an aircraft; however, it will be understood by one of ordinary skill in the art that the method disclosed can be adapted for a wide variety of applications and is not limited to flight events or even maintenance predicting applications for an aircraft.
- a variety of sensors and processors are collecting and storing data relating to system operation.
- this data is not retrieved from the aircraft until after the flight has ended.
- the full-flight data files, with the thousands of time-series signals and associated time-series data can be loaded into a machine-readable medium for storage and eventual processing.
- the time-series data of each signal in a cluster can be compared to the time-series data of each of the other signals in that same cluster.
- a cluster of size two (having two unique signals) is considered in the following examples.
- a relationship between the time-series data of one signal and the time-series data of the other signal can be calculated based on the difference between the values of the time-series data.
- the relationship is referred to herein as a cluster feature value and can include a mean, median, standard deviation, minimum, maximum, or percentile distribution of the difference between time-series data or other statistically-relevant data point that can be obtained for each flight/event, which can be identified as discrete occurrences separated in time.
- the two signals may each have time-series temperature data for a flight/event. The difference in temperature between the two signals as a function of time can be determined and the mean difference can be calculated.
- the mean difference is a cluster feature value, which is a single data point.
- other cluster feature values e.g., median, standard deviation, etc.
- This same process can also be applied to time-series data of larger clusters (e.g., greater than two unique signals).
- principal component analysis may be preferred for comparing time-series data from a large number of signals.
- the cluster feature value can be extracted from the full data set of the time-series data or from a subset of time-series data. For example, time-series data for acceleration of a component may be divided according to flight phase.
- feature values can be extracted from time-series data for a period of time immediately surrounding a transition from one flight phase to the next (e.g., ten seconds on either side of a flight phase transition point). In some instances a subset of the time-series data may provide a better indication of system operation.
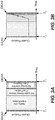
- FIG. 3A is a graphical representation of windows of time between event messages (shown as EICAS messages).
- EICAS messages show EICAS messages.
- an EICAS message at T n -1 has been addressed and the system has resumed healthy operation (e.g., healthy line replaceable unit (LRU) or accessories).
- healthy operation e.g., healthy line replaceable unit (LRU) or accessories.
- LRU healthy line replaceable unit
- immediate or near-term attention may be needed to address the message depending on what it is, noting that not all EICAS messages require the same response.
- a significant period of time occurring over multiple flights of an aircraft separates identical EICAS messages.
- the actionable alerting window indicates a period of time between the two EICAS message time-stamps in which action can be taken to schedule maintenance or minimize service interruption (e.g., pre-position replacement parts or preemptively schedule maintenance at an opportune time and/or location.).
- service interruption e.g., pre-position replacement parts or preemptively schedule maintenance at an opportune time and/or location.
- non-actionable window indicating a period of time over which there is not enough lead time to schedule maintenance or avoid an unplanned service interruption.
- EICAS messages indicating system failure may require immediate attention, whereas other messages can remain on through multiple additional flights without posing a risk to safety or additional maintenance (representing a relatively large actionable alerting window).
- T n -1 can be defined as T n minus a period of time (e.g., T n - three months), reflecting an expectation that the system was healthy at some point in time before the onset of what may be the one and only instance of the particular event message.
- the actionable alerting window is the period of time prior to the event message in which action can be taken to minimize service interruption.
- FIG. 3B is the graphical representation of FIG.
- FIG. 3A with cluster feature values extracted from the two signals discussed above and plotted as a function of time.
- Each cluster feature value data point represents one flight.
- the feature value or the relationship between the two signals in the cluster shows prognostic significance.
- FIG. 3B the cluster feature values remain relatively constant during the time period following the first EICAS message time-stamp when the system is healthy. The feature values begin to significantly drift away from the relatively constant value during the actionable alerting window and continue to drift further during the non-actionable window.
- FIG. 3B does not contain actual data, but is merely used for graphical representation of a feature value that can be used to predict EICAS messages. With respect to the example of the two signals having time-series temperature data, FIG.
- 3B indicates that the mean difference in the temperature between the data of the two signals remains relatively constant over a number of flights.
- This relatively constant mean difference corresponds to the period of time after the first EICAS message has been addressed and the system is expected to be healthy.
- the mean difference in the temperature Prior to the second EICAS message, the mean difference in the temperature begins to increase. In this case, the increase is significant in that it is observable.
- any drift away from a relatively constant value or any change in value in comparison to an earlier period of time when the system is expected to be healthy can be considered significant if it drifts outside of a predicted error range in the data.
- FIG. 3B represents a single example of a successful correlation between signal/cluster feature values and EICAS messages. Not all cluster feature values will exhibit differences within the actionable alerting window. Some may show wide fluctuation through all windows or no change at all. Feature values with significant fluctuation or change in the healthy LRU window may be considered false positives as the fluctuation does not correspond to a need for maintenance.
- Feature values with significant drift in the actionable alerting window are generally considered true positives as they correspond with the impending EICAS time-stamp at T n within a period of time in which action can be taken; whereas, feature values with significant change in the window immediately preceding the EICAS time-stamp at T n are identified as false negatives as they may indicate a need for action, but not with enough lead time to take action without an unplanned interruption in service.
- Significant drift in the window immediately following the EICAS message at T n -1 or immediately preceding the EICAS message at T n may indicate that the particular feature value is not related to or cannot be correlated to the particular EICAS message. This does not mean, however, that the particular feature value could not be used to predict a different EICAS message.
- feature values can be extracted from time-series data collected in multiple flights taken by multiple aircraft.
- feature values from one aircraft that are tagged as falling within the actionable alerting window can be compared with feature values of another aircraft that are tagged as falling within the healthy or efficient operation window to determine prognostic ability.
- FIG. 3B While the process of correlating cluster feature values with EICAS message time-stamps is represented graphically in FIG. 3B , it will be understood by one of ordinary skill in the art that the graph of FIG. 3B is merely used to illustrate the process and that there is no requirement to plot or display the correlation in the precise manner disclosed.
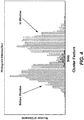
- FIG. 4 is a histogram of cluster feature values according to their corresponding window of time from FIG. 3A .
- window time-stamps Once the window time-stamps are established for a particular EICAS message and cluster feature values are compared as a function of time, most cluster feature values can be tagged as "before window” (healthy operation) or "in window” (actionable alerting window).
- Prognostic signatures of feature values are quantified by assessing the separation of the two normalized histograms (step 18). Specifically, by integrating the intersection of the two normalized histograms, a number between zero and one can be obtained, where one corresponds to no separation and zero corresponds to perfect separation.
- feature values can be extracted from multiple flights from one or more aircraft. For example, the feature values from one aircraft tagged as being “in window” can be compared to feature values from another aircraft tagged as being "before window.”
- the disclosed method can be repeated for all combinations of event messages and signal/cluster feature values.
- the results can be ranked by degree of separation of the histograms in the "before window” and "in window” time periods, with feature values showing high degree of separation being identified as good candidates for prognostic analytic development.
- the disclosed method provides a systematic, robust methodology for identifying which full-flight time-series signals carry relevant information that is prognostic.
- Logical groupings or clusters of signals having complex/cryptic signal names can be identified in an automated fashion.
- Feature values can be extracted from clusters and assessed against all event messages to identify feature values that can be used to predict a particular event message before it occurs.
- feature value/event combinations having predictive capability can be identified.
- any relative terms or terms of degree used herein such as “substantially”, “essentially”, “generally”, “approximately” and the like, should be interpreted in accordance with and subject to any applicable definitions or limits expressly stated herein.
- any relative terms or terms of degree used herein should be interpreted to broadly encompass any relevant disclosed embodiments as well as such ranges or variations as would be understood by a person of ordinary skill in the art in view of the entirety of the present disclosure, such as to encompass ordinary manufacturing tolerance variations, incidental alignment variations, transient alignment or shape variations induced by thermal, rotational or vibrational operational conditions, and the like.
- any relative terms or terms of degree used herein should be interpreted to encompass a range that expressly includes the designated quality, characteristic, parameter or value, without variation, as if no qualifying relative term or term of degree were utilized in the given disclosure or recitation.
- a method is described of identifying time-series signals that contain information useful for predicting impending event messages relating to one or more of safety, maintenance, and system operation information, before they occur.
- the method includes loading a plurality of time-series signals with assigned signal name and associated time-series data into a machine-readable storage medium and grouping the plurality of time-series signals based on textual similarity of the corresponding signal names into a signal cluster.
- the method of the preceding paragraph can optionally include, additionally and/or alternatively, any one or more of the following features, configurations, additional components, and/or steps:
- the method of the preceding paragraph, wherein the step of grouping signals can include comparing a first signal name of a first signal to a second signal name of a second signal character-by-character and assigning a similarity score to indicate the textual similarity between the first and second signal names.
- the similarity score can range from a defined value indicating no similarity of the first and second signal names to a defined value indicating an exact match of the first and second signal names.
- the signal cluster can include a pair of first and second signals with the similarity score exceeding a predefined threshold value and less than a value indicating an exact match.
- the method of any of the preceding paragraphs can further include extracting a feature value from the signal cluster and correlating the cluster feature value with event message time-stamps.
- extracting the feature value can include calculating a relationship between the time-series data of the first and second signals as a function of time.
- the relationship is the cluster feature value.
- time-series data can be collected for a plurality of discrete occurrences separated in time.
- the relationship between the time-series data of the first and second signals as a function of time can be calculated for each of the plurality of discrete occurrences thereby providing a plurality of cluster feature values.
- the plurality of discrete occurrences can include a plurality of flights taken by one or more aircraft.
- each of the cluster feature values can include a value selected from the group consisting of a mean, median, standard deviation, minimum, maximum, and a percentile distribution of the time-series data.
- step of correlating the cluster feature value can include comparing the plurality of cluster feature values as a function of time with event message time-stamps.
- comparing cluster feature values as a function of time can further include identifying a time period preceding an event message time-stamp during which the plurality of cluster feature values in aggregate significantly change in value in comparison to an earlier time period.
- the method of any of the preceding paragraphs can further include identifying an actionable alerting window and a non-actionable window.
- the actionable alerting window can cover a period of time between two consecutive event message time-stamps or a period of time leading up to an event message time-stamp in which action can be taken to minimize a service interruption.
- the non-actionable window can cover a period of time immediately preceding an event message time-stamp.
- the method of any of the preceding paragraphs can further include applying principal component analysis to determine a relationship between the time-series data of for a plurality of at least first and second signals in a cluster as a function of time.
- the relationship is the cluster feature value.
- signal names can be compared for a plurality of signals and the signals can be grouped based on textual similarity of signal names into a plurality of clusters with each cluster comprising a plurality of signals wherein the signal name of each signal in the cluster is compared to the signal name of each of the other signals in the cluster and wherein the similarity score for each comparison exceeds a predefined threshold value.
- each signal cluster can contain a unique set of time-series signals.
- a method of minimizing service interruption of an aircraft includes loading a plurality of time-series signals with an assigned signal name and associated time-series data into a machine-readable storage medium, grouping the plurality of time-series signals based on textual similarity of the corresponding signal names into a signal cluster, extracting a plurality of feature values from the signal cluster, correlating the cluster feature values with event message time-stamps to identify cluster feature values that change in a manner that indicates within an actionable alerting time period that the event message will occur, and using the feature values to predict the event message before it occurs and provide an actionable recommendation.
- the event messages relate to at least one of safety, maintenance, and engine operation.
- the method of the preceding paragraph can optionally include, additionally and/or alternatively, any one or more of the following features, configurations, additional components, and/or steps:
- grouping signals can include comparing a first signal name of a first signal to a second signal name of a second signal character-by-character and assigning a similarity score to indicate the textual similarity between the first and second signal names.
- the signal cluster can include a pair of first and second signals with the similarity score exceeding a predefined threshold value and less than a value indicating an exact match.
Landscapes
- Engineering & Computer Science (AREA)
- Theoretical Computer Science (AREA)
- Data Mining & Analysis (AREA)
- Databases & Information Systems (AREA)
- Physics & Mathematics (AREA)
- General Physics & Mathematics (AREA)
- General Engineering & Computer Science (AREA)
- Bioinformatics & Cheminformatics (AREA)
- Evolutionary Computation (AREA)
- Evolutionary Biology (AREA)
- Computer Vision & Pattern Recognition (AREA)
- Bioinformatics & Computational Biology (AREA)
- Artificial Intelligence (AREA)
- Life Sciences & Earth Sciences (AREA)
- Software Systems (AREA)
- Testing And Monitoring For Control Systems (AREA)
- Testing Of Devices, Machine Parts, Or Other Structures Thereof (AREA)
Abstract
Description
- The present disclosure is generally related to aircraft analytics and, more specifically, to identifying data with predictive capability.
- Modern aircraft are far more complex and produce significantly more data than their earlier counterparts. Full-flight data files sent from airlines contain useful information relative to predicting impending events (e.g., system alerts, maintenance messages, engine-indication and crew-alerting (EICAS) messages, etc.) before they occur, but often contain thousands of time-series signals, most of which have cryptic names (e.g., "OFVLPOS_CARDCTLLF 1Hz_1833"). The current approach for identifying analytics involves subject-matter experts, leveraging years of experience and detailed knowledge of the physics governing aircraft systems. Given the complexity of modern aircraft systems, the requisite engineering experience can take years to accumulate and due to the general separation of systems, solutions posed by subject-matter experts tend to be biased by their particular area of expertise. As such, subject-matter experts often do not see potential opportunities for using information in non-conventional ways outside of their domain. Further, subject-matter experts generally do not have the computer/data science skills needed to process large volumes of newly available data efficiently.
- A systematic and robust methodology is needed for identifying which full-flight time-series signals can be used to predict maintenance and thereby avoid unplanned aircraft service interruptions, while minimizing the need for years' worth of subject-matter expertise.
- A method is described of identifying time-series signals that contain information useful for predicting impending event messages relating to one or more of safety, maintenance, and system operation information, before they occur. The method includes loading a plurality of time-series signals with assigned signal name and associated time-series data into a machine-readable storage medium and grouping the plurality of time-series signals based on textual similarity of the corresponding signal names into a signal cluster.
- A method of minimizing service interruption of an aircraft includes loading a plurality of time-series signals with an assigned signal name and associated time-series data into a machine-readable storage medium, grouping the plurality of time-series signals based on textual similarity of the corresponding signal names into a signal cluster, extracting a plurality of feature values from the signal cluster, correlating the cluster feature values with event message time-stamps to identify cluster feature values that change in a manner that indicates within an actionable alerting time period that the event message will occur, and using the feature values to predict the event message before it occurs and provide an actionable recommendation. The event messages relate to at least one of safety, maintenance, and engine operation.
- The present summary is provided only by way of example, and not limitation. Other aspects of the present disclosure will be appreciated in view of the entirety of the present disclosure, including the entire text, claims and accompanying figures.
-
-
FIG. 1 is a flow chart of a method of the present disclosure. -
FIG. 2A is graphical representation of textual signal clustering. -
FIG. 2B is a graphical representation of textual signal clustering in which the signals ofFIG. 2A have been sorted according to signal name. -
FIG. 3A is a graphical representation of windows of time between engine-indication and crew-alerting system (EICAS) messages. -
FIG. 3B is the graphical representation ofFIG. 3A , including cluster feature data. -
FIG. 4 is a graphical representation of cluster feature data according to their corresponding window of time fromFIG. 3A . - While the above-identified figures set forth embodiments of the present invention, other embodiments are also contemplated, as noted in the discussion. In all cases, this disclosure presents the invention by way of representation and not limitation. It should be understood that numerous other modifications and embodiments can be devised by those skilled in the art, which fall within the scope of the invention as defined by the claims. The figures may not be drawn to scale, and applications and embodiments of the present invention may include features, steps and/or components not specifically shown in the drawings.
- Thousands of time-series signals (e.g., signals that carry data collected by on-board sensors, etc.) are produced during each aircraft flight and may carry information that can be used to avoid unplanned aircraft service interruptions. The present disclosure provides a systematic, robust methodology for identifying which full-flight time-series signals carry relevant information that is prognostic. The current invention leverages information contained within signal names to identify logical groupings in an automated fashion and assesses grouping features against all events where time-stamps indicate system failures, maintenance needs, operation status, safety hazards, and other information tending to require attention in the immediate, near-term, or foreseeable future, to identify useful combinations of signals that could be used to predict the particular events before they occur. In some aircraft, event time-stamps are referred to as engine-indication and crew-alerting system (EICAS) messages. The terms "EICAS messages" and "event messages" and "EICAS message time-stamp" and "event time-stamp" are used interchangeably herein. The ability to predict event messages before they occur will allow for actionable recommendations to be provided to airlines and/or component supply chains to prevent unscheduled service interruptions and to minimize service interruptions when they occur. For instance, if an event message can be predicted, necessary replacement parts can be pre-positioned so that they are available when the service interruption does occur, or the maintenance can be performed at a more opportune time and/or location.
-
FIG. 1 is a flow chart ofmethod 10 for identifying time-series signals that contain information useful for predicting impending event messages. Individual steps ofmethod 10 are described in further detail inFIGS. 2A, 2B ,3A, 3B , and4 . In brief,method 10 includes loading full in-flight time-series signals into a machine-readable storage system (step 12), automatically identifying logical groupings of time-series signals based on textual similarity of signal names and grouping the signals into clusters (step 14), extracting a feature value from the signal cluster (step 16), and correlating cluster feature values extracted over time to event message time-stamps to identify those with prognostic ability (step 18).Steps -
FIG. 2A is graphical representation of textual signal clustering (step 14), in which a list of time-series signal names is plotted on both the x- and y-axes with the list of time-series signal names arranged in the same order on each axis. A processor is used to compare each signal name on the x-axis with each signal name on the y-axis character-by-character and to assign a similarity score to indicate the textual similarity between each pair of signal names (i.e., each signal name on the x-axis paired with each signal name on the y-axis). The similarity score ranges from a defined value indicating no similarity between the signal names to a defined value indicating an exact match of the signal names. For example, a similarity score of zero may indicate that there are no characters that are the same or no character groupings that are the same (e.g., "EMU_N1_VIB_ACCEL_B_R" as compared to "WING ANTI-ICE SW POS"), whereas a similarity score of one may indicate an exact match in signal names (e.g., "WING ANTI-ICE SW POS" as compared to "WING ANTI-ICE SW POS"). A threshold similarity score is defined between the no match and exact match values, indicating a high enough degree of similarity that the likelihood that the signals contain related data is more favorable than not. For example, signal names containing the same name of a component and feature (e.g., "FAN" and "ACCEL") are more likely to have related data than signal names containing different components and/or different features (e.g., "THRUST_REV" and "ANTI-ICE"). An algorithm used for assigning the similarity score can be developed based on the names of signals used in a particular aircraft or a standard naming convention. Every combination of signal names is assigned a similarity score. A light gray box inFIG. 2A indicates pairs of signal names that have a similarity score exceeding the defined threshold value. The diagonal line acrossFIG. 2A indicates exact matches in signal names. All other light gray boxes indicate pairs of non-identical signal names that have a similarity score exceeding the defined threshold value. -
FIG. 2B is a graphical representation of textual signal clustering in which the signal pairs ofFIG. 2A , having non-identical signal names that have a similarity score exceeding the defined threshold, have been sorted according to signal name into clusters. The signal names on the x- and y-axes inFIG. 2B are the same, but are not arranged in the same order relative to the pre-sorted order inFIG. 2A . In this non-limiting embodiment, the signal pairs are sorted using the reverse Cuthill-Mckee ordering algorithm, so that the light gray boxes far from the diagonal move toward the diagonal such that filled-in blocks tend to form. The larger light gray filled-in blocks are referred to herein as clusters. Each cluster contains at least two unique signal names (i.e., not exact matches) and up to an undefined number of signal names. As such, clusters can vary significantly in size. Because the signals are sorted into clusters according to textual similarity of signal names, the size of each cluster is generally defined by the number of signals related to particular component and/or feature (e.g., "THRUST_REV"). For example, there are multiple accelerometers to measure engine vibration, which produces a relatively large cluster as illustrated in the upper left-hand corner ofFIG. 2B . - While the process of textual signal clustering is represented graphically in
FIGS. 2A and 2B , it will be understood by one of ordinary skill in the art that the graphs ofFIGS. 2A and 2B are merely used to illustrate one embodiment of the disclosed process and that there is no requirement to plot or display the clustering of signal names in the exact manner disclosed. - Once the clusters have been defined according to step 14 (
FIGS. 2A and 2B ), time-series signals within a cluster are extracted and the associated time-series data compared to obtain one or more cluster feature values (step 16). Each time-series signal has an associated data file that contains data collected during an event, which, as used herein, refers to a discrete occurrence. In the following examples, the event is a single flight of an aircraft; however, it will be understood by one of ordinary skill in the art that the method disclosed can be adapted for a wide variety of applications and is not limited to flight events or even maintenance predicting applications for an aircraft. During a flight, a variety of sensors and processors are collecting and storing data relating to system operation. Generally, this data is not retrieved from the aircraft until after the flight has ended. At this time, the full-flight data files, with the thousands of time-series signals and associated time-series data can be loaded into a machine-readable medium for storage and eventual processing. The time-series data of each signal in a cluster can be compared to the time-series data of each of the other signals in that same cluster. For ease of discussion, a cluster of size two (having two unique signals) is considered in the following examples. - In a non-limiting cluster size of two, a relationship between the time-series data of one signal and the time-series data of the other signal can be calculated based on the difference between the values of the time-series data. The relationship is referred to herein as a cluster feature value and can include a mean, median, standard deviation, minimum, maximum, or percentile distribution of the difference between time-series data or other statistically-relevant data point that can be obtained for each flight/event, which can be identified as discrete occurrences separated in time. For example, the two signals may each have time-series temperature data for a flight/event. The difference in temperature between the two signals as a function of time can be determined and the mean difference can be calculated. The mean difference is a cluster feature value, which is a single data point. In addition to the mean, other cluster feature values (e.g., median, standard deviation, etc.) can be calculated for the same pair of signals/time-series data. This same process can also be applied to time-series data of larger clusters (e.g., greater than two unique signals). However, to reduce computational demands, principal component analysis may be preferred for comparing time-series data from a large number of signals. The cluster feature value can be extracted from the full data set of the time-series data or from a subset of time-series data. For example, time-series data for acceleration of a component may be divided according to flight phase. In some embodiments, feature values can be extracted from time-series data for a period of time immediately surrounding a transition from one flight phase to the next (e.g., ten seconds on either side of a flight phase transition point). In some instances a subset of the time-series data may provide a better indication of system operation.
- The cluster feature value is calculated for the two signals in the above example for each flight to obtain multiple cluster feature values, which can be compared as a function of time to event messages.
FIG. 3A is a graphical representation of windows of time between event messages (shown as EICAS messages). In the present example, an EICAS message at T n-1 has been addressed and the system has resumed healthy operation (e.g., healthy line replaceable unit (LRU) or accessories). The next time the same EICAS message is sent occurs at T n . At this point, immediate or near-term attention may be needed to address the message depending on what it is, noting that not all EICAS messages require the same response. Generally, a significant period of time occurring over multiple flights of an aircraft, separates identical EICAS messages. As illustrated inFIG. 3A , there is a period of time between EICAS messages (at T n-1 and T n ) during which the system is healthy or operating effectively without the need for maintenance. Following this window, there is an actionable alerting window. The actionable alerting window indicates a period of time between the two EICAS message time-stamps in which action can be taken to schedule maintenance or minimize service interruption (e.g., pre-position replacement parts or preemptively schedule maintenance at an opportune time and/or location.). Immediately preceding the second EICAS message time-stamp, there is a non-actionable window, indicating a period of time over which there is not enough lead time to schedule maintenance or avoid an unplanned service interruption. It will be understood by one of ordinary skill in the art that the actual length of each period of time for the identified windows can vary widely depending on the type of EICAS message. For example, EICAS messages indicating system failure may require immediate attention, whereas other messages can remain on through multiple additional flights without posing a risk to safety or additional maintenance (representing a relatively large actionable alerting window). - In some instances, only a single event (EICAS) message time-stamp may be present in the time-series data (e.g., identifying the one and only event of a particular kind). When only one event message time-stamp is present, T n-1 can be defined as T n minus a period of time (e.g., T n - three months), reflecting an expectation that the system was healthy at some point in time before the onset of what may be the one and only instance of the particular event message. In this case, the actionable alerting window is the period of time prior to the event message in which action can be taken to minimize service interruption.
FIG. 3B is the graphical representation ofFIG. 3A with cluster feature values extracted from the two signals discussed above and plotted as a function of time. Each cluster feature value data point represents one flight. In this case, the feature value or the relationship between the two signals in the cluster shows prognostic significance. As shown inFIG. 3B , the cluster feature values remain relatively constant during the time period following the first EICAS message time-stamp when the system is healthy. The feature values begin to significantly drift away from the relatively constant value during the actionable alerting window and continue to drift further during the non-actionable window.FIG. 3B does not contain actual data, but is merely used for graphical representation of a feature value that can be used to predict EICAS messages. With respect to the example of the two signals having time-series temperature data,FIG. 3B indicates that the mean difference in the temperature between the data of the two signals remains relatively constant over a number of flights. This relatively constant mean difference corresponds to the period of time after the first EICAS message has been addressed and the system is expected to be healthy. Prior to the second EICAS message, the mean difference in the temperature begins to increase. In this case, the increase is significant in that it is observable. As used herein, any drift away from a relatively constant value or any change in value in comparison to an earlier period of time when the system is expected to be healthy can be considered significant if it drifts outside of a predicted error range in the data. The rise in the mean difference in temperature is first observed within the actionable alerting window, which indicates that this particular feature value (and combination of signals) may be used to predict the occurrence of an EICAS message before it occurs and avoid unplanned service interruption.FIG. 3B represents a single example of a successful correlation between signal/cluster feature values and EICAS messages. Not all cluster feature values will exhibit differences within the actionable alerting window. Some may show wide fluctuation through all windows or no change at all. Feature values with significant fluctuation or change in the healthy LRU window may be considered false positives as the fluctuation does not correspond to a need for maintenance. Feature values with significant drift in the actionable alerting window are generally considered true positives as they correspond with the impending EICAS time-stamp at T n within a period of time in which action can be taken; whereas, feature values with significant change in the window immediately preceding the EICAS time-stamp at T n are identified as false negatives as they may indicate a need for action, but not with enough lead time to take action without an unplanned interruption in service. Significant drift in the window immediately following the EICAS message at T n-1 or immediately preceding the EICAS message at T n may indicate that the particular feature value is not related to or cannot be correlated to the particular EICAS message. This does not mean, however, that the particular feature value could not be used to predict a different EICAS message. - While the example provided in
FIG. 3B represents feature values extracted from time-series data collected in multiple flights taken by a single aircraft, in alternative embodiments, feature values can be extracted from time-series data collected in multiple flights taken by multiple aircraft. In this case, feature values from one aircraft that are tagged as falling within the actionable alerting window can be compared with feature values of another aircraft that are tagged as falling within the healthy or efficient operation window to determine prognostic ability. - As discussed with respect to
FIGS. 2A and 2B , while the process of correlating cluster feature values with EICAS message time-stamps is represented graphically inFIG. 3B , it will be understood by one of ordinary skill in the art that the graph ofFIG. 3B is merely used to illustrate the process and that there is no requirement to plot or display the correlation in the precise manner disclosed. -
FIG. 4 is a histogram of cluster feature values according to their corresponding window of time fromFIG. 3A . Once the window time-stamps are established for a particular EICAS message and cluster feature values are compared as a function of time, most cluster feature values can be tagged as "before window" (healthy operation) or "in window" (actionable alerting window). Prognostic signatures of feature values are quantified by assessing the separation of the two normalized histograms (step 18). Specifically, by integrating the intersection of the two normalized histograms, a number between zero and one can be obtained, where one corresponds to no separation and zero corresponds to perfect separation. If there is no separation (i.e., the feature values completely overlap), the feature value does not provide a prognostic signature and cannot be used to predict the particular EICAS message. If there is complete separation (i.e., no overlap in the feature values in the "before window" and "in window"), the feature value may be a good candidate for use in predicting that particular EICAS message before it occurs. As discussed with respect toFIG. 3B , feature values can be extracted from multiple flights from one or more aircraft. For example, the feature values from one aircraft tagged as being "in window" can be compared to feature values from another aircraft tagged as being "before window." - The disclosed method can be repeated for all combinations of event messages and signal/cluster feature values. The results can be ranked by degree of separation of the histograms in the "before window" and "in window" time periods, with feature values showing high degree of separation being identified as good candidates for prognostic analytic development.
- The disclosed method provides a systematic, robust methodology for identifying which full-flight time-series signals carry relevant information that is prognostic. Logical groupings or clusters of signals having complex/cryptic signal names can be identified in an automated fashion. Feature values can be extracted from clusters and assessed against all event messages to identify feature values that can be used to predict a particular event message before it occurs. Through automated signal clustering and assessing all cluster feature values against all event messages, feature value/event combinations having predictive capability can be identified.
- Any relative terms or terms of degree used herein, such as "substantially", "essentially", "generally", "approximately" and the like, should be interpreted in accordance with and subject to any applicable definitions or limits expressly stated herein. In all instances, any relative terms or terms of degree used herein should be interpreted to broadly encompass any relevant disclosed embodiments as well as such ranges or variations as would be understood by a person of ordinary skill in the art in view of the entirety of the present disclosure, such as to encompass ordinary manufacturing tolerance variations, incidental alignment variations, transient alignment or shape variations induced by thermal, rotational or vibrational operational conditions, and the like. Moreover, any relative terms or terms of degree used herein should be interpreted to encompass a range that expressly includes the designated quality, characteristic, parameter or value, without variation, as if no qualifying relative term or term of degree were utilized in the given disclosure or recitation.
- The following are non-exclusive descriptions of possible embodiments of the present invention.
- A method is described of identifying time-series signals that contain information useful for predicting impending event messages relating to one or more of safety, maintenance, and system operation information, before they occur. The method includes loading a plurality of time-series signals with assigned signal name and associated time-series data into a machine-readable storage medium and grouping the plurality of time-series signals based on textual similarity of the corresponding signal names into a signal cluster.
- The method of the preceding paragraph can optionally include, additionally and/or alternatively, any one or more of the following features, configurations, additional components, and/or steps:
The method of the preceding paragraph, wherein the step of grouping signals can include comparing a first signal name of a first signal to a second signal name of a second signal character-by-character and assigning a similarity score to indicate the textual similarity between the first and second signal names. - The method of any of the preceding paragraphs, wherein the similarity score can range from a defined value indicating no similarity of the first and second signal names to a defined value indicating an exact match of the first and second signal names.
- The method of any of the preceding paragraphs, wherein the signal cluster can include a pair of first and second signals with the similarity score exceeding a predefined threshold value and less than a value indicating an exact match.
- The method of any of the preceding paragraphs can further include extracting a feature value from the signal cluster and correlating the cluster feature value with event message time-stamps.
- The method of any of the preceding paragraphs, wherein extracting the feature value can include calculating a relationship between the time-series data of the first and second signals as a function of time. The relationship is the cluster feature value.
- The method of any of the preceding paragraphs, wherein the time-series data can be collected for a plurality of discrete occurrences separated in time. The relationship between the time-series data of the first and second signals as a function of time can be calculated for each of the plurality of discrete occurrences thereby providing a plurality of cluster feature values.
- The method of any of the preceding paragraphs, wherein the plurality of discrete occurrences can include a plurality of flights taken by one or more aircraft.
- The method of any of the preceding paragraphs, wherein each of the cluster feature values can include a value selected from the group consisting of a mean, median, standard deviation, minimum, maximum, and a percentile distribution of the time-series data.
- The method of any of the preceding paragraphs, wherein the step of correlating the cluster feature value can include comparing the plurality of cluster feature values as a function of time with event message time-stamps.
- The method of any of the preceding paragraphs, wherein comparing cluster feature values as a function of time can further include identifying a time period preceding an event message time-stamp during which the plurality of cluster feature values in aggregate significantly change in value in comparison to an earlier time period.
- The method of any of the preceding paragraphs can further include identifying an actionable alerting window and a non-actionable window. The actionable alerting window can cover a period of time between two consecutive event message time-stamps or a period of time leading up to an event message time-stamp in which action can be taken to minimize a service interruption. The non-actionable window can cover a period of time immediately preceding an event message time-stamp.
- The method of any of the preceding paragraphs, wherein the time period over which feature values significantly drift away from the relatively constant value is within the actionable alerting window.
- The method of any of the preceding paragraphs can further include applying principal component analysis to determine a relationship between the time-series data of for a plurality of at least first and second signals in a cluster as a function of time. The relationship is the cluster feature value.
- The method of any of the preceding paragraphs, wherein signal names can be compared for a plurality of signals and the signals can be grouped based on textual similarity of signal names into a plurality of clusters with each cluster comprising a plurality of signals wherein the signal name of each signal in the cluster is compared to the signal name of each of the other signals in the cluster and wherein the similarity score for each comparison exceeds a predefined threshold value.
- The method of any of the preceding paragraphs, wherein the step of correlating the cluster feature value with event message time-stamps can be conducted for a plurality of clusters.
- The method of any of the preceding paragraphs, wherein the plurality of time-series signals can be grouped into a plurality of signal clusters based on textual similarity of the corresponding signal names.
- The method of any of the preceding paragraphs, wherein each signal cluster can contain a unique set of time-series signals.
- A method of minimizing service interruption of an aircraft includes loading a plurality of time-series signals with an assigned signal name and associated time-series data into a machine-readable storage medium, grouping the plurality of time-series signals based on textual similarity of the corresponding signal names into a signal cluster, extracting a plurality of feature values from the signal cluster, correlating the cluster feature values with event message time-stamps to identify cluster feature values that change in a manner that indicates within an actionable alerting time period that the event message will occur, and using the feature values to predict the event message before it occurs and provide an actionable recommendation. The event messages relate to at least one of safety, maintenance, and engine operation.
- The method of the preceding paragraph can optionally include, additionally and/or alternatively, any one or more of the following features, configurations, additional components, and/or steps:
- The method of the preceding paragraph, wherein grouping signals can include comparing a first signal name of a first signal to a second signal name of a second signal character-by-character and assigning a similarity score to indicate the textual similarity between the first and second signal names. The signal cluster can include a pair of first and second signals with the similarity score exceeding a predefined threshold value and less than a value indicating an exact match.
- While the invention has been described with reference to an exemplary embodiment(s), it will be understood by those skilled in the art that various changes may be made and equivalents may be substituted for elements thereof without departing from the scope of the invention. In addition, many modifications may be made to adapt a particular situation or material to the teachings of the invention without departing from the scope thereof. Therefore, it is intended that the invention not be limited to the particular embodiment(s) disclosed, but that the invention will include all embodiments falling within the scope of the appended claims.
Claims (15)
- A method of identifying time-series signals that contain information useful for predicting impending event messages relating to one or more of safety, maintenance, and system operation information, before they occur, the method comprising:Loading (12) a plurality of time-series signals into a machine-readable storage medium, wherein each signal has an assigned signal name and associated time-series data; andGrouping (14) the plurality of time-series signals based on textual similarity of the corresponding signal names into a signal cluster.
- The method of claim 1, wherein the step of grouping signals comprises:
comparing a first signal name of a first signal to a second signal name of a second signal character-by-character and assigning a similarity score to indicate the textual similarity between the first and second signal names. - The method of claim 2, wherein the similarity score ranges from a defined value indicating no similarity of the first and second signal names to a defined value indicating an exact match of the first and second signal names.
- The method of claim 2, wherein the signal cluster comprises a pair of first and second signals with the similarity score exceeding a predefined threshold value and less than a value indicating an exact match.
- The method of claim 2, and further comprising:Extracting (16) a feature value from the signal cluster; andCorrelating (18) the cluster feature value with event message time-stamps, and preferably wherein the step of correlating the cluster feature value with event message time-stamps is conducted for a plurality of clusters.
- The method of claim 5, wherein extracting the feature value comprises:
calculating a relationship between the time-series data of the first and second signals as a function of time, wherein the relationship is the cluster feature value. - The method of claim 6, wherein the time-series data is collected for a plurality of discrete occurrences separated in time, and wherein the relationship between the time-series data of the first and second signals as a function of time is calculated for each of the plurality of discrete occurrences thereby providing a plurality of cluster feature values, and preferably wherein each of the cluster feature values comprises a value selected from the group consisting of a mean, median, standard deviation, minimum, maximum, and a percentile distribution of the time-series data.
- The method of claim 7, wherein the plurality of discrete occurrences comprises a plurality of flights taken by one or more aircraft.
- The method of claim 7, wherein the step of correlating the cluster feature value comprises:comparing the plurality of cluster feature values as a function of time with event message time-stamps, and preferably wherein comparing cluster feature values as a function of time further comprises:identifying a time period preceding an event message time-stamp during which the plurality of cluster feature values in aggregate significantly change in value in comparison to an earlier time period.
- The method of claim 9 and further comprising:
identifying an actionable alerting window and a non-actionable window, wherein the actionable alerting window covers a period of time between two consecutive event message time-stamps or a period of time leading up to an event message time-stamp in which action can be taken to minimize a service interruption and wherein the non-actionable window covers a period of time immediately preceding an event message time-stamp. - The method of claim 10, wherein the time period over which feature values significantly drift away from the relatively constant value is within the actionable alerting window.
- The method of claim 5, and further comprising:
applying principal component analysis to determine a relationship between the time-series data of for a plurality of at least first and second signals in a cluster as a function of time, wherein the relationship is the cluster feature value. - The method of claim 5, wherein signal names are compared for a plurality of signals and wherein signals are grouped based on textual similarity of signal names into a plurality of clusters with each cluster comprising a plurality of signals wherein the signal name of each signal in the cluster is compared to the signal name of each of the other signals in the cluster and wherein the similarity score for each comparison exceeds a predefined threshold value.
- The method of claim 5, wherein the plurality of time-series signals are grouped into a plurality of signal clusters based on textual similarity of the corresponding signal names, and preferably wherein each signal cluster contains a unique set of time-series signals.
- A method of minimizing service interruption of an aircraft, the method comprising the method of claim 1, 2, 3 or 4 and further comprising:extracting a plurality of feature values from the signal cluster;correlating the cluster feature values with event message time-stamps to identify cluster feature values that change in a manner that indicates within an actionable alerting time period that the event message will occur; andusing the feature values to predict the event message before it occurs and provide an actionable recommendation;wherein event messages relate to one or more of safety, maintenance, and engine operation.
Applications Claiming Priority (1)
| Application Number | Priority Date | Filing Date | Title |
|---|---|---|---|
| US15/940,100 US11055319B2 (en) | 2018-03-29 | 2018-03-29 | Data-driven features via signal clustering |
Publications (1)
| Publication Number | Publication Date |
|---|---|
| EP3547217A1 true EP3547217A1 (en) | 2019-10-02 |
Family
ID=66041223
Family Applications (1)
| Application Number | Title | Priority Date | Filing Date |
|---|---|---|---|
| EP19166196.6A Withdrawn EP3547217A1 (en) | 2018-03-29 | 2019-03-29 | Data-driven features via signal clustering |
Country Status (2)
| Country | Link |
|---|---|
| US (1) | US11055319B2 (en) |
| EP (1) | EP3547217A1 (en) |
Families Citing this family (3)
| Publication number | Priority date | Publication date | Assignee | Title |
|---|---|---|---|---|
| CN112199361A (en) * | 2020-09-27 | 2021-01-08 | 富璟科技(深圳)有限公司 | Database redundant information processing method |
| CN112818922B (en) * | 2021-02-25 | 2022-08-02 | 上海数川数据科技有限公司 | Shop assistant identification method based on image |
| US12135782B2 (en) * | 2022-05-27 | 2024-11-05 | The Boeing Company | System, method, and program for analyzing vehicle system logs |
Citations (1)
| Publication number | Priority date | Publication date | Assignee | Title |
|---|---|---|---|---|
| WO2014093670A1 (en) * | 2012-12-12 | 2014-06-19 | University Of North Dakota | Analyzing flight data using predictive models |
Family Cites Families (8)
| Publication number | Priority date | Publication date | Assignee | Title |
|---|---|---|---|---|
| US7197503B2 (en) | 2002-11-26 | 2007-03-27 | Honeywell International Inc. | Intelligent retrieval and classification of information from a product manual |
| US7552005B2 (en) | 2004-03-16 | 2009-06-23 | Honeywell International Inc. | Method for fault diagnosis of a turbine engine |
| US7693643B2 (en) | 2005-02-14 | 2010-04-06 | Honeywell International Inc. | Fault detection system and method for turbine engine fuel systems |
| US20070088550A1 (en) * | 2005-10-13 | 2007-04-19 | Dimitar Filev | Method for predictive maintenance of a machine |
| US9919712B1 (en) * | 2015-08-10 | 2018-03-20 | Rockwell Collins, Inc. | Crew biometrics and aircraft data analysis with real-time and proactive actions |
| US11423053B2 (en) * | 2016-01-30 | 2022-08-23 | Micro Focus Llc | Log event cluster analytics management |
| US10489229B2 (en) * | 2016-02-29 | 2019-11-26 | International Business Machines Corporation | Analyzing computing system logs to predict events with the computing system |
| US10650614B2 (en) * | 2017-09-29 | 2020-05-12 | The Boeing Company | Aircraft maintenance event prediction using higher-level and lower-level system information |
-
2018
- 2018-03-29 US US15/940,100 patent/US11055319B2/en active Active
-
2019
- 2019-03-29 EP EP19166196.6A patent/EP3547217A1/en not_active Withdrawn
Patent Citations (1)
| Publication number | Priority date | Publication date | Assignee | Title |
|---|---|---|---|---|
| WO2014093670A1 (en) * | 2012-12-12 | 2014-06-19 | University Of North Dakota | Analyzing flight data using predictive models |
Non-Patent Citations (1)
| Title |
|---|
| LISHUAI LI ET AL: "Anomaly Detection in Airline Routine Operations Using Flight Data Recorder Data", 1 January 2009 (2009-01-01), XP055602418, Retrieved from the Internet <URL:https://pdfs.semanticscholar.org/7fa6/b75198c7b5f4a61642bbc896ca3c47755412.pdf> * |
Also Published As
| Publication number | Publication date |
|---|---|
| US20190303492A1 (en) | 2019-10-03 |
| US11055319B2 (en) | 2021-07-06 |
Similar Documents
| Publication | Publication Date | Title |
|---|---|---|
| EP3751478B1 (en) | Maintenance recommendations using lifecycle clustering | |
| US8112368B2 (en) | Method, apparatus and computer program product for predicting a fault utilizing multi-resolution classifier fusion | |
| CN109032824B (en) | Database verification method, database verification device, computer equipment and storage medium | |
| US11341463B2 (en) | Blockchain ledger entry upon maintenance of asset and anomaly detection correction | |
| CN103080954B (en) | Method and system for analyzing flight data recorded during flight of an aircraft | |
| US10503145B2 (en) | System and method for asset fleet monitoring and predictive diagnostics using analytics for large and varied data sources | |
| US11899527B2 (en) | Systems and methods for identifying machine anomaly root cause based on a selected reduced order model and a selected fault model | |
| US11055319B2 (en) | Data-driven features via signal clustering | |
| CN106156355B (en) | Log processing method and device | |
| US20190087789A1 (en) | Reporting and prioritizing faults for aircraft downtime reduction | |
| US20090228160A1 (en) | Method, Apparatus And Computer Program Product For Predicting And Avoiding A Fault | |
| US20110040470A1 (en) | Starter Control Valve Failure Prediction Machine To Predict and Trend Starter Control Valve Failures In Gas Turbine Engines Using A Starter Control Valve Health Prognostic, Program Product and Related Methods | |
| CN107463161A (en) | Predict the method and system and monitoring system of the failure in aircraft | |
| US11291077B2 (en) | Internet of things sensor major and minor event blockchain decisioning | |
| US20190102957A1 (en) | Aircraft maintenance event prediction using higher-level and lower-level system information | |
| US10032322B2 (en) | Validation tool for an aircraft engine monitoring system | |
| CN114104329B (en) | Automatic prediction of repair based on sensor data | |
| JP2019511061A (en) | System and method for determining aircraft data recording frame configuration with a focus on maintenance | |
| CN109272599A (en) | A kind of data processing method and relevant device | |
| Jammal et al. | Predictive Maintenance of Aircraft Braking Systems: A Machine Learning Approach to Clustering Brake Wear Patterns | |
| US20240053739A1 (en) | Remaining useful life prediction for machine components | |
| Azevedo et al. | Estimation of health indicators using advanced analytics for prediction of aircraft systems remaining useful lifetime | |
| US12067392B2 (en) | Providing access to historical metadata for software repositories | |
| JP6638260B2 (en) | Information providing apparatus, information providing method, and program | |
| Burnaev | On construction of early warning systems for predictive maintenance in aerospace industry |
Legal Events
| Date | Code | Title | Description |
|---|---|---|---|
| PUAI | Public reference made under article 153(3) epc to a published international application that has entered the european phase |
Free format text: ORIGINAL CODE: 0009012 |
|
| STAA | Information on the status of an ep patent application or granted ep patent |
Free format text: STATUS: THE APPLICATION HAS BEEN PUBLISHED |
|
| AK | Designated contracting states |
Kind code of ref document: A1 Designated state(s): AL AT BE BG CH CY CZ DE DK EE ES FI FR GB GR HR HU IE IS IT LI LT LU LV MC MK MT NL NO PL PT RO RS SE SI SK SM TR |
|
| AX | Request for extension of the european patent |
Extension state: BA ME |
|
| STAA | Information on the status of an ep patent application or granted ep patent |
Free format text: STATUS: REQUEST FOR EXAMINATION WAS MADE |
|
| 17P | Request for examination filed |
Effective date: 20191121 |
|
| RBV | Designated contracting states (corrected) |
Designated state(s): AL AT BE BG CH CY CZ DE DK EE ES FI FR GB GR HR HU IE IS IT LI LT LU LV MC MK MT NL NO PL PT RO RS SE SI SK SM TR |
|
| STAA | Information on the status of an ep patent application or granted ep patent |
Free format text: STATUS: EXAMINATION IS IN PROGRESS |
|
| 17Q | First examination report despatched |
Effective date: 20210311 |
|
| STAA | Information on the status of an ep patent application or granted ep patent |
Free format text: STATUS: THE APPLICATION HAS BEEN WITHDRAWN |
|
| 18W | Application withdrawn |
Effective date: 20250212 |