EP3546941A1 - Nanoparticle measurement device, analysis device, and analysis method - Google Patents
Nanoparticle measurement device, analysis device, and analysis method Download PDFInfo
- Publication number
- EP3546941A1 EP3546941A1 EP19164799.9A EP19164799A EP3546941A1 EP 3546941 A1 EP3546941 A1 EP 3546941A1 EP 19164799 A EP19164799 A EP 19164799A EP 3546941 A1 EP3546941 A1 EP 3546941A1
- Authority
- EP
- European Patent Office
- Prior art keywords
- low
- frequency component
- track
- timing signal
- reaction region
- Prior art date
- Legal status (The legal status is an assumption and is not a legal conclusion. Google has not performed a legal analysis and makes no representation as to the accuracy of the status listed.)
- Granted
Links
Images





Classifications
-
- G—PHYSICS
- G01—MEASURING; TESTING
- G01N—INVESTIGATING OR ANALYSING MATERIALS BY DETERMINING THEIR CHEMICAL OR PHYSICAL PROPERTIES
- G01N35/00—Automatic analysis not limited to methods or materials provided for in any single one of groups G01N1/00 - G01N33/00; Handling materials therefor
- G01N35/00029—Automatic analysis not limited to methods or materials provided for in any single one of groups G01N1/00 - G01N33/00; Handling materials therefor provided with flat sample substrates, e.g. slides
- G01N35/00069—Automatic analysis not limited to methods or materials provided for in any single one of groups G01N1/00 - G01N33/00; Handling materials therefor provided with flat sample substrates, e.g. slides whereby the sample substrate is of the bio-disk type, i.e. having the format of an optical disk
-
- G—PHYSICS
- G01—MEASURING; TESTING
- G01N—INVESTIGATING OR ANALYSING MATERIALS BY DETERMINING THEIR CHEMICAL OR PHYSICAL PROPERTIES
- G01N33/00—Investigating or analysing materials by specific methods not covered by groups G01N1/00 - G01N31/00
- G01N33/48—Biological material, e.g. blood, urine; Haemocytometers
- G01N33/50—Chemical analysis of biological material, e.g. blood, urine; Testing involving biospecific ligand binding methods; Immunological testing
- G01N33/53—Immunoassay; Biospecific binding assay; Materials therefor
- G01N33/543—Immunoassay; Biospecific binding assay; Materials therefor with an insoluble carrier for immobilising immunochemicals
- G01N33/54366—Apparatus specially adapted for solid-phase testing
- G01N33/54373—Apparatus specially adapted for solid-phase testing involving physiochemical end-point determination, e.g. wave-guides, FETS, gratings
-
- G—PHYSICS
- G01—MEASURING; TESTING
- G01N—INVESTIGATING OR ANALYSING MATERIALS BY DETERMINING THEIR CHEMICAL OR PHYSICAL PROPERTIES
- G01N33/00—Investigating or analysing materials by specific methods not covered by groups G01N1/00 - G01N31/00
- G01N33/48—Biological material, e.g. blood, urine; Haemocytometers
- G01N33/50—Chemical analysis of biological material, e.g. blood, urine; Testing involving biospecific ligand binding methods; Immunological testing
- G01N33/53—Immunoassay; Biospecific binding assay; Materials therefor
- G01N33/543—Immunoassay; Biospecific binding assay; Materials therefor with an insoluble carrier for immobilising immunochemicals
- G01N33/54353—Immunoassay; Biospecific binding assay; Materials therefor with an insoluble carrier for immobilising immunochemicals with ligand attached to the carrier via a chemical coupling agent
-
- G—PHYSICS
- G01—MEASURING; TESTING
- G01N—INVESTIGATING OR ANALYSING MATERIALS BY DETERMINING THEIR CHEMICAL OR PHYSICAL PROPERTIES
- G01N33/00—Investigating or analysing materials by specific methods not covered by groups G01N1/00 - G01N31/00
- G01N33/48—Biological material, e.g. blood, urine; Haemocytometers
- G01N33/50—Chemical analysis of biological material, e.g. blood, urine; Testing involving biospecific ligand binding methods; Immunological testing
- G01N33/53—Immunoassay; Biospecific binding assay; Materials therefor
- G01N33/543—Immunoassay; Biospecific binding assay; Materials therefor with an insoluble carrier for immobilising immunochemicals
- G01N33/54366—Apparatus specially adapted for solid-phase testing
-
- G—PHYSICS
- G01—MEASURING; TESTING
- G01N—INVESTIGATING OR ANALYSING MATERIALS BY DETERMINING THEIR CHEMICAL OR PHYSICAL PROPERTIES
- G01N33/00—Investigating or analysing materials by specific methods not covered by groups G01N1/00 - G01N31/00
- G01N33/48—Biological material, e.g. blood, urine; Haemocytometers
- G01N33/50—Chemical analysis of biological material, e.g. blood, urine; Testing involving biospecific ligand binding methods; Immunological testing
- G01N33/53—Immunoassay; Biospecific binding assay; Materials therefor
- G01N33/543—Immunoassay; Biospecific binding assay; Materials therefor with an insoluble carrier for immobilising immunochemicals
- G01N33/54366—Apparatus specially adapted for solid-phase testing
- G01N33/54386—Analytical elements
Definitions
- the present disclosure relates to a nanoparticle measurement device, an analysis device, and an analysis method for analyzing biomaterials such as antigens and antibodies.
- Immunoassays are known to quantitatively analyze disease detection and therapeutic effects by detecting particular antigens or antibodies as biomarkers associated with diseases.
- Japanese Unexamined Patent Application Publication No. 2015-127691 discloses an analysis device in which antibodies that are fixed to a reaction region on a disc for specimen analysis are allowed to bind to antigens in a sample, and the antigens are labeled by nanoparticles having antibodies and then are scanned with laser light emitted from an optical pickup so as to detect the nanoparticles captured on the reaction region.
- the analysis device disclosed in Japanese Patent Application Publication No. 2015-127691 is an optical disc device utilized for detecting a specimen.
- the specimen analysis disc may be warped during the process of forming the reaction region on the disc.
- the warp of the specimen analysis disc causes a tilt on the surface on which the reaction region is formed.
- detection signals for detecting nanoparticles captured on the reaction region cause fluctuation of low-frequency components because of the tilt on the surface of the specimen analysis disc.
- the fluctuation of the low-frequency components decreases the accuracy of detecting the nanoparticles.
- the warp of the specimen analysis disc thus leads to the deterioration of detection accuracy of nanoparticles.
- Japanese Unexamined Patent Application Publication No. 2001-126261 discloses an optical disc device with a reduced influence of a warp on an optical disc.
- the optical disc device disclosed in Japanese Patent Application Publication No. 2001-126261 can reduce the influence of the warp on the optical disc in the radial direction, but cannot deal with the influence of the warp in the tangential direction.
- the present disclosure provides a nanoparticle measurement device, an analysis device, and an analysis method capable of reducing the influence of fluctuation of low-frequency components derived from a warp of a specimen analysis disc so as to suppress a decrease in accuracy of detecting nanoparticles caused by the fluctuation of the low-frequency components.
- a first aspect of one or more embodiments provides a nanoparticle measurement device including: a timing signal generation unit configured to generate a first timing signal corresponding to a first track interval in a reaction region formed in a disc for specimen analysis having a plurality of tracks on which nanoparticles binding to substances to be detected are captured per track, and a second timing signal corresponding to a second track interval different from the reaction region, the tracks being formed from an inner side to an outer side of the disc for specimen analysis; a low-frequency component extraction unit configured to extract a low-frequency component fluctuating because of a warp of the disc for specimen analysis from a light reception signal according to the second timing signal, the light reception signal being generated when a laser light is radiated to the reaction region and a reflected light is received from the reaction region; a low-frequency component calculation unit configured to calculate an interpolated low-frequency component corresponding to the first track interval and interpolated in accordance with the low-frequency component; a threshold correction unit configured to correct a predetermined threshold in accordance with the interpolated
- a second aspect of one or more embodiments provides an analysis device including: a turntable holding a disc for specimen analysis; a turntable drive unit configured to rotate the turntable; a turntable drive circuit configured to control the turntable drive unit; an optical pickup driven in a direction perpendicular to a rotation axis of the turntable, and configured to emit a laser light to a reaction region, receive a reflected light from the reaction region, and generate a light reception signal; an optical pickup drive circuit configured to control an operation of the optical pickup; and a controller configured to control the turntable drive circuit and the optical pickup drive circuit, wherein the controller comprises the above-described nanoparticle measurement device.
- a third aspect of one or more embodiments provides an analysis method including: rotating a disc for specimen analysis having a plurality of tracks formed from an inner side to an outer side and having a reaction region on which nanoparticles binding to substances to be detected are captured per track; radiating a laser light to the reaction region per track; receiving a reflected light from the reaction region to generate a light reception signal; generating a first timing signal corresponding to a first track interval in the reaction region, and a second timing signal corresponding to a second track interval different from the reaction region; extracting a low-frequency component fluctuating because of a warp of the disc for specimen analysis from the light reception signal according to the second timing signal; calculating an interpolated low-frequency component corresponding to the first track interval and interpolated in accordance with the low-frequency component; correcting a predetermined threshold in accordance with the interpolated low-frequency component to set a corrected threshold; extracting nanoparticle pulse signals from the light reception signal according to the first timing signal and the corrected threshold; and counting the nanoparticle pulse signals
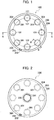
- FIG. 1 is a view showing the detection-target-substance capture unit as viewed from the cartridge side.
- Fig. 2 is a view showing the detection-target-substance capture unit as viewed from the specimen analysis disc side.
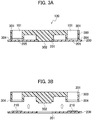
- Fig. 3A is a cross-sectional view of the detection-target-substance capture unit taken along line A-A in Fig. 1 .
- Fig. 3B is a view illustrating a state in which the cartridge is removed from the specimen analysis disc.
- Fig. 4 is a partly-enlarged view of a well shown in Fig. 1 taken along line B-B in Fig. 1 .
- the detection-target-substance capture unit 100 includes the specimen analysis disc 200 and the cartridge 300.
- the specimen analysis disc 200 is formed into a circular shape having substantially the same dimensions as optical discs such as Blu-ray discs (BDs), DVDs, and compact discs (CDs).
- the specimen analysis disc 200 is formed of resin material such as polycarbonate resin and cycloolefin polymer, commonly used for optical discs.
- the specimen analysis disc 200 is not limited to the optical discs described above, and may be any optical disc according to other embodiments or conforming to prescribed standards.
- the specimen analysis disc 200 has a center hole 201 formed in the middle of the disc, and a slit 202 provided at the circumferential edge of the disc.
- the slit 202 serves as a reference-position defining portion for defining a reference position of the specimen analysis disc 200.
- the surface of the specimen analysis disc 200 includes track regions 205 provided with convex regions 203 and recesses 204 alternately arranged in a radial direction.
- the convex regions 203 and the recesses 204 are formed in a spiral or concentric state from the inner side to the outer side of the specimen analysis disc 200.
- the convex regions 203 correspond to lands of an optical disc.
- the recesses 204 correspond to grooves of an optical disc, and correspond to tracks of the specimen analysis disc 200.
- the specimen analysis disc 200 thus includes a plurality of tracks formed from the inner side to the outer side.
- a track pitch of the recesses 204 in the radial direction is 320 nanometers (nm), for example.
- the cartridge 300 is provided with a plurality of cylindrical penetration holes 301 along the circumferential direction.
- the penetration holes 301 are arranged at regular intervals such that the respective center points are located on the common circle.
- the cartridge 300 includes a convex portion 302 in the middle, a convex portion 303 at the circumferential edge, and a plurality of seal members 304 corresponding to the penetration holes 301 at the circumferential edge.
- the seal members 304 are ring-like gaskets formed of elastically-deformable material such as silicone rubber, for example.
- the seal members 304 are placed around the respective penetration holes 301.
- the convex portion 302 When the cartridge 300 is attached to the specimen analysis disc 200, the convex portion 302 is inserted into the center hole 201 of the specimen analysis disc 200, and the convex portion 303 is inserted into the slit 202 so as to position the cartridge 300 and the specimen analysis disc 200 together.
- the seal members 304 When the cartridge 300 is attached to the specimen analysis disc 200, the seal members 304 are elastically deformed to fill the recesses 204 of the track regions 205.
- Fig. 4 illustrates a state before the seal member 304 is elastically deformed.
- the detection-target-substance capture unit 100 includes a plurality of wells 101 defined by the insertion holes 301 of the cartridge 300 together with the track regions 205 of the specimen analysis disc 200.
- the side surfaces on the inner side (inner surfaces) of the insertion holes 301 correspond to the inner surfaces of the wells 101, and the track regions 205 of the specimen analysis disc 200 correspond to the bottoms of the wells 101.
- the wells 101 each serve as a holder for storing a solution such as a sample solution, a buffer solution, and a cleaning solution.
- the seal members 304 decrease a risk of leakage of the solution from the wells 101.
- Fig. 1 and Fig. 2 illustrate the detection-target-substance capture unit 100 including eight wells 101, the number of wells 101 is not limited to eight.
- the cartridge 300 is detachable from the specimen analysis disc 200. Nanoparticles for labeling substances to be detected are detected and measured only by use of the specimen analysis disc 200 separated from the cartridge 300.
- the operator injects a buffer solution including antibodies 111 into the wells 101 of the detection-target-substance capture unit 100.
- the operator incubates the solution in the detection-target-substance capture unit 100 for an appropriate time at an appropriate temperature.
- the antibodies 111 are thus fixed to the track regions 205 of the specimen analysis disc 200 which are the bottoms of the wells 101.
- the operator drains the buffer solution from the wells 101, and cleans the wells 101 with another buffer solution or a cleaning solution.
- the antibodies 111 not fixed to the track regions 205 are removed by the cleaning.
- the operator injects a sample solution including detection target substances 121 into the wells 101.
- the detection target substances 121 are exosomes, for example.
- the sample solution sometimes does not include the detection target substances 121.
- the following is the case in which the sample solution includes the detection target substances 121 for illustration purposes.
- the operator incubates the solution in the detection-target-substance capture unit 100 for an appropriate time at an appropriate temperature.
- the detection target substances 121 are then specifically bound to the antibodies 111 fixed to the track regions 205 by an antigen-antibody reaction.
- the detection target substances 121 are thus captured on the track regions 205.
- the operator drains the sample solution from the wells 101, and cleans the wells 101 with a buffer solution or a cleaning solution.
- the detection target substances 121 not bound to the antibodies 111 but dispersed in the sample solution, and the detection target substances 121 adhering to the track regions 205 by non-specific binding, which is not the antigen-antibody reaction, are removed by the cleaning.
- the operator injects a buffer solution including nanoparticles 131 serving as labels into the wells 101.
- the surfaces of the nanoparticles 131 are provided with antibodies which specifically bind to the detection target substances 121 by the antigen-antibody reaction.
- the operator incubates the solution in the detection-target-substance capture unit 100 for an appropriate time at an appropriate temperature.
- the nanoparticles 131 specifically bind to the detection target substances 121 captured on the track regions 205 by the antigen-antibody reaction.
- the nanoparticles 131 binding to the detection target substances 121 are thus captured on the track regions 205, more particularly, on the recesses 204 of the track regions 205.
- the operator drains the buffer solution from the wells 101, cleans the wells 101 with another buffer solution or a cleaning solution, and dries the wells 101.
- the nanoparticles 131 not binding to the detection target substances 121 but dispersed in the buffer solution are removed by the cleaning.
- the operator separates the cartridge 300 and the specimen analysis disc 200 of the detection-target-substance capture unit 100, as shown in Fig. 3B .
- the specimen analysis disc 200 is provided with a plurality of circular reaction regions 210 corresponding to the respective wells 101.
- the nanoparticles 131 binding to the detection target substances 121 are captured on the recesses 204 of the track regions 205 in the reaction regions 201.
- the detection target substances 121 are captured and sandwiched between the antibodies 111 and the nanoparticles 131 on the recesses 204 of the track regions 205.
- Fig. 6 illustrates a state in which the nanoparticles 131 binding to the detection target substances 121 are captured on the recesses 204 of the track region 205.
- a nanoparticle measurement device, an analysis device, and an analysis method according to a first embodiment are described below with reference to Fig. 7 , Fig. 8A , Fig. 8B , Fig. 8C , Fig. 9 , Fig. 10 , Fig. 11 , Fig. 12 , and Fig. 13 .
- the analysis device according to a first embodiment is described with reference to Fig. 7 .
- the detection target substances 121 are exosomes having a size as small as 100 nm, it is difficult to optically detect the detection target substance 121 directly.
- the analysis device according to a first embodiment detects and measures the nanoparticles 131 captured on the reaction regions 210 so as to indirectly detect and measure the detection target substances 121 specifically bound to the nanoparticles 131.
- the analysis device 1 includes a turntable 2, a clamper 3, a turntable drive unit 4, a turntable drive circuit 5, and a reference-position detection sensor 6.
- the analysis device 1 further includes a guide shaft 7, an optical pickup 20, an optical pickup drive circuit 8, a nanoparticle measurement device 9, a storage unit 10, and a display unit 11.
- the analysis device 1 does not necessarily include the display unit 11, and an external display unit may be used instead.
- the specimen analysis disc 200 is placed on the turntable 2 with the reaction regions 210 facing down.
- the clamper 3 is driven in directions separating from and approaching the turntable 2.
- the specimen analysis disc 200 is held by the clamper 3 and the turntable 2 when the clamper 3 is driven in the direction approaching the turntable 2.
- the turntable drive unit 4 drives the turntable 2 to rotate on the rotation axis C2 together with the specimen analysis disc 200 and the clamper 3.
- a spindle motor may be used as the turntable drive unit 4.
- the turntable drive circuit 5 controls the turntable drive unit 4.
- the turntable drive circuit 5 controls the turntable drive unit 4 such that the turntable 2 rotates at a constant linear velocity together with the specimen analysis disc 200 and the clamper 3.
- the reference-position detection sensor 6 is placed adjacent to the circumferential portion of the specimen analysis disc 200.
- the reference-position detection sensor 6 is an optical sensor such as a photoreflector, for example.
- the reference-position detection sensor 6 emits detection light 6a toward the circumferential portion of the rotating specimen analysis disc 200, and receives the reflected light from the specimen analysis disc 200.
- the reference-position detection sensor 6 detects the slit 202 of the specimen analysis disc 200, generates a reference-position detection signal PDS, and outputs the signal to the nanoparticle measurement device 9.
- the reference-position detection signal PDS is a pulse signal which rises to be on when the slit 202 reaches the detecting position of the reference-position detection sensor 6, namely, the position to which the detection light 6a is radiated, and falls to be off when the slit 202 passes through the detecting position.
- the reference-position detection sensor 6 detects the reference position per rotation period and per track of the specimen analysis disc 200.
- a transmission-type optical sensor may be used as the reference-position detection sensor 6.
- the reference-position detection sensor 6 of this type emits the detection light 6a to the specimen analysis disc 200 and receives the detection light 6a passing through the slit 202, so as to detect the reference position per rotation period and per track of the specimen analysis disc 200.
- the guide shaft 7 is placed in parallel to the specimen analysis disc 200 in the radial direction of the specimen analysis disc 200.
- the optical pickup 20 is supported by the guide shaft 7.
- the optical pickup 20 is driven along the guide shaft 7 in the direction perpendicular to the rotation axis C2 of the turntable 2, in the radial direction of the specimen analysis disc 200, and in parallel to the specimen analysis disc 200.
- the optical pickup 20 includes an objective lens 21.
- the optical pickup 20 emits laser light 20a to the specimen analysis disc 200 .
- the laser light 20a is condensed by the objective lens 21 on the track regions 205 provided with the reaction regions 210 on the specimen analysis disc 200.
- the reference numerals 21 and 20a indicated in Fig. 5 correspond to the objective lens 21 and the laser light 20a shown in Fig. 7 with the vertical direction reversed.
- the optical pickup 20 is driven in the radial direction of the rotating specimen analysis disc 200.
- the recesses 204 corresponding to the tracks are thus scanned with the laser light 20a, as shown in Fig. 5 .
- the optical pickup 20 receives the reflected light from the specimen analysis disc 200.
- the optical pickup 20 detects a light reception level of the reflected light, generates a light reception signal LRS, and outputs the signal to the nanoparticle measurement device 9.
- the optical pickup drive circuit 8 controls the operation of the optical pickup 20.
- the optical pickup drive circuit 8 moves the optical pickup 20 along the guide shaft 7 or moves the objective lens 21 of the optical pickup 20 in the vertical direction.
- the nanoparticle measurement device 9 controls the turntable drive circuit 5 and the optical pickup drive circuit 8.
- the nanoparticle measurement device 9 thus serves as a controller.
- the nanoparticle measurement device 9 controls the turntable drive circuit 5 to stop or rotate the turntable 2 at a constant linear velocity, for example.
- the nanoparticle measurement device 9 controls the optical pickup drive circuit 8 to move the optical pickup 20 to a target position in the radial direction of the specimen analysis disc 200 or adjust the position of the objective lens 21 in the vertical direction so as to condense the laser light 20a on the track regions 205.
- the nanoparticle measurement device 9 detects the reference position per rotation period and per track of the specimen analysis disc 200 according to the reference-position detection signal PDS output from the reference-position detection sensor 6.
- the nanoparticle measurement device 9 specifies the reaction regions 210 according to the reference position detected.
- the storage unit 10 stores measurement parameters SP for every track in each reaction region 210.
- the measurement parameters SP include measurement information such as the number of the reaction regions 210, the time corresponding to the distance from the slit 202 as a reference-position defining portion to each reaction region 210, and the timing of timing signals of each track.
- the nanoparticle measurement device 9 reads out the measurement parameter SP from the storage unit 10, and sequentially generates a plurality of nanoparticle measurement timing signals BTS and a plurality of low-frequency component measurement timing signals LTS, as a plurality of measurement timing signals, per track in each reaction region 210 based on the measurement parameter SP.
- the nanoparticle measurement timing signals BTS are timing signals for measuring the nanoparticles 131 captured in the reaction regions 210.
- the low-frequency component measurement timing signals LTS are timing signals for measuring low-frequency components fluctuating because of a warp of the specimen analysis disc 200.
- the nanoparticle measurement timing signal BTS is defined as a first timing signal
- the low-frequency component measurement timing signal LTS is defined as a second timing signal.
- the nanoparticle measurement device 9 extracts nanoparticle pulse signals BS per nanoparticle measurement timing signal BTS from the light reception signal LRS output from the optical pickup 20.
- the method of generating the light reception signals LRS and extracting the nanoparticle pulse signals BS will be described below.
- the nanoparticle measurement device 9 counts the extracted nanoparticle pulse signals BS so as to count the number of the nanoparticles 131 labeling the detection target substances 121.
- the nanoparticle measurement device 9 directs the storage unit 10 to store the number of the nanoparticles 131 per nanoparticle measurement timing signal BTS in each reaction region 210.
- the nanoparticle measurement device 9 adds up the number of the nanoparticles 131 in each reaction region 210 and displays the sum on the display unit 11.
- the number of the nanoparticles 131 displayed corresponds to the number of the detection target substances 121 specifically bound to the nanoparticles 131.
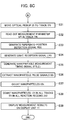
- Fig. 8A , Fig. 8B , and Fig. 8C are flow charts illustrating the analysis method of analyzing the detection target substances 121 by the analysis device 1.
- step S11 in the flow chart shown in Fig. 8A the nanoparticle measurement device 9 controls the turntable drive circuit 5 to direct the turntable drive unit 4 to turn the turntable 2 so that the specimen analysis disc 200 rotates at a constant linear velocity.
- step S12 the nanoparticle measurement device 9 directs the reference-position detection sensor 6 to emit the detection light 6a to the specimen analysis disc 200.
- step S13 the nanoparticle measurement device 9 directs the optical pickup 20 to emit the laser light 20a to the specimen analysis disc 200.
- Step S13 is not necessarily performed after step S12 .
- Step S12 may be performed after step S13, or step S12 and step S13 may be performed simultaneously.
- Fig. 9 schematically illustrates a positional relationship between the detecting positions of the reference-position detection sensor 6 and the optical pickup 20, and the positions of the slit 202 and the respective reaction regions 210 in the specimen analysis disc 200.
- the arrow in Fig. 9 indicates the rotating direction of the specimen analysis disc 200.
- Reference sign 6b indicates the detecting position of the reference-position detection sensor 6.
- the axial line JL corresponds to the guide shaft 7.
- the detecting position 6b of the reference-position detection sensor 6 is located on the axial line JL in Fig. 9 , but is not limited to this illustration.
- the detecting position 6b may be any position at which the slit 202 can be detected at the circumferential edge of the specimen analysis disc 200.
- the optical pickup 20 moves along the axial line JL in the radial direction of the specimen analysis disc 200.
- Reference sign 20b in Fig. 9 indicates the detecting position of the optical pickup 20.
- the reaction regions 210 are arranged at regular intervals such that the respective center points are located on the common circle having the center C200 of the specimen analysis disc 200.
- the reaction region, to which the laser light 20a is radiated first after the reference-position detection sensor 6 detects the slit 202 with the detection light 6a is indicated by reference numeral 211
- the following reaction regions, to which the laser light 20a is sequentially radiated are indicated by reference numerals 212, 213, 214, 215, 216, 217, and 218.
- the laser light 20a is radiated sequentially to the respective reaction regions 211 to 218 per track TR from the track TRs located on the inner side of the specimen analysis disc 200 to the track TRe located on the outer side of the specimen analysis disc 200.
- FIG. 10 illustrates the reaction region 211 to which the laser light 20a is radiated first after the reference-position detection sensor 6 detects the slit 202, the reaction region 212 to which the laser light 20a is radiated after the reaction region 211, and the reaction region 213 to which the laser light 20a is radiated after the reaction region 212, for illustration purposes.
- Fig. 10 illustrates a state in which the reaction regions 211, 212, and 213 are sequentially scanned with the laser light 20a along the track TRi-1 (s ⁇ i-1 ⁇ e) and further along the track TRi (s ⁇ i-1 ⁇ i ⁇ e).
- the nanoparticle measurement device 9, the analysis device 1, and the analysis method according to a first embodiment are illustrated with a case in which the track TRi is a first track, and the track TRi-1 is a second track.
- the track TRi is a first track
- the track TRi-1 is a second track.
- step S21 in the flow chart shown in Fig. 8B the nanoparticle measurement device 9 controls the optical pickup drive circuit 8 to move the optical pickup 20 above the track TRi-1 so that the laser light 20a is radiated to the track TRi-1 of the specimen analysis disc 200.
- the track TRi-1 is thus scanned with the laser light 20a.
- Fig. 11 illustrates a configuration of the nanoparticle measurement device 9.
- the nanoparticle measurement device 9 includes a reference-position detection unit 91, a timing signal generation unit 92, a light reception signal detection unit 93, a measurement unit 94, a low-frequency component extraction unit 95, a low-frequency component calculation unit 96, and a threshold correction unit 97.
- the nanoparticle measurement device 9, and the reference-position detection unit 91, the timing signal generation unit 92, the light reception signal detection unit 93, the measurement unit 94, the low-frequency component extraction unit 95, the low-frequency component calculation unit 96, and the threshold correction unit 97 included in the nanoparticle measurement device 9 may be implemented with either hardware such as a circuit or software (a computer program) executed by a central processing unit (CPU), or may be implemented with a combination of hardware and software.
- step S22 the timing signal generation unit 92 reads out a measurement parameter SPi-1 in the track TRi-1 from the storage unit 10.
- step S 23 the reference position detection sensor 6 detects the slit 202 to generate a reference-position detection signal PDS.
- the reference position detection sensor 6 outputs the reference-position detection signal PDS to the reference-position detection unit 91 of the nanoparticle measurement device 9.
- the reference-position detection unit 91 outputs the reference-position detection signal PDS to the timing signal generation unit 92.
- step S24 the optical pickup 20 receives the reflected light from the specimen analysis disc 200, generates a light reception signal LRS, and outputs the signal to the light reception signal detection unit 93 of the nanoparticle measurement device 9.
- the light reception signal detection unit 93 outputs the light reception signal LRS to the low-frequency component extraction unit 95 and the measurement unit 94.
- Fig. 12 is a timing chart illustrating a relationship between the light reception signals LRS, the nanoparticle measurement timing signals BTS, the low-frequency component measurement timing signals LTS, and the reference-position detection signals PDS.
- Fig. 12 only shows the light reception signals LRS, the nanoparticle measurement timing signals BTS, and the low-frequency component measurement timing signals LTS for measuring the nanoparticles 131 captured in the reaction regions 211 to 213 so as to correspond to Fig. 10 .
- Fig. 13 is a timing chart illustrating a relationship between the light reception signals LRS, the low-frequency component measurement timing signals LTS, a threshold TH, a corrected threshold CTH1, and the reference-position detection signals PDS.
- Fig. 13 corresponds to Fig. 12 .
- reaction regions 210 (211 to 218) are formed by use of the detection-target-substance capture unit 100, the regions on the outside of the reaction regions 210 in the specimen analysis disc 200 are in contact with the seal members 304.
- the regions located at the outer circumferences of the reaction regions 210 and having a predetermined width contain noise components, and are thus defined as impurity regions 220 not to be measured.
- Reference numerals 221, 222, and 223 shown in Fig. 10 denote the respective impurity regions 220 distinguished from the corresponding reaction regions 211, 212, and 213.
- the timing signal generation unit 92 generates the low-frequency component measurement timing signals LTS based on the measurement parameter SP and the reference-position detection signal PDS, and outputs the signals to the low-frequency component extraction unit 95.
- the timing signal generation unit 92 In the track TRi-1, the timing signal generation unit 92 generates the low-frequency component measurement timing signals LTS_1_i-1 and LTS_2_i-1 based on the measurement parameter SPi-1 and the reference-position detection signal PDS, as shown in Fig. 12 or Fig. 13 .
- the nanoparticle measurement device 9, the analysis device 1, and the analysis method according to a first embodiment are illustrated with a case in which the low-frequency component measurement timing signal LTS_1_i-1 is defined as a third timing signal, and the low-frequency component measurement timing signal LTS_2_i-1 is defined as a fourth timing signal.
- the timing signal generation unit 92 outputs the low-frequency component measurement timing signals LTS_1_i-1 and LTS_2_i-1 to the low-frequency component extraction unit 95.
- step S25 the timing signal generation unit 92 generates the low-frequency component measurement timing signal LTS_1_i-1 based on the measurement parameter SPi-1 and the reference-position detection signal PDS in the track TRi-1.
- the timing signal generation unit 92 outputs the low-frequency component measurement timing signal LTS_1_i-1 to the low-frequency component extraction unit 95.
- the low-frequency component measurement timing signal LTS_1_i-1 is a gate pulse signal reaching a high level in a track interval Tbs_1_i-1 after the laser light 20a passes through a track interval Tps_1_i-1 corresponding to the impurity region 221 and the reaction region 211, for example.
- the track interval Tbs_1_i-1 is an interval after the laser light 20a passes through the track interval Tps_1_i-1 and before the laser light 20a reaches a track interval Tps_2_i-1 corresponding to the impurity region 222 and the reaction region 212.
- the track interval Tbs_1_i-1 corresponds to an interval in which a gap between the impurity region 221 and the reaction region 211 and the impurity region 222 and the reaction region 212 is scanned with the laser light 20a in the track TRi-1.
- the track interval Tbs in which the region other than the reaction regions 210 and the impurity regions 220 is scanned with the laser light 20a, is defined as a second track interval
- a track interval Tcs in which the reaction region 210 is scanned with the laser light 20a, is defined as a first track interval
- step S26 the timing signal generation unit 92 generates the low-frequency component measurement timing signal LTS_2_i-1 based on the measurement parameter SPi-1 and the reference-position detection signal PDS in the track TRi-1.
- the timing signal generation unit 92 outputs the low-frequency component measurement timing signal LTS_2_i-1 to the low-frequency component extraction unit 95.
- the low-frequency component measurement timing signal LTS_2_i-1 is a gate pulse signal reaching a high level in a track interval Tbs_2_i-1 after the laser light 20a passes through the track interval Tps_2_i-1 corresponding to the impurity region 222 and the reaction region 212, for example.
- the track interval Tbs_2_i-1 is an interval after the laser light 20a passes through the track interval Tps_2_i-1 and before the laser light 20a reaches a track interval Tps_3_i-1 corresponding to the impurity region 223 and the reaction region 213.
- the track interval Tbs_2_i-1 corresponds to an interval in which a gap between the impurity region 222 and the reaction region 212 and the impurity region 223 and the reaction region 213 is scanned with the laser light 20a in the track TRi-1.
- the low-frequency component extraction unit 95 extracts a low-frequency component LFC fluctuating because of a warp of the specimen analysis disc 200, from the light reception signal LRS according to the low-frequency component measurement timing signal LTS, and outputs the extracted component to the low-frequency component calculation unit 96.
- the low-frequency component extraction unit 95 extracts a low-frequency component LFC_1_i-1 fluctuating because of a warp of the specimen analysis disc 200, from the light reception signal LRS according to the low-frequency component measurement timing signal LTS_1_i-1 in the track TRi-1, as shown in Fig. 13 .
- the low-frequency component extraction unit 95 outputs the low-frequency component LFC_1_i-1 to the low-frequency component calculation unit 96.
- the nanoparticle measurement device 9, the analysis device 1, and the analysis method according to a first embodiment are illustrated with a case in which the low-frequency component LFC_1_i-1 is defined as a first low-frequency component.
- step S28 the low-frequency component extraction unit 95 extracts a low-frequency component LFC_2_i-1 fluctuating because of a warp of the specimen analysis disc 200, from the light reception signal LRS according to the low-frequency component measurement timing signal LTS_2_i-1 in the track TRi-1, as shown in Fig. 13 .
- the low-frequency component extraction unit 95 outputs the low-frequency component LFC_2_i-1 to the low-frequency component calculation unit 96.
- the nanoparticle measurement device 9, the analysis device 1, and the analysis method according to a first embodiment are illustrated below with a case in which the low-frequency component LFC_2_i-1 is defined as a second low-frequency component.
- the low-frequency component calculation unit 96 computes the low-frequency component LFC_1_i-1 and the low-frequency component LFC_2_i-1 using a polynomial interpolation, for example, so as to calculate an interpolated low-frequency component CLFC1_2_i in a track interval Tps_2_i in the track TRi, as shown in Fig. 13 .
- the interpolated low-frequency component CLFC1_2_i is a low-frequency component in the track interval Tps_2_i interpolated with the low-frequency component LFC_1_i-1 and the low-frequency component LFC_2_i-1.
- the low-frequency component calculation unit 96 outputs the interpolated low-frequency component CLFC1_2_i to the threshold correction unit 97.
- step S30 the threshold correction unit 97 corrects a predetermined threshold TH in accordance with the interpolated low-frequency component CLFC1_2_i to set a corrected threshold CTH1_2_i in the reaction region 212 in the track TRi, as shown in Fig. 13 .
- the threshold correction unit 97 outputs the corrected threshold CTH1_2_i to the measurement unit 94.
- step S31 in the flow chart shown in Fig. 8C the nanoparticle measurement device 9 controls the optical pickup drive circuit 8 to move the optical pickup 20 above the track TRi so that the laser light 20a is radiated to the track TRi of the specimen analysis disc 200.
- the track TRi is thus scanned with the laser light 20a.
- step S32 the timing signal generation unit 92 reads out a measurement parameter SPi in the track TRi from the storage unit 10.
- the reference position detection sensor 6 detects the slit 202 to generate a reference-position detection signal PDS.
- the reference position detection sensor 6 outputs the reference-position detection signal PDS to the reference-position detection unit 91 of the nanoparticle measurement device 9.
- the reference-position detection unit 91 outputs the reference-position detection signal PDS to the timing signal generation unit 92.
- step S34 the optical pickup 20 receives the reflected light from the specimen analysis disc 200, generates a light reception signal LRS, and outputs the signal to the light reception signal detection unit 93 of the nanoparticle measurement device 9.
- the light reception signal detection unit 93 outputs the light reception signal LRS to the measurement unit 94 and the low-frequency component extraction unit 95.
- the timing signal generation unit 92 generates nanoparticle measurement timing signals BTS_1_i, BTS_2_i, and BTS_3_i based on the measurement parameter SPi and the reference-position detection signal PDS in the track TRi, as shown in Fig. 12 .
- the timing signal generation unit 92 outputs the nanoparticle measurement timing signals BTS_1_i, BTS_2_i, and BTS_3_i to the measurement unit 94.
- the timing signal generation unit 92 generates the nanoparticle measurement timing signal BTS_2_i based on the measurement parameter SPi and the reference-position detection signal PDS in the track TRi.
- the nanoparticle measurement timing signal BTS_2_i is a gate pulse signal reaching a high level in a track interval Tcs_2_i in which the reaction region 212 is scanned with the laser light 20a, for example, as shown in Fig. 10 , Fig. 12 , or Fig. 13 .
- the timing signal generation unit 92 outputs the nanoparticle measurement timing signal BTS_2_i to the measurement unit 94.
- step S36 the measurement unit 94 extracts pulse signals from the light reception signal LRS according to the nanoparticle measurement timing signal BTS_2_i.
- the measurement unit 94 compares the extracted pulse signals with the corrected threshold CTH1_2_i, and determines and extracts the pulse signals having a lower signal level than the corrected threshold CTH1_2_i as the nanoparticle pulse signals BS, for example.
- step S37 the measurement unit 94 counts the nanoparticle pulse signals BS, so as to count the nanoparticles 131 in the track TRi in the reaction region 212.
- the measurement unit 94 stores the number of the nanoparticles 131 in association with the reaction region 212 and the track TRi in the storage unit 10.
- the nanoparticle measurement device 9 When the nanoparticle measurement device 9 measures the nanoparticles 131 in the track TRi in the reaction region 212, the nanoparticle measurement device 9 extracts the low-frequency components LFC_1_i-1 and LFC_2_i-1 from the light reception signals LRS in the track intervals Tbs_1_i-1 and Tbs_2_i-1 before and after the laser light 20a passes through the reaction region 212 and the impurity region 222 in the track TRi-1 in front of the track TRi. The nanoparticle measurement device 9 calculates the interpolated low-frequency component CLFC1_2_i in the track interval Tps_2_i in the track TRi, in accordance with the low-frequency components LFC_1_i-1 and LFC_2_i-1.
- the nanoparticle measurement device 9 corrects the predetermined threshold TH in accordance with the interpolated low-frequency component CLFC1_2_i to set the corrected threshold CTH1_2_i in the track TRi in the reaction region 212 .
- the nanoparticle measurement device 9 extracts the nanoparticle pulse signals BS from the reception light signal LRS according to the nanoparticle measurement timing signal BTS_2_i and the corrected threshold CTH1_2_i so as to count the nanoparticle pulse signals BS.
- step S38 the nanoparticle measurement device 9 repeats the same processing from step S21 to step S37 for all of the tracks TR from the track TRs to the track TRe in all of the reaction regions 210 (211 to 218).
- the nanoparticle measurement device 9 thus counts the nanoparticles 131 in all of the tracks TR in all of the reaction regions 210.
- the nanoparticle measurement device 9 counts the nanoparticles 131 in the respective reaction regions 211 to 218, so as to indirectly count the detection target substances 121 specifically bound to the nanoparticles 131 by the antigen-antibody reaction.
- the measurement unit 94 stores the number of the nanoparticles 131 in association with the reaction regions 210 and the tracks TR in the storage unit 10.
- step S39 the measurement unit 94 reads out the number of the nanoparticles 131 from the storage unit 10, and sums up the number of the nanoparticles 131 for each reaction region 210 (211 to 218).
- the measurement unit 94 directs the display unit 11 to display the measurement results per reaction region 210.
- the measurement unit 94 displays the total number of the nanoparticles 131 per reaction region 210, or displays a distribution of the number of the nanoparticles 131 on the display unit 11.
- the analysis device 1, and the analysis method according to a first embodiment measure the nanoparticles 131 in the track TRi in the reaction region 212
- the low-frequency components LFC_1_i-1 and LFC_2_i-1 are extracted from the reception light signals LRS in the track intervals Tbs_1_i-1 and Tbs_2_i-1 in front of and behind the reaction region 212 in the tangential direction in the track TRi-1 adjacent to the track TRi in the radial direction of the specimen analysis disc 200.
- the nanoparticle measurement device 9, the analysis device 1, and the analysis method according to a first embodiment calculate the interpolated low-frequency component CLFC1_2_i in the track interval Tps_2_i in the track TRi in accordance with the low-frequency components LFC_1_i-1 and LFC_2_i-1.
- the nanoparticle measurement device 9, the analysis device 1, and the analysis method according to a first embodiment correct the predetermined threshold TH in accordance with the interpolated low-frequency component CLFC1_2_i to set the corrected threshold CTH1_2_i in the track TRi in the reaction region 212.
- the nanoparticle measurement device 9, the analysis device 1, and the analysis method according to a first embodiment extract the nanoparticle pulse signals BS from the reception light signal LRS according to the nanoparticle measurement timing signal BTS_2_i and the corrected threshold CTH1_2_i so as to count the nanoparticle pulse signals BS.
- the nanoparticle measurement device 9, the analysis device 1, and the analysis method according to a first embodiment can reduce the influence of fluctuation of the low-frequency components derived from a warp of the specimen analysis disc 200 in the radial direction and in the tangential direction, so as to suppress a decrease in accuracy of detecting the nanoparticles 131 caused by the fluctuation of the low-frequency components.
- a nanoparticle measurement device, an analysis device, and an analysis method according to a second embodiment are described below with reference to Fig. 7 , Fig. 11 , Fig. 14A , Fig. 14B , Fig. 14C , Fig. 14D , and Fig. 15 .
- the analysis device 401 according to a second embodiment has the same structure and executes the same processing as the analysis device 1 according to a first embodiment, but differs in the processing by the nanoparticle measurement device 409 from the nanoparticle measurement device 9.
- the processing by the nanoparticle measurement device 409 is described below.
- the same elements and signals as in the analysis device 1 according to a first embodiment are denoted by the same reference numerals for brevity.
- the analysis device 401 includes the turntable 2, the clamper 3, the turntable drive unit 4, the turntable drive circuit 5, and the reference-position detection sensor 6.
- the analysis device 401 further includes the guide shaft 7, the optical pickup 20, the optical pickup drive circuit 8, the nanoparticle measurement device 409, the storage unit 10, and the display unit 11.
- the nanoparticle measurement device 409 serves as a controller to control the turntable drive circuit 5 and the optical pickup drive circuit 8.
- the analysis device 401 does not necessarily include the display unit 11, and an external display unit may be used instead.
- the nanoparticle measurement device 409 counts the number of the nanoparticles 131 labeling the detection target substances 121 from the extracted nanoparticle pulse signals BS.
- the nanoparticle measurement device 409 directs the storage unit 10 to store the number of the nanoparticles 131 per nanoparticle measurement timing signal BTS in each reaction region 210.
- the nanoparticle measurement device 409 adds up the number of the nanoparticles 131 in each reaction region 210 and displays the sum on the display unit 11.
- the number of the nanoparticles 131 displayed corresponds to the number of the detection target substances 121 specifically bound to the nanoparticles 131.
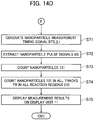
- Fig. 14A , Fig. 14B , Fig. 14C , Fig. 14D , and Fig. 15 are flow charts illustrating the analysis method of analyzing the detection target substances 121 by the analysis device 401.
- step S41 in the flow chart shown in Fig. 14A the nanoparticle measurement device 409 controls the turntable drive circuit 5 to direct the turntable drive unit 4 to turn the turntable 2 so that the specimen analysis disc 200 rotates at a constant linear velocity.
- step S42 the nanoparticle measurement device 409 directs the reference-position detection sensor 6 to emit the detection light 6a to the specimen analysis disc 200.
- step S43 the nanoparticle measurement device 409 directs the optical pickup 20 to emit the laser light 20a to the specimen analysis disc 200.
- Step S43 is not necessarily performed after step S42. Step S42 may be performed after step S43, or step S42 and step S43 may be performed simultaneously.
- a case of measuring the nanoparticles 131 in the track TRi in the reaction region 212 is described below. For illustration purposes, only signal processing of measuring the nanoparticles 131 in the track TRi in the reaction region 212 is described below.
- step S51 in the flow chart shown in Fig. 14B the nanoparticle measurement device 409 controls the optical pickup drive circuit 8 to move the optical pickup 20 above the track TRi-1 so that the laser light 20a is radiated to the track TRi-1 of the specimen analysis disc 200.
- the track TRi-1 is thus scanned with the laser light 20a.
- the nanoparticle measurement device 409, the analysis device 401, and the analysis method according to a second embodiment are illustrated with a case in which the track TRi is a third track, and the track TRi-1 is a fourth track.
- the nanoparticle measurement device 409 includes the reference-position detection unit 91, the timing signal generation unit 92, the light reception signal detection unit 93, a measurement unit 494, a low-frequency component extraction unit 495, a low-frequency component calculation unit 496, and a threshold correction unit 497.
- the nanoparticle measurement device 409, and the reference-position detection unit 91, the timing signal generation unit 92, the light reception signal detection unit 93, the measurement unit 494, the low-frequency component extraction unit 495, the low-frequency component calculation unit 496, and the threshold correction unit 497 included in the nanoparticle measurement device 409 may be implemented with either hardware such as a circuit or software (a computer program) executed by a CPU, or may be implemented with a combination of hardware and software.
- step S52 the timing signal generation unit 92 reads out a measurement parameter SPi-1 in the track TRi-1 from the storage unit 10.
- step S 53 the reference position detection sensor 6 detects the slit 202 to generate a reference-position detection signal PDS.
- the reference position detection sensor 6 outputs the reference-position detection signal PDS to the reference-position detection unit 91 of the nanoparticle measurement device 409.
- the reference-position detection unit 91 outputs the reference-position detection signal PDS to the timing signal generation unit 92.
- step S54 the optical pickup 20 receives the reflected light from the specimen analysis disc 200, generates a light reception signal LRS, and outputs the signal to the light reception signal detection unit 93 of the nanoparticle measurement device 409.
- the light reception signal detection unit 93 outputs the light reception signal LRS to the low-frequency component extraction unit 495 and the measurement unit 494.
- Fig. 15 is a timing chart illustrating a relationship between the light reception signals LRS, the low-frequency component measurement timing signals LTS, low-frequency components, the threshold TH, a corrected threshold CTH2, and the reference-position detection signals PDS.
- Fig. 15 corresponds to Fig. 12 or Fig. 13 .
- the timing signal generation unit 92 generates the low-frequency component measurement timing signals LTS based on the measurement parameter SP and the reference-position detection signal PDS, and outputs the signals to the low-frequency component extraction unit 495.
- the timing signal generation unit 92 In the track TRi-1, the timing signal generation unit 92 generates the low-frequency component measurement timing signal LTS_2_i-1 based on the measurement parameter SPi-1 and the reference-position detection signal PDS, as shown in Fig. 12 or Fig. 15 .
- step S55 the timing signal generation unit 92 generates the low-frequency component measurement timing signal LTS_2_i-1 based on the measurement parameter SPi-1 and the reference-position detection signal PDS in the track TRi-1.
- the timing signal generation unit 92 outputs the low-frequency component measurement timing signal LTS_2_i-1 to the low-frequency component extraction unit 495.
- the low-frequency component measurement timing signal LTS_2_i-1 is a gate pulse signal reaching a high level in the track interval Tbs_2_i-1 after the laser light 20a passes through the track interval Tps_2_i-1 corresponding to the impurity region 222 and the reaction region 212, for example.
- the track interval Tbs_2_i-1 is an interval after the laser light 20a passes through the track interval Tps_2_i-1 and before the laser light 20a reaches the track interval Tps_3_i-1 corresponding to the impurity region 223 and the reaction region 213.
- the track interval Tbs_2_i-1 corresponds to an interval in which a gap between the impurity region 222 and the reaction region 212 and the impurity region 223 and the reaction region 213 is scanned with the laser light 20a in the track TRi-1.
- the low-frequency component extraction unit 495 extracts a low-frequency component LFC fluctuating because of a warp of the reaction region 210 of the specimen analysis disc 200, from the light reception signal LRS according to the low-frequency component measurement timing signal LTS, and outputs the extracted component to the low-frequency component calculation unit 496.
- the low-frequency component extraction unit 495 extracts a low-frequency component LFC_2_i-1 fluctuating because of a warp of the specimen analysis disc 200, from the light reception signal LRS according to the low-frequency component measurement timing signal LTS_2_i-1 in the track TRi-1, as shown in Fig. 15 .
- the low-frequency component extraction unit 495 outputs the low-frequency component LFC_2_i-1 to the low-frequency component calculation unit 496.
- the nanoparticle measurement device 409, the analysis device 401, and the analysis method according to a second embodiment are illustrated with a case in which the low-frequency component LFC_2_i-1 is defined as a third low-frequency component.
- step S61 in the flow chart shown in Fig. 14C the nanoparticle measurement device 409 controls the optical pickup drive circuit 8 to move the optical pickup 20 above the track TRi so that the laser light 20a is radiated to the track TRi of the specimen analysis disc 200.
- the track TRi is thus scanned with the laser light 20a.
- step S62 the timing signal generation unit 92 reads out a measurement parameter SPi in the track TRi from the storage unit 10.
- the reference position detection sensor 6 detects the slit 202 to generate a reference-position detection signal PDS.
- the reference position detection sensor 6 outputs the reference-position detection signal PDS to the reference-position detection unit 91 of the nanoparticle measurement device 409.
- the reference-position detection unit 91 outputs the reference-position detection signal PDS to the timing signal generation unit 92.
- step S64 the optical pickup 20 receives the reflected light from the specimen analysis disc 200, generates a light reception signal LRS, and outputs the signal to the light reception signal detection unit 93 of the nanoparticle measurement device 409.
- the light reception signal detection unit 93 outputs the light reception signal LRS to the low-frequency component extraction unit 495 and the measurement unit 494.
- step S65 the timing signal generation unit 92 generates the low-frequency component measurement timing signal LTS_1_i based on the measurement parameter SPi and the reference-position detection signal PDS in the track TRi, as shown in Fig. 12 or Fig. 15 .
- the timing signal generation unit 92 outputs the low-frequency component measurement timing signal LTS_1_i to the low-frequency component extraction unit 495.
- the nanoparticle measurement device 409, the analysis device 401, and the analysis method according to a second embodiment are illustrated with a case in which the low-frequency component measurement timing signal LTS_2_i-1 is defined as a fifth timing signal, and the low-frequency component measurement timing signal LTS_1_i is defined as a sixth timing signal.
- the low-frequency component measurement timing signal LTS_1_i is a gate pulse signal reaching a high level in the track interval Tbs_1_i before the laser light 20a reaches the track interval Tps_2_i corresponding to the impurity region 222 and the reaction region 212, for example.
- the track interval Tbs_1_i is an interval after the laser light 20a passes through the track interval Tps_1_i and before the laser light 20a reaches the track interval Tps_2_i corresponding to the impurity region 222 and the reaction region 212.
- the track interval Tbs_1_i corresponds to an interval in which a gap between the impurity region 221 and the reaction region 211 and the impurity region 222 and the reaction region 212 is scanned with the laser light 20a in the track TRi.
- step S66 the low-frequency component extraction unit 495 extracts a low-frequency component LFC_1_i fluctuating because of a warp of the reaction region 210 of the specimen analysis disc 200, from the light reception signal LRS according to the low-frequency component measurement timing signal LTS_1_i in the track TRi, as shown in Fig. 15 .
- the low-frequency component extraction unit 495 outputs the low-frequency component LFC_1_i to the low-frequency component calculation unit 496.
- the nanoparticle measurement device 409, the analysis device 401, and the analysis method according to a second embodiment are illustrated with a case in which the low-frequency component LFC_1_i is defined as a fourth low-frequency component.
- the low-frequency component calculation unit 496 computes the low-frequency component LFC_2_i-1 and the low-frequency component LFC_1_i using a polynomial interpolation, for example, so as to calculate an interpolated low-frequency component CLFC2_2_i in the track interval Tps_2_i in the track TRi, as shown in Fig. 15 .
- the interpolated low-frequency component CLFC2_2_i is a low-frequency component in the track interval Tps_2_i interpolated with the low-frequency component LFC_2_i-1 and the low-frequency component LFC_1_i.
- the low-frequency component calculation unit 496 outputs the interpolated low-frequency component CLFC2_2_i to the threshold correction unit 497.
- step S68 the threshold correction unit 497 corrects the predetermined threshold TH in accordance with the interpolated low-frequency component CLFC2_2_i to set a corrected threshold CTH2_2_i in the track TRi in the reaction region 212, as shown in Fig. 15 .
- the threshold correction unit 497 outputs the corrected threshold CTH2_2_i to the measurement unit 494.
- the timing signal generation unit 92 generates the nanoparticle measurement timing signals BTS_1_i, BTS_2_i, and BTS_3_i based on the measurement parameter SPi and the reference-position detection signal PDS in the track TRi, as shown in Fig. 12 .
- the timing signal generation unit 92 outputs the nanoparticle measurement timing signals BTS_1_i, BTS_2_i, and BTS_3_i to the measurement unit 494.
- the timing signal generation unit 92 generates the nanoparticle measurement timing signal BTS_2_i based on the measurement parameter SPi and the reference-position detection signal PDS in the track TRi.
- the nanoparticle measurement timing signal BTS_2_i is a gate pulse signal reaching a high level in the track interval Tcs_2_i in which the reaction region 212 is scanned with the laser light 20a, for example, as shown in Fig. 10 , Fig. 12 , or Fig. 15 .
- the timing signal generation unit 92 outputs the nanoparticle measurement timing signal BTS_2_i to the measurement unit 494.
- step S72 the measurement unit 494 extracts pulse signals from the light reception signal LRS according to the nanoparticle measurement timing signal BTS_2_i.
- the measurement unit 494 compares the extracted pulse signals with the corrected threshold CTH2_2_i, and determines and extracts the pulse signals having a lower signal level than the corrected threshold CTH2_2_i as the nanoparticle pulse signals BS, for example.
- step S73 the measurement unit 494 counts the nanoparticle pulse signals BS, so as to count the nanoparticles 131 in the track TRi in the reaction region 212.
- the measurement unit 494 stores the number of the nanoparticles 131 in association with the reaction region 212 and the track TRi in the storage unit 10.
- the nanoparticle measurement device 409 When the nanoparticle measurement device 409 measures the nanoparticles 131 in the track TRi in the reaction region 212, the nanoparticle measurement device 409 extracts the low-frequency component LFC_2_i-1 from the light reception signal LRS in the track interval Tbs_2_i-1 after the laser light 20a passes through the reaction region 212 and the impurity region 222 in the track TRi-1 in front of the track TRi.
- the nanoparticle measurement device 409 extracts the low-frequency component LFC_1_i from the light reception signal LRS in the track interval Tbs_1_i before the laser light 20a reaches the reaction region 212 and the impurity region 222 in the track TRi.
- the nanoparticle measurement device 409 calculates the interpolated low-frequency component CLFC2_2_i in the track interval Tps_2_i in the track TRi in accordance with the low-frequency components LFC_2_i-1 and LFC_1_i.
- the nanoparticle measurement device 409 corrects the predetermined threshold TH in accordance with the interpolated low-frequency component CLFC2_2_i to set the corrected threshold CTH2_2_i in the track TRi in the reaction region 212.
- the nanoparticle measurement device 409 extracts the nanoparticle pulse signals BS from the reception light signal LRS according to the nanoparticle measurement timing signal BTS_2_i and the corrected threshold CTH2_2_i so as to count the nanoparticle pulse signals BS.
- step S74 the nanoparticle measurement device 409 repeats the same processing from step S51 to step S73 for all of the tracks TR from the track TRs to the track TRe in all of the reaction regions 210 (211 to 218).
- the nanoparticle measurement device 409 thus counts the nanoparticles 131 in all of the tracks TR in all of the reaction regions 210.
- the nanoparticle measurement device 409 counts the nanoparticles 131 in the respective reaction regions 211 to 218, so as to indirectly count the detection target substances 121 specifically bound to the nanoparticles 131 by the antigen-antibody reaction.
- the measurement unit 494 stores the number of the nanoparticles 131 in association with the reaction regions 210 and the tracks TR in the storage unit 10.
- step S75 the measurement unit 494 reads out the number of the nanoparticles 131 from the storage unit 10, and sums up the number of the nanoparticles 131 for each reaction region 210 (211 to 218) .
- the measurement unit 494 directs the display unit 11 to display the measurement results per reaction region 210. For example, the measurement unit 494 displays the total number of the nanoparticles 131 per reaction region 210, or displays a distribution of the number of the nanoparticles 131 on the display unit 11.
- the low-frequency component LFC_2_i-1 is extracted from the reception light signal LRS in the track interval Tbs_2_i-1 behind the reaction region 212 in the tangential direction in the track TRi-1 adjacent to the track TRi in the radial direction of the specimen analysis disc 200.
- the nanoparticle measurement device 409, the analysis device 401, and the analysis method according to a second embodiment further extract the low-frequency component LFC_1_i from the reception light signal LRS in the track interval Tbs_1_i in front of the reaction region 212 in the tangential direction in the track TRi.
- the nanoparticle measurement device 409, the analysis device 401, and the analysis method according to a second embodiment calculate the interpolated low-frequency component CLFC2_2_i in the track interval Tps_2_i in the track TRi in accordance with the low-frequency components LFC_2_i-1 and LFC_1_i.
- the nanoparticle measurement device 409, the analysis device 401, and the analysis method according to a second embodiment correct the predetermined threshold TH in accordance with the interpolated low-frequency component CLFC2_2_i to set the corrected threshold CTH2_2_i in the track TRi in the reaction region 212.
- the nanoparticle measurement device 409, the analysis device 401, and the analysis method according to a second embodiment extract the nanoparticle pulse signals BS from the reception light signal LRS according to the nanoparticle measurement timing signal BTS_2_i and the corrected threshold CTH2_2_i so as to count the nanoparticle pulse signals BS.
- the nanoparticle measurement device 409, the analysis device 401, and the analysis method according to a second embodiment can reduce the influence of fluctuation of the low-frequency components derived from a warp of the specimen analysis disc 200 in the radial direction and in the tangential direction, so as to suppress a decrease in accuracy of detecting the nanoparticles 131 caused by fluctuation of the low-frequency components.
- the nanoparticle measurement device 9 in the analysis device 1 according to a first embodiment includes the reference-position detection unit 91, the timing signal generation unit 92, the light reception signal detection unit 93, the measurement unit 94, the low-frequency component extraction unit 95, the low-frequency component calculation unit 96, and the threshold correction unit 97, as shown in Fig. 11 .
- the nanoparticle measurement device 9 in the analysis device 1 according to a first embodiment may include the timing signal generation unit 92, the measurement unit 94, the low-frequency component extraction unit 95, the low-frequency component calculation unit 96, and the threshold correction unit 97.
- the analysis device 1 includes the turntable 2, the clamper 3, the turntable drive unit 4, the turntable drive circuit 5, the reference-position detection sensor 6, the guide shaft 7, the optical pickup 20, the optical pickup drive circuit 8, a controller, the storage unit 10, and the display unit 11, wherein the controller includes the reference-position detection unit 91, the light reception signal detection unit 93, and the nanoparticle measurement device 9.
- the nanoparticle measurement device 409 in the analysis device 401 according to a second embodiment includes the reference-position detection unit 91, the timing signal generation unit 92, the light reception signal detection unit 93, the measurement unit 494, the low-frequency component extraction unit 495, the low-frequency component calculation unit 496, and the threshold correction unit 497, as shown in Fig. 11 .
- the nanoparticle measurement device 409 in the analysis device 401 according to a second embodiment may include the timing signal generation unit 92, the measurement unit 494, the low-frequency component extraction unit 495, the low-frequency component calculation unit 496, and the threshold correction unit 497.
- the analysis device 401 includes the turntable 2, the clamper 3, the turntable drive unit 4, the turntable drive circuit 5, the reference-position detection sensor 6, the guide shaft 7, the optical pickup 20, the optical pickup drive circuit 8, a controller, the storage unit 10, and the display unit 11, wherein the controller includes the reference-position detection unit 91, the light reception signal detection unit 93, and the nanoparticle measurement device 409.
- Fig. 12 , Fig. 13 , or Fig. 15 indicates the nanoparticle measurement timing signals BTS and the low-frequency component measurement timing signals LTS as rectangular gate pulse signals which rise at the start point and fall at the end point.
- the nanoparticle measurement timing signals BTS and the low-frequency component measurement timing signals LTS are not limited to the gate pulse signals and may be trigger pulse signals which reach a high level at the start point and at the end point.
- Fig. 13 or Fig. 15 indicates the two sampling points for the respective low-frequency components when the interpolated low-frequency component CLFC is calculated from the low-frequency components LFC extracted from the light reception signal LRS in accordance with the low-frequency component measurement timing signal LTS.
- the number of the sampling points for the respective low-frequency components LFC is not limited to two, and may be three or more.
- the nanoparticle measurement device 9 or 409 may extract the low-frequency components LFC_1_i and LFC_1_i from the light reception signals LRS in the track intervals Tbs_1_i and Tbs_2_i in front of and behind the track interval Tps_2_i corresponding to the impurity region 222 and the reaction region 212 in accordance with the low-frequency component measurement timing signals LTS_1_i and LTS_2_i in the track TRi.
- the nanoparticle measurement device 9 or 409 extracts the light reception signal LRS in the track interval Tcs_2_i according to the nanoparticle measurement timing signal BTS_2_i.
- the nanoparticle measurement device 9 or 409 stores the extracted light reception signal LRS and the low-frequency components LFC_1_i and LFC_1_i in the storage unit 10.
- the nanoparticle measurement device 9 or 409 reads out the low-frequency components LFC_1_i and LFC_1_i from the storage unit 10, and calculates the interpolated low-frequency component CLFC_2_i in the track interval Tps_2_i in the track TRi in accordance with the low-frequency components LFC_1_i and LFC_1_i.
- the nanoparticle measurement device 9 or 409 corrects the predetermined threshold TH in accordance with the interpolated low-frequency component CLFC_2_i to set a corrected threshold CTH_2_i in the track TRi in the reaction region 212.
- the nanoparticle measurement device 9 or 409 reads out, from the storage unit 10, the light reception signal LRS extracted from the nanoparticle measurement timing signal BTS_2_i.
- the nanoparticle measurement device 9 or 409 extracts and counts the nanoparticle signals BS from the reception light signal LRS according to the corrected threshold CTH_2_i.
- the nanoparticle measurement device, the analysis device, and the analysis method described above can achieve the effects similar to the nanoparticle measurement device 9 or 409, the analysis device 1 or 401, and the analysis method according to first or second embodiment.
Landscapes
- Health & Medical Sciences (AREA)
- Immunology (AREA)
- Life Sciences & Earth Sciences (AREA)
- Engineering & Computer Science (AREA)
- Chemical & Material Sciences (AREA)
- Molecular Biology (AREA)
- Biomedical Technology (AREA)
- Hematology (AREA)
- Urology & Nephrology (AREA)
- Analytical Chemistry (AREA)
- Physics & Mathematics (AREA)
- Biochemistry (AREA)
- General Health & Medical Sciences (AREA)
- General Physics & Mathematics (AREA)
- Pathology (AREA)
- Microbiology (AREA)
- Cell Biology (AREA)
- Food Science & Technology (AREA)
- Medicinal Chemistry (AREA)
- Biotechnology (AREA)
- Investigating Or Analysing Materials By Optical Means (AREA)
- Automatic Analysis And Handling Materials Therefor (AREA)
Abstract
Description
- The present disclosure relates to a nanoparticle measurement device, an analysis device, and an analysis method for analyzing biomaterials such as antigens and antibodies.
- Immunoassays are known to quantitatively analyze disease detection and therapeutic effects by detecting particular antigens or antibodies as biomarkers associated with diseases.
- Japanese Unexamined Patent Application Publication No.
2015-127691 2015-127691 - The specimen analysis disc may be warped during the process of forming the reaction region on the disc. The warp of the specimen analysis disc causes a tilt on the surface on which the reaction region is formed. When the warped specimen analysis disc is scanned with the laser light, detection signals for detecting nanoparticles captured on the reaction region cause fluctuation of low-frequency components because of the tilt on the surface of the specimen analysis disc. The fluctuation of the low-frequency components decreases the accuracy of detecting the nanoparticles. The warp of the specimen analysis disc thus leads to the deterioration of detection accuracy of nanoparticles.
- Japanese Unexamined Patent Application Publication No.
2001-126261 2001-126261 - In view of the foregoing, the present disclosure provides a nanoparticle measurement device, an analysis device, and an analysis method capable of reducing the influence of fluctuation of low-frequency components derived from a warp of a specimen analysis disc so as to suppress a decrease in accuracy of detecting nanoparticles caused by the fluctuation of the low-frequency components.
- A first aspect of one or more embodiments provides a nanoparticle measurement device including: a timing signal generation unit configured to generate a first timing signal corresponding to a first track interval in a reaction region formed in a disc for specimen analysis having a plurality of tracks on which nanoparticles binding to substances to be detected are captured per track, and a second timing signal corresponding to a second track interval different from the reaction region, the tracks being formed from an inner side to an outer side of the disc for specimen analysis; a low-frequency component extraction unit configured to extract a low-frequency component fluctuating because of a warp of the disc for specimen analysis from a light reception signal according to the second timing signal, the light reception signal being generated when a laser light is radiated to the reaction region and a reflected light is received from the reaction region; a low-frequency component calculation unit configured to calculate an interpolated low-frequency component corresponding to the first track interval and interpolated in accordance with the low-frequency component; a threshold correction unit configured to correct a predetermined threshold in accordance with the interpolated low-frequency component to set a corrected threshold; and a measurement unit configured to extract nanoparticle pulse signals from the light reception signal according to the first timing signal and the corrected threshold, and count the nanoparticle pulse signals, so as to count the nanoparticles captured in the first track interval in the reaction region.
- A second aspect of one or more embodiments provides an analysis device including: a turntable holding a disc for specimen analysis; a turntable drive unit configured to rotate the turntable; a turntable drive circuit configured to control the turntable drive unit; an optical pickup driven in a direction perpendicular to a rotation axis of the turntable, and configured to emit a laser light to a reaction region, receive a reflected light from the reaction region, and generate a light reception signal; an optical pickup drive circuit configured to control an operation of the optical pickup; and a controller configured to control the turntable drive circuit and the optical pickup drive circuit, wherein the controller comprises the above-described nanoparticle measurement device.
- A third aspect of one or more embodiments provides an analysis method including: rotating a disc for specimen analysis having a plurality of tracks formed from an inner side to an outer side and having a reaction region on which nanoparticles binding to substances to be detected are captured per track; radiating a laser light to the reaction region per track; receiving a reflected light from the reaction region to generate a light reception signal; generating a first timing signal corresponding to a first track interval in the reaction region, and a second timing signal corresponding to a second track interval different from the reaction region; extracting a low-frequency component fluctuating because of a warp of the disc for specimen analysis from the light reception signal according to the second timing signal; calculating an interpolated low-frequency component corresponding to the first track interval and interpolated in accordance with the low-frequency component; correcting a predetermined threshold in accordance with the interpolated low-frequency component to set a corrected threshold; extracting nanoparticle pulse signals from the light reception signal according to the first timing signal and the corrected threshold; and counting the nanoparticle pulse signals so as to count the nanoparticles captured in the first track interval in the reaction region.
-
-
Fig. 1 is a plan view illustrating a structure of a detection-target-substance capture unit. -
Fig. 2 is a plan view illustrating the structure of the detection-target-substance capture unit. -
Fig. 3A is a cross-sectional view of the detection-target-substance capture unit taken along line A-A inFig. 1 . -
Fig. 3B is a cross-sectional view showing a state in which a cartridge is removed from a disc for specimen analysis. -
Fig. 4 is an enlarged perspective view showing a well cross-sectioned along line B-B inFig. 1 . -
Fig. 5 is a schematic cross-sectional view showing a state in which substances to be detected are captured and sandwiched between antibodies and nanoparticles in a recess of a track region. -
Fig. 6 is a schematic plan view showing a state in which the nanoparticles and the substances to be detected coupled together are captured in recesses of the track region. -
Fig. 7 is a configuration diagram illustrating an analysis device according to first and second embodiments. -
Fig. 8A is a flow chart for illustrating an analysis method by the analysis device according to a first embodiment. -
Fig. 8B is a flow chart for illustrating the analysis method by the analysis device according to a first embodiment. -
Fig. 8C is a flow chart for illustrating the analysis method by the analysis device according to a first embodiment. -
Fig. 9 is a plan view illustrating a positional relationship between detecting positions of a reference-position detection sensor and an optical pickup, and positions of a slit and reaction regions on the specimen analysis disc. -
Fig. 10 is a diagram illustrating a relationship between the reaction regions, impurity regions, tracks, and track intervals. -
Fig. 11 is a configuration diagram illustrating a nanoparticle measurement device in the analysis device according to first and second embodiments. -
Fig. 12 is a timing chart illustrating a relationship between light reception signals, nanoparticle measurement timing signals, low-frequency component measurement timing signals, and reference position detection signals. -
Fig. 13 is a timing chart illustrating a relationship between the light reception signals, the nanoparticle measurement timing signals, the low-frequency component measurement timing signals, low-frequency components, a threshold, and the reference position detection signals. -
Fig. 14A is a flow chart for illustrating an analysis method by the analysis device according to a second embodiment. -
Fig. 14B is a flow chart for illustrating the analysis method by the analysis device according to a second embodiment. -
Fig. 14C is a flow chart for illustrating the analysis method by the analysis device according to a second embodiment. -
Fig. 14D is a flow chart for illustrating the analysis method by the analysis device according to a second embodiment. -
Fig. 15 is a timing chart illustrating a relationship between light reception signals, nanoparticle measurement timing signals, low-frequency component measurement timing signals, low-frequency components, a threshold, and reference position detection signals. - A detection-target-substance capture unit is illustrated below with reference to
Fig. 1, Fig. 2 ,Fig. 3A, Fig. 3B , andFig. 4 .Fig. 1 is a view showing the detection-target-substance capture unit as viewed from the cartridge side.Fig. 2 is a view showing the detection-target-substance capture unit as viewed from the specimen analysis disc side.Fig. 3A is a cross-sectional view of the detection-target-substance capture unit taken along line A-A inFig. 1 .Fig. 3B is a view illustrating a state in which the cartridge is removed from the specimen analysis disc.Fig. 4 is a partly-enlarged view of a well shown inFig. 1 taken along line B-B inFig. 1 . - As shown in
Fig. 1 and Fig. 2 , the detection-target-substance capture unit 100 includes thespecimen analysis disc 200 and thecartridge 300. Thespecimen analysis disc 200 is formed into a circular shape having substantially the same dimensions as optical discs such as Blu-ray discs (BDs), DVDs, and compact discs (CDs). Thespecimen analysis disc 200 is formed of resin material such as polycarbonate resin and cycloolefin polymer, commonly used for optical discs. Thespecimen analysis disc 200 is not limited to the optical discs described above, and may be any optical disc according to other embodiments or conforming to prescribed standards. - As shown in
Fig. 1, Fig. 2 ,Fig. 3A, or Fig. 3B , thespecimen analysis disc 200 has acenter hole 201 formed in the middle of the disc, and aslit 202 provided at the circumferential edge of the disc. Theslit 202 serves as a reference-position defining portion for defining a reference position of thespecimen analysis disc 200. - As shown in
Fig. 4 , the surface of thespecimen analysis disc 200 includestrack regions 205 provided withconvex regions 203 and recesses 204 alternately arranged in a radial direction. Theconvex regions 203 and therecesses 204 are formed in a spiral or concentric state from the inner side to the outer side of thespecimen analysis disc 200. Theconvex regions 203 correspond to lands of an optical disc. Therecesses 204 correspond to grooves of an optical disc, and correspond to tracks of thespecimen analysis disc 200. Thespecimen analysis disc 200 thus includes a plurality of tracks formed from the inner side to the outer side. A track pitch of therecesses 204 in the radial direction is 320 nanometers (nm), for example. - As shown in
Fig. 1, Fig. 2 ,Fig. 3A, or Fig. 3 , thecartridge 300 is provided with a plurality of cylindrical penetration holes 301 along the circumferential direction. The penetration holes 301 are arranged at regular intervals such that the respective center points are located on the common circle. Thecartridge 300 includes aconvex portion 302 in the middle, aconvex portion 303 at the circumferential edge, and a plurality ofseal members 304 corresponding to the penetration holes 301 at the circumferential edge. Theseal members 304 are ring-like gaskets formed of elastically-deformable material such as silicone rubber, for example. As shown inFig. 3A, Fig. 3B , orFig. 4 , theseal members 304 are placed around the respective penetration holes 301. - When the
cartridge 300 is attached to thespecimen analysis disc 200, theconvex portion 302 is inserted into thecenter hole 201 of thespecimen analysis disc 200, and theconvex portion 303 is inserted into theslit 202 so as to position thecartridge 300 and thespecimen analysis disc 200 together. When thecartridge 300 is attached to thespecimen analysis disc 200, theseal members 304 are elastically deformed to fill therecesses 204 of thetrack regions 205.Fig. 4 illustrates a state before theseal member 304 is elastically deformed. - As shown in
Fig. 3A andFig. 4 , the detection-target-substance capture unit 100 includes a plurality ofwells 101 defined by the insertion holes 301 of thecartridge 300 together with thetrack regions 205 of thespecimen analysis disc 200. The side surfaces on the inner side (inner surfaces) of the insertion holes 301 correspond to the inner surfaces of thewells 101, and thetrack regions 205 of thespecimen analysis disc 200 correspond to the bottoms of thewells 101. - The
wells 101 each serve as a holder for storing a solution such as a sample solution, a buffer solution, and a cleaning solution. Theseal members 304 decrease a risk of leakage of the solution from thewells 101. AlthoughFig. 1 and Fig. 2 illustrate the detection-target-substance capture unit 100 including eightwells 101, the number ofwells 101 is not limited to eight. - As shown in
Fig. 3B , thecartridge 300 is detachable from thespecimen analysis disc 200. Nanoparticles for labeling substances to be detected are detected and measured only by use of thespecimen analysis disc 200 separated from thecartridge 300. - An example of a method of forming reaction regions is described below with reference to the flow charts of
Fig. 5 and Fig. 6 . The operator injects a buffersolution including antibodies 111 into thewells 101 of the detection-target-substance capture unit 100. The operator incubates the solution in the detection-target-substance capture unit 100 for an appropriate time at an appropriate temperature. - The
antibodies 111 are thus fixed to thetrack regions 205 of thespecimen analysis disc 200 which are the bottoms of thewells 101. The operator drains the buffer solution from thewells 101, and cleans thewells 101 with another buffer solution or a cleaning solution. Theantibodies 111 not fixed to thetrack regions 205 are removed by the cleaning. - The operator injects a sample solution including
detection target substances 121 into thewells 101. Thedetection target substances 121 are exosomes, for example. The sample solution sometimes does not include thedetection target substances 121. The following is the case in which the sample solution includes thedetection target substances 121 for illustration purposes. - The operator incubates the solution in the detection-target-
substance capture unit 100 for an appropriate time at an appropriate temperature. Thedetection target substances 121 are then specifically bound to theantibodies 111 fixed to thetrack regions 205 by an antigen-antibody reaction. Thedetection target substances 121 are thus captured on thetrack regions 205. - The operator drains the sample solution from the
wells 101, and cleans thewells 101 with a buffer solution or a cleaning solution. Thedetection target substances 121 not bound to theantibodies 111 but dispersed in the sample solution, and thedetection target substances 121 adhering to thetrack regions 205 by non-specific binding, which is not the antigen-antibody reaction, are removed by the cleaning. - The operator injects a buffer
solution including nanoparticles 131 serving as labels into thewells 101. The surfaces of thenanoparticles 131 are provided with antibodies which specifically bind to thedetection target substances 121 by the antigen-antibody reaction. The operator incubates the solution in the detection-target-substance capture unit 100 for an appropriate time at an appropriate temperature. - The
nanoparticles 131 specifically bind to thedetection target substances 121 captured on thetrack regions 205 by the antigen-antibody reaction. Thenanoparticles 131 binding to thedetection target substances 121 are thus captured on thetrack regions 205, more particularly, on therecesses 204 of thetrack regions 205. - The operator drains the buffer solution from the
wells 101, cleans thewells 101 with another buffer solution or a cleaning solution, and dries thewells 101. Thenanoparticles 131 not binding to thedetection target substances 121 but dispersed in the buffer solution are removed by the cleaning. - The operator separates the
cartridge 300 and thespecimen analysis disc 200 of the detection-target-substance capture unit 100, as shown inFig. 3B . Thespecimen analysis disc 200 is provided with a plurality ofcircular reaction regions 210 corresponding to therespective wells 101. - As shown in
Fig. 5 , thenanoparticles 131 binding to thedetection target substances 121 are captured on therecesses 204 of thetrack regions 205 in thereaction regions 201. Thedetection target substances 121 are captured and sandwiched between theantibodies 111 and thenanoparticles 131 on therecesses 204 of thetrack regions 205.Fig. 6 illustrates a state in which thenanoparticles 131 binding to thedetection target substances 121 are captured on therecesses 204 of thetrack region 205. - A nanoparticle measurement device, an analysis device, and an analysis method according to a first embodiment are described below with reference to
Fig. 7 ,Fig. 8A ,Fig. 8B ,Fig. 8C ,Fig. 9 ,Fig. 10 ,Fig. 11 ,Fig. 12 , andFig. 13 . First, the analysis device according to a first embodiment is described with reference toFig. 7 . When thedetection target substances 121 are exosomes having a size as small as 100 nm, it is difficult to optically detect thedetection target substance 121 directly. The analysis device according to a first embodiment detects and measures thenanoparticles 131 captured on thereaction regions 210 so as to indirectly detect and measure thedetection target substances 121 specifically bound to thenanoparticles 131. - As shown in
Fig.7 , theanalysis device 1 includes a turntable 2, aclamper 3, a turntable drive unit 4, a turntable drive circuit 5, and a reference-position detection sensor 6. Theanalysis device 1 further includes a guide shaft 7, anoptical pickup 20, an opticalpickup drive circuit 8, a nanoparticle measurement device 9, astorage unit 10, and adisplay unit 11. Theanalysis device 1 does not necessarily include thedisplay unit 11, and an external display unit may be used instead. - The
specimen analysis disc 200 is placed on the turntable 2 with thereaction regions 210 facing down. Theclamper 3 is driven in directions separating from and approaching the turntable 2. Thespecimen analysis disc 200 is held by theclamper 3 and the turntable 2 when theclamper 3 is driven in the direction approaching the turntable 2. - The turntable drive unit 4 drives the turntable 2 to rotate on the rotation axis C2 together with the
specimen analysis disc 200 and theclamper 3. A spindle motor may be used as the turntable drive unit 4. The turntable drive circuit 5 controls the turntable drive unit 4. For example, the turntable drive circuit 5 controls the turntable drive unit 4 such that the turntable 2 rotates at a constant linear velocity together with thespecimen analysis disc 200 and theclamper 3. - The reference-
position detection sensor 6 is placed adjacent to the circumferential portion of thespecimen analysis disc 200. The reference-position detection sensor 6 is an optical sensor such as a photoreflector, for example. The reference-position detection sensor 6 emitsdetection light 6a toward the circumferential portion of the rotatingspecimen analysis disc 200, and receives the reflected light from thespecimen analysis disc 200. - The reference-
position detection sensor 6 detects theslit 202 of thespecimen analysis disc 200, generates a reference-position detection signal PDS, and outputs the signal to the nanoparticle measurement device 9. The reference-position detection signal PDS is a pulse signal which rises to be on when theslit 202 reaches the detecting position of the reference-position detection sensor 6, namely, the position to which thedetection light 6a is radiated, and falls to be off when theslit 202 passes through the detecting position. - The reference-
position detection sensor 6 detects the reference position per rotation period and per track of thespecimen analysis disc 200. A transmission-type optical sensor may be used as the reference-position detection sensor 6. The reference-position detection sensor 6 of this type emits thedetection light 6a to thespecimen analysis disc 200 and receives thedetection light 6a passing through theslit 202, so as to detect the reference position per rotation period and per track of thespecimen analysis disc 200. - The guide shaft 7 is placed in parallel to the
specimen analysis disc 200 in the radial direction of thespecimen analysis disc 200. Theoptical pickup 20 is supported by the guide shaft 7. Theoptical pickup 20 is driven along the guide shaft 7 in the direction perpendicular to the rotation axis C2 of the turntable 2, in the radial direction of thespecimen analysis disc 200, and in parallel to thespecimen analysis disc 200. - The
optical pickup 20 includes anobjective lens 21. Theoptical pickup 20 emitslaser light 20a to thespecimen analysis disc 200 . Thelaser light 20a is condensed by theobjective lens 21 on thetrack regions 205 provided with thereaction regions 210 on thespecimen analysis disc 200. The reference numerals 21 and 20a indicated inFig. 5 correspond to theobjective lens 21 and thelaser light 20a shown inFig. 7 with the vertical direction reversed. - The
optical pickup 20 is driven in the radial direction of the rotatingspecimen analysis disc 200. Therecesses 204 corresponding to the tracks are thus scanned with thelaser light 20a, as shown inFig. 5 . Theoptical pickup 20 receives the reflected light from thespecimen analysis disc 200. Theoptical pickup 20 detects a light reception level of the reflected light, generates a light reception signal LRS, and outputs the signal to the nanoparticle measurement device 9. - The optical
pickup drive circuit 8 controls the operation of theoptical pickup 20. The opticalpickup drive circuit 8 moves theoptical pickup 20 along the guide shaft 7 or moves theobjective lens 21 of theoptical pickup 20 in the vertical direction. - The nanoparticle measurement device 9 controls the turntable drive circuit 5 and the optical
pickup drive circuit 8. The nanoparticle measurement device 9 thus serves as a controller. The nanoparticle measurement device 9 controls the turntable drive circuit 5 to stop or rotate the turntable 2 at a constant linear velocity, for example. - The nanoparticle measurement device 9 controls the optical
pickup drive circuit 8 to move theoptical pickup 20 to a target position in the radial direction of thespecimen analysis disc 200 or adjust the position of theobjective lens 21 in the vertical direction so as to condense thelaser light 20a on thetrack regions 205. - The nanoparticle measurement device 9 detects the reference position per rotation period and per track of the
specimen analysis disc 200 according to the reference-position detection signal PDS output from the reference-position detection sensor 6. The nanoparticle measurement device 9 specifies thereaction regions 210 according to the reference position detected. - The
storage unit 10 stores measurement parameters SP for every track in eachreaction region 210. The measurement parameters SP include measurement information such as the number of thereaction regions 210, the time corresponding to the distance from theslit 202 as a reference-position defining portion to eachreaction region 210, and the timing of timing signals of each track. - The nanoparticle measurement device 9 reads out the measurement parameter SP from the
storage unit 10, and sequentially generates a plurality of nanoparticle measurement timing signals BTS and a plurality of low-frequency component measurement timing signals LTS, as a plurality of measurement timing signals, per track in eachreaction region 210 based on the measurement parameter SP. - The nanoparticle measurement timing signals BTS are timing signals for measuring the
nanoparticles 131 captured in thereaction regions 210. The low-frequency component measurement timing signals LTS are timing signals for measuring low-frequency components fluctuating because of a warp of thespecimen analysis disc 200. Hereinafter, the nanoparticle measurement timing signal BTS is defined as a first timing signal, and the low-frequency component measurement timing signal LTS is defined as a second timing signal. - The nanoparticle measurement device 9 extracts nanoparticle pulse signals BS per nanoparticle measurement timing signal BTS from the light reception signal LRS output from the
optical pickup 20. The method of generating the light reception signals LRS and extracting the nanoparticle pulse signals BS will be described below. - The nanoparticle measurement device 9 counts the extracted nanoparticle pulse signals BS so as to count the number of the
nanoparticles 131 labeling thedetection target substances 121. The nanoparticle measurement device 9 directs thestorage unit 10 to store the number of thenanoparticles 131 per nanoparticle measurement timing signal BTS in eachreaction region 210. The nanoparticle measurement device 9 adds up the number of thenanoparticles 131 in eachreaction region 210 and displays the sum on thedisplay unit 11. The number of thenanoparticles 131 displayed corresponds to the number of thedetection target substances 121 specifically bound to thenanoparticles 131. - The analysis method of analyzing the
detection target substances 121 by theanalysis device 1, more particularly the method of analyzing thenanoparticles 131 labeling thedetection target substances 121, is described below with reference toFig. 8A ,Fig. 8B ,Fig. 8C ,Fig. 9 ,Fig. 10 ,Fig. 11 ,Fig. 12 , andFig. 13 .Fig. 8A ,Fig. 8B , andFig. 8C are flow charts illustrating the analysis method of analyzing thedetection target substances 121 by theanalysis device 1. - In step S11 in the flow chart shown in
Fig. 8A , the nanoparticle measurement device 9 controls the turntable drive circuit 5 to direct the turntable drive unit 4 to turn the turntable 2 so that thespecimen analysis disc 200 rotates at a constant linear velocity. - In step S12, the nanoparticle measurement device 9 directs the reference-
position detection sensor 6 to emit thedetection light 6a to thespecimen analysis disc 200. In step S13, the nanoparticle measurement device 9 directs theoptical pickup 20 to emit thelaser light 20a to thespecimen analysis disc 200. Step S13 is not necessarily performed after step S12 . Step S12 may be performed after step S13, or step S12 and step S13 may be performed simultaneously. -
Fig. 9 schematically illustrates a positional relationship between the detecting positions of the reference-position detection sensor 6 and theoptical pickup 20, and the positions of theslit 202 and therespective reaction regions 210 in thespecimen analysis disc 200. The arrow inFig. 9 indicates the rotating direction of thespecimen analysis disc 200.Reference sign 6b indicates the detecting position of the reference-position detection sensor 6. The axial line JL corresponds to the guide shaft 7. - The detecting
position 6b of the reference-position detection sensor 6 is located on the axial line JL inFig. 9 , but is not limited to this illustration. The detectingposition 6b may be any position at which theslit 202 can be detected at the circumferential edge of thespecimen analysis disc 200. Theoptical pickup 20 moves along the axial line JL in the radial direction of thespecimen analysis disc 200.Reference sign 20b inFig. 9 indicates the detecting position of theoptical pickup 20. - As shown in
Fig. 9 , thereaction regions 210 are arranged at regular intervals such that the respective center points are located on the common circle having the center C200 of thespecimen analysis disc 200. For distinguishing therespective reaction regions 210, the reaction region, to which thelaser light 20a is radiated first after the reference-position detection sensor 6 detects theslit 202 with thedetection light 6a, is indicated byreference numeral 211, and the following reaction regions, to which thelaser light 20a is sequentially radiated, are indicated byreference numerals - The
laser light 20a is radiated sequentially to therespective reaction regions 211 to 218 per track TR from the track TRs located on the inner side of thespecimen analysis disc 200 to the track TRe located on the outer side of thespecimen analysis disc 200. - A case of measuring the
nanoparticles 131 in the track TRi (s < i < e) in thereaction region 212 is described below.Fig. 10 illustrates thereaction region 211 to which thelaser light 20a is radiated first after the reference-position detection sensor 6 detects theslit 202, thereaction region 212 to which thelaser light 20a is radiated after thereaction region 211, and thereaction region 213 to which thelaser light 20a is radiated after thereaction region 212, for illustration purposes. -
Fig. 10 illustrates a state in which thereaction regions laser light 20a along the track TRi-1 (s < i-1 < e) and further along the track TRi (s < i-1 < i < e). The nanoparticle measurement device 9, theanalysis device 1, and the analysis method according to a first embodiment are illustrated with a case in which the track TRi is a first track, and the track TRi-1 is a second track. For illustration purposes, only signal processing of measuring thenanoparticles 131 in the track TRi (s < i < e) in thereaction region 212 is described below. - In step S21 in the flow chart shown in
Fig. 8B , the nanoparticle measurement device 9 controls the opticalpickup drive circuit 8 to move theoptical pickup 20 above the track TRi-1 so that thelaser light 20a is radiated to the track TRi-1 of thespecimen analysis disc 200. The track TRi-1 is thus scanned with thelaser light 20a. -
Fig. 11 illustrates a configuration of the nanoparticle measurement device 9. As shown inFig. 11 , the nanoparticle measurement device 9 includes a reference-position detection unit 91, a timingsignal generation unit 92, a light receptionsignal detection unit 93, a measurement unit 94, a low-frequency component extraction unit 95, a low-frequency component calculation unit 96, and a threshold correction unit 97. - The nanoparticle measurement device 9, and the reference-
position detection unit 91, the timingsignal generation unit 92, the light receptionsignal detection unit 93, the measurement unit 94, the low-frequency component extraction unit 95, the low-frequency component calculation unit 96, and the threshold correction unit 97 included in the nanoparticle measurement device 9 may be implemented with either hardware such as a circuit or software (a computer program) executed by a central processing unit (CPU), or may be implemented with a combination of hardware and software. - In step S22, the timing
signal generation unit 92 reads out a measurement parameter SPi-1 in the track TRi-1 from thestorage unit 10. In step S 23, the referenceposition detection sensor 6 detects theslit 202 to generate a reference-position detection signal PDS. The referenceposition detection sensor 6 outputs the reference-position detection signal PDS to the reference-position detection unit 91 of the nanoparticle measurement device 9. The reference-position detection unit 91 outputs the reference-position detection signal PDS to the timingsignal generation unit 92. - In step S24, the
optical pickup 20 receives the reflected light from thespecimen analysis disc 200, generates a light reception signal LRS, and outputs the signal to the light receptionsignal detection unit 93 of the nanoparticle measurement device 9. The light receptionsignal detection unit 93 outputs the light reception signal LRS to the low-frequency component extraction unit 95 and the measurement unit 94. -
Fig. 12 is a timing chart illustrating a relationship between the light reception signals LRS, the nanoparticle measurement timing signals BTS, the low-frequency component measurement timing signals LTS, and the reference-position detection signals PDS.Fig. 12 only shows the light reception signals LRS, the nanoparticle measurement timing signals BTS, and the low-frequency component measurement timing signals LTS for measuring thenanoparticles 131 captured in thereaction regions 211 to 213 so as to correspond toFig. 10 . -
Fig. 13 is a timing chart illustrating a relationship between the light reception signals LRS, the low-frequency component measurement timing signals LTS, a threshold TH, a corrected threshold CTH1, and the reference-position detection signals PDS.Fig. 13 corresponds toFig. 12 . - When the reaction regions 210 (211 to 218) are formed by use of the detection-target-
substance capture unit 100, the regions on the outside of thereaction regions 210 in thespecimen analysis disc 200 are in contact with theseal members 304. The regions located at the outer circumferences of thereaction regions 210 and having a predetermined width contain noise components, and are thus defined asimpurity regions 220 not to be measured.Reference numerals Fig. 10 denote therespective impurity regions 220 distinguished from the correspondingreaction regions - The timing
signal generation unit 92 generates the low-frequency component measurement timing signals LTS based on the measurement parameter SP and the reference-position detection signal PDS, and outputs the signals to the low-frequency component extraction unit 95. In the track TRi-1, the timingsignal generation unit 92 generates the low-frequency component measurement timing signals LTS_1_i-1 and LTS_2_i-1 based on the measurement parameter SPi-1 and the reference-position detection signal PDS, as shown inFig. 12 orFig. 13 . - The nanoparticle measurement device 9, the
analysis device 1, and the analysis method according to a first embodiment are illustrated with a case in which the low-frequency component measurement timing signal LTS_1_i-1 is defined as a third timing signal, and the low-frequency component measurement timing signal LTS_2_i-1 is defined as a fourth timing signal. The timingsignal generation unit 92 outputs the low-frequency component measurement timing signals LTS_1_i-1 and LTS_2_i-1 to the low-frequency component extraction unit 95. - In particular, in step S25, the timing
signal generation unit 92 generates the low-frequency component measurement timing signal LTS_1_i-1 based on the measurement parameter SPi-1 and the reference-position detection signal PDS in the track TRi-1. The timingsignal generation unit 92 outputs the low-frequency component measurement timing signal LTS_1_i-1 to the low-frequency component extraction unit 95. - The low-frequency component measurement timing signal LTS_1_i-1 is a gate pulse signal reaching a high level in a track interval Tbs_1_i-1 after the
laser light 20a passes through a track interval Tps_1_i-1 corresponding to theimpurity region 221 and thereaction region 211, for example. - The track interval Tbs_1_i-1 is an interval after the
laser light 20a passes through the track interval Tps_1_i-1 and before thelaser light 20a reaches a track interval Tps_2_i-1 corresponding to theimpurity region 222 and thereaction region 212. Namely, the track interval Tbs_1_i-1 corresponds to an interval in which a gap between theimpurity region 221 and thereaction region 211 and theimpurity region 222 and thereaction region 212 is scanned with thelaser light 20a in the track TRi-1. - The track interval Tbs, in which the region other than the
reaction regions 210 and theimpurity regions 220 is scanned with thelaser light 20a, is defined as a second track interval, and a track interval Tcs, in which thereaction region 210 is scanned with thelaser light 20a, is defined as a first track interval. - In step S26, the timing
signal generation unit 92 generates the low-frequency component measurement timing signal LTS_2_i-1 based on the measurement parameter SPi-1 and the reference-position detection signal PDS in the track TRi-1. The timingsignal generation unit 92 outputs the low-frequency component measurement timing signal LTS_2_i-1 to the low-frequency component extraction unit 95. - The low-frequency component measurement timing signal LTS_2_i-1 is a gate pulse signal reaching a high level in a track interval Tbs_2_i-1 after the
laser light 20a passes through the track interval Tps_2_i-1 corresponding to theimpurity region 222 and thereaction region 212, for example. - The track interval Tbs_2_i-1 is an interval after the
laser light 20a passes through the track interval Tps_2_i-1 and before thelaser light 20a reaches a track interval Tps_3_i-1 corresponding to theimpurity region 223 and thereaction region 213. Namely, the track interval Tbs_2_i-1 corresponds to an interval in which a gap between theimpurity region 222 and thereaction region 212 and theimpurity region 223 and thereaction region 213 is scanned with thelaser light 20a in the track TRi-1. - The low-frequency component extraction unit 95 extracts a low-frequency component LFC fluctuating because of a warp of the
specimen analysis disc 200, from the light reception signal LRS according to the low-frequency component measurement timing signal LTS, and outputs the extracted component to the low-frequency component calculation unit 96. In particular, in step S27, the low-frequency component extraction unit 95 extracts a low-frequency component LFC_1_i-1 fluctuating because of a warp of thespecimen analysis disc 200, from the light reception signal LRS according to the low-frequency component measurement timing signal LTS_1_i-1 in the track TRi-1, as shown inFig. 13 . The low-frequency component extraction unit 95 outputs the low-frequency component LFC_1_i-1 to the low-frequency component calculation unit 96. The nanoparticle measurement device 9, theanalysis device 1, and the analysis method according to a first embodiment are illustrated with a case in which the low-frequency component LFC_1_i-1 is defined as a first low-frequency component. - In step S28, the low-frequency component extraction unit 95 extracts a low-frequency component LFC_2_i-1 fluctuating because of a warp of the
specimen analysis disc 200, from the light reception signal LRS according to the low-frequency component measurement timing signal LTS_2_i-1 in the track TRi-1, as shown inFig. 13 . The low-frequency component extraction unit 95 outputs the low-frequency component LFC_2_i-1 to the low-frequency component calculation unit 96. The nanoparticle measurement device 9, theanalysis device 1, and the analysis method according to a first embodiment are illustrated below with a case in which the low-frequency component LFC_2_i-1 is defined as a second low-frequency component. - In step S29, the low-frequency component calculation unit 96 computes the low-frequency component LFC_1_i-1 and the low-frequency component LFC_2_i-1 using a polynomial interpolation, for example, so as to calculate an interpolated low-frequency component CLFC1_2_i in a track interval Tps_2_i in the track TRi, as shown in
Fig. 13 . The interpolated low-frequency component CLFC1_2_i is a low-frequency component in the track interval Tps_2_i interpolated with the low-frequency component LFC_1_i-1 and the low-frequency component LFC_2_i-1. The low-frequency component calculation unit 96 outputs the interpolated low-frequency component CLFC1_2_i to the threshold correction unit 97. - In step S30, the threshold correction unit 97 corrects a predetermined threshold TH in accordance with the interpolated low-frequency component CLFC1_2_i to set a corrected threshold CTH1_2_i in the
reaction region 212 in the track TRi, as shown inFig. 13 . The threshold correction unit 97 outputs the corrected threshold CTH1_2_i to the measurement unit 94. - In step S31 in the flow chart shown in
Fig. 8C , the nanoparticle measurement device 9 controls the opticalpickup drive circuit 8 to move theoptical pickup 20 above the track TRi so that thelaser light 20a is radiated to the track TRi of thespecimen analysis disc 200. The track TRi is thus scanned with thelaser light 20a. - In step S32, the timing
signal generation unit 92 reads out a measurement parameter SPi in the track TRi from thestorage unit 10. In step S 33, the referenceposition detection sensor 6 detects theslit 202 to generate a reference-position detection signal PDS. The referenceposition detection sensor 6 outputs the reference-position detection signal PDS to the reference-position detection unit 91 of the nanoparticle measurement device 9. The reference-position detection unit 91 outputs the reference-position detection signal PDS to the timingsignal generation unit 92. - In step S34, the
optical pickup 20 receives the reflected light from thespecimen analysis disc 200, generates a light reception signal LRS, and outputs the signal to the light receptionsignal detection unit 93 of the nanoparticle measurement device 9. The light receptionsignal detection unit 93 outputs the light reception signal LRS to the measurement unit 94 and the low-frequency component extraction unit 95. - The timing
signal generation unit 92 generates nanoparticle measurement timing signals BTS_1_i, BTS_2_i, and BTS_3_i based on the measurement parameter SPi and the reference-position detection signal PDS in the track TRi, as shown inFig. 12 . The timingsignal generation unit 92 outputs the nanoparticle measurement timing signals BTS_1_i, BTS_2_i, and BTS_3_i to the measurement unit 94. - For example, in step S35, the timing
signal generation unit 92 generates the nanoparticle measurement timing signal BTS_2_i based on the measurement parameter SPi and the reference-position detection signal PDS in the track TRi. The nanoparticle measurement timing signal BTS_2_i is a gate pulse signal reaching a high level in a track interval Tcs_2_i in which thereaction region 212 is scanned with thelaser light 20a, for example, as shown inFig. 10 ,Fig. 12 , orFig. 13 . The timingsignal generation unit 92 outputs the nanoparticle measurement timing signal BTS_2_i to the measurement unit 94. - In step S36, the measurement unit 94 extracts pulse signals from the light reception signal LRS according to the nanoparticle measurement timing signal BTS_2_i. The measurement unit 94 compares the extracted pulse signals with the corrected threshold CTH1_2_i, and determines and extracts the pulse signals having a lower signal level than the corrected threshold CTH1_2_i as the nanoparticle pulse signals BS, for example.
- In step S37, the measurement unit 94 counts the nanoparticle pulse signals BS, so as to count the
nanoparticles 131 in the track TRi in thereaction region 212. The measurement unit 94 stores the number of thenanoparticles 131 in association with thereaction region 212 and the track TRi in thestorage unit 10. - When the nanoparticle measurement device 9 measures the
nanoparticles 131 in the track TRi in thereaction region 212, the nanoparticle measurement device 9 extracts the low-frequency components LFC_1_i-1 and LFC_2_i-1 from the light reception signals LRS in the track intervals Tbs_1_i-1 and Tbs_2_i-1 before and after thelaser light 20a passes through thereaction region 212 and theimpurity region 222 in the track TRi-1 in front of the track TRi. The nanoparticle measurement device 9 calculates the interpolated low-frequency component CLFC1_2_i in the track interval Tps_2_i in the track TRi, in accordance with the low-frequency components LFC_1_i-1 and LFC_2_i-1. - The nanoparticle measurement device 9 corrects the predetermined threshold TH in accordance with the interpolated low-frequency component CLFC1_2_i to set the corrected threshold CTH1_2_i in the track TRi in the
reaction region 212 . The nanoparticle measurement device 9 extracts the nanoparticle pulse signals BS from the reception light signal LRS according to the nanoparticle measurement timing signal BTS_2_i and the corrected threshold CTH1_2_i so as to count the nanoparticle pulse signals BS. - In step S38, the nanoparticle measurement device 9 repeats the same processing from step S21 to step S37 for all of the tracks TR from the track TRs to the track TRe in all of the reaction regions 210 (211 to 218). The nanoparticle measurement device 9 thus counts the
nanoparticles 131 in all of the tracks TR in all of thereaction regions 210. - The nanoparticle measurement device 9 counts the
nanoparticles 131 in therespective reaction regions 211 to 218, so as to indirectly count thedetection target substances 121 specifically bound to thenanoparticles 131 by the antigen-antibody reaction. The measurement unit 94 stores the number of thenanoparticles 131 in association with thereaction regions 210 and the tracks TR in thestorage unit 10. - In step S39, the measurement unit 94 reads out the number of the
nanoparticles 131 from thestorage unit 10, and sums up the number of thenanoparticles 131 for each reaction region 210 (211 to 218). The measurement unit 94 directs thedisplay unit 11 to display the measurement results perreaction region 210. For example, the measurement unit 94 displays the total number of thenanoparticles 131 perreaction region 210, or displays a distribution of the number of thenanoparticles 131 on thedisplay unit 11. - When the nanoparticle measurement device 9, the
analysis device 1, and the analysis method according to a first embodiment measure thenanoparticles 131 in the track TRi in thereaction region 212, the low-frequency components LFC_1_i-1 and LFC_2_i-1 are extracted from the reception light signals LRS in the track intervals Tbs_1_i-1 and Tbs_2_i-1 in front of and behind thereaction region 212 in the tangential direction in the track TRi-1 adjacent to the track TRi in the radial direction of thespecimen analysis disc 200. - The nanoparticle measurement device 9, the
analysis device 1, and the analysis method according to a first embodiment calculate the interpolated low-frequency component CLFC1_2_i in the track interval Tps_2_i in the track TRi in accordance with the low-frequency components LFC_1_i-1 and LFC_2_i-1. The nanoparticle measurement device 9, theanalysis device 1, and the analysis method according to a first embodiment correct the predetermined threshold TH in accordance with the interpolated low-frequency component CLFC1_2_i to set the corrected threshold CTH1_2_i in the track TRi in thereaction region 212. The nanoparticle measurement device 9, theanalysis device 1, and the analysis method according to a first embodiment extract the nanoparticle pulse signals BS from the reception light signal LRS according to the nanoparticle measurement timing signal BTS_2_i and the corrected threshold CTH1_2_i so as to count the nanoparticle pulse signals BS. - The nanoparticle measurement device 9, the
analysis device 1, and the analysis method according to a first embodiment can reduce the influence of fluctuation of the low-frequency components derived from a warp of thespecimen analysis disc 200 in the radial direction and in the tangential direction, so as to suppress a decrease in accuracy of detecting thenanoparticles 131 caused by the fluctuation of the low-frequency components. - A nanoparticle measurement device, an analysis device, and an analysis method according to a second embodiment are described below with reference to
Fig. 7 ,Fig. 11 ,Fig. 14A ,Fig. 14B ,Fig. 14C ,Fig. 14D , andFig. 15 . As shown inFig. 7 , the analysis device 401 according to a second embodiment has the same structure and executes the same processing as theanalysis device 1 according to a first embodiment, but differs in the processing by the nanoparticle measurement device 409 from the nanoparticle measurement device 9. The processing by the nanoparticle measurement device 409 is described below. The same elements and signals as in theanalysis device 1 according to a first embodiment are denoted by the same reference numerals for brevity. - As shown in
Fig.7 , the analysis device 401 includes the turntable 2, theclamper 3, the turntable drive unit 4, the turntable drive circuit 5, and the reference-position detection sensor 6. The analysis device 401 further includes the guide shaft 7, theoptical pickup 20, the opticalpickup drive circuit 8, the nanoparticle measurement device 409, thestorage unit 10, and thedisplay unit 11. The nanoparticle measurement device 409 serves as a controller to control the turntable drive circuit 5 and the opticalpickup drive circuit 8. The analysis device 401 does not necessarily include thedisplay unit 11, and an external display unit may be used instead. - The nanoparticle measurement device 409 counts the number of the
nanoparticles 131 labeling thedetection target substances 121 from the extracted nanoparticle pulse signals BS. The nanoparticle measurement device 409 directs thestorage unit 10 to store the number of thenanoparticles 131 per nanoparticle measurement timing signal BTS in eachreaction region 210. The nanoparticle measurement device 409 adds up the number of thenanoparticles 131 in eachreaction region 210 and displays the sum on thedisplay unit 11. The number of thenanoparticles 131 displayed corresponds to the number of thedetection target substances 121 specifically bound to thenanoparticles 131. - The analysis method of analyzing the
detection target substances 121 by the analysis device 401, more particularly the method of analyzing thenanoparticles 131 labeling thedetection target substances 121, is described below with reference toFig. 11 ,Fig. 14A ,Fig. 14B ,Fig. 14C ,Fig. 14D , andFig. 15 .Fig. 14A ,Fig. 14B ,Fig. 14C , andFig. 14D are flow charts illustrating the analysis method of analyzing thedetection target substances 121 by the analysis device 401. - In step S41 in the flow chart shown in
Fig. 14A , the nanoparticle measurement device 409 controls the turntable drive circuit 5 to direct the turntable drive unit 4 to turn the turntable 2 so that thespecimen analysis disc 200 rotates at a constant linear velocity. - In step S42, the nanoparticle measurement device 409 directs the reference-
position detection sensor 6 to emit thedetection light 6a to thespecimen analysis disc 200. In step S43, the nanoparticle measurement device 409 directs theoptical pickup 20 to emit thelaser light 20a to thespecimen analysis disc 200. Step S43 is not necessarily performed after step S42. Step S42 may be performed after step S43, or step S42 and step S43 may be performed simultaneously. - A case of measuring the
nanoparticles 131 in the track TRi in thereaction region 212 is described below. For illustration purposes, only signal processing of measuring thenanoparticles 131 in the track TRi in thereaction region 212 is described below. - In step S51 in the flow chart shown in
Fig. 14B , the nanoparticle measurement device 409 controls the opticalpickup drive circuit 8 to move theoptical pickup 20 above the track TRi-1 so that thelaser light 20a is radiated to the track TRi-1 of thespecimen analysis disc 200. The track TRi-1 is thus scanned with thelaser light 20a. The nanoparticle measurement device 409, the analysis device 401, and the analysis method according to a second embodiment are illustrated with a case in which the track TRi is a third track, and the track TRi-1 is a fourth track. - As shown in
Fig. 11 , the nanoparticle measurement device 409 includes the reference-position detection unit 91, the timingsignal generation unit 92, the light receptionsignal detection unit 93, a measurement unit 494, a low-frequency component extraction unit 495, a low-frequency component calculation unit 496, and a threshold correction unit 497. - The nanoparticle measurement device 409, and the reference-
position detection unit 91, the timingsignal generation unit 92, the light receptionsignal detection unit 93, the measurement unit 494, the low-frequency component extraction unit 495, the low-frequency component calculation unit 496, and the threshold correction unit 497 included in the nanoparticle measurement device 409 may be implemented with either hardware such as a circuit or software (a computer program) executed by a CPU, or may be implemented with a combination of hardware and software. - In step S52, the timing
signal generation unit 92 reads out a measurement parameter SPi-1 in the track TRi-1 from thestorage unit 10. In step S 53, the referenceposition detection sensor 6 detects theslit 202 to generate a reference-position detection signal PDS. The referenceposition detection sensor 6 outputs the reference-position detection signal PDS to the reference-position detection unit 91 of the nanoparticle measurement device 409. The reference-position detection unit 91 outputs the reference-position detection signal PDS to the timingsignal generation unit 92. - In step S54, the
optical pickup 20 receives the reflected light from thespecimen analysis disc 200, generates a light reception signal LRS, and outputs the signal to the light receptionsignal detection unit 93 of the nanoparticle measurement device 409. The light receptionsignal detection unit 93 outputs the light reception signal LRS to the low-frequency component extraction unit 495 and the measurement unit 494. -
Fig. 15 is a timing chart illustrating a relationship between the light reception signals LRS, the low-frequency component measurement timing signals LTS, low-frequency components, the threshold TH, a corrected threshold CTH2, and the reference-position detection signals PDS.Fig. 15 corresponds toFig. 12 orFig. 13 . - The timing
signal generation unit 92 generates the low-frequency component measurement timing signals LTS based on the measurement parameter SP and the reference-position detection signal PDS, and outputs the signals to the low-frequency component extraction unit 495. In the track TRi-1, the timingsignal generation unit 92 generates the low-frequency component measurement timing signal LTS_2_i-1 based on the measurement parameter SPi-1 and the reference-position detection signal PDS, as shown inFig. 12 orFig. 15 . - In particular, in step S55, the timing
signal generation unit 92 generates the low-frequency component measurement timing signal LTS_2_i-1 based on the measurement parameter SPi-1 and the reference-position detection signal PDS in the track TRi-1. The timingsignal generation unit 92 outputs the low-frequency component measurement timing signal LTS_2_i-1 to the low-frequency component extraction unit 495. - The low-frequency component measurement timing signal LTS_2_i-1 is a gate pulse signal reaching a high level in the track interval Tbs_2_i-1 after the
laser light 20a passes through the track interval Tps_2_i-1 corresponding to theimpurity region 222 and thereaction region 212, for example. - The track interval Tbs_2_i-1 is an interval after the
laser light 20a passes through the track interval Tps_2_i-1 and before thelaser light 20a reaches the track interval Tps_3_i-1 corresponding to theimpurity region 223 and thereaction region 213. Namely, the track interval Tbs_2_i-1 corresponds to an interval in which a gap between theimpurity region 222 and thereaction region 212 and theimpurity region 223 and thereaction region 213 is scanned with thelaser light 20a in the track TRi-1. - The low-frequency component extraction unit 495 extracts a low-frequency component LFC fluctuating because of a warp of the
reaction region 210 of thespecimen analysis disc 200, from the light reception signal LRS according to the low-frequency component measurement timing signal LTS, and outputs the extracted component to the low-frequency component calculation unit 496. In particular, in step S56, the low-frequency component extraction unit 495 extracts a low-frequency component LFC_2_i-1 fluctuating because of a warp of thespecimen analysis disc 200, from the light reception signal LRS according to the low-frequency component measurement timing signal LTS_2_i-1 in the track TRi-1, as shown inFig. 15 . The low-frequency component extraction unit 495 outputs the low-frequency component LFC_2_i-1 to the low-frequency component calculation unit 496. The nanoparticle measurement device 409, the analysis device 401, and the analysis method according to a second embodiment are illustrated with a case in which the low-frequency component LFC_2_i-1 is defined as a third low-frequency component. - In step S61 in the flow chart shown in
Fig. 14C , the nanoparticle measurement device 409 controls the opticalpickup drive circuit 8 to move theoptical pickup 20 above the track TRi so that thelaser light 20a is radiated to the track TRi of thespecimen analysis disc 200. The track TRi is thus scanned with thelaser light 20a. - In step S62, the timing
signal generation unit 92 reads out a measurement parameter SPi in the track TRi from thestorage unit 10. In step S 63, the referenceposition detection sensor 6 detects theslit 202 to generate a reference-position detection signal PDS. The referenceposition detection sensor 6 outputs the reference-position detection signal PDS to the reference-position detection unit 91 of the nanoparticle measurement device 409. The reference-position detection unit 91 outputs the reference-position detection signal PDS to the timingsignal generation unit 92. - In step S64, the
optical pickup 20 receives the reflected light from thespecimen analysis disc 200, generates a light reception signal LRS, and outputs the signal to the light receptionsignal detection unit 93 of the nanoparticle measurement device 409. The light receptionsignal detection unit 93 outputs the light reception signal LRS to the low-frequency component extraction unit 495 and the measurement unit 494. - In step S65, the timing
signal generation unit 92 generates the low-frequency component measurement timing signal LTS_1_i based on the measurement parameter SPi and the reference-position detection signal PDS in the track TRi, as shown inFig. 12 orFig. 15 . The timingsignal generation unit 92 outputs the low-frequency component measurement timing signal LTS_1_i to the low-frequency component extraction unit 495. The nanoparticle measurement device 409, the analysis device 401, and the analysis method according to a second embodiment are illustrated with a case in which the low-frequency component measurement timing signal LTS_2_i-1 is defined as a fifth timing signal, and the low-frequency component measurement timing signal LTS_1_i is defined as a sixth timing signal. - The low-frequency component measurement timing signal LTS_1_i is a gate pulse signal reaching a high level in the track interval Tbs_1_i before the
laser light 20a reaches the track interval Tps_2_i corresponding to theimpurity region 222 and thereaction region 212, for example. - The track interval Tbs_1_i is an interval after the
laser light 20a passes through the track interval Tps_1_i and before thelaser light 20a reaches the track interval Tps_2_i corresponding to theimpurity region 222 and thereaction region 212. Namely, the track interval Tbs_1_i corresponds to an interval in which a gap between theimpurity region 221 and thereaction region 211 and theimpurity region 222 and thereaction region 212 is scanned with thelaser light 20a in the track TRi. - In step S66, the low-frequency component extraction unit 495 extracts a low-frequency component LFC_1_i fluctuating because of a warp of the
reaction region 210 of thespecimen analysis disc 200, from the light reception signal LRS according to the low-frequency component measurement timing signal LTS_1_i in the track TRi, as shown inFig. 15 . The low-frequency component extraction unit 495 outputs the low-frequency component LFC_1_i to the low-frequency component calculation unit 496. The nanoparticle measurement device 409, the analysis device 401, and the analysis method according to a second embodiment are illustrated with a case in which the low-frequency component LFC_1_i is defined as a fourth low-frequency component. - In step S67, the low-frequency component calculation unit 496 computes the low-frequency component LFC_2_i-1 and the low-frequency component LFC_1_i using a polynomial interpolation, for example, so as to calculate an interpolated low-frequency component CLFC2_2_i in the track interval Tps_2_i in the track TRi, as shown in
Fig. 15 . The interpolated low-frequency component CLFC2_2_i is a low-frequency component in the track interval Tps_2_i interpolated with the low-frequency component LFC_2_i-1 and the low-frequency component LFC_1_i. The low-frequency component calculation unit 496 outputs the interpolated low-frequency component CLFC2_2_i to the threshold correction unit 497. - In step S68, the threshold correction unit 497 corrects the predetermined threshold TH in accordance with the interpolated low-frequency component CLFC2_2_i to set a corrected threshold CTH2_2_i in the track TRi in the
reaction region 212, as shown inFig. 15 . The threshold correction unit 497 outputs the corrected threshold CTH2_2_i to the measurement unit 494. - The timing
signal generation unit 92 generates the nanoparticle measurement timing signals BTS_1_i, BTS_2_i, and BTS_3_i based on the measurement parameter SPi and the reference-position detection signal PDS in the track TRi, as shown inFig. 12 . The timingsignal generation unit 92 outputs the nanoparticle measurement timing signals BTS_1_i, BTS_2_i, and BTS_3_i to the measurement unit 494. - For example, in step S71 in the flow chart shown in
Fig. 14D , the timingsignal generation unit 92 generates the nanoparticle measurement timing signal BTS_2_i based on the measurement parameter SPi and the reference-position detection signal PDS in the track TRi. The nanoparticle measurement timing signal BTS_2_i is a gate pulse signal reaching a high level in the track interval Tcs_2_i in which thereaction region 212 is scanned with thelaser light 20a, for example, as shown inFig. 10 ,Fig. 12 , orFig. 15 . The timingsignal generation unit 92 outputs the nanoparticle measurement timing signal BTS_2_i to the measurement unit 494. - In step S72, the measurement unit 494 extracts pulse signals from the light reception signal LRS according to the nanoparticle measurement timing signal BTS_2_i. The measurement unit 494 compares the extracted pulse signals with the corrected threshold CTH2_2_i, and determines and extracts the pulse signals having a lower signal level than the corrected threshold CTH2_2_i as the nanoparticle pulse signals BS, for example.
- In step S73, the measurement unit 494 counts the nanoparticle pulse signals BS, so as to count the
nanoparticles 131 in the track TRi in thereaction region 212. The measurement unit 494 stores the number of thenanoparticles 131 in association with thereaction region 212 and the track TRi in thestorage unit 10. - When the nanoparticle measurement device 409 measures the
nanoparticles 131 in the track TRi in thereaction region 212, the nanoparticle measurement device 409 extracts the low-frequency component LFC_2_i-1 from the light reception signal LRS in the track interval Tbs_2_i-1 after thelaser light 20a passes through thereaction region 212 and theimpurity region 222 in the track TRi-1 in front of the track TRi. - The nanoparticle measurement device 409 extracts the low-frequency component LFC_1_i from the light reception signal LRS in the track interval Tbs_1_i before the
laser light 20a reaches thereaction region 212 and theimpurity region 222 in the track TRi. The nanoparticle measurement device 409 calculates the interpolated low-frequency component CLFC2_2_i in the track interval Tps_2_i in the track TRi in accordance with the low-frequency components LFC_2_i-1 and LFC_1_i. - The nanoparticle measurement device 409 corrects the predetermined threshold TH in accordance with the interpolated low-frequency component CLFC2_2_i to set the corrected threshold CTH2_2_i in the track TRi in the
reaction region 212. The nanoparticle measurement device 409 extracts the nanoparticle pulse signals BS from the reception light signal LRS according to the nanoparticle measurement timing signal BTS_2_i and the corrected threshold CTH2_2_i so as to count the nanoparticle pulse signals BS. - In step S74, the nanoparticle measurement device 409 repeats the same processing from step S51 to step S73 for all of the tracks TR from the track TRs to the track TRe in all of the reaction regions 210 (211 to 218). The nanoparticle measurement device 409 thus counts the
nanoparticles 131 in all of the tracks TR in all of thereaction regions 210. - The nanoparticle measurement device 409 counts the
nanoparticles 131 in therespective reaction regions 211 to 218, so as to indirectly count thedetection target substances 121 specifically bound to thenanoparticles 131 by the antigen-antibody reaction. The measurement unit 494 stores the number of thenanoparticles 131 in association with thereaction regions 210 and the tracks TR in thestorage unit 10. - In step S75, the measurement unit 494 reads out the number of the
nanoparticles 131 from thestorage unit 10, and sums up the number of thenanoparticles 131 for each reaction region 210 (211 to 218) . The measurement unit 494 directs thedisplay unit 11 to display the measurement results perreaction region 210. For example, the measurement unit 494 displays the total number of thenanoparticles 131 perreaction region 210, or displays a distribution of the number of thenanoparticles 131 on thedisplay unit 11. - When the nanoparticle measurement device 409, the analysis device 401, and the analysis method according to a second embodiment measure the
nanoparticles 131 in the track TRi in thereaction region 212, the low-frequency component LFC_2_i-1 is extracted from the reception light signal LRS in the track interval Tbs_2_i-1 behind thereaction region 212 in the tangential direction in the track TRi-1 adjacent to the track TRi in the radial direction of thespecimen analysis disc 200. - The nanoparticle measurement device 409, the analysis device 401, and the analysis method according to a second embodiment further extract the low-frequency component LFC_1_i from the reception light signal LRS in the track interval Tbs_1_i in front of the
reaction region 212 in the tangential direction in the track TRi. The nanoparticle measurement device 409, the analysis device 401, and the analysis method according to a second embodiment calculate the interpolated low-frequency component CLFC2_2_i in the track interval Tps_2_i in the track TRi in accordance with the low-frequency components LFC_2_i-1 and LFC_1_i. - The nanoparticle measurement device 409, the analysis device 401, and the analysis method according to a second embodiment correct the predetermined threshold TH in accordance with the interpolated low-frequency component CLFC2_2_i to set the corrected threshold CTH2_2_i in the track TRi in the
reaction region 212. The nanoparticle measurement device 409, the analysis device 401, and the analysis method according to a second embodiment extract the nanoparticle pulse signals BS from the reception light signal LRS according to the nanoparticle measurement timing signal BTS_2_i and the corrected threshold CTH2_2_i so as to count the nanoparticle pulse signals BS. - The nanoparticle measurement device 409, the analysis device 401, and the analysis method according to a second embodiment can reduce the influence of fluctuation of the low-frequency components derived from a warp of the
specimen analysis disc 200 in the radial direction and in the tangential direction, so as to suppress a decrease in accuracy of detecting thenanoparticles 131 caused by fluctuation of the low-frequency components. - It should be understood that the present invention is not intended to be limited to first or second embodiment described above, and various modifications will be apparent to those skilled in the art without departing from the scope of the present invention.
- The nanoparticle measurement device 9 in the
analysis device 1 according to a first embodiment includes the reference-position detection unit 91, the timingsignal generation unit 92, the light receptionsignal detection unit 93, the measurement unit 94, the low-frequency component extraction unit 95, the low-frequency component calculation unit 96, and the threshold correction unit 97, as shown inFig. 11 . Alternatively, for example, the nanoparticle measurement device 9 in theanalysis device 1 according to a first embodiment may include the timingsignal generation unit 92, the measurement unit 94, the low-frequency component extraction unit 95, the low-frequency component calculation unit 96, and the threshold correction unit 97. - In such a case, the
analysis device 1 includes the turntable 2, theclamper 3, the turntable drive unit 4, the turntable drive circuit 5, the reference-position detection sensor 6, the guide shaft 7, theoptical pickup 20, the opticalpickup drive circuit 8, a controller, thestorage unit 10, and thedisplay unit 11, wherein the controller includes the reference-position detection unit 91, the light receptionsignal detection unit 93, and the nanoparticle measurement device 9. - The nanoparticle measurement device 409 in the analysis device 401 according to a second embodiment includes the reference-
position detection unit 91, the timingsignal generation unit 92, the light receptionsignal detection unit 93, the measurement unit 494, the low-frequency component extraction unit 495, the low-frequency component calculation unit 496, and the threshold correction unit 497, as shown inFig. 11 . Alternatively, for example, the nanoparticle measurement device 409 in the analysis device 401 according to a second embodiment may include the timingsignal generation unit 92, the measurement unit 494, the low-frequency component extraction unit 495, the low-frequency component calculation unit 496, and the threshold correction unit 497. - In such a case, the analysis device 401 includes the turntable 2, the
clamper 3, the turntable drive unit 4, the turntable drive circuit 5, the reference-position detection sensor 6, the guide shaft 7, theoptical pickup 20, the opticalpickup drive circuit 8, a controller, thestorage unit 10, and thedisplay unit 11, wherein the controller includes the reference-position detection unit 91, the light receptionsignal detection unit 93, and the nanoparticle measurement device 409. -
Fig. 12 ,Fig. 13 , orFig. 15 indicates the nanoparticle measurement timing signals BTS and the low-frequency component measurement timing signals LTS as rectangular gate pulse signals which rise at the start point and fall at the end point. The nanoparticle measurement timing signals BTS and the low-frequency component measurement timing signals LTS are not limited to the gate pulse signals and may be trigger pulse signals which reach a high level at the start point and at the end point. -
Fig. 13 orFig. 15 indicates the two sampling points for the respective low-frequency components when the interpolated low-frequency component CLFC is calculated from the low-frequency components LFC extracted from the light reception signal LRS in accordance with the low-frequency component measurement timing signal LTS. The number of the sampling points for the respective low-frequency components LFC is not limited to two, and may be three or more. - When the
nanoparticles 131 in the track TRi in thereaction region 212 are measured, the nanoparticle measurement device 9 or 409 may extract the low-frequency components LFC_1_i and LFC_1_i from the light reception signals LRS in the track intervals Tbs_1_i and Tbs_2_i in front of and behind the track interval Tps_2_i corresponding to theimpurity region 222 and thereaction region 212 in accordance with the low-frequency component measurement timing signals LTS_1_i and LTS_2_i in the track TRi. - The nanoparticle measurement device 9 or 409 extracts the light reception signal LRS in the track interval Tcs_2_i according to the nanoparticle measurement timing signal BTS_2_i. The nanoparticle measurement device 9 or 409 stores the extracted light reception signal LRS and the low-frequency components LFC_1_i and LFC_1_i in the
storage unit 10. The nanoparticle measurement device 9 or 409 reads out the low-frequency components LFC_1_i and LFC_1_i from thestorage unit 10, and calculates the interpolated low-frequency component CLFC_2_i in the track interval Tps_2_i in the track TRi in accordance with the low-frequency components LFC_1_i and LFC_1_i. - The nanoparticle measurement device 9 or 409 corrects the predetermined threshold TH in accordance with the interpolated low-frequency component CLFC_2_i to set a corrected threshold CTH_2_i in the track TRi in the
reaction region 212. The nanoparticle measurement device 9 or 409 reads out, from thestorage unit 10, the light reception signal LRS extracted from the nanoparticle measurement timing signal BTS_2_i. The nanoparticle measurement device 9 or 409 extracts and counts the nanoparticle signals BS from the reception light signal LRS according to the corrected threshold CTH_2_i. - The nanoparticle measurement device, the analysis device, and the analysis method described above can achieve the effects similar to the nanoparticle measurement device 9 or 409, the
analysis device 1 or 401, and the analysis method according to first or second embodiment.
Claims (6)
- A nanoparticle measurement device (9, 409) comprising:a timing signal generation unit (92) configured to generate a first timing signal (BTS) corresponding to a first track interval (Tcs) in a reaction region (210) formed in a disc for specimen analysis (200) having a plurality of tracks (TR) on which nanoparticles (131) binding to substances (121) to be detected are captured per track (TR), and a second timing signal (LTS) corresponding to a second track interval (Tbs) different from the reaction region (210), the tracks (TR) being formed from an inner side to an outer side of the disc for specimen analysis (200) ;a low-frequency component extraction unit (95, 495) configured to extract a low-frequency component (LFC) fluctuating because of a warp of the disc for specimen analysis (200) from a light reception signal (LRS) according to the second timing signal (LTS), the light reception signal (LRS) being generated when a laser light (20a) is radiated to the reaction region (210) and a reflected light is received from the reaction region (210);a low-frequency component calculation unit (96, 496) configured to calculate an interpolated low-frequency component (CLFC) corresponding to the first track interval (Tcs) and interpolated in accordance with the low-frequency component (LFC);a threshold correction unit (97, 497) configured to correct a predetermined threshold (TH) in accordance with the interpolated low-frequency component (CLFC) to set a corrected threshold (CTH); anda measurement unit (94, 494) configured to extract nanoparticle pulse signals (BS) from the light reception signal (LRS) according to the first timing signal (BTS) and the corrected threshold (CTH), and count the nanoparticle pulse signals (BS), so as to count the nanoparticles (131) captured in the first track interval (Tcs) in the reaction region (210) .
- The nanoparticle measurement device (9, 409) according to claim 1, wherein the disc for specimen analysis (200) comprises a region, defined as an impurity region (220), located at an outer circumference of the reaction region (210) and having a predetermined width.
- The nanoparticle measurement device (9) according to claim 2, wherein, when the laser light (20a) is radiated to the reaction region (210), the reflected light is received from the reaction region (210) to generate the light reception signal (LRS), and the nanoparticles (131) captured in a first track (TRi) of the plurality of tracks (TR) in the reaction region (210) are counted in accordance with the light reception signal (LRS),
the timing signal generation unit (92) generates a third timing signal (LTS_1_i-1) which is the second timing signal (LTS) in a track interval before the laser light (20a) reaches the reaction region (210) and the impurity region (220), and generates a fourth timing signal (LTS_2_i-1) which is the second timing signal (LTS) in a track interval after the laser light (20a) passes through the reaction region (210) and the impurity region (220), in a second track (TRi-1) different from the first track (TRi),
the low-frequency component extraction unit (95) extracts a first low-frequency component (LFC_1_i-1) from the light reception signal (LRS) according to the third timing signal (LTS_1_i-1), and a second low-frequency component (LFC_2_i-1) from the light reception signal (LRS) according to the fourth timing signal (LTS_2_i-1), and
the low-frequency component calculation unit (96) calculates the interpolated low-frequency component (CLFC) corresponding to the first track interval (Tcs) in accordance with the first and second low-frequency components (LFC_1_i-1, LFC_2_i-1). - The nanoparticle measurement device (409) according to claim 2, wherein, when the laser light (20a) is radiated to the reaction region (210), the reflected light is received from the reaction region (210) to generate the light reception signal (LRS), and the nanoparticles (131) captured in a third track (TRi) of the plurality of tracks (TR) in the reaction region (210) are counted in accordance with the light reception signal (LRS),
the timing signal generation unit (92) generates a fifth timing signal (LTS_2_i-1) which is the second timing signal (LTS) in a track interval after the laser light (20a) passes through the reaction region (210) and the impurity region (220) in a fourth track (TRi-1) different from the third track (TRi) in a fourth track (TRi-1) different from the third track (TRi), and generates a sixth timing signal (LTS_1_i) which is the second timing signal (LTS) in a track interval before the laser light (20a) reaches the reaction region (210) and the impurity region (220) in the third track (TRi),
the low-frequency component extraction unit (495) extracts a third low-frequency component (LFC_2_i-1) from the light reception signal (LRS) according to the fifth timing signal (LTS_2_i-1), and a fourth low-frequency component (LFC_1_i) from the light reception signal (LRS) according to the sixth timing signal (LTS_1_i), and
the low-frequency component calculation unit (496) calculates the interpolated low-frequency component (CLFC) corresponding to the first track interval (Tcs) in accordance with the third and fourth low-frequency components (LFC_2_i-1, LFC_1_i). - An analysis device (1, 401) comprising:a turntable (2) holding a disc for specimen analysis (200);a turntable drive unit (4) configured to rotate the turntable (2);a turntable drive circuit (5) configured to control the turntable drive unit (4);an optical pickup (20) driven in a direction perpendicular to a rotation axis (C2) of the turntable (2), and configured to emit a laser light (20a) to a reaction region (210), receive a reflected light from the reaction region (210), and generate a light reception signal (LRS);an optical pickup drive circuit (8) configured to control an operation of the optical pickup (20); anda controller (9, 409) configured to control the turntable drive circuit (5) and the optical pickup drive circuit (8), whereinthe controller (9, 409) comprises the nanoparticle measurement device (9, 409) according to any one of claims 1 to 4.
- An analysis method comprising:rotating a disc for specimen analysis (200) having a plurality of tracks (TR) formed from an inner side to an outer side and having a reaction region (210) on which nanoparticles (131) binding to substances (121) to be detected are captured per track (TR);radiating a laser light (20a) to the reaction region (210) per track (TR);receiving a reflected light from the reaction region (210) to generate a light reception signal (LRS);generating a first timing signal (BTS) corresponding to a first track interval (Tcs) in the reaction region (210), and a second timing signal (LTS) corresponding to a second track interval (Tbs) different from the reaction region (210);extracting a low-frequency component (LFC) fluctuating because of a warp of the disc for specimen analysis (200) from the light reception signal (LRS) according to the second timing signal (LTS);calculating an interpolated low-frequency component (CLFC) corresponding to the first track interval (Tcs) and interpolated in accordance with the low-frequency component (LFC);correcting a predetermined threshold (TH) in accordance with the interpolated low-frequency component (CLFC) to set a corrected threshold (CTH);extracting nanoparticle pulse signals (BS) from the light reception signal (LRS) according to the first timing signal (BTS) and the corrected threshold (CTH); andcounting the nanoparticle pulse signals (BS) so as to count the nanoparticles (131) captured in the first track interval (Tcs) in the reaction region (210).
Applications Claiming Priority (1)
| Application Number | Priority Date | Filing Date | Title |
|---|---|---|---|
| JP2018058391A JP6883248B2 (en) | 2018-03-26 | 2018-03-26 | Particle measuring machine, analyzer, and analysis method |
Publications (2)
| Publication Number | Publication Date |
|---|---|
| EP3546941A1 true EP3546941A1 (en) | 2019-10-02 |
| EP3546941B1 EP3546941B1 (en) | 2021-04-21 |
Family
ID=65911039
Family Applications (1)
| Application Number | Title | Priority Date | Filing Date |
|---|---|---|---|
| EP19164799.9A Active EP3546941B1 (en) | 2018-03-26 | 2019-03-25 | Analysis device and analysis method using nanoparticles |
Country Status (3)
| Country | Link |
|---|---|
| US (1) | US11499968B2 (en) |
| EP (1) | EP3546941B1 (en) |
| JP (1) | JP6883248B2 (en) |
Families Citing this family (2)
| Publication number | Priority date | Publication date | Assignee | Title |
|---|---|---|---|---|
| JP6687834B2 (en) * | 2016-02-03 | 2020-04-28 | 株式会社Jvcケンウッド | Analysis device and analysis method |
| CN114486689B (en) * | 2022-04-15 | 2022-07-05 | 南京颐兰贝生物科技有限责任公司 | Blood cell pulse counting error correction method and correction device |
Citations (8)
| Publication number | Priority date | Publication date | Assignee | Title |
|---|---|---|---|---|
| JP2001126261A (en) | 1999-10-29 | 2001-05-11 | Yamaha Corp | Optical disk reproducing device |
| US20050037484A1 (en) * | 2003-04-23 | 2005-02-17 | Norbert Staimer | Optical bio-discs including spiral fluidic circuits for performing assays |
| US20050111328A1 (en) * | 2003-11-24 | 2005-05-26 | General Electric Company | Sensor system and methods for improved quantitation of environmental parameters |
| US20080304073A1 (en) * | 2007-03-26 | 2008-12-11 | Nolte David D | Method and apparatus for conjugate quadrature interferometric detection of an immunoassay |
| US7812318B1 (en) * | 2008-03-14 | 2010-10-12 | Advanced Technology Applications, Llc | Electromagnetic biosensor |
| JP2015127691A (en) | 2013-11-28 | 2015-07-09 | 株式会社Jvcケンウッド | Substrate for analysis, method of producing substrate for analysis and substrate analyzing device |
| WO2017056526A1 (en) * | 2015-09-30 | 2017-04-06 | 株式会社Jvcケンウッド | Analysis device and analysis method |
| WO2017134944A1 (en) * | 2016-02-03 | 2017-08-10 | 株式会社Jvcケンウッド | Analysis device and analysis method |
Family Cites Families (4)
| Publication number | Priority date | Publication date | Assignee | Title |
|---|---|---|---|---|
| US5101395A (en) * | 1990-06-11 | 1992-03-31 | International Business Machines Corporation | Data detection employing high-speed baseline tracking compensation |
| JP2000020969A (en) * | 1998-06-30 | 2000-01-21 | Matsushita Electric Ind Co Ltd | Information recording / reproducing device |
| US9034261B2 (en) * | 2012-09-12 | 2015-05-19 | Sony Corporation | System and method for depositing particles on a disc |
| WO2017154751A1 (en) * | 2016-03-11 | 2017-09-14 | パナソニック株式会社 | Sample accommodation disk and fluorescence detection device using same |
-
2018
- 2018-03-26 JP JP2018058391A patent/JP6883248B2/en not_active Expired - Fee Related
-
2019
- 2019-02-25 US US16/284,169 patent/US11499968B2/en active Active
- 2019-03-25 EP EP19164799.9A patent/EP3546941B1/en active Active
Patent Citations (8)
| Publication number | Priority date | Publication date | Assignee | Title |
|---|---|---|---|---|
| JP2001126261A (en) | 1999-10-29 | 2001-05-11 | Yamaha Corp | Optical disk reproducing device |
| US20050037484A1 (en) * | 2003-04-23 | 2005-02-17 | Norbert Staimer | Optical bio-discs including spiral fluidic circuits for performing assays |
| US20050111328A1 (en) * | 2003-11-24 | 2005-05-26 | General Electric Company | Sensor system and methods for improved quantitation of environmental parameters |
| US20080304073A1 (en) * | 2007-03-26 | 2008-12-11 | Nolte David D | Method and apparatus for conjugate quadrature interferometric detection of an immunoassay |
| US7812318B1 (en) * | 2008-03-14 | 2010-10-12 | Advanced Technology Applications, Llc | Electromagnetic biosensor |
| JP2015127691A (en) | 2013-11-28 | 2015-07-09 | 株式会社Jvcケンウッド | Substrate for analysis, method of producing substrate for analysis and substrate analyzing device |
| WO2017056526A1 (en) * | 2015-09-30 | 2017-04-06 | 株式会社Jvcケンウッド | Analysis device and analysis method |
| WO2017134944A1 (en) * | 2016-02-03 | 2017-08-10 | 株式会社Jvcケンウッド | Analysis device and analysis method |
Also Published As
| Publication number | Publication date |
|---|---|
| US20190293640A1 (en) | 2019-09-26 |
| US11499968B2 (en) | 2022-11-15 |
| JP2019168420A (en) | 2019-10-03 |
| EP3546941B1 (en) | 2021-04-21 |
| JP6883248B2 (en) | 2021-06-09 |
Similar Documents
| Publication | Publication Date | Title |
|---|---|---|
| US10866233B2 (en) | Analysis device and analysis method | |
| US10520417B2 (en) | Analysis method and analysis device | |
| EP3546941B1 (en) | Analysis device and analysis method using nanoparticles | |
| US11300580B2 (en) | Analysis device and analysis method | |
| US10809178B2 (en) | Analysis device and analysis method | |
| EP3483587B1 (en) | Analysis device and analysis method | |
| CN112219107B (en) | Analysis threshold value generation device and analysis threshold value generation method | |
| US11692924B2 (en) | Optical device and method for detection target substance analysis | |
| JP6958166B2 (en) | Analytical equipment and analytical method | |
| CN1643365A (en) | Analysis device and analysis disk used therefor | |
| US11927521B2 (en) | Analysis threshold determination device and analysis threshold determination method | |
| JP4665673B2 (en) | Optical analyzer | |
| US12007325B2 (en) | Analysis device and analysis method | |
| CN1846262A (en) | Disc drive apparatus, and method for recognizing CD and dvd | |
| JP7218788B2 (en) | ANALYSIS THRESHOLD GENERATOR AND ANALYSIS THRESHOLD GENERATION METHOD | |
| JP2020118693A (en) | Disk for sample analysis | |
| EP4310497A1 (en) | Analysis device and analysis method | |
| EP3951360A1 (en) | Analysis device and analysis method | |
| KR100626434B1 (en) | Land Prefit Detector |
Legal Events
| Date | Code | Title | Description |
|---|---|---|---|
| PUAI | Public reference made under article 153(3) epc to a published international application that has entered the european phase |
Free format text: ORIGINAL CODE: 0009012 |
|
| STAA | Information on the status of an ep patent application or granted ep patent |
Free format text: STATUS: THE APPLICATION HAS BEEN PUBLISHED |
|
| AK | Designated contracting states |
Kind code of ref document: A1 Designated state(s): AL AT BE BG CH CY CZ DE DK EE ES FI FR GB GR HR HU IE IS IT LI LT LU LV MC MK MT NL NO PL PT RO RS SE SI SK SM TR |
|
| AX | Request for extension of the european patent |
Extension state: BA ME |
|
| STAA | Information on the status of an ep patent application or granted ep patent |
Free format text: STATUS: REQUEST FOR EXAMINATION WAS MADE |
|
| 17P | Request for examination filed |
Effective date: 20200330 |
|
| RBV | Designated contracting states (corrected) |
Designated state(s): AL AT BE BG CH CY CZ DE DK EE ES FI FR GB GR HR HU IE IS IT LI LT LU LV MC MK MT NL NO PL PT RO RS SE SI SK SM TR |
|
| GRAP | Despatch of communication of intention to grant a patent |
Free format text: ORIGINAL CODE: EPIDOSNIGR1 |
|
| STAA | Information on the status of an ep patent application or granted ep patent |
Free format text: STATUS: GRANT OF PATENT IS INTENDED |
|
| INTG | Intention to grant announced |
Effective date: 20200925 |
|
| GRAJ | Information related to disapproval of communication of intention to grant by the applicant or resumption of examination proceedings by the epo deleted |
Free format text: ORIGINAL CODE: EPIDOSDIGR1 |
|
| STAA | Information on the status of an ep patent application or granted ep patent |
Free format text: STATUS: REQUEST FOR EXAMINATION WAS MADE |
|
| GRAS | Grant fee paid |
Free format text: ORIGINAL CODE: EPIDOSNIGR3 |
|
| STAA | Information on the status of an ep patent application or granted ep patent |
Free format text: STATUS: GRANT OF PATENT IS INTENDED |
|
| GRAP | Despatch of communication of intention to grant a patent |
Free format text: ORIGINAL CODE: EPIDOSNIGR1 |
|
| INTC | Intention to grant announced (deleted) | ||
| INTG | Intention to grant announced |
Effective date: 20210205 |
|
| GRAA | (expected) grant |
Free format text: ORIGINAL CODE: 0009210 |
|
| STAA | Information on the status of an ep patent application or granted ep patent |
Free format text: STATUS: THE PATENT HAS BEEN GRANTED |
|
| AK | Designated contracting states |
Kind code of ref document: B1 Designated state(s): AL AT BE BG CH CY CZ DE DK EE ES FI FR GB GR HR HU IE IS IT LI LT LU LV MC MK MT NL NO PL PT RO RS SE SI SK SM TR |
|
| REG | Reference to a national code |
Ref country code: GB Ref legal event code: FG4D |
|
| REG | Reference to a national code |
Ref country code: CH Ref legal event code: EP |
|
| REG | Reference to a national code |
Ref country code: DE Ref legal event code: R096 Ref document number: 602019003979 Country of ref document: DE Ref country code: IE Ref legal event code: FG4D |
|
| REG | Reference to a national code |
Ref country code: AT Ref legal event code: REF Ref document number: 1385163 Country of ref document: AT Kind code of ref document: T Effective date: 20210515 |
|
| REG | Reference to a national code |
Ref country code: LT Ref legal event code: MG9D |
|
| REG | Reference to a national code |
Ref country code: AT Ref legal event code: MK05 Ref document number: 1385163 Country of ref document: AT Kind code of ref document: T Effective date: 20210421 |
|
| REG | Reference to a national code |
Ref country code: NL Ref legal event code: MP Effective date: 20210421 |
|
| PG25 | Lapsed in a contracting state [announced via postgrant information from national office to epo] |
Ref country code: HR Free format text: LAPSE BECAUSE OF FAILURE TO SUBMIT A TRANSLATION OF THE DESCRIPTION OR TO PAY THE FEE WITHIN THE PRESCRIBED TIME-LIMIT Effective date: 20210421 Ref country code: LT Free format text: LAPSE BECAUSE OF FAILURE TO SUBMIT A TRANSLATION OF THE DESCRIPTION OR TO PAY THE FEE WITHIN THE PRESCRIBED TIME-LIMIT Effective date: 20210421 Ref country code: FI Free format text: LAPSE BECAUSE OF FAILURE TO SUBMIT A TRANSLATION OF THE DESCRIPTION OR TO PAY THE FEE WITHIN THE PRESCRIBED TIME-LIMIT Effective date: 20210421 Ref country code: NL Free format text: LAPSE BECAUSE OF FAILURE TO SUBMIT A TRANSLATION OF THE DESCRIPTION OR TO PAY THE FEE WITHIN THE PRESCRIBED TIME-LIMIT Effective date: 20210421 Ref country code: BG Free format text: LAPSE BECAUSE OF FAILURE TO SUBMIT A TRANSLATION OF THE DESCRIPTION OR TO PAY THE FEE WITHIN THE PRESCRIBED TIME-LIMIT Effective date: 20210721 Ref country code: AT Free format text: LAPSE BECAUSE OF FAILURE TO SUBMIT A TRANSLATION OF THE DESCRIPTION OR TO PAY THE FEE WITHIN THE PRESCRIBED TIME-LIMIT Effective date: 20210421 |
|
| PG25 | Lapsed in a contracting state [announced via postgrant information from national office to epo] |
Ref country code: IS Free format text: LAPSE BECAUSE OF FAILURE TO SUBMIT A TRANSLATION OF THE DESCRIPTION OR TO PAY THE FEE WITHIN THE PRESCRIBED TIME-LIMIT Effective date: 20210821 Ref country code: GR Free format text: LAPSE BECAUSE OF FAILURE TO SUBMIT A TRANSLATION OF THE DESCRIPTION OR TO PAY THE FEE WITHIN THE PRESCRIBED TIME-LIMIT Effective date: 20210722 Ref country code: SE Free format text: LAPSE BECAUSE OF FAILURE TO SUBMIT A TRANSLATION OF THE DESCRIPTION OR TO PAY THE FEE WITHIN THE PRESCRIBED TIME-LIMIT Effective date: 20210421 Ref country code: PT Free format text: LAPSE BECAUSE OF FAILURE TO SUBMIT A TRANSLATION OF THE DESCRIPTION OR TO PAY THE FEE WITHIN THE PRESCRIBED TIME-LIMIT Effective date: 20210823 Ref country code: RS Free format text: LAPSE BECAUSE OF FAILURE TO SUBMIT A TRANSLATION OF THE DESCRIPTION OR TO PAY THE FEE WITHIN THE PRESCRIBED TIME-LIMIT Effective date: 20210421 Ref country code: NO Free format text: LAPSE BECAUSE OF FAILURE TO SUBMIT A TRANSLATION OF THE DESCRIPTION OR TO PAY THE FEE WITHIN THE PRESCRIBED TIME-LIMIT Effective date: 20210721 Ref country code: LV Free format text: LAPSE BECAUSE OF FAILURE TO SUBMIT A TRANSLATION OF THE DESCRIPTION OR TO PAY THE FEE WITHIN THE PRESCRIBED TIME-LIMIT Effective date: 20210421 Ref country code: PL Free format text: LAPSE BECAUSE OF FAILURE TO SUBMIT A TRANSLATION OF THE DESCRIPTION OR TO PAY THE FEE WITHIN THE PRESCRIBED TIME-LIMIT Effective date: 20210421 |
|
| REG | Reference to a national code |
Ref country code: DE Ref legal event code: R097 Ref document number: 602019003979 Country of ref document: DE |
|
| PG25 | Lapsed in a contracting state [announced via postgrant information from national office to epo] |
Ref country code: SK Free format text: LAPSE BECAUSE OF FAILURE TO SUBMIT A TRANSLATION OF THE DESCRIPTION OR TO PAY THE FEE WITHIN THE PRESCRIBED TIME-LIMIT Effective date: 20210421 Ref country code: EE Free format text: LAPSE BECAUSE OF FAILURE TO SUBMIT A TRANSLATION OF THE DESCRIPTION OR TO PAY THE FEE WITHIN THE PRESCRIBED TIME-LIMIT Effective date: 20210421 Ref country code: ES Free format text: LAPSE BECAUSE OF FAILURE TO SUBMIT A TRANSLATION OF THE DESCRIPTION OR TO PAY THE FEE WITHIN THE PRESCRIBED TIME-LIMIT Effective date: 20210421 Ref country code: CZ Free format text: LAPSE BECAUSE OF FAILURE TO SUBMIT A TRANSLATION OF THE DESCRIPTION OR TO PAY THE FEE WITHIN THE PRESCRIBED TIME-LIMIT Effective date: 20210421 Ref country code: DK Free format text: LAPSE BECAUSE OF FAILURE TO SUBMIT A TRANSLATION OF THE DESCRIPTION OR TO PAY THE FEE WITHIN THE PRESCRIBED TIME-LIMIT Effective date: 20210421 Ref country code: RO Free format text: LAPSE BECAUSE OF FAILURE TO SUBMIT A TRANSLATION OF THE DESCRIPTION OR TO PAY THE FEE WITHIN THE PRESCRIBED TIME-LIMIT Effective date: 20210421 Ref country code: SM Free format text: LAPSE BECAUSE OF FAILURE TO SUBMIT A TRANSLATION OF THE DESCRIPTION OR TO PAY THE FEE WITHIN THE PRESCRIBED TIME-LIMIT Effective date: 20210421 |
|
| PLBE | No opposition filed within time limit |
Free format text: ORIGINAL CODE: 0009261 |
|
| STAA | Information on the status of an ep patent application or granted ep patent |
Free format text: STATUS: NO OPPOSITION FILED WITHIN TIME LIMIT |
|
| 26N | No opposition filed |
Effective date: 20220124 |
|
| PG25 | Lapsed in a contracting state [announced via postgrant information from national office to epo] |
Ref country code: IS Free format text: LAPSE BECAUSE OF FAILURE TO SUBMIT A TRANSLATION OF THE DESCRIPTION OR TO PAY THE FEE WITHIN THE PRESCRIBED TIME-LIMIT Effective date: 20210821 Ref country code: AL Free format text: LAPSE BECAUSE OF FAILURE TO SUBMIT A TRANSLATION OF THE DESCRIPTION OR TO PAY THE FEE WITHIN THE PRESCRIBED TIME-LIMIT Effective date: 20210421 |
|
| PG25 | Lapsed in a contracting state [announced via postgrant information from national office to epo] |
Ref country code: IT Free format text: LAPSE BECAUSE OF FAILURE TO SUBMIT A TRANSLATION OF THE DESCRIPTION OR TO PAY THE FEE WITHIN THE PRESCRIBED TIME-LIMIT Effective date: 20210421 |
|
| PG25 | Lapsed in a contracting state [announced via postgrant information from national office to epo] |
Ref country code: MC Free format text: LAPSE BECAUSE OF FAILURE TO SUBMIT A TRANSLATION OF THE DESCRIPTION OR TO PAY THE FEE WITHIN THE PRESCRIBED TIME-LIMIT Effective date: 20210421 |
|
| REG | Reference to a national code |
Ref country code: CH Ref legal event code: PL |
|
| REG | Reference to a national code |
Ref country code: BE Ref legal event code: MM Effective date: 20220331 |
|
| PG25 | Lapsed in a contracting state [announced via postgrant information from national office to epo] |
Ref country code: LU Free format text: LAPSE BECAUSE OF NON-PAYMENT OF DUE FEES Effective date: 20220325 Ref country code: LI Free format text: LAPSE BECAUSE OF NON-PAYMENT OF DUE FEES Effective date: 20220331 Ref country code: IE Free format text: LAPSE BECAUSE OF NON-PAYMENT OF DUE FEES Effective date: 20220325 Ref country code: CH Free format text: LAPSE BECAUSE OF NON-PAYMENT OF DUE FEES Effective date: 20220331 |
|
| PG25 | Lapsed in a contracting state [announced via postgrant information from national office to epo] |
Ref country code: BE Free format text: LAPSE BECAUSE OF NON-PAYMENT OF DUE FEES Effective date: 20220331 |
|
| PG25 | Lapsed in a contracting state [announced via postgrant information from national office to epo] |
Ref country code: MK Free format text: LAPSE BECAUSE OF FAILURE TO SUBMIT A TRANSLATION OF THE DESCRIPTION OR TO PAY THE FEE WITHIN THE PRESCRIBED TIME-LIMIT Effective date: 20210421 Ref country code: CY Free format text: LAPSE BECAUSE OF FAILURE TO SUBMIT A TRANSLATION OF THE DESCRIPTION OR TO PAY THE FEE WITHIN THE PRESCRIBED TIME-LIMIT Effective date: 20210421 |
|
| PGFP | Annual fee paid to national office [announced via postgrant information from national office to epo] |
Ref country code: DE Payment date: 20240130 Year of fee payment: 6 Ref country code: GB Payment date: 20240201 Year of fee payment: 6 |
|
| PG25 | Lapsed in a contracting state [announced via postgrant information from national office to epo] |
Ref country code: HU Free format text: LAPSE BECAUSE OF FAILURE TO SUBMIT A TRANSLATION OF THE DESCRIPTION OR TO PAY THE FEE WITHIN THE PRESCRIBED TIME-LIMIT; INVALID AB INITIO Effective date: 20190325 |
|
| PGFP | Annual fee paid to national office [announced via postgrant information from national office to epo] |
Ref country code: FR Payment date: 20240213 Year of fee payment: 6 |
|
| PG25 | Lapsed in a contracting state [announced via postgrant information from national office to epo] |
Ref country code: MT Free format text: LAPSE BECAUSE OF FAILURE TO SUBMIT A TRANSLATION OF THE DESCRIPTION OR TO PAY THE FEE WITHIN THE PRESCRIBED TIME-LIMIT Effective date: 20210421 |
|
| REG | Reference to a national code |
Ref country code: DE Ref legal event code: R119 Ref document number: 602019003979 Country of ref document: DE |
|
| GBPC | Gb: european patent ceased through non-payment of renewal fee |
Effective date: 20250325 |
|
| PG25 | Lapsed in a contracting state [announced via postgrant information from national office to epo] |
Ref country code: TR Free format text: LAPSE BECAUSE OF FAILURE TO SUBMIT A TRANSLATION OF THE DESCRIPTION OR TO PAY THE FEE WITHIN THE PRESCRIBED TIME-LIMIT Effective date: 20210421 |
|
| PG25 | Lapsed in a contracting state [announced via postgrant information from national office to epo] |
Ref country code: DE Free format text: LAPSE BECAUSE OF NON-PAYMENT OF DUE FEES Effective date: 20251001 |
|
| PG25 | Lapsed in a contracting state [announced via postgrant information from national office to epo] |
Ref country code: GB Free format text: LAPSE BECAUSE OF NON-PAYMENT OF DUE FEES Effective date: 20250325 |
|
| PG25 | Lapsed in a contracting state [announced via postgrant information from national office to epo] |
Ref country code: FR Free format text: LAPSE BECAUSE OF NON-PAYMENT OF DUE FEES Effective date: 20250331 |