EP3529733B1 - Method for the continuous calculation of a cyber security risk index - Google Patents
Method for the continuous calculation of a cyber security risk index Download PDFInfo
- Publication number
- EP3529733B1 EP3529733B1 EP17794849.4A EP17794849A EP3529733B1 EP 3529733 B1 EP3529733 B1 EP 3529733B1 EP 17794849 A EP17794849 A EP 17794849A EP 3529733 B1 EP3529733 B1 EP 3529733B1
- Authority
- EP
- European Patent Office
- Prior art keywords
- risk
- cyber
- events
- facts
- index
- Prior art date
- Legal status (The legal status is an assumption and is not a legal conclusion. Google has not performed a legal analysis and makes no representation as to the accuracy of the status listed.)
- Active
Links
Images






Classifications
-
- H—ELECTRICITY
- H04—ELECTRIC COMMUNICATION TECHNIQUE
- H04L—TRANSMISSION OF DIGITAL INFORMATION, e.g. TELEGRAPHIC COMMUNICATION
- H04L63/00—Network architectures or network communication protocols for network security
- H04L63/14—Network architectures or network communication protocols for network security for detecting or protecting against malicious traffic
- H04L63/1433—Vulnerability analysis
-
- G—PHYSICS
- G06—COMPUTING OR CALCULATING; COUNTING
- G06F—ELECTRIC DIGITAL DATA PROCESSING
- G06F16/00—Information retrieval; Database structures therefor; File system structures therefor
- G06F16/20—Information retrieval; Database structures therefor; File system structures therefor of structured data, e.g. relational data
- G06F16/22—Indexing; Data structures therefor; Storage structures
- G06F16/2228—Indexing structures
-
- G—PHYSICS
- G06—COMPUTING OR CALCULATING; COUNTING
- G06F—ELECTRIC DIGITAL DATA PROCESSING
- G06F21/00—Security arrangements for protecting computers, components thereof, programs or data against unauthorised activity
- G06F21/50—Monitoring users, programs or devices to maintain the integrity of platforms, e.g. of processors, firmware or operating systems
- G06F21/55—Detecting local intrusion or implementing counter-measures
- G06F21/552—Detecting local intrusion or implementing counter-measures involving long-term monitoring or reporting
-
- G—PHYSICS
- G06—COMPUTING OR CALCULATING; COUNTING
- G06F—ELECTRIC DIGITAL DATA PROCESSING
- G06F21/00—Security arrangements for protecting computers, components thereof, programs or data against unauthorised activity
- G06F21/50—Monitoring users, programs or devices to maintain the integrity of platforms, e.g. of processors, firmware or operating systems
- G06F21/55—Detecting local intrusion or implementing counter-measures
- G06F21/554—Detecting local intrusion or implementing counter-measures involving event detection and direct action
-
- H—ELECTRICITY
- H04—ELECTRIC COMMUNICATION TECHNIQUE
- H04L—TRANSMISSION OF DIGITAL INFORMATION, e.g. TELEGRAPHIC COMMUNICATION
- H04L63/00—Network architectures or network communication protocols for network security
- H04L63/14—Network architectures or network communication protocols for network security for detecting or protecting against malicious traffic
-
- H—ELECTRICITY
- H04—ELECTRIC COMMUNICATION TECHNIQUE
- H04L—TRANSMISSION OF DIGITAL INFORMATION, e.g. TELEGRAPHIC COMMUNICATION
- H04L63/00—Network architectures or network communication protocols for network security
- H04L63/14—Network architectures or network communication protocols for network security for detecting or protecting against malicious traffic
- H04L63/1408—Network architectures or network communication protocols for network security for detecting or protecting against malicious traffic by monitoring network traffic
- H04L63/1425—Traffic logging, e.g. anomaly detection
Definitions
- the present disclosure is directed generally to a method for providing an automated, continuous cyber security risk assessment measurement.
- US 2015/381646 A1 discloses anomaly detection including determining a set of anomalous events associated with an enterprise network and determining a path of interest based at least in part on at least a subset of the set of anomalous events.
- US 2016/148103 A1 discloses a system that includes an interface configured to receive time series data representing information from a plurality of sensors, and a processor that is configured to construct a behavior model based on the time series data.
- US 2016/173521 A1 discloses methods for determining an entity's cybersecurity risk and benchmarking that risk by non-intrusively collecting one or more types of data associated with an entity.
- the present disclosure is directed to an inventive method for providing an automated, continuous cyber security risk assessment measurement.
- Various embodiments and implementations herein are directed to a method for consistent, predictable, repeatable measurement and comparison of cyber security risk indicators.
- Various embodiments include methods for consistent measurement and comparison of cyber security risks present in one organization over time, as well as between two or more organizations.
- the method comprises generation of a continuous cyber security risk assessment measurement, a "cyber risk indicator score," based on a variety of inputs including but not limited to data volume, network infrastructure and security device activity, defense sensor and host endpoint behavior, risks associated with connections to external entities, newly observed threat activities, audit event data quality, network and host-based threat detection sensors, vulnerability scanners, and/or asset management systems, and personnel security risk indicator systems and reports, among other factors.
- the continuous cyber security risk assessment measurement can also comprise a personnel and/or insider threat risk component, among other possible factors.
- the various inputs can be weighed and the cyber risk indicator score can be computed for the given network or group of networks (enterprise). Further, the score can be constantly updated and revised as new information is obtained.
- Using multiple inputs as described or otherwise envisioned herein provides several unique capabilities to the cyber security risk assessment system and method described herein. For example, there is unified reporting of operational risk due to information technology activities, and there is consistent measurement of the security value provided by data sources and/or sensors in the operational environment based on their impact upon security risk. In addition, there can be prioritization of security event remediation activities based on risk priority.
- the method may be used for: (i) cyber security risk indicator analysis using internal data sources, from an internal perspective; and/or (ii) cyber security risk indicator analysis using external data sources, from an external perspective.
- applications include corporate ranking for cyber insurance, regulatory compliance reporting, and/or general analysis of trends in threats and vulnerabilities on a global scale.
- the method includes the steps of: (i) obtaining cyber security precursor information from a plurality of sources, wherein the cyber security precursor information can be obtained from one or more online or offline sources; (ii) normalizing the obtained cyber security precursor information to a common information model; (iii) generating, from the normalized cyber security precursor information, one or more events; (iv) producing, from the one or more generated events, one or more facts; (v) calculating a plurality of risk indicators from the one or more facts; (vi) normalizing the plurality of risk indicators to a common model; (vii) calculating, using the normalized plurality of risk indicators, one or more cyber risk index component scores; and (viii) calculating, using the one or more cyber risk index component scores, a cyber risk indicator index.
- the method further includes the step of storing the generated one or more events in an event database.
- the method further includes the step of storing the generated one or more facts in a fact database.
- the method further includes the step of storing the generated one or more risk indicators in a risk indicator database.
- the step of producing one or more facts comprises one or more of a mathematical analysis, pattern detection, anomaly detection, and rule-based assessment of the one or more events
- the step of calculating a plurality of risk indicators from the one or more facts comprises an analysis of several facts over time.
- the cyber risk indicator index comprises a score between 0 and 100.
- the method further includes the step of providing the cyber risk indicator index to a user.
- the step of providing the cyber risk indicator index to a user comprises a user interface.
- the user interface comprises a graph of cyber risk indicator index over time.
- the method further includes the step of comparing the cyber risk indicator index to a pre-determined threshold.
- the method further includes the step of notifying a user if the cyber risk indicator index exceeds the pre-determined threshold.
- the method further includes the step of initiating an automated action if the cyber risk indicator index exceeds the pre-determined threshold.
- the system includes: a plurality of sensors configured to obtain cyber security precursor information; an event database configured to store one or more events; a fact database configured to store one or more facts; and a processor programmed to perform the steps of: (i) receiving the cyber security precursor information from the plurality of sensors; (ii) normalizing the obtained cyber security precursor information to a common information model; (iii) generating, from the normalized cyber security precursor information, one or more events; (iv) storing the generated one or more events in the event database; (v) producing, from the one or more generated events, one or more facts; (vi) storing the one or more facts in the facts database; (vii) calculating a plurality of risk indicators from the one or more facts; (viii) normalizing the plurality of risk indicators to a common model; (ix) calculating, using the normalized plurality of risk indicators, one or more cyber risk index component scores; and (x) calculating, using the one or more cyber risk
- Offline data sources may include but not be limited to personnel security indicators, localized and global cyber threat and risk indicators, and overall threat and risk levels calculated for a specific industry or the Internet as a whole.
- Online data sources may include but not be limited to computer network asset inventories, scan results from vulnerability scanning and penetration testing activities, and the output of security and architecture data from networked computing and security devices. Applicants have recognized and appreciated that it would be beneficial to provide a cyber security risk indicator assessment measurement that can be updated automatically and continuously as new information is received and/or analyzed.
- FIG. 1 is a flowchart of a cybersecurity index calculation method, in accordance with an embodiment.
- data from a plurality of sources is collected and processed into a uniform format.
- the data is then analyzed, which can include one or more of the following steps: (i) ingesting the data into a data transformation and normalization process; (ii) producing one or more normalized events from the data; (iii) producing one or more facts from the data; (iii) producing one or more metrics from the produced facts; (iv) utilizing the metric facts to generate risk indicators; (v) normalizing the risk indicators, including by such methods as sensor type, logical location on a computer network, physical location, and/or geographic location; (vi) computing a component score for risk indicators, represented by a ratio of that score per sensor type; (vii) producing the total risk index component score; (viii) normalizing the risk index component score based on the configured contribution of that score to the overall index; (ix) adjusting the index component score by a normalization
- the risk assessment and metrics are then optionally output to a user through a user interface.
- the risk assessment and metrics can also optionally be utilized within an automated system to respond to a risk, where the response is based, at least in part, on the calculated risk assessment and/or one or more of the risk metrics.
- FIG. 2 is a flowchart of a source data normalization method, in accordance with an embodiment.
- the data sources that are processed as part of the risk index calculation are normalized to a common information model.
- An integral part of computing the overall risk index is the ability to normalize the index. Normalization of the index occurs using one or more of the following primary factors: source type, asset identification, risk indicator properties (data bounds detected for properties based on the common information model), and risk index component contribution.
- source data normalization comprises the following main steps: (1) identify the data source categories, aligning it with a standard taxonomy of data sources and assigning a primary and (optionally) a secondary type; (2) create a normalization function for the severity values produced by the data source, which transforms data from source format into a normalized scale of 0-3 severity per data source, although many other scales are possible; and (3) assign a weight to each data source category, which applies regardless of the data source vendor.
- These initial steps produce a normalized event that captures activity relative to categories of data sources such as anti-virus (AV), network intrusion protection system (NIPS), and network firewall, among many other possible categories of data sources.
- AV anti-virus
- NIPS network intrusion protection system
- network firewall among many other possible categories of data sources.
- a normalization function is applied to ensure that all events can be compared equally regardless of a vendor-specific representation of certain fields such as severity or event importance, data source, website reputation, or threat types.
- the "TransformEvent” function is a data source (sensor) defined operation which applies a data transformation to a raw event to produce one or more entities in the common information model.
- the "NormalizeEvent” function returns a tuple that contains an original event attribute and a corresponding normalized attribute which, for instance, in the case of threat or vulnerability severity transforms a number (whole or floating point) and returns an attribute in the form of a whole number between 0 and 3 inclusive.
- the “Combine” function ensures that for any of the entities generated by "TransformEvent” each are assigned any attributes returned by the "NormalizeEventValue function.
- the value c might be transformed into a new value c', which would then be applied in the "Combine” function to return a new tuple (a, b, c') as the normalized event value.
- a sensor weight is calculated to determine how points shall be allotted to each sensor.
- a user-defined ranking on the operational impact of asset loss is applied by the "OperationalImpact” function.
- the ability of a sensor to monitor and report on some portion of an organization's networked assets is returned by "AssetCoverage,” which is a percentage and can be defined as a value between 0 and 1, inclusive.
- the base weight for each sensor type is 1, which is equivalent to 100% and results in full allocation of sensor points.
- the "ScoreWeight" function modifies the base score for each sensor with a percentage that is expressed as a value between 0 and 1, inclusive.
- data source normalization comprises taking a source audit record (such as an event in a log) and making a determination as to a type of source information for which this data matches a given pattern.
- Patterns are defined for matching data according to a heuristic process wherein a set of regular expression (nondeterministic finite state automata) collections, where each collection of regular expressions is applied to a record and the best fit for a given pattern is determined by the quality of match.
- the factors influencing matching quality include a score of whether a pattern match does not occur, occurs in part, or is satisfied for each input record.
- a fit score for patterns is defined using schemes such as rule-based matches (perfect fit), classification score based on Bayesian probability, confusion matrices, and other mechanisms for entity classification available to those with skill in the art.
- the source type knowledge base is queried to determine the root source type for that data.
- the data is transformed into a format that can be processed by the analytic engine, called an event.
- the Event data model described or otherwise envisioned herein is part of a common information model (CIM) that is used to represent the data in the domain being analyzed.
- CIM common information model
- the Event format contains a timestamp for pedigree, a set of attributes for the semantic property being represented, and also includes a set of graph-like relationships between Events using node and edge representations. Events can be represented in a tree-based text or binary format.
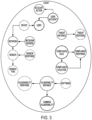
- FIG. 3 is a Venn diagram of various possible components of an Event data model or module, in accordance with an embodiment. Although FIG. 3 illustrates a number of possible entities that could be part of the Event module or data model, it should be noted that many other components or entities are possible.
- the attributes used for unique identification of a computing asset can be stored in a database.
- this identifying information is normalized so that events associated with different logical network MAC (Media Access Control) addresses or IP (Internet Protocol) addresses are all associated with the correct physical asset.
- the events produced by the source data normalization method are stored in an event database.
- analytic facts are computed using the normalized Event database created by the source data normalization method, and based on the application of mathematical functions, pattern detection, anomaly detection, and rule-based assessment of the event data.
- the analytic facts represent an assessment of events, facts, and/or a combination thereof.
- Examples of methods of deriving facts include, but are not limited to: (i) metrics in the form of: minimum, maximum, average, moving average, median, mode, and/or standard deviation, among others; (ii) mathematical functions in the form of: count, sum, trend (such as increasing, decreasing, or constant), rate (such as time between events, the rate of x per an object y, the slope (being the rate of change over time)), and/or duration (such as between events x and y, or event types a and b, or the time from detection of threat to containment or remediation of that threat data confidence, such as percent of errors in the data), among others.
- Each fact includes a context that is a reference to the set of events and/or facts that contributed to the value represented by the fact.
- Risk indicators can be computed from facts.
- risk indicators are computed by, for example, applying a global and/or time-series analysis of fact and event data in order to derive the indicator. Combining facts into risk indicators can make use of any function, and the following are just a few examples:
- risk indicators are calculated, they can be stored in an analytic fact database for normalization processing.
- FIG. 5 is a flowchart of a method for risk indicator normalization, in accordance with an embodiment.
- normalization of the risk indicators can be an important step in the index calculation process.
- the method for normalization may be performed on variables that are shared across events and analytic facts, for example in the current embodiment they take the form of normalization by the sensor type that recorded the event, threat type, defense action type, vulnerability type, logical location (i.e., network assignment) or physical location.
- FIG. 6 is a flowchart of a method for cyber risk index component score calculation, in accordance with an embodiment.
- Risk indicators are used to calculate the risk index component scores.
- Analytic facts for risk indicators that are normalized by sensor type are used to compute a set of risk index component scores, the set containing one set per sensor type that for which event data is available.
- the cyber risk index component scores may include the following factors, for example: Global Threat Indicators Score; Internal Threat Indicators Score; External Threat Indicators Score; Configuration Compliance Score; Data Quality Score; New Threat Indicators Score; Relative Defense Event Velocity (Technical Debt); Vulnerability Exposure Score; Asset Surface Area (Surface Area); Network Transaction Trust Score (Opportunity Risk); and/or Defense Configuration Maturity (Length of Score History), among many others.
- Each index component score is calculated by using the set of index component score per sensor type to calculate a ratio of the contribution per sensor type to that score by multiplying the index component score per sensor by an index component score weighting function.
- the resulting weighted scores are averaged and produce the score for index component representing the result of analyzing event data from all sensors.
- risk indicators and component index scores may be of a time-series analysis nature, calculating values over 'historical' periods and comparing values to current time windows. Time windows are configurable and many combinations of time periods are possible. After processing, each index score can be tagged with its type and stored in the analytic fact database.
- the "Defense Effectiveness” index component score measures indicators of repetitious defense events on a networked computing asset, potentially indicating compromise by an attack.
- the "Technical Debt” index component score is the proportion of total detection activity (vulnerabilities, threats) relative to the number of assets (given the percent of the network scanned) and comparing this proportion to those of the recent past. It is meant to tell the user how much debt they have incurred where debt is expressed in terms of security issues (as opposed to owed capital).
- the "Opportunity Risk” index component score represents how the severity of current detections compares to the maximum severity that could be seen.
- the "Detections from New Threats” index component score tells a user how many of their current threats are 'new', where new refers to a threat that has not been seen on the network over the past N time periods, depending upon the time window being analyzed.
- the "Surface Area” index component score measures how many of the network assets currently have threat detections.
- the "Audit Data Quality” index component score calculates the quality of data input, availability, and breadth of sensor contributions to the audit data over the past N days. For each day of history, this metric calculates rates of activity from each sensor as compared to similar day of week, day of year, and whether it is a weekend day or weekday. If a sensor has reported activity for that day, the data is analyzed for patterns of potentially missing data based on historical rates of data production.
- the equations below represent one possible method for calculating the risk index component scores, in accordance with one possible embodiment of the invention.
- the following definitions of sets and terms apply to the subsequent equations for calculating the risk index component scores:
- FIG. 7 is a flowchart of a method for cyber risk indicator index overall score calculation, in accordance with an embodiment.
- the values for all component risk scores for a choose time period of analysis are retrieved from the analytic fact database. Once retrieved, each component score is normalized relative to the number of points allocated to that component index per the system configuration. Subsequently, another operation to create the appropriate score distribution is applied via a configurable function for the score coefficient. Next, all of the scores are added and the sum is returned as the cyber risk indicator index score.
- the cyber risk indicator index score can then optionally be reported to a user and/or a user interface.
- the determined cyber risk indicator index score may be reported as a number or other format to a user through a user interface, or can be communicated to the user via a wired and/or wireless communications network.
- the score may be communicated as a report, an email, a text message, a haptic indicator, a visual indicator, and/or an audible indicator, or any of a wide variety of other indications or communications.
- the score can be compared or normalized to a reporting mechanism such as a constant display or other user interface. When the score is below a predetermined threshold, the display reports the information, such as by displaying the color green. When the score exceeds a predetermined threshold, the display reports the information to the user, such as by displaying the color red.
- a reporting mechanism such as a constant display or other user interface.
- the system can be designed or configured to automatically process the cyber risk indicator index score in order to perform an Information Technology orchestration automation, implement an additional compliance rule, adapt the acceptable risk index score thresholds, or automatically produce alerts of risk rule violations via e-mail, text, or perform any other action as necessary.
- the system can take one or more preprogrammed preventative actions based on the score, such as inactivating a system or sub-system, blocking and/or inactivating a communications network, changing or deleting permissions, or any of a wide variety of other actions.
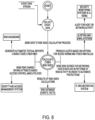
- FIG 8 An example operational scenario of an automated response triggered is depicted in FIG 8 .
- the continuously updated cyber risk score enables an automated response mechanism for IT operations orchestration and automation, risk alerting, risk reporting, and Identity and Access Management (IAM) adaptation, among other possible outcomes as described or otherwise envisioned herein.
- the risk results include a score for particular network segments (e.g., 10.1.x.x/16) and gives that system a means of prioritizing changes to IT infrastructure and increasing or decreasing protections as needed. For example, if the risk is measured to be low across an organization, then certain IT policies can be triggered which reduce firewall port restrictions on certain segments of the network.
- the alerts become a feedback loop for products like Security Information Event Management (SIEM) systems which can use scores for network segments to prioritize certain alerts.
- SIEM Security Information Event Management
- the alerting function can also be used as a type of IT security or operations alert to employees.
- the Risk Reporting scenario involves producing an automated scorecard and textual risk report that includes a scorecard of IT risk indicator status as well as depictions of the causes of the score improving or worsening, including such items as the patterns and volatility of the risk indicator scores, causes of gaps in the scores, and a prioritize list of contributors to loss of score points due to certain types of events, activity by network segments, geographically-focused activity to include natural disasters, and sensors producing abnormal event volumes.
- FIG. 9 in one embodiment, is a flowchart of a method for cyber security risk analysis. According to an embodiment, the method described in FIG. 9 is utilized to generate a cybersecurity score for the network or networks under assessment, optionally on a continuous basis.
- data from various sources is collected and processed into a uniform format.
- the system can utilize many different inputs, including but not limited to network firewalls, proxies, intrusion detection and prevention systems (IDS/IPS), asset management systems, vulnerability scanners, threat intelligence data, host-based security protection agents, security information event management systems, and other sensors related to cybersecurity monitoring and protection.
- IDS/IPS intrusion detection and prevention systems
- asset management systems vulnerability scanners
- threat intelligence data threat intelligence data
- host-based security protection agents security information event management systems
- security information event management systems and other sensors related to cybersecurity monitoring and protection.
- These inputs produce data related to network infrastructure and device activity, defense sensor and host endpoint behavior, externally bound network activity, data and activity volume, malware detections and observed threats (including repeated threats), and asset configuration state, among other things.
- the data collected by the system from various different sensors, inputs, databases, and/or other sources is processed into a uniform format. Accordingly, the data undergoes a transformation and normalization process.
- a transformation and normalization process in order to assess the importance of input data, it is first normalized to a discrete sensor type such as Firewall, Intrusion Detection, Proxy, AntiVirus, Configuration Management, or Vulnerability Scanner, among others.
- normalization of the index occurs using these primary factors: source type, asset identification, risk indicator properties (data bounds detected for properties based on the common information model), and risk index component contribution.
- Data source normalization can involve taking a source audit record (event in a log) and making a determination as to a type of source information for which this data matches the given pattern. After the pattern is identified to a given source type, the source type knowledge base is queried to determine the root source type for that data.
- one or more events are created from the normalized data.
- the data is transformed into a format that can be processed by the analytic engine, called an event.
- events produced by the source data normalization processed can be stored in an event database.
- analytics facts are computed from the event data.
- entities called analytic facts are computed based on applying mathematical functions, pattern detection, anomaly detection, and rule-based assessment of the event data.
- Facts represent an assessment of Events, Facts, or a combination thereof.
- Examples of methods of deriving facts include, but are not limited to: (i) metrics in the form of: minimum; maximum; average; moving average; median; mode; and/or standard deviation; and (ii) mathematical functions in the form of: count; sum; trend, including increasing, decreasing, or same; rate (for example: time between events; rate of x per an object y; slope - rate of change over time); duration (for example: between events x and y, or event types a and b; time from detection of threat to containment or remediation of that threat data confidence - percent of errors in the data).
- rates for example: time between events; rate of x per an object y; slope - rate of change over time
- duration for example: between events x and y, or event types a and b; time from detection of threat to containment or remediation of that threat data confidence - percent of errors in the data.
- facts produced by the system can be stored in an Analytic Fact Database.
- risk indicators are generated from the facts.
- risk indicators are computed from facts, including by applying global and/or time-series analysis of fact and event data in order to derive the indicator. Combining facts into risk indicators can make use of any function, including but not limited the examples set forth herein. Once risk indicators are calculated, they can be stored in an Analytic Fact Database for normalization processing.
- the one or more risk factors are normalized.
- the risk factors can be normalized by their associated data source type (sensor or detector), including additional normalizations such as the category of threat or vulnerability, logical/virtual location of the event, and physical or geographic location of the event, among many other options.
- normalizing the risk indicators is an important step in the index calculation process.
- the methods for normalization may be performed on variables that are shared across events and analytic facts, for example in the current embodiment they take the form of normalization by the sensor type that recorded the event, threat type, defense action type, vulnerability type, logical location (i.e., network assignment) or physical location.
- a risk index component score is calculated.
- a subset of Analytic Facts is retrieved per data source type and is then analyzed to produce various component scores.
- Risk indicators can be used to calculate the risk index component scores.
- Analytic facts for risk indicators that are normalized by sensor type are used to compute a set of risk index component scores, the set containing one set per sensor type that for which event data is available.
- the cyber risk index component score may include any of the factors described or otherwise envisioned herein.
- a cyber risk indicator index is calculated using the one or more cyber risk index component scores.
- the values for all component risk scores for a choose time period of analysis are retrieved from the Analytic Fact database. Once retrieved, each component score is normalized relative to the number of points allocated to that component index per the system configuration. Subsequently, another operation to create the appropriate score distribution is applied via a configurable function for the score coefficient. Next, all of the scores are added and the sum is returned as the cyber risk indicator index score.
- the cyber risk indicator index is provided to a user.
- the cyber risk indicator index can be provided via a wired and/or wireless communications network.
- the score may be communicated as a report, an email, a text message, a haptic indicator, a visual indicator, and/or an audible indicator, or any of a wide variety of other indications or communications.
- the system can be designed or configured to automatically process the cyber risk indicator index score in order to perform an Information Technology orchestration automation, implement an additional compliance rule, adapt the acceptable risk index score thresholds, or automatically produce alerts of risk rule violations via e-mail, text, or perform any other action as necessary.
- the system can take one or more preprogrammed preventative actions based on the score, such as inactivating a system or sub-system, blocking and/or inactivating a communications network, changing or deleting permissions, or any of a wide variety of other actions.
- the cyber risk indicator index is provided via a user interface, such as a cyber risk dashboard.
- a cyber risk dashboard is a user interface, such as a cyber risk dashboard.
- FIGS. 10-12 are embodiments of one or more components of a cyber risk user interface or dashboard.
- the calculated cyber risk index is calculated as a score between 0 and 100, inclusive.
- the calculated cyber risk index is calculated as a score between 0 and 100, and events or risk factors are provided to the user depending on the severity of the risk (critical, important, moderate, low, and no criticality, for example).
- the calculated cyber risk index is calculated as a score between 0 and 100 and is plotted on a graph over time. The user can then monitor changes in the calculated cyber risk index over time, and can extract or calculate patterns in the changing cyber risk index.
- the score can be compared or normalized to a reporting mechanism such as a constant display or other user interface.
- a reporting mechanism such as a constant display or other user interface.
- the display reports the information, such as by displaying the color green.
- the score exceeds a predetermined threshold, the display reports the information to the user, such as by displaying the color red.
- a reporting mechanism such as a constant display or other user interface.
Landscapes
- Engineering & Computer Science (AREA)
- Computer Security & Cryptography (AREA)
- Theoretical Computer Science (AREA)
- Software Systems (AREA)
- General Engineering & Computer Science (AREA)
- Computer Hardware Design (AREA)
- General Physics & Mathematics (AREA)
- Physics & Mathematics (AREA)
- Computing Systems (AREA)
- Computer Networks & Wireless Communication (AREA)
- Signal Processing (AREA)
- Databases & Information Systems (AREA)
- Data Mining & Analysis (AREA)
- Management, Administration, Business Operations System, And Electronic Commerce (AREA)
Description
- The present disclosure is directed generally to a method for providing an automated, continuous cyber security risk assessment measurement.
- Government entities, corporations, websites, and other organizations experience non- stop cyber-attacks from both domestic and foreign attackers. These attacks necessitate expensive and time-consuming protective measures and countermeasures. Despite even the best measures these constant attacks can result in data loss, confidential information breaches, and the erosion of customer confidence, and thus can significantly damage the reputation and financial footing of an entity. Businesses are adopting processes and implementing procedures designed to monitor their cyber health in near real time in order to determine the security posture of the company compared to peers and/or other businesses around the globe.
- Accordingly, there is a continued need in the art for methods and systems for continuously measuring cyber security risk indicators.
-
US 2015/381646 A1 discloses anomaly detection including determining a set of anomalous events associated with an enterprise network and determining a path of interest based at least in part on at least a subset of the set of anomalous events. -
US 2016/148103 A1 discloses a system that includes an interface configured to receive time series data representing information from a plurality of sensors, and a processor that is configured to construct a behavior model based on the time series data. -
US 2016/173521 A1 discloses methods for determining an entity's cybersecurity risk and benchmarking that risk by non-intrusively collecting one or more types of data associated with an entity. - The present disclosure is directed to an inventive method for providing an automated, continuous cyber security risk assessment measurement. Various embodiments and implementations herein are directed to a method for consistent, predictable, repeatable measurement and comparison of cyber security risk indicators. Various embodiments include methods for consistent measurement and comparison of cyber security risks present in one organization over time, as well as between two or more organizations.
- For example, in some embodiments, the method comprises generation of a continuous cyber security risk assessment measurement, a "cyber risk indicator score," based on a variety of inputs including but not limited to data volume, network infrastructure and security device activity, defense sensor and host endpoint behavior, risks associated with connections to external entities, newly observed threat activities, audit event data quality, network and host-based threat detection sensors, vulnerability scanners, and/or asset management systems, and personnel security risk indicator systems and reports, among other factors. According to embodiment, the continuous cyber security risk assessment measurement can also comprise a personnel and/or insider threat risk component, among other possible factors. The various inputs can be weighed and the cyber risk indicator score can be computed for the given network or group of networks (enterprise). Further, the score can be constantly updated and revised as new information is obtained.
- Using multiple inputs as described or otherwise envisioned herein provides several unique capabilities to the cyber security risk assessment system and method described herein. For example, there is unified reporting of operational risk due to information technology activities, and there is consistent measurement of the security value provided by data sources and/or sensors in the operational environment based on their impact upon security risk. In addition, there can be prioritization of security event remediation activities based on risk priority.
- In some embodiments, the method may be used for: (i) cyber security risk indicator analysis using internal data sources, from an internal perspective; and/or (ii) cyber security risk indicator analysis using external data sources, from an external perspective. More generally, applications include corporate ranking for cyber insurance, regulatory compliance reporting, and/or general analysis of trends in threats and vulnerabilities on a global scale.
- In accordance with an aspect is a method for calculating a cyber security risk. The method includes the steps of: (i) obtaining cyber security precursor information from a plurality of sources, wherein the cyber security precursor information can be obtained from one or more online or offline sources; (ii) normalizing the obtained cyber security precursor information to a common information model; (iii) generating, from the normalized cyber security precursor information, one or more events; (iv) producing, from the one or more generated events, one or more facts; (v) calculating a plurality of risk indicators from the one or more facts; (vi) normalizing the plurality of risk indicators to a common model; (vii) calculating, using the normalized plurality of risk indicators, one or more cyber risk index component scores; and (viii) calculating, using the one or more cyber risk index component scores, a cyber risk indicator index.
- According to an embodiment, the method further includes the step of storing the generated one or more events in an event database. According to an embodiment, the method further includes the step of storing the generated one or more facts in a fact database. According to an embodiment, the method further includes the step of storing the generated one or more risk indicators in a risk indicator database.
- According to an embodiment, the step of producing one or more facts comprises one or more of a mathematical analysis, pattern detection, anomaly detection, and rule-based assessment of the one or more events
- According to an embodiment, the step of calculating a plurality of risk indicators from the one or more facts comprises an analysis of several facts over time.
- According to an embodiment, the cyber risk indicator index comprises a score between 0 and 100.
- According to an embodiment, the method further includes the step of providing the cyber risk indicator index to a user.
- According to an embodiment, the step of providing the cyber risk indicator index to a user comprises a user interface.
- According to an embodiment, the user interface comprises a graph of cyber risk indicator index over time.
- According to an embodiment, the method further includes the step of comparing the cyber risk indicator index to a pre-determined threshold.
- According to an embodiment, the method further includes the step of notifying a user if the cyber risk indicator index exceeds the pre-determined threshold.
- According to an embodiment, the method further includes the step of initiating an automated action if the cyber risk indicator index exceeds the pre-determined threshold.
- According to an aspect is a computerized system for determining a cyber security risk. The system includes: a plurality of sensors configured to obtain cyber security precursor information; an event database configured to store one or more events; a fact database configured to store one or more facts; and a processor programmed to perform the steps of: (i) receiving the cyber security precursor information from the plurality of sensors; (ii) normalizing the obtained cyber security precursor information to a common information model; (iii) generating, from the normalized cyber security precursor information, one or more events; (iv) storing the generated one or more events in the event database; (v) producing, from the one or more generated events, one or more facts; (vi) storing the one or more facts in the facts database; (vii) calculating a plurality of risk indicators from the one or more facts; (viii) normalizing the plurality of risk indicators to a common model; (ix) calculating, using the normalized plurality of risk indicators, one or more cyber risk index component scores; and (x) calculating, using the one or more cyber risk index component scores, a cyber risk indicator index.
- According to an aspect is a computer system for determining a cyber security risk. The system includes: a non-transitory computer-readable storage medium configured to store data collected by the computer system and comprising computer-executable instructions; and a processor programmed to execute the computer-executable instructions resulting in the computer system performing the steps of: receiving cyber security precursor information from a plurality of sensors; (ii) normalizing the obtained cyber security precursor information to a common information model; (iii) generating, from the normalized cyber security precursor information, one or more events; (iv) storing the generated one or more events in the non-transitory computer-readable storage medium; (v) producing, from the one or more generated events, one or more facts; (vi) storing the one or more facts in the non-transitory computer-readable storage medium; (vii) calculating a plurality of risk indicators from the one or more facts; (viii) normalizing the plurality of risk indicators to a common model; (ix) calculating, using the normalized plurality of risk indicators, one or more cyber risk index component scores; and (x) calculating, using the one or more cyber risk index component scores, a cyber risk indicator index.
- These and other aspects of the invention will be apparent from the embodiments described herein.
- The present invention will be more fully understood and appreciated by reading the following Detailed Description in conjunction with the accompanying drawings, in which:
-
FIG. 1A is a flowchart of a cybersecurity index calculation method, in accordance with an embodiment. -
FIG. 1B is a flowchart of a cybersecurity index calculation method, in accordance with an embodiment. -
FIG. 2A is a flowchart of a cybersecurity data source normalization method, in accordance with an embodiment. -
FIG. 2B is a flowchart of a cybersecurity data source normalization method, in accordance with an embodiment. -
FIG. 3 is a Venn diagram of various possible components of an event data model, in accordance with an embodiment. -
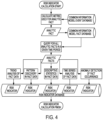
FIG. 4 is a flowchart of a cyber risk indicator calculation method, in accordance with an embodiment. -
FIG. 5 is a flowchart of a cyber risk indicator normalization method, in accordance with an embodiment. -
FIG. 6 is a flowchart of a cyber risk index component score calculation method, in accordance with an embodiment. -
FIG. 7 is a flowchart of a cyber risk index calculation method, in accordance with an embodiment. -
FIG. 8 is a flowchart of scenarios in which the continuous cyber risk index computation results influence operational processes, in accordance with an embodiment. -
FIG. 9 is a flowchart of a method for the determination of a cyber risk index, in accordance with an embodiment. -
FIG. 10 is a schematic representation of a cyber risk index user interface, in accordance with an embodiment. -
FIG. 11 is a schematic representation of a cyber risk index user interface, in accordance with an embodiment. -
FIG. 12 is a schematic representation of a cyber risk index user interface, in accordance with an embodiment. - The present disclosure describes various embodiments of a system and method for providing an automated, continuous cyber security risk assessment measurement that provides a normalized comparison between distinct sets of data collected from a variety of sources, including both offline and online data sources. Offline data sources may include but not be limited to personnel security indicators, localized and global cyber threat and risk indicators, and overall threat and risk levels calculated for a specific industry or the Internet as a whole. Online data sources may include but not be limited to computer network asset inventories, scan results from vulnerability scanning and penetration testing activities, and the output of security and architecture data from networked computing and security devices. Applicants have recognized and appreciated that it would be beneficial to provide a cyber security risk indicator assessment measurement that can be updated automatically and continuously as new information is received and/or analyzed.
- Referring to
FIG. 1 is a flowchart of a cybersecurity index calculation method, in accordance with an embodiment. According to an embodiment, data from a plurality of sources is collected and processed into a uniform format. The data is then analyzed, which can include one or more of the following steps: (i) ingesting the data into a data transformation and normalization process; (ii) producing one or more normalized events from the data; (iii) producing one or more facts from the data; (iii) producing one or more metrics from the produced facts; (iv) utilizing the metric facts to generate risk indicators; (v) normalizing the risk indicators, including by such methods as sensor type, logical location on a computer network, physical location, and/or geographic location; (vi) computing a component score for risk indicators, represented by a ratio of that score per sensor type; (vii) producing the total risk index component score; (viii) normalizing the risk index component score based on the configured contribution of that score to the overall index; (ix) adjusting the index component score by a normalization coefficient; and/or (x) combining all component scores into an overall "cyber score" or measurement of the system's cyber security risk assessment. The risk assessment and metrics are then optionally output to a user through a user interface. The risk assessment and metrics can also optionally be utilized within an automated system to respond to a risk, where the response is based, at least in part, on the calculated risk assessment and/or one or more of the risk metrics. - Referring to
FIG. 2 is a flowchart of a source data normalization method, in accordance with an embodiment. According to an embodiment, the data sources that are processed as part of the risk index calculation are normalized to a common information model. An integral part of computing the overall risk index is the ability to normalize the index. Normalization of the index occurs using one or more of the following primary factors: source type, asset identification, risk indicator properties (data bounds detected for properties based on the common information model), and risk index component contribution. - According to one embodiment, source data normalization comprises the following main steps: (1) identify the data source categories, aligning it with a standard taxonomy of data sources and assigning a primary and (optionally) a secondary type; (2) create a normalization function for the severity values produced by the data source, which transforms data from source format into a normalized scale of 0-3 severity per data source, although many other scales are possible; and (3) assign a weight to each data source category, which applies regardless of the data source vendor. These initial steps produce a normalized event that captures activity relative to categories of data sources such as anti-virus (AV), network intrusion protection system (NIPS), and network firewall, among many other possible categories of data sources.
- As the continuous risk assessment process collects reported events from cyber security monitoring and defense systems, a normalization function is applied to ensure that all events can be compared equally regardless of a vendor-specific representation of certain fields such as severity or event importance, data source, website reputation, or threat types. According to an embodiment, the transformation function can be calculated as follows:

- For each sensor, the "TransformEvent" function is a data source (sensor) defined operation which applies a data transformation to a raw event to produce one or more entities in the common information model. The "NormalizeEvent" function returns a tuple that contains an original event attribute and a corresponding normalized attribute which, for instance, in the case of threat or vulnerability severity transforms a number (whole or floating point) and returns an attribute in the form of a whole number between 0 and 3 inclusive. The "Combine" function ensures that for any of the entities generated by "TransformEvent" each are assigned any attributes returned by the "NormalizeEventValue function. As an example, given an original event expressed as a tuple of values (a,b,c), the value c might be transformed into a new value c', which would then be applied in the "Combine" function to return a new tuple (a, b, c') as the normalized event value.
- In order to complete the general data source normalization process, a sensor weight is calculated to determine how points shall be allotted to each sensor. The percent of weight allocated per sensor is proportional to the percentage of network assets on which that particular sensor can observe and report on event activity and the operational impact on the assets involved in those events, which is expressed as follows:

- A user-defined ranking on the operational impact of asset loss (from a confidentiality, integrity, and/or availability perspective, for example) is applied by the "OperationalImpact" function. The ability of a sensor to monitor and report on some portion of an organization's networked assets is returned by "AssetCoverage," which is a percentage and can be defined as a value between 0 and 1, inclusive. According to an embodiment the base weight for each sensor type is 1, which is equivalent to 100% and results in full allocation of sensor points. The "ScoreWeight" function modifies the base score for each sensor with a percentage that is expressed as a value between 0 and 1, inclusive.
- According to an embodiment, after applying the data source normalization process, the general process for creating another indicator score that contributes to the overall cyber security risk indicator index is as follows:

- According to an embodiment, data source normalization comprises taking a source audit record (such as an event in a log) and making a determination as to a type of source information for which this data matches a given pattern. Patterns are defined for matching data according to a heuristic process wherein a set of regular expression (nondeterministic finite state automata) collections, where each collection of regular expressions is applied to a record and the best fit for a given pattern is determined by the quality of match. The factors influencing matching quality include a score of whether a pattern match does not occur, occurs in part, or is satisfied for each input record. A fit score for patterns is defined using schemes such as rule-based matches (perfect fit), classification score based on Bayesian probability, confusion matrices, and other mechanisms for entity classification available to those with skill in the art.
- After the pattern is identified to a given source type, the source type knowledge base is queried to determine the root source type for that data. After the categorization is complete, the data is transformed into a format that can be processed by the analytic engine, called an event. According to an embodiment, the Event data model described or otherwise envisioned herein is part of a common information model (CIM) that is used to represent the data in the domain being analyzed. The Event format contains a timestamp for pedigree, a set of attributes for the semantic property being represented, and also includes a set of graph-like relationships between Events using node and edge representations. Events can be represented in a tree-based text or binary format. The system also has the ability to transform existing data formats to include XML Schema Documents (XSD), Eclipse Modeling Format (EMF) Unified Modeling Language (UML) format, and JavaScript Object Notation (JSON), automatically enabling any data model defined in those formats to be incorporated into the CIM.
FIG. 3 is a Venn diagram of various possible components of an Event data model or module, in accordance with an embodiment. AlthoughFIG. 3 illustrates a number of possible entities that could be part of the Event module or data model, it should be noted that many other components or entities are possible. - As data is transformed into the common information model, the attributes used for unique identification of a computing asset can be stored in a database. As events are processed, this identifying information is normalized so that events associated with different logical network MAC (Media Access Control) addresses or IP (Internet Protocol) addresses are all associated with the correct physical asset. According to an embodiment, the events produced by the source data normalization method are stored in an event database.
- According to an embodiment, analytic facts are computed using the normalized Event database created by the source data normalization method, and based on the application of mathematical functions, pattern detection, anomaly detection, and rule-based assessment of the event data. The analytic facts represent an assessment of events, facts, and/or a combination thereof. Examples of methods of deriving facts include, but are not limited to: (i) metrics in the form of: minimum, maximum, average, moving average, median, mode, and/or standard deviation, among others; (ii) mathematical functions in the form of: count, sum, trend (such as increasing, decreasing, or constant), rate (such as time between events, the rate of x per an object y, the slope (being the rate of change over time)), and/or duration (such as between events x and y, or event types a and b, or the time from detection of threat to containment or remediation of that threat data confidence, such as percent of errors in the data), among others. Each fact includes a context that is a reference to the set of events and/or facts that contributed to the value represented by the fact.
- Referring to
FIG. 4 is a flowchart of a method for risk indicator computation, in accordance with an embodiment. Risk indicators can be computed from facts. According to an embodiment, risk indicators are computed by, for example, applying a global and/or time-series analysis of fact and event data in order to derive the indicator. Combining facts into risk indicators can make use of any function, and the following are just a few examples: - Facts of type X over all time;
- Facts of type X over a particular window of time (between t1 and t2, including whether inclusive or exclusive);
- Facts of a metric type, m, incorporating values within a certain threshold on a fact attribute;
- Facts compared to another point (t_m) or window (t_1 - t_n) in time (for instance, how does this value compare to value at the same time last week, same day last year, or to all days);
- Normalized instances of facts with respect to (w.r.t) a certain variable, y;
- New instances of fact X since time t;
- Facts of metric type X with condition Y;
- Statistical outlier detection of Facts using (mean + (2 * std_dev)) (focuses on data top 95.4% of activity); and
- Statistical outlier detection of facts using normal (IQR + 1.5*std_dev) or extreme outlier (IQR + 3.0*std_dev) calculation.
- According to an embodiment, once risk indicators are calculated, they can be stored in an analytic fact database for normalization processing.
- Referring to
Figure 5 is a flowchart of a method for risk indicator normalization, in accordance with an embodiment. In order to provide a cybersecurity risk index score that is comparable between two distinct sets of networked computing assets, such as departments within an organization or organizations of different sizes, normalization of the risk indicators can be an important step in the index calculation process. The method for normalization may be performed on variables that are shared across events and analytic facts, for example in the current embodiment they take the form of normalization by the sensor type that recorded the event, threat type, defense action type, vulnerability type, logical location (i.e., network assignment) or physical location. - Referring to
Figure 6 is a flowchart of a method for cyber risk index component score calculation, in accordance with an embodiment. Risk indicators are used to calculate the risk index component scores. Analytic facts for risk indicators that are normalized by sensor type are used to compute a set of risk index component scores, the set containing one set per sensor type that for which event data is available. - The cyber risk index component scores may include the following factors, for example: Global Threat Indicators Score; Internal Threat Indicators Score; External Threat Indicators Score; Configuration Compliance Score; Data Quality Score; New Threat Indicators Score; Relative Defense Event Velocity (Technical Debt); Vulnerability Exposure Score; Asset Surface Area (Surface Area); Network Transaction Trust Score (Opportunity Risk); and/or Defense Configuration Maturity (Length of Score History), among many others. According to an embodiment, the cyber risk index component score may factor the one or more factors using the following equation:

- Each index component score is calculated by using the set of index component score per sensor type to calculate a ratio of the contribution per sensor type to that score by multiplying the index component score per sensor by an index component score weighting function. The resulting weighted scores are averaged and produce the score for index component representing the result of analyzing event data from all sensors. According to an embodiment, risk indicators and component index scores may be of a time-series analysis nature, calculating values over 'historical' periods and comparing values to current time windows. Time windows are configurable and many combinations of time periods are possible. After processing, each index score can be tagged with its type and stored in the analytic fact database.
- According to an embodiment, the "Defense Effectiveness" index component score measures indicators of repetitious defense events on a networked computing asset, potentially indicating compromise by an attack. The "Technical Debt" index component score is the proportion of total detection activity (vulnerabilities, threats) relative to the number of assets (given the percent of the network scanned) and comparing this proportion to those of the recent past. It is meant to tell the user how much debt they have incurred where debt is expressed in terms of security issues (as opposed to owed capital). The "Opportunity Risk" index component score represents how the severity of current detections compares to the maximum severity that could be seen. The "Detections from New Threats" index component score tells a user how many of their current threats are 'new', where new refers to a threat that has not been seen on the network over the past N time periods, depending upon the time window being analyzed. The "Surface Area" index component score measures how many of the network assets currently have threat detections. The "Audit Data Quality" index component score calculates the quality of data input, availability, and breadth of sensor contributions to the audit data over the past N days. For each day of history, this metric calculates rates of activity from each sensor as compared to similar day of week, day of year, and whether it is a weekend day or weekday. If a sensor has reported activity for that day, the data is analyzed for patterns of potentially missing data based on historical rates of data production.
- According to an embodiment, the equations below represent one possible method for calculating the risk index component scores, in accordance with one possible embodiment of the invention. The following definitions of sets and terms apply to the subsequent equations for calculating the risk index component scores:
- e ∈ Events →
e is an atomic computation action detected by network and host level monitoring data sources - Eventscurrent = ∀e within past time period between t 0 and t -1
- Eventshistorical = ∀e within past time period t -1 to t-n
- τ ∈ Threats and Threats ⊆ Events
- Threatscurrent = ∀τ within past time period t 0 and t -1
- Threatshistorical = ∀τ within past time period t -1 and t-n
- a ∈ Assets →
a is a device operating on a given network being monitored for e - Assetscurrent = ∀a with activity within the past time period t 0 to t -1
- Assetshistorical = ∀a with event activity within the past time period t -1 to t-n
- s ∈ Sensors where s produces ∃e
- The following equations represent one possible method for specific index score calculations, in accordance with one possible embodiment of the invention, and utilize the definitions of sets and terms provided above:



- Referring to
FIG. 7 is a flowchart of a method for cyber risk indicator index overall score calculation, in accordance with an embodiment. In order to compute the cyber risk indicator index score, the values for all component risk scores for a choose time period of analysis are retrieved from the analytic fact database. Once retrieved, each component score is normalized relative to the number of points allocated to that component index per the system configuration. Subsequently, another operation to create the appropriate score distribution is applied via a configurable function for the score coefficient. Next, all of the scores are added and the sum is returned as the cyber risk indicator index score. - The cyber risk indicator index score can then optionally be reported to a user and/or a user interface. According to one embodiment, the determined cyber risk indicator index score may be reported as a number or other format to a user through a user interface, or can be communicated to the user via a wired and/or wireless communications network. For example, the score may be communicated as a report, an email, a text message, a haptic indicator, a visual indicator, and/or an audible indicator, or any of a wide variety of other indications or communications. As another example, the score can be compared or normalized to a reporting mechanism such as a constant display or other user interface. When the score is below a predetermined threshold, the display reports the information, such as by displaying the color green. When the score exceeds a predetermined threshold, the display reports the information to the user, such as by displaying the color red. Many other display and/or notification systems and methods are possible.
- Alternatively or in addition to reporting the cyber risk indicator index score to a user, the system can be designed or configured to automatically process the cyber risk indicator index score in order to perform an Information Technology orchestration automation, implement an additional compliance rule, adapt the acceptable risk index score thresholds, or automatically produce alerts of risk rule violations via e-mail, text, or perform any other action as necessary. For example, according to an embodiment the system can take one or more preprogrammed preventative actions based on the score, such as inactivating a system or sub-system, blocking and/or inactivating a communications network, changing or deleting permissions, or any of a wide variety of other actions.
- An example operational scenario of an automated response triggered is depicted in
FIG 8 . The continuously updated cyber risk score enables an automated response mechanism for IT operations orchestration and automation, risk alerting, risk reporting, and Identity and Access Management (IAM) adaptation, among other possible outcomes as described or otherwise envisioned herein. As one example, in an IT operations orchestration scenario, the risk results include a score for particular network segments (e.g., 10.1.x.x/16) and gives that system a means of prioritizing changes to IT infrastructure and increasing or decreasing protections as needed. For example, if the risk is measured to be low across an organization, then certain IT policies can be triggered which reduce firewall port restrictions on certain segments of the network. If the risk is measured to be high, then additional virtual firewalls and network intrusion prevention system rules may be put into place. In the risk alerting scenario, the alerts become a feedback loop for products like Security Information Event Management (SIEM) systems which can use scores for network segments to prioritize certain alerts. The alerting function can also be used as a type of IT security or operations alert to employees. The Risk Reporting scenario involves producing an automated scorecard and textual risk report that includes a scorecard of IT risk indicator status as well as depictions of the causes of the score improving or worsening, including such items as the patterns and volatility of the risk indicator scores, causes of gaps in the scores, and a prioritize list of contributors to loss of score points due to certain types of events, activity by network segments, geographically-focused activity to include natural disasters, and sensors producing abnormal event volumes. - Referring to
FIG. 9 , in one embodiment, is a flowchart of a method for cyber security risk analysis. According to an embodiment, the method described inFIG. 9 is utilized to generate a cybersecurity score for the network or networks under assessment, optionally on a continuous basis. - At
step 910 of the method, data from various sources is collected and processed into a uniform format. For example, the system can utilize many different inputs, including but not limited to network firewalls, proxies, intrusion detection and prevention systems (IDS/IPS), asset management systems, vulnerability scanners, threat intelligence data, host-based security protection agents, security information event management systems, and other sensors related to cybersecurity monitoring and protection. These inputs produce data related to network infrastructure and device activity, defense sensor and host endpoint behavior, externally bound network activity, data and activity volume, malware detections and observed threats (including repeated threats), and asset configuration state, among other things. - At
step 920 of the method, the data collected by the system from various different sensors, inputs, databases, and/or other sources is processed into a uniform format. Accordingly, the data undergoes a transformation and normalization process. According to an embodiment, in order to assess the importance of input data, it is first normalized to a discrete sensor type such as Firewall, Intrusion Detection, Proxy, AntiVirus, Configuration Management, or Vulnerability Scanner, among others. For example, according to an embodiment, normalization of the index occurs using these primary factors: source type, asset identification, risk indicator properties (data bounds detected for properties based on the common information model), and risk index component contribution. Data source normalization can involve taking a source audit record (event in a log) and making a determination as to a type of source information for which this data matches the given pattern. After the pattern is identified to a given source type, the source type knowledge base is queried to determine the root source type for that data. - At
step 930 of the method, one or more events are created from the normalized data. According to an embodiment, after normalization and categorization is complete, the data is transformed into a format that can be processed by the analytic engine, called an event. According to an embodiment, events produced by the source data normalization processed can be stored in an event database. - At
step 940 of the method, analytics facts are computed from the event data. According to an embodiment, using the normalized Event database created by the source data normalization process, entities called analytic facts are computed based on applying mathematical functions, pattern detection, anomaly detection, and rule-based assessment of the event data. Facts represent an assessment of Events, Facts, or a combination thereof. Examples of methods of deriving facts include, but are not limited to: (i) metrics in the form of: minimum; maximum; average; moving average; median; mode; and/or standard deviation; and (ii) mathematical functions in the form of: count; sum; trend, including increasing, decreasing, or same; rate (for example: time between events; rate of x per an object y; slope - rate of change over time); duration (for example: between events x and y, or event types a and b; time from detection of threat to containment or remediation of that threat data confidence - percent of errors in the data). Many other methods of deriving facts are possible. According to an embodiment, facts produced by the system can be stored in an Analytic Fact Database. - At
step 950 of the method, one or more risk indicators are generated from the facts. According to an embodiment, risk indicators are computed from facts, including by applying global and/or time-series analysis of fact and event data in order to derive the indicator. Combining facts into risk indicators can make use of any function, including but not limited the examples set forth herein. Once risk indicators are calculated, they can be stored in an Analytic Fact Database for normalization processing. - At
step 960 of the method, the one or more risk factors are normalized. According to an embodiment, the risk factors can be normalized by their associated data source type (sensor or detector), including additional normalizations such as the category of threat or vulnerability, logical/virtual location of the event, and physical or geographic location of the event, among many other options. - For example, in order to provide a cybersecurity risk index score that is comparable between two distinct sets of networked computing assets, such as departments within an organization or organizations of different sizes, normalizing the risk indicators is an important step in the index calculation process. The methods for normalization may be performed on variables that are shared across events and analytic facts, for example in the current embodiment they take the form of normalization by the sensor type that recorded the event, threat type, defense action type, vulnerability type, logical location (i.e., network assignment) or physical location.
- At
step 970 of the method, a risk index component score is calculated. According to an embodiment, a subset of Analytic Facts is retrieved per data source type and is then analyzed to produce various component scores. Risk indicators can be used to calculate the risk index component scores. Analytic facts for risk indicators that are normalized by sensor type are used to compute a set of risk index component scores, the set containing one set per sensor type that for which event data is available. The cyber risk index component score may include any of the factors described or otherwise envisioned herein. - At
step 980 of the method, a cyber risk indicator index is calculated using the one or more cyber risk index component scores. According to an embodiment, to compute the cyber risk indicator index score, the values for all component risk scores for a choose time period of analysis are retrieved from the Analytic Fact database. Once retrieved, each component score is normalized relative to the number of points allocated to that component index per the system configuration. Subsequently, another operation to create the appropriate score distribution is applied via a configurable function for the score coefficient. Next, all of the scores are added and the sum is returned as the cyber risk indicator index score. - At
step 990 of the method, the cyber risk indicator index is provided to a user. According to an embodiment, the cyber risk indicator index can be provided via a wired and/or wireless communications network. For example, the score may be communicated as a report, an email, a text message, a haptic indicator, a visual indicator, and/or an audible indicator, or any of a wide variety of other indications or communications. Alternatively or in addition to reporting the cyber risk indicator index score to a user, the system can be designed or configured to automatically process the cyber risk indicator index score in order to perform an Information Technology orchestration automation, implement an additional compliance rule, adapt the acceptable risk index score thresholds, or automatically produce alerts of risk rule violations via e-mail, text, or perform any other action as necessary. For example, according to an embodiment the system can take one or more preprogrammed preventative actions based on the score, such as inactivating a system or sub-system, blocking and/or inactivating a communications network, changing or deleting permissions, or any of a wide variety of other actions. - According to another embodiment, the cyber risk indicator index is provided via a user interface, such as a cyber risk dashboard. Referring to
FIGS. 10-12 , for example, are embodiments of one or more components of a cyber risk user interface or dashboard. InFIG. 10 , for example, the calculated cyber risk index is calculated as a score between 0 and 100, inclusive. InFIG. 11 , for example, the calculated cyber risk index is calculated as a score between 0 and 100, and events or risk factors are provided to the user depending on the severity of the risk (critical, important, moderate, low, and no criticality, for example). InFIG. 12 , for example, the calculated cyber risk index is calculated as a score between 0 and 100 and is plotted on a graph over time. The user can then monitor changes in the calculated cyber risk index over time, and can extract or calculate patterns in the changing cyber risk index. - As another example, the score can be compared or normalized to a reporting mechanism such as a constant display or other user interface. When the score is below a predetermined threshold, the display reports the information, such as by displaying the color green. When the score exceeds a predetermined threshold, the display reports the information to the user, such as by displaying the color red. Many other display and/or notification systems and methods are possible.
- While various embodiments have been described and illustrated herein, those of ordinary skill in the art will readily envision a variety of other means and/or structures for performing the function and/or obtaining the results and/or one or more of the advantages described herein, and each of such variations and/or modifications is deemed to be within the scope of the embodiments described herein. More generally, those skilled in the art will readily appreciate that all parameters, dimensions, materials, and configurations described herein are meant to be exemplary and that the actual parameters, dimensions, materials, and/or configurations will depend upon the specific application or applications for which the teachings is/are used. Those skilled in the art will recognize, or be able to ascertain using no more than routine experimentation, many equivalents to the specific embodiments described herein. It is, therefore, to be understood that the foregoing embodiments are presented by way of example only and that, within the scope of the appended claims and equivalents thereto, embodiments may be practiced otherwise than as specifically described and claimed. Embodiments of the present disclosure are directed to each individual feature, system, article, material, kit, and/or method described herein. In addition, any combination of two or more such features, systems, articles, materials, kits, and/or methods, if such features, systems, articles, materials, kits, and/or methods are not mutually inconsistent, is included within the scope of the present disclosure.
- The above-described embodiments of the described subject matter can be implemented in any of numerous ways. For example, some embodiments may be implemented using hardware, software or a combination thereof. When any aspect of an embodiment is implemented at least in part in software, the software code can be executed on any suitable processor or collection of processors, whether provided in a single device or computer or distributed among multiple devices/computers.
Claims (15)
- A method for assessing a cyber security risk, comprising:obtaining cyber security precursor information from a plurality of sensors, wherein the cyber security precursor information is obtained from one or more online or offline sources;normalizing the obtained cyber security precursor information from each sensor to a common information model based on a data source type identified for each sensor;generating a plurality of events based on the normalized cyber security precursor information, wherein the plurality of events include:a timestamp for pedigree;a set of attributes for semantic properties being represented; anda set of graph-like relationships between events using node and edge representations;computing a plurality of facts based on the plurality of generated events, each fact represents an assessment of events and facts, and each fact comprising a context that is a reference to a set of events and facts that contributed to a value represented by the fact;calculating a plurality of risk indicators from the plurality of facts, each risk indicator based on a time-series analysis of a type of the fact;normalizing the plurality of risk indicators by normalizing the risk indicators according to their associated data source type;calculating a plurality of cyber risk index component scores for each data source type based on the plurality of normalized facts for each risk indicator; andcalculating a cyber risk indicator index based on the plurality of cyber risk index components scores.
- The method of claim 1, further comprising storing the generated plurality of events in an event database.
- The method of claim 1, further comprising storing the generated plurality of facts in a fact database.
- The method of claim 1, further comprising storing the generated plurality of risk indicators in a risk indicator database.
- The method of claim 1, wherein computing the plurality of facts comprises one or more of a mathematical analysis, pattern detection, anomaly detection, and rule-based assessment of the plurality of events.
- The method of claim 1, wherein the cyber risk indicator index comprises a score between 0 and 100.
- The method of claim 1, further comprising providing the cyber risk indicator index to a user.
- The method of claim 7, wherein providing the cyber risk indicator index to a user comprises a user interface.
- The method of claim 8, wherein the user interface comprises a graph of cyber risk indicator index over time.
- The method of claim 1, further comprising comparing the cyber risk indicator index to a pre-determined threshold.
- The method of claim 10, further comprising notifying a user if the cyber risk indicator index exceeds the pre-determined threshold.
- The method of claim 10, further comprising initiating an automated action if the cyber risk indicator index exceeds the pre-determined threshold.
- A computerized system configured to assess a cyber security risk, the system comprising:a plurality of sensors, the plurality of sensors configured to obtain cyber security precursor information;an event database configured to store a plurality of events;a fact database configured to store a plurality of facts; anda processor programmed to perform the method of any of claims 1 to 12.
- A computer system configured to assess a cyber security risk, the computer system comprising:a non-transitory computer-readable storage medium configured to store data collected by the computer system and comprising computer-executable instructions;a processor programmed to execute the computer-executable instructions resulting in the computer system performing the method of any of claims 1 to 12.
- The computerized system of claim 13 or the computer system of claim 14, further comprising a user interface.
Applications Claiming Priority (2)
| Application Number | Priority Date | Filing Date | Title |
|---|---|---|---|
| US15/336,307 US10212184B2 (en) | 2016-10-27 | 2016-10-27 | Method for the continuous calculation of a cyber security risk index |
| PCT/US2017/057797 WO2018080957A1 (en) | 2016-10-27 | 2017-10-23 | Method for the continuous calculation of a cyber security risk index |
Publications (2)
| Publication Number | Publication Date |
|---|---|
| EP3529733A1 EP3529733A1 (en) | 2019-08-28 |
| EP3529733B1 true EP3529733B1 (en) | 2025-05-21 |
Family
ID=60268480
Family Applications (1)
| Application Number | Title | Priority Date | Filing Date |
|---|---|---|---|
| EP17794849.4A Active EP3529733B1 (en) | 2016-10-27 | 2017-10-23 | Method for the continuous calculation of a cyber security risk index |
Country Status (3)
| Country | Link |
|---|---|
| US (2) | US10212184B2 (en) |
| EP (1) | EP3529733B1 (en) |
| WO (1) | WO2018080957A1 (en) |
Families Citing this family (102)
| Publication number | Priority date | Publication date | Assignee | Title |
|---|---|---|---|---|
| US10805331B2 (en) | 2010-09-24 | 2020-10-13 | BitSight Technologies, Inc. | Information technology security assessment system |
| US9438615B2 (en) | 2013-09-09 | 2016-09-06 | BitSight Technologies, Inc. | Security risk management |
| US20190018968A1 (en) * | 2014-07-17 | 2019-01-17 | Venafi, Inc. | Security reliance scoring for cryptographic material and processes |
| US11855768B2 (en) | 2014-12-29 | 2023-12-26 | Guidewire Software, Inc. | Disaster scenario based inferential analysis using feedback for extracting and combining cyber risk information |
| US11863590B2 (en) | 2014-12-29 | 2024-01-02 | Guidewire Software, Inc. | Inferential analysis using feedback for extracting and combining cyber risk information |
| US10404748B2 (en) | 2015-03-31 | 2019-09-03 | Guidewire Software, Inc. | Cyber risk analysis and remediation using network monitored sensors and methods of use |
| US20200389495A1 (en) | 2015-10-28 | 2020-12-10 | Qomplx, Inc. | Secure policy-controlled processing and auditing on regulated data sets |
| US12224992B2 (en) | 2015-10-28 | 2025-02-11 | Qomplx Llc | AI-driven defensive cybersecurity strategy analysis and recommendation system |
| US11570209B2 (en) | 2015-10-28 | 2023-01-31 | Qomplx, Inc. | Detecting and mitigating attacks using forged authentication objects within a domain |
| US12081594B2 (en) | 2015-10-28 | 2024-09-03 | Qomplx Llc | Highly scalable four-dimensional geospatial data system for simulated worlds |
| US10681074B2 (en) * | 2015-10-28 | 2020-06-09 | Qomplx, Inc. | System and method for comprehensive data loss prevention and compliance management |
| US20250039196A1 (en) | 2023-07-27 | 2025-01-30 | Qomplx Llc | System and method for track and trace user and entity behavior analysis |
| US20220014555A1 (en) | 2015-10-28 | 2022-01-13 | Qomplx, Inc. | Distributed automated planning and execution platform for designing and running complex processes |
| US12598197B2 (en) | 2015-10-28 | 2026-04-07 | Qomplx Llc | System and methods for detecting authentication object forgery or manipulation attacks |
| US12556523B2 (en) | 2015-10-28 | 2026-02-17 | Qomplx Llc | Dynamic authentication attack detection and enforcement at network, application, and host level |
| US12506715B2 (en) | 2015-10-28 | 2025-12-23 | Qomplx Llc | Network authentication toxicity assessment |
| US10277625B1 (en) * | 2016-09-28 | 2019-04-30 | Symantec Corporation | Systems and methods for securing computing systems on private networks |
| EP3545418A4 (en) | 2016-11-22 | 2020-08-12 | AON Global Operations PLC, Singapore Branch | SYSTEMS AND PROCEDURES FOR RISK ASSESSMENT OF CYBERSECURITY |
| US11310247B2 (en) * | 2016-12-21 | 2022-04-19 | Micro Focus Llc | Abnormal behavior detection of enterprise entities using time-series data |
| US10581896B2 (en) * | 2016-12-30 | 2020-03-03 | Chronicle Llc | Remedial actions based on user risk assessments |
| KR101781450B1 (en) * | 2017-01-03 | 2017-09-25 | 한국인터넷진흥원 | Method and Apparatus for Calculating Risk of Cyber Attack |
| US10791136B2 (en) * | 2017-03-20 | 2020-09-29 | Fair Isaac Corporation | System and method for empirical organizational cybersecurity risk assessment using externally-visible data |
| US10999296B2 (en) | 2017-05-15 | 2021-05-04 | Forcepoint, LLC | Generating adaptive trust profiles using information derived from similarly situated organizations |
| US11632382B2 (en) | 2017-05-15 | 2023-04-18 | Forcepoint Llc | Anomaly detection using endpoint counters |
| US11949700B2 (en) | 2017-05-15 | 2024-04-02 | Forcepoint Llc | Using content stored in an entity behavior catalog in combination with an entity risk score |
| US10318729B2 (en) | 2017-07-26 | 2019-06-11 | Forcepoint, LLC | Privacy protection during insider threat monitoring |
| US12387270B2 (en) * | 2017-07-26 | 2025-08-12 | Guidewire Software, Inc. | Synthetic diversity analysis with actionable feedback methodologies |
| US10999324B2 (en) | 2017-08-01 | 2021-05-04 | Forcepoint, LLC | Direct-connect web endpoint |
| US10713657B2 (en) * | 2017-08-01 | 2020-07-14 | Capital One Services, Llc | Systems and methods for estimating authenticity of local network of device initiating remote transaction |
| US10904282B2 (en) * | 2017-08-08 | 2021-01-26 | American International Group, Inc. | System and method for assessing cybersecurity risk of computer network |
| US11768934B2 (en) * | 2017-08-22 | 2023-09-26 | Sontiq, Inc. | Data breach system and method |
| US12457231B1 (en) * | 2017-11-27 | 2025-10-28 | Fortinet, Inc. | Initiating and utilizing pedigree for content |
| US11431740B2 (en) * | 2018-01-02 | 2022-08-30 | Criterion Systems, Inc. | Methods and systems for providing an integrated assessment of risk management and maturity for an organizational cybersecurity/privacy program |
| EP3746891A4 (en) | 2018-01-31 | 2020-12-23 | Aon Risk Consultants, Inc. | SYSTEM AND PROCEDURES FOR EVALUATING THE VULNERABILITY AND PROVIDING RELATED SERVICES AND PRODUCTS FOR EFFICIENT RISK REDUCTION |
| US10931687B2 (en) * | 2018-02-20 | 2021-02-23 | General Electric Company | Cyber-attack detection, localization, and neutralization for unmanned aerial vehicles |
| US10257219B1 (en) | 2018-03-12 | 2019-04-09 | BitSight Technologies, Inc. | Correlated risk in cybersecurity |
| US10812520B2 (en) | 2018-04-17 | 2020-10-20 | BitSight Technologies, Inc. | Systems and methods for external detection of misconfigured systems |
| US11200323B2 (en) | 2018-10-17 | 2021-12-14 | BitSight Technologies, Inc. | Systems and methods for forecasting cybersecurity ratings based on event-rate scenarios |
| US10791139B2 (en) * | 2018-10-24 | 2020-09-29 | American Bureau of Shipping | Cyber security risk model and index |
| US10521583B1 (en) | 2018-10-25 | 2019-12-31 | BitSight Technologies, Inc. | Systems and methods for remote detection of software through browser webinjects |
| US10885186B2 (en) | 2018-11-13 | 2021-01-05 | Forcepoint, LLC | System and method for operating a protected endpoint device |
| US12052276B2 (en) * | 2018-11-30 | 2024-07-30 | Proofpoint, Inc. | People-centric threat scoring |
| EP3918770A4 (en) | 2019-01-31 | 2022-04-13 | Aon Risk Consultants, Inc. | VULNERABILITY ASSESSMENT AND PATCH IDENTIFICATION SYSTEMS AND METHODS |
| WO2020168299A1 (en) * | 2019-02-14 | 2020-08-20 | Talisai Inc. | Artificial intelligence accountability platform and extensions |
| US11363051B2 (en) * | 2019-04-01 | 2022-06-14 | Armis Security Ltd. | System and method for mitigating cyber security threats by devices using risk factors |
| US11126711B2 (en) * | 2019-04-09 | 2021-09-21 | Jpmorgan Chase Bank, N.A. | System and method for implementing a log source value tool for security information event management |
| US11297075B2 (en) * | 2019-07-03 | 2022-04-05 | Microsoft Technology Licensing, Llc | Determine suspicious user events using grouped activities |
| US10726136B1 (en) | 2019-07-17 | 2020-07-28 | BitSight Technologies, Inc. | Systems and methods for generating security improvement plans for entities |
| US11316891B2 (en) | 2019-07-18 | 2022-04-26 | Bank Of America Corporation | Automated real-time multi-dimensional cybersecurity threat modeling |
| US11232384B1 (en) * | 2019-07-19 | 2022-01-25 | The Boston Consulting Group, Inc. | Methods and systems for determining cyber related projects to implement |
| US11956265B2 (en) | 2019-08-23 | 2024-04-09 | BitSight Technologies, Inc. | Systems and methods for inferring entity relationships via network communications of users or user devices |
| WO2021055924A1 (en) * | 2019-09-21 | 2021-03-25 | Proofpoint, Inc. | Managing and routing of endpoint telemetry using realms |
| US10848382B1 (en) | 2019-09-26 | 2020-11-24 | BitSight Technologies, Inc. | Systems and methods for network asset discovery and association thereof with entities |
| US11032244B2 (en) | 2019-09-30 | 2021-06-08 | BitSight Technologies, Inc. | Systems and methods for determining asset importance in security risk management |
| US10754506B1 (en) * | 2019-10-07 | 2020-08-25 | Cyberark Software Ltd. | Monitoring and controlling risk compliance in network environments |
| CN111126836A (en) * | 2019-12-23 | 2020-05-08 | 中国铁道科学研究院集团有限公司电子计算技术研究所 | Security vulnerability risk assessment method and device for high-speed train operation control system |
| US10893067B1 (en) | 2020-01-31 | 2021-01-12 | BitSight Technologies, Inc. | Systems and methods for rapidly generating security ratings |
| USD1071973S1 (en) * | 2020-02-26 | 2025-04-22 | BitSight Technologies, Inc. | Computer display screen with graphical user interface for risk vector analysis |
| US12069073B2 (en) * | 2020-02-28 | 2024-08-20 | Darktrace Holdings Limited | Cyber threat defense system and method |
| US11777992B1 (en) | 2020-04-08 | 2023-10-03 | Wells Fargo Bank, N.A. | Security model utilizing multi-channel data |
| US11720686B1 (en) | 2020-04-08 | 2023-08-08 | Wells Fargo Bank, N.A. | Security model utilizing multi-channel data with risk-entity facing cybersecurity alert engine and portal |
| US12341816B1 (en) | 2020-04-08 | 2025-06-24 | Wells Fargo Bank, N.A. | Security model utilizing multi-channel data with service level agreement integration |
| US12015630B1 (en) | 2020-04-08 | 2024-06-18 | Wells Fargo Bank, N.A. | Security model utilizing multi-channel data with vulnerability remediation circuitry |
| US11706241B1 (en) | 2020-04-08 | 2023-07-18 | Wells Fargo Bank, N.A. | Security model utilizing multi-channel data |
| CN111539617B (en) * | 2020-04-21 | 2022-04-12 | 中国联合网络通信集团有限公司 | Data processing method and device, electronic equipment, interaction system and storage medium |
| US11734431B2 (en) * | 2020-04-27 | 2023-08-22 | Saudi Arabian Oil Company | Method and system for assessing effectiveness of cybersecurity controls in an OT environment |
| US11556635B2 (en) | 2020-04-28 | 2023-01-17 | Bank Of America Corporation | System for evaluation and weighting of resource usage activity |
| WO2021231640A1 (en) * | 2020-05-13 | 2021-11-18 | Cogility Software Corporation | Systems and methods to compute a risk metric on a network of processing nodes |
| US20210360017A1 (en) * | 2020-05-14 | 2021-11-18 | Cynomi Ltd | System and method of dynamic cyber risk assessment |
| US12107894B1 (en) * | 2020-05-20 | 2024-10-01 | State Farm Mutual Automobile Insurance Company | Automated service ticket generation |
| US11023585B1 (en) | 2020-05-27 | 2021-06-01 | BitSight Technologies, Inc. | Systems and methods for managing cybersecurity alerts |
| US11122073B1 (en) | 2020-12-11 | 2021-09-14 | BitSight Technologies, Inc. | Systems and methods for cybersecurity risk mitigation and management |
| CN112637212B (en) * | 2020-12-24 | 2022-09-16 | 北京天融信网络安全技术有限公司 | Analysis method and analysis device for network security situation |
| US11838275B2 (en) | 2021-03-12 | 2023-12-05 | Forcepoint Llc | Web endpoint device having automatic switching between proxied and non-proxied communication modes |
| US12079347B2 (en) | 2021-03-31 | 2024-09-03 | BitSight Technologies, Inc. | Systems and methods for assessing cybersecurity risk in a work from home environment |
| US12353563B2 (en) | 2021-07-01 | 2025-07-08 | BitSight Technologies, Inc. | Systems and methods for accelerating cybersecurity assessments |
| CN113779195B (en) * | 2021-08-31 | 2023-12-22 | 西南电子技术研究所(中国电子科技集团公司第十研究所) | Hot event status assessment method |
| US12425437B2 (en) | 2021-09-17 | 2025-09-23 | BitSight Technologies, Inc. | Systems and methods for precomputation of digital asset inventories |
| US12052274B2 (en) | 2021-09-23 | 2024-07-30 | Armis Security Ltd. | Techniques for enriching device profiles and mitigating cybersecurity threats using enriched device profiles |
| US12579277B2 (en) | 2021-11-23 | 2026-03-17 | Qatar Foundation For Education, Science And Community Development | Quantifying satisfaction of security features of cloud software systems |
| US12488115B2 (en) | 2022-01-20 | 2025-12-02 | Capital One Services, Llc | Systems and methods for analyzing cybersecurity threat severity using machine learning |
| US12418557B2 (en) | 2022-01-21 | 2025-09-16 | Tennessee Technological University | Systems and methods for cyber risk assessment for computing systems |
| US12282564B2 (en) | 2022-01-31 | 2025-04-22 | BitSight Technologies, Inc. | Systems and methods for assessment of cyber resilience |
| US12143389B1 (en) | 2022-02-04 | 2024-11-12 | Wells Fargo Bank, N.A. | 3rd party data explorer |
| US12572846B2 (en) | 2022-03-22 | 2026-03-10 | Armis Security Ltd. | System and method for device attribute identification based on host configuration protocols |
| US12470593B2 (en) | 2022-07-11 | 2025-11-11 | Armis Security Ltd. | Malicious lateral movement detection using remote system protocols |
| US20240236138A1 (en) * | 2022-08-23 | 2024-07-11 | Alfahive Inc. | System and method to quantify domain-centric risk |
| CN115225413B (en) * | 2022-09-20 | 2022-12-23 | 北京微步在线科技有限公司 | Method and device for extracting defect index, electronic equipment and storage medium |
| CN116132103A (en) * | 2022-12-06 | 2023-05-16 | 中国电信股份有限公司 | Network security situation monitoring method and device, electronic equipment and storage medium |
| CN119604853A (en) * | 2022-12-19 | 2025-03-11 | 松下汽车电子系统株式会社 | Information notification method and information notification device |
| CN116471102B (en) * | 2023-05-04 | 2025-07-11 | 江西映乐信息技术有限公司 | Network information security monitoring system and method based on big data management |
| CN116910824B (en) * | 2023-08-28 | 2024-02-06 | 广东中山网传媒信息科技有限公司 | A secure big data analysis method and system based on distributed multi-source measurement |
| US20250094582A1 (en) * | 2023-09-15 | 2025-03-20 | International Business Machines Corporation | Selectively prioritizing alerts received for an advanced cybersecurity threat prioritization system |
| CN117195183B (en) * | 2023-09-28 | 2024-04-16 | 四川赛闯检测股份有限公司 | Data security compliance risk assessment system |
| CN117579389B (en) * | 2024-01-16 | 2024-04-05 | 北京源堡科技有限公司 | Network security assessment method, system, equipment and medium based on risk exposure surface |
| US20250280027A1 (en) * | 2024-02-29 | 2025-09-04 | Palo Alto Networks, Inc. | Security rating & incident risk scoring for attack surface management |
| US12309205B1 (en) | 2024-05-17 | 2025-05-20 | Virtualitics, Inc. | Systems and methods configured for automatically predicting device types for scanned devices on a network |
| US12244636B1 (en) * | 2024-05-17 | 2025-03-04 | Virtualitics, Inc. | Computer-based systems configured for network characterization and management and methods of use thereof |
| US12301613B1 (en) | 2024-05-17 | 2025-05-13 | Virtualitics, Inc. | Computer-based systems configured for network characterization and management based on automated key terrain identification and methods of use thereof |
| US12309150B1 (en) | 2024-05-17 | 2025-05-20 | Virtualitics, Inc. | Systems and methods configured for automatically assigning a unique identifier to a detected device |
| US12244635B1 (en) | 2024-05-17 | 2025-03-04 | Virtualitics, Inc. | Computer-based systems configured for network characterization and management based on risk score analysis and methods of use thereof |
| CN118611979B (en) * | 2024-07-04 | 2025-06-20 | 上海橄超信息技术有限公司 | A monitoring system for information network engineering supervision |
Family Cites Families (23)
| Publication number | Priority date | Publication date | Assignee | Title |
|---|---|---|---|---|
| US7340776B2 (en) | 2001-01-31 | 2008-03-04 | International Business Machines Corporation | Method and system for configuring and scheduling security audits of a computer network |
| KR100898241B1 (en) | 2002-09-30 | 2009-05-18 | 주식회사 케이티 | Apparatus and method for providing dynamic electronic infringement prevention service based on variable path configuration |
| US7376969B1 (en) | 2002-12-02 | 2008-05-20 | Arcsight, Inc. | Real time monitoring and analysis of events from multiple network security devices |
| US8201257B1 (en) | 2004-03-31 | 2012-06-12 | Mcafee, Inc. | System and method of managing network security risks |
| US20080025515A1 (en) | 2006-07-25 | 2008-01-31 | Jason Scott Coombs | Systems and Methods for Digitally-Signed Updates |
| US8732837B1 (en) | 2006-09-27 | 2014-05-20 | Bank Of America Corporation | System and method for monitoring the security of computing resources |
| US20090024663A1 (en) | 2007-07-19 | 2009-01-22 | Mcgovern Mark D | Techniques for Information Security Assessment |
| US8321937B2 (en) | 2007-11-25 | 2012-11-27 | Trend Micro Incorporated | Methods and system for determining performance of filters in a computer intrusion prevention detection system |
| US8850571B2 (en) | 2008-11-03 | 2014-09-30 | Fireeye, Inc. | Systems and methods for detecting malicious network content |
| US9317692B2 (en) | 2009-12-21 | 2016-04-19 | Symantec Corporation | System and method for vulnerability risk analysis |
| US9032521B2 (en) | 2010-10-13 | 2015-05-12 | International Business Machines Corporation | Adaptive cyber-security analytics |
| US8789192B2 (en) | 2011-05-23 | 2014-07-22 | Lockheed Martin Corporation | Enterprise vulnerability management |
| US8595845B2 (en) | 2012-01-19 | 2013-11-26 | Mcafee, Inc. | Calculating quantitative asset risk |
| US9112895B1 (en) | 2012-06-25 | 2015-08-18 | Emc Corporation | Anomaly detection system for enterprise network security |
| US20140137257A1 (en) | 2012-11-12 | 2014-05-15 | Board Of Regents, The University Of Texas System | System, Method and Apparatus for Assessing a Risk of One or More Assets Within an Operational Technology Infrastructure |
| US9003537B2 (en) | 2013-01-31 | 2015-04-07 | Hewlett-Packard Development Company, L.P. | CVSS information update by analyzing vulnerability information |
| US9264444B2 (en) | 2013-05-21 | 2016-02-16 | Rapid7, Llc | Systems and methods for determining an objective security assessment for a network of assets |
| US9401926B1 (en) | 2013-10-31 | 2016-07-26 | Fulcrum IP Services, LLC | System and method for implementation of cyber security |
| US9565204B2 (en) | 2014-07-18 | 2017-02-07 | Empow Cyber Security Ltd. | Cyber-security system and methods thereof |
| US20160080408A1 (en) | 2014-09-15 | 2016-03-17 | Lookingglass Cyber Solutions | Apparatuses, methods and systems for a cyber security assessment mechanism |
| SG11201703164RA (en) | 2014-10-21 | 2017-05-30 | Ironnet Cybersecurity Inc | Cybersecurity system |
| US10503967B2 (en) | 2014-11-21 | 2019-12-10 | The Regents Of The University Of California | Fast behavior and abnormality detection |
| US9372994B1 (en) | 2014-12-13 | 2016-06-21 | Security Scorecard, Inc. | Entity IP mapping |
-
2016
- 2016-10-27 US US15/336,307 patent/US10212184B2/en active Active
-
2017
- 2017-10-23 WO PCT/US2017/057797 patent/WO2018080957A1/en not_active Ceased
- 2017-10-23 EP EP17794849.4A patent/EP3529733B1/en active Active
-
2019
- 2019-01-15 US US16/248,632 patent/US10404737B1/en active Active
Non-Patent Citations (1)
| Title |
|---|
| ANONYMOUS: "Normalization (statistics) - Wikipedia", 30 June 2016 (2016-06-30), XP093143665, Retrieved from the Internet <URL:https://en.wikipedia.org/w/index.php?title=Normalization_(statistics)&oldid=727715826> [retrieved on 20240320] * |
Also Published As
| Publication number | Publication date |
|---|---|
| US10212184B2 (en) | 2019-02-19 |
| US20190253447A1 (en) | 2019-08-15 |
| WO2018080957A1 (en) | 2018-05-03 |
| US20180124091A1 (en) | 2018-05-03 |
| EP3529733A1 (en) | 2019-08-28 |
| US10404737B1 (en) | 2019-09-03 |
Similar Documents
| Publication | Publication Date | Title |
|---|---|---|
| US10404737B1 (en) | Method for the continuous calculation of a cyber security risk index | |
| US12107869B1 (en) | Automated quantified assessment, recommendations and mitigation actions for enterprise level security operations | |
| TWI595375B (en) | Anomaly detection using adaptive behavioral profiles | |
| US10860711B2 (en) | Method and system for analyzing risk | |
| Geer et al. | Information security: Why the future belongs to the quants | |
| Danish | Enhancing cyber security through predictive analytics: Real-time threat detection and response | |
| EP2945091B1 (en) | Assessment type-variable enterprise security impact analysis | |
| US20190207981A1 (en) | Control maturity assessment in security operations environments | |
| Forsberg et al. | Technical performance metrics of a security operations center | |
| US20200244693A1 (en) | Systems and methods for cybersecurity risk assessment of users of a computer network | |
| US20170054750A1 (en) | Risk assessment | |
| Agrafiotis et al. | Validating an insider threat detection system: A real scenario perspective | |
| Kim et al. | A framework for event prioritization in cyber network defense | |
| WO2015159926A1 (en) | Information leakage detection device, information leakage detection method, and information leakage detection program | |
| CN113344472A (en) | Network security scoring method | |
| Brignoli et al. | A distributed security tomography framework to assess the exposure of ICT infrastructures to network threats | |
| Zavrazhnyi et al. | Methodological principles of assessing the impact of artificial intelligence on the information security of management systems of enterprises | |
| Ņikiforova et al. | E-step control: Solution for processing and analysis of IS users activities in the context of insider threat identification based on Markov chain | |
| Setiawan et al. | Designing a Cybersecurity Risk Assessment Framework for Local Government Web-Based Applications | |
| Taylor et al. | Cybersecurity Indicators Within a Cybersecurity Testing and Monitoring Framework. | |
| JP2024532788A (en) | SYSTEM AND METHOD FOR MANAGING DIGITAL GOVERNANCE IN A DIGITAL ECOSYSTEM - Patent application | |
| Sherif et al. | The SMART approach to develop good cyber security metrics | |
| Boye | A Continuous Risk Management Approach for Cyber-Security in Industrial Control Systems | |
| Almheiri | AI-Driven Cyber Threat Detection | |
| US20260067326A1 (en) | Adaptive incident prioritization engine in a security management system |
Legal Events
| Date | Code | Title | Description |
|---|---|---|---|
| STAA | Information on the status of an ep patent application or granted ep patent |
Free format text: STATUS: UNKNOWN |
|
| STAA | Information on the status of an ep patent application or granted ep patent |
Free format text: STATUS: THE INTERNATIONAL PUBLICATION HAS BEEN MADE |
|
| PUAI | Public reference made under article 153(3) epc to a published international application that has entered the european phase |
Free format text: ORIGINAL CODE: 0009012 |
|
| STAA | Information on the status of an ep patent application or granted ep patent |
Free format text: STATUS: REQUEST FOR EXAMINATION WAS MADE |
|
| 17P | Request for examination filed |
Effective date: 20190524 |
|
| AK | Designated contracting states |
Kind code of ref document: A1 Designated state(s): AL AT BE BG CH CY CZ DE DK EE ES FI FR GB GR HR HU IE IS IT LI LT LU LV MC MK MT NL NO PL PT RO RS SE SI SK SM TR |
|
| AX | Request for extension of the european patent |
Extension state: BA ME |
|
| RAP1 | Party data changed (applicant data changed or rights of an application transferred) |
Owner name: OPAQ NETWORKS, INC. |
|
| DAV | Request for validation of the european patent (deleted) | ||
| DAX | Request for extension of the european patent (deleted) | ||
| RAP1 | Party data changed (applicant data changed or rights of an application transferred) |
Owner name: FORTINET, INC. |
|
| STAA | Information on the status of an ep patent application or granted ep patent |
Free format text: STATUS: EXAMINATION IS IN PROGRESS |
|
| 17Q | First examination report despatched |
Effective date: 20211028 |
|
| GRAP | Despatch of communication of intention to grant a patent |
Free format text: ORIGINAL CODE: EPIDOSNIGR1 |
|
| STAA | Information on the status of an ep patent application or granted ep patent |
Free format text: STATUS: GRANT OF PATENT IS INTENDED |
|
| INTG | Intention to grant announced |
Effective date: 20250226 |
|
| GRAS | Grant fee paid |
Free format text: ORIGINAL CODE: EPIDOSNIGR3 |
|
| GRAA | (expected) grant |
Free format text: ORIGINAL CODE: 0009210 |
|
| STAA | Information on the status of an ep patent application or granted ep patent |
Free format text: STATUS: THE PATENT HAS BEEN GRANTED |
|
| P01 | Opt-out of the competence of the unified patent court (upc) registered |
Free format text: CASE NUMBER: APP_14464/2025 Effective date: 20250325 |
|
| AK | Designated contracting states |
Kind code of ref document: B1 Designated state(s): AL AT BE BG CH CY CZ DE DK EE ES FI FR GB GR HR HU IE IS IT LI LT LU LV MC MK MT NL NO PL PT RO RS SE SI SK SM TR |
|
| REG | Reference to a national code |
Ref country code: GB Ref legal event code: FG4D |
|
| REG | Reference to a national code |
Ref country code: CH Ref legal event code: EP |
|
| REG | Reference to a national code |
Ref country code: DE Ref legal event code: R096 Ref document number: 602017089572 Country of ref document: DE |
|
| REG | Reference to a national code |
Ref country code: IE Ref legal event code: FG4D |
|
| REG | Reference to a national code |
Ref country code: NL Ref legal event code: MP Effective date: 20250521 |
|
| PG25 | Lapsed in a contracting state [announced via postgrant information from national office to epo] |
Ref country code: FI Free format text: LAPSE BECAUSE OF FAILURE TO SUBMIT A TRANSLATION OF THE DESCRIPTION OR TO PAY THE FEE WITHIN THE PRESCRIBED TIME-LIMIT Effective date: 20250521 Ref country code: PT Free format text: LAPSE BECAUSE OF FAILURE TO SUBMIT A TRANSLATION OF THE DESCRIPTION OR TO PAY THE FEE WITHIN THE PRESCRIBED TIME-LIMIT Effective date: 20250922 Ref country code: ES Free format text: LAPSE BECAUSE OF FAILURE TO SUBMIT A TRANSLATION OF THE DESCRIPTION OR TO PAY THE FEE WITHIN THE PRESCRIBED TIME-LIMIT Effective date: 20250521 |
|
| REG | Reference to a national code |
Ref country code: LT Ref legal event code: MG9D |
|
| PG25 | Lapsed in a contracting state [announced via postgrant information from national office to epo] |
Ref country code: GR Free format text: LAPSE BECAUSE OF FAILURE TO SUBMIT A TRANSLATION OF THE DESCRIPTION OR TO PAY THE FEE WITHIN THE PRESCRIBED TIME-LIMIT Effective date: 20250822 Ref country code: NO Free format text: LAPSE BECAUSE OF FAILURE TO SUBMIT A TRANSLATION OF THE DESCRIPTION OR TO PAY THE FEE WITHIN THE PRESCRIBED TIME-LIMIT Effective date: 20250821 |
|
| PG25 | Lapsed in a contracting state [announced via postgrant information from national office to epo] |
Ref country code: PL Free format text: LAPSE BECAUSE OF FAILURE TO SUBMIT A TRANSLATION OF THE DESCRIPTION OR TO PAY THE FEE WITHIN THE PRESCRIBED TIME-LIMIT Effective date: 20250521 Ref country code: NL Free format text: LAPSE BECAUSE OF FAILURE TO SUBMIT A TRANSLATION OF THE DESCRIPTION OR TO PAY THE FEE WITHIN THE PRESCRIBED TIME-LIMIT Effective date: 20250521 |
|
| PG25 | Lapsed in a contracting state [announced via postgrant information from national office to epo] |
Ref country code: BG Free format text: LAPSE BECAUSE OF FAILURE TO SUBMIT A TRANSLATION OF THE DESCRIPTION OR TO PAY THE FEE WITHIN THE PRESCRIBED TIME-LIMIT Effective date: 20250521 |
|
| PG25 | Lapsed in a contracting state [announced via postgrant information from national office to epo] |
Ref country code: HR Free format text: LAPSE BECAUSE OF FAILURE TO SUBMIT A TRANSLATION OF THE DESCRIPTION OR TO PAY THE FEE WITHIN THE PRESCRIBED TIME-LIMIT Effective date: 20250521 |
|
| PG25 | Lapsed in a contracting state [announced via postgrant information from national office to epo] |
Ref country code: RS Free format text: LAPSE BECAUSE OF FAILURE TO SUBMIT A TRANSLATION OF THE DESCRIPTION OR TO PAY THE FEE WITHIN THE PRESCRIBED TIME-LIMIT Effective date: 20250821 |
|
| PG25 | Lapsed in a contracting state [announced via postgrant information from national office to epo] |
Ref country code: IS Free format text: LAPSE BECAUSE OF FAILURE TO SUBMIT A TRANSLATION OF THE DESCRIPTION OR TO PAY THE FEE WITHIN THE PRESCRIBED TIME-LIMIT Effective date: 20250921 |
|
| PG25 | Lapsed in a contracting state [announced via postgrant information from national office to epo] |
Ref country code: LV Free format text: LAPSE BECAUSE OF FAILURE TO SUBMIT A TRANSLATION OF THE DESCRIPTION OR TO PAY THE FEE WITHIN THE PRESCRIBED TIME-LIMIT Effective date: 20250521 |
|
| REG | Reference to a national code |
Ref country code: AT Ref legal event code: MK05 Ref document number: 1797380 Country of ref document: AT Kind code of ref document: T Effective date: 20250521 |
|
| PGFP | Annual fee paid to national office [announced via postgrant information from national office to epo] |
Ref country code: DE Payment date: 20251029 Year of fee payment: 9 |
|
| PGFP | Annual fee paid to national office [announced via postgrant information from national office to epo] |
Ref country code: GB Payment date: 20251027 Year of fee payment: 9 |
|
| PG25 | Lapsed in a contracting state [announced via postgrant information from national office to epo] |
Ref country code: AT Free format text: LAPSE BECAUSE OF FAILURE TO SUBMIT A TRANSLATION OF THE DESCRIPTION OR TO PAY THE FEE WITHIN THE PRESCRIBED TIME-LIMIT Effective date: 20250521 Ref country code: DK Free format text: LAPSE BECAUSE OF FAILURE TO SUBMIT A TRANSLATION OF THE DESCRIPTION OR TO PAY THE FEE WITHIN THE PRESCRIBED TIME-LIMIT Effective date: 20250521 Ref country code: SM Free format text: LAPSE BECAUSE OF FAILURE TO SUBMIT A TRANSLATION OF THE DESCRIPTION OR TO PAY THE FEE WITHIN THE PRESCRIBED TIME-LIMIT Effective date: 20250521 |
|
| PGFP | Annual fee paid to national office [announced via postgrant information from national office to epo] |
Ref country code: FR Payment date: 20251027 Year of fee payment: 9 |
|
| PG25 | Lapsed in a contracting state [announced via postgrant information from national office to epo] |
Ref country code: CZ Free format text: LAPSE BECAUSE OF FAILURE TO SUBMIT A TRANSLATION OF THE DESCRIPTION OR TO PAY THE FEE WITHIN THE PRESCRIBED TIME-LIMIT Effective date: 20250521 |
|
| PG25 | Lapsed in a contracting state [announced via postgrant information from national office to epo] |
Ref country code: EE Free format text: LAPSE BECAUSE OF FAILURE TO SUBMIT A TRANSLATION OF THE DESCRIPTION OR TO PAY THE FEE WITHIN THE PRESCRIBED TIME-LIMIT Effective date: 20250521 |
|
| PG25 | Lapsed in a contracting state [announced via postgrant information from national office to epo] |
Ref country code: SK Free format text: LAPSE BECAUSE OF FAILURE TO SUBMIT A TRANSLATION OF THE DESCRIPTION OR TO PAY THE FEE WITHIN THE PRESCRIBED TIME-LIMIT Effective date: 20250521 Ref country code: RO Free format text: LAPSE BECAUSE OF FAILURE TO SUBMIT A TRANSLATION OF THE DESCRIPTION OR TO PAY THE FEE WITHIN THE PRESCRIBED TIME-LIMIT Effective date: 20250521 |
|
| PG25 | Lapsed in a contracting state [announced via postgrant information from national office to epo] |
Ref country code: IT Free format text: LAPSE BECAUSE OF FAILURE TO SUBMIT A TRANSLATION OF THE DESCRIPTION OR TO PAY THE FEE WITHIN THE PRESCRIBED TIME-LIMIT Effective date: 20250521 |
|
| REG | Reference to a national code |
Ref country code: DE Ref legal event code: R097 Ref document number: 602017089572 Country of ref document: DE |
|
| PLBE | No opposition filed within time limit |
Free format text: ORIGINAL CODE: 0009261 |
|
| STAA | Information on the status of an ep patent application or granted ep patent |
Free format text: STATUS: NO OPPOSITION FILED WITHIN TIME LIMIT |
|
| REG | Reference to a national code |
Ref country code: CH Ref legal event code: L10 Free format text: ST27 STATUS EVENT CODE: U-0-0-L10-L00 (AS PROVIDED BY THE NATIONAL OFFICE) Effective date: 20260402 |
|
| 26N | No opposition filed |
Effective date: 20260224 |