EP3522323A1 - Frequency response control system with clipping parameter determination - Google Patents
Frequency response control system with clipping parameter determination Download PDFInfo
- Publication number
- EP3522323A1 EP3522323A1 EP19154979.9A EP19154979A EP3522323A1 EP 3522323 A1 EP3522323 A1 EP 3522323A1 EP 19154979 A EP19154979 A EP 19154979A EP 3522323 A1 EP3522323 A1 EP 3522323A1
- Authority
- EP
- European Patent Office
- Prior art keywords
- bat
- battery
- power
- max
- signal
- Prior art date
- Legal status (The legal status is an assumption and is not a legal conclusion. Google has not performed a legal analysis and makes no representation as to the accuracy of the status listed.)
- Granted
Links
Images




Classifications
-
- H—ELECTRICITY
- H02—GENERATION; CONVERSION OR DISTRIBUTION OF ELECTRIC POWER
- H02J—ELECTRIC POWER NETWORKS; CIRCUIT ARRANGEMENTS OR SYSTEMS FOR SUPPLYING OR DISTRIBUTING ELECTRIC POWER; SYSTEMS FOR STORING ELECTRIC ENERGY
- H02J3/00—Circuit arrangements for AC mains or AC distribution networks
- H02J3/12—Arrangements for adjusting voltage in AC networks by changing a characteristic of the network load
-
- H—ELECTRICITY
- H02—GENERATION; CONVERSION OR DISTRIBUTION OF ELECTRIC POWER
- H02J—ELECTRIC POWER NETWORKS; CIRCUIT ARRANGEMENTS OR SYSTEMS FOR SUPPLYING OR DISTRIBUTING ELECTRIC POWER; SYSTEMS FOR STORING ELECTRIC ENERGY
- H02J3/00—Circuit arrangements for AC mains or AC distribution networks
- H02J3/001—Arrangements for handling faults or abnormalities, e.g. emergencies or contingencies
- H02J3/0014—Arrangements for handling faults or abnormalities, e.g. emergencies or contingencies for preventing or reducing power oscillations in networks
-
- H—ELECTRICITY
- H02—GENERATION; CONVERSION OR DISTRIBUTION OF ELECTRIC POWER
- H02J—ELECTRIC POWER NETWORKS; CIRCUIT ARRANGEMENTS OR SYSTEMS FOR SUPPLYING OR DISTRIBUTING ELECTRIC POWER; SYSTEMS FOR STORING ELECTRIC ENERGY
- H02J3/00—Circuit arrangements for AC mains or AC distribution networks
- H02J3/001—Arrangements for handling faults or abnormalities, e.g. emergencies or contingencies
- H02J3/0014—Arrangements for handling faults or abnormalities, e.g. emergencies or contingencies for preventing or reducing power oscillations in networks
- H02J3/00142—Oscillations concerning frequency
-
- H—ELECTRICITY
- H02—GENERATION; CONVERSION OR DISTRIBUTION OF ELECTRIC POWER
- H02J—ELECTRIC POWER NETWORKS; CIRCUIT ARRANGEMENTS OR SYSTEMS FOR SUPPLYING OR DISTRIBUTING ELECTRIC POWER; SYSTEMS FOR STORING ELECTRIC ENERGY
- H02J3/00—Circuit arrangements for AC mains or AC distribution networks
- H02J3/28—Arrangements for balancing of the load in networks by storage of energy
- H02J3/32—Arrangements for balancing of the load in networks by storage of energy using batteries or super capacitors with converting means
-
- H—ELECTRICITY
- H02—GENERATION; CONVERSION OR DISTRIBUTION OF ELECTRIC POWER
- H02J—ELECTRIC POWER NETWORKS; CIRCUIT ARRANGEMENTS OR SYSTEMS FOR SUPPLYING OR DISTRIBUTING ELECTRIC POWER; SYSTEMS FOR STORING ELECTRIC ENERGY
- H02J7/00—Circuit arrangements for charging or discharging batteries or for supplying loads from batteries
- H02J7/865—Battery or charger load switching, e.g. concurrent charging and load supply
-
- H—ELECTRICITY
- H02—GENERATION; CONVERSION OR DISTRIBUTION OF ELECTRIC POWER
- H02J—ELECTRIC POWER NETWORKS; CIRCUIT ARRANGEMENTS OR SYSTEMS FOR SUPPLYING OR DISTRIBUTING ELECTRIC POWER; SYSTEMS FOR STORING ELECTRIC ENERGY
- H02J2103/00—Details of circuit arrangements for mains or AC distribution networks
- H02J2103/30—Simulating, planning, modelling, reliability check or computer assisted design [CAD] of electric power networks
-
- H—ELECTRICITY
- H02—GENERATION; CONVERSION OR DISTRIBUTION OF ELECTRIC POWER
- H02J—ELECTRIC POWER NETWORKS; CIRCUIT ARRANGEMENTS OR SYSTEMS FOR SUPPLYING OR DISTRIBUTING ELECTRIC POWER; SYSTEMS FOR STORING ELECTRIC ENERGY
- H02J3/00—Circuit arrangements for AC mains or AC distribution networks
- H02J3/28—Arrangements for balancing of the load in networks by storage of energy
-
- Y—GENERAL TAGGING OF NEW TECHNOLOGICAL DEVELOPMENTS; GENERAL TAGGING OF CROSS-SECTIONAL TECHNOLOGIES SPANNING OVER SEVERAL SECTIONS OF THE IPC; TECHNICAL SUBJECTS COVERED BY FORMER USPC CROSS-REFERENCE ART COLLECTIONS [XRACs] AND DIGESTS
- Y02—TECHNOLOGIES OR APPLICATIONS FOR MITIGATION OR ADAPTATION AGAINST CLIMATE CHANGE
- Y02E—REDUCTION OF GREENHOUSE GAS [GHG] EMISSIONS, RELATED TO ENERGY GENERATION, TRANSMISSION OR DISTRIBUTION
- Y02E60/00—Enabling technologies; Technologies with a potential or indirect contribution to GHG emissions mitigation
-
- Y—GENERAL TAGGING OF NEW TECHNOLOGICAL DEVELOPMENTS; GENERAL TAGGING OF CROSS-SECTIONAL TECHNOLOGIES SPANNING OVER SEVERAL SECTIONS OF THE IPC; TECHNICAL SUBJECTS COVERED BY FORMER USPC CROSS-REFERENCE ART COLLECTIONS [XRACs] AND DIGESTS
- Y04—INFORMATION OR COMMUNICATION TECHNOLOGIES HAVING AN IMPACT ON OTHER TECHNOLOGY AREAS
- Y04S—SYSTEMS INTEGRATING TECHNOLOGIES RELATED TO POWER NETWORK OPERATION, COMMUNICATION OR INFORMATION TECHNOLOGIES FOR IMPROVING THE ELECTRICAL POWER GENERATION, TRANSMISSION, DISTRIBUTION, MANAGEMENT OR USAGE, i.e. SMART GRIDS
- Y04S40/00—Systems for electrical power generation, transmission, distribution or end-user application management characterised by the use of communication or information technologies, or communication or information technology specific aspects supporting them
- Y04S40/20—Information technology specific aspects, e.g. CAD, simulation, modelling, system security
Definitions
- the present disclosure relates generally to frequency response systems configured to add or remove electricity from an energy grid, and more particularly to a frequency response controller that determines optimal power setpoints for a battery power inverter in a frequency response system.
- Stationary battery storage has several purposes when integrated with campus electrical distribution. For example, battery storage can be used to participate in a local frequency response program. Battery storage can be used to reduce the energy used during times when electricity is expensive and to reduce the electrical demand of a building to reduce the demand charge incurred.
- One implementation of the present disclosure is a frequency response control system including a battery, a power inverter, and a frequency response controller.
- the battery is configured to store and discharge electric power.
- the power inverter is configured to control an amount of the electric power stored or discharged from the battery at each of a plurality of time steps during a frequency response period.
- the frequency response controller includes a high level controller configured to determine values of clipping parameters and a low level controller configured to use the values of the clipping parameters to modify battery power setpoints.
- the power inverter is configured to use the modified battery power setpoints to control the amount of the electric power stored or discharged from the battery.
- the high level controller is configured to determine the values of the clipping parameters by generating an objective function that accounts for both frequency response revenue and a cost of battery degradation as a function of the battery power setpoints modified by the clipping parameters and optimizing the objective function to generate the values of the clipping parameters.
- the clipping parameters include at least one of a battery charging power parameter that defines a maximum allowable rate at which the electric power can be stored in the battery or a battery discharging power parameter that defines a maximum allowable rate at which the electric power can be discharged from the battery.
- using the values of the clipping parameters to modify the battery power setpoints includes comparing a battery power setpoint to the battery charging power parameter and the battery discharging power parameter, setting the battery power setpoint equal to the battery charging power parameter in response to a determination that the battery power setpoint would cause the battery to charge at a rate that violates the battery charging power parameter, and setting the battery power setpoint equal to the battery discharging power parameter in response to a determination that the battery power setpoint would cause the battery to discharge at a rate that violates the battery discharging power parameter.
- the clipping parameters include at least one of a change in charging power parameter that defines a maximum change in the amount of electric power stored in the battery between consecutive time steps or a change in discharging power parameter that defines a maximum change in the amount of electric power discharged from the battery between consecutive time steps.
- using the values of the clipping parameters to modify the battery power setpoints includes calculating a difference between a first battery power setpoint for a first time step and a second battery power setpoint for a second time step consecutive with the first time step, comparing the difference to the change in charging power parameter, and setting the second battery power setpoint equal to the first battery power setpoint plus or minus the change in charging power parameter in response to a determination that the difference exceeds the change in charging power parameter.
- using the values of the clipping parameters to modify the battery power setpoints includes calculating a difference between a first battery power setpoint for a first time step and a second battery power setpoint for a second time step consecutive with the first time step, comparing the difference to the change in discharging power parameter, and setting the second battery power setpoint equal to the first battery power setpoint plus or minus the change in discharging power parameter in response to a determination that the difference exceeds the change in discharging power parameter.
- the frequency response controller is configured to receive a frequency regulation signal from an incentive provider and transform the frequency regulation signal into a power signal comprising a time series of the battery power setpoints.
- the frequency response controller is configured to adjust the modified battery power setpoints to reduce a delay between a first time at which the frequency regulation signal or the power signal has a value of zero and a second time at which the modified battery power setpoints have a value of zero.
- adjusting the modified battery power setpoints includes predicting a number of time steps between a current time step and a future time step at which the frequency regulation signal or the power signal has a value of zero, setting a zero cross bound based on the predicted number of time steps and a maximum allowable change in the modified battery power setpoints between consecutive time steps, and causing the modified battery power setpoints to begin approaching zero in response to a determination that a modified battery power setpoint for the current time step is outside the zero cross bound.
- Another implementation of the present disclosure is a method for controlling an amount of electric power stored or discharged from a battery in a frequency response control system.
- the method includes operating a high level controller to determine values of clipping parameters, providing the values of the clipping parameters from the high level controller to a low level controller, operating the low level controller to modify battery power setpoints using the clipping parameters , and using the modified battery power setpoints to control the amount of the electric power stored or discharged from the battery.
- operating the high level controller to determine the values of the clipping parameters includes generating an objective function that accounts for both frequency response revenue and a cost of battery degradation as a function of the battery power setpoints modified by the clipping parameters and optimizing the objective function to generate the values of the clipping parameters.
- the clipping parameters include at least one of a battery charging power parameter that defines a maximum allowable rate at which the electric power can be stored in the battery or a battery discharging power parameter that defines a maximum allowable rate at which the electric power can be discharged from the battery.
- using the values of the clipping parameters to modify the battery power setpoints includes comparing a battery power setpoint to the battery charging power parameter and the battery discharging power parameter, setting the battery power setpoint equal to the battery charging power parameter in response to a determination that the battery power setpoint would cause the battery to charge at a rate that violates the battery charging power parameter, and setting the battery power setpoint equal to the battery discharging power parameter in response to a determination that the battery power setpoint would cause the battery to discharge at a rate that violates the battery discharging power parameter.
- the clipping parameters include at least one of a change in charging power parameter that defines a maximum change in the amount of electric power stored in the battery between consecutive time steps or a change in discharging power parameter that defines a maximum change in the amount of electric power discharged from the battery between consecutive time steps.
- using the values of the clipping parameters to modify the battery power setpoints includes calculating a difference between a first battery power setpoint for a first time step and a second battery power setpoint for a second time step consecutive with the first time step, comparing the difference to the change in charging power parameter, and setting the second battery power setpoint equal to the first battery power setpoint plus or minus the change in charging power parameter in response to a determination that the difference exceeds the change in charging power parameter.
- using the values of the clipping parameters to modify the battery power setpoints includes calculating a difference between a first battery power setpoint for a first time step and a second battery power setpoint for a second time step consecutive with the first time step, comparing the difference to the change in discharging power parameter, and setting the second battery power setpoint equal to the first battery power setpoint plus or minus the change in discharging power parameter in response to a determination that the difference exceeds the change in discharging power parameter.
- the method includes receiving a frequency regulation signal from an incentive provider and transforming the frequency regulation signal into a power signal comprising a time series of the battery power setpoints.
- the method includes adjusting the modified battery power setpoints to reduce a delay between a first time at which the frequency regulation signal or the power signal has a value of zero and a second time at which the modified battery power setpoints have a value of zero.
- adjusting the modified battery power setpoints includes predicting a number of time steps between a current time step and a future time step at which the frequency regulation signal or the power signal has a value of zero, setting a zero cross bound based on the predicted number of time steps and a maximum allowable change in the modified battery power setpoints between consecutive time steps, and causing the modified battery power setpoints to begin approaching zero in response to a determination that a modified battery power setpoint for the current time step is outside the zero cross bound.
- the system includes building equipment that operate to affect a variable state or condition within one or more buildings, a battery configured to store and discharge electric power for use in powering at least one of the building equipment or the one or more buildings, a power inverter configured to control an amount of the electric power stored or discharged from the battery at each of a plurality of time steps during a frequency response period, and a frequency response controller.
- the frequency response controller includes a high level controller configured to determine values of clipping parameters and a low level controller configured to use the values of the clipping parameters to modify battery power setpoints.
- the power inverter is configured to use the modified battery power setpoints to control the amount of the electric power stored or discharged from the battery.
- the high level controller is configured to determine the values of the clipping parameters by generating an objective function that accounts for both frequency response revenue and a cost of battery degradation as a function of the battery power setpoints modified by the clipping parameters and optimizing the objective function to generate the values of the clipping parameters.
- the clipping parameters include at least one of a battery charging power parameter that defines a maximum allowable rate at which the electric power can be stored in the battery or a battery discharging power parameter that defines a maximum allowable rate at which the electric power can be discharged from the battery.
- using the values of the clipping parameters to modify the battery power setpoints includes comparing a battery power setpoint to the battery charging power parameter and the battery discharging power parameter, setting the battery power setpoint equal to the battery charging power parameter in response to a determination that the battery power setpoint would cause the battery to charge at a rate that violates the battery charging power parameter, and setting the battery power setpoint equal to the battery discharging power parameter in response to a determination that the battery power setpoint would cause the battery to discharge at a rate that violates the battery discharging power parameter.
- the clipping parameters include at least one of a change in charging power parameter that defines a maximum change in the amount of electric power stored in the battery between consecutive time steps or a change in discharging power parameter that defines a maximum change in the amount of electric power discharged from the battery between consecutive time steps.
- using the values of the clipping parameters to modify the battery power setpoints includes calculating a difference between a first battery power setpoint for a first time step and a second battery power setpoint for a second time step consecutive with the first time step, comparing the difference to the change in charging power parameter, and setting the second battery power setpoint equal to the first battery power setpoint plus or minus the change in charging power parameter in response to a determination that the difference exceeds the change in charging power parameter.
- using the values of the clipping parameters to modify the battery power setpoints includes calculating a difference between a first battery power setpoint for a first time step and a second battery power setpoint for a second time step consecutive with the first time step, comparing the difference to the change in discharging power parameter, and setting the second battery power setpoint equal to the first battery power setpoint plus or minus the change in discharging power parameter in response to a determination that the difference exceeds the change in discharging power parameter.
- the frequency response controller is configured to receive a frequency regulation signal from an incentive provider and transform the frequency regulation signal into a power signal comprising a time series of the battery power setpoints.
- the frequency response controller is configured to adjust the modified battery power setpoints to reduce a delay between a first time at which the frequency regulation signal or the power signal has a value of zero and a second time at which the modified battery power setpoints have a value of zero.
- adjusting the modified battery power setpoints includes predicting a number of time steps between a current time step and a future time step at which the frequency regulation signal or the power signal has a value of zero, setting a zero cross bound based on the predicted number of time steps and a maximum allowable change in the modified battery power setpoints between consecutive time steps, and causing the modified battery power setpoints to begin approaching zero in response to a determination that a modified battery power setpoint for the current time step is outside the zero cross bound.
- a frequency response optimization system 100 is shown, according to an exemplary embodiment.
- System 100 is shown to include a campus 102 and an energy grid 104.
- Campus 102 may include one or more buildings 116 that receive power from energy grid 104.
- Buildings 116 may include equipment or devices that consume electricity during operation.
- buildings 116 may include HVAC equipment, lighting equipment, security equipment, communications equipment, vending machines, computers, electronics, elevators, or other types of building equipment.
- buildings 116 are served by a building management system (BMS).
- BMS building management system
- a BMS is, in general, a system of devices configured to control, monitor, and manage equipment in or around a building or building area.
- a BMS can include, for example, a HVAC system, a security system, a lighting system, a fire alerting system, and/or any other system that is capable of managing building functions or devices.
- An exemplary building management system which may be used to monitor and control buildings 116 is described in U.S. Patent Application No. 14/717,593 , titled "Building Management System for Forecasting Time Series Values of Building Variables" and filed May 20, 2015, the entire disclosure of which is incorporated by reference herein.
- campus 102 includes a central plant 118.
- Central plant 118 may include one or more subplants that consume resources from utilities (e.g., water, natural gas, electricity, etc.) to satisfy the loads of buildings 116.
- utilities e.g., water, natural gas, electricity, etc.
- central plant 118 may include a heater subplant, a heat recovery chiller subplant, a chiller subplant, a cooling tower subplant, a hot thermal energy storage (TES) subplant, and a cold thermal energy storage (TES) subplant, a steam subplant, and/or any other type of subplant configured to serve buildings 116.
- TES hot thermal energy storage
- TES cold thermal energy storage
- the subplants may be configured to convert input resources (e.g., electricity, water, natural gas, etc.) into output resources (e.g., cold water, hot water, chilled air, heated air, etc.) that are provided to buildings 116.
- input resources e.g., electricity, water, natural gas, etc.
- output resources e.g., cold water, hot water, chilled air, heated air, etc.
- An exemplary central plant which may be used to satisfy the loads of buildings 116 is described U.S. Patent Application No. 14/634,609 , titled "High Level Central Plant Optimization" and filed February 27, 2015, the entire disclosure of which is incorporated by reference herein.
- campus 102 includes energy generation 120.
- Energy generation 120 may be configured to generate energy that can be used by buildings 116, used by central plant 118, and/or provided to energy grid 104.
- energy generation 120 generates electricity.
- energy generation 120 may include an electric power plant, a photovoltaic energy field, or other types of systems or devices that generate electricity.
- the electricity generated by energy generation 120 can be used internally by campus 102 (e.g., by buildings 116 and/or central plant 118) to decrease the amount of electric power that campus 102 receives from outside sources such as energy grid 104 or battery 108.
- the power output of campus 102 is shown in FIG. 1 as P campus ⁇ P campus may be positive if campus 102 is outputting electric power or negative if campus 102 is receiving electric power.
- system 100 is shown to include a power inverter 106 and a battery 108.
- Power inverter 106 may be configured to convert electric power between direct current (DC) and alternating current (AC).
- battery 108 may be configured to store and output DC power
- energy grid 104 and campus 102 may be configured to consume and generate AC power.
- Power inverter 106 may be used to convert DC power from battery 108 into a sinusoidal AC output synchronized to the grid frequency of energy grid 104.
- Power inverter 106 may also be used to convert AC power from campus 102 or energy grid 104 into DC power that can be stored in battery 108.
- the power output of battery 108 is shown as P bat .
- P bat may be positive if battery 108 is providing power to power inverter 106 or negative if battery 108 is receiving power from power inverter 106.
- power inverter 106 receives a DC power output from battery 108 and converts the DC power output to an AC power output that can be fed into energy grid 104.
- Power inverter 106 may synchronize the frequency of the AC power output with that of energy grid 104 (e.g., 50 Hz or 60 Hz) using a local oscillator and may limit the voltage of the AC power output to no higher than the grid voltage.
- power inverter 106 is a resonant inverter that includes or uses LC circuits to remove the harmonics from a simple square wave in order to achieve a sine wave matching the frequency of energy grid 104.
- power inverter 106 may operate using high-frequency transformers, low-frequency transformers, or without transformers.
- Low-frequency transformers may convert the DC output from battery 108 directly to the AC output provided to energy grid 104.
- High-frequency transformers may employ a multi-step process that involves converting the DC output to high-frequency AC, then back to DC, and then finally to the AC output provided to energy grid 104.
- System 100 is shown to include a point of interconnection (POI) 110.
- POI 110 is the point at which campus 102, energy grid 104, and power inverter 106 are electrically connected.
- the power supplied to POI 110 from power inverter 106 is shown as P sup .
- P sup may be defined as P bat + P loss , where P bat is the battery power and P l oss is the power loss in the battery system (e.g., losses in power inverter 106 and/or battery 108).
- P sup may be positive is power inverter 106 is providing power to POI 110 or negative if power inverter 106 is receiving power from POI 110.
- P campus and P sup combine at POI 110 to form P POI .
- P POI may be defined as the power provided to energy grid 104 from POI 110.
- P POI may be positive if POI 110 is providing power to energy grid 104 or negative if POI 110 is receiving power from energy grid
- system 100 is shown to include a frequency response controller 112.
- Controller 112 may be configured to generate and provide power setpoints to power inverter 106.
- Power inverter 106 may use the power setpoints to control the amount of power P sup provided to POI 110 or drawn from POI 110.
- power inverter 106 may be configured to draw power from POI 110 and store the power in battery 108 in response to receiving a negative power setpoint from controller 112.
- power inverter 106 may be configured to draw power from battery 108 and provide the power to POI 110 in response to receiving a positive power setpoint from controller 112.
- the magnitude of the power setpoint may define the amount of power P sup provided to or from power inverter 106.
- Controller 112 may be configured to generate and provide power setpoints that optimize the value of operating system 100 over a time horizon.
- frequency response controller 112 uses power inverter 106 and battery 108 to perform frequency regulation for energy grid 104.
- Frequency regulation is the process of maintaining the stability of the grid frequency (e.g., 60 Hz in the United States).
- the grid frequency may remain stable and balanced as long as the total electric supply and demand of energy grid 104 are balanced. Any deviation from that balance may result in a deviation of the grid frequency from its desirable value. For example, an increase in demand may cause the grid frequency to decrease, whereas an increase in supply may cause the grid frequency to increase.
- Frequency response controller 112 may be configured to offset a fluctuation in the grid frequency by causing power inverter 106 to supply energy from battery 108 to energy grid 104 (e.g., to offset a decrease in grid frequency) or store energy from energy grid 104 in battery 108 (e.g., to offset an increase in grid frequency).
- frequency response controller 112 uses power inverter 106 and battery 108 to perform load shifting for campus 102.
- controller 112 may cause power inverter 106 to store energy in battery 108 when energy prices are low and retrieve energy from battery 108 when energy prices are high in order to reduce the cost of electricity required to power campus 102.
- Load shifting may also allow system 100 reduce the demand charge incurred.
- Demand charge is an additional charge imposed by some utility providers based on the maximum power consumption during an applicable demand charge period. For example, a demand charge rate may be specified in terms of dollars per unit of power (e.g., $/kW) and may be multiplied by the peak power usage (e.g., kW) during a demand charge period to calculate the demand charge.
- Load shifting may allow system 100 to smooth momentary spikes in the electric demand of campus 102 by drawing energy from battery 108 in order to reduce peak power draw from energy grid 104, thereby decreasing the demand charge incurred.
- system 100 is shown to include an incentive provider 114.
- Incentive provider 114 may be a utility (e.g., an electric utility), a regional transmission organization (RTO), an independent system operator (ISO), or any other entity that provides incentives for performing frequency regulation.
- incentive provider 114 may provide system 100 with monetary incentives for participating in a frequency response program.
- system 100 may maintain a reserve capacity of stored energy (e.g., in battery 108) that can be provided to energy grid 104.
- System 100 may also maintain the capacity to draw energy from energy grid 104 and store the energy in battery 108. Reserving both of these capacities may be accomplished by managing the state-of-charge of battery 108.
- Frequency response controller 112 may provide incentive provider 114 with a price bid and a capability bid.
- the price bid may include a price per unit power (e.g., $/MW) for reserving or storing power that allows system 100 to participate in a frequency response program offered by incentive provider 114.
- the price per unit power bid by frequency response controller 112 is referred to herein as the "capability price.”
- the price bid may also include a price for actual performance, referred to herein as the "performance price.”
- the capability bid may define an amount of power (e.g., MW) that system 100 will reserve or store in battery 108 to perform frequency response, referred to herein as the "capability bid.”
- Incentive provider 114 may provide frequency response controller 112 with a capability clearing price CP cap , a performance clearing price CP perf , and a regulation award Reg award , which correspond to the capability price, the performance price, and the capability bid, respectively.
- CP cap , CP perf , and Reg award are the same as the corresponding bids placed by controller 112.
- CP cap , CP perf , and Reg award may not be the same as the bids placed by controller 112.
- CP cap , CP perf , and Reg award may be generated by incentive provider 114 based on bids received from multiple participants in the frequency response program.
- Controller 112 may use CP cap , CP perf , and Reg award to perform frequency regulation, described in greater detail below.
- Frequency response controller 112 is shown receiving a regulation signal from incentive provider 114.
- the regulation signal may specify a portion of the regulation award Reg award that frequency response controller 112 is to add or remove from energy grid 104.
- the regulation signal is a normalized signal (e.g., between -1 and 1) specifying a proportion of Reg award . Positive values of the regulation signal may indicate an amount of power to add to energy grid 104, whereas negative values of the regulation signal may indicate an amount of power to remove from energy grid 104.
- Frequency response controller 112 may respond to the regulation signal by generating an optimal power setpoint for power inverter 106.
- the optimal power setpoint may take into account both the potential revenue from participating in the frequency response program and the costs of participation. Costs of participation may include, for example, a monetized cost of battery degradation as well as the energy and demand charges that will be incurred.
- the optimization may be performed using sequential quadratic programming, dynamic programming, or any other optimization technique.
- controller 112 uses a battery life model to quantify and monetize battery degradation as a function of the power setpoints provided to power inverter 106.
- the battery life model allows controller 112 to perform an optimization that weighs the revenue generation potential of participating in the frequency response program against the cost of battery degradation and other costs of participation (e.g., less battery power available for campus 102, increased electricity costs, etc.).
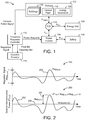
- An exemplary regulation signal and power response are described in greater detail with reference to FIG. 2 .
- Graph 200 illustrates a regulation signal Reg signal 202 as a function of time.
- Reg signal 202 is shown as a normalized signal ranging from -1 to 1 (i.e., -1 ⁇ Reg signal ⁇ 1).
- Reg signal 202 may be generated by incentive provider 114 and provided to frequency response controller 112.
- Reg signal 202 may define a proportion of the regulation award Reg award 254 that controller 112 is to add or remove from energy grid 104, relative to a baseline value referred to as the midpoint b 256.
- Graph 250 illustrates the desired interconnection power P POI * 252 as a function of time.
- P POI * 252 may be calculated by frequency response controller 112 based on Reg signal 202, Reg award 254, and a midpoint b 256.
- Midpoint b may be defined (e.g., set or optimized) by controller 112 and may represent the midpoint of regulation around which the load is modified in response to Reg signal 202. Optimal adjustment of midpoint b may allow controller 112 to actively participate in the frequency response market while also taking into account the energy and demand charge that will be incurred.
- controller 112 may perform several tasks. Controller 112 may generate a price bid (e.g., $/MW) that includes the capability price and the performance price. In some embodiments, controller 112 sends the price bid to incentive provider 114 at approximately 15:30 each day and the price bid remains in effect for the entirety of the next day. Prior to beginning a frequency response period, controller 112 may generate the capability bid (e.g., MW) and send the capability bid to incentive provider 114. In some embodiments, controller 112 generates and sends the capability bid to incentive provider 114 approximately 1.5 hours before a frequency response period begins. In an exemplary embodiment, each frequency response period has a duration of one hour; however, it is contemplated that frequency response periods may have any duration.
- a price bid e.g., $/MW
- controller 112 sends the price bid to incentive provider 114 at approximately 15:30 each day and the price bid remains in effect for the entirety of the next day.
- controller 112 Prior to beginning a frequency response period, controller 112 may generate the capability bid
- controller 112 may generate the midpoint b around which controller 112 plans to perform frequency regulation.
- controller 112 generates a midpoint b that will maintain battery 108 at a constant state-of-charge (SOC) (i.e. a midpoint that will result in battery 108 having the same SOC at the beginning and end of the frequency response period).
- SOC state-of-charge
- controller 112 generates midpoint b using an optimization procedure that allows the SOC of battery 108 to have different values at the beginning and end of the frequency response period.
- controller 112 may use the SOC of battery 108 as a constrained variable that depends on midpoint b in order to optimize a value function that takes into account frequency response revenue, energy costs, and the cost of battery degradation. Exemplary processes for calculating and/or optimizing midpoint b under both the constant SOC scenario and the variable SOC scenario are described in greater detail with reference to FIGS. 3-4A .
- Frequency response controller 112 may be configured to perform an optimization process to generate values for the bid price, the capability bid, and the midpoint b. In some embodiments, frequency response controller 112 generates values for the bids and the midpoint b periodically using a predictive optimization scheme (e.g., once every half hour, once per frequency response period, etc.). Controller 112 may also calculate and update power setpoints for power inverter 106 periodically during each frequency response period (e.g., once every two seconds).
- a predictive optimization scheme e.g., once every half hour, once per frequency response period, etc.
- the interval at which controller 112 generates power setpoints for power inverter 106 is significantly shorter than the interval at which controller 112 generates the bids and the midpoint b .
- controller 112 may generate values for the bids and the midpoint b every half hour, whereas controller 112 may generate a power setpoint for power inverter 106 every two seconds. The difference in these time scales allows controller 112 to use a cascaded optimization process to generate optimal bids, midpoints b , and power setpoints.
- a high level controller 312 determines optimal values for the bid price, the capability bid, and the midpoint b by performing a high level optimization.
- High level controller 312 may select midpoint b to maintain a constant state-of-charge in battery 108 (i.e., the same state-of-charge at the beginning and end of each frequency response period) or to vary the state-of-charge in order to optimize the overall value of operating system 100 (e.g., frequency response revenue minus energy costs and battery degradation costs).
- High level controller 312 may also determine filter parameters for a signal filter (e.g., a low pass filter) used by a low level controller 314.
- a signal filter e.g., a low pass filter
- Low level controller 314 uses the midpoint b and the filter parameters from high level controller 312 to perform a low level optimization in order to generate the power setpoints for power inverter 106.
- low level controller 314 may determine how closely to track the desired power P POI * at the point of interconnection 110.
- the low level optimization performed by low level controller 314 may consider not only frequency response revenue but also the costs of the power setpoints in terms of energy costs and battery degradation.
- low level controller 314 may determine that it is deleterious to battery 108 to follow the regulation exactly and may sacrifice a portion of the frequency response revenue in order to preserve the life of battery 108. The cascaded optimization process is described in greater detail below.
- frequency response controller 112 is shown to include a communications interface 302 and a processing circuit 304.
- Communications interface 302 may include wired or wireless interfaces (e.g., jacks, antennas, transmitters, receivers, transceivers, wire terminals, etc.) for conducting data communications with various systems, devices, or networks.
- communications interface 302 may include an Ethernet card and port for sending and receiving data via an Ethernet-based communications network and/or a WiFi transceiver for communicating via a wireless communications network.
- Communications interface 302 may be configured to communicate via local area networks or wide area networks (e.g., the Internet, a building WAN, etc.) and may use a variety of communications protocols (e.g., BACnet, IP, LON, etc.).
- Communications interface 302 may be a network interface configured to facilitate electronic data communications between frequency response controller 112 and various external systems or devices (e.g., campus 102, energy grid 104, power inverter 106, incentive provider 114, utilities 320, weather service 322, etc.).
- frequency response controller 112 may receive inputs from incentive provider 114 indicating an incentive event history (e.g., past clearing prices, mileage ratios, participation requirements, etc.) and a regulation signal.
- Controller 112 may receive a campus power signal from campus 102, utility rates from utilities 320, and weather forecasts from weather service 322 via communications interface 302.
- Controller 112 may provide a price bid and a capability bid to incentive provider 114 and may provide power setpoints to power inverter 106 via communications interface 302.
- processing circuit 304 is shown to include a processor 306 and memory 308.
- Processor 306 may be a general purpose or specific purpose processor, an application specific integrated circuit (ASIC), one or more field programmable gate arrays (FPGAs), a group of processing components, or other suitable processing components.
- ASIC application specific integrated circuit
- FPGAs field programmable gate arrays
- Processor 306 may be configured to execute computer code or instructions stored in memory 308 or received from other computer readable media (e.g., CDROM, network storage, a remote server, etc.).
- Memory 308 may include one or more devices (e.g., memory units, memory devices, storage devices, etc.) for storing data and/or computer code for completing and/or facilitating the various processes described in the present disclosure.
- Memory 308 may include random access memory (RAM), read-only memory (ROM), hard drive storage, temporary storage, non-volatile memory, flash memory, optical memory, or any other suitable memory for storing software objects and/or computer instructions.
- Memory 308 may include database components, object code components, script components, or any other type of information structure for supporting the various activities and information structures described in the present disclosure.
- Memory 308 may be communicably connected to processor 306 via processing circuit 304 and may include computer code for executing (e.g., by processor 306) one or more processes described herein.
- frequency response controller 112 is shown to include a load/rate predictor 310.
- Load/rate predictor 310 is shown receiving weather forecasts from a weather service 322. In some embodiments, load/rate predictor 310 predicts P ⁇ campus as a function of the weather forecasts.
- load/rate predictor 310 uses feedback from campus 102 to predict P ⁇ campus .Feedback from campus 102 may include various types of sensory inputs (e.g., temperature, flow, humidity, enthalpy, etc.) or other data relating to buildings 116, central plant 118, and/or energy generation 120 (e.g., inputs from a HVAC system, a lighting control system, a security system, a water system, a PV energy system, etc.).
- Load/rate predictor 310 may predict one or more different types of loads for campus 102. For example, load/rate predictor 310 may predict a hot water load, a cold water load, and/or an electric load for each time step k within the optimization window.
- load/rate predictor 310 receives a measured electric load and/or previous measured load data from campus 102.
- load/rate predictor 310 is shown receiving a campus power signal from campus 102.
- the campus power signal may indicate the measured electric load of campus 102.
- Load/rate predictor 310 may predict one or more statistics of the campus power signal including, for example, a mean campus power ⁇ campus and a standard deviation of the campus power ⁇ campus .
- load/rate predictor 310 uses a deterministic plus stochastic model trained from historical load data to predict P ⁇ campus .
- Load/rate predictor 310 may use any of a variety of prediction methods to predict P ⁇ campus (e.g., linear regression for the deterministic portion and an AR model for the stochastic portion).
- load/rate predictor 310 makes load/rate predictions using the techniques described in U.S. Patent Application No. 14/717,593 , titled "Building Management System for Forecasting Time Series Values of Building Variables" and filed May 20, 2015.
- Load/rate predictor 310 is shown receiving utility rates from utilities 320.
- Utility rates may indicate a cost or price per unit of a resource (e.g., electricity, natural gas, water, etc.) provided by utilities 320 at each time step k in the optimization window.
- the utility rates are time-variable rates.
- the price of electricity may be higher at certain times of day or days of the week (e.g., during high demand periods) and lower at other times of day or days of the week (e.g., during low demand periods).
- the utility rates may define various time periods and a cost per unit of a resource during each time period.
- Utility rates may be actual rates received from utilities 320 or predicted utility rates estimated by load/rate predictor 310.
- the utility rates include demand charges for one or more resources provided by utilities 320.
- a demand charge may define a separate cost imposed by utilities 320 based on the maximum usage of a particular resource (e.g., maximum energy consumption) during a demand charge period.
- the utility rates may define various demand charge periods and one or more demand charges associated with each demand charge period. In some instances, demand charge periods may overlap partially or completely with each other and/or with the prediction window.
- frequency response controller 112 may be configured to account for demand charges in the high level optimization process performed by high level controller 312.
- Utilities 320 may be defined by time-variable (e.g., hourly) prices, a maximum service level (e.g., a maximum rate of consumption allowed by the physical infrastructure or by contract) and, in the case of electricity, a demand charge or a charge for the peak rate of consumption within a certain period.
- Load/rate predictor 310 may store the predicted campus power P ⁇ ampus and the utility rates in memory 308 and/or provide the predicted campus power P ⁇ campus and the utility rates to high level controller 312.
- frequency response controller 112 is shown to include an energy market predictor 316 and a signal statistics predictor 318.
- Energy market predictor 316 may be configured to predict energy market statistics relating to the frequency response program.
- energy market predictor 316 may predict the values of one or more variables that can be used to estimate frequency response revenue.
- PS is a performance score based on how closely the frequency response provided by controller 112 tracks the regulation signal.
- Energy market predictor 316 may be configured to predict the capability clearing price CP cap , the performance clearing price CP perf , the mileage ratio MR , and/or other energy market statistics that can be used to estimate frequency response revenue. Energy market predictor 316 may store the energy market statistics in memory 308 and/or provide the energy market statistics to high level controller 312.
- Signal statistics predictor 318 may be configured to predict one or more statistics of the regulation signal provided by incentive provider 114.
- signal statistics predictor 318 may be configured to predict the mean ⁇ FR , standard deviation ⁇ FR , and/or other statistics of the regulation signal.
- the regulation signal statistics may be based on previous values of the regulation signal (e.g., a historical mean, a historical standard deviation, etc.) or predicted values of the regulation signal (e.g., a predicted mean, a predicted standard deviation, etc.).
- signal statistics predictor 318 uses a deterministic plus stochastic model trained from historical regulation signal data to predict future values of the regulation signal. For example, signal statistics predictor 318 may use linear regression to predict a deterministic portion of the regulation signal and an AR model to predict a stochastic portion of the regulation signal. In some embodiments, signal statistics predictor 318 predicts the regulation signal using the techniques described in U.S. Patent Application No. 14/717,593 , titled "Building Management System for Forecasting Time Series Values of Building Variables" and filed May 20, 2015. Signal statistics predictor 318 may use the predicted values of the regulation signal to calculate the regulation signal statistics. Signal statistics predictor 318 may store the regulation signal statistics in memory 308 and/or provide the regulation signal statistics to high level controller 312.
- frequency response controller 112 is shown to include a high level controller 312.
- High level controller 312 may be configured to generate values for the midpoint b and the capability bid Reg award .
- high level controller 312 determines a midpoint b that will cause battery 108 to have the same state-of-charge (SOC) at the beginning and end of each frequency response period.
- high level controller 312 performs an optimization process to generate midpoint b and Reg award .
- high level controller 312 may generate midpoint b using an optimization procedure that allows the SOC of battery 108 to vary and/or have different values at the beginning and end of the frequency response period.
- High level controller 312 may use the SOC of battery 108 as a constrained variable that depends on midpoint b in order to optimize a value function that takes into account frequency response revenue, energy costs, and the cost of battery degradation. Both of these embodiments are described in greater detail with reference to FIG. 4A .
- High level controller 312 may use the estimated values of the campus power signal received from campus 102 to predict the value of ⁇ P campus dt over the frequency response period. Similarly, high level controller 312 may use the estimated values of the regulation signal from incentive provider 114 to predict the value of ⁇ Reg signal dt over the frequency response period. High level controller 312 may estimate the value of f P loss dt using a Thevinin equivalent circuit model of battery 108 (described in greater detail with reference to FIG. 4A ). This allows high level controller 312 to estimate the integral ⁇ P loss dt as a function of other variables such as Reg award , Reg signal , P campus , and midpoint b.
- E ⁇ Reg signal ⁇ can be approximated by the estimated mean of the regulation signal ⁇ FR and the term E ⁇ P campus ⁇ can be approximated by the estimated mean of the campus power signal ⁇ campus .
- High level controller 312 may solve the equation for midpoint b to determine the midpoint b that maintains battery 108 at a constant state-of-charge.
- the SOC of battery 108 may be a normalized variable (i.e., 0 ⁇ SOC ⁇ 1) such that the term SOC ⁇ C des represents the amount of energy stored in battery 108 for a given state-of-charge.
- the SOC is shown as a negative value because drawing energy from battery 108 (i.e., a positive P bat ) decreases the SOC of battery 108.
- High level controller 312 may perform an optimization to find optimal midpoints b for each frequency response period within an optimization window (e.g., each hour for the next day) given the electrical costs over the optimization window.
- Optimal midpoints b may be the midpoints that maximize an objective function that includes both frequency response revenue and costs of electricity and battery degradation.
- Rev ( Reg award,k ) is the frequency response revenue at time step k
- c k b k is the cost of electricity purchased at time step k
- the min( ) term is the demand charge based on the maximum rate of electricity consumption during the applicable demand charge period
- ⁇ bat,k is the monetized cost battery degradation at time step k .
- the electricity cost is expressed as a positive value because drawing power from energy grid 104 is represented as a negative power and therefore will result in negative value (i.e., a cost) in the objective function.
- the demand charge is expressed as a minimum for the same reason (i.e., the most negative power value represents maximum power draw from energy grid 104).
- High level controller 312 may estimate the frequency response revenue Rev(Reg award , k ) as a function of the midpoints b.
- selecting Reg award as a function of midpoint b allows high level controller 312 to predict the frequency response revenue that will result from a given midpoint b .
- High level controller 312 may estimate the cost of battery degradation ⁇ bat as a function of the midpoints b .
- high level controller 312 may use a battery life model to predict a loss in battery capacity that will result from a set of midpoints b , power outputs, and/or other variables that can be manipulated by controller 112.
- the terms in the battery life model depend on the midpoints b and power setpoints selected by controller 112. This allows high level controller 312 to predict a loss in battery capacity that will result from a given set of control outputs. High level controller 312 may monetize the loss in battery capacity and include the monetized cost of battery degradation ⁇ bat in the objective function J .
- high level controller 312 generates a set of filter parameters for low level controller 314.
- the filter parameters may be used by low level controller 314 as part of a low-pass filter that removes high frequency components from the regulation signal.
- high level controller 312 generates a set of filter parameters that transform the regulation signal into an optimal frequency response signal Res FR .
- high level controller 312 may perform a second optimization process to determine an optimal frequency response Res FR based on the optimized values for Reg award and midpoint b.
- the performance score PS may be based on several factors that indicate how well the optimal frequency response Res FR tracks the regulation signal. Closely tracking the regulation signal may result in higher performance scores, thereby increasing the frequency response revenue. However, closely tracking the regulation signal may also increase the cost of battery degradation ⁇ bat .
- the optimized frequency response Res FR represents an optimal tradeoff between decreased frequency response revenue and increased battery life.
- High level controller 312 may use the optimized frequency response Res FR to generate a set of filter parameters for low level controller 314.
- frequency response controller 112 is shown to include a low level controller 314.
- Low level controller 314 is shown receiving the midpoints b and the filter parameters from high level controller 312.
- Low level controller 314 may also receive the campus power signal from campus 102 and the regulation signal from incentive provider 114.
- Low level controller 314 may use the regulation signal to predict future values of the regulation signal and may filter the predicted regulation signal using the filter parameters provided by high level controller 312.
- low level controller 314 performs an optimization to determine how closely to track P POI * .
- Low level controller 314 may use the optimal frequency response Res FR in place of the filtered frequency response Reg filter to calculate the desired interconnection power P POI * and power setpoints P SP as previously described.
- High level controller 312 is shown to include a constant state-of-charge (SOC) controller 402 and a variable SOC controller 408.
- Constant SOC controller 402 may be configured to generate a midpoint b that results in battery 108 having the same SOC at the beginning and the end of each frequency response period. In other words, constant SOC controller 402 may determine a midpoint b that maintains battery 108 at a predetermined SOC at the beginning of each frequency response period.
- Variable SOC controller 408 may generate midpoint b using an optimization procedure that allows the SOC of battery 108 to have different values at the beginning and end of the frequency response period. In other words, variable SOC controller 408 may determine a midpoint b that results in a net change in the SOC of battery 108 over the duration of the frequency response period.
- Constant SOC controller 402 may use the estimated values of the campus power signal received from campus 102 to predict the value of ⁇ P campus dt over the frequency response period. Similarly, constant SOC controller 402 may use the estimated values of the regulation signal from incentive provider 114 to predict the value of f Reg signal dt over the frequency response period.
- Constant SOC controller 402 is shown to include a battery power loss estimator 404.
- Battery power loss estimator 404 may estimate the value of ⁇ P loss dt using a Thevinin equivalent circuit model of battery 108.
- battery power loss estimator 404 may model battery 108 as a voltage source in series with a resistor. The voltage source has an open circuit voltage of V OC and the resistor has a resistance of R TH . An electric current I flows from the voltage source through the resistor.
- Constant SOC controller 402 is shown to include a midpoint calculator 406.
- Midpoint calculator 406 may solve the equation for midpoint b to determine the midpoint b that maintains battery 108 at a constant state-of-charge.
- Variable SOC controller 408 may determine optimal midpoints b by allowing the SOC of battery 108 to have different values at the beginning and end of a frequency response period.
- the SOC of battery 108 may be a normalized variable (i.e., 0 ⁇ SOC ⁇ 1) such that the term SOC ⁇ C des represents the amount of energy stored in battery 108 for a given state-of-charge.
- the SOC is shown as a negative value because drawing energy from battery 108 (i.e., a positive P bat ) decreases the SOC of battery 108.
- Variable SOC controller 408 is shown to include a battery power loss estimator 410 and a midpoint optimizer 412.
- Battery power loss estimator 410 may be the same or similar to battery power loss estimator 404.
- Midpoint optimizer 412 may be configured to establish a relationship between the midpoint b and the SOC of battery 108.
- the previous equation defines a relationship between midpoint b and the change in SOC of battery 108.
- Midpoint optimizer 412 may use this equation to determine the impact that different values of midpoint b have on the SOC in order to determine optimal midpoints b .
- This equation can also be used by midpoint optimizer 412 during optimization to translate constraints on the SOC in terms of midpoint b .
- the SOC of battery 108 may be constrained between zero and 1 (e.g., 0 ⁇ SOC ⁇ 1) since battery 108 cannot be charged in excess of its maximum capacity or depleted below zero.
- Midpoint optimizer 412 may use the relationship between ⁇ SOC and midpoint b to constrain the optimization of midpoint b to midpoint values that satisfy the capacity constraint.
- Midpoint optimizer 412 may perform an optimization to find optimal midpoints b for each frequency response period within the optimization window (e.g., each hour for the next day) given the electrical costs over the optimization window.
- Optimal midpoints b may be the midpoints that maximize an objective function that includes both frequency response revenue and costs of electricity and battery degradation.
- Rev ( Reg award , k ) is the frequency response revenue at time step k
- c k b k is the cost of electricity purchased at time step k
- the min( ) term is the demand charge based on the maximum rate of electricity consumption during the applicable demand charge period
- ⁇ bat,k is the monetized cost battery degradation at time step k .
- Midpoint optimizer 412 may use input from frequency response revenue estimator 416 (e.g., a revenue model) to determine a relationship between midpoint b and Rev ( Reg award,k ). Similarly, midpoint optimizer 412 may use input from battery degradation estimator 418 and/or revenue loss estimator 420 to determine a relationship between midpoint b and the monetized cost of battery degradation ⁇ bat,k .
- frequency response revenue estimator 416 e.g., a revenue model
- variable SOC controller 408 is shown to include an optimization constraints module 414.
- Optimization constraints module 414 may provide one or more constraints on the optimization performed by midpoint optimizer 412. The optimization constraints may be specified in terms of midpoint b or other variables that are related to midpoint b .
- SOC 0 is the SOC of battery 108 at the beginning of the optimization window
- ⁇ SOC i is the change in SOC during frequency response period i
- h is the total number of frequency response periods within the optimization window.
- optimization constraints module 414 implements an optimization constraint on midpoint b so that the power at POI 110 does not exceed the power rating of power inverter 106.
- a constraint is shown in the following equation: ⁇ P limit ⁇ b k + P campus , max p ⁇ P limit where P limit is the power rating of power inverter 106 and P campus , max p is the maximum value of P campus at confidence level p .
- This constraint could also be implemented by identifying the probability that the sum of b k and P campus,max exceeds the power inverter power rating (e.g., using a probability density function for P campus,max ) and limiting that probability to less than or equal to 1 - p .
- optimization constraints module 414 implements an optimization constraint to ensure (with a given probability) that the actual SOC of battery 108 remains between zero and one at each time step during the applicable frequency response period. This constraint is different from the first optimization constraint which placed bounds on the expected SOC of battery 108 at the end of each optimization period.
- the expected SOC of battery 108 can be determined deterministically, whereas the actual SOC of battery 108 is dependent on the campus power P campus and the actual value of the regulation signal Reg signal at each time step during the optimization period. In other words, for any value of Reg award > 0, there is a chance that battery 108 becomes fully depleted or fully charged while maintaining the desired power P POI * at POI 110.
- Optimization constraints module 414 may implement the constraint on the actual SOC of battery 108 by approximating the battery power P bat (a random process) as a wide-sense stationary, correlated normally distributed process.
- optimization constraints module 414 converts the battery power P bat into an uncorrelated normal process driven by the regulation signal Reg signal .
- x' k represents the regulation signal Reg signal .
- this allows optimization constraints module 414 to define the probability of ruin in terms of the regulation signal Reg signal .
- optimization constraints module 414 determines a probability p that the random walk driven by the sequence of -1 and 1 will take the value of 1.
- each frequency response period has a duration of one hour (i.e., 3600 seconds) and the interval between time steps is two seconds
- n 1800
- the equation for p defines p as a function of the mean and standard deviation of the regulation signal Reg signal , which may be estimated by signal statistics predictor 318.
- the equation for z defines z as a function of the SOC of battery 108 and the parameters of the regulation signal Reg signal .
- Optimization constraints module 414 may use one or more of the previous equations to place constraints on ⁇ SOC ⁇ C des and Reg award given the current SOC of battery 108. For example, optimization constraints module 414 may use the mean and standard deviation of the regulation signal Reg signal to calculate p . Optimization constraints module 414 may then use p in combination with the SOC of battery 108 to calculate z . Optimization constraints module 414 may use p and z as inputs to the equation for the probability of ruin P . This allows optimization constraints module 414 to define the probability or ruin P as a function of the SOC of battery 108 and the estimated statistics of the regulation signal Reg signal .
- Optimization constraints module 414 may impose constraints on the SOC of battery 108 to ensure that the probability of ruin P within N time steps does not exceed a threshold value. These constraints may be expressed as limitations on the variables ⁇ SOC ⁇ C des and/or Reg award , which are related to midpoint b as previously described.
- optimization constraints module 414 uses the equation for the probability of ruin P to define boundaries on the combination of variables p and z .
- optimization constraints module 414 constrains the probability of ruin P to less than the threshold value, which imposes limits on potential combinations of the variables p and z . Since the variables p and z are related to the SOC of battery 108 and the statistics of the regulation signal, the constraints may impose limitations on ⁇ SOC ⁇ C des and Reg award given the current SOC of battery 108. These constraints may also impose limitations on midpoint b since the variables ⁇ SOC ⁇ C des and Reg award are related to midpoint b. For example, optimization constraints module 414 may set constraints on the maximum bid Reg award given a desired change in the SOC for battery 108. In other embodiments, optimization constraints module 414 penalizes the objective function J given the bid Reg award and the change in SOC.
- variable SOC controller 408 is shown to include a frequency response (FR) revenue estimator 416.
- FR revenue estimator 416 may be configured to estimate the frequency response revenue that will result from a given midpoint b (e.g., a midpoint provided by midpoint optimizer 412).
- the estimated frequency response revenue may be used as the term Rev ( Reg award , k ) in the objective function J .
- Midpoint optimizer 412 may use the estimated frequency response revenue along with other terms in the objective function J to determine an optimal midpoint b .
- FR revenue estimator 416 uses a revenue model to predict frequency response revenue.
- the equation for frequency response revenue used by FR revenue estimator 416 does not include a performance score (or assumes a performance score of 1.0). This results in FR revenue estimator 416 estimating a maximum possible frequency response revenue that can be achieved for a given midpoint b (i.e., if the actual frequency response of controller 112 were to follow the regulation signal exactly).
- the actual frequency response may be adjusted by low level controller 314 in order to preserve the life of battery 108.
- the equation for frequency response revenue can be adjusted to include a performance score.
- the resulting value function J may then be optimized by low level controller 314 to determine an optimal frequency response output which considers both frequency response revenue and the costs of battery degradation, as described with reference to FIG. 5A .
- variable SOC controller 408 is shown to include a battery degradation estimator 418.
- Battery degradation estimator 418 may estimate the cost of battery degradation that will result from a given midpoint b (e.g., a midpoint provided by midpoint optimizer 412). The estimated battery degradation may be used as the term ⁇ bat in the objective function J .
- Midpoint optimizer 412 may use the estimated battery degradation along with other terms in the objective function J to determine an optimal midpoint b.
- battery degradation estimator 418 uses a battery life model to predict a loss in battery capacity that will result from a set of midpoints b , power outputs, and/or other variables that can be manipulated by controller 112.
- C loss,nom is the nominal loss in battery capacity that is expected to occur over time. Therefore, C loss,add represents the additional loss in battery capacity degradation in excess of the nominal
- Battery degradation estimator 418 may define the terms in the battery life model as functions of one or more variables that have known values (e.g., estimated or measured values) and/or variables that can be manipulated by high level controller 312. For example, battery degradation estimator 418 may define the terms in the battery life model as functions of the regulation signal statistics (e.g., the mean and standard deviation of Reg signal ), the campus power signal statistics (e.g., the mean and standard deviation of P campus ), Reg award , midpoint b, the SOC of battery 108, and/or other variables that have known or controlled values.
- the regulation signal statistics e.g., the mean and standard deviation of Reg signal
- the campus power signal statistics e.g., the mean and standard deviation of P campus
- Reg award e.g., the mean and standard deviation of P campus
- midpoint b e.g., the SOC of battery 108
- battery degradation estimator 418 measures the cell temperature T cell using a temperature sensor configured to measure the temperature of battery 108. In other embodiments, battery degradation estimator 418 estimates or predicts the cell temperature T cell based on a history of measured temperature values. For example, battery degradation estimator 418 may use a predictive model to estimate the cell temperature T cell as a function of the battery power P bat , the ambient temperature, and/or other variables that can be measured, estimated, or controlled by high level controller 312.
- Battery degradation estimator 418 may define the variable SOC in the battery life model as the SOC of battery 108 at the end of the frequency response period.
- the SOC of battery 108 may be measured or estimated based on the control decisions made by controller 112.
- battery degradation estimator 418 may use a predictive model to estimate or predict the SOC of battery 108 at the end of the frequency response period as a function of the battery power P bat , the midpoint b, and/or other variables that can be measured, estimated, or controlled by high level controller 312.
- P avg ⁇ bat 2 ⁇ exp ⁇ ⁇ bat 2 2 ⁇ bat 2 + erf ⁇ ⁇ bat 2 ⁇ bat 2
- ⁇ bat and ⁇ bat 2 are the mean and variance of the battery power P bat .
- the SOC of battery 108 can be viewed as a constant slope with a zero mean random walk added to it, as previously described.
- E max ⁇ min ⁇ R 0 + c ⁇ ⁇ SOC ⁇ exp ⁇ ⁇ R 0 ⁇ ⁇ SOC ⁇ bat ⁇ SOC ⁇ R 0 ⁇ SOC + c ⁇ R 0 ⁇ exp ⁇ ⁇ ⁇ SOC ⁇ R 0 ⁇ bat ⁇ SOC > R 0
- R 0 is the expected range with zero expected change in the state-of-charge.
- Battery degradation estimator 418 may use the previous equations to establish a relationship between the capacity loss C loss,add and the control outputs provided by controller 112.
- variable SOC controller 408 is shown to include a revenue loss estimator 420.
- Revenue loss estimator 420 may be configured to estimate an amount of potential revenue that will be lost as a result of the battery capacity loss C loss,add .
- Midpoint optimizer 412 may use the inputs from optimization constraints module 414, FR revenue estimator 416, battery degradation estimator 418, and revenue loss estimator 420 to define the terms in objective function J .
- Midpoint optimizer 412 may determine values for midpoint b that optimize objective function J .
- midpoint optimizer 412 may use sequential quadratic programming, dynamic programming, or any other optimization technique.
- high level controller 312 is shown to include a capability bid calculator 422.
- Capability bid calculator 422 may be configured to generate a capability bid Reg award based on the midpoint b generated by constant SOC controller 402 and/or variable SOC controller 408.
- Capability bid calculator 422 may provide the capability bid to incentive provider 114 and to frequency response optimizer 424 for use in generating an optimal frequency response.
- high level controller 312 is shown to include a frequency response optimizer 424 and a filter parameters optimizer 426.
- Filter parameters optimizer 426 may be configured to generate a set of filter parameters for low level controller 314. The filter parameters may be used by low level controller 314 as part of a low-pass filter that removes high frequency components from the regulation signal Reg signal .
- filter parameters optimizer 426 generates a set of filter parameters that transform the regulation signal Reg signal into an optimal frequency response signal Res FR .
- Frequency response optimizer 424 may perform a second optimization process to determine the optimal frequency response Res FR based on the values for Reg award and midpoint b. In the second optimization, the values for Reg award and midpoint b may be fixed at the values previously determined during the first optimization.
- the performance score PS may be based on several factors that indicate how well the optimal frequency response Res FR tracks the regulation signal Reg signal .
- the frequency response Res FR may affect both Rev ( Reg award ) and the monetized cost of battery degradation ⁇ bat . Closely tracking the regulation signal may result in higher performance scores, thereby increasing the frequency response revenue. However, closely tracking the regulation signal may also increase the cost of battery degradation ⁇ bat .
- the optimized frequency response Res FR represents an optimal tradeoff between decreased frequency response revenue and increased battery life (i.e., the frequency response that maximizes value J ).
- the performance score PS is a composite weighting of an accuracy score, a delay score, and a precision score.
- each term in the precision score is assigned an equal weighting (e.g., 1/3). In other embodiments, some terms may be weighted higher than others.
- the accuracy score PS acc may be the maximum correlation between the regulation signal Reg signal and the optimal frequency response Res FR .
- the delay score PS delay may be based on the time delay ⁇ between the regulation signal Reg signal and the optimal frequency response Res FR .
- the precision score PS prec may be based on a difference between the frequency response Res FR and the regulation signal Reg signal
- Frequency response optimizer 424 may use the estimated performance score and the estimated battery degradation to define the terms in objective function J . Frequency response optimizer 424 may determine values for frequency response Res FR that optimize objective function J . In various embodiments, frequency response optimizer 424 may use sequential quadratic programming, dynamic programming, or any other optimization technique.
- Filter parameters optimizer 426 may use the optimized frequency response Res FR to generate a set of filter parameters for low level controller 314.
- the filter parameters are used by low level controller 314 to translate an incoming regulation signal into a frequency response signal.
- Low level controller 314 is described in greater detail with reference to FIG. 5A .
- high level controller 312 is shown to include a clipping parameters optimizer 428.
- Clipping parameters optimizer 428 can be configured to generate a set of clipping parameters that are used by low level controller 314 to modify the battery power setpoints provided to power inverter 106.
- the battery power setpoints affect the frequency response of system 100 and consequently influence how closely the frequency response tracks the regulation signal Reg signal . Closely tracking the regulation signal Reg signal may result in higher performance scores, thereby increasing the frequency response revenue Rev ( Reg award ). However, closely tracking the regulation signal may also increase the cost of battery degradation ⁇ bat .
- variable P bat is used throughout this disclosure to designate the battery power, the battery power setpoints, and/or the battery power signal.
- the terms "battery power setpoints” and “battery power signal” are used interchangeably to designate the setpoints/control signals provided as an output from frequency response controller 112 to power inverter 106 and used by power inverter 106 to control the amount of power stored or discharged from battery 108 at each time step (i.e., the battery power).
- the battery power signal may be a continuous signal or a time series of discrete battery power setpoints (e.g., a battery power setpoint for each time step).
- the variable P bat is used to represent each of these items in various contexts.
- clipping parameter is used herein to designate any parameter that can be used to modify battery power setpoints or impose constraints on the battery power setpoints. For example, some clipping parameters limit the battery power setpoints within a predefined range, whereas other clipping parameters limit the rate at which the battery power setpoints can change over time, and other clipping parameters may limit the average value of the battery power setpoints over a given horizon. It should be understood that the clipping parameters may include any of a variety of parameters in addition to parameters that "clip" the battery power setpoints.
- Clipping parameters optimizer 428 can be configured to generate a set of clipping parameters that, when applied to the battery power setpoints, result in modified battery power setpoints that represent an optimal tradeoff between decreased frequency response revenue and increased battery life (i.e., the frequency response that maximizes the objective function J).
- the clipping parameters generated by clipping parameters optimizer 428 may include, for example, a maximum battery charging power parameter P bat,max,charge , a maximum battery discharging power parameter P bat,max,discharge , a maximum change in charging power parameter ⁇ P bat,max,charge , a maximum change in discharging power parameter ⁇ P bat,max,discharge , a maximum sustained charging power parameter P bat,max,charge_sustained , a maximum sustained discharging power parameter P bat,max,discharge_sustained , and a maximum sustained effort parameter P bat,max,effort .
- These parameters can be used by low level controller 314 to modify the battery power setpoints provided to power inverter 106.
- low level controller 314 can clip the battery power setpoints such that the battery charging power is no greater than P bat,max,charge and the battery discharging power is no greater than P bat,max,discharge at any given time step.
- low level controller 314 can clip the battery power setpoints such that the change in battery charging power between consecutive time steps is no greater than ⁇ P bat,max,charge and the change in battery discharging power between consecutive time steps is no greater than ⁇ P bat,max,discharge .
- Low level controller 314 can clip the battery power setpoints such that the average battery charging power over a given time period is no greater than P bat,max,charge_sustained and the average battery discharging power over a given time period is no greater than P bat,max,discharge_sustained .
- low level controller 314 can clip the battery power setpoints such that the average change in battery charging power or discharging power between consecutive time steps over a given time period is no greater than P bat,max,effort .
- the clipping operations performed by low level controller 314 are described in greater detail with reference to FIGS. 5B-10 .
- clipping parameters optimizer 428 is shown to include a power signal calculator 430 and a battery power calculator 432.
- Power signal is the same as the desired power P POI * exchanged between POI 110 and energy grid 104, which is the sum of the campus power P campus and the desired battery power P bat * .
- Clipping parameters optimizer 428 is shown to include a maximum power optimizer 434.
- Maximum power optimizer 434 can be configured to determine optimal values for the maximum battery charging power parameter P bat,max,charge and the maximum battery discharging power parameter P bat,max,discharge .
- the value of P bat affects the frequency response Res FR of system 100 and consequently affects how closely the frequency response Res FR tracks the regulation signal Reg signal .
- Maximum power optimizer 434 can use the frequency response Res FR to calculate the components of the performance score (i.e., PS acc , PS delay , and PS prec ) as described with reference to filter parameters optimizer 426.
- Maximum power optimizer 434 can substitute Res FR for Res signal to calculate the monetized cost of battery degradation ⁇ bat,k as described with reference to battery degradation estimator 418. With these constraints in place, maximum power optimizer 434 can optimize the objective function J using sequential quadratic programming, dynamic programming, or any other optimization technique.
- the maximum battery charging power parameter P bat,max,charge and the maximum battery discharging power parameter P bat,max,discharge are the variables to be optimized. Larger values P bat,max,charge and P bat,max,discharge result in less clipping of the unbounded battery power P bat , k * and therefore allow Res FR to closely track the regulation signal Reg signal . Closely tracking the regulation signal Reg signal may result in higher performance scores, thereby increasing the frequency response revenue. However, closely tracking the regulation signal may also increase the cost of battery degradation ⁇ bat .
- the optimization performed by maximum power optimizer 434 optimizes both P bat , max , charge and P bat,max,discharge simultaneously.
- the optimization may be a multi-variable optimization.
- the optimization can be a single-variable optimization in other embodiments.
- P bat,max,charge or P bat,max,discharge can be omitted from the optimization such that the optimization is performed using only a single optimization variable.
- the optimal values of P bat,max,charge , P bat,max,discharge , and/or P bat,max can be output as clipping parameters to low level controller 314.
- clipping parameters optimizer 428 is shown to include a maximum power change optimizer 436.
- Maximum power change optimizer 436 can be configured to determine optimal values for the maximum change in charging power parameter ⁇ P bat,max,charge and the maximum change in discharging power parameter ⁇ P bat,max,discharge .
- maximum power change optimizer 436 is shown receiving the unbounded power signal P bat * from battery power calculator 432 and the optimal values of the maximum power parameters P bat,max,charge and P bat,max,discharge from maximum power optimizer 434.
- the first set of constraints specify that the value of P bat cannot increase or decrease by more than ⁇ P bat,max,charge between time step k - 1 and time step k when battery 108 is charging (i.e., when P bat,clip,k ⁇ 0). Accordingly, if the clipped battery power P bat,clip,k at time step k is less than the battery power setpoint P bat,k- 1 at time step k - 1 by an amount that exceeds ⁇ P bat,max,charge (i.e., P bat,k- 1 - P bat,clip,k > ⁇ P bat,max,charge ), the battery power setpoint P bat , k at time step k will be set to P bat,k- 1 - ⁇ P bat,max,charge .
- the battery power setpoint P bat ,k at time step k will be set to P bat,k- 1 + ⁇ P bat,max,charge .
- the battery power setpoint P bat,k at time step k will be equal to the clipped battery power P bat,clip,k at time step k .
- the second set of constraints specify that the value of P bat cannot increase or decrease by more than ⁇ P bat,max,discharge between time step k - 1 and time step k when battery 108 is discharging (i.e., when P bat,clip,k > 0).
- the battery power setpoint P bat,k at time step k will be set to P bat,k- 1 - ⁇ P bat,max,discharge .
- the clipped battery power P bat,clip,k at time step k exceeds the battery power setpoint P bat,k- 1 at time step k - 1 by an amount that exceeds ⁇ P bat,max,discharge .
- the battery power setpoint P bat,k at time step k will be set to P bat,k- 1 + ⁇ P bat,max,charge .
- the battery power setpoint P bat , k at time step k will be equal to the clipped battery power P bat,clip,k at time step k .
- the value of P bat affects the frequency response Res FR of system 100 and consequently affects how closely the frequency response Res FR tracks the regulation signal Reg signal .
- Maximum power change optimizer 436 can use the frequency response Res FR to calculate the components of the performance score (i.e., PS acc , PS delay , and PS prec ) as described with reference to filter parameters optimizer 426.
- Maximum power change optimizer 436 can substitute Res FR for Res signal to calculate the monetized cost of battery degradation ⁇ bat,k as described with reference to battery degradation estimator 418. With these constraints in place, maximum power change optimizer 436 can optimize the objective function J using sequential quadratic programming, dynamic programming, or any other optimization technique.
- the maximum change in charging power parameter ⁇ P bat,max,charge and the maximum change in discharging power parameter ⁇ P bat,max,discharge are the variables to be optimized. Larger values ⁇ P bat,max,charge and ⁇ P bat,max,discharge result in less clipping of the battery power P bat , clip and therefore allow Res FR to closely track the regulation signal Reg signal . Closely tracking the regulation signal Reg signal may result in higher performance scores, thereby increasing the frequency response revenue. However, closely tracking the regulation signal may also increase the cost of battery degradation ⁇ bat .
- the optimization performed by maximum power change optimizer 436 optimizes both ⁇ P bat,max,charge and ⁇ P bat,max,discharge simultaneously.
- the optimization may be a multi-variable optimization.
- the optimization can be a single-variable optimization in other embodiments.
- ⁇ P bat,max,charge or ⁇ P bat,max,discharge can be omitted from the optimization such that the optimization is performed using only a single optimization variable.
- the optimal values of ⁇ P bat,max,charge , ⁇ P bat,max,discharge , and/or ⁇ P bat,max can be output as clipping parameters to low level controller 314.
- clipping parameters optimizer 428 is shown to include a maximum sustained power optimizer 438 and a maximum sustained effort optimizer 440.
- Maximum sustained power optimizer 438 can be configured to generate values for the maximum sustained charging power parameter P bat,max,charge_sustained and the maximum sustained discharging power parameter P bat,max,discharge_sustained .
- the parameters P bat,max,charge_sustained and P bat , max,discharge_sustained impose limits on the average value of P bat over a predetermined time period (e.g., five minutes, fifteen minutes, etc.), which helps limit battery degradation caused by extended periods of high battery power usage. This average value of P bat is referred to herein as the sustained battery power P bat,sustained .
- Low level controller 314 can be configured to modify the battery power signal P bat such that the sustained battery power P bat,sustained is maintained between P bat , max,discharge_sustained and - P bat,max,charge_sustained .
- maximum sustained power optimizer 438 sets the values of P bat,max,charge_sustained and P bat , max,discharge_sustained to a predetermined fraction or ratio of the values of P bat,max,charge and P bat,max,discharge , respectively.
- the values of P bat,max,charge_sustained and P bat , max,discharge_sustained can be output as clipping parameters to low level controller 314.
- Maximum sustained effort optimizer 440 can be configured to generate a value for the maximum sustained effort parameter P bat,max,effort .
- the parameter P bat,max,effort imposes limits on the average value of ⁇ P hat over a predetermined time period (e.g., five minutes, fifteen minutes, etc.), which helps limit battery degradation caused by extended periods of large changes in battery power ⁇ P bat .
- This average value of ⁇ P bat is referred to herein as the sustained battery effort ⁇ P bat,sustained .
- Low level controller 314 can be configured to modify the battery power signal P bat such that the sustained battery effort ⁇ P bat,sustained is less than P bat,max,effort .
- maximum sustained effort optimizer 440 sets the value of P bat,max,effort to a predetermined fraction or ratio of the value of ⁇ P bat,max,charge and/or ⁇ P bat,max,discharge .
- the value of P bat,max,effort can be output as a clipping parameter to low level controller 314.
- Low level controller 314 may receive the midpoints b and the filter parameters from high level controller 312. Low level controller 314 may also receive the campus power signal from campus 102 and the regulation signal Reg signal and the regulation award Reg award from incentive provider 114.
- Low level controller 314 is shown to include a regulation signal predictor 502.
- Regulation signal predictor 502 may use a history of past and current values for the regulation signal Reg signal to predict future values of the regulation signal.
- regulation signal predictor 502 uses a deterministic plus stochastic model trained from historical regulation signal data to predict future values of the regulation signal Reg signal .
- regulation signal predictor 502 may use linear regression to predict a deterministic portion of the regulation signal Reg signal and an AR model to predict a stochastic portion of the regulation signal Reg signal .
- regulation signal predictor 502 predicts the regulation signal Reg signal using the techniques described in U.S. Patent Application No. 14/717,593 , titled "Building Management System for Forecasting Time Series Values of Building Variables" and filed May 20, 2015.
- Low level controller 314 is shown to include a regulation signal filter 504.
- Regulation signal filter 504 may filter the incoming regulation signal Reg signal and/or the predicted regulation signal using the filter parameters provided by high level controller 312.
- regulation signal filter 504 is a low pass filter configured to remove high frequency components from the regulation signal Reg signal .
- Regulation signal filter 504 may provide the filtered regulation signal to power setpoint optimizer 506.
- low level controller 314 performs an optimization to determine how closely to track P POI * .
- low level controller 314 is shown to include a frequency response optimizer 508.
- the optimized frequency response Res FR represents an optimal tradeoff between decreased frequency response revenue and increased battery life (i.e., the frequency response that maximizes value J ).
- the values of Rev ( Reg award ) and ⁇ bat,k may be calculated by FR revenue estimator 510, performance score calculator 512, battery degradation estimator 514, and revenue loss estimator 516.
- low level controller 314 is shown to include a FR revenue estimator 510.
- FR revenue estimator 510 may estimate a frequency response revenue that will result from the frequency response Res FR .
- Low level controller 314 is shown to include a performance score calculator 512.
- Performance score calculator 512 may calculate the performance score PS used in the revenue function.
- the performance score PS may be based on several factors that indicate how well the optimal frequency response Res FR tracks the regulation signal Reg signal .
- the performance score PS is a composite weighting of an accuracy score, a delay score, and a precision score.
- each term in the precision score is assigned an equal weighting (e.g., 1/3). In other embodiments, some terms may be weighted higher than others.
- Each of the terms in the performance score model may be calculated as previously described with reference to FIG. 4A .
- low level controller 314 is shown to include a battery degradation estimator 514.
- Battery degradation estimator 514 may be the same or similar to battery degradation estimator 418, with the exception that battery degradation estimator 514 predicts the battery degradation that will result from the frequency response Res FR rather than the original regulation signal Reg signal .
- the estimated battery degradation may be used as the term ⁇ batt in the objective function J .
- Frequency response optimizer 508 may use the estimated battery degradation along with other terms in the objective function J to determine an optimal frequency response Res FR .
- battery degradation estimator 514 uses a battery life model to predict a loss in battery capacity that will result from the frequency response Res FR .
- C loss,nom is the nominal loss in battery capacity that is expected to occur over time. Therefore, C loss,add represents the additional loss in battery capacity degradation in excess of the nominal value Cl oss,nom .
- the terms in the battery life model may be calculated as described with reference to FIG. 4A , with the exception that the frequency response Res FR is used in place of the regulation signal Reg signal .
- low level controller 314 is shown to include a revenue loss estimator 516.
- Revenue loss estimator 516 may be the same or similar to revenue loss estimator 420, as described with reference to FIG. 4A .
- revenue loss estimator 516 may be configured to estimate an amount of potential revenue that will be lost as a result of the battery capacity loss C loss,add .
- Frequency response optimizer 508 may use the estimated performance score and the estimated battery degradation to define the terms in objective function J . Frequency response optimizer 508 may determine values for frequency response Res FR that optimize objective function J. In various embodiments, frequency response optimizer 508 may use sequential quadratic programming, dynamic programming, or any other optimization technique.
- low level controller 314 is shown to include a battery power signal clipper 518.
- Battery power signal clipper 518 can be configured to generate power setpoints P bat for power inverter 106 by applying a set of clipping parameters to the unbounded battery power signal P bat * .
- the clipping parameters may be generated by clipping parameters optimizer 428, as previously described, and provided as an input to battery power signal clipper 518.
- the clipping parameters may include, for example, a maximum battery charging power parameter P bat,max,charge , a maximum battery discharging power parameter P bat,max,discharge, a maximum change in charging power parameter ⁇ P bat,max,charge , a maximum change in discharging power parameter ⁇ P bat,max,discharge , a maximum sustained charging power parameter P bat,max,charge_sustained , a maximum sustained discharging power parameter P bat,max,discharge_sustained , and a maximum sustained effort parameter P bat,max,effort .
- These parameters can be used by battery power signal clipper 518 to modify the battery power setpoints provided to power inverter 106.
- the unbounded battery power signal P bat * is provided as an input to battery power signal clipper 518.
- battery power signal clipper 518 generates the unbounded battery power signal P bat * based on the values of Reg signal , Reg award , midpoint b, and the campus power signal P campus .
- Power signal is the same as the desired power P POI * exchanged between POI 110 and energy grid 104, which is the sum of the campus power P campus and the desired battery power P bat * .
- battery power signal clipper 518 is shown to include a maximum power adjuster 520.
- Maximum power adjuster 520 can be configured to clip the unbounded battery power P bat * using the optimal maximum battery charging power parameter P bat,max,charge and the optimal maximum battery discharging power parameter P bat,max,discharge generated by maximum power optimizer 434.
- the clipped battery power P bat can be provided as an output to power inverter 106 and/or provided as an input to other components of battery power signal clipper 518.
- Maximum power adjuster 520 can clip the unbounded battery power P bat * such that the clipped battery power P bat is maintained between -P bat,max,charge and P bat,max,discharge .
- FIG. 6 a graph 600 illustrating the clipping operations performed by maximum power adjuster 520 is shown, according to an exemplary embodiment.
- line 602 represents the unbounded battery power P bat *
- line 604 represents the clipped battery power P bat .
- Positive values of the battery power indicate that battery 108 is discharging
- negative values of the battery power indicate that battery 108 is charging.
- Line 606 indicates the maximum battery discharging power P bat,max,discharge (i.e., the maximum rate at which battery 108 can be discharged)
- line 608 indicates the maximum battery charging power - P bat,max,charge (i.e., the maximum rate at which battery 108 can be charged).
- the unbounded battery power P bat * is between -P bat,max,charge and P bat,max,discharge . Accordingly, maximum power adjuster 520 may not clip the unbounded battery power P bat * between times t 0 and t 1 . Thus, the clipped battery power P bat may be equal to the unbounded battery power P bat * between times t 0 and t 1 . However, at time t 1, the unbounded battery power P bat * begins exceeding P bat,max,discharge and remains above P bat,max,discharge until time t 2 .
- maximum power adjuster 520 may clip the unbounded battery power P bat * to P bat,max,discharge between times t 1 and t 2 .
- the clipped battery power P bat may be equal to P bat,max,discharge between times t 1 and t 2 .
- the unbounded battery power P bat * drops below P bat,max,discharge and remains between -P bat,max,charge and P bat,max,discharge until time t 3 . Accordingly, maximum power adjuster 520 may not clip the unbounded battery power P bat * between times t 2 and t 3 . Thus, the clipped battery power P bat may be equal to the unbounded battery power P bat * between times t 2 and t 3 . However, at time t 3 , the unbounded battery power P bat * drops below -P bat,max,charge and remains below P bat,max,discharge until time t 4 .
- maximum power adjuster 520 may clip the unbounded battery power P bat * to -P bat,max,charge between times t 3 and t 4 .
- the clipped battery power P bat may be equal to -P bat,max,discharge between times t 3 and t 4 .
- battery power signal clipper 518 is shown to include a maximum power change adjuster 522.
- Maximum power change adjuster 522 can be configured to clip the unbounded power signal P bat * using the optimal maximum battery charging power parameter P bat,max,charge and the optimal maximum battery discharging power parameter P bat,max,discharge generated by maximum power optimizer 434, as well as the optimal maximum change in charging power parameter ⁇ P bat,max,charge and the optimal maximum change in discharging power parameter ⁇ P bat,max,discharge generated by maximum power change optimizer 436.
- the first set of equations specify that the value of P bat cannot increase or decrease by more than ⁇ P bat,max,charge between time step k - 1 and time step k when battery 108 is charging (i.e., when P bat,clip,k ⁇ 0).
- maximum power change adjuster 522 may set the battery power setpoint P bat , k at time step k to P bat,k- 1 - ⁇ P bat,max,charge .
- maximum power change adjuster 522 may set the battery power setpoint P bat,k at time step k to P bat,k- 1 + ⁇ P bat,max,charge .
- maximum power change adjuster 522 may set the battery power setpoint P bat,k at time step k equal to the clipped battery power P bat,clip,k at time step k .
- the second set of equations specify that the value of P bat cannot increase or decrease by more than ⁇ P bat,max,discharge between time step k - 1 and time step k when battery 108 is discharging (i.e., when P bat,clip,k > 0). Accordingly, if the clipped battery power P bat,clip,k at time step k is less than the battery power setpoint P bat,k -1 at time step k - 1 by an amount that exceeds ⁇ P bat,max,discharge .
- maximum power change adjuster 522 may set the battery power setpoint P bat , k at time step k to P bat,k- 1 - ⁇ P bat,max,discharge .
- maximum power change adjuster 522 may set the battery power setpoint P bat,k at time step k to P bat,k - 1 + ⁇ P bat,max,charge .
- maximum power change adjuster 522 may set the battery power setpoint P bat,k at time step k equal to the clipped battery power P bat,clip,k at time step k .
- FIG. 7 a graph 700 illustrating the clipping operations performed by maximum power change adjuster 522 is shown, according to an exemplary embodiment.
- line 702 represents the unbounded battery power P bat *
- line 704 represents the clipped battery power P bat (i.e., the battery power setpoint). Positive values of the battery power indicate that battery 108 is discharging, whereas negative values of the battery power indicate that battery 108 is charging.
- the unbounded battery power P bat * is less than zero, which indicates that battery 108 is charging.
- the unbounded battery power P bat * is relatively stable and does not change by more than ⁇ P bat,max,charge between any two consecutive time steps k - 1 and k. Accordingly, maximum power change adjuster 522 does not alter the unbounded battery power P bat * between time t 0 and time t 1 .
- the battery power setpoint P bat provided to power inverter 106 will be equal to the unbounded battery power P bat * between time t 0 and time t 1 .
- the unbounded battery power P bat * begins decreasing at a rate that exceeds ⁇ P bat,max,charge (i.e., P bat , k ⁇ 1 ⁇ P bat , k * > ⁇ P bat , max , charge ).
- maximum power change adjuster 522 may prevent the battery power setpoint P bat from changing by more than ⁇ P bat,max,charge between any two consecutive time steps k - 1 and k. It is noted that the maximum change in charging power parameter ⁇ P bat,max,charge is applicable between times t 1 and t 2 because battery 108 is charging (i.e., P bat is negative).
- maximum power change adjuster 522 sets the battery power setpoint P bat,k at time step k to P bat,k- 1 - ⁇ P bat,max,charge . This adjustment is repeated for each time step k until the difference between P bat,k- 1 and P bat , k * is no longer greater than ⁇ P bat,max,charge , which occurs at time t 2 .
- the slope 706 of the battery power setpoint P bat between times t 1 and t 2 is equal to - ⁇ P bat,max,charge over the duration of each time step k .
- the unbounded battery power P bat * begins increasing (relative to the previous value of the battery power setpoint P bat ) at a rate that exceeds ⁇ P bat,max,charge (i.e., P bat , k * ⁇ P bat,k -1 > ⁇ P bat,max,charge ).
- maximum power change adjuster 522 may prevent the battery power setpoint P bat from changing by more than ⁇ P bat,max,charge between any two consecutive time steps k - 1 and k. It is noted that the maximum change in charging power parameter ⁇ P bat,max,charge is still applicable between times t 2 and t 3 because battery 108 is still charging (i.e., P bat is negative).
- maximum power change adjuster 522 sets the battery power setpoint P bat,k at time step k to P bat,k- 1 + ⁇ P bat,max,charge . This adjustment is repeated for each time step k between times t 2 and t 3 .
- the slope 708 of the battery power setpoint P bat between times t 2 and t 3 is equal to ⁇ P bat,max,charge over the duration of each time step k.
- the battery power setpoint P bat becomes positive, which indicates that battery 108 is now discharging.
- the difference between the unbounded battery power P bat , k * and the battery power setpoint P bat,k- 1 is still greater than the maximum allowable change.
- the maximum allowable change is now defined by the maximum change in discharging power ⁇ P bat,max,discharge parameter rather than the maximum change in charging power ⁇ P bat,max,charge parameter.
- Maximum power change adjuster 522 may prevent the battery power setpoint P bat from changing by more than ⁇ P bat,max,discharge between any two consecutive time steps k - 1 and k.
- maximum power change adjuster 522 sets the battery power setpoint P bat,k at time step k to P bat,k- 1 + ⁇ P bat,m ax, discharge . This adjustment is repeated for each time step k until the difference between P bat , k * and P bat,k- 1 is no longer greater than ⁇ P bat,max,discharge , which occurs at time t 4 .
- the slope 710 of the battery power setpoint P bat between times t 3 and t 4 is equal to ⁇ P bat,max,discharge over the duration of each time step k.
- the unbounded battery power P bat * is greater than zero, which indicates that battery 108 is discharging.
- the unbounded battery power P bat * is relatively stable and does not change by more than ⁇ P bat,max,dischage between any two consecutive time steps k - 1 and k. Accordingly, maximum power change adjuster 522 does not alter the unbounded battery power P bat * between time t 4 and time t 5 .
- the battery power setpoint P bat provided to power inverter 106 will be equal to the unbounded battery power P bat * between time t 4 and time t 5 .
- battery power signal clipper 518 is shown to include a zero cross adjuster 524.
- Zero cross adjuster 524 can be configured to modify the battery power signal P bat (i.e., the time series of battery power setpoints) generated by maximum power change adjuster 522 to ensure that the battery power signal P bat crosses zero at approximately the same time as the unbounded battery power P bat * and/or the regulation signal Reg signal .
- the maximum power change limitations imposed by maximum power change adjuster 522 cause the battery power signal P bat to significantly lag the unbounded battery power P bat * and/or the regulation signal Reg signal .
- graph 700 shows the unbounded battery power P bat * crossing zero shortly after time t 2 , whereas the battery power signal P bat does not cross zero until significantly later at time t 3 .
- the adjustments performed by zero cross adjuster 524 may decrease the lag time between P bat and P bat * and/or Reg signal to ensure that both cross zero at approximately the same time (or closer to the same time).
- zero cross adjuster 524 predicts the time at which the unbounded battery power P bat * and/or the regulation signal Reg signal will cross zero based on the current value and slope of P bat * and/or Reg signal .
- the slope can be expressed as the change in value of the signal P bat * and/or Reg signal between consecutive time steps k - 1 and k.
- Zero cross adjuster 524 can use the predicted number of time steps StepsToZero Power and/or StepsToZero Reg to generate upper and lower zero cross bounds for the battery power signal P bat .
- zero cross adjuster 524 can calculate an upper bound for the battery power signal P bat by multiplying the predicted number of time steps StepsToZero Power or StepsToZero Reg by the maximum rate that the battery discharging power can change between each time step ⁇ P bat,max,discharge , as shown in the following equation:
- ZeroCross UpperBound StepsToZero ⁇ ⁇ P bat , max , discharge where StepsToZero is either StepsToZero Power or StepsToZero Reg .
- ZeroCross UpperBound indicates the maximum value that the battery power signal P bat can have for the battery power signal P bat to be able to reach zero at the same time as the unbounded battery power P bat * and/or the regulation signal Reg signal , given the limitation on the rate at which the battery power signal can decrease ⁇ P bat,max,discharge when discharging.
- ZeroCross LowerBound indicates the minimum value that the battery power signal P bat can have for the battery power signal P bat to be able to reach zero at the same time as the unbounded battery power P bat * and/or the regulation signal Reg signal , given the limitation on the rate at which the battery power signal can increase ⁇ P bat,max,charge when charging.
- Zero cross adjuster 524 can use the upper zero cross bound ZeroCross UpperBound and the lower zero cross bound ZeroCross LowerBound to determine when to start adjusting the battery power signal P bat toward zero. For example, if the battery power signal P bat is currently greater than or equal to the upper zero cross bound ZeroCross UpperBound (i.e., P bat ⁇ ZeroCross UpperBound ) and the slope of the unbounded power P bat * and/or the regulation signal Reg signal is negative (i.e., P bat * or Reg signal is moving toward zero), zero cross adjuster 524 can begin decreasing the battery power signal P bat at the maximum allowable rate ⁇ P bat,max,discharge per time step.
- the upper zero cross bound ZeroCross UpperBound i.e., P bat ⁇ ZeroCross UpperBound
- Reg signal i.e., P bat * or Reg signal is moving toward zero
- zero cross adjuster 524 can begin increasing the battery power signal P bat at the maximum allowable rate ⁇ P bat,max,charge per time step.
- a graph 800 illustrating the adjustments to the battery power signal P bat performed by zero cross adjuster 524 is shown, according to an exemplary embodiment.
- line 802 represents the unbounded battery power P bat *
- line 804 represents the battery power signal P bat without any zero cross adjustment (i.e., the output of maximum power change adjuster 522)
- line 806 represents the battery power signal P bat,zc with zero cross adjustments (i.e., the output of zero cross adjuster 524).
- Positive values of the battery power indicate that battery 108 is discharging, whereas negative values of the battery power indicate that battery 108 is charging.
- line 808 represents the zero cross upper bound ZeroCross UpperBound at time t 5
- line 810 represents the zero cross lower bound ZeroCross LowerBound at time t 2 .
- the values of ZeroCross UpperBound and ZeroCross LowerBound depend on the predicted number of time steps until the unbounded power signal P bat , k * and/or the regulation signal Reg signal,k reaches zero, based on their current values and slopes. Accordingly, the values ZeroCross UpperBound and ZeroCross LowerBound may change over time as the values and slopes of the unbounded power signal P bat , k * and/or the regulation signal Reg signal,k change.
- lines 808 and 810 represent the values of ZeroCross UpperBound and ZeroCross LowerBound at specific times (i.e., times t 5 and t 2 respectively) and are not necessarily fixed at those values over the entire time period shown in graph 800.
- the unbounded battery power P bat * is less than zero, which indicates that battery 108 is charging.
- the unbounded battery power P bat * is relatively stable and does not change by more than ⁇ P bat,max,charge between any two consecutive time steps k - 1 and k. Accordingly, maximum power change adjuster 522 does not alter the unbounded battery power P bat * between time t 0 and time t 1 .
- the unbounded battery power P bat * is also between the upper zero cross bound ZeroCross UpperBound,k and the zero cross lower bound ZeroCross LowerBound,k at each time step k between time t 0 and time t 1 .
- zero cross adjuster 524 does not alter the unbounded battery power P bat * between time t 0 and time t 1 .
- the unbounded battery power P bat * , the battery power signal P bat without any zero cross adjustment, and the battery power signal P bat,zc with zero cross adjustment are substantially equal between time t 0 and time t 1 .
- the unbounded battery power P bat * begins decreasing at a rate that exceeds ⁇ P bat,max,charge (i.e., P bat , k ⁇ 1 ⁇ P bat , k * > ⁇ P bat , max , charge ) .
- maximum power change adjuster 522 may prevent the battery power signal P bat from changing by more than ⁇ P bat,max,charge between any two consecutive time steps k - 1 and k. Therefore, maximum power change adjuster 522 sets the battery power signal P bat , k at time step k to P bat,k- 1 - ⁇ P bat,max,charge .
- the value of the battery power signal P bat drops below the lower zero cross bound ZeroCross LowerBound .
- Zero cross adjuster 524 initiates zero cross adjustment at time t 2 , which drives the value of P bat,zc toward zero.
- the adjusted battery power signal P bat,zc (line 806) begins moving toward zero at time t 2 at the maximum allowable rate.
- the adjusted battery power signal P bat,zc has a slope that corresponds to the maximum change in charge power ⁇ P bat,max,charge between time t 2 and t 3 .
- the battery power signal P bat without zero cross adjustment continues decreasing between time t 2 and time t 3 in an attempt to match the unbounded battery power P bat * .
- P bat continues to decrease until the value of P bat reaches the value of the unbounded battery power P bat * at time t 3 .
- the adjustment performed by zero cross adjuster 524 decreases the lag time between the time at which unbounded battery power P bat * crosses zero and the time at which the battery power signal crosses zero.
- the unbounded battery power P bat * crosses zero between time t 3 and time t 4 .
- the adjusted battery power signal P bat,zc crosses zero at time t 4 , whereas the battery power signal P bat without zero cross adjustment does not cross zero until significantly later at time t 5 .
- the value of the adjusted battery power signal P bat,zc exceeds the upper zero cross bound ZeroCross UpperBound .
- Zero cross adjuster 524 initiates zero cross adjustment at time t 5 , which drives the value of P bat,zc toward zero.
- the adjusted battery power signal P bat,zc (line 806) begins moving toward zero at time t 5 at the maximum allowable rate.
- the adjusted battery power signal P bat,zc has a slope that corresponds to the maximum change in discharge power - ⁇ P bat,max,discharge between time t 5 and t 7 .
- the battery power signal P bat without zero cross adjustment (line 804) continues increasing between time t 5 and time t 6 in an attempt to match the unbounded battery power P bat * .
- P bat continues to increase until the value of P bat reaches the value of the unbounded battery power P bat * at time t 6 .
- the adjustment performed by zero cross adjuster 524 causes the adjusted battery power signal P bat,zc to cross zero at the same time as the unbounded battery power P bat * .
- both the adjusted battery power signal P bat,zc and the unbounded battery power P bat * cross zero at time t 7 .
- the battery power signal P bat without zero cross adjustment does not cross zero until time t 8 .
- battery power signal clipper 518 is shown to include a maximum sustained power adjuster 526.
- Maximum sustained power adjuster 526 can be configured to adjust the unbounded power signal P bat * using the optimal maximum sustained charging power parameter P bat,max,charge_sustained and maximum sustained discharging power parameter P bat,max,discharge_sustained generated by maximum sustained power optimizer 438.
- the maximum sustained power parameters P bat,max,charge_sustained and P bat-max,discharge_sustained limit the moving average of the battery power signal P bat over a predetermined horizon (e.g., five minutes, fifteen minutes, etc.).
- the values of P bat,max,charge_sustained and P bat , max,discharge_sustained are set to a fixed fraction or percentage of P bat,max,charge and P bat,max,discharge , respectively (e.g., 75%) and may be received as an input to maximum sustained power adjuster 526.
- Maximum sustained power adjuster 526 can calculate a moving average of the battery power signal P bat using a set of previous values of the battery power signal P bat .
- Maximum sustained power adjuster 526 can actively adjust the battery power signal P bat to ensure that the moving average P bat,k is maintained between P bat,max,charge_sustained and P bat,max,discharge_sustained .
- maximum sustained power adjuster 526 can calculate the number of time steps required for the current value of the battery power signal P bat,k to reach the maximum sustained discharge power P bat,max,discharge_sustained based on the maximum allowable change in the discharge power ⁇ P bat,max,discharge . between consecutive time steps k - 1 and k.
- maximum sustained power adjuster 526 may adjust the battery power signal P bat,k toward the maximum sustained charging power -P bat,max,charge_sustained at a rate of ⁇ P bat,max,charge .
- maximum sustained power adjuster 526 may adjust the battery power signal P bat,k toward the maximum sustained discharging power P bat , max,discharge_sustained at a rate of - ⁇ P bat,max,discharge .
- maximum sustained power adjuster 526 may not adjust the battery power signal P bat,k .
- a graph 900 illustrating the adjustments to the battery power signal P bat performed by maximum sustained power adjuster 526 is shown, according to an exemplary embodiment.
- line 902 represents the unbounded battery power P bat *
- line 904 represents the battery power signal P bat after being adjusted by maximum sustained power adjuster 526.
- Line 906 represents the sustained power moving average of P bat at each time step k (i.e., P bat,k ) based on the values of P bat within a moving time window that ends at time step k .
- Line 908 represents the maximum sustained discharging power P bat,max,discharge_sustained .
- the battery power signal P bat matches the unbounded battery power P bat * . Both the battery power signal P bat and the unbounded battery power P bat * are above the maximum sustained discharging power P bat,max,discharge_sustained .
- the sustained power moving average P bat,k is below the maximum sustained discharging power P bat,max,discharge_sustained but continues to increase with each time step k. As the sustained power moving average P bat,k approaches the maximum sustained discharging power P bat,max,discharge_sustained , the sustained power discharge bound P sustained,DishargeBound decreases until it reaches the value of P bat at time t 1 .
- maximum sustained power adjuster 526 determines that the value of P bat exceeds the sustained power discharge bound P sustained,DishargeBound . Consequently, maximum sustained power adjuster 526 adjusts the battery power signal P bat toward the maximum sustained discharge power P bat , max,discharge_sustained at a rate of - ⁇ P bat,max,discharge , which represents the slope of line 904 between time t 1 and time t 2 .
- the battery power signal P bat and the sustained power discharge bound P sustained,DishargeBound both continue to decrease until they reach the maximum sustained discharge power P bat , max,discharge_sustained at time t 2 .
- the sustained power moving average P bat,k reaches the maximum sustained discharge power P bat,max,discharge-sustained . Accordingly, any value of P bat above maximum sustained discharge power P bat , max,discharge_sustained would cause the sustained power moving average P bat,k to exceed the maximum sustained discharge power P bat,max,discharge_sustained .
- maximum sustained power adjuster 526 sets the battery power signal P bat equal to the maximum sustained discharge power P bat,max,discharge_sustained .
- battery power signal clipper 518 is shown to include a maximum sustained effort adjuster 528.
- Maximum sustained effort adjuster 528 can be configured to adjust the unbounded power signal P bat * using the optimal maximum sustained effort parameter P bat,max,effort generated by maximum sustained effort optimizer 440.
- the maximum sustained effort parameter P bat,max,effort limits the moving average of the change in the battery power signal ⁇ P bat (i.e., the sustained effort) over a predetermined horizon (e.g., five minutes, fifteen minutes, etc.).
- the horizon over which the sustained effort is calculated is longer than the horizon over which the sustained power is calculated.
- the value of P bat,max,effort is set to a fixed fraction or percentage of ⁇ P bat,max,charge or ⁇ P bat,max,discharge (e.g., 75%) and may be received as an input to maximum sustained effort adjuster 528.
- Maximum sustained effort adjuster 528 can calculate a moving average of the change in the battery power signal P bat between sets of consecutive time steps using a set of previous values of the battery power signal P bat .
- Maximum sustained effort adjuster 528 can actively adjust the battery power signal P bat to ensure that the moving average ⁇ P bat,k is less than the maximum sustained effort parameter P bat,max,effort .
- Maximum sustained effort adjuster 528 can calculate the number of time steps required for the current value of the battery power signal P bat,k to reach the maximum sustained effort P bat,max,effort based on the maximum allowable change in the charging or discharging power (i.e., ⁇ P bat,max,charge or ⁇ P bat,max,discharge ) between consecutive time steps k - 1 and k.
- maximum sustained effort adjuster 528 may adjust the battery power signal P bat,k toward the maximum sustained effort -P bat,max,effort at a rate of ⁇ P bat,max,charge .
- maximum sustained effort adjuster 528 may adjust the battery power signal P bat,k toward the maximum sustained effort P bat,max,effort at a rate of - ⁇ P bat,max,discharge .
- maximum sustained effort adjuster 528 may not adjust the battery power signal P bat,k .
- a graph 1000 illustrating the adjustments to the battery power signal P bat performed by maximum sustained power adjuster 526 and maximum sustained effort adjuster 528 is shown, according to an exemplary embodiment.
- line 1002 represents the unbounded battery power P bat *
- line 1004 represents the battery power signal P bat after being adjusted by maximum sustained power adjuster 526 and maximum sustained effort adjuster 528.
- Line 1006 represents the sustained power moving average of P bat at each time step k (i.e., P bat,k ) based on the values of P bat within a moving time window that ends at time step k.
- Line 1008 represents the sustained effort moving average of ⁇ P bat at each time step k (i.e., ⁇ P bat,k ) based on the values of P bat within a moving time window that ends at time step k .
- Line 1010 represents the maximum sustained discharging power P bat,max,discharge_sustained and line 1012 represents the maximum sustained effort P bat,max,effort .
- the battery power signal P bat matches the unbounded battery power P bat * . Both the battery power signal P bat and the unbounded battery power P bat * are above the maximum sustained discharging power P bat,max,discharge_sustained .
- the sustained power moving average P bat,k is below the maximum sustained discharging power P bat,max,discharge_sustained but continues to increase with each time step k. As the sustained power moving average P bat,k approaches the maximum sustained discharging power P bat,max,discharge_sustained , the sustained power discharge bound P sustained,DishargeBound decreases until it reaches the value of P bat at time t 1 .
- maximum sustained power adjuster 526 determines that the value of P bat exceeds the sustained power discharge bound P sustained,DishargeBound . Consequently, maximum sustained power adjuster 526 adjusts the battery power signal P bat toward the maximum sustained discharge power P bat,max,discharge_sustained at a rate of - ⁇ P bat,max,discharge , which represents the slope of line 904 between time t 1 and time t 2 .
- the battery power signal P bat and the sustained power discharge bound P sustained,DishargeBound both continue to decrease until they reach the maximum sustained discharge power P bat,max,discharge_sustained at time t 2 .
- the sustained power moving average P bat,k reaches the maximum sustained discharge power P bat,max,discharge-sustained . Accordingly, any value of P bat above maximum sustained discharge power P bat,max,discharge_sustained would cause the sustained power moving average P bat,k to exceed the maximum sustained discharge power P bat,max,discharge_sustained .
- maximum sustained power adjuster 526 sets the battery power signal P bat equal to the maximum sustained discharge power P bat,max,discharge_sustained .
- maximum sustained effort adjuster 528 determines that the value of P bat exceeds the sustained effort bound E sustained,Bound . Consequently, maximum sustained effort adjuster 528 adjusts the battery power signal P bat toward the maximum sustained effort P bat,max,effort at a rate of - ⁇ P bat,max,discharge , which represents the slope of line 1004 between time t 3 and time t 4 .
- the battery power signal P bat and the sustained effort bound E sustained,Bound both continue to decrease until they reach the maximum sustained effort P bat,max,effort at time t 4 .
- maximum sustained effort adjuster 528 sets the battery power signal P bat equal to the maximum sustained effort P bat,max,effort
- Process 1100 can be performed by one or more components of frequency response optimization system 100 including, for example, frequency response controller 112 and power inverter 106.
- Process 1100 is shown to include generating an objective function that accounts for both frequency response revenue and a cost of battery degradation as a function of battery power setpoints (step 1102).
- the battery power setpoints P bat affect the frequency response Res FR of system 100 and consequently affect how closely the frequency response Res FR tracks the regulation signal Reg signal .
- the frequency response Res FR can be used to calculate the components of the performance score (i.e., PS acc , PS delay , and PS prec ) as described with reference to filter parameters optimizer 426.
- the frequency response Res FR can also be substituted for Res signal to calculate the monetized cost of battery degradation ⁇ bat,k as described with reference to battery degradation estimator 418.
- Process 1100 is shown to include using clipping parameters to generate and impose constraints on the battery power setpoints (step 1104).
- the clipping parameters used in step 1104 may include, for example, a maximum battery charging power parameter P bat,max,charge , a maximum battery discharging power parameter P bat,max,discharge , a maximum change in charging power parameter ⁇ P bat,max,charge , a maximum change in discharging power parameter ⁇ P bat,max,discharge , a maximum sustained charging power parameter P bat,max,charge_sustained , a maximum sustained discharging power parameter P bat,max,discharge_sustained , and/or a maximum sustained effort parameter P bat,max,effort .
- the battery power P bat,k is constrained using the maximum battery charging power parameter P bat,max,charge and the maximum battery discharging power parameter P bat,max,discharge .
- the battery power P bat,k is constrained using the maximum change in charging power parameter ⁇ P bat,max,charge and the maximum change in discharging power parameter ⁇ P bat,max,discharge .
- the first set of constraints specify that the value of P bat cannot increase or decrease by more than ⁇ P bat,max,charge between time step k - 1 and time step k when battery 108 is charging (i.e., when P bat,clip,k ⁇ 0). Accordingly, if the clipped battery power P bat,clip,k at time step k is less than the battery power setpoint P bat,k -1 at time step k - 1 by an amount that exceeds ⁇ P bat,max,charge (i.e., P bat,k -1 - P bat,clip,k > ⁇ P bat,max,charge ), the battery power setpoint P bat,k at time step k will be set to P bat,k -1 - ⁇ P bat,max,charge .
- the battery power setpoint P bat,k at time step k will be set to P bat,k -1 + ⁇ P bat,max,charge .
- the battery power setpoint P bat,k at time step k will be equal to the clipped battery power P bat,clip,k at time step k .
- the second set of constraints specify that the value of P bat cannot increase or decrease by more than ⁇ P bat,max,discharge between time step k - 1 and time step k when battery 108 is discharging (i.e., when P bat,clip,k > 0).
- the battery power setpoint P bat,k at time step k will be set to P bat,k -1 - ⁇ P bat,max,discharge .
- the battery power setpoint P bat,k at time step k will be set to P bat,k -1 + ⁇ P bat,max,charge .
- the battery power setpoint P bat , k at time step k will be equal to the clipped battery power P bat,clip,k at time step k .
- process 1100 is shown to include optimizing the objective function subject to the constraints to determine optimal values of the clipping parameters (step 1106).
- the optimization performed in step 1106 uses the maximum battery charging power parameter P bat,max,charge and the maximum battery discharging power parameter P bat,max,discharge as the variables to be optimized. Larger values P bat,max,charge and P bat,max,discharge result in less clipping of the unbounded battery power P bat , k * and therefore allow Res FR to closely track the regulation signal Reg signal . Closely tracking the regulation signal Reg signal may result in higher performance scores, thereby increasing the frequency response revenue. However, closely tracking the regulation signal may also increase the cost of battery degradation ⁇ bat .
- the optimization performed in step 1106 optimizes both P bat,max,charge and P bat,max,discharge simultaneously.
- the optimization may be a multi-variable optimization.
- the optimization can be a single-variable optimization in other embodiments.
- either P bat,max,charge or P bat,max,discharge can be omitted from the optimization such that the optimization is performed using only a single optimization variable.
- the optimization performed in step 1106 uses the maximum change in charging power parameter ⁇ P bat,max,charge and the maximum change in discharging power parameter ⁇ P bat,max,discharge as the variables to be optimized. Larger values ⁇ P bat,max,charge and ⁇ P bat,max,discharge result in less clipping of the battery power P bat,clip and therefore allow Res FR to closely track the regulation signal Reg signal . Closely tracking the regulation signal Reg signal may result in higher performance scores, thereby increasing the frequency response revenue. However, closely tracking the regulation signal may also increase the cost of battery degradation ⁇ bat .
- ⁇ P bat,max,charge and ⁇ P bat,max,discharge result in more clipping of the battery power P bat,clip and therefore cause Res FR to track the regulation signal Reg signal less closely. Tracking the regulation signal Reg signal less closely may result in lower performance scores, thereby decreasing the frequency response revenue. However, tracking the regulation signal less closely may also decrease the cost of battery degradation ⁇ bat .
- the optimization performed in step 1106 results in values of ⁇ P bat,max,charge and ⁇ P bat,max,discharge that represent an optimal tradeoff between frequency response revenue and battery degradation costs (i.e., the frequency response that maximizes the objective function J).
- the optimization performed in step 1106 optimizes both ⁇ P bat,max,charge and ⁇ P bat,max,discharge simultaneously.
- the optimization may be a multi-variable optimization.
- the optimization can be a single-variable optimization in other embodiments.
- either ⁇ P bat,max,charge or ⁇ P bat,max,discharge can be omitted from the optimization such that the optimization is performed using only a single optimization variable.
- the optimization performed in step 1106 may optimize the objective function J using sequential quadratic programming, dynamic programming, or any other optimization technique.
- the optimal values of P bat,max,charge, P bat,max,discharge , P bat,max , ⁇ P bat,max,charge , ⁇ P bat,max,discharge , and/or ⁇ P bat,max can be output as clipping parameters to low level controller 314 for use in adjusting the battery power setpoints P bat .
- step 1108 includes adjusting the battery power signal P bat as described with reference to zero cross adjuster 524 to ensure that the battery power signal P bat crosses zero at approximately the same time (or closer to the same time) as the unbounded battery power P bat * and/or the regulation signal Reg signal .
- step 1108 includes adjusting the battery power signal P bat as described with reference to maximum sustained power adjuster 526 and/or maximum sustained effort adjuster 528 to ensure that the moving average of the battery power P bat or change in battery power ⁇ P bat does not exceed the maximum sustained power parameters and/or the maximum sustained effort parameters.
- process 1100 is shown to include using the adjusted battery power setpoints to control an amount of power stored or discharged from a battery (step 1110).
- the adjusted battery power setpoints P bat,k can be provided as an input to power inverter 106.
- Power inverter 106 can use the battery power setpoints P bat,k to control the amount of power stored in battery 108 or discharged from battery 108 at each time step k .
- Process 1200 can be performed by one or more components of frequency response optimization system 100 such as frequency response controller 112. In some embodiments, process 1200 is performed by one or more components of high level controller 312 such as clipping parameters optimizer 428.
- Process 1200 is shown to include transforming a frequency regulation signal into a power signal (step 1202).
- the power signal created in step 1202 may be either the power signal Power signal or the unbounded battery power P bat * in various embodiments.
- Process 1200 is shown to include clipping the power signal using the maximum charging power parameter P bat,max,charge and the maximum discharging power parameter P bat,max,discharge (step 1204).
- Process 1200 is shown to include using the clipped power signal to calculate a performance score, frequency response revenue, and a cost of battery degradation (step 1206).
- the value of P bat affects the frequency response Res FR of system 100 and consequently affects how closely the frequency response Res FR tracks the regulation signal Reg signal .
- Step 1206 may include using the frequency response Res FR to calculate the components of the performance score (i.e., PS acc , PS delay , and PS prec ) as described with reference to filter parameters optimizer 426. Step 1206 may include substituting Res FR for Res signal to calculate the monetized cost of battery degradation ⁇ bat,k as described with reference to battery degradation estimator 418.
- Process 1200 is shown to include generating an objective function that accounts for frequency response revenue and the cost of battery degradation (step 1208).
- Process 1200 is shown to include optimizing the objective function to determine optimal values of the maximum charging power parameter P bat,max,charge and the maximum discharging power parameter P bat,max,discharge (step 1210).
- the optimization performed in step 1210 uses the maximum battery charging power parameter P bat,max,charge and the maximum battery discharging power parameter P bat,max,discharge as the variables to be optimized. Larger values P bat,max,charge and P bat,max,discharge result in less clipping of the unbounded battery power P bat , k * and therefore allow Res FR to closely track the regulation signal Reg signal . Closely tracking the regulation signal Reg signal may result in higher performance scores, thereby increasing the frequency response revenue. However, closely tracking the regulation signal may also increase the cost of battery degradation ⁇ bat .
- the optimization performed in step 1210 optimizes both P bat,max,charge and P bat,max,discharge simultaneously.
- the optimization may be a multi-variable optimization.
- the optimization can be a single-variable optimization in other embodiments.
- P bat,max,charge or P bat,max,discharge can be omitted from the optimization such that the optimization is performed using only a single optimization variable.
- the optimization performed in step 1210 may optimize the objective function J using sequential quadratic programming, dynamic programming, or any other optimization technique.
- Process 1300 can be performed by one or more components of frequency response optimization system 100 such as frequency response controller 112. In some embodiments, process 1300 is performed by one or more components of high level controller 312 such as clipping parameters optimizer 428.
- Process 1300 is shown to include transforming a frequency regulation signal into a power signal (step 1302).
- the power signal created in step 1302 may be either the power signal Power signal or the unbounded battery power P bat * in various embodiments.
- Process 1300 is shown to include clipping the power signal using the optimal maximum charging power parameter P bat,max,charge and the optimal maximum discharging power parameter P bat,max,discharge (step 1304).
- the optimal values of P bat,max,charge and P bat,max,discharge are generated by performing process 1200.
- Process 1300 is shown to include clipping the power signal using the maximum change in charging power parameter ⁇ P bat,max,charge and the maximum change in discharging power parameter ⁇ P bat,max,discharge (step 1306).
- the first set of equations specify that the value of P bat cannot increase or decrease by more than ⁇ P bat,max,charge between time step k - 1 and time step k when battery 108 is charging (i.e., when P bat,clip,k ⁇ 0).
- step 1306 may include setting the battery power setpoint P bat,k at time step k to P bat,k -1 - ⁇ P bat,max,charge .
- step 1306 may include setting the battery power setpoint P bat,k at time step k to P bat,k -1 + ⁇ P bat,max,charge .
- step 1306 may include setting the battery power setpoint P bat,k at time step k equal to the clipped battery power P bat,clip,k at time step k.
- the second set of equations specify that the value of P bat cannot increase or decrease by more than ⁇ P bat,max,discharge between time step k - 1 and time step k when battery 108 is discharging (i.e., when P bat,clip,k > 0).
- step 1306 may include setting the battery power setpoint P bat,k at time step k to P bat,k -1 - ⁇ P bat,max,discharge .
- step 1306 may include setting the battery power setpoint P bat,k at time step k to P bat,k -1 + ⁇ P bat,max,charge .
- step 1306 may include setting the battery power setpoint P bat,k at time step k equal to the clipped battery power P bat,clip,k at time step k.
- Process 1300 is shown to include using the clipped power signal to calculate a performance score, frequency response revenue, and a cost of battery degradation (step 1308).
- the value of P bat affects the frequency response Res FR of system 100 and consequently affects how closely the frequency response Res FR tracks the regulation signal Reg signal .
- Step 1308 may include using the frequency response Res FR to calculate the components of the performance score (i.e., PS acc , PS delay , and PS prec ) as described with reference to filter parameters optimizer 426. Step 1308 may include substituting Res FR for Res signal to calculate the monetized cost of battery degradation ⁇ bat,k as described with reference to battery degradation estimator 418.
- Process 1300 is shown to include generating an objective function that accounts for frequency response revenue and the cost of battery degradation (step 1310).
- Process 1300 is shown to include optimizing the objective function to determine optimal values of the maximum change in charging power parameter ⁇ P bat,max,charge and the maximum change in discharging power parameter ⁇ P bat,max,discharge (step 1312).
- the optimization performed in step 1312 uses the maximum change in charging power parameter ⁇ P bat,max,charge and the maximum change in discharging power parameter ⁇ P bat,max,discharge as the variables to be optimized. Larger values ⁇ P bat,max,charge and ⁇ P bat,max,discharge result in less clipping of the battery power P bat,clip and therefore allow Res FR to closely track the regulation signal Reg signal . Closely tracking the regulation signal Reg signal may result in higher performance scores, thereby increasing the frequency response revenue. However, closely tracking the regulation signal may also increase the cost of battery degradation ⁇ bat .
- ⁇ P bat,max,charge and ⁇ P bat,max,discharge result in more clipping of the battery power P bat,clip and therefore cause Res FR to track the regulation signal Reg signal less closely. Tracking the regulation signal Reg signal less closely may result in lower performance scores, thereby decreasing the frequency response revenue. However, tracking the regulation signal less closely may also decrease the cost of battery degradation ⁇ bat .
- the optimization performed in step 1312 results in values of ⁇ P bat,max,charge and ⁇ P bat,max,discharge that represent an optimal tradeoff between frequency response revenue and battery degradation costs (i.e., the frequency response that maximizes the objective function J).
- the optimization performed in step 1312 optimizes both ⁇ P bat,max,charge and ⁇ P bat,max,discharge simultaneously.
- the optimization may be a multi-variable optimization.
- the optimization can be a single-variable optimization in other embodiments.
- ⁇ P bat,max,charge or ⁇ P bat,max,discharge can be omitted from the optimization such that the optimization is performed using only a single optimization variable.
- the optimization performed in step 1312 may optimize the objective function J using sequential quadratic programming, dynamic programming, or any other optimization technique.
- the present disclosure contemplates methods, systems and program products on any machine-readable media for accomplishing various operations.
- the embodiments of the present disclosure may be implemented using existing computer processors, or by a special purpose computer processor for an appropriate system, incorporated for this or another purpose, or by a hardwired system.
- Embodiments within the scope of the present disclosure include program products comprising machine-readable media for carrying or having machine-executable instructions or data structures stored thereon.
- Such machine-readable media can be any available media that can be accessed by a general purpose or special purpose computer or other machine with a processor.
- machine-readable media can comprise RAM, ROM, EPROM, EEPROM, CD-ROM or other optical disk storage, magnetic disk storage or other magnetic storage devices, or any other medium which can be used to carry or store desired program code in the form of machine-executable instructions or data structures and which can be accessed by a general purpose or special purpose computer or other machine with a processor. Combinations of the above are also included within the scope of machine-readable media.
- Machine-executable instructions include, for example, instructions and data which cause a general purpose computer, special purpose computer, or special purpose processing machines to perform a certain function or group of functions.
Landscapes
- Engineering & Computer Science (AREA)
- Power Engineering (AREA)
- Supply And Distribution Of Alternating Current (AREA)
- Charge And Discharge Circuits For Batteries Or The Like (AREA)
- General Engineering & Computer Science (AREA)
- Physics & Mathematics (AREA)
- General Physics & Mathematics (AREA)
- Automation & Control Theory (AREA)
Abstract
Description
- This application claims the benefit of and priority to
U.S. Application No. 15/887,575, filed February 2nd, 2018 - The present disclosure relates generally to frequency response systems configured to add or remove electricity from an energy grid, and more particularly to a frequency response controller that determines optimal power setpoints for a battery power inverter in a frequency response system.
- Stationary battery storage has several purposes when integrated with campus electrical distribution. For example, battery storage can be used to participate in a local frequency response program. Battery storage can be used to reduce the energy used during times when electricity is expensive and to reduce the electrical demand of a building to reduce the demand charge incurred.
- One implementation of the present disclosure is a frequency response control system including a battery, a power inverter, and a frequency response controller. The battery is configured to store and discharge electric power. The power inverter is configured to control an amount of the electric power stored or discharged from the battery at each of a plurality of time steps during a frequency response period. The frequency response controller includes a high level controller configured to determine values of clipping parameters and a low level controller configured to use the values of the clipping parameters to modify battery power setpoints. The power inverter is configured to use the modified battery power setpoints to control the amount of the electric power stored or discharged from the battery.
- In some embodiments, the high level controller is configured to determine the values of the clipping parameters by generating an objective function that accounts for both frequency response revenue and a cost of battery degradation as a function of the battery power setpoints modified by the clipping parameters and optimizing the objective function to generate the values of the clipping parameters.
- In some embodiments, the clipping parameters include at least one of a battery charging power parameter that defines a maximum allowable rate at which the electric power can be stored in the battery or a battery discharging power parameter that defines a maximum allowable rate at which the electric power can be discharged from the battery.
- In some embodiments, using the values of the clipping parameters to modify the battery power setpoints includes comparing a battery power setpoint to the battery charging power parameter and the battery discharging power parameter, setting the battery power setpoint equal to the battery charging power parameter in response to a determination that the battery power setpoint would cause the battery to charge at a rate that violates the battery charging power parameter, and setting the battery power setpoint equal to the battery discharging power parameter in response to a determination that the battery power setpoint would cause the battery to discharge at a rate that violates the battery discharging power parameter.
- In some embodiments, the clipping parameters include at least one of a change in charging power parameter that defines a maximum change in the amount of electric power stored in the battery between consecutive time steps or a change in discharging power parameter that defines a maximum change in the amount of electric power discharged from the battery between consecutive time steps.
- In some embodiments, using the values of the clipping parameters to modify the battery power setpoints includes calculating a difference between a first battery power setpoint for a first time step and a second battery power setpoint for a second time step consecutive with the first time step, comparing the difference to the change in charging power parameter, and setting the second battery power setpoint equal to the first battery power setpoint plus or minus the change in charging power parameter in response to a determination that the difference exceeds the change in charging power parameter.
- In some embodiments, using the values of the clipping parameters to modify the battery power setpoints includes calculating a difference between a first battery power setpoint for a first time step and a second battery power setpoint for a second time step consecutive with the first time step, comparing the difference to the change in discharging power parameter, and setting the second battery power setpoint equal to the first battery power setpoint plus or minus the change in discharging power parameter in response to a determination that the difference exceeds the change in discharging power parameter.
- In some embodiments, the frequency response controller is configured to receive a frequency regulation signal from an incentive provider and transform the frequency regulation signal into a power signal comprising a time series of the battery power setpoints.
- In some embodiments, the frequency response controller is configured to adjust the modified battery power setpoints to reduce a delay between a first time at which the frequency regulation signal or the power signal has a value of zero and a second time at which the modified battery power setpoints have a value of zero.
- In some embodiments, adjusting the modified battery power setpoints includes predicting a number of time steps between a current time step and a future time step at which the frequency regulation signal or the power signal has a value of zero, setting a zero cross bound based on the predicted number of time steps and a maximum allowable change in the modified battery power setpoints between consecutive time steps, and causing the modified battery power setpoints to begin approaching zero in response to a determination that a modified battery power setpoint for the current time step is outside the zero cross bound.
- Another implementation of the present disclosure is a method for controlling an amount of electric power stored or discharged from a battery in a frequency response control system. The method includes operating a high level controller to determine values of clipping parameters, providing the values of the clipping parameters from the high level controller to a low level controller, operating the low level controller to modify battery power setpoints using the clipping parameters , and using the modified battery power setpoints to control the amount of the electric power stored or discharged from the battery.
- In some embodiments, operating the high level controller to determine the values of the clipping parameters includes generating an objective function that accounts for both frequency response revenue and a cost of battery degradation as a function of the battery power setpoints modified by the clipping parameters and optimizing the objective function to generate the values of the clipping parameters.
- In some embodiments, the clipping parameters include at least one of a battery charging power parameter that defines a maximum allowable rate at which the electric power can be stored in the battery or a battery discharging power parameter that defines a maximum allowable rate at which the electric power can be discharged from the battery.
- In some embodiments, using the values of the clipping parameters to modify the battery power setpoints includes comparing a battery power setpoint to the battery charging power parameter and the battery discharging power parameter, setting the battery power setpoint equal to the battery charging power parameter in response to a determination that the battery power setpoint would cause the battery to charge at a rate that violates the battery charging power parameter, and setting the battery power setpoint equal to the battery discharging power parameter in response to a determination that the battery power setpoint would cause the battery to discharge at a rate that violates the battery discharging power parameter.
- In some embodiments, the clipping parameters include at least one of a change in charging power parameter that defines a maximum change in the amount of electric power stored in the battery between consecutive time steps or a change in discharging power parameter that defines a maximum change in the amount of electric power discharged from the battery between consecutive time steps.
- In some embodiments, using the values of the clipping parameters to modify the battery power setpoints includes calculating a difference between a first battery power setpoint for a first time step and a second battery power setpoint for a second time step consecutive with the first time step, comparing the difference to the change in charging power parameter, and setting the second battery power setpoint equal to the first battery power setpoint plus or minus the change in charging power parameter in response to a determination that the difference exceeds the change in charging power parameter.
- In some embodiments, using the values of the clipping parameters to modify the battery power setpoints includes calculating a difference between a first battery power setpoint for a first time step and a second battery power setpoint for a second time step consecutive with the first time step, comparing the difference to the change in discharging power parameter, and setting the second battery power setpoint equal to the first battery power setpoint plus or minus the change in discharging power parameter in response to a determination that the difference exceeds the change in discharging power parameter.
- In some embodiments, the method includes receiving a frequency regulation signal from an incentive provider and transforming the frequency regulation signal into a power signal comprising a time series of the battery power setpoints.
- In some embodiments, the method includes adjusting the modified battery power setpoints to reduce a delay between a first time at which the frequency regulation signal or the power signal has a value of zero and a second time at which the modified battery power setpoints have a value of zero.
- In some embodiments, adjusting the modified battery power setpoints includes predicting a number of time steps between a current time step and a future time step at which the frequency regulation signal or the power signal has a value of zero, setting a zero cross bound based on the predicted number of time steps and a maximum allowable change in the modified battery power setpoints between consecutive time steps, and causing the modified battery power setpoints to begin approaching zero in response to a determination that a modified battery power setpoint for the current time step is outside the zero cross bound.
- Another implementation of the present disclosure is a multi-building management system. The system includes building equipment that operate to affect a variable state or condition within one or more buildings, a battery configured to store and discharge electric power for use in powering at least one of the building equipment or the one or more buildings, a power inverter configured to control an amount of the electric power stored or discharged from the battery at each of a plurality of time steps during a frequency response period, and a frequency response controller. The frequency response controller includes a high level controller configured to determine values of clipping parameters and a low level controller configured to use the values of the clipping parameters to modify battery power setpoints. The power inverter is configured to use the modified battery power setpoints to control the amount of the electric power stored or discharged from the battery.
- In some embodiments, the high level controller is configured to determine the values of the clipping parameters by generating an objective function that accounts for both frequency response revenue and a cost of battery degradation as a function of the battery power setpoints modified by the clipping parameters and optimizing the objective function to generate the values of the clipping parameters.
- In some embodiments, the clipping parameters include at least one of a battery charging power parameter that defines a maximum allowable rate at which the electric power can be stored in the battery or a battery discharging power parameter that defines a maximum allowable rate at which the electric power can be discharged from the battery.
- In some embodiments, using the values of the clipping parameters to modify the battery power setpoints includes comparing a battery power setpoint to the battery charging power parameter and the battery discharging power parameter, setting the battery power setpoint equal to the battery charging power parameter in response to a determination that the battery power setpoint would cause the battery to charge at a rate that violates the battery charging power parameter, and setting the battery power setpoint equal to the battery discharging power parameter in response to a determination that the battery power setpoint would cause the battery to discharge at a rate that violates the battery discharging power parameter.
- In some embodiments, the clipping parameters include at least one of a change in charging power parameter that defines a maximum change in the amount of electric power stored in the battery between consecutive time steps or a change in discharging power parameter that defines a maximum change in the amount of electric power discharged from the battery between consecutive time steps.
- In some embodiments, using the values of the clipping parameters to modify the battery power setpoints includes calculating a difference between a first battery power setpoint for a first time step and a second battery power setpoint for a second time step consecutive with the first time step, comparing the difference to the change in charging power parameter, and setting the second battery power setpoint equal to the first battery power setpoint plus or minus the change in charging power parameter in response to a determination that the difference exceeds the change in charging power parameter.
- In some embodiments, using the values of the clipping parameters to modify the battery power setpoints includes calculating a difference between a first battery power setpoint for a first time step and a second battery power setpoint for a second time step consecutive with the first time step, comparing the difference to the change in discharging power parameter, and setting the second battery power setpoint equal to the first battery power setpoint plus or minus the change in discharging power parameter in response to a determination that the difference exceeds the change in discharging power parameter.
- In some embodiments, the frequency response controller is configured to receive a frequency regulation signal from an incentive provider and transform the frequency regulation signal into a power signal comprising a time series of the battery power setpoints.
- In some embodiments, the frequency response controller is configured to adjust the modified battery power setpoints to reduce a delay between a first time at which the frequency regulation signal or the power signal has a value of zero and a second time at which the modified battery power setpoints have a value of zero.
- In some embodiments, adjusting the modified battery power setpoints includes predicting a number of time steps between a current time step and a future time step at which the frequency regulation signal or the power signal has a value of zero, setting a zero cross bound based on the predicted number of time steps and a maximum allowable change in the modified battery power setpoints between consecutive time steps, and causing the modified battery power setpoints to begin approaching zero in response to a determination that a modified battery power setpoint for the current time step is outside the zero cross bound.
- Those skilled in the art will appreciate that the summary is illustrative only and is not intended to be in any way limiting. Other aspects, inventive features, and advantages of the devices and/or processes described herein, as defined solely by the claims, will become apparent in the detailed description set forth herein and taken in conjunction with the accompanying drawings.
-
-
FIG. 1 is a block diagram of a frequency response optimization system, according to an exemplary embodiment. -
FIG. 2 is a graph of a regulation signal which may be provided to the system ofFIG. 1 and a frequency response signal which may be generated by the system ofFIG. 1 , according to an exemplary embodiment. -
FIG. 3 is a block diagram illustrating the frequency response controller ofFIG. 1 in greater detail, according to an exemplary embodiment. -
FIG. 4A is a block diagram illustrating the high level controller ofFIG. 3 in greater detail, according to an exemplary embodiment. -
FIG. 4B is a block diagram illustrating the clipping parameter optimizer ofFIG. 4A in greater detail, according to an exemplary embodiment. -
FIG. 5A is a block diagram illustrating the low level controller ofFIG. 3 in greater detail, according to an exemplary embodiment. -
FIG. 5B is a block diagram illustrating the battery power signal clipper ofFIG. 5A in greater detail, according to an exemplary embodiment. -
FIG. 6 is a graph illustrating the adjustments to the power signal performed by the maximum power adjuster ofFIG. 5B , according to an exemplary embodiment. -
FIG. 7 is a graph illustrating the adjustments to the power signal performed by the maximum power change adjuster ofFIG. 5B , according to an exemplary embodiment. -
FIG. 8 is a graph illustrating the adjustments to the power signal performed by the zero cross adjuster ofFIG. 5B , according to an exemplary embodiment. -
FIG. 9 is a graph illustrating the adjustments to the power signal performed by the maximum sustained power adjuster ofFIG. 5B , according to an exemplary embodiment. -
FIG. 10 is a graph illustrating the adjustments to the power signal performed by the maximum sustained effort adjuster ofFIG. 5B , according to an exemplary embodiment. -
FIG. 11 is a flowchart of a process for controlling an amount of power stored or discharged from a battery in a frequency response control system, according to an exemplary embodiment. -
FIG. 12 is a flowchart of a process for generating optimal values of a maximum battery charging power parameter and a maximum battery discharging power parameter, according to an exemplary embodiment. -
FIG. 13 is a flowchart of a process for generating optimal values of a maximum change in charging power parameter and a maximum change in discharging power parameter, according to an exemplary embodiment. - Referring to
FIG. 1 , a frequencyresponse optimization system 100 is shown, according to an exemplary embodiment.System 100 is shown to include acampus 102 and anenergy grid 104.Campus 102 may include one ormore buildings 116 that receive power fromenergy grid 104.Buildings 116 may include equipment or devices that consume electricity during operation. For example,buildings 116 may include HVAC equipment, lighting equipment, security equipment, communications equipment, vending machines, computers, electronics, elevators, or other types of building equipment. In some embodiments,buildings 116 are served by a building management system (BMS). A BMS is, in general, a system of devices configured to control, monitor, and manage equipment in or around a building or building area. A BMS can include, for example, a HVAC system, a security system, a lighting system, a fire alerting system, and/or any other system that is capable of managing building functions or devices. An exemplary building management system which may be used to monitor and controlbuildings 116 is described inU.S. Patent Application No. 14/717,593 - In some embodiments,
campus 102 includes a central plant 118. Central plant 118 may include one or more subplants that consume resources from utilities (e.g., water, natural gas, electricity, etc.) to satisfy the loads ofbuildings 116. For example, central plant 118 may include a heater subplant, a heat recovery chiller subplant, a chiller subplant, a cooling tower subplant, a hot thermal energy storage (TES) subplant, and a cold thermal energy storage (TES) subplant, a steam subplant, and/or any other type of subplant configured to servebuildings 116. The subplants may be configured to convert input resources (e.g., electricity, water, natural gas, etc.) into output resources (e.g., cold water, hot water, chilled air, heated air, etc.) that are provided tobuildings 116. An exemplary central plant which may be used to satisfy the loads ofbuildings 116 is describedU.S. Patent Application No. 14/634,609 - In some embodiments,
campus 102 includesenergy generation 120.Energy generation 120 may be configured to generate energy that can be used bybuildings 116, used by central plant 118, and/or provided toenergy grid 104. In some embodiments,energy generation 120 generates electricity. For example,energy generation 120 may include an electric power plant, a photovoltaic energy field, or other types of systems or devices that generate electricity. The electricity generated byenergy generation 120 can be used internally by campus 102 (e.g., bybuildings 116 and/or central plant 118) to decrease the amount of electric power thatcampus 102 receives from outside sources such asenergy grid 104 orbattery 108. If the amount of electricity generated byenergy generation 120 exceeds the electric power demand ofcampus 102, the excess electric power can be provided toenergy grid 104 or stored inbattery 108. The power output ofcampus 102 is shown inFIG. 1 as P campus· Pcampus may be positive ifcampus 102 is outputting electric power or negative ifcampus 102 is receiving electric power. - Still referring to
FIG. 1 ,system 100 is shown to include apower inverter 106 and abattery 108.Power inverter 106 may be configured to convert electric power between direct current (DC) and alternating current (AC). For example,battery 108 may be configured to store and output DC power, whereasenergy grid 104 andcampus 102 may be configured to consume and generate AC power.Power inverter 106 may be used to convert DC power frombattery 108 into a sinusoidal AC output synchronized to the grid frequency ofenergy grid 104.Power inverter 106 may also be used to convert AC power fromcampus 102 orenergy grid 104 into DC power that can be stored inbattery 108. The power output ofbattery 108 is shown as Pbat. Pbat may be positive ifbattery 108 is providing power topower inverter 106 or negative ifbattery 108 is receiving power frompower inverter 106. - In some instances,
power inverter 106 receives a DC power output frombattery 108 and converts the DC power output to an AC power output that can be fed intoenergy grid 104.Power inverter 106 may synchronize the frequency of the AC power output with that of energy grid 104 (e.g., 50 Hz or 60 Hz) using a local oscillator and may limit the voltage of the AC power output to no higher than the grid voltage. In some embodiments,power inverter 106 is a resonant inverter that includes or uses LC circuits to remove the harmonics from a simple square wave in order to achieve a sine wave matching the frequency ofenergy grid 104. In various embodiments,power inverter 106 may operate using high-frequency transformers, low-frequency transformers, or without transformers. Low-frequency transformers may convert the DC output frombattery 108 directly to the AC output provided toenergy grid 104. High-frequency transformers may employ a multi-step process that involves converting the DC output to high-frequency AC, then back to DC, and then finally to the AC output provided toenergy grid 104. -
System 100 is shown to include a point of interconnection (POI) 110.POI 110 is the point at whichcampus 102,energy grid 104, andpower inverter 106 are electrically connected. The power supplied toPOI 110 frompower inverter 106 is shown as Psup. Psup may be defined as Pbat + Ploss, where Pbat is the battery power and P loss is the power loss in the battery system (e.g., losses inpower inverter 106 and/or battery 108). Psup may be positive ispower inverter 106 is providing power toPOI 110 or negative ifpower inverter 106 is receiving power fromPOI 110. Pcampus and Psup combine atPOI 110 to form PPOI. PPOI may be defined as the power provided toenergy grid 104 fromPOI 110. PPOI may be positive ifPOI 110 is providing power toenergy grid 104 or negative ifPOI 110 is receiving power fromenergy grid 104. - Still referring to
FIG. 1 ,system 100 is shown to include afrequency response controller 112.Controller 112 may be configured to generate and provide power setpoints topower inverter 106.Power inverter 106 may use the power setpoints to control the amount of power Psup provided toPOI 110 or drawn fromPOI 110. For example,power inverter 106 may be configured to draw power fromPOI 110 and store the power inbattery 108 in response to receiving a negative power setpoint fromcontroller 112. Conversely,power inverter 106 may be configured to draw power frombattery 108 and provide the power toPOI 110 in response to receiving a positive power setpoint fromcontroller 112. The magnitude of the power setpoint may define the amount of power Psup provided to or frompower inverter 106.Controller 112 may be configured to generate and provide power setpoints that optimize the value ofoperating system 100 over a time horizon. - In some embodiments,
frequency response controller 112 usespower inverter 106 andbattery 108 to perform frequency regulation forenergy grid 104. Frequency regulation is the process of maintaining the stability of the grid frequency (e.g., 60 Hz in the United States). The grid frequency may remain stable and balanced as long as the total electric supply and demand ofenergy grid 104 are balanced. Any deviation from that balance may result in a deviation of the grid frequency from its desirable value. For example, an increase in demand may cause the grid frequency to decrease, whereas an increase in supply may cause the grid frequency to increase.Frequency response controller 112 may be configured to offset a fluctuation in the grid frequency by causingpower inverter 106 to supply energy frombattery 108 to energy grid 104 (e.g., to offset a decrease in grid frequency) or store energy fromenergy grid 104 in battery 108 (e.g., to offset an increase in grid frequency). - In some embodiments,
frequency response controller 112 usespower inverter 106 andbattery 108 to perform load shifting forcampus 102. For example,controller 112 may causepower inverter 106 to store energy inbattery 108 when energy prices are low and retrieve energy frombattery 108 when energy prices are high in order to reduce the cost of electricity required topower campus 102. Load shifting may also allowsystem 100 reduce the demand charge incurred. Demand charge is an additional charge imposed by some utility providers based on the maximum power consumption during an applicable demand charge period. For example, a demand charge rate may be specified in terms of dollars per unit of power (e.g., $/kW) and may be multiplied by the peak power usage (e.g., kW) during a demand charge period to calculate the demand charge. Load shifting may allowsystem 100 to smooth momentary spikes in the electric demand ofcampus 102 by drawing energy frombattery 108 in order to reduce peak power draw fromenergy grid 104, thereby decreasing the demand charge incurred. - Still referring to
FIG. 1 ,system 100 is shown to include anincentive provider 114.Incentive provider 114 may be a utility (e.g., an electric utility), a regional transmission organization (RTO), an independent system operator (ISO), or any other entity that provides incentives for performing frequency regulation. For example,incentive provider 114 may providesystem 100 with monetary incentives for participating in a frequency response program. In order to participate in the frequency response program,system 100 may maintain a reserve capacity of stored energy (e.g., in battery 108) that can be provided toenergy grid 104.System 100 may also maintain the capacity to draw energy fromenergy grid 104 and store the energy inbattery 108. Reserving both of these capacities may be accomplished by managing the state-of-charge ofbattery 108. -
Frequency response controller 112 may provideincentive provider 114 with a price bid and a capability bid. The price bid may include a price per unit power (e.g., $/MW) for reserving or storing power that allowssystem 100 to participate in a frequency response program offered byincentive provider 114. The price per unit power bid byfrequency response controller 112 is referred to herein as the "capability price." The price bid may also include a price for actual performance, referred to herein as the "performance price." The capability bid may define an amount of power (e.g., MW) thatsystem 100 will reserve or store inbattery 108 to perform frequency response, referred to herein as the "capability bid." -
Incentive provider 114 may providefrequency response controller 112 with a capability clearing price CPcap, a performance clearing price CPperf, and a regulation award Regaward, which correspond to the capability price, the performance price, and the capability bid, respectively. In some embodiments, CPcap, CPperf, and Regaward are the same as the corresponding bids placed bycontroller 112. In other embodiments, CPcap, CPperf, and Regaward may not be the same as the bids placed bycontroller 112. For example, CPcap, CPperf, and Regaward may be generated byincentive provider 114 based on bids received from multiple participants in the frequency response program.Controller 112 may use CPcap, CPperf, and Regaward to perform frequency regulation, described in greater detail below. -
Frequency response controller 112 is shown receiving a regulation signal fromincentive provider 114. The regulation signal may specify a portion of the regulation award Regaward thatfrequency response controller 112 is to add or remove fromenergy grid 104. In some embodiments, the regulation signal is a normalized signal (e.g., between -1 and 1) specifying a proportion of Regaward. Positive values of the regulation signal may indicate an amount of power to add toenergy grid 104, whereas negative values of the regulation signal may indicate an amount of power to remove fromenergy grid 104. -
Frequency response controller 112 may respond to the regulation signal by generating an optimal power setpoint forpower inverter 106. The optimal power setpoint may take into account both the potential revenue from participating in the frequency response program and the costs of participation. Costs of participation may include, for example, a monetized cost of battery degradation as well as the energy and demand charges that will be incurred. The optimization may be performed using sequential quadratic programming, dynamic programming, or any other optimization technique. - In some embodiments,
controller 112 uses a battery life model to quantify and monetize battery degradation as a function of the power setpoints provided topower inverter 106. Advantageously, the battery life model allowscontroller 112 to perform an optimization that weighs the revenue generation potential of participating in the frequency response program against the cost of battery degradation and other costs of participation (e.g., less battery power available forcampus 102, increased electricity costs, etc.). An exemplary regulation signal and power response are described in greater detail with reference toFIG. 2 . - Referring now to
FIG. 2 , a pair offrequency response graphs Graph 200 illustrates aregulation signal Reg signal 202 as a function of time.Reg signal 202 is shown as a normalized signal ranging from -1 to 1 (i.e., -1 ≤ Regsignal ≤ 1).Reg signal 202 may be generated byincentive provider 114 and provided tofrequency response controller 112.Reg signal 202 may define a proportion of theregulation award Reg award 254 thatcontroller 112 is to add or remove fromenergy grid 104, relative to a baseline value referred to as themidpoint b 256. For example, if the value ofReg award 254 is 10 MW, a regulation signal value of 0.5 (i.e., Regsignal = 0.5) may indicate thatsystem 100 is requested to add 5 MW of power atPOI 110 relative to midpoint b (e.g.,
system 100 is requested to remove 3 MW of power fromPOI 110 relative to midpoint b (e.g.,
-
Graph 250 illustrates the desired interconnection power
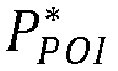
frequency response controller 112 based onReg signal 202,Reg award 254, and amidpoint b 256. For example,controller 112 may calculate


controller 112 and may represent the midpoint of regulation around which the load is modified in response toReg signal 202. Optimal adjustment of midpoint b may allowcontroller 112 to actively participate in the frequency response market while also taking into account the energy and demand charge that will be incurred. - In order to participate in the frequency response market,
controller 112 may perform several tasks.Controller 112 may generate a price bid (e.g., $/MW) that includes the capability price and the performance price. In some embodiments,controller 112 sends the price bid toincentive provider 114 at approximately 15:30 each day and the price bid remains in effect for the entirety of the next day. Prior to beginning a frequency response period,controller 112 may generate the capability bid (e.g., MW) and send the capability bid toincentive provider 114. In some embodiments,controller 112 generates and sends the capability bid toincentive provider 114 approximately 1.5 hours before a frequency response period begins. In an exemplary embodiment, each frequency response period has a duration of one hour; however, it is contemplated that frequency response periods may have any duration. - At the start of each frequency response period,
controller 112 may generate the midpoint b around whichcontroller 112 plans to perform frequency regulation. In some embodiments,controller 112 generates a midpoint b that will maintainbattery 108 at a constant state-of-charge (SOC) (i.e. a midpoint that will result inbattery 108 having the same SOC at the beginning and end of the frequency response period). In other embodiments,controller 112 generates midpoint b using an optimization procedure that allows the SOC ofbattery 108 to have different values at the beginning and end of the frequency response period. For example,controller 112 may use the SOC ofbattery 108 as a constrained variable that depends on midpoint b in order to optimize a value function that takes into account frequency response revenue, energy costs, and the cost of battery degradation. Exemplary processes for calculating and/or optimizing midpoint b under both the constant SOC scenario and the variable SOC scenario are described in greater detail with reference toFIGS. 3-4A . - During each frequency response period,
controller 112 may periodically generate a power setpoint forpower inverter 106. For example,controller 112 may generate a power setpoint for each time step in the frequency response period. In some embodiments,controller 112 generates the power setpoints using the equation:
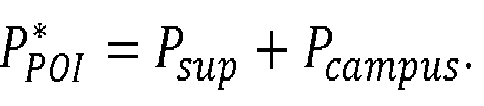

POI 110 toenergy grid 104. Positive values of Psup and Pcampus indicate energy flow toPOI 110 frompower inverter 106 andcampus 102, respectively. In other embodiments,controller 112 generates the power setpoints using the equation:
Controller 112 may subtract Pcampus from

power inverter 106 indicates the amount of power thatpower inverter 106 is to add to POI 110 (if the power setpoint is positive) or remove from POI 110 (if the power setpoint is negative). - Referring now to
FIG. 3 , a block diagram illustratingfrequency response controller 112 in greater detail is shown, according to an exemplary embodiment.Frequency response controller 112 may be configured to perform an optimization process to generate values for the bid price, the capability bid, and the midpoint b. In some embodiments,frequency response controller 112 generates values for the bids and the midpoint b periodically using a predictive optimization scheme (e.g., once every half hour, once per frequency response period, etc.).Controller 112 may also calculate and update power setpoints forpower inverter 106 periodically during each frequency response period (e.g., once every two seconds). - In some embodiments, the interval at which
controller 112 generates power setpoints forpower inverter 106 is significantly shorter than the interval at whichcontroller 112 generates the bids and the midpoint b. For example,controller 112 may generate values for the bids and the midpoint b every half hour, whereascontroller 112 may generate a power setpoint forpower inverter 106 every two seconds. The difference in these time scales allowscontroller 112 to use a cascaded optimization process to generate optimal bids, midpoints b, and power setpoints. - In the cascaded optimization process, a
high level controller 312 determines optimal values for the bid price, the capability bid, and the midpoint b by performing a high level optimization.High level controller 312 may select midpoint b to maintain a constant state-of-charge in battery 108 (i.e., the same state-of-charge at the beginning and end of each frequency response period) or to vary the state-of-charge in order to optimize the overall value of operating system 100 (e.g., frequency response revenue minus energy costs and battery degradation costs).High level controller 312 may also determine filter parameters for a signal filter (e.g., a low pass filter) used by alow level controller 314. -
Low level controller 314 uses the midpoint b and the filter parameters fromhigh level controller 312 to perform a low level optimization in order to generate the power setpoints forpower inverter 106. Advantageously,low level controller 314 may determine how closely to track the desired power
interconnection 110. For example, the low level optimization performed bylow level controller 314 may consider not only frequency response revenue but also the costs of the power setpoints in terms of energy costs and battery degradation. In some instances,low level controller 314 may determine that it is deleterious tobattery 108 to follow the regulation exactly and may sacrifice a portion of the frequency response revenue in order to preserve the life ofbattery 108. The cascaded optimization process is described in greater detail below. - Still referring to
FIG. 3 ,frequency response controller 112 is shown to include acommunications interface 302 and aprocessing circuit 304. Communications interface 302 may include wired or wireless interfaces (e.g., jacks, antennas, transmitters, receivers, transceivers, wire terminals, etc.) for conducting data communications with various systems, devices, or networks. For example,communications interface 302 may include an Ethernet card and port for sending and receiving data via an Ethernet-based communications network and/or a WiFi transceiver for communicating via a wireless communications network. Communications interface 302 may be configured to communicate via local area networks or wide area networks (e.g., the Internet, a building WAN, etc.) and may use a variety of communications protocols (e.g., BACnet, IP, LON, etc.). - Communications interface 302 may be a network interface configured to facilitate electronic data communications between
frequency response controller 112 and various external systems or devices (e.g.,campus 102,energy grid 104,power inverter 106,incentive provider 114,utilities 320,weather service 322, etc.). For example,frequency response controller 112 may receive inputs fromincentive provider 114 indicating an incentive event history (e.g., past clearing prices, mileage ratios, participation requirements, etc.) and a regulation signal.Controller 112 may receive a campus power signal fromcampus 102, utility rates fromutilities 320, and weather forecasts fromweather service 322 viacommunications interface 302.Controller 112 may provide a price bid and a capability bid toincentive provider 114 and may provide power setpoints topower inverter 106 viacommunications interface 302. - Still referring to
FIG. 3 ,processing circuit 304 is shown to include aprocessor 306 andmemory 308.Processor 306 may be a general purpose or specific purpose processor, an application specific integrated circuit (ASIC), one or more field programmable gate arrays (FPGAs), a group of processing components, or other suitable processing components.Processor 306 may be configured to execute computer code or instructions stored inmemory 308 or received from other computer readable media (e.g., CDROM, network storage, a remote server, etc.). -
Memory 308 may include one or more devices (e.g., memory units, memory devices, storage devices, etc.) for storing data and/or computer code for completing and/or facilitating the various processes described in the present disclosure.Memory 308 may include random access memory (RAM), read-only memory (ROM), hard drive storage, temporary storage, non-volatile memory, flash memory, optical memory, or any other suitable memory for storing software objects and/or computer instructions.Memory 308 may include database components, object code components, script components, or any other type of information structure for supporting the various activities and information structures described in the present disclosure.Memory 308 may be communicably connected toprocessor 306 viaprocessing circuit 304 and may include computer code for executing (e.g., by processor 306) one or more processes described herein. - Still referring to
FIG. 3 ,frequency response controller 112 is shown to include a load/rate predictor 310. Load/rate predictor 310 may be configured to predict the electric load of campus 102 (i.e., P̂campus ) for each time step k (e.g., k = 1 ... n) within an optimization window. Load/rate predictor 310 is shown receiving weather forecasts from aweather service 322. In some embodiments, load/rate predictor 310 predicts P̂campus as a function of the weather forecasts. In some embodiments, load/rate predictor 310 uses feedback fromcampus 102 to predict P̂campus .Feedback fromcampus 102 may include various types of sensory inputs (e.g., temperature, flow, humidity, enthalpy, etc.) or other data relating tobuildings 116, central plant 118, and/or energy generation 120 (e.g., inputs from a HVAC system, a lighting control system, a security system, a water system, a PV energy system, etc.). Load/rate predictor 310 may predict one or more different types of loads forcampus 102. For example, load/rate predictor 310 may predict a hot water load, a cold water load, and/or an electric load for each time step k within the optimization window. - In some embodiments, load/
rate predictor 310 receives a measured electric load and/or previous measured load data fromcampus 102. For example, load/rate predictor 310 is shown receiving a campus power signal fromcampus 102. The campus power signal may indicate the measured electric load ofcampus 102. Load/rate predictor 310 may predict one or more statistics of the campus power signal including, for example, a mean campus power µcampus and a standard deviation of the campus power σcampus . Load/rate predictor 310 may predict P̂campus as a function of a given weather forecast (φ̂w ), a day type (day), the time of day (t), and previous measured load data (Y k-1). Such a relationship is expressed in the following equation:
- In some embodiments, load/
rate predictor 310 uses a deterministic plus stochastic model trained from historical load data to predict P̂campus . Load/rate predictor 310 may use any of a variety of prediction methods to predict P̂campus (e.g., linear regression for the deterministic portion and an AR model for the stochastic portion). In some embodiments, load/rate predictor 310 makes load/rate predictions using the techniques described inU.S. Patent Application No. 14/717,593 - Load/
rate predictor 310 is shown receiving utility rates fromutilities 320. Utility rates may indicate a cost or price per unit of a resource (e.g., electricity, natural gas, water, etc.) provided byutilities 320 at each time step k in the optimization window. In some embodiments, the utility rates are time-variable rates. For example, the price of electricity may be higher at certain times of day or days of the week (e.g., during high demand periods) and lower at other times of day or days of the week (e.g., during low demand periods). The utility rates may define various time periods and a cost per unit of a resource during each time period. Utility rates may be actual rates received fromutilities 320 or predicted utility rates estimated by load/rate predictor 310. - In some embodiments, the utility rates include demand charges for one or more resources provided by
utilities 320. A demand charge may define a separate cost imposed byutilities 320 based on the maximum usage of a particular resource (e.g., maximum energy consumption) during a demand charge period. The utility rates may define various demand charge periods and one or more demand charges associated with each demand charge period. In some instances, demand charge periods may overlap partially or completely with each other and/or with the prediction window. Advantageously,frequency response controller 112 may be configured to account for demand charges in the high level optimization process performed byhigh level controller 312.Utilities 320 may be defined by time-variable (e.g., hourly) prices, a maximum service level (e.g., a maximum rate of consumption allowed by the physical infrastructure or by contract) and, in the case of electricity, a demand charge or a charge for the peak rate of consumption within a certain period. Load/rate predictor 310 may store the predicted campus power P̂ampus and the utility rates inmemory 308 and/or provide the predicted campus power P̂campus and the utility rates tohigh level controller 312. - Still referring to
FIG. 3 ,frequency response controller 112 is shown to include anenergy market predictor 316 and asignal statistics predictor 318.Energy market predictor 316 may be configured to predict energy market statistics relating to the frequency response program. For example,energy market predictor 316 may predict the values of one or more variables that can be used to estimate frequency response revenue. In some embodiments, the frequency response revenue is defined by the following equation:
controller 112 tracks the regulation signal.Energy market predictor 316 may be configured to predict the capability clearing price CPcap , the performance clearing price CPperf, the mileage ratio MR, and/or other energy market statistics that can be used to estimate frequency response revenue.Energy market predictor 316 may store the energy market statistics inmemory 308 and/or provide the energy market statistics tohigh level controller 312. -
Signal statistics predictor 318 may be configured to predict one or more statistics of the regulation signal provided byincentive provider 114. For example,signal statistics predictor 318 may be configured to predict the mean µFR , standard deviation σFR, and/or other statistics of the regulation signal. The regulation signal statistics may be based on previous values of the regulation signal (e.g., a historical mean, a historical standard deviation, etc.) or predicted values of the regulation signal (e.g., a predicted mean, a predicted standard deviation, etc.). - In some embodiments,
signal statistics predictor 318 uses a deterministic plus stochastic model trained from historical regulation signal data to predict future values of the regulation signal. For example,signal statistics predictor 318 may use linear regression to predict a deterministic portion of the regulation signal and an AR model to predict a stochastic portion of the regulation signal. In some embodiments,signal statistics predictor 318 predicts the regulation signal using the techniques described inU.S. Patent Application No. 14/717,593 Signal statistics predictor 318 may use the predicted values of the regulation signal to calculate the regulation signal statistics.Signal statistics predictor 318 may store the regulation signal statistics inmemory 308 and/or provide the regulation signal statistics tohigh level controller 312. - Still referring to
FIG. 3 ,frequency response controller 112 is shown to include ahigh level controller 312.High level controller 312 may be configured to generate values for the midpoint b and the capability bid Regaward. In some embodiments,high level controller 312 determines a midpoint b that will causebattery 108 to have the same state-of-charge (SOC) at the beginning and end of each frequency response period. In other embodiments,high level controller 312 performs an optimization process to generate midpoint b and Regaward. For example,high level controller 312 may generate midpoint b using an optimization procedure that allows the SOC ofbattery 108 to vary and/or have different values at the beginning and end of the frequency response period.High level controller 312 may use the SOC ofbattery 108 as a constrained variable that depends on midpoint b in order to optimize a value function that takes into account frequency response revenue, energy costs, and the cost of battery degradation. Both of these embodiments are described in greater detail with reference toFIG. 4A . -
High level controller 312 may determine midpoint b by equating the desired power
POI 110 with the actual power atPOI 110 as shown in the following equation:

POI 110 and the right side of the equation is the actual power atPOI 110. Integrating over the frequency response period results in the following equation:
- For embodiments in which the SOC of
battery 108 is maintained at the same value at the beginning and end of the frequency response period, the integral of the battery power Pbat over the frequency response period is zero (i.e., ∫Pbatdt = 0). Accordingly, the previous equation can be rewritten as follows:
battery 108 at a constant value (and near 50%) will allowsystem 100 to participate in the frequency market during all hours of the day. -
High level controller 312 may use the estimated values of the campus power signal received fromcampus 102 to predict the value of ∫Pcampusdt over the frequency response period. Similarly,high level controller 312 may use the estimated values of the regulation signal fromincentive provider 114 to predict the value of ∫Regsignaldt over the frequency response period.High level controller 312 may estimate the value of f Ploss dt using a Thevinin equivalent circuit model of battery 108 (described in greater detail with reference toFIG. 4A ). This allowshigh level controller 312 to estimate the integral ∫Ploss dt as a function of other variables such as Regaward, Regsignal, Pcampus, and midpoint b. - After substituting known and estimated values, the preceding equation can be rewritten as follows:

High level controller 312 may solve the equation for midpoint b to determine the midpoint b that maintainsbattery 108 at a constant state-of-charge. - For embodiments in which the SOC of
battery 108 is treated as a variable, the SOC ofbattery 108 may be allowed to have different values at the beginning and end of the frequency response period. Accordingly, the integral of the battery power Pbat over the frequency response period can be expressed as -ΔSOC · Cdes as shown in the following equation:
battery 108 over the frequency response period and Cdes is the design capacity ofbattery 108. The SOC ofbattery 108 may be a normalized variable (i.e., 0 ≤ SOC ≤ 1) such that the term SOC · Cdes represents the amount of energy stored inbattery 108 for a given state-of-charge. The SOC is shown as a negative value because drawing energy from battery 108 (i.e., a positive Pbat ) decreases the SOC ofbattery 108. The equation for midpoint b becomes:
- After substituting known and estimated values, the preceding equation can be rewritten as follows:

High level controller 312 may solve the equation for midpoint b in terms of ΔSOC. -
High level controller 312 may perform an optimization to find optimal midpoints b for each frequency response period within an optimization window (e.g., each hour for the next day) given the electrical costs over the optimization window. Optimal midpoints b may be the midpoints that maximize an objective function that includes both frequency response revenue and costs of electricity and battery degradation. For example, an objective function J can be written as:
energy grid 104 is represented as a negative power and therefore will result in negative value (i.e., a cost) in the objective function. The demand charge is expressed as a minimum for the same reason (i.e., the most negative power value represents maximum power draw from energy grid 104). -
High level controller 312 may estimate the frequency response revenue Rev(Regaward,k) as a function of the midpoints b. In some embodiments,high level controller 312 estimates frequency response revenue using the following equation:
energy market predictor 316 and Regaward is a function of the midpoint b. For example,high level controller 312 may place a bid that is as large as possible for a given midpoint, as shown in the following equation:
power inverter 106. Advantageously, selecting Regaward as a function of midpoint b allowshigh level controller 312 to predict the frequency response revenue that will result from a given midpoint b. -
High level controller 312 may estimate the cost of battery degradation λbat as a function of the midpoints b. For example,high level controller 312 may use a battery life model to predict a loss in battery capacity that will result from a set of midpoints b, power outputs, and/or other variables that can be manipulated bycontroller 112. In some embodiments, the battery life model expresses the loss in battery capacity Closs,add as a sum of multiple piecewise linear functions, as shown in the following equation:


battery 108. Each of these terms is described in greater detail with reference toFIG. 4A . Advantageously, several of the terms in the battery life model depend on the midpoints b and power setpoints selected bycontroller 112. This allowshigh level controller 312 to predict a loss in battery capacity that will result from a given set of control outputs.High level controller 312 may monetize the loss in battery capacity and include the monetized cost of battery degradation λbat in the objective function J. - In some embodiments,
high level controller 312 generates a set of filter parameters forlow level controller 314. The filter parameters may be used bylow level controller 314 as part of a low-pass filter that removes high frequency components from the regulation signal. In some embodiments,high level controller 312 generates a set of filter parameters that transform the regulation signal into an optimal frequency response signal ResFR. For example,high level controller 312 may perform a second optimization process to determine an optimal frequency response ResFR based on the optimized values for Regaward and midpoint b. - In some embodiments,
high level controller 312 determines the optimal frequency response ResFR by optimizing value function J with the frequency response revenue Rev(Regaward ) defined as follows:
High level controller 312 may use the optimized frequency response ResFR to generate a set of filter parameters forlow level controller 314. These and other features ofhigh level controller 312 are described in greater detail with reference toFIG. 4A . - Still referring to
FIG. 3 ,frequency response controller 112 is shown to include alow level controller 314.Low level controller 314 is shown receiving the midpoints b and the filter parameters fromhigh level controller 312.Low level controller 314 may also receive the campus power signal fromcampus 102 and the regulation signal fromincentive provider 114.Low level controller 314 may use the regulation signal to predict future values of the regulation signal and may filter the predicted regulation signal using the filter parameters provided byhigh level controller 312. -
Low level controller 314 may use the filtered regulation signal to determine optimal power setpoints forpower inverter 106. For example,low level controller 314 may use the filtered regulation signal to calculate the desired interconnection power

Low level controller 314 may subtract the campus power Pcampus from the desired interconnection power
power inverter 106, as shown in the following equation:
- In some embodiments,
low level controller 314 performs an optimization to determine how closely to track
low level controller 314 may determine an optimal frequency response ResFR by optimizing value function J with the frequency response revenue Rev(Regaward ) defined as follows:
Low level controller 314 may use the optimal frequency response ResFR in place of the filtered frequency response Regfilter to calculate the desired interconnection power
low level controller 314 are described in greater detail with reference toFIG. 5A . - Referring now to
FIG. 4A , a block diagram illustratinghigh level controller 312 in greater detail is shown, according to an exemplary embodiment.High level controller 312 is shown to include a constant state-of-charge (SOC)controller 402 and avariable SOC controller 408.Constant SOC controller 402 may be configured to generate a midpoint b that results inbattery 108 having the same SOC at the beginning and the end of each frequency response period. In other words,constant SOC controller 402 may determine a midpoint b that maintainsbattery 108 at a predetermined SOC at the beginning of each frequency response period.Variable SOC controller 408 may generate midpoint b using an optimization procedure that allows the SOC ofbattery 108 to have different values at the beginning and end of the frequency response period. In other words,variable SOC controller 408 may determine a midpoint b that results in a net change in the SOC ofbattery 108 over the duration of the frequency response period. -
Constant SOC controller 402 may determine midpoint b by equating the desired power
POI 110 with the actual power atPOI 110 as shown in the following equation:

POI 110 and the right side of the equation is the actual power atPOI 110. Integrating over the frequency response period results in the following equation:
- Since the SOC of
battery 108 is maintained at the same value at the beginning and end of the frequency response period, the integral of the battery power Pbat over the frequency response period is zero (i.e., ∫Pbatdt = 0). Accordingly, the previous equation can be rewritten as follows:
battery 108 at a constant value (and near 50%) will allowsystem 100 to participate in the frequency market during all hours of the day. -
Constant SOC controller 402 may use the estimated values of the campus power signal received fromcampus 102 to predict the value of ∫Pcampusdt over the frequency response period. Similarly,constant SOC controller 402 may use the estimated values of the regulation signal fromincentive provider 114 to predict the value of f Regsignal dt over the frequency response period. Regaward can be expressed as a function of midpoint b as previously described (e.g., Regaward = Plimit - |b|). Therefore, the only remaining term in the equation for midpoint b is the expected battery power loss ∫Ploss . -
Constant SOC controller 402 is shown to include a batterypower loss estimator 404. Batterypower loss estimator 404 may estimate the value of ∫Plossdt using a Thevinin equivalent circuit model ofbattery 108. For example, batterypower loss estimator 404 may modelbattery 108 as a voltage source in series with a resistor. The voltage source has an open circuit voltage of VOC and the resistor has a resistance of RTH . An electric current I flows from the voltage source through the resistor. - To find the battery power loss in terms of the supplied power Psup , battery
power loss estimator 404 may identify the supplied power Psup as a function of the current I, the open circuit voltage VOC , and the resistance RTH as shown in the following equation:


- Battery
power loss estimator 404 may solve for the current I as follows:

- Battery
power loss estimator 404 may simplify the previous equation by approximating theexpression 

- Battery
power loss estimator 404 may calculate the expected value of ∫Plossdt over the frequency response period as follows:
power loss estimator 404 to estimate ∫Plossdt as a function of other variables such as Regaward, Regsignal, Pcampus, midpoint b, and Pmax . -
Constant SOC controller 402 is shown to include amidpoint calculator 406.Midpoint calculator 406 may be configured to calculate midpoint b by substituting the previous expression for ∫Plossdt into the equation for midpoint b. After substituting known and estimated values, the equation for midpoint b can be rewritten as follows:
Midpoint calculator 406 may solve the equation for midpoint b to determine the midpoint b that maintainsbattery 108 at a constant state-of-charge. -
Variable SOC controller 408 may determine optimal midpoints b by allowing the SOC ofbattery 108 to have different values at the beginning and end of a frequency response period. For embodiments in which the SOC ofbattery 108 is allowed to vary, the integral of the battery power Pbat over the frequency response period can be expressed as -ΔSOC · Cdes as shown in the following equation:
battery 108 over the frequency response period and Cdes is the design capacity ofbattery 108. The SOC ofbattery 108 may be a normalized variable (i.e., 0 ≤ SOC ≤ 1) such that the term SOC · Cdes represents the amount of energy stored inbattery 108 for a given state-of-charge. The SOC is shown as a negative value because drawing energy from battery 108 (i.e., a positive Pbat ) decreases the SOC ofbattery 108. The equation for midpoint b becomes:
-
Variable SOC controller 408 is shown to include a batterypower loss estimator 410 and amidpoint optimizer 412. Batterypower loss estimator 410 may be the same or similar to batterypower loss estimator 404.Midpoint optimizer 412 may be configured to establish a relationship between the midpoint b and the SOC ofbattery 108. For example, after substituting known and estimated values, the equation for midpoint b can be written as follows:
- Advantageously, the previous equation defines a relationship between midpoint b and the change in SOC of
battery 108.Midpoint optimizer 412 may use this equation to determine the impact that different values of midpoint b have on the SOC in order to determine optimal midpoints b. This equation can also be used bymidpoint optimizer 412 during optimization to translate constraints on the SOC in terms of midpoint b. For example, the SOC ofbattery 108 may be constrained between zero and 1 (e.g., 0 ≤ SOC ≤ 1) sincebattery 108 cannot be charged in excess of its maximum capacity or depleted below zero.Midpoint optimizer 412 may use the relationship between ΔSOC and midpoint b to constrain the optimization of midpoint b to midpoint values that satisfy the capacity constraint. -
Midpoint optimizer 412 may perform an optimization to find optimal midpoints b for each frequency response period within the optimization window (e.g., each hour for the next day) given the electrical costs over the optimization window. Optimal midpoints b may be the midpoints that maximize an objective function that includes both frequency response revenue and costs of electricity and battery degradation. For example, an objective function J can be written as:
Midpoint optimizer 412 may use input from frequency response revenue estimator 416 (e.g., a revenue model) to determine a relationship between midpoint b and Rev(Regaward,k ). Similarly,midpoint optimizer 412 may use input frombattery degradation estimator 418 and/orrevenue loss estimator 420 to determine a relationship between midpoint b and the monetized cost of battery degradation λbat,k . - Still referring to
FIG. 4A ,variable SOC controller 408 is shown to include anoptimization constraints module 414.Optimization constraints module 414 may provide one or more constraints on the optimization performed bymidpoint optimizer 412. The optimization constraints may be specified in terms of midpoint b or other variables that are related to midpoint b. For example,optimization constraints module 414 may implement an optimization constraint specifying that the expected SOC ofbattery 108 at the end of each frequency response period is between zero and one, as shown in the following equation:
battery 108 at the beginning of the optimization window, ΔSOCi is the change in SOC during frequency response period i, and h is the total number of frequency response periods within the optimization window. - In some embodiments,
optimization constraints module 414 implements an optimization constraint on midpoint b so that the power atPOI 110 does not exceed the power rating ofpower inverter 106. Such a constraint is shown in the following equation:
power inverter 106 and
- In some embodiments,
optimization constraints module 414 implements an optimization constraint to ensure (with a given probability) that the actual SOC ofbattery 108 remains between zero and one at each time step during the applicable frequency response period. This constraint is different from the first optimization constraint which placed bounds on the expected SOC ofbattery 108 at the end of each optimization period. The expected SOC ofbattery 108 can be determined deterministically, whereas the actual SOC ofbattery 108 is dependent on the campus power Pcampus and the actual value of the regulation signal Regsignal at each time step during the optimization period. In other words, for any value of Regaward > 0, there is a chance thatbattery 108 becomes fully depleted or fully charged while maintaining the desired power
POI 110. -
Optimization constraints module 414 may implement the constraint on the actual SOC ofbattery 108 by approximating the battery power Pbat (a random process) as a wide-sense stationary, correlated normally distributed process. Thus, the SOC ofbattery 108 can be considered as a random walk. Determining if the SOC would violate the constraint is an example of a gambler's ruin problem. For example, consider a random walk described by the following equation:
- The probability P that yk (starting at state z) will reach zero in less than n moves is given by the following equation:

- In some embodiments, each frequency response period includes approximately n = 1800 time steps (e.g., one time step every two seconds for an hour). Therefore, the central limit theorem applies and it is possible to convert the autocorrelated random process for Pbat and the limits on the SOC of
battery 108 into an uncorrelated random process of 1 or -1 with a limit of zero. - In some embodiments,
optimization constraints module 414 converts the battery power Pbat into an uncorrelated normal process driven by the regulation signal Regsignal . For example, consider the original battery power described by the following equation:


- Additionally, the impulse response of the difference equation for x k+1 is:

- Using convolution, xk can be expressed as follows:


- A random walk driven by signal xk can be defined as follows:


- Thus, the autocorrelated driving signal xk of the random walk can be converted into an uncorrelated driving signal


optimization constraints module 414 to define the probability of ruin in terms of the regulation signal Regsignal . - In some embodiments,
optimization constraints module 414 determines a probability p that the random walk driven by the sequence of -1 and 1 will take the value of 1. In order to ensure that the random walk driven by the sequence of -1 and 1 will behave the same as the random walk driven by x'k,optimization constraints module 414 may select p such that the ratio of the mean to the standard deviation is the same for both driving functions, as shown in the following equations: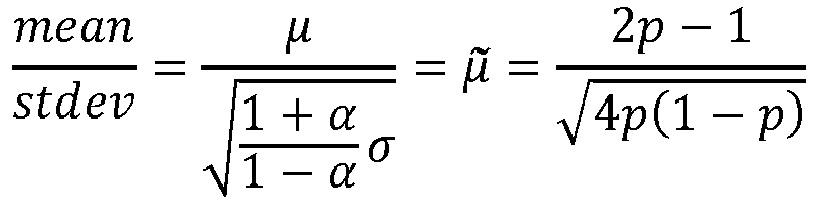


Optimization constraints module 414 may also ensure that both driving functions have the same number of standard deviations away from zero (or ruin) to ensure that both random walks have the same behavior, as shown in the following equation:
- Advantageously, the equations for p and z allow
optimization constraints module 414 to define the probability of ruin P (i.e., the probability ofbattery 108 fully depleting or reaching a fully charged state) within N time steps (n = 1 ... N) as a function of variables that are known tohigh level controller 312 and/or manipulated byhigh level controller 312. For example, the equation for p defines p as a function of the mean and standard deviation of the regulation signal Regsignal , which may be estimated bysignal statistics predictor 318. The equation for z defines z as a function of the SOC ofbattery 108 and the parameters of the regulation signal Regsignal . -
Optimization constraints module 414 may use one or more of the previous equations to place constraints on ΔSOC · Cdes and Regaward given the current SOC ofbattery 108. For example,optimization constraints module 414 may use the mean and standard deviation of the regulation signal Regsignal to calculate p.Optimization constraints module 414 may then use p in combination with the SOC ofbattery 108 to calculate z.Optimization constraints module 414 may use p and z as inputs to the equation for the probability of ruin P. This allowsoptimization constraints module 414 to define the probability or ruin P as a function of the SOC ofbattery 108 and the estimated statistics of the regulation signal Regsignal .Optimization constraints module 414 may impose constraints on the SOC ofbattery 108 to ensure that the probability of ruin P within N time steps does not exceed a threshold value. These constraints may be expressed as limitations on the variables ΔSOC · Cdes and/or Regaward, which are related to midpoint b as previously described. - In some embodiments,
optimization constraints module 414 uses the equation for the probability of ruin P to define boundaries on the combination of variables p and z. The boundaries represent thresholds when the probability of ruin P in less than N steps is greater than a critical value Pcr (e.g., Pcr = 0.001). For example,optimization constraints module 414 may generate boundaries that correspond to a threshold probability ofbattery 108 fully depleting or reaching a fully charged state during a frequency response period (e.g., in N = 1800 steps). - In some embodiments,
optimization constraints module 414 constrains the probability of ruin P to less than the threshold value, which imposes limits on potential combinations of the variables p and z. Since the variables p and z are related to the SOC ofbattery 108 and the statistics of the regulation signal, the constraints may impose limitations on ΔSOC · Cdes and Regaward given the current SOC ofbattery 108. These constraints may also impose limitations on midpoint b since the variables ΔSOC · Cdes and Regaward are related to midpoint b. For example,optimization constraints module 414 may set constraints on the maximum bid Regaward given a desired change in the SOC forbattery 108. In other embodiments,optimization constraints module 414 penalizes the objective function J given the bid Regaward and the change in SOC. - Still referring to
FIG. 4A ,variable SOC controller 408 is shown to include a frequency response (FR)revenue estimator 416.FR revenue estimator 416 may be configured to estimate the frequency response revenue that will result from a given midpoint b (e.g., a midpoint provided by midpoint optimizer 412). The estimated frequency response revenue may be used as the term Rev(Regaward,k ) in the objective functionJ . Midpoint optimizer 412 may use the estimated frequency response revenue along with other terms in the objective function J to determine an optimal midpoint b. - In some embodiments,
FR revenue estimator 416 uses a revenue model to predict frequency response revenue. An exemplary revenue model which may be used byFR revenue estimator 416 is shown in the following equation:
energy market predictor 316 and Regaward is a function of the midpoint b. For example,capability bid calculator 422 may calculate Regaward using the following equation:
power inverter 106. - As shown above, the equation for frequency response revenue used by
FR revenue estimator 416 does not include a performance score (or assumes a performance score of 1.0). This results inFR revenue estimator 416 estimating a maximum possible frequency response revenue that can be achieved for a given midpoint b (i.e., if the actual frequency response ofcontroller 112 were to follow the regulation signal exactly). However, it is contemplated that the actual frequency response may be adjusted bylow level controller 314 in order to preserve the life ofbattery 108. When the actual frequency response differs from the regulation signal, the equation for frequency response revenue can be adjusted to include a performance score. The resulting value function J may then be optimized bylow level controller 314 to determine an optimal frequency response output which considers both frequency response revenue and the costs of battery degradation, as described with reference toFIG. 5A . - Still referring to
FIG. 4A ,variable SOC controller 408 is shown to include abattery degradation estimator 418.Battery degradation estimator 418 may estimate the cost of battery degradation that will result from a given midpoint b (e.g., a midpoint provided by midpoint optimizer 412). The estimated battery degradation may be used as the term λbat in the objective functionJ . Midpoint optimizer 412 may use the estimated battery degradation along with other terms in the objective function J to determine an optimal midpoint b. - In some embodiments,
battery degradation estimator 418 uses a battery life model to predict a loss in battery capacity that will result from a set of midpoints b, power outputs, and/or other variables that can be manipulated bycontroller 112. The battery life model may define the loss in battery capacity Closs,add as a sum of multiple piecewise linear functions, as shown in the following equation:


battery 108. Closs,nom is the nominal loss in battery capacity that is expected to occur over time. Therefore, Closs,add represents the additional loss in battery capacity degradation in excess of the nominal value Closs,nom . -
Battery degradation estimator 418 may define the terms in the battery life model as functions of one or more variables that have known values (e.g., estimated or measured values) and/or variables that can be manipulated byhigh level controller 312. For example,battery degradation estimator 418 may define the terms in the battery life model as functions of the regulation signal statistics (e.g., the mean and standard deviation of Regsignal ), the campus power signal statistics (e.g., the mean and standard deviation of Pcampus ), Regaward, midpoint b, the SOC ofbattery 108, and/or other variables that have known or controlled values. - In some embodiments,
battery degradation estimator 418 measures the cell temperature Tcell using a temperature sensor configured to measure the temperature ofbattery 108. In other embodiments,battery degradation estimator 418 estimates or predicts the cell temperature Tcell based on a history of measured temperature values. For example,battery degradation estimator 418 may use a predictive model to estimate the cell temperature Tcell as a function of the battery power Pbat, the ambient temperature, and/or other variables that can be measured, estimated, or controlled byhigh level controller 312. -
Battery degradation estimator 418 may define the variable SOC in the battery life model as the SOC ofbattery 108 at the end of the frequency response period. The SOC ofbattery 108 may be measured or estimated based on the control decisions made bycontroller 112. For example,battery degradation estimator 418 may use a predictive model to estimate or predict the SOC ofbattery 108 at the end of the frequency response period as a function of the battery power Pbat, the midpoint b, and/or other variables that can be measured, estimated, or controlled byhigh level controller 312. -
Battery degradation estimator 418 may define the average power ratio PR as the ratio of the average power output of battery 108 (i.e., Pavg ) to the design power Pdes (e.g.,
battery 108 can be defined using the following equation:


-
Battery degradation estimator 418 may define the average effort ratio ER as the ratio of the average change in battery power ΔPavg to the design power Pdes (i.e.,


- To make this calculation more tractable, the contribution due to the battery power loss can be neglected. Additionally, the campus power Pcampus and the regulation signal Regsignal can be assumed to be uncorrelated, but autocorrelated with first order autocorrelation parameters of αcampus and α, respectively. The argument inside the absolute value in the equation for ΔPavg has a mean of zero and a variance given by:

-
Battery degradation estimator 418 may define the depth of discharge DOD as the maximum state-of-charge minus the minimum state-of-charge ofbattery 108 over the frequency response period, as shown in the following equation:
- The SOC of
battery 108 can be viewed as a constant slope with a zero mean random walk added to it, as previously described. An uncorrelated normal random walk with a driving signal that has zero mean has an expected range given by:


- If the SOC of
battery 108 is expected to change (i.e., is not zero mean), the following equation may be used to define the depth of discharge:
Battery degradation estimator 418 may use the previous equations to establish a relationship between the capacity loss Closs,add and the control outputs provided bycontroller 112. - Still referring to
FIG. 4A ,variable SOC controller 408 is shown to include arevenue loss estimator 420.Revenue loss estimator 420 may be configured to estimate an amount of potential revenue that will be lost as a result of the battery capacity loss Closs,add . In some embodiments,revenue loss estimator 420 converts battery capacity loss Closs,add into lost revenue using the following equation:
-
Revenue loss estimator 420 may determine a present value of the revenue loss Rloss using the following equation:
Revenue loss estimator 420 may provide the present value of the revenue loss λbat tomidpoint optimizer 412 for use in the objective function J. -
Midpoint optimizer 412 may use the inputs fromoptimization constraints module 414,FR revenue estimator 416,battery degradation estimator 418, andrevenue loss estimator 420 to define the terms in objective functionJ . Midpoint optimizer 412 may determine values for midpoint b that optimize objective function J. In various embodiments,midpoint optimizer 412 may use sequential quadratic programming, dynamic programming, or any other optimization technique. - Still referring to
FIG. 4A ,high level controller 312 is shown to include acapability bid calculator 422.Capability bid calculator 422 may be configured to generate a capability bid Regaward based on the midpoint b generated byconstant SOC controller 402 and/orvariable SOC controller 408. In some embodiments,capability bid calculator 422 generates a capability bid that is as large as possible for a given midpoint, as shown in the following equation:
power inverter 106.Capability bid calculator 422 may provide the capability bid toincentive provider 114 and tofrequency response optimizer 424 for use in generating an optimal frequency response. - Still referring to
FIG. 4A ,high level controller 312 is shown to include afrequency response optimizer 424 and a filter parameters optimizer 426. Filter parameters optimizer 426 may be configured to generate a set of filter parameters forlow level controller 314. The filter parameters may be used bylow level controller 314 as part of a low-pass filter that removes high frequency components from the regulation signal Regsignal . In some embodiments, filter parameters optimizer 426 generates a set of filter parameters that transform the regulation signal Regsignal into an optimal frequency response signal ResFR.Frequency response optimizer 424 may perform a second optimization process to determine the optimal frequency response ResFR based on the values for Regaward and midpoint b. In the second optimization, the values for Regaward and midpoint b may be fixed at the values previously determined during the first optimization. - In some embodiments,
frequency response optimizer 424 determines the optimal frequency response ResFR by optimizing value function J shown in the following equation:

- The frequency response ResFR may affect both Rev(Regaward ) and the monetized cost of battery degradation λbat . Closely tracking the regulation signal may result in higher performance scores, thereby increasing the frequency response revenue. However, closely tracking the regulation signal may also increase the cost of battery degradation λbat . The optimized frequency response ResFR represents an optimal tradeoff between decreased frequency response revenue and increased battery life (i.e., the frequency response that maximizes value J).
- In some embodiments, the performance score PS is a composite weighting of an accuracy score, a delay score, and a precision score.
Frequency response optimizer 424 may calculate the performance score PS using the performance score model shown in the following equation:
- The accuracy score PSacc may be the maximum correlation between the regulation signal Regsignal and the optimal frequency response ResFR.
Frequency response optimizer 424 may calculate the accuracy score PSacc using the following equation:
- The delay score PSdelay may be based on the time delay δ between the regulation signal Regsignal and the optimal frequency response ResFR.
Frequency response optimizer 424 may calculate the delay score PSdelay using the following equation:
- The precision score PSprec may be based on a difference between the frequency response ResFR and the regulation signal Regsignal
Frequency response optimizer 424 may calculate the precision score PSprec using the following equation:
-
Frequency response optimizer 424 may use the estimated performance score and the estimated battery degradation to define the terms in objective function J.Frequency response optimizer 424 may determine values for frequency response ResFR that optimize objective function J. In various embodiments,frequency response optimizer 424 may use sequential quadratic programming, dynamic programming, or any other optimization technique. - Filter parameters optimizer 426 may use the optimized frequency response ResFR to generate a set of filter parameters for
low level controller 314. In some embodiments, the filter parameters are used bylow level controller 314 to translate an incoming regulation signal into a frequency response signal.Low level controller 314 is described in greater detail with reference toFIG. 5A . - Referring now to
FIGS. 4A-4B ,high level controller 312 is shown to include aclipping parameters optimizer 428. Clipping parameters optimizer 428 can be configured to generate a set of clipping parameters that are used bylow level controller 314 to modify the battery power setpoints provided topower inverter 106. The battery power setpoints affect the frequency response ofsystem 100 and consequently influence how closely the frequency response tracks the regulation signal Regsignal . Closely tracking the regulation signal Regsignal may result in higher performance scores, thereby increasing the frequency response revenue Rev(Regaward ). However, closely tracking the regulation signal may also increase the cost of battery degradation λbat. - Before discussing clipping parameters optimizer 428 in greater detail, it should be noted that the variable Pbat is used throughout this disclosure to designate the battery power, the battery power setpoints, and/or the battery power signal. The terms "battery power setpoints" and "battery power signal" are used interchangeably to designate the setpoints/control signals provided as an output from
frequency response controller 112 topower inverter 106 and used bypower inverter 106 to control the amount of power stored or discharged frombattery 108 at each time step (i.e., the battery power). The battery power signal may be a continuous signal or a time series of discrete battery power setpoints (e.g., a battery power setpoint for each time step). The variable Pbat is used to represent each of these items in various contexts. - Additionally, the term "clipping parameter" is used herein to designate any parameter that can be used to modify battery power setpoints or impose constraints on the battery power setpoints. For example, some clipping parameters limit the battery power setpoints within a predefined range, whereas other clipping parameters limit the rate at which the battery power setpoints can change over time, and other clipping parameters may limit the average value of the battery power setpoints over a given horizon. It should be understood that the clipping parameters may include any of a variety of parameters in addition to parameters that "clip" the battery power setpoints.
- Clipping parameters optimizer 428 can be configured to generate a set of clipping parameters that, when applied to the battery power setpoints, result in modified battery power setpoints that represent an optimal tradeoff between decreased frequency response revenue and increased battery life (i.e., the frequency response that maximizes the objective function J). The clipping parameters generated by clipping
parameters optimizer 428 may include, for example, a maximum battery charging power parameter Pbat,max,charge, a maximum battery discharging power parameter Pbat,max,discharge , a maximum change in charging power parameter ΔPbat,max,charge , a maximum change in discharging power parameter ΔPbat,max,discharge , a maximum sustained charging power parameter Pbat,max,charge_sustained , a maximum sustained discharging power parameter Pbat,max,discharge_sustained , and a maximum sustained effort parameter Pbat,max,effort . These parameters can be used bylow level controller 314 to modify the battery power setpoints provided topower inverter 106. - For example,
low level controller 314 can clip the battery power setpoints such that the battery charging power is no greater than Pbat,max,charge and the battery discharging power is no greater than Pbat,max,discharge at any given time step. Similarly,low level controller 314 can clip the battery power setpoints such that the change in battery charging power between consecutive time steps is no greater than ΔPbat,max,charge and the change in battery discharging power between consecutive time steps is no greater than ΔPbat,max,discharge .Low level controller 314 can clip the battery power setpoints such that the average battery charging power over a given time period is no greater than Pbat,max,charge_sustained and the average battery discharging power over a given time period is no greater than Pbat,max,discharge_sustained . Similarly,low level controller 314 can clip the battery power setpoints such that the average change in battery charging power or discharging power between consecutive time steps over a given time period is no greater than Pbat,max,effort . The clipping operations performed bylow level controller 314 are described in greater detail with reference toFIGS. 5B-10 . - Referring particularly to
FIG. 4B , clippingparameters optimizer 428 is shown to include apower signal calculator 430 and abattery power calculator 432.Power signal calculator 430 can be configured to calculate a power signal Powersignal by multiplying the regulation signal Regsignal by the value of Regaward and adding the midpoint b, as shown in the following equation:
- In some embodiments, Powersignal is the same as the desired power

POI 110 andenergy grid 104, which is the sum of the campus power Pcampus and the desired battery power
Battery power calculator 432 can be configured to determine the desired battery power


- Clipping parameters optimizer 428 is shown to include a
maximum power optimizer 434.Maximum power optimizer 434 can be configured to determine optimal values for the maximum battery charging power parameter Pbat,max,charge and the maximum battery discharging power parameter Pbat,max,discharge . In some embodiments,maximum power optimizer 434 determines the optimal values of Pbat,max,charge and Pbat,max,discharge by optimizing the objective function:
- For example, the battery power Pbat,k can be constrained as follows:

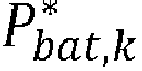


- As discussed above, the value of Pbat affects the frequency response ResFR of
system 100 and consequently affects how closely the frequency response ResFR tracks the regulation signal Regsignal . For example, the frequency response ResFR can be defined as a function of the battery power Pbat as shown in the following equation:
maximum power optimizer 434.Maximum power optimizer 434 can use the frequency response ResFR to calculate the components of the performance score (i.e., PSacc , PSdelay , and PSprec ) as described with reference to filter parameters optimizer 426.Maximum power optimizer 434 can substitute ResFR for Ressignal to calculate the monetized cost of battery degradation λbat,k as described with reference tobattery degradation estimator 418. With these constraints in place,maximum power optimizer 434 can optimize the objective function J using sequential quadratic programming, dynamic programming, or any other optimization technique. - In the optimization performed by
maximum power optimizer 434, the maximum battery charging power parameter Pbat,max,charge and the maximum battery discharging power parameter Pbat,max,discharge are the variables to be optimized. Larger values Pbat,max,charge and Pbat,max,discharge result in less clipping of the unbounded battery power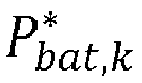
- Conversely, smaller values of Pbat,max,charge and Pbat,max,discharge result in more clipping of the unbounded battery power

maximum power optimizer 434 results in values of Pbat,max,charge and Pbat,max,discharge that represent an optimal tradeoff between frequency response revenue and battery degradation costs (i.e., the frequency response that maximizes the objective function J). - In some embodiments, the optimization performed by
maximum power optimizer 434 optimizes both Pbat,max,charge and Pbat,max,discharge simultaneously. In other words, the optimization may be a multi-variable optimization. However, it is contemplated that the optimization can be a single-variable optimization in other embodiments. For example, Pbat,max,charge and Pbat,max,discharge can be set equal to each other (i.e., Pbat,max,charge = Pbat,max,discharge = Pbat,max ) and treated as a single variable in the optimization. Alternatively, either Pbat,max,charge or Pbat,max,discharge can be omitted from the optimization such that the optimization is performed using only a single optimization variable. The optimal values of Pbat,max,charge, Pbat,max,discharge, and/or Pbat,max can be output as clipping parameters tolow level controller 314. - Still referring to
FIG. 4B , clippingparameters optimizer 428 is shown to include a maximumpower change optimizer 436. Maximumpower change optimizer 436 can be configured to determine optimal values for the maximum change in charging power parameter ΔPbat,max,charge and the maximum change in discharging power parameter ΔPbat,max,discharge. - In some embodiments, maximum
power change optimizer 436 determines the optimal values of ΔPbat,max,charge and ΔP bat,max,discharge by optimizing the objective function:
- subject to constraints that clip the battery power Pbat,k using the maximum battery charging power parameter Pbat,max,charge, the maximum battery discharging power parameter Pbat,max,discharge, the maximum change in charging power parameter ΔPbat,max,charge, and the maximum change in discharging power parameter ΔPbat,max,discharge.
- For example, maximum
power change optimizer 436 is shown receiving the unbounded power signal
battery power calculator 432 and the optimal values of the maximum power parameters Pbat,max,charge and Pbat,max,discharge frommaximum power optimizer 434. Maximumpower change optimizer 436 can apply the optimal clipping parameters Pbat,max,charge and Pbat,max,discharge generated bymaximum power optimizer 434 to the unbounded power signal



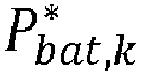

- Maximum power change optimizer 436 can then impose power change constraints on the clipped power signal Pbat,clip as shown in the following equations:


- The first set of constraints specify that the value of Pbat cannot increase or decrease by more than ΔPbat,max,charge between time step k - 1 and time step k when
battery 108 is charging (i.e., when Pbat,clip,k < 0). Accordingly, if the clipped battery power Pbat,clip,k at time step k is less than the battery power setpoint P bat,k-1 at time step k - 1 by an amount that exceeds ΔPbat,max,charge (i.e., P bat,k-1 - Pbat,clip,k > ΔPbat,max,charge ), the battery power setpoint Pbat,k at time step k will be set to P bat,k-1 - ΔPbat,max,charge. Similarly, if the clipped battery power Pbat,clip,k at time step k exceeds the battery power setpoint P bat,k-1 at time step k - 1 by an amount that exceeds ΔPbat,max,charge (i.e., Pbat,clip,k - P bat,k-1 > ΔPbat,max,charge ), the battery power setpoint Pbat,k at time step k will be set to P bat,k-1 + ΔPbat,max,charge. However, if the absolute value of the difference between the clipped battery power Pbat,clip,k at time step k and the battery power setpoint P bat,k-1 at time step k - 1 is less than or equal to ΔPbat,max,charge (i.e., |Pbat,clip,k - P bat,k-1| ≤ ΔPbat,max,charge ), the battery power setpoint Pbat,k at time step k will be equal to the clipped battery power Pbat,clip,k at time step k. - The second set of constraints specify that the value of Pbat cannot increase or decrease by more than ΔPbat,max,discharge between time step k - 1 and time step k when
battery 108 is discharging (i.e., when Pbat,clip,k > 0). Accordingly, if the clipped battery power Pbat,clip,k at time step k is less than the battery power setpoint P bat,k-1 at time step k - 1 by an amount that exceeds ΔPbat,max,discharge (i.e., P bat,k-1 - Pbat,clip,k > ΔPbat,max,discharge ), the battery power setpoint Pbat,k at time step k will be set to P bat,k-1 - ΔPbat,max,discharge. Similarly, if the clipped battery power Pbat,clip,k at time step k exceeds the battery power setpoint P bat,k-1 at time step k - 1 by an amount that exceeds ΔPbat,max,discharge. (i.e., Pbat,clip,k - P bat,k-1 > ΔP bat,max,discharge) , the battery power setpoint Pbat,k at time step k will be set to P bat,k-1 + ΔP bat,max,charge. However, if the absolute value of the difference between the clipped battery power Pbat,clip,k at time step k and the battery power setpoint P bat,k-1 at time step k - 1 is less than or equal to ΔPbat,max,discharge (i.e., |Pbat,clip,k - P bat,k-1| ≤ ΔPbat,max,discharge ), the battery power setpoint Pbat,k at time step k will be equal to the clipped battery power Pbat,clip,k at time step k. - As discussed above, the value of Pbat affects the frequency response ResFR of
system 100 and consequently affects how closely the frequency response ResFR tracks the regulation signal Regsignal . For example, the frequency response ResFR can be defined as a function of the battery power Pbat as shown in the following equation:
power change optimizer 436. Maximumpower change optimizer 436 can use the frequency response ResFR to calculate the components of the performance score (i.e., PSacc , PSdelay , and PSprec ) as described with reference to filter parameters optimizer 426. Maximumpower change optimizer 436 can substitute ResFR for Ressignal to calculate the monetized cost of battery degradation λ bat,k as described with reference tobattery degradation estimator 418. With these constraints in place, maximumpower change optimizer 436 can optimize the objective function J using sequential quadratic programming, dynamic programming, or any other optimization technique. - In the optimization performed by maximum
power change optimizer 436, the maximum change in charging power parameter ΔPbat,max,charge and the maximum change in discharging power parameter ΔPbat,max,discharge are the variables to be optimized. Larger values ΔPbat,max,charge and ΔPbat,max,discharge result in less clipping of the battery power Pbat,clip and therefore allow ResFR to closely track the regulation signal Regsignal . Closely tracking the regulation signal Regsignal may result in higher performance scores, thereby increasing the frequency response revenue. However, closely tracking the regulation signal may also increase the cost of battery degradation λ bat . - Conversely, smaller values of ΔPbat,max,charge and ΔPbat,max,discharge result in more clipping of the battery power Pbat,clip and therefore cause ResFR to track the regulation signal Regsignal less closely. Tracking the regulation signal Regsignal less closely may result in lower performance scores, thereby decreasing the frequency response revenue. However, tracking the regulation signal less closely may also decrease the cost of battery degradation λ bat. The optimization performed by maximum
power change optimizer 436 results in values of ΔPbat,max,charge and PΔ bat,max,discharge that represent an optimal tradeoff between frequency response revenue and battery degradation costs (i.e., the frequency response that maximizes the objective function J). - In some embodiments, the optimization performed by maximum
power change optimizer 436 optimizes both ΔPbat,max,charge and ΔPbat,max,discharge simultaneously. In other words, the optimization may be a multi-variable optimization. However, it is contemplated that the optimization can be a single-variable optimization in other embodiments. For example, ΔPbat,max,charge and ΔPbat,max,discharge can be set equal to each other (i.e., ΔPbat,max,charge = ΔPbat,max,discharge = ΔPbat,max ) and treated as a single variable in the optimization. Alternatively, either ΔPbat,max,charge or ΔPbat,max,discharge can be omitted from the optimization such that the optimization is performed using only a single optimization variable. The optimal values of ΔPbat,max,charge, ΔPbat,max,discharge, and/or ΔPbat,max can be output as clipping parameters tolow level controller 314. - Still referring to
FIG. 4B , clippingparameters optimizer 428 is shown to include a maximumsustained power optimizer 438 and a maximumsustained effort optimizer 440. Maximumsustained power optimizer 438 can be configured to generate values for the maximum sustained charging power parameter Pbat,max,charge_sustained and the maximum sustained discharging power parameter Pbat,max,discharge_sustained . The parameters Pbat,max,charge_sustained and P bat,max,discharge_sustained impose limits on the average value of Pbat over a predetermined time period (e.g., five minutes, fifteen minutes, etc.), which helps limit battery degradation caused by extended periods of high battery power usage. This average value of Pbat is referred to herein as the sustained battery power Pbat,sustained.Low level controller 314 can be configured to modify the battery power signal Pbat such that the sustained battery power Pbat,sustained is maintained between P bat,max,discharge_sustained and - Pbat,max,charge_sustained . - In some embodiments, maximum
sustained power optimizer 438 sets the values of Pbat,max,charge_sustained and P bat,max,discharge_sustained to a predetermined fraction or ratio of the values of Pbat,max,charge and Pbat,max,discharge, respectively. For example, maximumsustained power optimizer 438 can be configured to calculate values of Pbat,max,charge_sustained and Pbat,max,discharge_sustained using the following equations:

low level controller 314. - Maximum
sustained effort optimizer 440 can be configured to generate a value for the maximum sustained effort parameter Pbat,max,effort. The parameter Pbat,max,effort imposes limits on the average value of ΔPhat over a predetermined time period (e.g., five minutes, fifteen minutes, etc.), which helps limit battery degradation caused by extended periods of large changes in battery power ΔPbat. This average value of ΔPbat is referred to herein as the sustained battery effort ΔPbat,sustained.Low level controller 314 can be configured to modify the battery power signal Pbat such that the sustained battery effort ΔPbat,sustained is less than Pbat,max,effort . - In some embodiments, maximum
sustained effort optimizer 440 sets the value of Pbat,max,effort to a predetermined fraction or ratio of the value of ΔPbat,max,charge and/or ΔPbat,max,discharge. For example, maximumsustained effort optimizer 440 can be configured to calculate the value of Pbat,max,effort using either of the following equations:

low level controller 314. - Referring now to
FIG. 5A , a block diagram illustratinglow level controller 314 in greater detail is shown, according to an exemplary embodiment.Low level controller 314 may receive the midpoints b and the filter parameters fromhigh level controller 312.Low level controller 314 may also receive the campus power signal fromcampus 102 and the regulation signal Regsignal and the regulation award Regaward fromincentive provider 114. -
Low level controller 314 is shown to include aregulation signal predictor 502.Regulation signal predictor 502 may use a history of past and current values for the regulation signal Regsignal to predict future values of the regulation signal. In some embodiments,regulation signal predictor 502 uses a deterministic plus stochastic model trained from historical regulation signal data to predict future values of the regulation signal Regsignal . For example,regulation signal predictor 502 may use linear regression to predict a deterministic portion of the regulation signal Regsignal and an AR model to predict a stochastic portion of the regulation signal Regsignal . In some embodiments,regulation signal predictor 502 predicts the regulation signal Regsignal using the techniques described inU.S. Patent Application No. 14/717,593 -
Low level controller 314 is shown to include aregulation signal filter 504.Regulation signal filter 504 may filter the incoming regulation signal Regsignal and/or the predicted regulation signal using the filter parameters provided byhigh level controller 312. In some embodiments,regulation signal filter 504 is a low pass filter configured to remove high frequency components from the regulation signal Regsignal .Regulation signal filter 504 may provide the filtered regulation signal topower setpoint optimizer 506. -
Power setpoint optimizer 506 may be configured to determine optimal power setpoints forpower inverter 106 based on the filtered regulation signal. In some embodiments,power setpoint optimizer 506 uses the filtered regulation signal as the optimal frequency response. For example,low level controller 314 may use the filtered regulation signal to calculate the desired interconnection power

Power setpoint optimizer 506 may subtract the campus power Pcampus from the desired interconnection power
power inverter 106, as shown in the following equation:
- In other embodiments,
low level controller 314 performs an optimization to determine how closely to track
low level controller 314 is shown to include afrequency response optimizer 508.Frequency response optimizer 508 may determine an optimal frequency response ResFR by optimizing value function J shown in the following equation:
FR revenue estimator 510,performance score calculator 512,battery degradation estimator 514, andrevenue loss estimator 516. - Still referring to
FIG. 5A ,low level controller 314 is shown to include aFR revenue estimator 510.FR revenue estimator 510 may estimate a frequency response revenue that will result from the frequency response ResFR . In some embodiments,FR revenue estimator 510 estimates the frequency response revenue using the following equation:
-
Low level controller 314 is shown to include aperformance score calculator 512.Performance score calculator 512 may calculate the performance score PS used in the revenue function. The performance score PS may be based on several factors that indicate how well the optimal frequency response ResFR tracks the regulation signal Regsignal . In some embodiments, the performance score PS is a composite weighting of an accuracy score, a delay score, and a precision score.Performance score calculator 512 may calculate the performance score PS using the performance score model shown in the following equation:
FIG. 4A . - Still referring to
FIG. 5A ,low level controller 314 is shown to include abattery degradation estimator 514.Battery degradation estimator 514 may be the same or similar tobattery degradation estimator 418, with the exception thatbattery degradation estimator 514 predicts the battery degradation that will result from the frequency response ResFR rather than the original regulation signal Regsignal . The estimated battery degradation may be used as the term λ batt in the objective function J.Frequency response optimizer 508 may use the estimated battery degradation along with other terms in the objective function J to determine an optimal frequency response ResFR . - In some embodiments,
battery degradation estimator 514 uses a battery life model to predict a loss in battery capacity that will result from the frequency response ResFR . The battery life model may define the loss in battery capacity Closs,add as a sum of multiple piecewise linear functions, as shown in the following equation:


battery 108. Closs,nom is the nominal loss in battery capacity that is expected to occur over time. Therefore, Closs,add represents the additional loss in battery capacity degradation in excess of the nominal value Closs,nom. The terms in the battery life model may be calculated as described with reference toFIG. 4A , with the exception that the frequency response ResFR is used in place of the regulation signal Regsignal . - Still referring to
FIG. 5A ,low level controller 314 is shown to include arevenue loss estimator 516.Revenue loss estimator 516 may be the same or similar torevenue loss estimator 420, as described with reference toFIG. 4A . For example,revenue loss estimator 516 may be configured to estimate an amount of potential revenue that will be lost as a result of the battery capacity loss Closs,add . In some embodiments,revenue loss estimator 516 converts battery capacity loss Closs,add into lost revenue using the following equation:
-
Revenue loss estimator 420 may determine a present value of the revenue loss Rloss using the following equation:
Revenue loss estimator 420 may provide the present value of the revenue loss λ bat tofrequency response optimizer 508 for use in the objective function J. -
Frequency response optimizer 508 may use the estimated performance score and the estimated battery degradation to define the terms in objective function J.Frequency response optimizer 508 may determine values for frequency response ResFR that optimize objective function J. In various embodiments,frequency response optimizer 508 may use sequential quadratic programming, dynamic programming, or any other optimization technique. - Referring now to
FIGS. 5A-5B ,low level controller 314 is shown to include a batterypower signal clipper 518. Batterypower signal clipper 518 can be configured to generate power setpoints Pbat forpower inverter 106 by applying a set of clipping parameters to the unbounded battery power signal
parameters optimizer 428, as previously described, and provided as an input to batterypower signal clipper 518. The clipping parameters may include, for example, a maximum battery charging power parameter Pbat,max,charge, a maximum battery discharging power parameter Pbat,max,discharge, a maximum change in charging power parameter ΔPbat,max,charge, a maximum change in discharging power parameter ΔPbat,max,discharge, a maximum sustained charging power parameter Pbat,max,charge_sustained , a maximum sustained discharging power parameter Pbat,max,discharge_sustained , and a maximum sustained effort parameter Pbat,max,effort . These parameters can be used by batterypower signal clipper 518 to modify the battery power setpoints provided topower inverter 106. - In some embodiments, the unbounded battery power signal

power signal clipper 518. In other embodiments, batterypower signal clipper 518 generates the unbounded battery power signal
power signal clipper 518 can calculate a power signal Powersignal by multiplying the regulation signal Regsignal by the value of Regaward and adding the midpoint b, as shown in the following equation:
- In some embodiments, Powersignal is the same as the desired power

POI 110 andenergy grid 104, which is the sum of the campus power Pcampus and the desired battery power
power signal clipper 518 can be configured to determine the desired battery power


- Referring particularly to
FIG. 5B , batterypower signal clipper 518 is shown to include amaximum power adjuster 520.Maximum power adjuster 520 can be configured to clip the unbounded battery power
maximum power optimizer 434. The clipped battery power Pbat can be provided as an output topower inverter 106 and/or provided as an input to other components of batterypower signal clipper 518. -
Maximum power adjuster 520 can clip the unbounded battery power
maximum power adjuster 520 can calculate the clipped battery power Pbat using the following equation:


- Referring now to
FIG. 6 , agraph 600 illustrating the clipping operations performed bymaximum power adjuster 520 is shown, according to an exemplary embodiment. Ingraph 600,line 602 represents the unbounded battery power
line 604 represents the clipped battery power Pbat . Positive values of the battery power indicate thatbattery 108 is discharging, whereas negative values of the battery power indicate thatbattery 108 is charging.Line 606 indicates the maximum battery discharging power Pbat,max,discharge (i.e., the maximum rate at whichbattery 108 can be discharged) andline 608 indicates the maximum battery charging power -Pbat,max,charge (i.e., the maximum rate at whichbattery 108 can be charged). - Between times t 0 and t1, the unbounded battery power

maximum power adjuster 520 may not clip the unbounded battery power


maximum power adjuster 520 may clip the unbounded battery power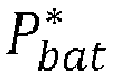
- At time t2, the unbounded battery power

maximum power adjuster 520 may not clip the unbounded battery power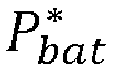


maximum power adjuster 520 may clip the unbounded battery power
- Referring again to
FIG. 5B , batterypower signal clipper 518 is shown to include a maximumpower change adjuster 522. Maximumpower change adjuster 522 can be configured to clip the unbounded power signal
maximum power optimizer 434, as well as the optimal maximum change in charging power parameter ΔPbat,max,charge and the optimal maximum change in discharging power parameter ΔPbat,max,discharge generated by maximumpower change optimizer 436. - Maximum
power change adjuster 522 can apply the optimal clipping parameters Pbat,max,charge and Pbat,max,discharge generated bymaximum power optimizer 434 to the unbounded power signal


- Maximum
power change adjuster 522 can then apply the maximum change in charging power parameter ΔPbat,max,charge and the maximum change in discharging power parameter ΔPbat,max,discharge. generated by maximum power change optimizer 436 to the clipped power signal Pbat,clip as shown in the following equations:

- The first set of equations specify that the value of Pbat cannot increase or decrease by more than ΔPbat,max,charge between time step k - 1 and time step k when
battery 108 is charging (i.e., when Pbat,clip,k < 0). Accordingly, if the clipped battery power Pbat,clip,k at time step k is less than the battery power setpoint P bat,k-1 at time step k - 1 by an amount that exceeds ΔPbat,max,charge (i.e., P bat,k-1 - Pbat,clip,k > ΔPbat,max,charge ), maximumpower change adjuster 522 may set the battery power setpoint Pbat,k at time step k to P bat,k-1 - ΔPbat,max,charge . Similarly, if the clipped battery power Pbat,clip,k at time step k exceeds the battery power setpoint P bat,k-1 at time step k - 1 by an amount that exceeds ΔPbat,max,charge (i.e., Pbat,clip,k - P bat,k-1 > ΔPbat,max,charge ), maximumpower change adjuster 522 may set the battery power setpoint Pbat,k at time step k to P bat,k-1 + ΔPbat,max,charge . However, if the absolute value of the difference between the clipped battery power Pbat,clip,k at time step k and the battery power setpoint P bat,k-1 at time step k - 1 is less than or equal to ΔPbat,max,charge (i.e., |Pbat,clip,k - P bat,k-1| ≤ ΔPbat,max,charge ), maximumpower change adjuster 522 may set the battery power setpoint Pbat,k at time step k equal to the clipped battery power Pbat,clip,k at time step k. - The second set of equations specify that the value of Pbat cannot increase or decrease by more than ΔPbat,max,discharge between time step k - 1 and time step k when
battery 108 is discharging (i.e., when Pbat,clip,k > 0). Accordingly, if the clipped battery power Pbat,clip,k at time step k is less than the battery power setpoint P bat,k-1 at time step k - 1 by an amount that exceeds ΔPbat,max,discharge. (i.e., P bat,k-1 - Pbat,clip,k > ΔPbat,max,discharge ), maximumpower change adjuster 522 may set the battery power setpoint Pbat,k at time step k to P bat,k-1 - ΔPbat,max,discharge. Similarly, if the clipped battery power Pbat,clip,k at time step k exceeds the battery power setpoint P bat,k-1 at time step k - 1 by an amount that exceeds ΔPbat,max,discharge (i.e., Pbat,clip,k - P bat,k-1 > ΔPbat,max,discharge ), maximumpower change adjuster 522 may set the battery power setpoint Pbat,k at time step k to Pbat,k- 1 + ΔPbat,max,charge . However, if the absolute value of the difference between the clipped battery power Pbat,clip,k at time step k and the battery power setpoint P bat,k-1 at time step k - 1 is less than or equal to ΔPbat,max,discharge. (i.e., |Pbat,clip,k - P bat,k-1| ≤ ΔPbat,max,discharge ), maximumpower change adjuster 522 may set the battery power setpoint Pbat,k at time step k equal to the clipped battery power Pbat,clip,k at time step k. - Referring now to
FIG. 7 , agraph 700 illustrating the clipping operations performed by maximumpower change adjuster 522 is shown, according to an exemplary embodiment. Ingraph 700,line 702 represents the unbounded battery power
line 704 represents the clipped battery power Pbat (i.e., the battery power setpoint). Positive values of the battery power indicate thatbattery 108 is discharging, whereas negative values of the battery power indicate thatbattery 108 is charging. In this example, it is assumed that the maximum battery charging power parameter Pbat,max,charge and maximum battery discharging power parameter Pbat,max,discharge are sufficiently large such that the clipping operations performed bymaximum power adjuster 520 do not change the unbounded battery power

- Between time t 0 and time t 1, the unbounded battery power

battery 108 is charging. The unbounded battery power
power change adjuster 522 does not alter the unbounded battery power
power inverter 106 will be equal to the unbounded battery power
- At time t 1, the unbounded battery power
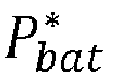

power change adjuster 522 may prevent the battery power setpoint Pbat from changing by more than ΔPbat,max,charge between any two consecutive time steps k - 1 and k. It is noted that the maximum change in charging power parameter ΔPbat,max,charge is applicable between times t 1 and t 2 becausebattery 108 is charging (i.e., Pbat is negative). Therefore, maximumpower change adjuster 522 sets the battery power setpoint Pbat,k at time step k to P bat,k-1 - ΔPbat,max,charge . This adjustment is repeated for each time step k until the difference between P bat,k-1 and
slope 706 of the battery power setpoint Pbat between times t 1 and t 2 is equal to -ΔPbat,max,charge over the duration of each time step k. - At time t 2, the unbounded battery power


power change adjuster 522 may prevent the battery power setpoint Pbat from changing by more than ΔPbat,max,charge between any two consecutive time steps k - 1 and k. It is noted that the maximum change in charging power parameter ΔPbat,max,charge is still applicable between times t 2 and t 3 becausebattery 108 is still charging (i.e., Pbat is negative). Therefore, maximumpower change adjuster 522 sets the battery power setpoint Pbat,k at time step k to P bat,k-1 + ΔPbat,max,charge . This adjustment is repeated for each time step k between times t 2 and t 3. Theslope 708 of the battery power setpoint Pbat between times t 2 and t 3 is equal to ΔPbat,max,charge over the duration of each time step k. - At time t 3, the battery power setpoint Pbat becomes positive, which indicates that
battery 108 is now discharging. The difference between the unbounded battery power
power change adjuster 522 may prevent the battery power setpoint Pbat from changing by more than ΔP bat,max,discharge between any two consecutive time steps k - 1 and k. Therefore, maximumpower change adjuster 522 sets the battery power setpoint Pbat,k at time step k to P bat,k-1 + ΔP bat,max, discharge. This adjustment is repeated for each time step k until the difference between
slope 710 of the battery power setpoint Pbat between times t 3 and t 4 is equal to ΔP bat,max,discharge over the duration of each time step k. - Between time t 4 and time t 5, the unbounded battery power

battery 108 is discharging. The unbounded battery power
power change adjuster 522 does not alter the unbounded battery power
power inverter 106 will be equal to the unbounded battery power
- Referring again to
FIG. 5B , batterypower signal clipper 518 is shown to include a zerocross adjuster 524. Zerocross adjuster 524 can be configured to modify the battery power signal Pbat (i.e., the time series of battery power setpoints) generated by maximumpower change adjuster 522 to ensure that the battery power signal Pbat crosses zero at approximately the same time as the unbounded battery power
power change adjuster 522 cause the battery power signal Pbat to significantly lag the unbounded battery power
graph 700 shows the unbounded battery power
cross adjuster 524 may decrease the lag time between Pbat and
- In some embodiments, zero
cross adjuster 524 predicts the time at which the unbounded battery power


cross adjuster 524 may calculate the slope of

- where


cross adjuster 524 may calculate the slope of Regsignal using the following equation:
- Zero
cross adjuster 524 can use the calculated slope slopePower or slopeReg to predict the number of time steps until the corresponding signal
cross adjuster 524 can predict the number of time steps until the unbounded power signal

- Similarly, zero
cross adjuster 524 can predict the number of time steps until the regulation signal Regsignal reaches zero using the following equation:
- Zero
cross adjuster 524 can use the predicted number of time steps StepsToZeroPower and/or StepsToZeroReg to generate upper and lower zero cross bounds for the battery power signal Pbat . For example, zerocross adjuster 524 can calculate an upper bound for the battery power signal Pbat by multiplying the predicted number of time steps StepsToZeroPower or StepsToZeroReg by the maximum rate that the battery discharging power can change between each time step ΔPbat,max,discharge, as shown in the following equation:

- Similarly, zero
cross adjuster 524 can calculate a lower bound for the battery power signal Pbat by multiplying the predicted number of time steps StepsToZeroPower or StepsToZeroReg by the maximum rate that the battery charging power can change between each time step ΔPbat,max,charge, as shown in the following equation:

- Zero
cross adjuster 524 can use the upper zero cross bound ZeroCrossUpperBound and the lower zero cross bound ZeroCrossLowerBound to determine when to start adjusting the battery power signal Pbat toward zero. For example, if the battery power signal Pbat is currently greater than or equal to the upper zero cross bound ZeroCrossUpperBound (i.e., Pbat ≥ ZeroCrossUpperBound) and the slope of the unbounded power

cross adjuster 524 can begin decreasing the battery power signal Pbat at the maximum allowable rate ΔPbat,max,discharge per time step. Similarly, if the battery power signal Pbat is currently less than or equal to the lower zero cross bound ZeroCrossLowerBound (i.e., Pbat ≤ ZeroCrossLowerBound ) and the slope of the unbounded power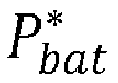

cross adjuster 524 can begin increasing the battery power signal Pbat at the maximum allowable rate ΔPbat,max,charge per time step. - Referring now to
FIG. 8 , agraph 800 illustrating the adjustments to the battery power signal Pbat performed by zerocross adjuster 524 is shown, according to an exemplary embodiment. Ingraph 800,line 802 represents the unbounded battery power
line 804 represents the battery power signal Pbat without any zero cross adjustment (i.e., the output of maximum power change adjuster 522), andline 806 represents the battery power signal Pbat,zc with zero cross adjustments (i.e., the output of zero cross adjuster 524). Positive values of the battery power indicate thatbattery 108 is discharging, whereas negative values of the battery power indicate thatbattery 108 is charging. In this example, it is assumed that the maximum battery charging power parameter Pbat,max,charge and maximum battery discharging power parameter Pbat,max,discharge are sufficiently large such that the clipping operations performed bymaximum power adjuster 520 do not change the unbounded battery power

- In
graph 800,line 808 represents the zero cross upper bound ZeroCrossUpperBound at time t 5, whereasline 810 represents the zero cross lower bound ZeroCrossLowerBound at time t 2. As discussed above, the values of ZeroCrossUpperBound and ZeroCrossLowerBound depend on the predicted number of time steps until the unbounded power signal

lines graph 800. - Between time t 0 and time t 1, the unbounded battery power

battery 108 is charging. The unbounded battery power
power change adjuster 522 does not alter the unbounded battery power

cross adjuster 524 does not alter the unbounded battery power

- At time t 1, the unbounded battery power


power change adjuster 522 may prevent the battery power signal Pbat from changing by more than ΔPbat,max,charge between any two consecutive time steps k - 1 and k. Therefore, maximumpower change adjuster 522 sets the battery power signal Pbat,k at time step k to P bat,k-1 - ΔPbat,max,charge . This adjustment is repeated for each time step k until the difference between P bat,k-1 and
line 804 between times t 1 and t 3 is equal to -ΔPbat,max,charge over the duration of each time step k. - At time t 2, the value of the battery power signal Pbat drops below the lower zero cross bound ZeroCrossLowerBound . Zero
cross adjuster 524 initiates zero cross adjustment at time t 2, which drives the value of Pbat,zc toward zero. Accordingly, the adjusted battery power signal Pbat,zc (line 806) begins moving toward zero at time t 2 at the maximum allowable rate. Thus, the adjusted battery power signal Pbat,zc has a slope that corresponds to the maximum change in charge power ΔPbat,max,charge between time t 2 and t 3. However, the battery power signal Pbat without zero cross adjustment (line 804) continues decreasing between time t 2 and time t 3 in an attempt to match the unbounded battery power

- Advantageously, the adjustment performed by zero
cross adjuster 524 decreases the lag time between the time at which unbounded battery power

- At time t 5, the value of the adjusted battery power signal Pbat,zc exceeds the upper zero cross bound ZeroCrossUpperBound . Zero
cross adjuster 524 initiates zero cross adjustment at time t 5, which drives the value of Pbat,zc toward zero. Accordingly, the adjusted battery power signal Pbat,zc (line 806) begins moving toward zero at time t 5 at the maximum allowable rate. Thus, the adjusted battery power signal Pbat,zc has a slope that corresponds to the maximum change in discharge power -ΔPbat,max,discharge between time t 5 and t7. However, the battery power signal Pbat without zero cross adjustment (line 804) continues increasing between time t 5 and time t 6 in an attempt to match the unbounded battery power

- Advantageously, the adjustment performed by zero
cross adjuster 524 causes the adjusted battery power signal Pbat,zc to cross zero at the same time as the unbounded battery power
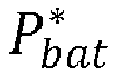
- Referring again to
FIG. 5B , batterypower signal clipper 518 is shown to include a maximumsustained power adjuster 526. Maximumsustained power adjuster 526 can be configured to adjust the unbounded power signal
sustained power optimizer 438. As described above, the maximum sustained power parameters Pbat,max,charge_sustained and Pbat-max,discharge_sustained limit the moving average of the battery power signal Pbat over a predetermined horizon (e.g., five minutes, fifteen minutes, etc.). In some embodiments, the values of Pbat,max,charge_sustained and P bat,max,discharge_sustained are set to a fixed fraction or percentage of Pbat,max,charge and Pbat,max,discharge, respectively (e.g., 75%) and may be received as an input to maximumsustained power adjuster 526. - Maximum
sustained power adjuster 526 can calculate a moving average of the battery power signal Pbat using a set of previous values of the battery power signal Pbat . For example, maximumsustained power adjuster 526 can calculate a moving average of the battery power signal Pbat at each time step k using the following equation: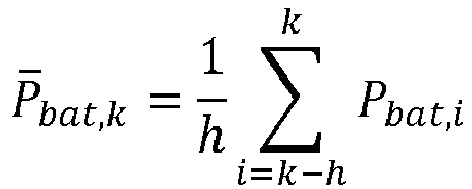
P bat,k is the moving average of the battery power signal Pbat,k over the last h time steps. Maximumsustained power adjuster 526 can actively adjust the battery power signal Pbat to ensure that the moving averageP bat,k is maintained between Pbat,max,charge_sustained and Pbat,max,discharge_sustained . - If
battery 108 is currently charging (i.e., Pbat is negative), maximumsustained power adjuster 526 can calculate the number of time steps required for the current value of the battery power signal Pbat,k to reach the maximum sustained charge power Pbat,max,charge_sustained based on the maximum allowable change in the charge power ΔPbat,max,charge between consecutive time steps k - 1 and k. For example, maximumsustained power adjuster 526 can calculate the required number of time steps required for the current value of the battery power signal Pbat,k to reach the maximum sustained charge power Pbat,max,charge_sustained using the following equation:
- Similarly, if
battery 108 is currently discharging (i.e., Pbat is positive), maximumsustained power adjuster 526 can calculate the number of time steps required for the current value of the battery power signal Pbat,k to reach the maximum sustained discharge power Pbat,max,discharge_sustained based on the maximum allowable change in the discharge power ΔPbat,max,discharge. between consecutive time steps k - 1 and k. For example, maximumsustained power adjuster 526 can calculate the required number of time steps required for the current value of the battery power signal Pbat,k to reach the maximum sustained discharge power P bat,max,discharge_sustained using the following equation:
- Maximum
sustained power adjuster 526 can calculate the average charging power addedP added,charge using the following equation:
- Similarly, maximum
sustained power adjuster 526 can calculate the average discharging power addedP added,discharge using the following equation:
- Maximum
sustained power adjuster 526 can calculate a charging power value Pcalc,charge using the following equation:
P bat,k is calculated. Similarly, maximumsustained power adjuster 526 can calculate a discharging power value Pcalc,discharge using the following equation:
P bat,k is calculated. - Maximum
sustained power adjuster 526 can calculate a charging power margin Pmargin,charge and a discharging power margin Pmargin,discharge using the following equations:

- Maximum
sustained power adjuster 526 can calculate a sustained charging power bound Psustained,ChargeBound using the following equation:
- Similarly, maximum
sustained power adjuster 526 can calculate a sustained discharging power bound Psustained,DischargeBound using the following equation:
- If the battery power signal Pbat,k at time step k is less than -Psustained,ChargeBound, maximum
sustained power adjuster 526 may adjust the battery power signal Pbat,k toward the maximum sustained charging power -Pbat,max,charge_sustained at a rate of ΔPbat,max,charge. Similarly, if the battery power signal Pbat,k at time step k is greater than Psustained,DishargeBound, maximumsustained power adjuster 526 may adjust the battery power signal Pbat,k toward the maximum sustained discharging power P bat,max,discharge_sustained at a rate of -ΔPbat,max,discharge . However, if the battery power signal Pbat,k at time step k is between -Psustained,ChargeBound and Psustained,DishargeBound, maximumsustained power adjuster 526 may not adjust the battery power signal Pbat,k . - Referring now to
FIG. 9 , agraph 900 illustrating the adjustments to the battery power signal Pbat performed by maximumsustained power adjuster 526 is shown, according to an exemplary embodiment. Ingraph 900,line 902 represents the unbounded battery power
line 904 represents the battery power signal Pbat after being adjusted by maximumsustained power adjuster 526.Line 906 represents the sustained power moving average of Pbat at each time step k (i.e.,P bat,k ) based on the values of Pbat within a moving time window that ends at time step k. Line 908 represents the maximum sustained discharging power Pbat,max,discharge_sustained . - Between time t 0 and time t 1, the battery power signal Pbat matches the unbounded battery power


P bat,k is below the maximum sustained discharging power Pbat,max,discharge_sustained but continues to increase with each time step k. As the sustained power moving averageP bat,k approaches the maximum sustained discharging power Pbat,max,discharge_sustained, the sustained power discharge bound Psustained,DishargeBound decreases until it reaches the value of Pbat at time t 1. - At time t 1, maximum
sustained power adjuster 526 determines that the value of Pbat exceeds the sustained power discharge bound Psustained,DishargeBound . Consequently, maximumsustained power adjuster 526 adjusts the battery power signal Pbat toward the maximum sustained discharge power P bat,max,discharge_sustained at a rate of -ΔPbat,max,discharge, which represents the slope ofline 904 between time t 1 and time t 2. The battery power signal Pbat and the sustained power discharge bound Psustained,DishargeBound both continue to decrease until they reach the maximum sustained discharge power P bat,max,discharge_sustained at time t 2. - At time t 2, the sustained power moving average
P bat,k reaches the maximum sustained discharge power Pbat,max,discharge-sustained . Accordingly, any value of Pbat above maximum sustained discharge power P bat,max,discharge_sustained would cause the sustained power moving averageP bat,k to exceed the maximum sustained discharge power Pbat,max,discharge_sustained . Thus, maximumsustained power adjuster 526 sets the battery power signal Pbat equal to the maximum sustained discharge power Pbat,max,discharge_sustained . - Referring again to
FIG. 5B , batterypower signal clipper 518 is shown to include a maximumsustained effort adjuster 528. Maximumsustained effort adjuster 528 can be configured to adjust the unbounded power signal
sustained effort optimizer 440. As described above, the maximum sustained effort parameter Pbat,max,effort limits the moving average of the change in the battery power signal ΔPbat (i.e., the sustained effort) over a predetermined horizon (e.g., five minutes, fifteen minutes, etc.). In some embodiments, the horizon over which the sustained effort is calculated is longer than the horizon over which the sustained power is calculated. In some embodiments, the value of Pbat,max,effort is set to a fixed fraction or percentage of ΔPbat,max,charge or ΔPbat,max,discharge (e.g., 75%) and may be received as an input to maximumsustained effort adjuster 528. - Maximum
sustained effort adjuster 528 can calculate a moving average of the change in the battery power signal Pbat between sets of consecutive time steps using a set of previous values of the battery power signal Pbat . For example, maximumsustained effort adjuster 528 can calculate a moving average of the change in the battery power signal Pbat at each time step k using the following equation:
ΔP bat,k is the moving average of the change in the battery power signal Pbat,k over the last h time steps. Notably, both increases and decreases in the battery power signal Pbat qualify as a positive "effort" due to the absolute value in the moving average calculation. Maximumsustained effort adjuster 528 can actively adjust the battery power signal Pbat to ensure that the moving averageΔP bat,k is less than the maximum sustained effort parameter P bat,max,effort. - Maximum
sustained effort adjuster 528 can calculate the number of time steps required for the current value of the battery power signal Pbat,k to reach the maximum sustained effort Pbat,max,effort based on the maximum allowable change in the charging or discharging power (i.e., ΔPbat,max,charge or ΔP bat,max,discharge) between consecutive time steps k - 1 and k. For example, maximumsustained effort adjuster 528 can calculate the required number of time steps required for the current value of the battery power signal Pbat,k to reach the maximum sustained effort Pbat,maxeffort using the following equation:
battery 108 is charging or ΔPbat,max,discharge ifbattery 108 is discharging. - Maximum
sustained effort adjuster 528 can calculate the average effort addedE added using the following equation:

ΔP bat,k is calculated. Maximumsustained effort adjuster 528 can calculate an effort margin Emargin using the following equation:
- Maximum
sustained effort adjuster 528 can calculate a sustained effort bound Esustained,Bound using the following equation:
- If the battery power signal Pbat,k at time step k is less than -Esustained,Bound, maximum
sustained effort adjuster 528 may adjust the battery power signal Pbat,k toward the maximum sustained effort -Pbat,max,effort at a rate of ΔPbat,max,charge. Similarly, if the battery power signal Pbat,k at time step k is greater than -Esustained,Bound, maximumsustained effort adjuster 528 may adjust the battery power signal Pbat,k toward the maximum sustained effort Pbat,max,effort at a rate of -ΔPbat,max,discharge. However, if the battery power signal Pbat,k at time step k is between -Esustained,Bound and Esustained,Bound, maximumsustained effort adjuster 528 may not adjust the battery power signal Pbat,k. - Referring now to
FIG. 10 , agraph 1000 illustrating the adjustments to the battery power signal Pbat performed by maximumsustained power adjuster 526 and maximumsustained effort adjuster 528 is shown, according to an exemplary embodiment. Ingraph 1000,line 1002 represents the unbounded battery power
line 1004 represents the battery power signal Pbat after being adjusted by maximumsustained power adjuster 526 and maximumsustained effort adjuster 528.Line 1006 represents the sustained power moving average of Pbat at each time step k (i.e.,P bat,k ) based on the values of Pbat within a moving time window that ends at time step k.Line 1008 represents the sustained effort moving average of ΔPbat at each time step k (i.e.,Δ P bat,k ) based on the values of Pbat within a moving time window that ends at time step k. Line 1010 represents the maximum sustained discharging power Pbat,max,discharge_sustained andline 1012 represents the maximum sustained effort Pbat,max,effort. - Between time t 0 and time t 1, the battery power signal Pbat matches the unbounded battery power


P bat,k is below the maximum sustained discharging power Pbat,max,discharge_sustained but continues to increase with each time step k. As the sustained power moving averageP bat,k approaches the maximum sustained discharging power Pbat,max,discharge_sustained, the sustained power discharge bound Psustained,DishargeBound decreases until it reaches the value of Pbat at time t 1. - At time t 1, maximum
sustained power adjuster 526 determines that the value of Pbat exceeds the sustained power discharge bound Psustained,DishargeBound . Consequently, maximumsustained power adjuster 526 adjusts the battery power signal Pbat toward the maximum sustained discharge power Pbat,max,discharge_sustained at a rate of -ΔPbat,max,discharge, which represents the slope ofline 904 between time t 1 and time t 2. The battery power signal Pbat and the sustained power discharge bound Psustained,DishargeBound both continue to decrease until they reach the maximum sustained discharge power Pbat,max,discharge_sustained at time t 2. - At time t 2, the sustained power moving average
P bat,k reaches the maximum sustained discharge power Pbat,max,discharge-sustained . Accordingly, any value of Pbat above maximum sustained discharge power Pbat,max,discharge_sustained would cause the sustained power moving averageP bat,k to exceed the maximum sustained discharge power Pbat,max,discharge_sustained. Thus, maximumsustained power adjuster 526 sets the battery power signal Pbat equal to the maximum sustained discharge power Pbat,max,discharge_sustained. - At time t 3, maximum
sustained effort adjuster 528 determines that the value of Pbat exceeds the sustained effort bound Esustained,Bound . Consequently, maximumsustained effort adjuster 528 adjusts the battery power signal Pbat toward the maximum sustained effort Pbat,max,effort at a rate of -ΔPbat,max,discharge, which represents the slope ofline 1004 between time t 3 and time t 4. The battery power signal Pbat and the sustained effort bound Esustained,Bound both continue to decrease until they reach the maximum sustained effort Pbat,max,effort at time t 4. - At time t 4, the sustained effort moving average
Δ P bat,k reaches the maximum sustained effort Pbat,max,effort . Accordingly, any further changes in the value of Pbat that exceed the maximum sustained effort Pbat,max,effort would cause the sustained effort moving average ΔPbat,k to exceed the maximum sustained effort Pbat,max,effort . Thus, maximumsustained effort adjuster 528 sets the battery power signal Pbat equal to the maximum sustained effort Pbat,max,effort - Referring now to
FIG. 11 , a flowchart of aprocess 1100 for controlling an amount of power stored or discharged from a battery in a frequency response control system is shown, according to an exemplary embodiment.Process 1100 can be performed by one or more components of frequencyresponse optimization system 100 including, for example,frequency response controller 112 andpower inverter 106. -
Process 1100 is shown to include generating an objective function that accounts for both frequency response revenue and a cost of battery degradation as a function of battery power setpoints (step 1102). One example of an objective function which can be generated instep 1102 is shown in the following equation:

- As discussed above, the battery power setpoints Pbat affect the frequency response ResFR of
system 100 and consequently affect how closely the frequency response ResFR tracks the regulation signal Regsignal. For example, the frequency response ResFR can be defined as a function of the battery power Pbat as shown in the following equation:
battery degradation estimator 418. -
Process 1100 is shown to include using clipping parameters to generate and impose constraints on the battery power setpoints (step 1104). The clipping parameters used instep 1104 may include, for example, a maximum battery charging power parameter Pbat,max,charge , a maximum battery discharging power parameter Pbat,max,discharge, a maximum change in charging power parameter ΔPbat,max,charge, a maximum change in discharging power parameter ΔPbat,max,discharge, a maximum sustained charging power parameter Pbat,max,charge_sustained, a maximum sustained discharging power parameter Pbat,max,discharge_sustained, and/or a maximum sustained effort parameter Pbat,max,effort. - In some embodiments, the battery power Pbat,k is constrained using the maximum battery charging power parameter Pbat,max,charge and the maximum battery discharging power parameter Pbat,max,discharge. For example, the battery power Pbat,k can be constrained as follows:


- In some embodiments, the battery power Pbat,k is constrained using the maximum change in charging power parameter ΔPbat,max,charge and the maximum change in discharging power parameter ΔPbat,max,discharge. For example, the battery power Pbat,k can be constrained as follows:


- The first set of constraints specify that the value of Pbat cannot increase or decrease by more than ΔPbat,max,charge between time step k - 1 and time step k when
battery 108 is charging (i.e., when Pbat,clip,k < 0). Accordingly, if the clipped battery power Pbat,clip,k at time step k is less than the battery power setpoint P bat,k-1 at time step k - 1 by an amount that exceeds ΔPbat,max,charge (i.e., P bat,k-1 - Pbat,clip,k > ΔPbat,max,charge ), the battery power setpoint Pbat,k at time step k will be set to P bat,k-1 - ΔPbat,max,charge . Similarly, if the clipped battery power Pbat,clip,k at time step k exceeds the battery power setpoint P bat.k-1 at time step k - 1 by an amount that exceeds ΔPbat,max,charge (i.e., Pbat,clip,k - P bαt,k-1 > ΔPbat,max,charge ), the battery power setpoint Pbat,k at time step k will be set to P bat,k-1 + ΔPbat,max,charge . However, if the absolute value of the difference between the clipped battery power Pbat,clip,k at time step k and the battery power setpoint P bat,k-1 at time step k - 1 is less than or equal to ΔPbat,max,charge (i.e., |Pbat,clip,k - P bat,k-1| ≤ ΔPbat,max,charge ), the battery power setpoint Pbat,k at time step k will be equal to the clipped battery power Pbat,clip,k at time step k. - The second set of constraints specify that the value of Pbat cannot increase or decrease by more than ΔPbat,max,discharge between time step k - 1 and time step k when
battery 108 is discharging (i.e., when Pbat,clip,k > 0). Accordingly, if the clipped battery power Pbat,clip,k at time step k is less than the battery power setpoint P bat,k-1 at time step k - 1 by an amount that exceeds ΔPbat,max,discharge (i.e., P bat,k-1 - Pbat,clip,k > ΔPbat,max,discharge ), the battery power setpoint Pbat,k at time step k will be set to P bat,k-1 - ΔPbat,max,discharge. Similarly, if the clipped battery power Pbat,clip,k at time step k exceeds the battery power setpoint P bat,k-1 at time step k - 1 by an amount that exceeds ΔPbat,max,discharge (i.e., Pbat,clip,k - P bat,k-1 > ΔPbat,max,discharge ), the battery power setpoint Pbat,k at time step k will be set to P bat,k-1 + ΔPbat,max,charge. However, if the absolute value of the difference between the clipped battery power Pbat,clip,k at time step k and the battery power setpoint P bat,k-1 at time step k - 1 is less than or equal to ΔPbat,max,discharge (i.e., |Pbat,clip,k - P bat,k-1| ≤ ΔPbat,max,discharge ), the battery power setpoint Pbat,k at time step k will be equal to the clipped battery power Pbat,clip,k at time step k. - Still referring to
FIG. 11 ,process 1100 is shown to include optimizing the objective function subject to the constraints to determine optimal values of the clipping parameters (step 1106). In some embodiments, the optimization performed instep 1106 uses the maximum battery charging power parameter Pbat,max,charge and the maximum battery discharging power parameter Pbat,max,discharge as the variables to be optimized. Larger values Pbat,max,charge and Pbat,max,discharge result in less clipping of the unbounded battery power
- Conversely, smaller values of Pbat,max,charge and Pbat,max,discharge result in more clipping of the unbounded battery power

step 1106 results in values of Pbat,max,charge and Pbat,max,discharge that represent an optimal tradeoff between frequency response revenue and battery degradation costs (i.e., the frequency response that maximizes the objective function J). - In some embodiments, the optimization performed in
step 1106 optimizes both Pbat,max,charge and Pbat,max,discharge simultaneously. In other words, the optimization may be a multi-variable optimization. However, it is contemplated that the optimization can be a single-variable optimization in other embodiments. For example, Pbat,max,charge and Pbat,max,discharge can be set equal to each other (i.e., Pbat,max,charge = Pbat,max,discharge = Pbat,max ) and treated as a single variable in the optimization. Alternatively, either Pbat,max,charge or Pbat,max,discharge can be omitted from the optimization such that the optimization is performed using only a single optimization variable. - In some embodiments, the optimization performed in
step 1106 uses the maximum change in charging power parameter ΔPbat,max,charge and the maximum change in discharging power parameter ΔPbat,max,discharge as the variables to be optimized. Larger values ΔPbat,max,charge and ΔPbat,max,discharge result in less clipping of the battery power Pbat,clip and therefore allow ResFR to closely track the regulation signal Regsignal . Closely tracking the regulation signal Regsignal may result in higher performance scores, thereby increasing the frequency response revenue. However, closely tracking the regulation signal may also increase the cost of battery degradation λbat . - Conversely, smaller values of ΔPbat,max,charge and ΔPbat,max,discharge result in more clipping of the battery power Pbat,clip and therefore cause ResFR to track the regulation signal Regsignal less closely. Tracking the regulation signal Regsignal less closely may result in lower performance scores, thereby decreasing the frequency response revenue. However, tracking the regulation signal less closely may also decrease the cost of battery degradation λbat. The optimization performed in
step 1106 results in values of ΔPbat,max,charge and ΔPbat,max,discharge that represent an optimal tradeoff between frequency response revenue and battery degradation costs (i.e., the frequency response that maximizes the objective function J). - In some embodiments, the optimization performed in
step 1106 optimizes both ΔPbat,max,charge and ΔPbat,max,discharge simultaneously. In other words, the optimization may be a multi-variable optimization. However, it is contemplated that the optimization can be a single-variable optimization in other embodiments. For example, ΔPbat,max,charge and ΔPbat,max,discharge can be set equal to each other (i.e., ΔPbat,max,charge = ΔPbat,max,discharge = ΔPbat,max ) and treated as a single variable in the optimization. Alternatively, either ΔPbat,max,charge or ΔPbat,max,discharge can be omitted from the optimization such that the optimization is performed using only a single optimization variable. - The optimization performed in
step 1106 may optimize the objective function J using sequential quadratic programming, dynamic programming, or any other optimization technique. The optimal values of Pbat,max,charge, Pbat,max,discharge, Pbat,max, ΔPbat,max,charge, ΔPbat,max,discharge, and/or ΔPbat,max can be output as clipping parameters tolow level controller 314 for use in adjusting the battery power setpoints Pbat. - Still referring to
FIG. 11 ,process 1100 is shown to include using the optimal values of the clipping parameters to adjust battery power setpoints (step 1108). In some embodiments,step 1108 is performed bylow level controller 314. In some embodiments,step 1108 includes applying the optimal clipping parameters Pbat,max,charge and Pbat,max,discharge to the unbounded power signal



- In some embodiments, step 1108 includes applying the maximum change in charging power parameter ΔPbat,max,charge and the maximum change in discharging power parameter ΔPbat,max,discharge to the clipped power signal Pbat,clip as shown in the following equations:


- In some embodiments,
step 1108 includes adjusting the battery power signal Pbat as described with reference to zerocross adjuster 524 to ensure that the battery power signal Pbat crosses zero at approximately the same time (or closer to the same time) as the unbounded battery power
step 1108 includes adjusting the battery power signal Pbat as described with reference to maximumsustained power adjuster 526 and/or maximumsustained effort adjuster 528 to ensure that the moving average of the battery power Pbat or change in battery power ΔPbat does not exceed the maximum sustained power parameters and/or the maximum sustained effort parameters. These and other examples of how the power signal Pbat can be adjusted are described in detail with reference to batterypower signal clipper 518 and illustrated inFIGS. 6-10 . - Still referring to
FIG. 11 ,process 1100 is shown to include using the adjusted battery power setpoints to control an amount of power stored or discharged from a battery (step 1110). For example, the adjusted battery power setpoints Pbat,k can be provided as an input topower inverter 106.Power inverter 106 can use the battery power setpoints Pbat,k to control the amount of power stored inbattery 108 or discharged frombattery 108 at each time step k. - Referring now to
FIG. 12 , a flowchart of aprocess 1200 for generating optimal values of a maximum charging power parameter Pbat,max,charge and a maximum discharging power parameter Pbat,max,discharge is shown, according to an exemplary embodiment.Process 1200 can be performed by one or more components of frequencyresponse optimization system 100 such asfrequency response controller 112. In some embodiments,process 1200 is performed by one or more components ofhigh level controller 312 such asclipping parameters optimizer 428. -
Process 1200 is shown to include transforming a frequency regulation signal into a power signal (step 1202). In some embodiments,step 1202 includes calculating a power signal Powersignal by multiplying the regulation signal Regsignal by the value of Regaward and adding the midpoint b, as shown in the following equation:

POI 110 andenergy grid 104, which is the sum of the campus power Pcampus and the desired battery power
- In some embodiments,
step 1202 includes calculating the desired battery power


step 1202 may be either the power signal Powersignal or the unbounded battery power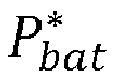
-
Process 1200 is shown to include clipping the power signal using the maximum charging power parameter Pbat,max,charge and the maximum discharging power parameter Pbat,max,discharge (step 1204).Step 1204 may include applying the clipping parameters Pbat,max,charge and Pbat,max,discharge to the unbounded power signal


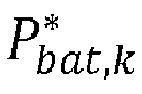


-
Process 1200 is shown to include using the clipped power signal to calculate a performance score, frequency response revenue, and a cost of battery degradation (step 1206). As discussed above, the value of Pbat affects the frequency response ResFR ofsystem 100 and consequently affects how closely the frequency response ResFR tracks the regulation signal Regsignal. For example, the frequency response ResFR can be defined as a function of the battery power Pbat as shown in the following equation:
-
Step 1206 may include using the frequency response ResFR to calculate the components of the performance score (i.e., PSacc, PSdelay, and PSprec ) as described with reference to filter parameters optimizer 426.Step 1206 may include substituting ResFR for Ressignal to calculate the monetized cost of battery degradation λbat,k as described with reference tobattery degradation estimator 418. -
Process 1200 is shown to include generating an objective function that accounts for frequency response revenue and the cost of battery degradation (step 1208). One example of an objective function which can be generated instep 1208 is shown in the following equation:

-
Process 1200 is shown to include optimizing the objective function to determine optimal values of the maximum charging power parameter Pbat,max,charge and the maximum discharging power parameter Pbat,max,discharge (step 1210). In some embodiments, the optimization performed instep 1210 uses the maximum battery charging power parameter Pbat,max,charge and the maximum battery discharging power parameter Pbat,max,discharge as the variables to be optimized. Larger values Pbat,max,charge and Pbat,max,discharge result in less clipping of the unbounded battery power
- Conversely, smaller values of Pbat,max,charge and Pbat,max,discharge result in more clipping of the unbounded battery power

step 1210 results in values of Pbat,max,charge and Pbat,max,discharge that represent an optimal tradeoff between frequency response revenue and battery degradation costs (i.e., the frequency response that maximizes the objective function J). - In some embodiments, the optimization performed in
step 1210 optimizes both Pbat,max,charge and Pbat,max,discharge simultaneously. In other words, the optimization may be a multi-variable optimization. However, it is contemplated that the optimization can be a single-variable optimization in other embodiments. For example, Pbat,max,charge and Pbat,max,discharge can be set equal to each other (i.e., Pbat,max,charge = Pbat,max,discharge = Pbat,max ) and treated as a single variable in the optimization. Alternatively, either Pbat,max,charge or Pbat,max,discharge can be omitted from the optimization such that the optimization is performed using only a single optimization variable. The optimization performed instep 1210 may optimize the objective function J using sequential quadratic programming, dynamic programming, or any other optimization technique. - Referring now to
FIG. 13 , a flowchart of aprocess 1300 for generating optimal values of a maximum change in charging power parameter ΔPbat,max,charge and a maximum change in discharging power parameter ΔPbat,max,discharge is shown, according to an exemplary embodiment.Process 1300 can be performed by one or more components of frequencyresponse optimization system 100 such asfrequency response controller 112. In some embodiments,process 1300 is performed by one or more components ofhigh level controller 312 such asclipping parameters optimizer 428. -
Process 1300 is shown to include transforming a frequency regulation signal into a power signal (step 1302). In some embodiments,step 1302 includes calculating a power signal Powersignal by multiplying the regulation signal Regsignal by the value of Regaward and adding the midpoint b, as shown in the following equation:

POI 110 andenergy grid 104, which is the sum of the campus power Pcampus and the desired battery power
- In some embodiments,
step 1302 includes calculating the desired battery power


step 1302 may be either the power signal Powersignal or the unbounded battery power
-
Process 1300 is shown to include clipping the power signal using the optimal maximum charging power parameter Pbat,max,charge and the optimal maximum discharging power parameter Pbat,max,discharge (step 1304). In some embodiments, the optimal values of Pbat,max,charge and Pbat,max,discharge are generated by performingprocess 1200.Step 1304 may include applying the optimal clipping parameters Pbat,max,charge and Pbat,max,discharge to the unbounded power signal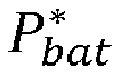


-
Process 1300 is shown to include clipping the power signal using the maximum change in charging power parameter ΔPbat,max,charge and the maximum change in discharging power parameter ΔPbat,max,discharge (step 1306). Step 1306 may include applying the maximum change in charging power parameter ΔPbat,max,charge and the maximum change in discharging power parameter ΔPbat,max,discharge to the clipped power signal Pbat,clip as shown in the following equations:

- The first set of equations specify that the value of Pbat cannot increase or decrease by more than ΔPbat,max,charge between time step k - 1 and time step k when
battery 108 is charging (i.e., when Pbat,clip,k < 0). Accordingly, if the clipped battery power Pbat,clip,k at time step k is less than the battery power setpoint P bat.k-1 at time step k - 1 by an amount that exceeds ΔPbat,max,charge (i.e., P bat,k-1 - Pbat,clip,k > ΔPbat,max,charge ),step 1306 may include setting the battery power setpoint Pbat,k at time step k to P bat,k-1 - ΔPbat,max,charge . Similarly, if the clipped battery power Pbat,clip,k at time step k exceeds the battery power setpoint P bat,k-1 at time step k - 1 by an amount that exceeds ΔPbat,max,charge (i.e., Pbat,clip,k - P bat,k-1 > ΔPbat,max,charge ),step 1306 may include setting the battery power setpoint Pbat,k at time step k to P bat,k-1 + ΔPbat,max,charge . However, if the absolute value of the difference between the clipped battery power Pbat,clip,k at time step k and the battery power setpoint P bat,k-1 at time step k - 1 is less than or equal to ΔPbat,max,charge (i.e., |Pbat,clip,k - Pbαt, k-1| ≤ ΔPbat,max,charge ),step 1306 may include setting the battery power setpoint Pbat,k at time step k equal to the clipped battery power Pbat,clip,k at time step k. - The second set of equations specify that the value of Pbat cannot increase or decrease by more than ΔPbat,max,discharge between time step k - 1 and time step k when
battery 108 is discharging (i.e., when Pbat,clip,k > 0). Accordingly, if the clipped battery power Pbat,clip,k at time step k is less than the battery power setpoint P bat,k-1 at time step k - 1 by an amount that exceeds ΔPbat,max,discharge (i.e., P bat,k-1 - Pbat,clip,k > ΔPbat,max,discharge ),step 1306 may include setting the battery power setpoint Pbat,k at time step k to P bat,k-1 - ΔPbat,max,discharge . Similarly, if the clipped battery power Pbat,clip,k at time step k exceeds the battery power setpoint P bat,k-1 at time step k - 1 by an amount that exceeds ΔPbat,max,discharge (i.e., Pbat,clip,k - P bat,k-1 > ΔPbat,max,discharge ),step 1306 may include setting the battery power setpoint Pbat,k at time step k to P bat,k-1 + ΔPbat,max,charge . However, if the absolute value of the difference between the clipped battery power Pbat,clip,k at time step k and the battery power setpoint P bat,k-1 at time step k - 1 is less than or equal to ΔPbat,max,discharge (i.e., |Pbat,clip,k - P bat,k-1| ≤ ΔPbat,max,discharge ),step 1306 may include setting the battery power setpoint Pbat,k at time step k equal to the clipped battery power Pbat,clip,k at time step k. -
Process 1300 is shown to include using the clipped power signal to calculate a performance score, frequency response revenue, and a cost of battery degradation (step 1308). As discussed above, the value of Pbat affects the frequency response ResFR ofsystem 100 and consequently affects how closely the frequency response ResFR tracks the regulation signal Regsignal. For example, the frequency response ResFR can be defined as a function of the battery power Pbat as shown in the following equation:
-
Step 1308 may include using the frequency response ResFR to calculate the components of the performance score (i.e., PSacc, PSdelay, and PSprec ) as described with reference to filter parameters optimizer 426.Step 1308 may include substituting ResFR for Ressignal to calculate the monetized cost of battery degradation λbat,k as described with reference tobattery degradation estimator 418. -
Process 1300 is shown to include generating an objective function that accounts for frequency response revenue and the cost of battery degradation (step 1310). One example of an objective function which can be generated instep 1310 is shown in the following equation:

-
Process 1300 is shown to include optimizing the objective function to determine optimal values of the maximum change in charging power parameter ΔPbat,max,charge and the maximum change in discharging power parameter ΔPbat,max,discharge (step 1312). In some embodiments, the optimization performed instep 1312 uses the maximum change in charging power parameter ΔPbat,max,charge and the maximum change in discharging power parameter ΔPbat,max,discharge as the variables to be optimized. Larger values ΔPbat,max,charge and ΔPbat,max,discharge result in less clipping of the battery power Pbat,clip and therefore allow ResFR to closely track the regulation signal Regsignal . Closely tracking the regulation signal Regsignal may result in higher performance scores, thereby increasing the frequency response revenue. However, closely tracking the regulation signal may also increase the cost of battery degradation λbat. - Conversely, smaller values of ΔPbat,max,charge and ΔPbat,max,discharge result in more clipping of the battery power Pbat,clip and therefore cause ResFR to track the regulation signal Regsignal less closely. Tracking the regulation signal Regsignal less closely may result in lower performance scores, thereby decreasing the frequency response revenue. However, tracking the regulation signal less closely may also decrease the cost of battery degradation λbat. The optimization performed in
step 1312 results in values of ΔPbat,max,charge and ΔPbat,max,discharge that represent an optimal tradeoff between frequency response revenue and battery degradation costs (i.e., the frequency response that maximizes the objective function J). - In some embodiments, the optimization performed in
step 1312 optimizes both ΔPbat,max,charge and ΔPbat,max,discharge simultaneously. In other words, the optimization may be a multi-variable optimization. However, it is contemplated that the optimization can be a single-variable optimization in other embodiments. For example, ΔPbat,max,charge and ΔPbat,max,discharge can be set equal to each other (i.e., ΔPbat,max,charge = ΔPbat,max,discharge = ΔPbat,max ) and treated as a single variable in the optimization. Alternatively, either ΔPbat,max,charge or ΔPbat,max,discharge can be omitted from the optimization such that the optimization is performed using only a single optimization variable. The optimization performed instep 1312 may optimize the objective function J using sequential quadratic programming, dynamic programming, or any other optimization technique. - The construction and arrangement of the systems and methods as shown in the various exemplary embodiments are illustrative only. Although only a few embodiments have been described in detail in this disclosure, many modifications are possible (e.g., variations in sizes, dimensions, structures, shapes and proportions of the various elements, values of parameters, mounting arrangements, use of materials, colors, orientations, etc.). For example, the position of elements may be reversed or otherwise varied and the nature or number of discrete elements or positions may be altered or varied. Accordingly, all such modifications are intended to be included within the scope of the present disclosure. The order or sequence of any process or method steps may be varied or re-sequenced according to alternative embodiments. Other substitutions, modifications, changes, and omissions may be made in the design, operating conditions and arrangement of the exemplary embodiments without departing from the scope of the present disclosure.
- The present disclosure contemplates methods, systems and program products on any machine-readable media for accomplishing various operations. The embodiments of the present disclosure may be implemented using existing computer processors, or by a special purpose computer processor for an appropriate system, incorporated for this or another purpose, or by a hardwired system. Embodiments within the scope of the present disclosure include program products comprising machine-readable media for carrying or having machine-executable instructions or data structures stored thereon. Such machine-readable media can be any available media that can be accessed by a general purpose or special purpose computer or other machine with a processor. By way of example, such machine-readable media can comprise RAM, ROM, EPROM, EEPROM, CD-ROM or other optical disk storage, magnetic disk storage or other magnetic storage devices, or any other medium which can be used to carry or store desired program code in the form of machine-executable instructions or data structures and which can be accessed by a general purpose or special purpose computer or other machine with a processor. Combinations of the above are also included within the scope of machine-readable media. Machine-executable instructions include, for example, instructions and data which cause a general purpose computer, special purpose computer, or special purpose processing machines to perform a certain function or group of functions.
- Although the figures show a specific order of method steps, the order of the steps may differ from what is depicted. Also two or more steps may be performed concurrently or with partial concurrence. Such variation will depend on the software and hardware systems chosen and on designer choice. All such variations are within the scope of the disclosure. Likewise, software implementations could be accomplished with standard programming techniques with rule based logic and other logic to accomplish the various connection steps, processing steps, comparison steps and decision steps.
Claims (15)
- A frequency response control system comprising:- a battery configured to store and discharge electric power;- a power inverter configured to control an amount of the electric power stored or discharged from the battery at each of a plurality of time steps during a frequency response period; and- a frequency response controller comprising:wherein the power inverter is configured to use the modified battery power setpoints to control the amount of the electric power stored or discharged from the battery.- a high level controller configured to determine values of clipping parameters; and- a low level controller configured to use the values of the clipping parameters to modify battery power setpoints;
- The frequency response control system of Claim 1,
wherein the high level controller is configured to determine the values of the clipping parameters by:- generating an objective function that accounts for both frequency response revenue and a cost of battery degradation as a function of the battery power setpoints modified by the clipping parameters; and- optimizing the objective function to generate the values of the clipping parameters. - The frequency response control system of Claim 1 or 2,
wherein the clipping parameters comprise at least one of:- a battery charging power parameter that defines a maximum allowable rate at which the electric power can be stored in the battery; or- a battery discharging power parameter that defines a maximum allowable rate at which the electric power can be discharged from the battery. - The frequency response control system of Claim 3,
wherein using the values of the clipping parameters to modify the battery power setpoints comprises:- comparing a battery power setpoint to the battery charging power parameter and the battery discharging power parameter;- setting the battery power setpoint equal to the battery charging power parameter in response to a determination that the battery power setpoint would cause the battery to charge at a rate that violates the battery charging power parameter; and- setting the battery power setpoint equal to the battery discharging power parameter in response to a determination that the battery power setpoint would cause the battery to discharge at a rate that violates the battery discharging power parameter. - The frequency response control system of one of Claims 1 to 4,
wherein the clipping parameters comprise at least one of:- a change in charging power parameter that defines a maximum change in the amount of electric power stored in the battery between consecutive time steps; or- a change in discharging power parameter that defines a maximum change in the amount of electric power discharged from the battery between consecutive time steps. - The frequency response control system of Claim 5,
wherein using the values of the clipping parameters to modify the battery power setpoints comprises:- calculating a difference between a first battery power setpoint for a first time step and a second battery power setpoint for a second time step consecutive with the first time step;- comparing the difference to the change in charging power parameter; and- setting the second battery power setpoint equal to the first battery power setpoint plus or minus the change in charging power parameter in response to a determination that the difference exceeds the change in charging power parameter. - The frequency response control system of Claim 5,
wherein using the values of the clipping parameters to modify the battery power setpoints comprises:- calculating a difference between a first battery power setpoint for a first time step and a second battery power setpoint for a second time step consecutive with the first time step;- comparing the difference to the change in discharging power parameter; and- setting the second battery power setpoint equal to the first battery power setpoint plus or minus the change in discharging power parameter in response to a determination that the difference exceeds the change in discharging power parameter. - The frequency response control system of one of Claims 1 to 7,
wherein the frequency response controller is configured to:- receive a frequency regulation signal from an incentive provider;- transform the frequency regulation signal into a power signal comprising a time series of the battery power setpoints. - A method for controlling an amount of electric power stored or discharged from a battery in a frequency response control system, the method comprising:- operating a high level controller to determine values of clipping parameters;- providing the values of the clipping parameters from the high level controller to a low level controller;- operating the low level controller to modify battery power setpoints using the values of the clipping parameters; and- using the modified battery power setpoints to control the amount of the electric power stored or discharged from the battery.
- The method of Claim 9,
wherein operating the high level controller to determine the values of the clipping parameters comprises:- generating an objective function that accounts for both frequency response revenue and a cost of battery degradation as a function of the battery power setpoints modified by the clipping parameters; and- optimizing the objective function to generate the values of the clipping parameters. - The method of Claim 9 or 10,
wherein the clipping parameters comprise at least one of:- a battery charging power parameter that defines a maximum allowable rate at which the electric power can be stored in the battery; or- a battery discharging power parameter that defines a maximum allowable rate at which the electric power can be discharged from the battery. - The method of Claim 11,
wherein using the values of the clipping parameters to modify the battery power setpoints comprises:- comparing a battery power setpoint to the battery charging power parameter and the battery discharging power parameter;- setting the battery power setpoint equal to the battery charging power parameter in response to a determination that the battery power setpoint would cause the battery to charge at a rate that violates the battery charging power parameter; and- setting the battery power setpoint equal to the battery discharging power parameter in response to a determination that the battery power setpoint would cause the battery to discharge at a rate that violates the battery discharging power parameter. - The method of one of Claims 9 to 12,
wherein the clipping parameters comprise at least one of:- a change in charging power parameter that defines a maximum change in the amount of electric power stored in the battery between consecutive time steps; or- a change in discharging power parameter that defines a maximum change in the amount of electric power discharged from the battery between consecutive time steps. - The method of Claim 13,
wherein using the values of the clipping parameters to modify the battery power setpoints comprises:- calculating a difference between a first battery power setpoint for a first time step and a second battery power setpoint for a second time step consecutive with the first time step;- comparing the difference to the change in charging power parameter; and- setting the second battery power setpoint equal to the first battery power setpoint plus or minus the change in charging power parameter in response to a determination that the difference exceeds the change in charging power parameter. - The method of Claim 13,
wherein using the values of the clipping parameters to modify the battery power setpoints comprises:- calculating a difference between a first battery power setpoint for a first time step and a second battery power setpoint for a second time step consecutive with the first time step;- comparing the difference to the change in discharging power parameter; and- setting the second battery power setpoint equal to the first battery power setpoint plus or minus the change in discharging power parameter in response to a determination that the difference exceeds the change in discharging power parameter.
Applications Claiming Priority (1)
| Application Number | Priority Date | Filing Date | Title |
|---|---|---|---|
| US15/887,575 US12362562B2 (en) | 2018-02-02 | 2018-02-02 | Frequency response control system with clipping parameter determination |
Publications (2)
| Publication Number | Publication Date |
|---|---|
| EP3522323A1 true EP3522323A1 (en) | 2019-08-07 |
| EP3522323B1 EP3522323B1 (en) | 2024-07-03 |
Family
ID=65278205
Family Applications (1)
| Application Number | Title | Priority Date | Filing Date |
|---|---|---|---|
| EP19154979.9A Active EP3522323B1 (en) | 2018-02-02 | 2019-02-01 | Frequency response control system with clipping parameter determination |
Country Status (2)
| Country | Link |
|---|---|
| US (1) | US12362562B2 (en) |
| EP (1) | EP3522323B1 (en) |
Families Citing this family (16)
| Publication number | Priority date | Publication date | Assignee | Title |
|---|---|---|---|---|
| US20190137956A1 (en) * | 2017-11-06 | 2019-05-09 | Nec Laboratories America, Inc. | Battery lifetime maximization in behind-the-meter energy management systems |
| US12007732B2 (en) | 2019-07-12 | 2024-06-11 | Johnson Controls Tyco IP Holdings LLP | HVAC system with building infection control |
| US11960261B2 (en) | 2019-07-12 | 2024-04-16 | Johnson Controls Tyco IP Holdings LLP | HVAC system with sustainability and emissions controls |
| US12393992B2 (en) | 2018-10-18 | 2025-08-19 | Tyco Fire & Security Gmbh | Systems and methods for assessing and controlling sustainability of an energy plant |
| US11226600B2 (en) | 2019-08-29 | 2022-01-18 | Johnson Controls Tyco IP Holdings LLP | Building control system with load curtailment optimization |
| US12529490B2 (en) | 2019-07-12 | 2026-01-20 | Tyco Fire & Security Gmbh | Infection control tool for HVAC system |
| US11714393B2 (en) | 2019-07-12 | 2023-08-01 | Johnson Controls Tyco IP Holdings LLP | Building control system with load curtailment optimization |
| US12264828B2 (en) | 2019-07-12 | 2025-04-01 | Tyco Fire & Security Gmbh | Air quality control and disinfection system |
| US11099530B2 (en) | 2019-08-23 | 2021-08-24 | Johnson Controls Technology Company | Central plant control system with device geometric modeling and control |
| US11144020B2 (en) | 2019-08-23 | 2021-10-12 | Johnson Controls Tyco IP Holdings LLP | Central plant control system with geometric modeling of operational sequences |
| US20220166242A1 (en) * | 2020-11-20 | 2022-05-26 | Microsoft Technology Licensing, Llc | Dynamic discharge rate control |
| US12261434B2 (en) | 2022-02-10 | 2025-03-25 | Tyco Fire & Security Gmbh | Control system with multi-factor carbon emissions optimization |
| US12398905B2 (en) | 2021-05-28 | 2025-08-26 | Tyco Fire & Security Gmbh | Building control system with multi-objective control of carbon emissions and occupant comfort |
| EP4405759A1 (en) | 2021-09-20 | 2024-07-31 | Tyco Fire & Security GmbH | Systems and methods for sustainability planning for a building |
| CN114069666B (en) * | 2021-11-10 | 2022-06-24 | 中节能风力发电股份有限公司 | Control method and system for energy storage power instruction in wind storage system |
| EP4387033A3 (en) * | 2022-12-13 | 2024-08-14 | Vestas Wind Systems A/S | Methods and systems for controlling an energy storage system to provide a frequency regulation service |
Citations (4)
| Publication number | Priority date | Publication date | Assignee | Title |
|---|---|---|---|---|
| WO2014019607A1 (en) * | 2012-07-31 | 2014-02-06 | Siemens Aktiengesellschaft | Device for an optimized operation of a local storage system in an electrical energy supply grid with distributed generators, distributed storage systems and loads |
| WO2017026287A1 (en) * | 2015-08-07 | 2017-02-16 | シャープ株式会社 | Control device, energy management device, system, and control method |
| EP3248260A1 (en) * | 2015-10-08 | 2017-11-29 | Johnson Controls Technology Company | Building management system with electrical energy storage optimization based on benefits and costs of participating in pbdr and ibdr programs |
| US20180031641A1 (en) * | 2016-07-29 | 2018-02-01 | Johnson Controls Technology Company | Electrical energy storage system with battery resistance estimation |
Family Cites Families (35)
| Publication number | Priority date | Publication date | Assignee | Title |
|---|---|---|---|---|
| JP2006129588A (en) * | 2004-10-28 | 2006-05-18 | Sanyo Electric Co Ltd | Secondary battery power control method and power supply device |
| JP5089883B2 (en) * | 2005-12-16 | 2012-12-05 | 日立ビークルエナジー株式会社 | Battery management device |
| US8527109B2 (en) | 2006-07-11 | 2013-09-03 | Regen Energy Inc. | Method and apparatus for managing an energy consuming load |
| US7580775B2 (en) | 2006-07-11 | 2009-08-25 | Regen Energy Inc. | Method and apparatus for implementing enablement state decision for energy consuming load based on demand and duty cycle of load |
| US8527108B2 (en) | 2006-07-11 | 2013-09-03 | Regen Energy Inc. | Method and apparatus for managing an energy consuming load |
| BR112012014622A2 (en) | 2009-12-16 | 2019-05-14 | Commonwealth Scientific And Industrial Research Organisation | heating, ventilation, and air conditioning (hvac) system control method of a building |
| US8478452B2 (en) * | 2010-04-06 | 2013-07-02 | Battelle Memorial Institute | Grid regulation services for energy storage devices based on grid frequency |
| US8903554B2 (en) | 2011-02-22 | 2014-12-02 | The Board Of Trustees Of The Leland Stanford Junior University | Energy plant design and operation |
| CN103748734B (en) * | 2011-08-19 | 2016-09-28 | 日本碍子株式会社 | Control the method for accumulator, the device controlling accumulator and electric power control system |
| EP2688173B1 (en) * | 2012-07-20 | 2017-03-22 | Panasonic Intellectual Property Management Co., Ltd. | Multi-service provision with energy storage system |
| US10418833B2 (en) | 2015-10-08 | 2019-09-17 | Con Edison Battery Storage, Llc | Electrical energy storage system with cascaded frequency response optimization |
| WO2015037654A1 (en) * | 2013-09-12 | 2015-03-19 | 日本電気株式会社 | Control device, electricity storage device, battery control system, battery control device, control method, battery control method, and recording medium |
| JP5915957B2 (en) * | 2014-06-06 | 2016-05-11 | パナソニックIpマネジメント株式会社 | Charge / discharge control device and charge / discharge control method |
| CA2957726C (en) | 2014-08-26 | 2023-03-14 | Johnson Solid State, Llc | Hvac control system and methods for operating same |
| US10871756B2 (en) | 2014-08-26 | 2020-12-22 | Johnson Solid State, Llc | Temperature control system and methods for operating same |
| WO2016187213A1 (en) * | 2015-05-19 | 2016-11-24 | The Regents Of The University Of California | Battery control methods and circuits, and energy storage to grid connection systems |
| US9929562B2 (en) * | 2015-06-09 | 2018-03-27 | Renewable Energy Systems Ltd. | Method and apparatus for preventing voltage flicker in a power system |
| US10190793B2 (en) | 2015-10-08 | 2019-01-29 | Johnson Controls Technology Company | Building management system with electrical energy storage optimization based on statistical estimates of IBDR event probabilities |
| US10250039B2 (en) | 2015-10-08 | 2019-04-02 | Con Edison Battery Storage, Llc | Energy storage controller with battery life model |
| US10418832B2 (en) | 2015-10-08 | 2019-09-17 | Con Edison Battery Storage, Llc | Electrical energy storage system with constant state-of charge frequency response optimization |
| US10222427B2 (en) | 2015-10-08 | 2019-03-05 | Con Edison Battery Storage, Llc | Electrical energy storage system with battery power setpoint optimization based on battery degradation costs and expected frequency response revenue |
| US10186889B2 (en) | 2015-10-08 | 2019-01-22 | Taurus Des, Llc | Electrical energy storage system with variable state-of-charge frequency response optimization |
| US10554170B2 (en) | 2015-10-08 | 2020-02-04 | Con Edison Battery Storage, Llc | Photovoltaic energy system with solar intensity prediction |
| US10742055B2 (en) | 2015-10-08 | 2020-08-11 | Con Edison Battery Storage, Llc | Renewable energy system with simultaneous ramp rate control and frequency regulation |
| US10283968B2 (en) | 2015-10-08 | 2019-05-07 | Con Edison Battery Storage, Llc | Power control system with power setpoint adjustment based on POI power limits |
| US10197632B2 (en) | 2015-10-08 | 2019-02-05 | Taurus Des, Llc | Electrical energy storage system with battery power setpoint optimization using predicted values of a frequency regulation signal |
| US10700541B2 (en) | 2015-10-08 | 2020-06-30 | Con Edison Battery Storage, Llc | Power control system with battery power setpoint optimization using one-step-ahead prediction |
| US10564610B2 (en) | 2015-10-08 | 2020-02-18 | Con Edison Battery Storage, Llc | Photovoltaic energy system with preemptive ramp rate control |
| US10389136B2 (en) | 2015-10-08 | 2019-08-20 | Con Edison Battery Storage, Llc | Photovoltaic energy system with value function optimization |
| US10614146B2 (en) * | 2015-12-17 | 2020-04-07 | Siemens Aktiengesellschaft | Adaptive demand response method using batteries with commercial buildings for grid stability and sustainable growth |
| US10592833B2 (en) * | 2016-04-01 | 2020-03-17 | Enel X North America, Inc. | Extended control in control systems and methods for economical optimization of an electrical system |
| US10263462B2 (en) * | 2016-04-27 | 2019-04-16 | Demand Energy Networks, Inc. | Electrical system control using simulation-based setpoint determination, and related systems, apparatuses, and methods |
| US10305309B2 (en) | 2016-07-29 | 2019-05-28 | Con Edison Battery Storage, Llc | Electrical energy storage system with battery state-of-charge estimation |
| US10594153B2 (en) | 2016-07-29 | 2020-03-17 | Con Edison Battery Storage, Llc | Frequency response optimization control system |
| CA3043996C (en) | 2016-08-09 | 2022-06-28 | Johnson Solid State, Llc | Temperature control system and methods for operating same |
-
2018
- 2018-02-02 US US15/887,575 patent/US12362562B2/en active Active
-
2019
- 2019-02-01 EP EP19154979.9A patent/EP3522323B1/en active Active
Patent Citations (4)
| Publication number | Priority date | Publication date | Assignee | Title |
|---|---|---|---|---|
| WO2014019607A1 (en) * | 2012-07-31 | 2014-02-06 | Siemens Aktiengesellschaft | Device for an optimized operation of a local storage system in an electrical energy supply grid with distributed generators, distributed storage systems and loads |
| WO2017026287A1 (en) * | 2015-08-07 | 2017-02-16 | シャープ株式会社 | Control device, energy management device, system, and control method |
| EP3248260A1 (en) * | 2015-10-08 | 2017-11-29 | Johnson Controls Technology Company | Building management system with electrical energy storage optimization based on benefits and costs of participating in pbdr and ibdr programs |
| US20180031641A1 (en) * | 2016-07-29 | 2018-02-01 | Johnson Controls Technology Company | Electrical energy storage system with battery resistance estimation |
Also Published As
| Publication number | Publication date |
|---|---|
| US20190245368A1 (en) | 2019-08-08 |
| US12362562B2 (en) | 2025-07-15 |
| EP3522323B1 (en) | 2024-07-03 |
Similar Documents
| Publication | Publication Date | Title |
|---|---|---|
| EP3522323B1 (en) | Frequency response control system with clipping parameter determination | |
| US11258260B2 (en) | Battery optimization control system with data fusion systems and methods | |
| US11296511B2 (en) | Energy storage controller with battery life model | |
| US11502534B2 (en) | Electrical energy storage system with battery state-of-charge estimation | |
| US10594153B2 (en) | Frequency response optimization control system | |
| US11258287B2 (en) | Using one-step ahead prediction to determine battery power setpoints | |
| US11163271B2 (en) | Cloud based building energy optimization system with a dynamically trained load prediction model | |
| US11159022B2 (en) | Building energy optimization system with a dynamically trained load prediction model | |
| US10222427B2 (en) | Electrical energy storage system with battery power setpoint optimization based on battery degradation costs and expected frequency response revenue | |
| US11061424B2 (en) | Building energy storage system with peak load contribution and stochastic cost optimization | |
| EP3413421B1 (en) | Building energy optimization system with economic load demand response (eldr) optimization | |
| US10283968B2 (en) | Power control system with power setpoint adjustment based on POI power limits | |
| US10197632B2 (en) | Electrical energy storage system with battery power setpoint optimization using predicted values of a frequency regulation signal | |
| US10742055B2 (en) | Renewable energy system with simultaneous ramp rate control and frequency regulation | |
| WO2018200861A1 (en) | Building energy system with stochastic model predictive control | |
| KR20200064731A (en) | Method for determining capacity of energy storage system and appratus for determining capacity of energy storage system | |
| WO2016151614A1 (en) | Energy management module, energy supply system, and energy supply method |
Legal Events
| Date | Code | Title | Description |
|---|---|---|---|
| PUAI | Public reference made under article 153(3) epc to a published international application that has entered the european phase |
Free format text: ORIGINAL CODE: 0009012 |
|
| STAA | Information on the status of an ep patent application or granted ep patent |
Free format text: STATUS: REQUEST FOR EXAMINATION WAS MADE |
|
| 17P | Request for examination filed |
Effective date: 20190201 |
|
| AK | Designated contracting states |
Kind code of ref document: A1 Designated state(s): AL AT BE BG CH CY CZ DE DK EE ES FI FR GB GR HR HU IE IS IT LI LT LU LV MC MK MT NL NO PL PT RO RS SE SI SK SM TR |
|
| AX | Request for extension of the european patent |
Extension state: BA ME |
|
| STAA | Information on the status of an ep patent application or granted ep patent |
Free format text: STATUS: EXAMINATION IS IN PROGRESS |
|
| 17Q | First examination report despatched |
Effective date: 20201020 |
|
| RAP1 | Party data changed (applicant data changed or rights of an application transferred) |
Owner name: JOHNSON CONTROLS TYCO IP HOLDINGS LLP |
|
| GRAP | Despatch of communication of intention to grant a patent |
Free format text: ORIGINAL CODE: EPIDOSNIGR1 |
|
| STAA | Information on the status of an ep patent application or granted ep patent |
Free format text: STATUS: GRANT OF PATENT IS INTENDED |
|
| INTG | Intention to grant announced |
Effective date: 20240126 |
|
| GRAS | Grant fee paid |
Free format text: ORIGINAL CODE: EPIDOSNIGR3 |
|
| GRAA | (expected) grant |
Free format text: ORIGINAL CODE: 0009210 |
|
| STAA | Information on the status of an ep patent application or granted ep patent |
Free format text: STATUS: THE PATENT HAS BEEN GRANTED |
|
| AK | Designated contracting states |
Kind code of ref document: B1 Designated state(s): AL AT BE BG CH CY CZ DE DK EE ES FI FR GB GR HR HU IE IS IT LI LT LU LV MC MK MT NL NO PL PT RO RS SE SI SK SM TR |
|
| REG | Reference to a national code |
Ref country code: CH Ref legal event code: EP |
|
| REG | Reference to a national code |
Ref country code: DE Ref legal event code: R096 Ref document number: 602019054448 Country of ref document: DE |
|
| REG | Reference to a national code |
Ref country code: LT Ref legal event code: MG9D |
|
| REG | Reference to a national code |
Ref country code: NL Ref legal event code: MP Effective date: 20240703 |
|
| PG25 | Lapsed in a contracting state [announced via postgrant information from national office to epo] |
Ref country code: PT Free format text: LAPSE BECAUSE OF FAILURE TO SUBMIT A TRANSLATION OF THE DESCRIPTION OR TO PAY THE FEE WITHIN THE PRESCRIBED TIME-LIMIT Effective date: 20241104 |
|
| REG | Reference to a national code |
Ref country code: AT Ref legal event code: MK05 Ref document number: 1700836 Country of ref document: AT Kind code of ref document: T Effective date: 20240703 |
|
| PG25 | Lapsed in a contracting state [announced via postgrant information from national office to epo] |
Ref country code: NL Free format text: LAPSE BECAUSE OF FAILURE TO SUBMIT A TRANSLATION OF THE DESCRIPTION OR TO PAY THE FEE WITHIN THE PRESCRIBED TIME-LIMIT Effective date: 20240703 |
|
| PG25 | Lapsed in a contracting state [announced via postgrant information from national office to epo] |
Ref country code: PT Free format text: LAPSE BECAUSE OF FAILURE TO SUBMIT A TRANSLATION OF THE DESCRIPTION OR TO PAY THE FEE WITHIN THE PRESCRIBED TIME-LIMIT Effective date: 20241104 Ref country code: NL Free format text: LAPSE BECAUSE OF FAILURE TO SUBMIT A TRANSLATION OF THE DESCRIPTION OR TO PAY THE FEE WITHIN THE PRESCRIBED TIME-LIMIT Effective date: 20240703 |
|
| PG25 | Lapsed in a contracting state [announced via postgrant information from national office to epo] |
Ref country code: NO Free format text: LAPSE BECAUSE OF FAILURE TO SUBMIT A TRANSLATION OF THE DESCRIPTION OR TO PAY THE FEE WITHIN THE PRESCRIBED TIME-LIMIT Effective date: 20241003 |
|
| PG25 | Lapsed in a contracting state [announced via postgrant information from national office to epo] |
Ref country code: GR Free format text: LAPSE BECAUSE OF FAILURE TO SUBMIT A TRANSLATION OF THE DESCRIPTION OR TO PAY THE FEE WITHIN THE PRESCRIBED TIME-LIMIT Effective date: 20241004 Ref country code: FI Free format text: LAPSE BECAUSE OF FAILURE TO SUBMIT A TRANSLATION OF THE DESCRIPTION OR TO PAY THE FEE WITHIN THE PRESCRIBED TIME-LIMIT Effective date: 20240703 Ref country code: PL Free format text: LAPSE BECAUSE OF FAILURE TO SUBMIT A TRANSLATION OF THE DESCRIPTION OR TO PAY THE FEE WITHIN THE PRESCRIBED TIME-LIMIT Effective date: 20240703 |
|
| PG25 | Lapsed in a contracting state [announced via postgrant information from national office to epo] |
Ref country code: BG Free format text: LAPSE BECAUSE OF FAILURE TO SUBMIT A TRANSLATION OF THE DESCRIPTION OR TO PAY THE FEE WITHIN THE PRESCRIBED TIME-LIMIT Effective date: 20240703 |
|
| PG25 | Lapsed in a contracting state [announced via postgrant information from national office to epo] |
Ref country code: LV Free format text: LAPSE BECAUSE OF FAILURE TO SUBMIT A TRANSLATION OF THE DESCRIPTION OR TO PAY THE FEE WITHIN THE PRESCRIBED TIME-LIMIT Effective date: 20240703 |
|
| PG25 | Lapsed in a contracting state [announced via postgrant information from national office to epo] |
Ref country code: AT Free format text: LAPSE BECAUSE OF FAILURE TO SUBMIT A TRANSLATION OF THE DESCRIPTION OR TO PAY THE FEE WITHIN THE PRESCRIBED TIME-LIMIT Effective date: 20240703 Ref country code: IS Free format text: LAPSE BECAUSE OF FAILURE TO SUBMIT A TRANSLATION OF THE DESCRIPTION OR TO PAY THE FEE WITHIN THE PRESCRIBED TIME-LIMIT Effective date: 20241103 |
|
| PG25 | Lapsed in a contracting state [announced via postgrant information from national office to epo] |
Ref country code: CZ Free format text: LAPSE BECAUSE OF FAILURE TO SUBMIT A TRANSLATION OF THE DESCRIPTION OR TO PAY THE FEE WITHIN THE PRESCRIBED TIME-LIMIT Effective date: 20240703 Ref country code: HR Free format text: LAPSE BECAUSE OF FAILURE TO SUBMIT A TRANSLATION OF THE DESCRIPTION OR TO PAY THE FEE WITHIN THE PRESCRIBED TIME-LIMIT Effective date: 20240703 |
|
| PG25 | Lapsed in a contracting state [announced via postgrant information from national office to epo] |
Ref country code: RS Free format text: LAPSE BECAUSE OF FAILURE TO SUBMIT A TRANSLATION OF THE DESCRIPTION OR TO PAY THE FEE WITHIN THE PRESCRIBED TIME-LIMIT Effective date: 20241003 Ref country code: ES Free format text: LAPSE BECAUSE OF FAILURE TO SUBMIT A TRANSLATION OF THE DESCRIPTION OR TO PAY THE FEE WITHIN THE PRESCRIBED TIME-LIMIT Effective date: 20240703 |
|
| PG25 | Lapsed in a contracting state [announced via postgrant information from national office to epo] |
Ref country code: RS Free format text: LAPSE BECAUSE OF FAILURE TO SUBMIT A TRANSLATION OF THE DESCRIPTION OR TO PAY THE FEE WITHIN THE PRESCRIBED TIME-LIMIT Effective date: 20241003 Ref country code: PL Free format text: LAPSE BECAUSE OF FAILURE TO SUBMIT A TRANSLATION OF THE DESCRIPTION OR TO PAY THE FEE WITHIN THE PRESCRIBED TIME-LIMIT Effective date: 20240703 Ref country code: NO Free format text: LAPSE BECAUSE OF FAILURE TO SUBMIT A TRANSLATION OF THE DESCRIPTION OR TO PAY THE FEE WITHIN THE PRESCRIBED TIME-LIMIT Effective date: 20241003 Ref country code: LV Free format text: LAPSE BECAUSE OF FAILURE TO SUBMIT A TRANSLATION OF THE DESCRIPTION OR TO PAY THE FEE WITHIN THE PRESCRIBED TIME-LIMIT Effective date: 20240703 Ref country code: IS Free format text: LAPSE BECAUSE OF FAILURE TO SUBMIT A TRANSLATION OF THE DESCRIPTION OR TO PAY THE FEE WITHIN THE PRESCRIBED TIME-LIMIT Effective date: 20241103 Ref country code: HR Free format text: LAPSE BECAUSE OF FAILURE TO SUBMIT A TRANSLATION OF THE DESCRIPTION OR TO PAY THE FEE WITHIN THE PRESCRIBED TIME-LIMIT Effective date: 20240703 Ref country code: GR Free format text: LAPSE BECAUSE OF FAILURE TO SUBMIT A TRANSLATION OF THE DESCRIPTION OR TO PAY THE FEE WITHIN THE PRESCRIBED TIME-LIMIT Effective date: 20241004 Ref country code: FI Free format text: LAPSE BECAUSE OF FAILURE TO SUBMIT A TRANSLATION OF THE DESCRIPTION OR TO PAY THE FEE WITHIN THE PRESCRIBED TIME-LIMIT Effective date: 20240703 Ref country code: ES Free format text: LAPSE BECAUSE OF FAILURE TO SUBMIT A TRANSLATION OF THE DESCRIPTION OR TO PAY THE FEE WITHIN THE PRESCRIBED TIME-LIMIT Effective date: 20240703 Ref country code: CZ Free format text: LAPSE BECAUSE OF FAILURE TO SUBMIT A TRANSLATION OF THE DESCRIPTION OR TO PAY THE FEE WITHIN THE PRESCRIBED TIME-LIMIT Effective date: 20240703 Ref country code: BG Free format text: LAPSE BECAUSE OF FAILURE TO SUBMIT A TRANSLATION OF THE DESCRIPTION OR TO PAY THE FEE WITHIN THE PRESCRIBED TIME-LIMIT Effective date: 20240703 Ref country code: AT Free format text: LAPSE BECAUSE OF FAILURE TO SUBMIT A TRANSLATION OF THE DESCRIPTION OR TO PAY THE FEE WITHIN THE PRESCRIBED TIME-LIMIT Effective date: 20240703 |
|
| REG | Reference to a national code |
Ref country code: DE Ref legal event code: R081 Ref document number: 602019054448 Country of ref document: DE Owner name: TYCO FIRE & SECURITY GMBH, CH Free format text: FORMER OWNER: JOHNSON CONTROLS TYCO IP HOLDINGS LLP, MILWAUKEE, WI, US |
|
| RAP2 | Party data changed (patent owner data changed or rights of a patent transferred) |
Owner name: TYCO FIRE & SECURITY GMBH |
|
| REG | Reference to a national code |
Ref country code: DE Ref legal event code: R097 Ref document number: 602019054448 Country of ref document: DE |
|
| P01 | Opt-out of the competence of the unified patent court (upc) registered |
Free format text: CASE NUMBER: APP_10021/2025 Effective date: 20250227 |
|
| PG25 | Lapsed in a contracting state [announced via postgrant information from national office to epo] |
Ref country code: RO Free format text: LAPSE BECAUSE OF FAILURE TO SUBMIT A TRANSLATION OF THE DESCRIPTION OR TO PAY THE FEE WITHIN THE PRESCRIBED TIME-LIMIT Effective date: 20240703 Ref country code: SM Free format text: LAPSE BECAUSE OF FAILURE TO SUBMIT A TRANSLATION OF THE DESCRIPTION OR TO PAY THE FEE WITHIN THE PRESCRIBED TIME-LIMIT Effective date: 20240703 Ref country code: DK Free format text: LAPSE BECAUSE OF FAILURE TO SUBMIT A TRANSLATION OF THE DESCRIPTION OR TO PAY THE FEE WITHIN THE PRESCRIBED TIME-LIMIT Effective date: 20240703 |
|
| PG25 | Lapsed in a contracting state [announced via postgrant information from national office to epo] |
Ref country code: EE Free format text: LAPSE BECAUSE OF FAILURE TO SUBMIT A TRANSLATION OF THE DESCRIPTION OR TO PAY THE FEE WITHIN THE PRESCRIBED TIME-LIMIT Effective date: 20240703 |
|
| PG25 | Lapsed in a contracting state [announced via postgrant information from national office to epo] |
Ref country code: IT Free format text: LAPSE BECAUSE OF FAILURE TO SUBMIT A TRANSLATION OF THE DESCRIPTION OR TO PAY THE FEE WITHIN THE PRESCRIBED TIME-LIMIT Effective date: 20240703 Ref country code: SK Free format text: LAPSE BECAUSE OF FAILURE TO SUBMIT A TRANSLATION OF THE DESCRIPTION OR TO PAY THE FEE WITHIN THE PRESCRIBED TIME-LIMIT Effective date: 20240703 |
|
| PLBE | No opposition filed within time limit |
Free format text: ORIGINAL CODE: 0009261 |
|
| STAA | Information on the status of an ep patent application or granted ep patent |
Free format text: STATUS: NO OPPOSITION FILED WITHIN TIME LIMIT |
|
| 26N | No opposition filed |
Effective date: 20250404 |
|
| PG25 | Lapsed in a contracting state [announced via postgrant information from national office to epo] |
Ref country code: SE Free format text: LAPSE BECAUSE OF FAILURE TO SUBMIT A TRANSLATION OF THE DESCRIPTION OR TO PAY THE FEE WITHIN THE PRESCRIBED TIME-LIMIT Effective date: 20240703 |
|
| PG25 | Lapsed in a contracting state [announced via postgrant information from national office to epo] |
Ref country code: MC Free format text: LAPSE BECAUSE OF FAILURE TO SUBMIT A TRANSLATION OF THE DESCRIPTION OR TO PAY THE FEE WITHIN THE PRESCRIBED TIME-LIMIT Effective date: 20240703 |
|
| REG | Reference to a national code |
Ref country code: CH Ref legal event code: PL |
|
| PG25 | Lapsed in a contracting state [announced via postgrant information from national office to epo] |
Ref country code: LU Free format text: LAPSE BECAUSE OF NON-PAYMENT OF DUE FEES Effective date: 20250201 |
|
| PG25 | Lapsed in a contracting state [announced via postgrant information from national office to epo] |
Ref country code: CH Free format text: LAPSE BECAUSE OF NON-PAYMENT OF DUE FEES Effective date: 20250228 |
|
| GBPC | Gb: european patent ceased through non-payment of renewal fee |
Effective date: 20250201 |
|
| REG | Reference to a national code |
Ref country code: BE Ref legal event code: MM Effective date: 20250228 |
|
| PG25 | Lapsed in a contracting state [announced via postgrant information from national office to epo] |
Ref country code: GB Free format text: LAPSE BECAUSE OF NON-PAYMENT OF DUE FEES Effective date: 20250201 |
|
| PG25 | Lapsed in a contracting state [announced via postgrant information from national office to epo] |
Ref country code: FR Free format text: LAPSE BECAUSE OF NON-PAYMENT OF DUE FEES Effective date: 20250228 |
|
| PG25 | Lapsed in a contracting state [announced via postgrant information from national office to epo] |
Ref country code: BE Free format text: LAPSE BECAUSE OF NON-PAYMENT OF DUE FEES Effective date: 20250228 |
|
| PG25 | Lapsed in a contracting state [announced via postgrant information from national office to epo] |
Ref country code: IE Free format text: LAPSE BECAUSE OF NON-PAYMENT OF DUE FEES Effective date: 20250201 |
|
| PGFP | Annual fee paid to national office [announced via postgrant information from national office to epo] |
Ref country code: DE Payment date: 20260220 Year of fee payment: 8 |