EP3505886A2 - Method and apparatus for transforming uniformly or non-uniformly sampled interferograms to produce spectral data - Google Patents
Method and apparatus for transforming uniformly or non-uniformly sampled interferograms to produce spectral data Download PDFInfo
- Publication number
- EP3505886A2 EP3505886A2 EP18212124.4A EP18212124A EP3505886A2 EP 3505886 A2 EP3505886 A2 EP 3505886A2 EP 18212124 A EP18212124 A EP 18212124A EP 3505886 A2 EP3505886 A2 EP 3505886A2
- Authority
- EP
- European Patent Office
- Prior art keywords
- matrix
- cube
- interferograms
- interferogram
- interferometer
- Prior art date
- Legal status (The legal status is an assumption and is not a legal conclusion. Google has not performed a legal analysis and makes no representation as to the accuracy of the status listed.)
- Granted
Links
Images




Classifications
-
- G—PHYSICS
- G01—MEASURING; TESTING
- G01J—MEASUREMENT OF INTENSITY, VELOCITY, SPECTRAL CONTENT, POLARISATION, PHASE OR PULSE CHARACTERISTICS OF INFRARED, VISIBLE OR ULTRAVIOLET LIGHT; COLORIMETRY; RADIATION PYROMETRY
- G01J3/00—Spectrometry; Spectrophotometry; Monochromators; Measuring colours
- G01J3/02—Details
- G01J3/0275—Details making use of sensor-related data, e.g. for identification of sensor parts or optical elements
-
- G—PHYSICS
- G01—MEASURING; TESTING
- G01J—MEASUREMENT OF INTENSITY, VELOCITY, SPECTRAL CONTENT, POLARISATION, PHASE OR PULSE CHARACTERISTICS OF INFRARED, VISIBLE OR ULTRAVIOLET LIGHT; COLORIMETRY; RADIATION PYROMETRY
- G01J3/00—Spectrometry; Spectrophotometry; Monochromators; Measuring colours
- G01J3/02—Details
- G01J3/0205—Optical elements not provided otherwise, e.g. optical manifolds, diffusers, windows
- G01J3/0224—Optical elements not provided otherwise, e.g. optical manifolds, diffusers, windows using polarising or depolarising elements
-
- G—PHYSICS
- G01—MEASURING; TESTING
- G01J—MEASUREMENT OF INTENSITY, VELOCITY, SPECTRAL CONTENT, POLARISATION, PHASE OR PULSE CHARACTERISTICS OF INFRARED, VISIBLE OR ULTRAVIOLET LIGHT; COLORIMETRY; RADIATION PYROMETRY
- G01J3/00—Spectrometry; Spectrophotometry; Monochromators; Measuring colours
- G01J3/02—Details
- G01J3/0256—Compact construction
-
- G—PHYSICS
- G01—MEASURING; TESTING
- G01J—MEASUREMENT OF INTENSITY, VELOCITY, SPECTRAL CONTENT, POLARISATION, PHASE OR PULSE CHARACTERISTICS OF INFRARED, VISIBLE OR ULTRAVIOLET LIGHT; COLORIMETRY; RADIATION PYROMETRY
- G01J3/00—Spectrometry; Spectrophotometry; Monochromators; Measuring colours
- G01J3/28—Investigating the spectrum
-
- G—PHYSICS
- G01—MEASURING; TESTING
- G01J—MEASUREMENT OF INTENSITY, VELOCITY, SPECTRAL CONTENT, POLARISATION, PHASE OR PULSE CHARACTERISTICS OF INFRARED, VISIBLE OR ULTRAVIOLET LIGHT; COLORIMETRY; RADIATION PYROMETRY
- G01J3/00—Spectrometry; Spectrophotometry; Monochromators; Measuring colours
- G01J3/28—Investigating the spectrum
- G01J3/2803—Investigating the spectrum using photoelectric array detector
-
- G—PHYSICS
- G01—MEASURING; TESTING
- G01J—MEASUREMENT OF INTENSITY, VELOCITY, SPECTRAL CONTENT, POLARISATION, PHASE OR PULSE CHARACTERISTICS OF INFRARED, VISIBLE OR ULTRAVIOLET LIGHT; COLORIMETRY; RADIATION PYROMETRY
- G01J3/00—Spectrometry; Spectrophotometry; Monochromators; Measuring colours
- G01J3/28—Investigating the spectrum
- G01J3/2823—Imaging spectrometer
-
- G—PHYSICS
- G01—MEASURING; TESTING
- G01J—MEASUREMENT OF INTENSITY, VELOCITY, SPECTRAL CONTENT, POLARISATION, PHASE OR PULSE CHARACTERISTICS OF INFRARED, VISIBLE OR ULTRAVIOLET LIGHT; COLORIMETRY; RADIATION PYROMETRY
- G01J3/00—Spectrometry; Spectrophotometry; Monochromators; Measuring colours
- G01J3/28—Investigating the spectrum
- G01J3/447—Polarisation spectrometry
-
- G—PHYSICS
- G01—MEASURING; TESTING
- G01J—MEASUREMENT OF INTENSITY, VELOCITY, SPECTRAL CONTENT, POLARISATION, PHASE OR PULSE CHARACTERISTICS OF INFRARED, VISIBLE OR ULTRAVIOLET LIGHT; COLORIMETRY; RADIATION PYROMETRY
- G01J3/00—Spectrometry; Spectrophotometry; Monochromators; Measuring colours
- G01J3/28—Investigating the spectrum
- G01J3/45—Interferometric spectrometry
-
- G—PHYSICS
- G01—MEASURING; TESTING
- G01J—MEASUREMENT OF INTENSITY, VELOCITY, SPECTRAL CONTENT, POLARISATION, PHASE OR PULSE CHARACTERISTICS OF INFRARED, VISIBLE OR ULTRAVIOLET LIGHT; COLORIMETRY; RADIATION PYROMETRY
- G01J3/00—Spectrometry; Spectrophotometry; Monochromators; Measuring colours
- G01J3/28—Investigating the spectrum
- G01J3/45—Interferometric spectrometry
- G01J3/453—Interferometric spectrometry by correlation of the amplitudes
- G01J3/4531—Devices without moving parts
-
- G—PHYSICS
- G01—MEASURING; TESTING
- G01J—MEASUREMENT OF INTENSITY, VELOCITY, SPECTRAL CONTENT, POLARISATION, PHASE OR PULSE CHARACTERISTICS OF INFRARED, VISIBLE OR ULTRAVIOLET LIGHT; COLORIMETRY; RADIATION PYROMETRY
- G01J3/00—Spectrometry; Spectrophotometry; Monochromators; Measuring colours
- G01J3/28—Investigating the spectrum
- G01J3/45—Interferometric spectrometry
- G01J3/453—Interferometric spectrometry by correlation of the amplitudes
- G01J3/4537—Devices with refractive scan
-
- G—PHYSICS
- G06—COMPUTING OR CALCULATING; COUNTING
- G06F—ELECTRIC DIGITAL DATA PROCESSING
- G06F17/00—Digital computing or data processing equipment or methods, specially adapted for specific functions
- G06F17/10—Complex mathematical operations
- G06F17/16—Matrix or vector computation, e.g. matrix-matrix or matrix-vector multiplication, matrix factorization
-
- G—PHYSICS
- G06—COMPUTING OR CALCULATING; COUNTING
- G06F—ELECTRIC DIGITAL DATA PROCESSING
- G06F17/00—Digital computing or data processing equipment or methods, specially adapted for specific functions
- G06F17/10—Complex mathematical operations
- G06F17/17—Function evaluation by approximation methods, e.g. inter- or extrapolation, smoothing, least mean square method
-
- G—PHYSICS
- G01—MEASURING; TESTING
- G01J—MEASUREMENT OF INTENSITY, VELOCITY, SPECTRAL CONTENT, POLARISATION, PHASE OR PULSE CHARACTERISTICS OF INFRARED, VISIBLE OR ULTRAVIOLET LIGHT; COLORIMETRY; RADIATION PYROMETRY
- G01J3/00—Spectrometry; Spectrophotometry; Monochromators; Measuring colours
- G01J3/28—Investigating the spectrum
- G01J2003/283—Investigating the spectrum computer-interfaced
Definitions
- the present disclosure is directed to a method and apparatus for transforming uniformly or non-uniformly sampled interferograms to produce spectral data at predefined wavelengths.
- a set of reference retardances of an interferometer are determined, as are a set of wavelengths corresponding to spectral slices of a hyperspectral data-cube.
- a reconstruction matrix is formed that includes rows of periodic functions. Each row of the reconstruction matrix corresponds to a selected wavelength of the set of wavelengths, and each column of the reconstruction matrix corresponds to a selected retardance of the reference retardances.
- the periodic functions have as a parameter the selected wavelength of the corresponding row and are sampled at the selected retardances of each of the corresponding columns.
- An interferogram data-cube is obtained that includes an array of one or more simultaneously measured interferograms. Each row of the interferogram data-cube corresponds to one of the selected retardances and each column of the interferogram data-cube corresponds to a different interferogram from the simultaneously measured interferograms.
- a set of matrix-vector products is formed for each of the interferograms. Each of the matrix-vector products includes a matrix multiplication of the reconstruction matrix with a column of the interferogram data-cube. The set of matrix-vector products forms the hyperspectral data-cube.
- the present disclosure relates to signal processing in hyperspectral imaging systems.
- Hyperspectral imaging systems described herein use a polarization interferometer that is configured to introduce a variable optical path delay (or retardance) in components of light that pass through the interferometer.
- the device that causes the path delay (referred to as a variable optical retarder) is placed between two polarizers such that the variable path delay is introduced between first rays in an incident polarization direction and second rays in an orthogonal polarization (e.g., ordinary and extraordinary rays), with both sets of rays tracing a common path.
- This path delay causes a wavelength-dependent phase shift between the first and second rays.
- the path delay causes light exiting the polarization interferometer to form interferograms that are detected via an optical sensor, e.g., a focal-plane array.
- a polarization interferometer can use one or more liquid-crystal (LC) cells as a variable optical retarder.
- LC liquid-crystal
- Such a variable optical retarder is referred to herein as a liquid-crystal variable retarder (LCVR).
- liquid-crystal (LC) materials are liquids having some crystalline properties (e.g., orientation of internal structures, such as the LC director that indicates the local average alignment of LC molecules) that can be selectably altered by applying an external stimulus, such as an electric field or a magnetic field.
- a change in orientation of the LC director alters the optical properties of the LC materials, e.g., changing the optical axis of the LC birefringence.
- An LCVR generates a variable optical path delay, or a variable retardance, between two orthogonal polarizations of light that travel through the liquid crystal.
- One or more liquid-crystal cells within the LCVR function as electrically tunable birefringent elements. By varying the voltage across the electrodes of the liquid-crystal cell, the cell molecules change their orientation, and it is possible to controllably change the optical path delay over a period of time.
- the LCVR is placed between a first polarizer and a second polarizer with nominally parallel or perpendicular polarization axes.
- the slow axis of the LCVR (the polarization axis with the variable optical path delay) is oriented nominally 45 degrees with respect to the polarization direction of the first polarizer.
- Incoming light is polarized to an incident polarization direction by the first polarizer.
- the polarized incident light can be described in terms of a portion of light polarized parallel to the slow axis of the LCVR and a portion of light polarized perpendicular to this axis.
- the second polarizer or analyzer, oriented either parallel or perpendicular to the first polarizer, interferes the portion of light polarized parallel to the slow axis of the LCVR with the portion of light polarized perpendicular, changing the wavelength-dependent polarization state at the output of the LCVR into a wavelength-dependent intensity pattern that can be sensed by an optical detector or a focal plane array.
- an optical detector or a focal plane array By sensing this intensity while varying the retardance of the LCVR, it is possible to measure an interferogram of the incoming light, which can be used to ascertain spectral properties of the incoming light.
- Hyperspectral imaging refers to methods and devices for acquiring hyperspectral datasets or data-cubes, which may include images where densely sampled, finely resolved spectral information is provided at each pixel.
- the wavelength-dependent intensity pattern provided by the polarization interferometer corresponds approximately to a cosine transform of the spectrum of the incident light.
- the interferograms generated by all points of a scene imaged through the LCVR can be sampled simultaneously. From this, the hyperspectral data-cube can be nominally recovered by applying a transform, such as an inverse cosine transform or Fourier transform along the retardance axis, to the recorded spatially-dependent interferogram.
- Hyperspectral imagers based on liquid-crystal polarization interferometers generate interferograms that may be non-uniformly sampled with respect to optical path delay.
- a standard Fourier transform may not be optimal for converting the raw data generated by such a device to a hyperspectral image.
- This disclosure describes methods and apparatuses used to reconstruct the hyperspectral data-cube with better accuracy and fewer artifacts than with a Fourier transform, whether or not the interferograms are uniformly sampled.
- FIG. 1 illustrates an apparatus 100 that performs image processing according to an example embodiment.
- the apparatus 100 includes a device controller 102, which may include one or more processors, such as central processing units, subprocessors, graphics processing units, digital signal processors, etc.
- the controller 102 is coupled to a memory 104 that includes functional modules that will be described in greater detail below.
- the memory 104 may include a combination of volatile and non-volatile memory, and may store instructions and data as known in the art.
- the apparatus 100 includes an optical section 106 with an external optical interface 108 that receives light from outside the apparatus 100.
- the external optical interface 108 may include windows, lenses, filters, apertures, etc., suitable for passing light 109 from outside the apparatus 100 to internal optical components.
- the external optical interface 108 is shown coupled to an external lens 110.
- a polarization interferometer 112 is located in the optical section 106 of the apparatus 100.
- the polarization interferometer 112 is coupled to the controller 102, e.g., via electrical signal lines.
- the controller 102 applies signals to the polarization interferometer 112 to cause a time-varying optical path delay or retardance in an LCVR 112a that is part of the interferometer 112.
- This time-varying optical path delay causes a wavelength-dependent phase shift between different polarizations of the light 109, resulting in interferograms that vary as a function of the optical path delay.
- the interferograms are detected by an image sensor 114 (e.g., an array of sensor pixels, focal plane array) which is also coupled to the controller 102.
- a retardance controller 118 instructs the device controller 102 to apply a control signal to the LCVR 112a to achieve a time-varying retardance trajectory.
- An image processor 120 uses this retardance trajectory as a measure of time-varying path delay together with interferograms detected at the image sensor 114.
- Each detected interferogram can be processed by calculating a transform as a function of the path delay at a corresponding position of the LCVR 112a, and together the processed interferograms comprise spatially-dependent spectral data, e.g., a hyperspectral data-cube.
- the computer 124 and/or the apparatus 100 may include a graphics processing unit (GPU) 128, 130 that can be used to speed up certain computations as described below.
- a GPU 128, 130 will have a large number of processing cores (e.g., hundreds or thousands) configured for parallelizable sub-computations, such as matrix or sub-matrix multiplications. Assuming each of the sub-computations are independent, a GPU can greatly reduce image processing time. As the calculations below involve parallelizable matrix multiplication, a GPU may be used to improve processing speeds.
- Hyperspectral imagers described herein generate raw signals that are interferograms with respect to optical path delay independently at each pixel.
- these systems are based on liquid-crystal polarization interferometers, the sampling of the interferograms may not be entirely uniform with respect to optical path delay.
- typical Fast Fourier Transform (FFT) algorithms may not work to calculate hyperspectral data-cubes from the interferograms.
- FFT Fast Fourier Transform
- an FFT of the interferograms may not lead to an optimal estimate of spectral data, e.g., the hyperspectral data-cube.
- Non-uniform sampling may be intentionally introduced, for example through denser sampling at shorter path delays, in order to enhance the sensitivity at certain wavelengths.
- One way that non-uniform sampling might be remedied prior to applying an FFT to an interferogram is to resample the interferogram at uniform intervals of optical path delay or retardance via interpolation.
- the optical path delay of each recorded interferogram sample is known, for example by obtaining the phase of an interferogram of a monochromatic reference light source of known wavelength as a function of time. If the optical path delay were changed monotonically as a function of time as is generally the case, there would be a one-to-one relationship between optical path delay and time.
- Individual interferogram samples would be taken at known retardances, and a uniformly spaced retardance grid could be used to calculate, via interpolation of the interferogram samples, the interpolated interferograms.
- this interpolation method may be computationally expensive, especially if higher-order (e.g., cubic spline) methods are used or image sizes are large.
- the interpolation may cause significant loss and/or distortion of the signal, which would be disadvantageous and potentially cause artifacts in the reconstructed spectral data.
- the hyperspectral imagers described herein may already be less sensitive to shorter wavelengths, and such an interpolation just exacerbates this problem.
- the top plot 200 is an interferogram of a blue LED measured through a polarization interferometer based on an LCVR.
- the interferogram was sampled at uniformly spaced time intervals while the retardance of the LCVR was scanned at a nominally constant rate. However, due to small fluctuations in the scanning rate of the LCVR, the interferogram in the top plot 200 was sampled at non-uniform intervals of retardance.
- the middle plot 202 shows the results of resampling, via interpolation, of the interferogram in the top plot 200 at uniform retardance increments.
- Plot 204 shows a separately measured interferogram of the same blue LED that was purposely sampled non-uniformly with respect to retardance (although at uniformly-spaced time intervals, as shown in FIG. 3 ) to increase the number of samples near zero path delays 206-208 which is where, as can be seen in plots 200, 202, 204, most of the signal from short (blue) wavelengths is located.
- the intentional non-uniform sampling of the interferogram in 204 boosted the standard deviation of the signal with respect to the interferogram in 200 by about 30%.
- the non-uniform retardance sampling can also be dealt with via a number of methods developed for Fourier transforms of non-uniformly sampled data, such as the non-uniform discrete Fourier transform, which can be calculated with the NuFFT software library.
- the image processor 120 can approximate a Fourier transform by taking a dot-product of the interferogram with only the (uniformly or non-uniformly sampled) Fourier components of interest, or equivalently, only those rows of the (regular or non-uniform) discrete Fourier transform (DFT) matrix that contribute to wavelengths of interest.
- DFT discrete Fourier transform
- An advantage of this method is that each wavelength can be treated independently to incorporate different apodizations and wavelength-dependent zero path delay, and the Fourier components can be sampled with the same non-uniformity as the interferogram such that the non-uniformity is no longer an issue. Any additional linear transformations can also be combined with this matrix to form an overall "reconstruction" matrix for directly reconstructing spectral data from the raw interferograms. Such a matrix could even have a spatial index to incorporate spatial calibrations such as a spatially-dependent retardance.
- a reference retardance vs. time curve is obtained from a sensor, as shown in by the example curve 300 in FIG. 3 .
- a monochromatic light source 116 located on one side of a liquid-crystal cell may be used to obtain this curve 300.
- the light from the light source 116 is detected by the sensor 114 while the controller 102 applies a voltage to the LC cell(s) of the LCVR 112a, causing the retardance of the LCVR to transition from a first to a second retardance.
- the controller 102 then analyzes the detected oscillations in intensity of the light source 116 to determine the time-dependent retardance, or equivalently, the phase of the interferogram of the light source 116 for each sample of the interferogram.
- Other ways of obtaining the data of plot 300 comprise analyzing a capacitance measurement of the LC cell(s) using a similar procedure.
- the system may have wavelength- and temperature- dependent variations in zero path delay which may arise, for example, by compensating a residual liquid-crystal retardance with another birefringent material. It is desirable that interferograms are measured at both positive and negative path delays, and in some cases, the residual liquid-crystal retardance prevents this and must be compensated.
- One way to compensate the residual retardance is to include within the polarization interferometer a fixed retardance of opposite sign, e.g., a multiple-order waveplate with slow axis perpendicular to the slow axis of the LCVR.
- this compensating waveplate has a retardance that depends on wavelength and/or temperature in a manner different than the retardance of the LCVR, the zero path delay of the polarization interferometer would depend on both wavelength and temperature.
- the system can also determine and store a zero path delay point, with respect to the reference retardance curve, for each wavelength and thus each row of the reconstruction matrix.
- An example of determining zero path delay according to an example embodiment is shown in a set of plots in FIG. 4 .
- plot 400 is a set of measurements of interferograms of a narrowband light source stepped in 10 nm increments, each shown stacked upon the other. Wavelength increases up the vertical axis.
- Plot 410 is an expanded view of the portion 402 of plot 400
- plot 420 is a subset of the portion 412 of plot 410.
- These points 422 form a curve and not a vertical line because some of the liquid-crystal retardance is compensated with a waveplate of different dispersion, thus resulting in a residual dispersion across the detectable optical spectrum.
- This residual dispersion is related to a sum of indices of refraction of both the liquid-crystal material and the compensation waveplate.
- a Cauchy approximation e.g., up to 6th order
- the coefficients of the equation generally depend on temperature.
- the reference retardance corresponding to zero path delay can be calculated at any wavelength where the Cauchy approximation is valid.
- This equation can also be solved for different temperatures, assuming the coefficient variation with respect to temperature has been characterized.
- the coefficients can be stored in memory of the apparatus 100 as known in the art and used by the image processor in the computations described below.
- Another parameter that can be used by the image processor 120 is the rate of change of phase delay of a given wavelength of interest (e.g., ⁇ i , corresponding to the i th row of the reconstruction matrix) relative to the rate of change of phase of the reference retardance curve at a reference wavelength ⁇ 0 .
- a scaling factor can be obtained, for example, by knowledge of the liquid crystal indices of refraction n e , n o as a function of wavelength ⁇ and temperature T, where the e- and o-subscripts represent the respective indices for the extraordinary and ordinary rays. Equation (1) below can be used to determine the scaling factor ⁇ i at wavelength ⁇ i , or a calibration can be used to empirically determine a value.
- ⁇ i n e ⁇ i T ⁇ n o ⁇ i T n e ⁇ o T ⁇ n o ⁇ o T ⁇ 0 ⁇ i
- the elements A ij of the reconstruction matrix may then be represented as shown in Equation (2) below, where ⁇ j is the phase of the reference retardance curve corresponding to interferogram sample j.
- the angle ⁇ i is the phase of the reference retardance curve corresponding to zero path delay for wavelength ⁇ i , calculated e.g. as in Equation (3) via the fitting coefficients obtained in FIG. 4 .
- phase ⁇ i from the phase of the reference retardance curve ⁇ j phase shifts the periodic function sampled in row i such that it has a phase of 0 at an interferogram sample corresponding to the zero-retardance point of the interferometer at wavelength ⁇ i .
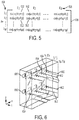
- FIG. 5 a diagram shows a reconstruction matrix 500 according to an example embodiment.
- the matrix 500 includes rows of periodic functions 502 (e.g., cosine functions) as in Equation (2). Each row corresponds to a selected wavelength of a set of wavelengths 504, which each correspond to spectral slices of a hyperspectral data-cube.
- the wavelengths 504 can be preselected to have a particular range and distribution. Note that the previously described reference wavelength ⁇ 0 may or may not be included in the set of wavelengths 504.
- Each column of the matrix 500 corresponds to a selected retardance of a set of reference retardances 506.
- the set of reference retardances 506 are associated with a state of an interferometer at a particular point in time. Note that the set of retardances 506 may be distributed at non-uniform retardance intervals (e.g., as shown in FIG. 3 ), and the initial retardance ⁇ 1 may or may not be a minimal retardance.
- the periodic functions 502 have as a parameter the selected wavelengths 504 (or the indices of the selected wavelengths 504) of the corresponding row and are sampled at the reference retardances 506 of each of the corresponding columns.
- the matrix 500 can be multiplied with an interferogram data-cube to obtain spectral data.
- FIG. 6 a conceptual diagram shows an interferogram data-cube according to an example embodiment.
- Elements 600 represent individual sensors of a detector, e.g., pixels of a focal plane array, arranged across an xy-plane.
- the t-axis represents a change in retardance of a polarization interferometer from ⁇ 1 to ⁇ N , which each correspond to a different point in time between t 1 and t N during which the data-cube is acquired.
- the curves 602 represent individual interferograms measured at each sensor 600 over the acquisition time period. Therefore, the interferogram data-cube is formed of an array with each element having a sample value corresponding to a particular sensor position and retardance value. Points 604 represent individual samples corresponding to retardance ⁇ j for the sensors 600.
- the interferogram data-cube can be represented as a two-dimensional matrix X 700 as shown in FIG. 7 .
- the matrix 700 includes samples 702 that correspond to simultaneously measured interferograms.
- Each row of the matrix 700 corresponds to a selected retardance of the reference retardances 506 and each column corresponds to a different interferogram measurement from the set of simultaneously measured interferograms with index k.
- the calculation of spectral data or the hyperspectral data-cube involves forming a set of matrix-vector products for each of the interferograms, each of the matrix-vector products comprising a matrix multiplication of the matrix 500 with a column k of the interferogram data-cube 700.
- Each row of H can be composed into an image corresponding to one of the wavelengths 504, each pixel of the image corresponding to an intensity at the corresponding wavelength and at the spatial location labeled with index k.
- different reconstruction matrices 500 can be constructed for at least two spatial regions of the interferometer.
- different pixel locations p k in FIG. 7 can be multiplied by a different reconstruction matrix.
- regions 705-707 which may each be associated with a different reconstruction matrix 500.
- Such regions may encompass one or more individual pixels and may also encompass non-contiguous portions of the data-cube matrix 700. In this way, compensation for spatially-dependent characteristics of the polarization interferometer (or other optical components) can be made at any desired granularity.
- the reconstruction of spectral data from interferograms that are asymmetric with respect to zero path delay requires special handling to prevent the formation of low-resolution spectral artifacts (see, e.g., C. D. Porter and D. B. Tanner, "Correction of phase errors in Fourier spectroscopy,” Int. J. Infrared Millimeter Waves 4, 273-298 (1983 )).
- One way to incorporate this special handling into the reconstruction matrix 500 is to multiply each row of the matrix 500 with a linear "ramp" function that starts equal to zero at the end nearest zero path delay, goes through one half at the (wavelength-dependent) zero path delay point, and continues to one with the same slope, at which point it remains constant.
- Equation (4) defines a matrix that can be multiplied elementwise with the reconstruction matrix to accommodate asymmetric interferograms.
- the rows of the reconstruction matrix 500 can also be multiplied by a windowing or apodization function as long as it is symmetric about zero path delay for each wavelength.
- a windowing or apodization function can be applied for each wavelength. For example, due to intrinsic path delay inhomogeneities across an LCVR that might limit the best obtainable spectral resolution for shorter wavelengths, shorter wavelengths typically generate interferograms with most of their signal energy located around zero path delay. Therefore, when reconstructing the shorter wavelength portions of a spectrum from an interferogram, it is advantageous to first multiply the interferogram by a windowing function that includes just those portions where there is signal from shorter wavelengths.
- the window functions can be multiplied elementwise with the rows of the reconstruction matrix 500.
- A is the reconstruction matrix 500 and B is a matrix with columns that are the system response at each wavelength represented by a row of the reconstruction matrix 500
- the reconstruction matrix 500 can be pre-multiplied by the diagonalization matrix ( AB ) -1 in order to "diagonalize” the reconstruction. That is, the full reconstruction matrix could be set to ( AB ) -1 A so that multiplication by the system response matrix B (or by the measured response at a given wavelength) produces the identity.
- This is analogous to a least-squares solution to the reconstruction of spectral data from interferograms.
- AB may be ill-conditioned, it may be necessary to provide some form of regularization to prevent the above matrix inversion from diverging.
- the reconstruction matrix 500 can also include information about the spectral sensitivity of the interferometer in order to equalize the system response across wavelengths.
- the diagram in FIG. 8 shows the system response matrix B 800.
- the columns of the matrix 800 are the expected raw interferograms generated by a unit wavelength stimulus to the interferometer at the wavelengths 504 corresponding to each of the rows of A.
- a pair of stacked plots shows two reconstruction matrices as described above and plotted similarly to the measurements in FIG. 4 .
- Each line of plot 900 is a row of the reconstruction matrix A as in Equation (2), accounting for non-uniform retardance spacing, wavelength-dependent zero path delay, and liquid-crystal dispersion.
- the plot 902 shows the effects of additional processing, which includes multiplication of each row by the ramp function of Equation (4) to avoid double-counting the symmetric part of the interferogram, as well as wavelength-dependent windowing to separately define the resolution bin size for each wavelength.
- a flowchart shows a method according to an example embodiment.
- the method involves determining 1000 a set of reference retardances of an interferometer.
- a set of wavelengths corresponding to spectral slices of a hyperspectral data-cube are also determined 1001, e.g., based on a desired spectral range of the hyperspectral data-cube.
- a reconstruction matrix is formed 1002.
- the reconstruction matrix has rows of sampled periodic functions. Each row of the reconstruction matrix corresponds to a selected wavelength of the set of wavelengths, and each column of the reconstruction matrix corresponds to a selected retardance of the reference retardances.
- the periodic functions have as a parameter the selected wavelength of the corresponding row and are sampled at the reference retardances of each of the corresponding columns.
- An interferogram data-cube is obtained 1003, e.g., via an optical detector.
- the interferogram data-cube includes an array of one or more simultaneously measured interferograms.
- the simultaneously measured interferograms may be non-uniformly sampled with respect to optical path delay.
- Each row of the interferogram data-cube corresponds to one of the selected retardances and each column of the interferogram data-cube corresponds to a different interferogram from the set of simultaneously measured interferograms.
- a set of matrix-vector products is formed 1004 for each of the interferograms.
- Each of the matrix-vector products includes a matrix multiplication of the reconstruction matrix with a column of the interferogram data-cube.
- the set of matrix-vector products forms the hyperspectral data-cube.
Landscapes
- Physics & Mathematics (AREA)
- Spectroscopy & Molecular Physics (AREA)
- General Physics & Mathematics (AREA)
- Engineering & Computer Science (AREA)
- Mathematical Physics (AREA)
- Pure & Applied Mathematics (AREA)
- Mathematical Optimization (AREA)
- Mathematical Analysis (AREA)
- Data Mining & Analysis (AREA)
- Theoretical Computer Science (AREA)
- Computational Mathematics (AREA)
- Algebra (AREA)
- Databases & Information Systems (AREA)
- Software Systems (AREA)
- General Engineering & Computer Science (AREA)
- Computing Systems (AREA)
- Spectrometry And Color Measurement (AREA)
Abstract
Description
- The present disclosure is directed to a method and apparatus for transforming uniformly or non-uniformly sampled interferograms to produce spectral data at predefined wavelengths. In one embodiment, a set of reference retardances of an interferometer are determined, as are a set of wavelengths corresponding to spectral slices of a hyperspectral data-cube. A reconstruction matrix is formed that includes rows of periodic functions. Each row of the reconstruction matrix corresponds to a selected wavelength of the set of wavelengths, and each column of the reconstruction matrix corresponds to a selected retardance of the reference retardances. The periodic functions have as a parameter the selected wavelength of the corresponding row and are sampled at the selected retardances of each of the corresponding columns. An interferogram data-cube is obtained that includes an array of one or more simultaneously measured interferograms. Each row of the interferogram data-cube corresponds to one of the selected retardances and each column of the interferogram data-cube corresponds to a different interferogram from the simultaneously measured interferograms. A set of matrix-vector products is formed for each of the interferograms. Each of the matrix-vector products includes a matrix multiplication of the reconstruction matrix with a column of the interferogram data-cube. The set of matrix-vector products forms the hyperspectral data-cube.
- These and other features and aspects of various embodiments may be understood in view of the following detailed discussion and accompanying drawings.
- The discussion below makes reference to the following figures, wherein the same reference number may be used to identify the similar/same component in multiple figures. The drawings are not necessarily to scale.
-
FIG. 1 is a diagram of an apparatus according to an example embodiment; -
FIG. 2 is a set of plots showing interferograms processed via an optical device according to example embodiments; -
FIG. 3 is a graph of retardance versus time for an optical device according to an example embodiment; -
FIG. 4 is a set of plots showing the measurement of a wavelength dependence of a zero path delay of an interferometer according to an example embodiment; -
FIG. 5 is a diagram of a reconstruction matrix according to an example embodiment; -
FIG. 6 is a conceptual diagram of an interferogram data-cube according to an example embodiment; -
FIG. 7 is a diagram of a matrix that represents an interferogram data-cube according to an example embodiment; -
FIG. 8 is a diagram of a system response matrix according to an example embodiment; -
FIG. 9 is a set of plots showing the effect of ramp and window functions on a reconstruction matrix according to example embodiments; and -
FIG. 10 is a flowchart of a method according to an example embodiment. - The present disclosure relates to signal processing in hyperspectral imaging systems. Hyperspectral imaging systems described herein use a polarization interferometer that is configured to introduce a variable optical path delay (or retardance) in components of light that pass through the interferometer. The device that causes the path delay (referred to as a variable optical retarder) is placed between two polarizers such that the variable path delay is introduced between first rays in an incident polarization direction and second rays in an orthogonal polarization (e.g., ordinary and extraordinary rays), with both sets of rays tracing a common path. This path delay causes a wavelength-dependent phase shift between the first and second rays. The path delay causes light exiting the polarization interferometer to form interferograms that are detected via an optical sensor, e.g., a focal-plane array.
- A polarization interferometer can use one or more liquid-crystal (LC) cells as a variable optical retarder. Such a variable optical retarder is referred to herein as a liquid-crystal variable retarder (LCVR). Generally, liquid-crystal (LC) materials are liquids having some crystalline properties (e.g., orientation of internal structures, such as the LC director that indicates the local average alignment of LC molecules) that can be selectably altered by applying an external stimulus, such as an electric field or a magnetic field. A change in orientation of the LC director alters the optical properties of the LC materials, e.g., changing the optical axis of the LC birefringence.
- An LCVR generates a variable optical path delay, or a variable retardance, between two orthogonal polarizations of light that travel through the liquid crystal. One or more liquid-crystal cells within the LCVR function as electrically tunable birefringent elements. By varying the voltage across the electrodes of the liquid-crystal cell, the cell molecules change their orientation, and it is possible to controllably change the optical path delay over a period of time.
- To create a polarization interferometer with an LCVR, the LCVR is placed between a first polarizer and a second polarizer with nominally parallel or perpendicular polarization axes. The slow axis of the LCVR (the polarization axis with the variable optical path delay) is oriented nominally 45 degrees with respect to the polarization direction of the first polarizer. Incoming light is polarized to an incident polarization direction by the first polarizer. Because the slow axis of the LCVR is at 45 degrees with respect to this incident polarization direction, the polarized incident light can be described in terms of a portion of light polarized parallel to the slow axis of the LCVR and a portion of light polarized perpendicular to this axis.
- As the light passes through the LCVR, it acquires a wavelength-dependent relative phase shift between the first and second polarizations, thereby leading to a wavelength-dependent change in the polarization state. The second polarizer, or analyzer, oriented either parallel or perpendicular to the first polarizer, interferes the portion of light polarized parallel to the slow axis of the LCVR with the portion of light polarized perpendicular, changing the wavelength-dependent polarization state at the output of the LCVR into a wavelength-dependent intensity pattern that can be sensed by an optical detector or a focal plane array. By sensing this intensity while varying the retardance of the LCVR, it is possible to measure an interferogram of the incoming light, which can be used to ascertain spectral properties of the incoming light.
- As noted above, a polarization interferometer is used in hyperspectral imaging applications because of its abilities to encode spectral information of the incident light into an intensity pattern that is easily measured with a non-spectrally-resolving detector. Hyperspectral imaging refers to methods and devices for acquiring hyperspectral datasets or data-cubes, which may include images where densely sampled, finely resolved spectral information is provided at each pixel.
- The wavelength-dependent intensity pattern provided by the polarization interferometer corresponds approximately to a cosine transform of the spectrum of the incident light. By recording each pixel's intensity pattern at the output of a polarization interferometer as a function of the LCVR's retardance, the interferograms generated by all points of a scene imaged through the LCVR can be sampled simultaneously. From this, the hyperspectral data-cube can be nominally recovered by applying a transform, such as an inverse cosine transform or Fourier transform along the retardance axis, to the recorded spatially-dependent interferogram.
- Hyperspectral imagers based on liquid-crystal polarization interferometers generate interferograms that may be non-uniformly sampled with respect to optical path delay. A standard Fourier transform may not be optimal for converting the raw data generated by such a device to a hyperspectral image. This disclosure describes methods and apparatuses used to reconstruct the hyperspectral data-cube with better accuracy and fewer artifacts than with a Fourier transform, whether or not the interferograms are uniformly sampled.
- To enhance understanding of hyperspectral image processing described herein, a block diagram in
FIG. 1 illustrates anapparatus 100 that performs image processing according to an example embodiment. Theapparatus 100 includes adevice controller 102, which may include one or more processors, such as central processing units, subprocessors, graphics processing units, digital signal processors, etc. Thecontroller 102 is coupled to amemory 104 that includes functional modules that will be described in greater detail below. Thememory 104 may include a combination of volatile and non-volatile memory, and may store instructions and data as known in the art. - The
apparatus 100 includes anoptical section 106 with an externaloptical interface 108 that receives light from outside theapparatus 100. The externaloptical interface 108 may include windows, lenses, filters, apertures, etc., suitable forpassing light 109 from outside theapparatus 100 to internal optical components. In this example, the externaloptical interface 108 is shown coupled to anexternal lens 110. - A
polarization interferometer 112 is located in theoptical section 106 of theapparatus 100. Thepolarization interferometer 112 is coupled to thecontroller 102, e.g., via electrical signal lines. Thecontroller 102 applies signals to thepolarization interferometer 112 to cause a time-varying optical path delay or retardance in anLCVR 112a that is part of theinterferometer 112. This time-varying optical path delay causes a wavelength-dependent phase shift between different polarizations of thelight 109, resulting in interferograms that vary as a function of the optical path delay. The interferograms are detected by an image sensor 114 (e.g., an array of sensor pixels, focal plane array) which is also coupled to thecontroller 102. - A
retardance controller 118 instructs thedevice controller 102 to apply a control signal to theLCVR 112a to achieve a time-varying retardance trajectory. Animage processor 120 uses this retardance trajectory as a measure of time-varying path delay together with interferograms detected at theimage sensor 114. Each detected interferogram can be processed by calculating a transform as a function of the path delay at a corresponding position of theLCVR 112a, and together the processed interferograms comprise spatially-dependent spectral data, e.g., a hyperspectral data-cube. - All the processing described herein can take place within the
apparatus 100 or viaexternal computer 124 coupled byinterface 122 or some combination thereof. This is indicated byimage processor 126 operating oncomputer 124. Thecomputer 124 and/or theapparatus 100 may include a graphics processing unit (GPU) 128, 130 that can be used to speed up certain computations as described below. Generally, aGPU - Hyperspectral imagers described herein generate raw signals that are interferograms with respect to optical path delay independently at each pixel. When these systems are based on liquid-crystal polarization interferometers, the sampling of the interferograms may not be entirely uniform with respect to optical path delay. As a result, typical Fast Fourier Transform (FFT) algorithms may not work to calculate hyperspectral data-cubes from the interferograms. Furthermore, even if the interferogram sampling were uniform, an FFT of the interferograms may not lead to an optimal estimate of spectral data, e.g., the hyperspectral data-cube. Non-uniform sampling may be intentionally introduced, for example through denser sampling at shorter path delays, in order to enhance the sensitivity at certain wavelengths.
- One way that non-uniform sampling might be remedied prior to applying an FFT to an interferogram is to resample the interferogram at uniform intervals of optical path delay or retardance via interpolation. One can assume that the optical path delay of each recorded interferogram sample is known, for example by obtaining the phase of an interferogram of a monochromatic reference light source of known wavelength as a function of time. If the optical path delay were changed monotonically as a function of time as is generally the case, there would be a one-to-one relationship between optical path delay and time. Individual interferogram samples would be taken at known retardances, and a uniformly spaced retardance grid could be used to calculate, via interpolation of the interferogram samples, the interpolated interferograms.
- However, this interpolation method may be computationally expensive, especially if higher-order (e.g., cubic spline) methods are used or image sizes are large. Also, in regions of the interferogram that may be sampled near the Nyquist limit or that may have few samples per interference fringe (especially for shorter wavelengths near zero path delay), the interpolation may cause significant loss and/or distortion of the signal, which would be disadvantageous and potentially cause artifacts in the reconstructed spectral data. The hyperspectral imagers described herein may already be less sensitive to shorter wavelengths, and such an interpolation just exacerbates this problem.
- In
FIG. 2 , a set of plots show how different sampling methods can affect the signal strength and distortion of an interferogram according to an example embodiment. Thetop plot 200 is an interferogram of a blue LED measured through a polarization interferometer based on an LCVR. The interferogram was sampled at uniformly spaced time intervals while the retardance of the LCVR was scanned at a nominally constant rate. However, due to small fluctuations in the scanning rate of the LCVR, the interferogram in thetop plot 200 was sampled at non-uniform intervals of retardance. Themiddle plot 202 shows the results of resampling, via interpolation, of the interferogram in thetop plot 200 at uniform retardance increments. This interpolation decreases the interferogram signal strength (as measured by the interferogram's standard deviation) by almost 20%. Plot 204 shows a separately measured interferogram of the same blue LED that was purposely sampled non-uniformly with respect to retardance (although at uniformly-spaced time intervals, as shown inFIG. 3 ) to increase the number of samples near zero path delays 206-208 which is where, as can be seen inplots - The non-uniform retardance sampling can also be dealt with via a number of methods developed for Fourier transforms of non-uniformly sampled data, such as the non-uniform discrete Fourier transform, which can be calculated with the NuFFT software library. However, a Fourier transform across all frequencies may be overkill, as many of the calculated frequencies may not even correspond to wavelengths within the detectable optical spectrum. Instead, the
image processor 120 can approximate a Fourier transform by taking a dot-product of the interferogram with only the (uniformly or non-uniformly sampled) Fourier components of interest, or equivalently, only those rows of the (regular or non-uniform) discrete Fourier transform (DFT) matrix that contribute to wavelengths of interest. - An advantage of this method is that each wavelength can be treated independently to incorporate different apodizations and wavelength-dependent zero path delay, and the Fourier components can be sampled with the same non-uniformity as the interferogram such that the non-uniformity is no longer an issue. Any additional linear transformations can also be combined with this matrix to form an overall "reconstruction" matrix for directly reconstructing spectral data from the raw interferograms. Such a matrix could even have a spatial index to incorporate spatial calibrations such as a spatially-dependent retardance.
- To generate the reconstruction matrix, a reference retardance vs. time curve is obtained from a sensor, as shown in by the
example curve 300 inFIG. 3 . For example, a monochromatic light source 116 (seeFIG. 1 ) located on one side of a liquid-crystal cell may be used to obtain thiscurve 300. The light from thelight source 116 is detected by thesensor 114 while thecontroller 102 applies a voltage to the LC cell(s) of theLCVR 112a, causing the retardance of the LCVR to transition from a first to a second retardance. Thecontroller 102 then analyzes the detected oscillations in intensity of thelight source 116 to determine the time-dependent retardance, or equivalently, the phase of the interferogram of thelight source 116 for each sample of the interferogram. Other ways of obtaining the data ofplot 300 comprise analyzing a capacitance measurement of the LC cell(s) using a similar procedure. - The system may have wavelength- and temperature- dependent variations in zero path delay which may arise, for example, by compensating a residual liquid-crystal retardance with another birefringent material. It is desirable that interferograms are measured at both positive and negative path delays, and in some cases, the residual liquid-crystal retardance prevents this and must be compensated. One way to compensate the residual retardance is to include within the polarization interferometer a fixed retardance of opposite sign, e.g., a multiple-order waveplate with slow axis perpendicular to the slow axis of the LCVR. If this compensating waveplate has a retardance that depends on wavelength and/or temperature in a manner different than the retardance of the LCVR, the zero path delay of the polarization interferometer would depend on both wavelength and temperature. In such a case, the system can also determine and store a zero path delay point, with respect to the reference retardance curve, for each wavelength and thus each row of the reconstruction matrix. An example of determining zero path delay according to an example embodiment is shown in a set of plots in
FIG. 4 . - In
FIG. 4 ,plot 400 is a set of measurements of interferograms of a narrowband light source stepped in 10 nm increments, each shown stacked upon the other. Wavelength increases up the vertical axis.Plot 410 is an expanded view of theportion 402 ofplot 400, andplot 420 is a subset of theportion 412 ofplot 410. The highlighted points 422 inplot 420 indicate the reference retardance value that represents the actual zero path delay for each wavelength, σ(λ) = 0, where σ is the actual interferometer path delay and not the measured reference retardance. Thesepoints 422 form a curve and not a vertical line because some of the liquid-crystal retardance is compensated with a waveplate of different dispersion, thus resulting in a residual dispersion across the detectable optical spectrum. - This residual dispersion is related to a sum of indices of refraction of both the liquid-crystal material and the compensation waveplate. As indicated by
plot 430 andequation 432, a Cauchy approximation (e.g., up to 6th order) can be used to fit the data. Note that the coefficients of the equation generally depend on temperature. Usingequation 432, the reference retardance corresponding to zero path delay can be calculated at any wavelength where the Cauchy approximation is valid. This equation can also be solved for different temperatures, assuming the coefficient variation with respect to temperature has been characterized. The coefficients can be stored in memory of theapparatus 100 as known in the art and used by the image processor in the computations described below. - Another parameter that can be used by the
image processor 120 is the rate of change of phase delay of a given wavelength of interest (e.g., λi , corresponding to the i th row of the reconstruction matrix) relative to the rate of change of phase of the reference retardance curve at a reference wavelength λ0 . A scaling factor can be obtained, for example, by knowledge of the liquid crystal indices of refraction ne, no as a function of wavelength λ and temperature T, where the e- and o-subscripts represent the respective indices for the extraordinary and ordinary rays. Equation (1) below can be used to determine the scaling factor αi at wavelength λi , or a calibration can be used to empirically determine a value.
- In view of the above, the elements Aij of the reconstruction matrix may then be represented as shown in Equation (2) below, where Φ j is the phase of the reference retardance curve corresponding to interferogram sample j. The phase Φ j is found empirically by analyzing the interferogram of a reference light source, e.g., using Takeda's method; it relates to the reference retardance Γ j as Φ j = 2πΓj/λ 0 The angle φi is the phase of the reference retardance curve corresponding to zero path delay for wavelength λi , calculated e.g. as in Equation (3) via the fitting coefficients obtained in
FIG. 4 . Subtracting the phase φi from the phase of the reference retardance curve Φ j phase shifts the periodic function sampled in row i such that it has a phase of 0 at an interferogram sample corresponding to the zero-retardance point of the interferometer at wavelength λi .

- Note the reconstruction matrix elements in Equation (2) only need to be calculated once per image acquisition, as each acquisition has a specific reference retardance curve and temperature. In
FIG. 5 , a diagram shows areconstruction matrix 500 according to an example embodiment. Thematrix 500 includes rows of periodic functions 502 (e.g., cosine functions) as in Equation (2). Each row corresponds to a selected wavelength of a set ofwavelengths 504, which each correspond to spectral slices of a hyperspectral data-cube. Thewavelengths 504 can be preselected to have a particular range and distribution. Note that the previously described reference wavelength λ 0 may or may not be included in the set ofwavelengths 504. - Each column of the
matrix 500 corresponds to a selected retardance of a set ofreference retardances 506. The set ofreference retardances 506 are associated with a state of an interferometer at a particular point in time. Note that the set ofretardances 506 may be distributed at non-uniform retardance intervals (e.g., as shown inFIG. 3 ), and the initial retardance Γ 1 may or may not be a minimal retardance. - The
periodic functions 502 have as a parameter the selected wavelengths 504 (or the indices of the selected wavelengths 504) of the corresponding row and are sampled at the reference retardances 506 of each of the corresponding columns. Thematrix 500 can be multiplied with an interferogram data-cube to obtain spectral data. InFIG. 6 , a conceptual diagram shows an interferogram data-cube according to an example embodiment.Elements 600 represent individual sensors of a detector, e.g., pixels of a focal plane array, arranged across an xy-plane. The t-axis represents a change in retardance of a polarization interferometer from Γ 1 to Γ N , which each correspond to a different point in time between t1 and tN during which the data-cube is acquired. Thecurves 602 represent individual interferograms measured at eachsensor 600 over the acquisition time period. Therefore, the interferogram data-cube is formed of an array with each element having a sample value corresponding to a particular sensor position and retardance value.Points 604 represent individual samples corresponding to retardance Γ j for thesensors 600. - While the illustrated
sensors 600 are in a two-dimensional spatial arrangement, for purposes of calculation they can be labeled by a single index, e.g.,pk , k ∈ {1... P}. As such, the interferogram data-cube can be represented as a two-dimensional matrix X 700 as shown inFIG. 7 . Thematrix 700 includessamples 702 that correspond to simultaneously measured interferograms. Each row of thematrix 700 corresponds to a selected retardance of the reference retardances 506 and each column corresponds to a different interferogram measurement from the set of simultaneously measured interferograms with index k. As shown here, the interferogram samples are labeled bysensor positions 704, the sensor array having P positions, e.g., P = number of pixel rows * number of pixel columns. - The calculation of spectral data or the hyperspectral data-cube involves forming a set of matrix-vector products for each of the interferograms, each of the matrix-vector products comprising a matrix multiplication of the
matrix 500 with a column k of the interferogram data-cube 700. Thus, the resulting hyperspectral data-cube H can be formed by the matrix multiplication H = AX. Each row of H can be composed into an image corresponding to one of thewavelengths 504, each pixel of the image corresponding to an intensity at the corresponding wavelength and at the spatial location labeled with index k. - In some embodiments,
different reconstruction matrices 500 can be constructed for at least two spatial regions of the interferometer. Thus, different pixel locations pk inFIG. 7 can be multiplied by a different reconstruction matrix. This is indicated inFIG. 7 by regions 705-707, which may each be associated with adifferent reconstruction matrix 500. Such regions may encompass one or more individual pixels and may also encompass non-contiguous portions of the data-cube matrix 700. In this way, compensation for spatially-dependent characteristics of the polarization interferometer (or other optical components) can be made at any desired granularity. - The reconstruction of spectral data from interferograms that are asymmetric with respect to zero path delay requires special handling to prevent the formation of low-resolution spectral artifacts (see, e.g., C. D. Porter and D. B. Tanner, "Correction of phase errors in Fourier spectroscopy," Int. J. Infrared Millimeter Waves 4, 273-298 (1983)). One way to incorporate this special handling into the
reconstruction matrix 500 is to multiply each row of thematrix 500 with a linear "ramp" function that starts equal to zero at the end nearest zero path delay, goes through one half at the (wavelength-dependent) zero path delay point, and continues to one with the same slope, at which point it remains constant. Without loss of generality, it can be assumed that the phase of the reference retardance curve starts at a minimum of 0 for Φ j,j=1 and increases monotonically for increasing sample number j. Then, the wavelength-dependent ramp can be defined as in Equation (4) below. Equation (4) defines a matrix that can be multiplied elementwise with the reconstruction matrix to accommodate asymmetric interferograms.
- The rows of the
reconstruction matrix 500 can also be multiplied by a windowing or apodization function as long as it is symmetric about zero path delay for each wavelength. One advantage of calculating the reconstruction matrix row-by-row is that a different size windowing function can be applied for each wavelength. For example, due to intrinsic path delay inhomogeneities across an LCVR that might limit the best obtainable spectral resolution for shorter wavelengths, shorter wavelengths typically generate interferograms with most of their signal energy located around zero path delay. Therefore, when reconstructing the shorter wavelength portions of a spectrum from an interferogram, it is advantageous to first multiply the interferogram by a windowing function that includes just those portions where there is signal from shorter wavelengths. Making the window bigger would add more noise but not signal, as unlike the signal, the noise is often distributed across all path delays. And, to avoid repeating multiplications of the interferograms at different locations with the same window function(s), the window functions can be multiplied elementwise with the rows of thereconstruction matrix 500. - If A is the
reconstruction matrix 500 and B is a matrix with columns that are the system response at each wavelength represented by a row of thereconstruction matrix 500, then thereconstruction matrix 500 can be pre-multiplied by the diagonalization matrix (AB)-1 in order to "diagonalize" the reconstruction. That is, the full reconstruction matrix could be set to (AB)-1 A so that multiplication by the system response matrix B (or by the measured response at a given wavelength) produces the identity. This is analogous to a least-squares solution to the reconstruction of spectral data from interferograms. Also, because AB may be ill-conditioned, it may be necessary to provide some form of regularization to prevent the above matrix inversion from diverging. For example, one could add a multiple of the identity prior to inversion: (AB + βI)-1, where I is the M x M identity matrix and β is a multiplication factor. Thereconstruction matrix 500 can also include information about the spectral sensitivity of the interferometer in order to equalize the system response across wavelengths. The diagram inFIG. 8 shows the systemresponse matrix B 800. The columns of thematrix 800 are the expected raw interferograms generated by a unit wavelength stimulus to the interferometer at thewavelengths 504 corresponding to each of the rows of A. - In
FIG. 9 , a pair of stacked plots shows two reconstruction matrices as described above and plotted similarly to the measurements inFIG. 4 . Each line ofplot 900 is a row of the reconstruction matrix A as in Equation (2), accounting for non-uniform retardance spacing, wavelength-dependent zero path delay, and liquid-crystal dispersion. The plot 902 shows the effects of additional processing, which includes multiplication of each row by the ramp function of Equation (4) to avoid double-counting the symmetric part of the interferogram, as well as wavelength-dependent windowing to separately define the resolution bin size for each wavelength. - In
FIG. 10 , a flowchart shows a method according to an example embodiment. The method involves determining 1000 a set of reference retardances of an interferometer. A set of wavelengths corresponding to spectral slices of a hyperspectral data-cube are also determined 1001, e.g., based on a desired spectral range of the hyperspectral data-cube. A reconstruction matrix is formed 1002. The reconstruction matrix has rows of sampled periodic functions. Each row of the reconstruction matrix corresponds to a selected wavelength of the set of wavelengths, and each column of the reconstruction matrix corresponds to a selected retardance of the reference retardances. The periodic functions have as a parameter the selected wavelength of the corresponding row and are sampled at the reference retardances of each of the corresponding columns. - An interferogram data-cube is obtained 1003, e.g., via an optical detector. The interferogram data-cube includes an array of one or more simultaneously measured interferograms. The simultaneously measured interferograms may be non-uniformly sampled with respect to optical path delay. Each row of the interferogram data-cube corresponds to one of the selected retardances and each column of the interferogram data-cube corresponds to a different interferogram from the set of simultaneously measured interferograms. A set of matrix-vector products is formed 1004 for each of the interferograms. Each of the matrix-vector products includes a matrix multiplication of the reconstruction matrix with a column of the interferogram data-cube. The set of matrix-vector products forms the hyperspectral data-cube.
- The various embodiments described above may be implemented using circuitry, firmware, and/or software modules that interact to provide particular results. One of skill in the relevant arts can readily implement such described functionality, either at a modular level or as a whole, using knowledge generally known in the art. For example, the flowcharts and control diagrams illustrated herein may be used to create computer-readable instructions/code for execution by a processor. Such instructions may be stored on a non-transitory computer-readable medium and transferred to the processor for execution as is known in the art. The structures and procedures shown above are only a representative example of embodiments that can be used to provide the functions described hereinabove.
- Unless otherwise indicated, all numbers expressing feature sizes, amounts, and physical properties used in the specification and claims are to be understood as being modified in all instances by the term "about." Accordingly, unless indicated to the contrary, the numerical parameters set forth in the foregoing specification and attached claims are approximations that can vary depending upon the desired properties sought to be obtained by those skilled in the art utilizing the teachings disclosed herein. The use of numerical ranges by endpoints includes all numbers within that range (e.g. 1 to 5 includes 1, 1.5, 2, 2.75, 3, 3.80, 4, and 5) and any range within that range.
- The foregoing description of the example embodiments has been presented for the purposes of illustration and description. It is not intended to be exhaustive or to limit the embodiments to the precise form disclosed. Many modifications and variations are possible in light of the above teaching. Any or all features of the disclosed embodiments can be applied individually or in any combination are not meant to be limiting, but purely illustrative. It is intended that the scope of the invention be limited not with this detailed description, but rather determined by the claims appended hereto.
Claims (10)
- A method, comprising:determining a set of reference retardances of an interferometer;determining a set of wavelengths corresponding to spectral slices of a hyperspectral data-cube;forming a reconstruction matrix comprising rows of periodic functions, wherein each row of the reconstruction matrix corresponds to a selected wavelength of the set of wavelengths, and each column of the reconstruction matrix corresponds to a selected retardance of the reference retardances, wherein the periodic functions have as a parameter the selected wavelength of the corresponding row and are sampled at the selected retardance of each of the corresponding columns;obtaining an interferogram data-cube comprising an array of one or more simultaneously measured interferograms, wherein each row of the interferogram data-cube corresponds to one of the selected retardances and each column of the interferogram data-cube corresponds to a different interferogram from the simultaneously measured interferograms; andforming a set of matrix-vector products for each of the interferograms, each of the matrix-vector products comprising a matrix multiplication of the reconstruction matrix with a column of the interferogram data-cube, the set of matrix-vector products forming the hyperspectral data-cube.
- The method of claim 1, wherein the interferograms correspond to different image points within the interferometer.
- The method of claim 1, wherein the simultaneously measured interferograms are non-uniformly sampled with respect to optical path delay.
- The method of claim 1, wherein the interferometer comprises a polarization interferometer.
- The method of claim 4, wherein the polarization interferometer comprises a liquid-crystal variable retarder, and wherein a relative rate of oscillation of the periodic functions in each row is based on a liquid-crystal birefringence of the liquid-crystal variable retarder as a function of at least one of wavelength and temperature.
- An apparatus, comprising:an interferometer operable to transition through a set of reference retardances;an optical sensor operable to simultaneously measure interferograms corresponding to different positions of the optical sensor as the interferometer transitions through the set of the reference retardances; anda controller coupled to the interferometer and the optical sensor, the controller operable to:determine a set of wavelengths corresponding to spectral slices of a hyperspectral data-cube;form a reconstruction matrix comprising rows of periodic functions, wherein each row corresponds to a selected wavelength of the set of wavelengths, and each column corresponds to a selected retardance of the reference retardances, wherein the periodic functions each have as a parameter the selected wavelength of the corresponding row and are sampled at the selected retardance of the corresponding column;obtain an interferogram data-cube comprising an array of one or more of the simultaneously measured interferograms, wherein each row of the interferogram data-cube corresponds to one of the selected retardances and each column of the interferogram data-cube corresponds to a different interferogram from the simultaneously measured interferograms; andform a set of matrix-vector products for each of the interferograms, each of the matrix-vector products comprising a matrix multiplication of the reconstruction matrix with a column of the interferogram data-cube, the set of matrix-vector products forming the hyperspectral data-cube.
- The apparatus of claim 6, wherein each of the periodic functions is phase-shifted for each of the selected wavelengths so that a phase of 0 corresponds roughly to a zero-retardance point of the interferometer at each of the selected wavelengths.
- The apparatus of claim 6, wherein the controller is further configured to multiply each row of the reconstruction matrix by a wavelength-dependent function to reduce artifacts caused by asymmetrically measured interferograms.
- The apparatus of claim 6, wherein each row of the reconstruction matrix is multiplied by a wavelength-dependent windowing or apodization function.
- The apparatus of claim 6, wherein the reconstruction matrix is multiplied by a diagonalization matrix (AB)-1 to yield (AB)-1 A, where A is the reconstruction matrix and B is a system response matrix with columns that are the expected raw interferograms generated by a unit wavelength stimulus to the interferometer at the wavelengths corresponding to each of the rows of A.
Applications Claiming Priority (1)
| Application Number | Priority Date | Filing Date | Title |
|---|---|---|---|
| US15/858,338 US10663346B2 (en) | 2017-12-29 | 2017-12-29 | Method and apparatus for transforming uniformly or non-uniformly sampled interferograms to produce spectral data |
Publications (3)
| Publication Number | Publication Date |
|---|---|
| EP3505886A2 true EP3505886A2 (en) | 2019-07-03 |
| EP3505886A3 EP3505886A3 (en) | 2019-07-31 |
| EP3505886B1 EP3505886B1 (en) | 2020-09-23 |
Family
ID=64665224
Family Applications (1)
| Application Number | Title | Priority Date | Filing Date |
|---|---|---|---|
| EP18212124.4A Active EP3505886B1 (en) | 2017-12-29 | 2018-12-12 | Method and apparatus for transforming uniformly or non-uniformly sampled interferograms to produce spectral data |
Country Status (5)
| Country | Link |
|---|---|
| US (1) | US10663346B2 (en) |
| EP (1) | EP3505886B1 (en) |
| JP (1) | JP7082564B2 (en) |
| KR (1) | KR102439398B1 (en) |
| CN (1) | CN109990899B (en) |
Families Citing this family (4)
| Publication number | Priority date | Publication date | Assignee | Title |
|---|---|---|---|---|
| US11095390B2 (en) * | 2018-08-23 | 2021-08-17 | International Business Machines Corporation | Polarization-insensitive optical link |
| US20240159511A1 (en) * | 2022-10-17 | 2024-05-16 | Lawrence Livermore National Security, Llc | Three-phase spectral interferometry with improved signal retrieval |
| DE102023211554A1 (en) * | 2023-11-20 | 2025-05-22 | Fraunhofer-Gesellschaft zur Förderung der angewandten Forschung eingetragener Verein | Optical device |
| KR102889567B1 (en) * | 2023-11-28 | 2025-11-24 | 이화여자대학교 산학협력단 | Greenhouse Gas Total Concentration Measuring Method and Computing Device for Performing the Method |
Family Cites Families (88)
| Publication number | Priority date | Publication date | Assignee | Title |
|---|---|---|---|---|
| US4342516A (en) | 1980-03-07 | 1982-08-03 | The Perkin-Elmer Corporation | Filter indexing for spectrophotometer system |
| US4461543A (en) | 1982-03-26 | 1984-07-24 | Sperry Corporation | Electro optic switch |
| JPS62103529A (en) | 1985-10-31 | 1987-05-14 | Toshiba Corp | Composite pipe |
| US4848877A (en) | 1987-09-29 | 1989-07-18 | Cambridge Research And Instrumentation, Inc. | Liquid crystal devices and systems using such devices |
| US4905169A (en) | 1988-06-02 | 1990-02-27 | The United States Of America As Represented By The United States Department Of Energy | Method and apparatus for simultaneously measuring a plurality of spectral wavelengths present in electromagnetic radiation |
| US5126869A (en) | 1990-12-03 | 1992-06-30 | Raytheon Company | Two-dimensional, phased-array optical beam steerer |
| US5784162A (en) | 1993-08-18 | 1998-07-21 | Applied Spectral Imaging Ltd. | Spectral bio-imaging methods for biological research, medical diagnostics and therapy |
| DE69226998T2 (en) | 1991-07-19 | 1999-04-15 | Sharp K.K., Osaka | Optical modulation element and devices with such an element |
| US5347382A (en) | 1992-04-23 | 1994-09-13 | Rumbaugh Scott H | Liquid crystal cell retarder with driving beyond retardance value and two cells for high speed |
| JP2925064B2 (en) | 1993-12-02 | 1999-07-26 | 矢崎総業株式会社 | Tunable wavelength filter |
| JPH07212639A (en) | 1994-01-25 | 1995-08-11 | Sony Corp | Electronic shutter device for television and camera |
| US5751384A (en) | 1995-05-23 | 1998-05-12 | The Board Of Regents Of The University Of Colorado | Color polarizers for polarizing an additive color spectrum along a first axis and it's compliment along a second axis |
| US5856842A (en) | 1996-08-26 | 1999-01-05 | Kaiser Optical Systems Corporation | Apparatus facilitating eye-contact video communications |
| US6100944A (en) * | 1997-10-10 | 2000-08-08 | Boulder Nonlinear Systems, Inc. | Polarizing interferometer using multiorder and zero order birefringence switches |
| JP3732326B2 (en) | 1998-02-02 | 2006-01-05 | 株式会社沖データ | Optical print head |
| CN1299472A (en) | 1998-04-08 | 2001-06-13 | 科英应用技术公司 | High speed electro-optic modulator |
| US6421131B1 (en) | 1999-07-02 | 2002-07-16 | Cambridge Research & Instrumentation Inc. | Birefringent interferometer |
| GB2354833A (en) | 1999-09-28 | 2001-04-04 | Sharp Lab Of Europ Ltd | Liquid crystal device |
| US7116370B1 (en) | 2000-03-31 | 2006-10-03 | Sharp Laboratories Of Ameria, Inc. | Image processing system optical shifting mechanism |
| US6373614B1 (en) | 2000-08-31 | 2002-04-16 | Cambridge Research Instrumentation Inc. | High performance polarization controller and polarization sensor |
| US7973936B2 (en) | 2001-01-30 | 2011-07-05 | Board Of Trustees Of Michigan State University | Control system and apparatus for use with ultra-fast laser |
| US6576886B1 (en) | 2001-02-20 | 2003-06-10 | General Photonics Corporation | Dynamic control of polarization of an optical signal |
| JP4382317B2 (en) | 2001-12-06 | 2009-12-09 | シチズンホールディングス株式会社 | Liquid crystal variable wavelength filter device |
| US6744509B2 (en) | 2002-08-20 | 2004-06-01 | Meadowlark Optics, Inc. | Retardance sweep polarimeter and method |
| US7067795B1 (en) | 2002-10-03 | 2006-06-27 | General Photonics Corporation | Methods and systems for dynamic control of polarization of an optical signal |
| EP1411333B1 (en) | 2002-10-15 | 2006-03-08 | Centre National De La Recherche Scientifique (Cnrs) | A liquid crystal based polarimetric system, a process for its calibration, and a polarimetric measurement process |
| US7897406B2 (en) | 2002-12-20 | 2011-03-01 | Fiso Technologies Inc. | Method and sensor for detecting a chemical substance using an optically anisotropic material |
| US7782377B2 (en) | 2003-02-26 | 2010-08-24 | Canon Kabushiki Kaisha | Image sensing apparatus, control method therefor, storage medium, and program to create correction data |
| WO2005008199A2 (en) * | 2003-07-18 | 2005-01-27 | Chemimage Corporation | Method and apparatus for compact fabry-perot imaging spectrometer |
| US7321791B2 (en) * | 2003-09-23 | 2008-01-22 | Cambridge Research And Instrumentation, Inc. | Spectral imaging of deep tissue |
| JP4285350B2 (en) | 2004-02-26 | 2009-06-24 | セイコーエプソン株式会社 | Viewing angle control element and manufacturing method thereof, liquid crystal display device, electronic device |
| JP2005348140A (en) | 2004-06-03 | 2005-12-15 | Matsushita Electric Ind Co Ltd | Camera device |
| JP4400448B2 (en) | 2004-12-22 | 2010-01-20 | コニカミノルタセンシング株式会社 | Spectral luminance meter calibration method and calibration system operation program |
| US6992809B1 (en) | 2005-02-02 | 2006-01-31 | Chemimage Corporation | Multi-conjugate liquid crystal tunable filter |
| WO2006103663A1 (en) | 2005-03-29 | 2006-10-05 | Yoel Arieli | Spectral imaging camera and applications |
| US7420663B2 (en) | 2005-05-24 | 2008-09-02 | Bwt Property Inc. | Spectroscopic sensor on mobile phone |
| JP4684771B2 (en) | 2005-06-30 | 2011-05-18 | Hoya株式会社 | Image blur correction device |
| JP4205704B2 (en) | 2005-08-02 | 2009-01-07 | 国立大学法人 北海道大学 | Imaging polarization measurement method |
| US7639363B2 (en) | 2005-09-07 | 2009-12-29 | California Institute Of Technology | Electro-optic imaging Fourier transform spectrometer |
| US7630022B1 (en) | 2005-09-20 | 2009-12-08 | Thomas Baur | Advanced liquid crystal tunable filters and method |
| WO2007038410A2 (en) | 2005-09-27 | 2007-04-05 | Chemimage Corporation | Liquid crystal filter with tunable rejection band |
| US7525712B2 (en) | 2005-09-29 | 2009-04-28 | Teledyne Scientific & Imaging, Llc | Broad spectral range polarization rotator |
| DE102005048240A1 (en) | 2005-10-07 | 2007-04-19 | Stefan Steib | Method for the spectral, integrated calibration of an image sensor by means of monochromatic light sources |
| EP1952106B1 (en) | 2005-11-04 | 2014-08-27 | George Themelis | System for multispectral imaging |
| CN100451678C (en) * | 2005-11-18 | 2009-01-14 | 北京航空航天大学 | High spectrum full polarization three dimension imaging integrate detecting system |
| US8644911B1 (en) | 2006-06-30 | 2014-02-04 | Hypermed Imaging, Inc. | OxyVu-1 hyperspectral tissue oxygenation (HTO) measurement system |
| US8447087B2 (en) | 2006-09-12 | 2013-05-21 | Carestream Health, Inc. | Apparatus and method for caries detection |
| WO2008068753A2 (en) | 2006-12-04 | 2008-06-12 | Ben-Gurion University Of The Negev - Research And Development Authority | Polarization independent birefringent tunable filters |
| GB0717967D0 (en) | 2007-09-14 | 2007-10-24 | Cascade Technologies Ltd | Polarimetric hyperspectral imager |
| EP2265936A2 (en) | 2008-04-01 | 2010-12-29 | Koninklijke Philips Electronics N.V. | Spectral detector calibration |
| US8406859B2 (en) | 2008-08-10 | 2013-03-26 | Board Of Regents, The University Of Texas System | Digital light processing hyperspectral imaging apparatus |
| FR2937732B1 (en) | 2008-10-29 | 2010-12-31 | Horiba Jobin Yvon Sas | DEVICE AND METHOD FOR SPECTROSCOPIC POLARIMETRIC MEASUREMENTS IN THE VISIBLE AND NEAR INFRARED DOMAIN |
| WO2010081116A2 (en) | 2009-01-10 | 2010-07-15 | Goldfinch Solutions, Llc | System and method for analyzing properties of meat using multispectral imaging |
| US8525970B2 (en) | 2009-05-21 | 2013-09-03 | The Hong Kong University Of Science And Technology | Photo-aligned liquid-crystal micropolarimeter array and its manufacturing method |
| US8982313B2 (en) | 2009-07-31 | 2015-03-17 | North Carolina State University | Beam steering devices including stacked liquid crystal polarization gratings and related methods of operation |
| US7999933B2 (en) | 2009-08-14 | 2011-08-16 | Princeton Instruments | Method for calibrating imaging spectrographs |
| US8400574B2 (en) | 2010-04-16 | 2013-03-19 | Chemimage Corporation | Short wave infrared multi-conjugate liquid crystal tunable filter |
| US9111501B2 (en) | 2010-04-19 | 2015-08-18 | Sharp Kabushiki Kaisha | Display device |
| US20110299089A1 (en) * | 2010-06-04 | 2011-12-08 | University Of Washington | Compact liquid crystal based fourier transform spectrometer system |
| US20120013922A1 (en) | 2010-07-19 | 2012-01-19 | Lotz Michael G | Print Data Format Modification Mechanism |
| US9046422B2 (en) * | 2011-04-20 | 2015-06-02 | The Arizona Board Of Regents On Behalf Of The University Of Arizona | Ultra-compact snapshot imaging fourier transform spectrometer |
| US9442015B2 (en) * | 2010-09-03 | 2016-09-13 | The Arizona Board Of Regents On Behalf Of The University Of Arizona | Snapshot spatial heterodyne imaging polarimetry |
| US9074993B2 (en) * | 2010-09-03 | 2015-07-07 | The Arizona Board Of Regents On Behalf Of The University Of Arizona | White light achromatic grating imaging polarimeter |
| US8422119B1 (en) | 2010-09-20 | 2013-04-16 | Disco Corporation | Compensation of beam walkoff in nonlinear crystal using cylindrical lens |
| US8736777B2 (en) | 2011-01-19 | 2014-05-27 | Chemimage Technologies Llc | VIS-SNIR multi-conjugate liquid crystal tunable filter |
| EP2551635A1 (en) | 2011-07-26 | 2013-01-30 | Hexagon Technology Center GmbH | Optical measurement system with filter unit for extracting electromagnetic radiation |
| JP6073883B2 (en) | 2011-07-28 | 2017-02-01 | マサチューセッツ インスティテュート オブ テクノロジー | Configuration of camera for 3D imaging of internal space |
| JP2013096883A (en) | 2011-11-02 | 2013-05-20 | Seiko Epson Corp | Spectroscopic measuring apparatus |
| US20140362331A1 (en) | 2013-03-15 | 2014-12-11 | Chemlmage Corporation | Short-Wavelength Infrared (SWIR) Multi-Conjugate Liquid Crystal Tunable Filter |
| US20140354868A1 (en) | 2013-06-04 | 2014-12-04 | Corning Incorporated | Portable hyperspectral imager |
| US9513166B2 (en) | 2013-07-16 | 2016-12-06 | Utah State University Research Foundation | Split field spectral imager |
| JP5866577B2 (en) | 2013-07-29 | 2016-02-17 | パナソニックIpマネジメント株式会社 | Optical filter and polarization imaging apparatus using the same |
| US9631973B2 (en) | 2013-12-13 | 2017-04-25 | Raytheon Company | Multifunction imager |
| EP3126904B1 (en) | 2014-04-02 | 2018-11-28 | Essilor International | Achromatic phase modulator and optical device |
| US11490037B2 (en) * | 2014-10-29 | 2022-11-01 | Palo Alto Research Center Incorporated | Liquid crystal fourier transform imaging spectrometer |
| US10760967B2 (en) | 2014-10-29 | 2020-09-01 | Palo Alto Research Center Incorporated | Liquid crystal fourier transform imaging spectrometer |
| US10469771B2 (en) | 2014-10-29 | 2019-11-05 | Palo Alto Research Center Incorporated | Liquid crystal fourier transform imaging spectrometer |
| EP3218669B1 (en) | 2014-11-16 | 2024-02-28 | ABDULHALIM, Ibrahim | Multi-spectral polarimetric variable optical device and imager |
| US10302494B2 (en) | 2014-12-18 | 2019-05-28 | Palo Alto Research Center Incorporated | Obtaining spectral information from a moving object |
| CN107430309B (en) | 2015-01-09 | 2020-11-06 | 依视路国际公司 | Liquid Crystal Achromatic Phase Modulator |
| US10228517B2 (en) | 2015-03-03 | 2019-03-12 | Nistica, Inc. | Optical arrangement for managing diversity and isolation between ports in a wavelength selective switch |
| US10317283B2 (en) | 2016-02-04 | 2019-06-11 | Jasco Corporation | Spectrum measurement method using fourier transform type spectroscopic device |
| JP2017191071A (en) | 2016-04-15 | 2017-10-19 | キヤノン株式会社 | Spectral data processing device, imaging device, spectral data processing method, and spectral data processing program |
| US10425598B2 (en) | 2016-06-20 | 2019-09-24 | Massachusetts Institute Of Technology | Methods and systems for time-encoded multiplexed imaging |
| US10768497B2 (en) | 2016-10-03 | 2020-09-08 | Xerox Corporation | Hyperspectral imaging system |
| JP2020514797A (en) | 2017-01-06 | 2020-05-21 | ニスティカ,インコーポレーテッド | Optical arrangement for suppressing out-of-band crosstalk in wavelength selective switches |
| US10884278B2 (en) | 2017-10-24 | 2021-01-05 | Palo Alto Research Center Incorporated | Liquid crystal temperature control by resistive heating |
| US10175116B1 (en) * | 2017-12-29 | 2019-01-08 | Palo Alto Research Center Incorporated | Color filter used with liquid-crystal polarization interferometer |
-
2017
- 2017-12-29 US US15/858,338 patent/US10663346B2/en not_active Expired - Fee Related
-
2018
- 2018-12-04 CN CN201811476928.1A patent/CN109990899B/en not_active Expired - Fee Related
- 2018-12-06 JP JP2018228850A patent/JP7082564B2/en not_active Expired - Fee Related
- 2018-12-12 EP EP18212124.4A patent/EP3505886B1/en active Active
- 2018-12-13 KR KR1020180160553A patent/KR102439398B1/en active Active
Non-Patent Citations (1)
| Title |
|---|
| C. D. PORTER; D. B. TANNER: "Correction of phase errors in Fourier spectroscopy", INT. J. INFRARED MILLIMETER WAVES, vol. 4, 1983, pages 273 - 298 |
Also Published As
| Publication number | Publication date |
|---|---|
| KR20190082090A (en) | 2019-07-09 |
| CN109990899B (en) | 2022-01-14 |
| CN109990899A (en) | 2019-07-09 |
| EP3505886A3 (en) | 2019-07-31 |
| KR102439398B1 (en) | 2022-09-02 |
| US10663346B2 (en) | 2020-05-26 |
| US20190204153A1 (en) | 2019-07-04 |
| JP2019120681A (en) | 2019-07-22 |
| EP3505886B1 (en) | 2020-09-23 |
| JP7082564B2 (en) | 2022-06-08 |
Similar Documents
| Publication | Publication Date | Title |
|---|---|---|
| EP3505886B1 (en) | Method and apparatus for transforming uniformly or non-uniformly sampled interferograms to produce spectral data | |
| US6816261B2 (en) | Polarization analysis unit, calibration method and optimization therefor | |
| US9880053B2 (en) | Image pickup apparatus, spectroscopic system, and spectroscopic method | |
| US9097585B2 (en) | Spectrographic polarimeter and method of recording state of polarity | |
| KR102430145B1 (en) | Liquid-crystal variable retarder using liquid crystal cells of differing thicknesses | |
| CN111443045B (en) | Spectral imaging analysis system and spectral imaging analysis method | |
| JP2018532105A (en) | Apparatus, system and method for Talbot type spectrometer | |
| CN112781728B (en) | Accurate solution of fully polarized hyperspectral imaging method combined with compressed sensing | |
| EP4407287A1 (en) | Polarimetric phase imaging | |
| JP2018194455A (en) | Polarization property measurement method and polarization property measurement device | |
| Han et al. | Deep image prior plus sparsity prior: toward single-shot full-Stokes spectropolarimetric imaging with a multiple-order retarder | |
| KR102483017B1 (en) | Measuring path delay through a liquid-crystal variable retarder at non-uniform retardance intervals | |
| US7023546B1 (en) | Real-time imaging spectropolarimeter based on an optical modulator | |
| EP4428509A1 (en) | Wavefront measuring apparatus and wavefront measuring method for sensing a light field and reconstructing a wavefront thereof | |
| CN109991768B (en) | Exit pupil expander for distributing light over a liquid crystal variable retarder | |
| CN107084787A (en) | A kind of temperature correction of AOTF imaging spectrometers spectral calibration | |
| Hagen et al. | Generating high-performance polarization measurements with low-performance polarizers: demonstration with a microgrid polarization camera | |
| Pruthvi et al. | Solar spectropolarimetry of Ca II 8542 Å line: polarimeter development, calibration, and preliminary observations | |
| JP2019533174A (en) | Method and apparatus for analyzing electromagnetic waves with high definition | |
| Pozhar et al. | Acousto-optical imaging spectroscopy | |
| EP4708843A1 (en) | Optical imaging apparatus and spectral imaging method for creating spectrally and spatially resolved image data | |
| Youngs et al. | Snapshot hyperspectral imaging Fourier transform spectropolarimeter | |
| Han et al. | Iterative reconstruction for linear imaging spectropolarimetry without polarimetric calibration | |
| Kulkarni | A survey of performance characterization for spectropolarimetric imaging systems | |
| Perseo et al. | Validation of delay dispersion estimation for coherence imaging spectroscopy |
Legal Events
| Date | Code | Title | Description |
|---|---|---|---|
| PUAI | Public reference made under article 153(3) epc to a published international application that has entered the european phase |
Free format text: ORIGINAL CODE: 0009012 |
|
| STAA | Information on the status of an ep patent application or granted ep patent |
Free format text: STATUS: THE APPLICATION HAS BEEN PUBLISHED |
|
| PUAL | Search report despatched |
Free format text: ORIGINAL CODE: 0009013 |
|
| AK | Designated contracting states |
Kind code of ref document: A2 Designated state(s): AL AT BE BG CH CY CZ DE DK EE ES FI FR GB GR HR HU IE IS IT LI LT LU LV MC MK MT NL NO PL PT RO RS SE SI SK SM TR |
|
| AX | Request for extension of the european patent |
Extension state: BA ME |
|
| AK | Designated contracting states |
Kind code of ref document: A3 Designated state(s): AL AT BE BG CH CY CZ DE DK EE ES FI FR GB GR HR HU IE IS IT LI LT LU LV MC MK MT NL NO PL PT RO RS SE SI SK SM TR |
|
| AX | Request for extension of the european patent |
Extension state: BA ME |
|
| RIC1 | Information provided on ipc code assigned before grant |
Ipc: G01J 3/28 20060101AFI20190627BHEP Ipc: G02F 1/00 20060101ALI20190627BHEP Ipc: G01J 3/447 20060101ALI20190627BHEP Ipc: G01J 3/45 20060101ALI20190627BHEP Ipc: G01J 3/453 20060101ALI20190627BHEP Ipc: G01J 3/02 20060101ALI20190627BHEP |
|
| STAA | Information on the status of an ep patent application or granted ep patent |
Free format text: STATUS: REQUEST FOR EXAMINATION WAS MADE |
|
| 17P | Request for examination filed |
Effective date: 20200131 |
|
| RBV | Designated contracting states (corrected) |
Designated state(s): AL AT BE BG CH CY CZ DE DK EE ES FI FR GB GR HR HU IE IS IT LI LT LU LV MC MK MT NL NO PL PT RO RS SE SI SK SM TR |
|
| RIC1 | Information provided on ipc code assigned before grant |
Ipc: G01J 3/447 20060101ALI20200303BHEP Ipc: G01J 3/02 20060101ALI20200303BHEP Ipc: G02F 1/00 20060101ALI20200303BHEP Ipc: G01J 3/453 20060101ALI20200303BHEP Ipc: G01J 3/28 20060101AFI20200303BHEP Ipc: G01J 3/45 20060101ALI20200303BHEP |
|
| GRAP | Despatch of communication of intention to grant a patent |
Free format text: ORIGINAL CODE: EPIDOSNIGR1 |
|
| STAA | Information on the status of an ep patent application or granted ep patent |
Free format text: STATUS: GRANT OF PATENT IS INTENDED |
|
| INTG | Intention to grant announced |
Effective date: 20200417 |
|
| GRAS | Grant fee paid |
Free format text: ORIGINAL CODE: EPIDOSNIGR3 |
|
| GRAA | (expected) grant |
Free format text: ORIGINAL CODE: 0009210 |
|
| STAA | Information on the status of an ep patent application or granted ep patent |
Free format text: STATUS: THE PATENT HAS BEEN GRANTED |
|
| AK | Designated contracting states |
Kind code of ref document: B1 Designated state(s): AL AT BE BG CH CY CZ DE DK EE ES FI FR GB GR HR HU IE IS IT LI LT LU LV MC MK MT NL NO PL PT RO RS SE SI SK SM TR |
|
| REG | Reference to a national code |
Ref country code: GB Ref legal event code: FG4D |
|
| REG | Reference to a national code |
Ref country code: CH Ref legal event code: EP |
|
| REG | Reference to a national code |
Ref country code: IE Ref legal event code: FG4D |
|
| REG | Reference to a national code |
Ref country code: AT Ref legal event code: REF Ref document number: 1316875 Country of ref document: AT Kind code of ref document: T Effective date: 20201015 Ref country code: DE Ref legal event code: R096 Ref document number: 602018008096 Country of ref document: DE |
|
| PG25 | Lapsed in a contracting state [announced via postgrant information from national office to epo] |
Ref country code: SE Free format text: LAPSE BECAUSE OF FAILURE TO SUBMIT A TRANSLATION OF THE DESCRIPTION OR TO PAY THE FEE WITHIN THE PRESCRIBED TIME-LIMIT Effective date: 20200923 Ref country code: FI Free format text: LAPSE BECAUSE OF FAILURE TO SUBMIT A TRANSLATION OF THE DESCRIPTION OR TO PAY THE FEE WITHIN THE PRESCRIBED TIME-LIMIT Effective date: 20200923 Ref country code: BG Free format text: LAPSE BECAUSE OF FAILURE TO SUBMIT A TRANSLATION OF THE DESCRIPTION OR TO PAY THE FEE WITHIN THE PRESCRIBED TIME-LIMIT Effective date: 20201223 Ref country code: HR Free format text: LAPSE BECAUSE OF FAILURE TO SUBMIT A TRANSLATION OF THE DESCRIPTION OR TO PAY THE FEE WITHIN THE PRESCRIBED TIME-LIMIT Effective date: 20200923 Ref country code: NO Free format text: LAPSE BECAUSE OF FAILURE TO SUBMIT A TRANSLATION OF THE DESCRIPTION OR TO PAY THE FEE WITHIN THE PRESCRIBED TIME-LIMIT Effective date: 20201223 Ref country code: GR Free format text: LAPSE BECAUSE OF FAILURE TO SUBMIT A TRANSLATION OF THE DESCRIPTION OR TO PAY THE FEE WITHIN THE PRESCRIBED TIME-LIMIT Effective date: 20201224 |
|
| REG | Reference to a national code |
Ref country code: AT Ref legal event code: MK05 Ref document number: 1316875 Country of ref document: AT Kind code of ref document: T Effective date: 20200923 |
|
| PG25 | Lapsed in a contracting state [announced via postgrant information from national office to epo] |
Ref country code: RS Free format text: LAPSE BECAUSE OF FAILURE TO SUBMIT A TRANSLATION OF THE DESCRIPTION OR TO PAY THE FEE WITHIN THE PRESCRIBED TIME-LIMIT Effective date: 20200923 Ref country code: LV Free format text: LAPSE BECAUSE OF FAILURE TO SUBMIT A TRANSLATION OF THE DESCRIPTION OR TO PAY THE FEE WITHIN THE PRESCRIBED TIME-LIMIT Effective date: 20200923 |
|
| REG | Reference to a national code |
Ref country code: NL Ref legal event code: MP Effective date: 20200923 |
|
| REG | Reference to a national code |
Ref country code: LT Ref legal event code: MG4D |
|
| PG25 | Lapsed in a contracting state [announced via postgrant information from national office to epo] |
Ref country code: CZ Free format text: LAPSE BECAUSE OF FAILURE TO SUBMIT A TRANSLATION OF THE DESCRIPTION OR TO PAY THE FEE WITHIN THE PRESCRIBED TIME-LIMIT Effective date: 20200923 Ref country code: RO Free format text: LAPSE BECAUSE OF FAILURE TO SUBMIT A TRANSLATION OF THE DESCRIPTION OR TO PAY THE FEE WITHIN THE PRESCRIBED TIME-LIMIT Effective date: 20200923 Ref country code: PT Free format text: LAPSE BECAUSE OF FAILURE TO SUBMIT A TRANSLATION OF THE DESCRIPTION OR TO PAY THE FEE WITHIN THE PRESCRIBED TIME-LIMIT Effective date: 20210125 Ref country code: EE Free format text: LAPSE BECAUSE OF FAILURE TO SUBMIT A TRANSLATION OF THE DESCRIPTION OR TO PAY THE FEE WITHIN THE PRESCRIBED TIME-LIMIT Effective date: 20200923 Ref country code: LT Free format text: LAPSE BECAUSE OF FAILURE TO SUBMIT A TRANSLATION OF THE DESCRIPTION OR TO PAY THE FEE WITHIN THE PRESCRIBED TIME-LIMIT Effective date: 20200923 Ref country code: SM Free format text: LAPSE BECAUSE OF FAILURE TO SUBMIT A TRANSLATION OF THE DESCRIPTION OR TO PAY THE FEE WITHIN THE PRESCRIBED TIME-LIMIT Effective date: 20200923 |
|
| PG25 | Lapsed in a contracting state [announced via postgrant information from national office to epo] |
Ref country code: IS Free format text: LAPSE BECAUSE OF FAILURE TO SUBMIT A TRANSLATION OF THE DESCRIPTION OR TO PAY THE FEE WITHIN THE PRESCRIBED TIME-LIMIT Effective date: 20210123 Ref country code: PL Free format text: LAPSE BECAUSE OF FAILURE TO SUBMIT A TRANSLATION OF THE DESCRIPTION OR TO PAY THE FEE WITHIN THE PRESCRIBED TIME-LIMIT Effective date: 20200923 Ref country code: ES Free format text: LAPSE BECAUSE OF FAILURE TO SUBMIT A TRANSLATION OF THE DESCRIPTION OR TO PAY THE FEE WITHIN THE PRESCRIBED TIME-LIMIT Effective date: 20200923 Ref country code: AL Free format text: LAPSE BECAUSE OF FAILURE TO SUBMIT A TRANSLATION OF THE DESCRIPTION OR TO PAY THE FEE WITHIN THE PRESCRIBED TIME-LIMIT Effective date: 20200923 Ref country code: AT Free format text: LAPSE BECAUSE OF FAILURE TO SUBMIT A TRANSLATION OF THE DESCRIPTION OR TO PAY THE FEE WITHIN THE PRESCRIBED TIME-LIMIT Effective date: 20200923 |
|
| REG | Reference to a national code |
Ref country code: DE Ref legal event code: R097 Ref document number: 602018008096 Country of ref document: DE |
|
| PG25 | Lapsed in a contracting state [announced via postgrant information from national office to epo] |
Ref country code: SK Free format text: LAPSE BECAUSE OF FAILURE TO SUBMIT A TRANSLATION OF THE DESCRIPTION OR TO PAY THE FEE WITHIN THE PRESCRIBED TIME-LIMIT Effective date: 20200923 |
|
| PLBE | No opposition filed within time limit |
Free format text: ORIGINAL CODE: 0009261 |
|
| STAA | Information on the status of an ep patent application or granted ep patent |
Free format text: STATUS: NO OPPOSITION FILED WITHIN TIME LIMIT |
|
| PG25 | Lapsed in a contracting state [announced via postgrant information from national office to epo] |
Ref country code: DK Free format text: LAPSE BECAUSE OF FAILURE TO SUBMIT A TRANSLATION OF THE DESCRIPTION OR TO PAY THE FEE WITHIN THE PRESCRIBED TIME-LIMIT Effective date: 20200923 Ref country code: SI Free format text: LAPSE BECAUSE OF FAILURE TO SUBMIT A TRANSLATION OF THE DESCRIPTION OR TO PAY THE FEE WITHIN THE PRESCRIBED TIME-LIMIT Effective date: 20200923 Ref country code: MC Free format text: LAPSE BECAUSE OF FAILURE TO SUBMIT A TRANSLATION OF THE DESCRIPTION OR TO PAY THE FEE WITHIN THE PRESCRIBED TIME-LIMIT Effective date: 20200923 |
|
| 26N | No opposition filed |
Effective date: 20210624 |
|
| REG | Reference to a national code |
Ref country code: BE Ref legal event code: MM Effective date: 20201231 |
|
| PG25 | Lapsed in a contracting state [announced via postgrant information from national office to epo] |
Ref country code: IE Free format text: LAPSE BECAUSE OF NON-PAYMENT OF DUE FEES Effective date: 20201212 Ref country code: IT Free format text: LAPSE BECAUSE OF FAILURE TO SUBMIT A TRANSLATION OF THE DESCRIPTION OR TO PAY THE FEE WITHIN THE PRESCRIBED TIME-LIMIT Effective date: 20200923 Ref country code: LU Free format text: LAPSE BECAUSE OF NON-PAYMENT OF DUE FEES Effective date: 20201212 |
|
| PG25 | Lapsed in a contracting state [announced via postgrant information from national office to epo] |
Ref country code: TR Free format text: LAPSE BECAUSE OF FAILURE TO SUBMIT A TRANSLATION OF THE DESCRIPTION OR TO PAY THE FEE WITHIN THE PRESCRIBED TIME-LIMIT Effective date: 20200923 Ref country code: MT Free format text: LAPSE BECAUSE OF FAILURE TO SUBMIT A TRANSLATION OF THE DESCRIPTION OR TO PAY THE FEE WITHIN THE PRESCRIBED TIME-LIMIT Effective date: 20200923 Ref country code: CY Free format text: LAPSE BECAUSE OF FAILURE TO SUBMIT A TRANSLATION OF THE DESCRIPTION OR TO PAY THE FEE WITHIN THE PRESCRIBED TIME-LIMIT Effective date: 20200923 |
|
| PG25 | Lapsed in a contracting state [announced via postgrant information from national office to epo] |
Ref country code: MK Free format text: LAPSE BECAUSE OF FAILURE TO SUBMIT A TRANSLATION OF THE DESCRIPTION OR TO PAY THE FEE WITHIN THE PRESCRIBED TIME-LIMIT Effective date: 20200923 |
|
| PG25 | Lapsed in a contracting state [announced via postgrant information from national office to epo] |
Ref country code: BE Free format text: LAPSE BECAUSE OF NON-PAYMENT OF DUE FEES Effective date: 20201231 |
|
| REG | Reference to a national code |
Ref country code: CH Ref legal event code: PL |
|
| PG25 | Lapsed in a contracting state [announced via postgrant information from national office to epo] |
Ref country code: LI Free format text: LAPSE BECAUSE OF NON-PAYMENT OF DUE FEES Effective date: 20211231 Ref country code: CH Free format text: LAPSE BECAUSE OF NON-PAYMENT OF DUE FEES Effective date: 20211231 |
|
| PGFP | Annual fee paid to national office [announced via postgrant information from national office to epo] |
Ref country code: GB Payment date: 20221116 Year of fee payment: 5 Ref country code: FR Payment date: 20221122 Year of fee payment: 5 Ref country code: DE Payment date: 20221122 Year of fee payment: 5 |
|
| PG25 | Lapsed in a contracting state [announced via postgrant information from national office to epo] |
Ref country code: NL Free format text: LAPSE BECAUSE OF NON-PAYMENT OF DUE FEES Effective date: 20200923 |
|
| REG | Reference to a national code |
Ref country code: DE Ref legal event code: R119 Ref document number: 602018008096 Country of ref document: DE |
|
| GBPC | Gb: european patent ceased through non-payment of renewal fee |
Effective date: 20231212 |
|
| PG25 | Lapsed in a contracting state [announced via postgrant information from national office to epo] |
Ref country code: DE Free format text: LAPSE BECAUSE OF NON-PAYMENT OF DUE FEES Effective date: 20240702 |
|
| PG25 | Lapsed in a contracting state [announced via postgrant information from national office to epo] |
Ref country code: GB Free format text: LAPSE BECAUSE OF NON-PAYMENT OF DUE FEES Effective date: 20231212 |
|
| PG25 | Lapsed in a contracting state [announced via postgrant information from national office to epo] |
Ref country code: FR Free format text: LAPSE BECAUSE OF NON-PAYMENT OF DUE FEES Effective date: 20231231 |
|
| PG25 | Lapsed in a contracting state [announced via postgrant information from national office to epo] |
Ref country code: GB Free format text: LAPSE BECAUSE OF NON-PAYMENT OF DUE FEES Effective date: 20231212 Ref country code: FR Free format text: LAPSE BECAUSE OF NON-PAYMENT OF DUE FEES Effective date: 20231231 Ref country code: DE Free format text: LAPSE BECAUSE OF NON-PAYMENT OF DUE FEES Effective date: 20240702 |