EP3476171B1 - System and method of controlling network traffic using preamble detection and automated optimization of random access channel parameters - Google Patents
System and method of controlling network traffic using preamble detection and automated optimization of random access channel parameters Download PDFInfo
- Publication number
- EP3476171B1 EP3476171B1 EP17731015.8A EP17731015A EP3476171B1 EP 3476171 B1 EP3476171 B1 EP 3476171B1 EP 17731015 A EP17731015 A EP 17731015A EP 3476171 B1 EP3476171 B1 EP 3476171B1
- Authority
- EP
- European Patent Office
- Prior art keywords
- rach
- random access
- access channel
- average
- physical random
- Prior art date
- Legal status (The legal status is an assumption and is not a legal conclusion. Google has not performed a legal analysis and makes no representation as to the accuracy of the status listed.)
- Active
Links
Images











Classifications
-
- H—ELECTRICITY
- H04—ELECTRIC COMMUNICATION TECHNIQUE
- H04W—WIRELESS COMMUNICATION NETWORKS
- H04W74/00—Wireless channel access
- H04W74/08—Non-scheduled access, e.g. ALOHA
- H04W74/0833—Random access procedures, e.g. with 4-step access
-
- H—ELECTRICITY
- H04—ELECTRIC COMMUNICATION TECHNIQUE
- H04L—TRANSMISSION OF DIGITAL INFORMATION, e.g. TELEGRAPHIC COMMUNICATION
- H04L27/00—Modulated-carrier systems
- H04L27/26—Systems using multi-frequency codes
-
- H—ELECTRICITY
- H04—ELECTRIC COMMUNICATION TECHNIQUE
- H04L—TRANSMISSION OF DIGITAL INFORMATION, e.g. TELEGRAPHIC COMMUNICATION
- H04L27/00—Modulated-carrier systems
- H04L27/26—Systems using multi-frequency codes
- H04L27/2601—Multicarrier modulation systems
- H04L27/2647—Arrangements specific to the receiver only
- H04L27/2655—Synchronisation arrangements
- H04L27/2662—Symbol synchronisation
- H04L27/2663—Coarse synchronisation, e.g. by correlation
-
- H—ELECTRICITY
- H04—ELECTRIC COMMUNICATION TECHNIQUE
- H04W—WIRELESS COMMUNICATION NETWORKS
- H04W28/00—Network traffic management; Network resource management
- H04W28/02—Traffic management, e.g. flow control or congestion control
-
- H—ELECTRICITY
- H04—ELECTRIC COMMUNICATION TECHNIQUE
- H04L—TRANSMISSION OF DIGITAL INFORMATION, e.g. TELEGRAPHIC COMMUNICATION
- H04L7/00—Arrangements for synchronising receiver with transmitter
- H04L7/04—Speed or phase control by synchronisation signals
- H04L7/041—Speed or phase control by synchronisation signals using special codes as synchronising signal
- H04L7/042—Detectors therefor, e.g. correlators, state machines
-
- H—ELECTRICITY
- H04—ELECTRIC COMMUNICATION TECHNIQUE
- H04W—WIRELESS COMMUNICATION NETWORKS
- H04W74/00—Wireless channel access
- H04W74/002—Transmission of channel access control information
Definitions
- Example aspects relate generally to a system and method for controlling network traffic using improved preamble detection and an automation of determined random access channel parameters.
- FIG. 1 illustrates a conventional 3rd Generation Partnership Project Long-Term Evolution (3GPP LTE) network 10.
- the network 10 includes an Internet Protocol (IP) Connectivity Access Network (IP-CAN) 100 and an IP Packet Data Network (IP-PDN) 1001.
- IP-CAN 100 generally includes: a serving gateway (SGW) 101; a packet data network (PDN) gateway (PGW) 103; a policy and charging rules function (PCRF) 106; a mobility management entity (MME) 108 and E-UTRAN Node B (eNB) 105 (i.e., base station, for the purposes herein the terms base station and eNB may be used interchangeably).
- SGW serving gateway
- PGW packet data network gateway
- PCRF policy and charging rules function
- MME mobility management entity
- eNB E-UTRAN Node B
- the IP-PDN 1001 portion of the EPS may include application or proxy servers, media servers, email servers, etc.
- the eNB 105 is part of what is referred to as an Evolved Universal Mobile Telecommunications System (UMTS) Terrestrial Radio Access Network (EUTRAN), and the portion of the IP-CAN 100 including the SGW 101, the PGW 103, the PCRF 106, and the MME 108 is referred to as an Evolved Packet Core (EPC).
- EPC Evolved Packet Core
- the eNB 105 provides wireless resources and radio coverage for one or more user equipments (UEs) 110. That is to say, any number of UEs 110 may be connected (or attached) to the eNB 105.
- the eNB 105 is operatively coupled to the SGW 101 and the MME 108.
- the SGW 101 routes and forwards user data packets, while also acting as the mobility anchor for the user plane during inter-eNB handovers of UEs.
- the SGW 101 also acts as the anchor for mobility between 3rd Generation Partnership Project Long-Term Evolution (3GPP LTE) and other 3GPP technologies.
- 3GPP LTE 3rd Generation Partnership Project Long-Term Evolution
- the SGW 101 terminates the downlink data path and triggers paging when downlink data arrives for UEs 110.
- the PGW 103 provides connectivity between UE 110 and the external packet data networks (e.g., the IP-PDN) by being the point of entry/exit of traffic for the UE 110.
- the external packet data networks e.g., the IP-PDN
- a given UE 110 may have simultaneous connectivity with more than one PGW 103 for accessing multiple PDNs.
- the PGW 103 also performs policy enforcement, packet filtering for UEs 110, charging support, lawful interception and packet screening, each of which are well-known functions.
- the PGW 103 also acts as the anchor for mobility between 3GPP and non-3GPP technologies, such as Worldwide Interoperability for Microwave Access (WiMAX) and 3rd Generation Partnership Project 2 (3GPP2 (code division multiple access (CDMA) 1X and Enhanced Voice Data Optimized (EvDO)).
- WiMAX Worldwide Interoperability for Microwave Access
- 3GPP2 code division multiple access (CDMA) 1X and Enhanced Voice Data Optimized (EvDO)
- eNB 105 is also operatively coupled to the MME 108.
- the MME 108 is the control-node for the EUTRAN, and is responsible for idle mode UE 110 paging and tagging procedures including retransmissions.
- the MME 108 is also responsible for choosing a particular SGW for a UE during initial attachment of the UE to the network, and during intra-LTE handover involving Core Network (CN) node relocation.
- the MME 108 authenticates UEs 110 by interacting with a Home Subscriber Server (HSS), which is not shown in FIG. 1 .
- HSS Home Subscriber Server
- Non Access Stratum (NAS) signaling terminates at the MME 108, and is responsible for generation and allocation of temporary identities for UEs 110.
- the MME 108 also checks the authorization of a UE 110 to camp on a service provider's Public Land Mobile Network (PLMN), and enforces UE 110 roaming restrictions.
- PLMN Public Land Mobile Network
- the MME 108 is the termination point in the network for ciphering/integrity protection for NAS signaling, and handles security key management.
- the MME 108 also provides control plane functionality for mobility between LTE and 2G/3G access networks with an interface from the SGSN (not shown) terminating at the MME 108.
- the Policy and Charging Rules Function (PCRF) 106 is the entity that may access subscriber databases, make policy decisions and set charging rules for the subscriber.
- FIG. 2 illustrates a conventional E-UTRAN Node B (eNB) 105.
- the eNB 105 includes: a memory 225; a processor 210; a scheduler 215; wireless communication interfaces 220; radio link control (RLC) buffers 230 for each bearer; and a backhaul interface 235.
- the processor 210 may also be referred to as a core network entity processing circuit, an EPC entity processing circuit, etc.
- the processor 210 may consist of one or more core processing units, either physically coupled together or distributed.
- the processor 210 controls the function of eNB 105 (as described herein), and is operatively coupled to the memory 225 and the communication interfaces 220. While only one processor 210 is shown in FIG.
- processors may be included in a typical eNB 105.
- the functions performed by the processor may be implemented using hardware.
- Such hardware may include one or more Central Processing Units (CPUs), digital signal processors (DSPs), application-specific-integrated-circuits, field programmable gate arrays (FPGAs) computers or the like.
- CPUs Central Processing Units
- DSPs digital signal processors
- FPGAs field programmable gate arrays
- processor used throughout this document, may refer to any of these example implementations, though the term is not limited to these examples.
- VRAN Virtual Radio Access Network
- various functions eNB components may be distributed across multiple processing circuits and multiple physical nodes within VRAN cloud.
- the eNB 105 may include one or more cells or sectors serving UEs 110 within individual geometric coverage sector areas. Each cell individually may contain elements depicted in Figure 2 . Throughout this document the terms eNB, cell or sector shall be used interchangeably.
- the wireless communication interfaces 220 include various interfaces including one or more transmitters/receivers connected to one or more antennas to transmit/receive wirelessly control and data signals to/from UEs 110.
- Backhaul interface 235 is the portion of eNB 105 that interfaces with SGW 101, MME 108, other eNBs, or interface to other EPC network elements and/or RAN elements within IP-CAN 100.
- the scheduler 215 schedules control and data communications that are to be transmitted and received by the eNB 105 to and from UEs 110.
- the memory 225 may buffer and store data that is being processed at eNB 105, transmitted and received to and from eNB 105.
- Scheduler 215 may make physical resource block (PRB) allocation decisions based upon a Quality of Service (QoS) Class Identifier (QCI), which represents traffic priority hierarchy.
- QoS Quality of Service
- QCI Class Identifier
- QCIs 1 to 4 are reserved for Guaranteed Bitrate (GBR) classes for which the scheduler maintains certain specific data flow QoS characteristics.
- GRR Guaranteed Bitrate
- QCIs 5 to 9 are reserved for various categories of Best Effort traffic.
- a random access channel enables user equipments (UEs) 110 to perform tasks such as initially accessing the communication network 10, uplink synchronization, handovers between cells, and recovery from failed links. Therefore, an achievement of an optimal random access performance through an efficient RACH signature detection algorithm, and use of a correct configuration of the RACH parameters, is crucial to optimizing performance of the communication network.
- RACH preamble detectors which takes place in the wireless interface 220 of an eNB 105, relies on an estimation of a noise floor in order to set a preamble detection threshold. Because of the non-stationary nature of signals involved in RACH preamble detection due to random RACH transmissions, unpredictable scheduling decisions and non-Gaussian interference, sufficiently accurate estimation of the noise floor may be an unachievable task and this may lead to an underperforming cellular system.
- static parameter configurations may not have the ability to overcome possible mismatches between the calculations used to set the parameters and the realities of a real-world deployment.
- static configurations may not adapt to changing conditions in a cellular network, especially with regard to interference and traffic intensity.
- static configurations may not autonomously tune the RACH parameters to reflect changes in the network architecture over time, such as cell splitting and the insertion of small cells.
- FIGUEIREDO FELIPE A P ET AL: "A modified CA-CFAR method for LTE random access detection " proposes a modified CA-CFAR method to detect CAZA sequences that are sent by UEs.
- JLTNTTI ET AL "CFAR strategies for channelized radiometer" analyses the performance of CA, OS and iterative CFAR signal detection methods in the context of channelized radiometer.
- At least one aspect relates to a method of preamble detection to control network traffic in a communication network, as claimed in claim 1.
- the detecting of the RACH preambles further includes, collecting noise rise information and preamble miss information for a set of transmitted RACH preambles, computing an overall average noise rise for the communication network based on the collected noise rise information, computing an average missed detection ratio for the communication network using the collected preamble miss information, determining a target receiver power and a power ramp-up using the average nose rise and the average missed detection ratio.
- the detecting of the RACH preambles further includes determining the normalized RACH detection threshold by performing the steps of, collecting preamble false alarm ratio information, computing an average false alarm rate for the communication network based on the preamble false alarm ratio information, and determining the normalized RACH detection threshold based on the average false alarm rate.
- the method further includes collecting a contention ratio information, computing an average contention ratio for the communication network based on the collected contention ratio information, determining the opportunity period based on the average contention ratio.
- the method includes repeating the steps of collecting noise rise information and preamble miss information, and repeating the steps of computing an overall average noise rise and an average missed detection ratio until the determined target receiver power and the power ramp-up remain constant; the method further includes repeating the steps of collecting preamble false alarm ratio information and computing an average false alarm rate until the determined normalized RACH detection threshold remains constant; and wherein the detecting of the RACH preambles further includes determining an opportunity period, once the determined target receiver power, the power ramp-up, and the normalized RACH detection threshold remain constant, by performing the steps of, collecting a contention ratio information, computing an average contention ratio for the communication network based on the collected contention ratio information, determining the opportunity period based on the average contention ratio.
- At least another aspect relates to at least a first network node in a communication network as claimed in claim 6.
- the at least a first processor is further configured to detect the RACH preambles by, collecting noise rise information and preamble miss information for a set of transmitted RACH preambles, computing an overall average noise rise for the communication network based on the collected noise rise information, computing an average missed detection ratio for the communication network using the collected preamble miss information, determining a target receiver power and a power ramp-up using the average nose rise and the average missed detection ratio.
- the at least a first processor is further configured to detect the RACH preambles by determining the normalized RACH detection threshold by performing the steps of, collecting preamble false alarm ratio information, computing an average false alarm rate for the communication network based on the preamble false alarm ratio information, and determining the normalized RACH detection threshold based on the average false alarm rate.
- the at least a first processor is further configured to, collect a contention ratio information, compute an average contention ratio for the communication network based on the collected contention ratio information, determine the opportunity period based on the average contention ratio.
- the at least a first processor is further configured to, repeat the steps of collecting noise rise information and preamble miss information, and repeating the steps of computing an overall average noise rise and an average missed detection ratio until the determined target receiver power and the power ramp-up remain constant, and the at least a first processor is further configured to, repeat the steps of collecting preamble false alarm ratio information and computing an average false alarm rate until the determined normalized RACH detection threshold remains constant, wherein the at least a first processor is further configured to detect the RACH preambles by determining an opportunity period, once the determined target receiver power, the power ramp-up, and the normalized RACH detection threshold remain constant, by performing the steps of, collecting a contention ratio information, computing an average contention ratio for the communication network based on the collected contention ratio information, determining the opportunity period based on the average contention ratio.
- the invention relates to a method and a network node as set forth in the claims. It will be understood that aspects of this disclosure following outside the scope of the claims may not be part of the invention but may be useful to understand the invention.
- Methods discussed below may be implemented by hardware, software, firmware, middleware, microcode, hardware description languages, or any combination thereof.
- the program code or code segments to perform the necessary tasks may be stored in a machine or computer readable medium such as a storage medium, such as a non-transitory storage medium.
- a processor(s) may perform the necessary tasks.
- Such existing hardware may include one or more Central Processing Units (CPUs), digital signal processors (DSPs), application-specific-integrated-circuits, field programmable gate arrays (FPGAs) computers or the like.
- CPUs Central Processing Units
- DSPs digital signal processors
- FPGAs field programmable gate arrays
- the software implemented aspects of the example aspects are typically encoded on some form of program storage medium or implemented over some type of transmission medium.
- the program storage medium may be any non-transitory storage medium such as magnetic (e.g., a floppy disk or a hard drive) or optical (e.g., a compact disk read only memory, or "CD ROM"), and may be read only or random access.
- the transmission medium may be twisted wire pairs, coaxial cable, optical fiber, or some other suitable transmission medium known to the art. The example aspects not limited by these aspects of any given implementation.
- the five objectives, listed above, may be quantified in terms of metrics, and these metrics are referred to as 'network metrics' throughout the remainder of this document.
- 'network metrics' Due to the multi-dimensionality of network problems associated with the simultaneous optimization of several parameters, and due to the dynamic nature of cellular networks (with varying traffic loads and changing interference patterns), automated and adaptive RACH parameter setting methods may assist proper network operations. More specifically, some or all of the following parameters may be optimized via the example aspect. Throughout the remainder of this document, these parameters are referred to as ⁇ RACH parameters.'
- example aspects provide an adaptive RACH parameter optimization solution that may be designed to handle performance constraints which are concurrently affected by the RACH parameters 1) through 4).
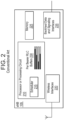
- FIG. 3 illustrates a wireless interface 220a that may be included in a reconfigured eNB 105a (see FIG. 4 ).
- the wireless interface 220a may include multiple antenna signal processing chains (101a through 101n). While multiple chains 101 may be included, for simplicity only a single chain 101a will be described here, for brevity sake.
- the interface 220a may include a receiver antenna 102a that receives data and information that is sent through the chain 101a.
- the chain 101a may include a cyclic prefix remover 103a, and a discrete Fourier transformation (DFT) 123a with length N_DFT.
- DFT discrete Fourier transformation
- the value of N_DFT may depend on a sampling rate of the system (for example, a system with 20 MHz bandwidth may include a value of N_DFT that is equal to 24576).
- the chain 101a may also include a subcarrier selector 107a, a symbol-by-symbol complex multiplier 109a and a zero-padder 111a that performs zero-padding (i.e., the padder 111a may insert a sequence of zeros at an end of the sequence symbols being processed, such that a total length of the signal may fit the IFFT with a length N_cor).
- An inverse fast Fourier transformation (IFFT) 113a may perform an inverse fast Fourier transformation (IFFT) with length N_cor.
- N_cor may be be greater than a length of the RACH preamble in symbols (i.e, 839). Typically, N_cor may be set to 1024.
- a symbol-by-symbol computator 115a may perform a symbol-by-symbol computation of the squared absolute value of each symbol.
- An adder 117 may perform a symbol-by-symbol addition of the symbols computed by each antenna signal processing chain 101.
- a signature detection block 119 may then perform signature detection based on the random variable Y (leaving the adder 117). That is to say, the signature detection block 119 may search and classify the peaks in the correlation power profile represented by Y.
- a generator 131 may generate a prime-length Zadoff-Chu root sequence according to 3GPP Technical Specification 36.211, ⁇ Physical Channels and Modulation'.
- a discrete Fourier transformer 133 may perform a discrete Fourier transform (DFT) with length N_ZC on complex symbols generated by the sequencer 131. Typically, a length N_ZC may be equal to a value 839.
- a conjugator 135 may perform a symbol-by-symbol complex conjugation operation of the symbols leaving the discrete Fourier transformer 133.
- the signals 121 leaving the interface 220a may be signals corresponding to the signatures detected at the eNB 105a.
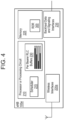
- FIG. 4 illustrates a reconfigured eNB 105a that includes the wireless interface 220a of FIG. 3 (described above).
- the eNB 105a includes a RACH Detection Routine (RDR) 300 that may include the algorithms and method step information that the processor 210 may run and/or perform in order to perform the methods illustrated in FIGS. 6 , 11A-11C , 18 , 21-22 , 24A-24C , and 25-26 (see the description below).
- the processor 210 also controls the function of the components of interface 220a shown in FIG. 3 .
- FIG. 5 illustrates a reconfigured network 10a that includes the reconfigured eNB 105a (shown in FIG. 4 ).
- N RX may be a number of receiver antennas at the eNB 105a and X k may be assumed to be a complex, zero-mean with variance ⁇ 2 .
- Equation 1 the distribution of the random variable represented by each Y j may be approximated by a chi-squared distribution with 2 N RX degrees of freedom.
- CDF cumulative distribution function
- T RACH a probability that all M metrics are below a normalized threshold value T RACH may be given by [ Q x 2 ,2NRX ( T RACK )] M . Therefore, the probability that one or more metrics are above T RACH may be defined as probability of false alarm P FA , as shown below.
- P FA 1 ⁇ Q x 2 , 2 N RX T RACH M
- T RACH may be determined numerically using Equations 2 and 3.
- Table 1 P FA 0.01 0.01 0.01 0.001 0.001 0.001 N RX 1 2 4 1 2 4 T RACH 13.63 8.24 5.28 15.93 9.46 5.94
- a normalized threshold T RACH generally needs to be scaled by a noise floor of the correlation power profile Y in order to provide an actual threshold value T RACH ′ to be used in the detection.
- a detection algorithm which is blind with respect to the noise floor, may be advantageous.
- Algorithm 1 that describes signature detection based on a forward consecutive mean excision (FCME) method.
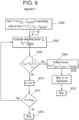
- FIG. 6 illustrates a random access channel (RACH) signature detection method, in accordance with an example aspect.
- the original metric space i.e., signature windows
- FIGS. 7-9 depict simulation results related to the performance of the method of FIG. 6 .
- FIG. 7 illustrates a probability of a missed detection for an overall network as a function of a target receive power that may be set for random access communications.
- FCME forward consecutive mean excision
- PRamp power ramp-ups
- FIG. 8 depicts a probability of a false alarm as a function of a target receive power level for a UE 110 transmitting a RACH preamble.
- the method of FIG. 6 has clear advantages over the conventional threshold scaling.
- FIG. 9 depicts an average number of trials as a function of a target receive power level for a UE 110 transmitting a RACH preamble. As shown in FIG. 9 , the FCME and threshold scaling show similar performance, although PRamp has some impact on a number of attempts for lower target receiver powers.
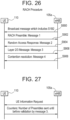
- the UE 110 may decode useful information related to cell access. Specifically, the System Information Block 2 (SIB2, in step S900 of FIG. 26 ) may broadcast to all UEs 110, and this broadcast may carry information related to RACH parameters, which may include a RACH initial target receive power P 0,RACH and a power ramp-up P ramp,RACH . Upon decoding of the RACH parameters, the UEs 110 may adjust a transmit power of the RACH preambles P RACH as shown below.
- P RACH k min P max , P 0 , RACH ⁇ P loss + k ⁇ 1 P ramp , RACH + ⁇ preamble ,
- P max may be a maximum power that can be transmitted by the UE 110
- P loss may be a path-loss that is to be compensated for (estimated using downlink reference signals)
- k may be a number of attempts associated with the preamble detection by the eNB 105a
- ⁇ preamble may be a power offset that may depend on a type of RACH preamble being transmitted.
- the power level defined by P 0,RACH and P ramp,RACH may directly reflect the network metrics A)-C).
- the metrics A)-C) may be periodically monitored such that a proper adjustment of P 0,RACH and P ramp,RACH may be made.
- P 0,RACH and P ramp,RACH may impact network interference levels in two ways.
- the Physical Random Access Channel which has a transmit power controlled by P 0,RACH and P ramp,RACH , and which transports the RACH preambles, may cause interference in data / control channels (PUSCH/PUCCH) of neighboring sectors.
- the eNB 105a may acknowledge (Message 2 in step S904 of FIG. 26 ). Then, the UE 110 may respond to the eNB 105a (Message 3 in step S906 of FIG. 26 ), which may usually be sent on the uplink data channel PUSCH, with power settings derived from a successfully detected Message 1.
- the portions of the PUSCH carrying Message 3 may cause interference in the data / control channels of neighboring sectors. The intensity of the Message 3 interference may then be a function of P 0,RACH and the accumulation of power ramp-ups P ramp,RACH .
- the eNB 105a measurements associated with a received interference power and a thermal noise power may be used, as shown below.
- I v , t msg1 p ⁇ u ⁇ v I u , v , t msg1 p
- Equation 5 describes an interference caused by the messages 1 (step S902 of FIG. 26 ) on the physical resource block p of sector v at time t .
- I ⁇ , t msg1 p may be a sum of the terms I u , ⁇ , t msg1 p (i.e., an interference due to the message 1 originating from sector u on the physical resource block P of sector v at time t .
- the interference caused by message 3 on the physical resource block p of sector v at time t is shown in Equation 6.
- I v , t msg3 p ⁇ u ⁇ v I u , v , t msg3 p
- a thermal noise on the physical resource block p of sector v at time t may be defined as N v , t ( p ).
- all quantities describe above may represent a linear average of the measurements in each diversity branch.
- a single parameter may be used to represent the network metric A).
- This parameter may be designated as a noise rise, R v, t ( p ), and may be defined as follows.
- R v , t p I v , t msg1 p + I v , t msg3 p + N v , t p N v , t p
- this variable relates to the physical resource block p of sector v at a time t .
- the component I u , ⁇ , t msg1 p or the component I u , ⁇ , t msg3 p from a particular originating sector u , or none of these components may be contributing to the noise floor R v,t ( p ).
- the contribution of each interference component may be dependent upon a relative alignment of the physical resource blocks across the multiple sectors of the network.
- the preamble miss ratio for the l-th trial in sector v at time t M v , t ( l ) may be quantified.
- M v , t ( l ) may be defined as follow.
- M v , t l 1 ⁇ D v , t l S v , t l
- D v,t ( l ) may be a number of preambles validated with messages 3 during an l-th trial in sector v at time t
- S v , t ( l ) may be a total number of preambles sent for the l-th attempt in sector v at time t .
- the preambles detected as a result of the contention resolution process may be excluded.
- the counters D v , t ( l ) and S v , t ( l ) may be obtained from the information received as a response to the UEInformationRequest message sent by the eNB's 105a to a UE (see FIG. 27 ).
- Equations 7 and 8 may be defined for a certain instant of time t .
- an averaging value of R v,t ( p ) and M v,t ( l ) over a period of time is useful. This is shown in the equations below.
- T may be defined as a sampling period during which measurements may be made.
- the RACH parameters P 0,RACH and P ramp,RACH may be obtained from the multi-objective optimization program described below.
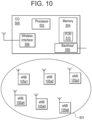
- FIG. 10 illustrates a centralized architecture involving a central office 500 (or, a central node) in communication with multiple eNBs (105a1-105a6, that are identical to eNB 105a of FIG. 4 ) in a geographic area 501.
- the central office 500 may include a processor 502, memory 504, a wireless interface 506 to communicate with each of the eNBs 105a, and a backhaul 508.
- a Power Optimization Routine (POR) 510 may be included in the memory.
- the processor 502 may cause the POR 510 to perform the method steps of the method flowchart shown in FIGS. 11A-11C , described below.
- the architecture may be used to control the RACH parameters (e.g., P 0,RACH and P ramp,RACH ).
- the measurements such as R v,t ( p ) and M v,t ( k ) may be collected within the individual sectors v serviced by each respective eNB105a. The measurements may then be sent via a network communication interface to the central office 500 to perform the optimization defined in Equation 11.
- the multi-objective optimization program defined by Equation 11 may be solved using numerical methods such as an evolutionary algorithm which may use the concept of Pareto optimality.
- each element in the objective vector in Equation 11 may be optimized individually, but in coordination with each other.
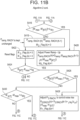
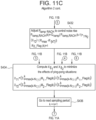
- a specific method of implementing this latter method is shown in FIGS. 11A-11C .
- a maximum tolerable value for the noise rise and preamble miss ratios (i.e., R max , M max,1 and M max , respectively) may be set in agreement with each other because of an intertwined effect that variations in P 0,RACH and P ramp,RACH may cause.
- the scaling constants, ⁇ P and ⁇ R , and the scaling functions, ⁇ N 1 and ⁇ N 2 may be selected such that a speed of convergence and oscillations on network metrics may be kept in balance.
- the scaling functions ⁇ N 1 and ⁇ N 2 may be designed to avoid "ping-pong" situations due to power updates driven by missed detection ratios and interference levels.
- the general shape for functions ⁇ N 1 and ⁇ N 2 are shown in FIG.
- ⁇ M 1 , ⁇ M 2 and ⁇ R may also be configured to provide additional stability to the network metrics by avoiding unnecessary changes in RACH parameters.
- a function Q ⁇ which may be based on simulations, may be responsible for the mapping of continuous values into the discrete P ramp,RACH values supported by the network.
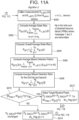
- FIG. 11A depicts a flowchart of method steps involved in determining RACH power parameters using a centralized architecture (such as the architecture of FIG. 10 ), using the algorithm 2 approach.
- step S410 the processor 502 may determine if the relationship if
- step S410 If in step S410 the relationship
- step S416 the processor 502 may determine if the relationship
- step S430 the processor then determines whether the relationship M [ kT ] - M max ⁇ ⁇ M 2 holds true (where an affirmative response causes the processor 502 to perform the step of S432, and a negative response causes the processor 502 to perform the step of S434). If the processor 502 returns a negative response to the inquiry of step S424, then the processor 502 next performs the step of S434.
- FIGS. 13-16 illustrates simulation results associated with determining power levels using the centralized architecture of FIG. 10 .
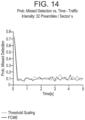
- FIGS. 13-16 show an impact of a control algorithm for the RACH target receive power, P 0,RACH , on the network metrics that are investigated.
- the simulation consists of a two-ring, 120-degree-sectored cellular network (i.e., 57 sectors) with wraparound, down-tilt, path-loss, shadow fading and uniform user distribution over the geographical area.
- the random accesses are assumed to be Poisson distributed with an intensity of 32 preambles/sector/second.
- FIG. 13 depicts an evolution of P 0,RACH over a period of time, where the FCME method is shown to perform better than conventional threshold scaling.
- FIG. 15 depicts an evolution of the probability of a false alarm over a period of time. In this drawing, the FCME method provides advantages over a conventional threshold scaling method.
- FIG. 16 depicts an evolution of an average number of trials over time.
- T RACH may have a direct effect on network metrics C) and D) (i.e., minimization and delays and reduction of network signaling), respectively.
- the network metric C) may be measured in the eNBs 105a by computing a preamble miss ratio as defined in Equations 8 and 10.
- a new quantity called a 'preamble false alarm ratio' may be defined.
- preamble false alarm ratio F v , t 1 ⁇ N ⁇ , t msg 3 N ⁇ , t msg 2 ,
- N ⁇ , t msg3 is a number of messages 3 (see FIG. 26 ) received in sector v at time t and N ⁇ , t msg2 is a number of messages 2 (see FIG. 26 ) sent by sector v at time t .
- a time averaged F v , t may also be more convenient, and this value may be defined as shown below.
- T RACH may also be defined by an optimization program similar to Equation 11. Equation 14 (below) offers such an optimization. arg max T RACH ⁇ F kT subject to : F ⁇ , kT ⁇ F max , ⁇ ⁇ , t ,
- F max may be a maximum tolerable false alarm rate
- N sector may be the total number of sectors in the system that may be optimized.
- F max may be a maximum tolerable false alarm rate
- f ( ⁇ ) describes an average of the variable F v, [ kT ] throughout the sectors v .
- FIG. 10 depicts a system architecture depicted by FIG. 10 together with gradient based optimization methods.
- a central office CO 500
- POR 510 power optimization routine
- the slopes ⁇ FA for each N RX value are summarized in Table 2 (shown below). Table 2: N RX 1 2 4 ⁇ FA -2.31 -1.22 -0.66
- a new normalized threshold T ⁇ RACH from the current threshold T ⁇ RACH may be computed such that a target probability of false alarm P FA,target may be achieved from a current probability of false alarm P ⁇ FA .
- T ⁇ RACH ⁇ FA ⁇ log 10 P FA ,target ⁇ log 10 P ⁇ FA + T ⁇ RACH
- step S504 the processor 502 may determine whether the relationship
- an optimization of network metric E may be achieved.
- a measurement may be provided by the eNBs 105a that indicates a suitability of network metric E), where the measurement may be a 'contention ratio.
- D v , t may be an overall number of preambles detected in sector v at time t
- a v , t may be a total number of UEs 110 that were granted access to the network without the need for the ⁇ contention resolution' procedure.
- T may be defined as a sampling period during which measurements may be collected.
- An optimization program may be defined to find a optimum value for ⁇ RACH , as shown below.
- C max may be a maximum tolerable contention ratio
- N sector may be a total number of sectors in the system that may be optimized
- f ( ⁇ ) may describe an average of the variable C v ,[ kT ] throughout the sectors v .
- Equation 18 Similar to the normalized threshold T RACH , a simpler means of solving the problem in Equation 18 may be implemented, where it is assumed that an exponential distribution with parameter ⁇ for inter-arrival time exists between each pair of consecutive RACH preamble transmissions.
- the number of RACH preamble transmissions, k in any given time span, ⁇ , may be distributed according to a Poisson distribution, as shown below.
- P k e ⁇ ⁇ ⁇ k k !
- a look-up table may be constructed that maps each pair ( ⁇ RACH, p col ), with p col greater than a maximum tolerable probability p max , to a new pair ( ⁇ RACH ′ , p col ′ ), where p col ′ ⁇ p max and ⁇ RACH ′ may be a largest possible RACH opportunity period.
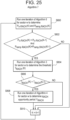
- FIG. 21 is a method flowchart providing a method for optimizing ⁇ RACH , where the look-up table ⁇ col may be constructed using the procedure indicated in FIG. 20 .
- step S604 the processor 502 may then determine is the relationship
- FIG. 22 is a flowchart depicting a method of comprehensively optimizing multiple RACH parameters.
- FIG. 10 (a centralized hierarchy) pertain to a hierarchy reliant on a central office 500 that is able to collect measurements from eNBs 105a within a particular geographical area 501, where measurements are processed so that the eNBs 105a are updated with newly computed RACH parameters.
- a centralized solution assumes that (1) communication interfaces are available for carrying information between the central office 500 and the eNBs 105a, (2) the deployment is homogeneous (i.e., all eNBs 105a provide a same coverage characteristics), and (3) the traffic is homogeneous in the geographical area 501 being considered. In the case that these conditions are not met, a decentralized solution may perform better.
- FIG. 23 therefore depicts a decentralized hierarchy, where each eNB 105a has a same structure as shown in FIG. 4 , and interference measurements 901 are transmitted between neighboring eNBs 105a via wireless interface 235.
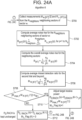
- 24A-24C provides a method implementing a decentralized solution for the optimization of P 0,RACH and P ramp,RACH , where any of the processors 210 of the eNB 105a1-105a5 may perform the method steps (and, each of eNB 105a1-105a5 are identical to the eNB 105a of FIG. 4 ).
- the processor 210 may then compute an average noise rise for the N neighbors neighboring sectors of sector w .
- a counter p may correspond to physical resource blocks where Messages 1 and/or 3 ( FIG.
- the processor 210 may determine if
- the processor may determine adjust a power ramp P ramp,RACH ( k ) by determining in step S714 whether
- FIG. 25 is a flowchart depicting a method of comprehensively optimizing RACH parameters in a decentralized hierarchy (as shown in FIG. 23 ).
- any of the processors 210 of the eNB 105a1-105a5 may perform these method steps.
- step S808 the processor 210 ends the method (in step S810).
Landscapes
- Engineering & Computer Science (AREA)
- Computer Networks & Wireless Communication (AREA)
- Signal Processing (AREA)
- Mobile Radio Communication Systems (AREA)
Description
- Example aspects relate generally to a system and method for controlling network traffic using improved preamble detection and an automation of determined random access channel parameters.
-
FIG. 1 illustrates a conventional 3rd Generation Partnership Project Long-Term Evolution (3GPP LTE)network 10. Thenetwork 10 includes an Internet Protocol (IP) Connectivity Access Network (IP-CAN) 100 and an IP Packet Data Network (IP-PDN) 1001. The IP-CAN 100 generally includes: a serving gateway (SGW) 101; a packet data network (PDN) gateway (PGW) 103; a policy and charging rules function (PCRF) 106; a mobility management entity (MME) 108 and E-UTRAN Node B (eNB) 105 (i.e., base station, for the purposes herein the terms base station and eNB may be used interchangeably). Although not shown, the IP-PDN 1001 portion of the EPS may include application or proxy servers, media servers, email servers, etc. - Within the IP-CAN 100, the eNB 105 is part of what is referred to as an Evolved Universal Mobile Telecommunications System (UMTS) Terrestrial Radio Access Network (EUTRAN), and the portion of the IP-CAN 100 including the SGW 101, the PGW 103, the PCRF 106, and the MME 108 is referred to as an Evolved Packet Core (EPC). Although only a
single eNB 105 is shown inFIG. 1 , it should be understood that the EUTRAN may include any number of eNBs. Similarly, although only a single SGW, PGW and MME are shown inFIG. 1 , it should be understood that the EPC may include any number of these core network elements. - The eNB 105 provides wireless resources and radio coverage for one or more user equipments (UEs) 110. That is to say, any number of
UEs 110 may be connected (or attached) to the eNB 105. The eNB 105 is operatively coupled to the SGW 101 and the MME 108. - The SGW 101 routes and forwards user data packets, while also acting as the mobility anchor for the user plane during inter-eNB handovers of UEs. The SGW 101 also acts as the anchor for mobility between 3rd Generation Partnership Project Long-Term Evolution (3GPP LTE) and other 3GPP technologies. For
idle UEs 110, the SGW 101 terminates the downlink data path and triggers paging when downlink data arrives for UEs 110. - The PGW 103 provides connectivity between UE 110 and the external packet data networks (e.g., the IP-PDN) by being the point of entry/exit of traffic for the UE 110. As is known, a given UE 110 may have simultaneous connectivity with more than one PGW 103 for accessing multiple PDNs.
- The PGW 103 also performs policy enforcement, packet filtering for UEs 110, charging support, lawful interception and packet screening, each of which are well-known functions. The PGW 103 also acts as the anchor for mobility between 3GPP and non-3GPP technologies, such as Worldwide Interoperability for Microwave Access (WiMAX) and 3rd Generation Partnership Project 2 (3GPP2 (code division multiple access (CDMA) 1X and Enhanced Voice Data Optimized (EvDO)).
- Still referring to
FIG. 1 , eNB 105 is also operatively coupled to theMME 108. The MME 108 is the control-node for the EUTRAN, and is responsible for idle mode UE 110 paging and tagging procedures including retransmissions. The MME 108 is also responsible for choosing a particular SGW for a UE during initial attachment of the UE to the network, and during intra-LTE handover involving Core Network (CN) node relocation. TheMME 108 authenticatesUEs 110 by interacting with a Home Subscriber Server (HSS), which is not shown inFIG. 1 . - Non Access Stratum (NAS) signaling terminates at the
MME 108, and is responsible for generation and allocation of temporary identities for UEs 110. The MME 108 also checks the authorization of a UE 110 to camp on a service provider's Public Land Mobile Network (PLMN), and enforces UE 110 roaming restrictions. TheMME 108 is the termination point in the network for ciphering/integrity protection for NAS signaling, and handles security key management. - The MME 108 also provides control plane functionality for mobility between LTE and 2G/3G access networks with an interface from the SGSN (not shown) terminating at the
MME 108. - The Policy and Charging Rules Function (PCRF) 106 is the entity that may access subscriber databases, make policy decisions and set charging rules for the subscriber.
-
FIG. 2 illustrates a conventional E-UTRAN Node B (eNB) 105. The eNB 105 includes: amemory 225; aprocessor 210; ascheduler 215;wireless communication interfaces 220; radio link control (RLC)buffers 230 for each bearer; and abackhaul interface 235. Theprocessor 210 may also be referred to as a core network entity processing circuit, an EPC entity processing circuit, etc. Theprocessor 210 may consist of one or more core processing units, either physically coupled together or distributed. Theprocessor 210 controls the function of eNB 105 (as described herein), and is operatively coupled to thememory 225 and thecommunication interfaces 220. While only oneprocessor 210 is shown inFIG. 2 , it should be understood that multiple processors may be included in a typical eNB 105. The functions performed by the processor may be implemented using hardware. Such hardware may include one or more Central Processing Units (CPUs), digital signal processors (DSPs), application-specific-integrated-circuits, field programmable gate arrays (FPGAs) computers or the like. The term processor, used throughout this document, may refer to any of these example implementations, though the term is not limited to these examples. With a Virtual Radio Access Network (VRAN) architecture various functions eNB components may be distributed across multiple processing circuits and multiple physical nodes within VRAN cloud. - The eNB 105 may include one or more cells or sectors serving UEs 110 within individual geometric coverage sector areas. Each cell individually may contain elements depicted in
Figure 2 . Throughout this document the terms eNB, cell or sector shall be used interchangeably. - Still referring to
FIG. 2 , thewireless communication interfaces 220 include various interfaces including one or more transmitters/receivers connected to one or more antennas to transmit/receive wirelessly control and data signals to/fromUEs 110.Backhaul interface 235 is the portion of eNB 105 that interfaces with SGW 101, MME 108, other eNBs, or interface to other EPC network elements and/or RAN elements within IP-CAN 100. Thescheduler 215 schedules control and data communications that are to be transmitted and received by the eNB 105 to and from UEs 110. Thememory 225 may buffer and store data that is being processed at eNB 105, transmitted and received to and from eNB 105. -
Scheduler 215 may make physical resource block (PRB) allocation decisions based upon a Quality of Service (QoS) Class Identifier (QCI), which represents traffic priority hierarchy. There are nine QCI classes currently defined in LTE, with 1 representing highest priority and 9 representing the lowest priority.QCIs 1 to 4 are reserved for Guaranteed Bitrate (GBR) classes for which the scheduler maintains certain specific data flow QoS characteristics. QCIs 5 to 9 are reserved for various categories of Best Effort traffic. - A random access channel (RACH) enables user equipments (UEs) 110 to perform tasks such as initially accessing the
communication network 10, uplink synchronization, handovers between cells, and recovery from failed links. Therefore, an achievement of an optimal random access performance through an efficient RACH signature detection algorithm, and use of a correct configuration of the RACH parameters, is crucial to optimizing performance of the communication network. - Conventional random access channel (RACH) preamble detectors, which takes place in the
wireless interface 220 of an eNB 105, relies on an estimation of a noise floor in order to set a preamble detection threshold. Because of the non-stationary nature of signals involved in RACH preamble detection due to random RACH transmissions, unpredictable scheduling decisions and non-Gaussian interference, sufficiently accurate estimation of the noise floor may be an unachievable task and this may lead to an underperforming cellular system. - Conventional solutions for configuring RACH parameters generally consist of static parameter settings based on engineering best practices. That is to say, these static parameter settings may be performed via link-budget, traffic engineering calculations and/or field performance measurements. However, a static parameter configuration solution may experience several shortcomings. First, static parameter configurations may not have the ability to overcome possible mismatches between the calculations used to set the parameters and the realities of a real-world deployment. Second, static configurations may not adapt to changing conditions in a cellular network, especially with regard to interference and traffic intensity. Third, static configurations may not autonomously tune the RACH parameters to reflect changes in the network architecture over time, such as cell splitting and the insertion of small cells.
- Conventional solutions do not efficiently avoid interference of communication channels, optimize RACH coverage, minimize delays related to call setup and handover, reduce network signaling overhead, and obtain an optimal resource allocation balance between random access and other network communication needs. Additionally, high operational expenditures are often experienced in order to maintain communication networks when the RACH parameters are statically configured because frequent human intervention is generally required.
- DE FIGUEIREDO FELIPE A P ET AL: "A modified CA-CFAR method for LTE random access detection" proposes a modified CA-CFAR method to detect CAZA sequences that are sent by UEs.
- JLTNTTI ET AL: "CFAR strategies for channelized radiometer" analyses the performance of CA, OS and iterative CFAR signal detection methods in the context of channelized radiometer.
- The invention is defined by the appended claims.
- At least one aspect relates to a method of preamble detection to control network traffic in a communication network, as claimed in
claim 1. - In one further aspect, the detecting of the RACH preambles further includes, collecting noise rise information and preamble miss information for a set of transmitted RACH preambles, computing an overall average noise rise for the communication network based on the collected noise rise information, computing an average missed detection ratio for the communication network using the collected preamble miss information, determining a target receiver power and a power ramp-up using the average nose rise and the average missed detection ratio.
- In one further aspect, the detecting of the RACH preambles further includes determining the normalized RACH detection threshold by performing the steps of, collecting preamble false alarm ratio information, computing an average false alarm rate for the communication network based on the preamble false alarm ratio information, and determining the normalized RACH detection threshold based on the average false alarm rate.
- In one further aspect, the method further includes collecting a contention ratio information, computing an average contention ratio for the communication network based on the collected contention ratio information, determining the opportunity period based on the average contention ratio.
- In one further aspect, the method includes repeating the steps of collecting noise rise information and preamble miss information, and repeating the steps of computing an overall average noise rise and an average missed detection ratio until the determined target receiver power and the power ramp-up remain constant; the method further includes repeating the steps of collecting preamble false alarm ratio information and computing an average false alarm rate until the determined normalized RACH detection threshold remains constant; and wherein the detecting of the RACH preambles further includes determining an opportunity period, once the determined target receiver power, the power ramp-up, and the normalized RACH detection threshold remain constant, by performing the steps of, collecting a contention ratio information, computing an average contention ratio for the communication network based on the collected contention ratio information, determining the opportunity period based on the average contention ratio.
- At least another aspect relates to at least a first network node in a communication network as claimed in
claim 6. - In one further aspect, the at least a first processor is further configured to detect the RACH preambles by, collecting noise rise information and preamble miss information for a set of transmitted RACH preambles, computing an overall average noise rise for the communication network based on the collected noise rise information, computing an average missed detection ratio for the communication network using the collected preamble miss information, determining a target receiver power and a power ramp-up using the average nose rise and the average missed detection ratio.
- In one further aspect, the at least a first processor is further configured to detect the RACH preambles by determining the normalized RACH detection threshold by performing the steps of, collecting preamble false alarm ratio information, computing an average false alarm rate for the communication network based on the preamble false alarm ratio information, and determining the normalized RACH detection threshold based on the average false alarm rate.
- In one further aspect, the at least a first processor is further configured to, collect a contention ratio information, compute an average contention ratio for the communication network based on the collected contention ratio information, determine the opportunity period based on the average contention ratio.
- In one further aspect, the at least a first processor is further configured to, repeat the steps of collecting noise rise information and preamble miss information, and repeating the steps of computing an overall average noise rise and an average missed detection ratio until the determined target receiver power and the power ramp-up remain constant, and the at least a first processor is further configured to, repeat the steps of collecting preamble false alarm ratio information and computing an average false alarm rate until the determined normalized RACH detection threshold remains constant, wherein the at least a first processor is further configured to detect the RACH preambles by determining an opportunity period, once the determined target receiver power, the power ramp-up, and the normalized RACH detection threshold remain constant, by performing the steps of, collecting a contention ratio information, computing an average contention ratio for the communication network based on the collected contention ratio information, determining the opportunity period based on the average contention ratio.
- The invention relates to a method and a network node as set forth in the claims. It will be understood that aspects of this disclosure following outside the scope of the claims may not be part of the invention but may be useful to understand the invention.
- The above and other features and advantages of example aspects will become more apparent by describing in detail, example aspects with reference to the attached drawings. The accompanying drawings are intended to depict example aspects and should not be interpreted to limit the intended scope of the claims. The accompanying drawings are not to be considered as drawn to scale unless explicitly noted.
-
FIG. 1 illustrates a conventional 3rd Generation Partnership Project Long-Term Evolution (3GPP LTE) network; -
FIG. 2 illustrates a conventional E-UTRAN Node B (eNB); -
FIG. 3 illustrates a wireless interface within a reconfigured eNB, in accordance with an example aspect; -
FIG. 4 illustrates a reconfigured eNB, in accordance with an example aspect; -
FIG. 5 illustrates a reconfigured 3GPP LTE network, in accordance with an example aspect; -
FIG. 6 illustrates a random access channel (RACH) signature detection method, in accordance with an example aspect; -
FIG. 7 illustrates a probability of a missed detection using the RACH signature detection, in accordance with an example aspect; -
FIG. 8 illustrates a probability of a false alarm detection using the RACH signature detection, in accordance with an example aspect; -
FIG. 9 illustrates an average number of trials using the RACH signature detection, in accordance with an example aspect; -
FIG. 10 illustrates a centralized LTE architecture, in accordance with an example aspect; -
FIG. 11A illustrates a method optimizing power, in accordance with an example aspect; -
FIG. 11B illustrates a method optimizing power, in accordance with an example aspect; -
FIG. 11C illustrates a method optimizing power, in accordance with an example aspect; -
FIG. 12 illustrates a scaling function used in the method of optimizing power, in accordance with an example aspect; -
FIG. 13 illustrates an evolution of the PRACH target receiver power using the method of optimizing power, in accordance with an example aspect; -
FIG. 14 illustrates an evolution of the probability of missed detection using the method of optimizing power, in accordance with an example aspect; -
FIG. 15 illustrates an evolution of the probability of a false alarm using the method of optimizing power, in accordance with an example aspect; -
FIG. 16 illustrates an evolution of the average number of trials using the method of optimizing power, in accordance with an example aspect; -
FIG. 17 illustrates a relationship between the normalized threshold and the logarithm probability of a false alarm, in accordance with an example aspect; -
FIG. 18 illustrates a method for optimizing a threshold value, in accordance with an example aspect; -
FIG. 19 illustrates a relationship between RACH intensity and RACH opportunity period, in accordance with an example aspect; -
FIG. 20 illustrates relationships between RACH preamble collision probabilities and RACH intensities for different RACH opportunity periods τ RACH, in accordance with an example aspect; -
FIG. 21 illustrates a method of optimizing a periodicity, in accordance with an example aspect; -
FIG. 22 illustrates a comprehensive RACH parameter optimization, in accordance with an example aspect; -
FIG. 23 illustrates a decentralized LTE architecture, in accordance with an example aspect; -
FIG. 24A illustrates a decentralized optimization of power, in accordance with an example aspect; -
FIG. 24B illustrates a decentralized optimization of power, in accordance with an example aspect; -
FIG. 24C illustrates a decentralized optimization of power, in accordance with an example aspect; -
FIG. 25 illustrates a decentralized comprehensive RACH parameter optimization, in accordance with an example aspect; -
FIG. 26 illustrates a communication diagram with exchange of messages between a user equipment and an eNB for the RACH procedure, in accordance with an example aspect not covered by the claims; and -
FIG. 27 illustrates another communication diagram with exchange of messages between a user equipment and an eNB for the RACH procedure, in accordance with an example aspect not covered by the claims. - While example aspects are capable of various modifications and alternative forms, aspects thereof are shown by way of example in the drawings and will herein be described in detail. It should be understood, however, that there is no intent to limit example aspects to the particular forms disclosed, but on the contrary, example aspects are to cover all modifications, equivalents, and alternatives falling within the scope of the claims. Like numbers refer to like elements throughout the description of the figures.
- Before discussing example aspects in more detail, it is noted that some example aspects are described as processes or methods depicted as flowcharts. Although the flowcharts describe the operations as sequential processes, many of the operations may be performed in parallel, concurrently or simultaneously. In addition, the order of operations may be rearranged. The processes may be terminated when their operations are completed, but may also have additional steps not included in the figure. The processes may correspond to methods, functions, procedures, subroutines, subprograms, etc.
- Methods discussed below, some of which are illustrated by the flow charts, may be implemented by hardware, software, firmware, middleware, microcode, hardware description languages, or any combination thereof. When implemented in software, firmware, middleware or microcode, the program code or code segments to perform the necessary tasks may be stored in a machine or computer readable medium such as a storage medium, such as a non-transitory storage medium. A processor(s) may perform the necessary tasks.
- Specific structural and functional details disclosed herein are merely representative for purposes of describing example aspects. This disclosure may, however, be embodied in many alternate forms and should not be construed as limited to only the aspects set forth herein.
- It will be understood that, although the terms first, second, etc. may be used herein to describe various elements, these elements should not be limited by these terms. These terms are only used to distinguish one element from another. For example, a first element could be termed a second element, and, similarly, a second element could be termed a first element, without departing from the scope of example aspects. As used herein, the term "and/or" includes any and all combinations of one or more of the associated listed items.
- It will be understood that when an element is referred to as being "connected" or "coupled" to another element, it can be directly connected or coupled to the other element or intervening elements may be present. In contrast, when an element is referred to as being "directly connected" or "directly coupled" to another element, there are no intervening elements present. Other words used to describe the relationship between elements should be interpreted in a like fashion (e.g., "between" versus "directly between," "adjacent" versus "directly adjacent," etc.).
- The terminology used herein is for the purpose of describing particular aspects only and is not intended to be limiting of example aspects. As used herein, the singular forms "a," "an" and "the" are intended to include the plural forms as well, unless the context clearly indicates otherwise. It will be further understood that the terms "comprises," "comprising," "includes" and/or "including," when used herein, specify the presence of stated features, integers, steps, operations, elements and/or components, but do not preclude the presence or addition of one or more other features, integers, steps, operations, elements, components and/or groups thereof.
- It should also be noted that in some alternative implementations, the functions/acts noted may occur out of the order noted in the figures. For example, two figures shown in succession may in fact be executed concurrently or may sometimes be executed in the reverse order, depending upon the functionality/acts involved.
- Unless otherwise defined, all terms (including technical and scientific terms) used herein have the same meaning as commonly understood by one of ordinary skill in the art to which example aspects belong. It will be further understood that terms, e.g., those defined in commonly used dictionaries, should be interpreted as having a meaning that is consistent with their meaning in the context of the relevant art and will not be interpreted in an idealized or overly formal sense unless expressly so defined herein.
- Portions of the example aspects and corresponding detailed description are presented in terms of software, or algorithms and symbolic representations of operation on data bits within a computer memory. These descriptions and representations are the ones by which those of ordinary skill in the art effectively convey the substance of their work to others of ordinary skill in the art. An algorithm, as the term is used here, and as it is used generally, is conceived to be a self-consistent sequence of steps leading to a desired result. The steps are those requiring physical manipulations of physical quantities. Usually, though not necessarily, these quantities take the form of optical, electrical, or magnetic signals capable of being stored, transferred, combined, compared, and otherwise manipulated. It has proven convenient at times, principally for reasons of common usage, to refer to these signals as bits, values, elements, symbols, characters, terms, numbers, or the like.
- In the following description, illustrative aspects will be described with reference to acts and symbolic representations of operations (e.g., in the form of flowcharts) that may be implemented as program modules or functional processes include routines, programs, objects, components, data structures, etc., that perform particular tasks or implement particular abstract data types and may be implemented using existing hardware at existing network elements. Such existing hardware may include one or more Central Processing Units (CPUs), digital signal processors (DSPs), application-specific-integrated-circuits, field programmable gate arrays (FPGAs) computers or the like.
- It should be borne in mind, however, that all of these and similar terms are to be associated with the appropriate physical quantities and are merely convenient labels applied to these quantities. Unless specifically stated otherwise, or as is apparent from the discussion, terms such as "processing" or "computing" or "calculating" or "determining" of "displaying" or the like, refer to the action and processes of a computer system, or similar electronic computing device, that manipulates and transforms data represented as physical, electronic quantities within the computer system's registers and memories into other data similarly represented as physical quantities within the computer system memories or registers or other such information storage, transmission or display devices.
- Note also that the software implemented aspects of the example aspects are typically encoded on some form of program storage medium or implemented over some type of transmission medium. The program storage medium may be any non-transitory storage medium such as magnetic (e.g., a floppy disk or a hard drive) or optical (e.g., a compact disk read only memory, or "CD ROM"), and may be read only or random access. Similarly, the transmission medium may be twisted wire pairs, coaxial cable, optical fiber, or some other suitable transmission medium known to the art. The example aspects not limited by these aspects of any given implementation.
- The achievement of optimal random access performance through efficient RACH signature detection algorithms and the correct configuration of the RACH parameters, which may be adapted to diverse situations encountered in practical deployment of cellular networks, may meet at least the following five objectives.
- A) Avoidance of excessive interference on communication channels;
- B) Achievement of an intended RACH coverage;
- C) Minimization of delays related to call setup, handovers, etc.;
- D) Reduction of network signaling overhead related to identification assignments, resource grants, etc.; and
- E) Obtainment of a proper resource allocation balance between random access and other communication needs.
- The five objectives, listed above, may be quantified in terms of metrics, and these metrics are referred to as 'network metrics' throughout the remainder of this document. Due to the multi-dimensionality of network problems associated with the simultaneous optimization of several parameters, and due to the dynamic nature of cellular networks (with varying traffic loads and changing interference patterns), automated and adaptive RACH parameter setting methods may assist proper network operations. More specifically, some or all of the following parameters may be optimized via the example aspect. Throughout the remainder of this document, these parameters are referred to as `RACH parameters.'
- 1) RACH initial target receive power P 0,RACH;
- 2) RACH transmit power ramp-up P ramp,RACH;
- 3) Normalized RACH preamble detection threshold T RACH;
- 4) RACH resource allocation period τ RACH.
- Within the context of the example aspects, the optimization of RACH parameters 1) and 2) may directly affect objectives A), B), C); the optimization of RACH parameter 3) may directly affect objectives C) and D); and the optimization of RACH parameter 4) may directly affect objectives A), C) and E). For this reason, example aspects provide an adaptive RACH parameter optimization solution that may be designed to handle performance constraints which are concurrently affected by the RACH parameters 1) through 4).
-
FIG. 3 illustrates awireless interface 220a that may be included in a reconfiguredeNB 105a (seeFIG. 4 ). Thewireless interface 220a may include multiple antenna signal processing chains (101a through 101n). Whilemultiple chains 101 may be included, for simplicity only asingle chain 101a will be described here, for brevity sake. As shown inFIG. 3 , theinterface 220a may include areceiver antenna 102a that receives data and information that is sent through thechain 101a. Thechain 101a may include acyclic prefix remover 103a, and a discrete Fourier transformation (DFT) 123a with length N_DFT. The value of N_DFT may depend on a sampling rate of the system (for example, a system with 20 MHz bandwidth may include a value of N_DFT that is equal to 24576). Thechain 101a may also include asubcarrier selector 107a, a symbol-by-symbol complex multiplier 109a and a zero-padder 111a that performs zero-padding (i.e., the padder 111a may insert a sequence of zeros at an end of the sequence symbols being processed, such that a total length of the signal may fit the IFFT with a length N_cor). An inverse fast Fourier transformation (IFFT) 113a may perform an inverse fast Fourier transformation (IFFT) with length N_cor. The value N_cor may be be greater than a length of the RACH preamble in symbols (i.e, 839). Typically, N_cor may be set to 1024. A symbol-by-symbol computator 115a may perform a symbol-by-symbol computation of the squared absolute value of each symbol. Anadder 117 may perform a symbol-by-symbol addition of the symbols computed by each antennasignal processing chain 101. Asignature detection block 119 may then perform signature detection based on the random variable Y (leaving the adder 117). That is to say, thesignature detection block 119 may search and classify the peaks in the correlation power profile represented by Y. Agenerator 131 may generate a prime-length Zadoff-Chu root sequence according to 3GPP Technical Specification 36.211, `Physical Channels and Modulation'. Adiscrete Fourier transformer 133 may perform a discrete Fourier transform (DFT) with length N_ZC on complex symbols generated by thesequencer 131. Typically, a length N_ZC may be equal to a value 839. Aconjugator 135 may perform a symbol-by-symbol complex conjugation operation of the symbols leaving thediscrete Fourier transformer 133. Thesignals 121 leaving theinterface 220a may be signals corresponding to the signatures detected at theeNB 105a. -
FIG. 4 illustrates a reconfiguredeNB 105a that includes thewireless interface 220a ofFIG. 3 (described above). TheeNB 105a includes a RACH Detection Routine (RDR) 300 that may include the algorithms and method step information that theprocessor 210 may run and/or perform in order to perform the methods illustrated inFIGS. 6 ,11A-11C ,18 ,21-22 ,24A-24C , and25-26 (see the description below). Theprocessor 210 also controls the function of the components ofinterface 220a shown inFIG. 3 . -
FIG. 5 illustrates a reconfigurednetwork 10a that includes the reconfiguredeNB 105a (shown inFIG. 4 ). - Relevant to the characterization of the RACH signature detection algorithm is a random variable Y (transmitted from
adder 117 ofFIG. 3 ), which may be a vector of length N cor, i.e., Y = (Y 1, Y2, ··· , Y Ncor ), described as follows.
- Where N RX may be a number of receiver antennas at the
eNB 105a and Xk may be assumed to be a complex, zero-mean with variance σ 2. - Using
Equation 1, the distribution of the random variable represented by each Yj may be approximated by a chi-squared distribution with 2N RX degrees of freedom. After normalization (by making σ 2 = 1), the cumulative distribution function (CDF) may be written as shown below.
- Assuming that M is a number of metrics to be searched in the correlation power profile represented by Y, a probability that all M metrics are below a normalized threshold value T RACH may be given by [Qx 2 ,2NRX (T RACK)] M . Therefore, the probability that one or more metrics are above T RACH may be defined as probability of false alarm P FA, as shown below.

- By setting P FA to a particular value, T RACH may be determined numerically using
Equations Table 1: PFA 0.01 0.01 0.01 0.001 0.001 0.001 N RX1 2 4 1 2 4 TRACH 13.63 8.24 5.28 15.93 9.46 5.94 - In a conventional implementation of a signature detection procedure, a normalized threshold T RACH generally needs to be scaled by a noise floor of the correlation power profile Y in order to provide an actual threshold value


cor ), a normalized RACH detection threshold (T RACH), and an initial size of a set that does not contain outliers (I). -
FIG. 6 illustrates a random access channel (RACH) signature detection method, in accordance with an example aspect. As shown in step S300, theprocessor 210 may cause thesignature detection block 119 to sort the power profile values Yj in ascending order, i.e.,

processor 210 may then compute a weighting factor Tk to be used with thevalues 
- In step S304, the
processor 210 may determine if
processor 210 may determine outliers

processor 210 may then remap elements ofto the original metric space (i.e., signature windows), whereupon the procedure may stop at step S310.
- If in step S304 the
processor 210 determines that the relationship
processor 210 may increment k (k=k+1) in step S312, whereupon the processor may determine if k is less than or equal to Ncor (in step S314), and if k is less than or equal to Ncor then the processor repeats step S302 (otherwise the procedure ends at step S316). -
FIGS. 7-9 depict simulation results related to the performance of the method ofFIG. 6 . Specifically,FIG. 7 illustrates a probability of a missed detection for an overall network as a function of a target receive power that may be set for random access communications. As shown in this figured, forward consecutive mean excision (FCME) method ofFIG. 6 , and the threshold scaling (i.e., conventional method) show approximately a same performance with power ramp-ups (PRamp) having some minor impact only for lower target receive powers.FIG. 8 depicts a probability of a false alarm as a function of a target receive power level for aUE 110 transmitting a RACH preamble. As shown inFIG. 8 , the method ofFIG. 6 has clear advantages over the conventional threshold scaling.FIG. 9 depicts an average number of trials as a function of a target receive power level for aUE 110 transmitting a RACH preamble. As shown inFIG. 9 , the FCME and threshold scaling show similar performance, although PRamp has some impact on a number of attempts for lower target receiver powers. - Following an initial cell synchronization process, the
UE 110 may decode useful information related to cell access. Specifically, the System Information Block 2 (SIB2, in step S900 ofFIG. 26 ) may broadcast to allUEs 110, and this broadcast may carry information related to RACH parameters, which may include a RACH initial target receive power P 0,RACH and a power ramp-up Pramp,RACH. Upon decoding of the RACH parameters, theUEs 110 may adjust a transmit power of the RACH preambles P RACH as shown below.
- Where P max may be a maximum power that can be transmitted by the
UE 110, P loss may be a path-loss that is to be compensated for (estimated using downlink reference signals), k may be a number of attempts associated with the preamble detection by theeNB 105a, and Δpreamble may be a power offset that may depend on a type of RACH preamble being transmitted. - As mentioned above, the power level defined by P 0,RACH and P ramp,RACH may directly reflect the network metrics A)-C). In this context, the metrics A)-C) may be periodically monitored such that a proper adjustment of P 0,RACH and P ramp,RACH may be made.
- In the case of network metric A), P 0,RACH and P ramp,RACH may impact network interference levels in two ways.
- First, the Physical Random Access Channel (PRACH), which has a transmit power controlled by P 0,RACH and P ramp,RACH, and which transports the RACH preambles, may cause interference in data / control channels (PUSCH/PUCCH) of neighboring sectors.
- Second, after the RACH preamble (
Message 1 in step S902 ofFIG. 26 ) from aparticular UE 110 is detected, theeNB 105a may acknowledge (Message 2 in step S904 ofFIG. 26 ). Then, theUE 110 may respond to theeNB 105a (Message 3 in step S906 ofFIG. 26 ), which may usually be sent on the uplink data channel PUSCH, with power settings derived from a successfully detectedMessage 1. The portions of thePUSCH carrying Message 3 may cause interference in the data / control channels of neighboring sectors. The intensity of theMessage 3 interference may then be a function of P 0,RACH and the accumulation of power ramp-ups P ramp,RACH. - In order to measure network metric A) such that P 0,RACH and P ramp,RACH may be controlled, the
eNB 105a measurements associated with a received interference power and a thermal noise power may be used, as shown below.
-
Equation 5 describes an interference caused by the messages 1 (step S902 ofFIG. 26 ) on the physical resource block p of sector v at time t. Note that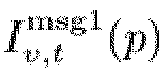

message 1 originating from sector u on the physical resource block P of sector v at time t. Similarly, the interference caused bymessage 3 on the physical resource block p of sector v at time t is shown inEquation 6.
- A thermal noise on the physical resource block p of sector v at time t may be defined as N v,t (p). In the case of receiver diversity, all quantities describe above may represent a linear average of the measurements in each diversity branch.
- Based on the quantities described above, a single parameter may be used to represent the network metric A). This parameter may be designated as a noise rise, R v,t(p), and may be defined as follows.

- Where this variable relates to the physical resource block p of sector v at a time t. Note that either the component


- In order to measure the network metrics B) and C), the preamble miss ratio for the l-th trial in sector v at time t, M v,t (l), may be quantified. M v,t (l) may be defined as follow.

- Where Dv,t (l) may be a number of preambles validated with
messages 3 during an l-th trial in sector v at time t, and S v,t (l) may be a total number of preambles sent for the l-th attempt in sector v at time t. In both counters D v,t (l) and Sv,t (l), the preambles detected as a result of the contention resolution process may be excluded. Furthermore, from an implementation perspective, the counters D v,t (l) and S v,t (l) may be obtained from the information received as a response to the UEInformationRequest message sent by the eNB's 105a to a UE (seeFIG. 27 ). - The values in
Equations 7 and 8may be defined for a certain instant of time t. However, for system optimization purposes, an averaging value of Rv,t (p) and Mv,t (l) over a period of time is useful. This is shown in the equations below.

- Where T may be defined as a sampling period during which measurements may be made.
- Using quantities described in
Equations 9 and 10, the RACH parameters P 0,RACH and P ramp,RACH may be obtained from the multi-objective optimization program described below.
- Where R [kT] = (R [kT](1), R [kT](2),···) with R [kT](p) = (R 1,[kT](p), R 2,[kT](p),··· , R N
sector ,[kT](p)), M [kT] = (M [kT](1),M [kT](2),···) with M [kT](l) = (M 1,[kT](l), M 2,[kT](l),··· , M Nsector ,[kT](l)), R max may be a maximum tolerable noise rise, M max(l) may be a maximum tolerable preamble miss ratio at the l-th trial, and N sector may be a total number of sectors in the system that may be optimized. Although more sophisticated cost functions may be considered, in the most simple case the functions f(·) and g(·) describe an average of these variables R v,[kT](p) and M v,[kT](l) throughout the sectors v. -
FIG. 10 illustrates a centralized architecture involving a central office 500 (or, a central node) in communication with multiple eNBs (105a1-105a6, that are identical toeNB 105a ofFIG. 4 ) in ageographic area 501. Thecentral office 500 may include aprocessor 502,memory 504, awireless interface 506 to communicate with each of theeNBs 105a, and abackhaul 508. A Power Optimization Routine (POR) 510 may be included in the memory. Theprocessor 502 may cause thePOR 510 to perform the method steps of the method flowchart shown inFIGS. 11A-11C , described below. - Referring to
FIG. 10 , the architecture may be used to control the RACH parameters (e.g., P 0,RACH and P ramp,RACH). To this end, the measurements such as Rv,t (p) and Mv,t (k) may be collected within the individual sectors v serviced by each respective eNB105a. The measurements may then be sent via a network communication interface to thecentral office 500 to perform the optimization defined inEquation 11. - The multi-objective optimization program defined by Equation 11may be solved using numerical methods such as an evolutionary algorithm which may use the concept of Pareto optimality. Alternatively, each element in the objective vector in
Equation 11 may be optimized individually, but in coordination with each other. A specific method of implementing this latter method is shown inFIGS. 11A-11C . - In
algorithm 2, a maximum tolerable value for the noise rise and preamble miss ratios (i.e., R max, M max,1 and M max, respectively) may be set in agreement with each other because of an intertwined effect that variations in P 0,RACH and P ramp,RACH may cause. In this context, the scaling constants, γ P and γ R , and the scaling functions, γ N1 and γ N2 , may be selected such that a speed of convergence and oscillations on network metrics may be kept in balance. Note that the scaling functions γ N1 and γ N2 may be designed to avoid "ping-pong" situations due to power updates driven by missed detection ratios and interference levels. The general shape for functions γ N1 and γ N2 are shown inFIG. 12 . Moreover, the precision values ε M1 , ε M2 and ε R may also be configured to provide additional stability to the network metrics by avoiding unnecessary changes in RACH parameters. Finally, a function Q{·}, which may be based on simulations, may be responsible for the mapping of continuous values into the discrete P ramp,RACH values supported by the network. -
FIG. 11A depicts a flowchart of method steps involved in determining RACH power parameters using a centralized architecture (such as the architecture ofFIG. 10 ), using thealgorithm 2 approach. Specifically, in step S400, theprocessor 502 of theCO 500 may set k = 1 , and xγ1 = xγ2 = N γ, in order to collect measurements R v,[kT](p) and M v,[kT](l) from the N sector sectors in the centralized system (FIG. 10 ), where this information collection comes from a collection ofprocessors 210 of a number of base stations eNB (105a1-105a6, where each eNB may be identical toeNB 105a ofFIG. 4 ). In step S402, theprocessor 502 may compute an average noise rise for the network, where a counter p may correspond to a physical resource block whereMessages 1 and/or 3 (FIG. 26 ) may cause interference and Np may be a total number of such resource blocks, where p = 1 to Np within the relationship
- In step S404, the
processor 502 may compute an overall average noise rise for the network, as defined by
processor 502 may then Compute an average missed detection ratios for the network for l = 1 to Nl using the relationship
processor 502 may compute an average missed detection ratio for the second trial (and further trials)using
- In step S410, the
processor 502 may determine if the relationship if |M max,1 - M [kT](1)|> ε M1 holds true, and if so then in step S412 theprocessor 502 may adjust target receiver power based on P0,RACH(k) = P 0,RACH(k - 1) - γ P (M max,1 - M [kT](1)), where M1- Flag(k) = 1 - If in step S410 the relationship |M max,1 - M [kT](1)| > ε M
1 does not hold true, then in step S414 theprocessor 502 may adjust the target receive power by P 0,RACH(k) = P 0,RACH(k - 1) where M 1- Flag(k) = 0. - Following steps S412 or S414, in step S416 (
FIG. 11B ) theprocessor 502 may determine if the relationship |M max - M [kT]|> ε M2 holds true, and if so then in step S420 theprocessor 502 may adjust power ramp-up P ramp,RACH(k) by P ramp,RACH(k) = Q ramp {P ramp,RACH(k - 1) - γ R (M max - M [kT])}, where M 2- Flag(k) = 1. Otherwise, theprocessor 502 may adjust the power according to P ramp,RACH(k) = P ramp,RACH(k - 1), where M 2- Flag(k) = 0 in step S418. - Following steps S420 or S422, the
processor 502 may make adjustments in P 0,RACH(k) or P ramp,RACH(k) to control the noise rise by adjusting R 1- Flag(k) = 0 and R 2-Flag(k) = 0. - In step S424, the
processor 502 then determines whether the relationship R [kT] - R max > εR holds true, and if so theprocessor 502 then determines (in step S426) whether the relationship M [kT](1) - M max,1 < ε M1 also holds true, and if so theprocessor 502 then adjusts the receive power to control a noise increase using P 0,RACH(k) = P 0,RACH(k - 1) + γ N1 (x γ1)·(R max - R [kT]), where R 1- Flag(k) = 1 in step S428. Otherwise, if theprocessor 502 determines the determination of step S426 to be negative, then in step S430 the processor then determines whether the relationship M [kT] - M max < ε M2 holds true (where an affirmative response causes theprocessor 502 to perform the step of S432, and a negative response causes theprocessor 502 to perform the step of S434). If theprocessor 502 returns a negative response to the inquiry of step S424, then theprocessor 502 next performs the step of S434. - In step S432 (
FIG. 11c ), theprocessor 502 may adjust a receiver power to control a noise increase, by computing P ramp,RACH(k) = Q ramp {P ramp,RACH(k - 1) + γ N2 (xγ2)·(R max - R [kT])}, where R 2- Flag(k) = 1. Then in step S434, theprocessor 210 may compute an intensity of "ping-pong" situations for the last N γ sampling periods by determining

- In step S436, the
processor 502 may go to a next sampling period by incrementing k (k=k+1), and then returning to step S400 (FIG. 11A ). -
FIGS. 13-16 illustrates simulation results associated with determining power levels using the centralized architecture ofFIG. 10 . Specifically,FIGS. 13-16 show an impact of a control algorithm for the RACH target receive power, P 0,RACH, on the network metrics that are investigated. The simulation consists of a two-ring, 120-degree-sectored cellular network (i.e., 57 sectors) with wraparound, down-tilt, path-loss, shadow fading and uniform user distribution over the geographical area. The random accesses are assumed to be Poisson distributed with an intensity of 32 preambles/sector/second. The control algorithm for P 0,RACH consist in the implementation of step S412 with γ P = 20, M max,1 = 0.1 and T = 0.1 seconds. Note that other values γ P and M max,1 may be chosen to provide better system stability. -
FIG. 13 depicts an evolution of P 0,RACH over a period of time, where the FCME method is shown to perform better than conventional threshold scaling.FIG. 14 depicts an evolution of the probability of a missed detection over a period of time. In this case, convergence is achieved for both signature detection methods at M max,1 = 0.1.FIG. 15 depicts an evolution of the probability of a false alarm over a period of time. In this drawing, the FCME method provides advantages over a conventional threshold scaling method.FIG. 16 depicts an evolution of an average number of trials over time. - An optimization of T RACH may have a direct effect on network metrics C) and D) (i.e., minimization and delays and reduction of network signaling), respectively. As discussed above, the network metric C) may be measured in the
eNBs 105a by computing a preamble miss ratio as defined inEquations 
- Where

FIG. 26 ) received in sector v at time t and
FIG. 26 ) sent by sector v at time t. Similar to the other quantities defined above, a time averaged F v,t may also be more convenient, and this value may be defined as shown below.
- An optimization of T RACH may also be defined by an optimization program similar to
Equation 11. Equation 14 (below) offers such an optimization.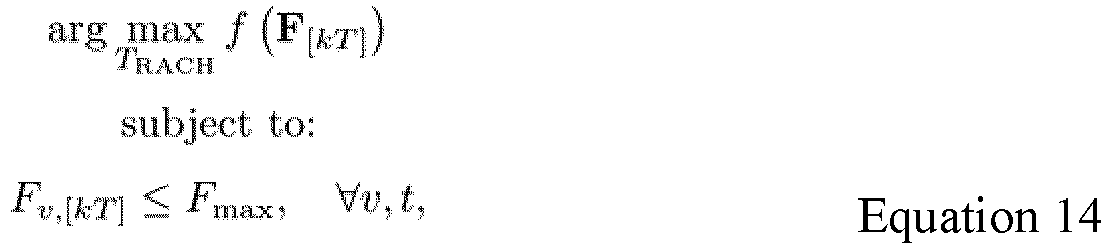
- Where F[kT] = (F1,[kT], F2,[kT],··· , F N
sector ,[kT]), F max may be a maximum tolerable false alarm rate, and N sector may be the total number of sectors in the system that may be optimized. Although more sophisticated cost functions may be considered, in the simplest case the function f(·) describes an average of the variable F v,[kT] throughout the sectors v. - In order to solve the problem defined by
Equation 14, the system architecture depicted byFIG. 10 may be employed together with gradient based optimization methods. In this architecture, a central office (CO 500) may perform the method steps described below by running a power optimization routine (POR 510) saved to memory that includes the algorithms to perform the method steps. Alternatively, the dependency between T RACH and P FA as given inEquation 3 may be used to provide a simpler method to find an optimum value for T RACH. In this context,FIG. 17 depicts a relationship between T RACH and log10(P FA) for M = 832 and N RX = {1, 2, 4}. Relationships between T RACH and log10(P FA) are approximately linear for a wide range of P FA values. The slopes αFA for each N RX value are summarized in Table 2 (shown below).Table 2: N RX1 2 4 αFA -2.31 -1.22 -0.66 - Thus, using the slopes provided in Table 2, a new normalized threshold T̃ RACH from the current threshold T̂ RACH may be computed such that a target probability of false alarm P FA,target may be achieved from a current probability of false alarm P̂ FA. To this end, the following equation may define these relationships.

- Optimization of the normalized RACH preamble detection threshold (described above) is reflected in the method shown in
FIG. 18 . As shown in step S500 ofFIG. 18 , theprocessor 502 ofCO 500 may set k=1, and then theprocessor 502 may collect measurements F v,[kT] from a number of base stations (eNB 105a1-105a6) fromgeographic area 501 for further processing. It is important to note that in eacheNB 105a of thearea 501, aprocessor 210 for therespective eNB 105 may compute the measurement F v,[kT] based onEquations 12 and 13, where this information may be stored inmemory 225 of theeNB 105a until theprocessor 500 requests this stored information. Then, in step S502, theprocessor 502 may compute an average false alarm rate for the network by determining
- In step S504, the
processor 502 may determine whether the relationship |F max - F [kT]| > ε FA holds true, and if so then in step S508 theprocessor 502 may update the threshold by T RACH(k) = αFA · [log10(F max - log10(F [kT])] + TRACH(k - 1). Otherwise, theprocessor 502 may determine that T RACH(k) = T RACH(k - 1) in step S506. Following steps S506 or S508, theprocessor 502 may increment k (k=k+1) in step S510, and return to step S500 to repeat thealgorithm 2 procedure. - By controlling the RACH opportunity period τ RACH (i.e., a frequency with which PRACH opportunity slots may be provided for random access communications), an optimization of network metric E) may be achieved. In this context, a measurement may be provided by the
eNBs 105a that indicates a suitability of network metric E), where the measurement may be a 'contention ratio.' The contention ratio, C v,t , for sector v at time t may be defined as follows.
- Where D v,t may be an overall number of preambles detected in sector v at time t, and A v,t may be a total number of
UEs 110 that were granted access to the network without the need for the `contention resolution' procedure. - Similar to the other network measurements defined above, system optimization purposes dictate the use of a time averaging of Cv,t, as shown in the equation below.

- Where T may be defined as a sampling period during which measurements may be collected.
- An optimization program may be defined to find a optimum value for τ RACH, as shown below.

- Where C[kT] = (C1,[kT], C 2,[kT],··· , C N
sector [kT]), C max may be a maximum tolerable contention ratio, N sector may be a total number of sectors in the system that may be optimized, and f(·) may describe an average of the variable C v,[kT] throughout the sectors v. - Similar to the normalized threshold T RACH, a simpler means of solving the problem in
Equation 18 may be implemented, where it is assumed that an exponential distribution with parameter λ for inter-arrival time exists between each pair of consecutive RACH preamble transmissions. The number of RACH preamble transmissions, k, in any given time span, τ, may be distributed according to a Poisson distribution, as shown below.
- From Equation 19, a collision probability, p col, as seen by a
particular UE 110 during a time span τ may be written as follows.
- Thus, for a particular p col and a time span τ, a supported intensity λ may be determined as follows.

- Because there are N preamble orthogonal preambles available in each sector, for a particular p col and a particular RACH opportunity period τ RACH, a supported RACH intensity λRACH may be determined as follows.

-
FIG. 19 depicts a supported RACH intensity as a function of a RACH opportunity period (for 64 preambles per sector), where RACH intensities λRACH varies with RACH opportunity periods τ RACH for N preamble = 64 and p col = {0.001, 0.01, 0.1}.FIG. 20 depicts collision probabilities p col as a function of RACH intensities λRACH for N preamble = 64 and τ RACH = {1, 2, 5, 10, 15, 20} ms. Based onFIG. 20 , a look-up table may be constructed that maps each pair (τ RACH, p col), with p col greater than a maximum tolerable probability p max, to a new pair (



FIG. 20 for λRACH = 200 preambles/sector/second. -
FIG. 21 is a method flowchart providing a method for optimizing τ RACH, where the look-up table Δcol may be constructed using the procedure indicated inFIG. 20 . In step S600, theprocessor 502 may cause k = 1, and then theprocessor 502 ofCO 500 may collect measurements C v,[kT] from theeNBs 105a ingeographic area 501 for further processing. Specifically, in eacheNB 105a, theprocessor 210 may compute
Equations 16 and 17, where this information may then be stored inmemory 225 until theprocessor 502 requests this information. Then, in step S602, theprocessor 502 may compute an average contention ratio for the network by calculating
- In step S604, the
processor 502 may then determine is the relationship |C max - C [kT]| > ε col holds true, and if so theprocessor 502 then may adjust the RACH opportunity period based on the look-up table, where τ RACH(k) = τ RACH(k - 1) + Δ col (τRACH(k - 1), C [kT]) in step S606. Otherwise, theprocessor 502 may determine that τ RACH(k) = τ RACH(k - 1), in step S608. Following steps S606 or S608, the processor may increment k (k=k+1), in step S610, and then return the process to step S600. - The prior example aspects (described above) considered an optimization of individual RACH parameters as stand-alone processes. However, in reality, there are interactions among the RACH parameters. For example, changing a normalized threshold T RACH may affect not only a preamble false alarm ratio but also a preamble miss ratio, which in turn may require a RACH target receive power P 0,RACH to be adjusted. Due to the dependencies between the RACH parameters,
FIG. 22 is a flowchart depicting a method of comprehensively optimizing multiple RACH parameters. - As depicted in
FIG. 22 , a method of comprehensive RACH optimization is provided. Specifically, in step S650 theprocessor 502 may set k=1, and then run an iteration of algorithm 2 (seeFIGS. 11A-11C ) to determine [P 0,RACH(k), P ramp,RACH(k)] = Algorithm-2 (P 0,RACH(k - 1), P ramp,RACH(k - 1),R max,M max,1,M max,γ P ,γ R ,γ N1 ,γ N2 ,ε M1 ,ε M2 ,εR ). Then, in step S652, theprocessor 502 may determine if the relationship (P 0,RACH(k) = P 0,RACH(k - 1)) ∧ (P ramp,RACH(k) = P ramp,RACH(k - 1)) holds true, and if so then in step S654 theprocessor 502 may run algorithm 3 (FIG. 18 ) to determine T RACH(k), where T RACH(k) = Algorithm_3(T RACH(k - 1),F max αFA,ε FA). Otherwise, the method may progresses to step S660, where theprocessor 502 increments (K=K+1), and return to step S650. - Following step S654, in step S656 the
processor 502 may determine if T RACH(k) = T RACH(k - 1), and if so then in step S658 theprocessor 502 may run algorithm 4 (FIG. 21 ) to determine τ RACH(k) = Algorithm_4(τ RACH(k - 1),C max,Δcol,ε col). If theprocessor 502 determines that the inquiry of step S656 is negative, or if theprocessor 502 competes step S658, then theprocessor 502 increments k (k=k+1) in step S660, and returns the process to step S650. - The example aspects associated with
FIG. 10 (a centralized hierarchy) pertain to a hierarchy reliant on acentral office 500 that is able to collect measurements fromeNBs 105a within a particulargeographical area 501, where measurements are processed so that theeNBs 105a are updated with newly computed RACH parameters. However, such a centralized solution assumes that (1) communication interfaces are available for carrying information between thecentral office 500 and theeNBs 105a, (2) the deployment is homogeneous (i.e., alleNBs 105a provide a same coverage characteristics), and (3) the traffic is homogeneous in thegeographical area 501 being considered. In the case that these conditions are not met, a decentralized solution may perform better.FIG. 23 therefore depicts a decentralized hierarchy, where eacheNB 105a has a same structure as shown inFIG. 4 , andinterference measurements 901 are transmitted between neighboringeNBs 105a viawireless interface 235. - Because changes in the RACH preamble detection threshold T RACH and opportunity period τ RACH have a low impact on a performance of neighboring sectors, an optimization may be carried out independently in each sector (i.e., in a decentralized fashion). In this scenario, the only required changes to the methods of
FIGS. 18 and21 relate to settingN sector = 1, where the optimizations are performed locally and independently, on a sector-by-sector basis. - However, because variations in P 0,RACH and P ramp,RACH affect interference levels in neighboring sectors, a small amount of coordination between the sectors may improve performance. Specifically, neighboring sectors may be able to exchange information about the interference levels that are experienced due to changes in P 0,RACH and P ramp,RACH. This exchange of interference information between
eNBs 105a may be done using the quantities R v,[kT](p) as defined in Equation 9. Therefore,FIGS. 24A-24C provides a method implementing a decentralized solution for the optimization of P 0,RACH and P ramp,RACH, where any of theprocessors 210 of the eNB 105a1-105a5 may perform the method steps (and, each of eNB 105a1-105a5 are identical to theeNB 105a ofFIG. 4 ). - In step S700 of
FIG. 24A , aprocessor 210 for any one of the sectors w (associated with any of the eNB 105a1-105a5) may set k=1, and x γ1 = x γ2 = N γ, prior to collecting measurements M w,[kT](l) and R v,[kT](p) from the N neighbors neighboring sectors of sector w. In step S702, theprocessor 210 may then compute an average noise rise for the N neighbors neighboring sectors of sector w. A counter p may correspond to physical resource blocks whereMessages 1 and/or 3 (FIG. 26 ) may cause interference and Np may be a total number of such resource blocks for p = 1 to Np , using the relationship
- In step S704, the
processor 210 may compute an overall average noise rise for the neighboring sectors using
processor 210 may then calculate an average missed detection ratio for the second trial (and further trials), using the relationship
- In step S708, the
processor 210 may determine if |M max,1 - M w,[kT](1)| > εM1 , and if so then theprocessor 210 may adjust an adjust target receive power P 0,RACH(k), using P 0,RACH(k) = P 0,RACH(k - 1) - γ P (M max,1 - M w,[kT](1)), where M 1- Flag(k) = 1, in step S710. Otherwise, theprocessor 210 may calculate P 0,RACH(k) = P 0,RACH(k - 1), where M 1- Flag(k) = 0 in step S712. - Following step S710 or S712, the processor may determine adjust a power ramp P ramp,RACH(k) by determining in step S714 whether |Mmax - M w,[kT]| > ε M
2 , where if this relationship holds true then in step S718 theprocessor 210 may adjust the power ramp by calculating P ramp,RACH(k) = Q ramp{P ramp,RACH(k - 1) - γ R (M max - M w,[kT])}, where M 2- Flag(k) = 1. Otherwise, theprocessor 210 may adjust the power ramp by determining P ramp,RACH(k) = P ramp,RACH(k - 1),M 2- Flag(k) = 0 in step S716. - Following steps S716 or S718, the
processor 210 may make adjustments in P 0,RACH(k) or P ramp,RACH(k) to control the noise rise in the neighboring sectors by resetting flags R 1 -Flag(k) = 0 and R 2- Flag(k) = 0 in step S720. - Following step S720, in step S724 the
processor 210 may determine if R [kT] - R max > εR , and if so then in step S722 theprocessor 210 may then determine if M w,[kT](1) - M max,1 < ε M1 in step S726. If step S722 is answered in the affirmative, then in step S726 theprocessor 210 may determine P 0,RACH(k) = P0,RACH(k - 1) + γ N1 (xγ1 )· (R max - R [kT]), where R1- Flag(k) = 1 (in step S726). Otherwise, in step S728 theprocessor 210 may determine M w,[kT] - Mmax < ε M2 , in step S728. - In step S728, if the
processor 210 makes the determination in the affirmative, then in step S730 theprocessor 210 may make adjustments to control a rise in noise by calculating P ramp,RACH(k) = Q ramp {P ramp,RACH(k - 1) + γ N2 (xγ2) · (R max - R [kT])}, where R 2- Flag(k) = 1. Otherwise, in step S732 the method my continue where in step S732 theprocessor 210 may compute an intensity of a "ping-pong" situation for a last N γ sampling periods, where

- As in the centralized architecture shown in
FIG. 10 , a comprehensive RACH parameter optimization procedure may be implanted for each sector w. In the decentralized method for optimizing all RACH parameters, the method ofFIGS. 24A-24C may be used for controlling P 0,RACH and P ramp,RACH, and the decentralized methods ofFIGS. 18 and21 may be used for controlling T RACH and τ RACH, respectively.FIG. 25 is a flowchart depicting a method of comprehensively optimizing RACH parameters in a decentralized hierarchy (as shown inFIG. 23 ). - In
FIG. 25 (Algorithm 7), any of theprocessors 210 of the eNB 105a1-105a5 may perform these method steps. In step S800, theprocessor 210 may set k=1, and then perform an iteration of Algorithm 6 (FIGS. 24A-24B ) for a sector w, where [P 0,RACH(k),P ramp,RACH(k)] = Algorithm_6(P 0,RACH(k - 1),P ramp,RACH(k - 1),R max,M max,1,M max,γP ,γR ,γ N1 ,γ N2 ,ε M1 ,ε M2 ,εR ). It is noted that other algorithms may run only when P 0,RACH(k) and P ramp,RACH(k) are stable. - In step S802, the
processor 210 may determine if (P 0,RACH(k) = P 0,RACH(k - 1)) ∧ (P ramp,RACH(k) = P ramp,RACH(k - 1)), and if so then in step S804 theprocessor 210 may run an iteration of the decentralized version of Algorithm 3 (FIG. 18 ) for sector w, where [T RACH(k)] = Algorithm_3(T RACH(k - 1),F max,αFA,ε FA). It should be noted that other algorithms may run only when T RACH(k) is stable. Otherwise, if theprocessor 210 does not determine step S802 to be in the affirmative, thenprocessor 210 may end the method in step S810. - Following step S804, in step S806 the
processor 210 may determine if T RACH(k) = T RACH(k - 1), and if so then in step S808 the processor may perform an iteration of the decentralized version of Algorithm 4 (FIG. 21 ) for sector w, where [τ RACH(k)] = Algorithm _4(τ RACH(k - 1),C max,Δcol,ε col) Otherwise, theprocessor 210 ends the method (in step S810). - Following step S808, the
processor 210 ends the method (in step S810).
Claims (10)
- A method comprising:detecting, by at least a processor of a network node, received physical random access channel signatures, by performing the steps of,computing a correlation power profile comprising correlation power profile values for the received physical random access channel signatures (S300),sorting the correlation power profile values into sorted correlation power profile values (S300),for each sorted correlation power profile value:computing a weight factor based on a normalized physical random access channel detection threshold (S302),if the sorted correlation power profile value is greater than the weight factor times a sum of the sorted correlation power profile values preceding the sorted correlation power profile value, selecting the sorted correlation power profile value and sorted correlation power profile values following the sorted correlation power profile value as outlier peaks (S306),mapping the outlier peaks to the received physical random access channel signatures (S308).
- The method of claim 1 comprising:
detecting the received physical random access channel signatures, by further performing the steps of,collecting noise rise information and preamble miss information for the received physical random access channel signatures (S400),computing an overall average noise rise for the communication network based on the collected noise rise information (S404),computing an average missed detection ratio for the communication network using the collected preamble miss information (S406),determining a target receiver power and a power ramp-up using the average nose rise and the average missed detection ratio (S412). - The method of claim 1 wherein:
the detecting of the received physical random access channel signatures, is by further performing the step of:determining the normalized physical random access channel detection threshold, by performing the steps of,collecting preamble false alarm ratio information (S500),computing an average false alarm rate for the communication network based on the preamble false alarm ratio information (S502), anddetermining the normalized physical random access channel detection threshold based on the average false alarm rate (S508). - The method of claim 1, further comprising:collecting a contention ratio information (S600),computing an average contention ratio for the communication network based on the collected contention ratio information (S602),determining the opportunity period based on the average contention ratio (S606).
- The method of claim 2, wherein:the steps of collecting noise rise information and preamble miss information, and the steps of computing an overall average noise rise and an average missed detection ratio are repeated until the determined target receiver power and the power ramp-up remain constant; andwherein the detecting of the received physical random access channel signatures, is by further performing the step of:determining the normalized physical random access channel detection threshold, once the determined target receiver power and the power ramp-up remain constant, by performing the steps of,collecting preamble false alarm ratio information (S650),computing an average false alarm rate for the communication network based on the preamble false alarm ratio information (S654), anddetermining the normalized physical random access channel detection threshold based on the average false alarm rate (S658).
- A network node comprising:a first processor, configured to,detect received physical random access channel signatures, by performing the steps of,computing a correlation power profile comprising correlation power profile values for the received physical random access channel signatures (S300),sorting correlation power profile values into sorted correlation power profile values (S300),for each sorted correlation power profile value:computing a weight factor based on a normalized physical random access channel detection threshold (S302),if the sorted correlation power profile value is greater than the weight factor times a sum of the sorted correlation power profile values preceding the sorted correlation power profile value, selecting the sorted correlation power profile value and sorted correlation power profile values following the sorted correlation power profile value as outlier peaks (S306),mapping the outlier peaks to the received physical random access channel signatures(S308).
- The network node of claim 6 wherein:the processor is further configured to detect the received physical random access channel signatures by,collecting noise rise information and preamble miss information for the received physical random access channel signatures (S400),computing an overall average noise rise for the communication network based on the collected noise rise information (S404),computing an average missed detection ratio for the communication network using the collected preamble miss information (S406),determining a target receiver power and a power ramp-up using the average nose rise and the average missed detection ratio (S412).
- The network node of claim 6, wherein:the processor is further configured to detect the received physical random access channel signatures by determining the normalized physical random access channel detection threshold by performing the steps of,collecting preamble false alarm ratio information (S500),computing an average false alarm rate for the communication network based on the preamble false alarm ratio information (S502), anddetermining the normalized physical random access channel detection threshold based on the average false alarm rate (S508).
- The network node of claim 6 wherein:
the processor is further configured to:collect a contention ratio information (S600),compute an average contention ratio for the communication network based on the collected contention ratio information (S602),determine the opportunity period based on the average contention ratio (S606). - The network node of claim 7, wherein the processor is further configured to,repeat the steps of collecting noise rise information and preamble miss information, and the steps of computing an overall average noise rise and an average missed detection ratio until the determined target receiver power and the power ramp-up remain constant,wherein the processor is further configured to detect the received physical random access channel signatures by determining the normalized physical random access channel detection threshold, once the determined target receiver power and the power ramp-up remain constant, by performing the steps of,collecting preamble false alarm ratio information (S650),computing an average false alarm rate for the communication network based on the preamble false alarm ratio information (S654), anddetermining the normalized physical random access channel detection threshold based on the average false alarm rate (S658).
Applications Claiming Priority (2)
| Application Number | Priority Date | Filing Date | Title |
|---|---|---|---|
| US15/191,756 US9913295B2 (en) | 2016-06-24 | 2016-06-24 | System and method of controlling network traffic using preamble detection and automated optimization of random access channel parameters |
| PCT/US2017/035870 WO2017222789A1 (en) | 2016-06-24 | 2017-06-05 | System and method of controlling network traffic using preamble detection and automated optimization of random access channel parameters |
Publications (2)
| Publication Number | Publication Date |
|---|---|
| EP3476171A1 EP3476171A1 (en) | 2019-05-01 |
| EP3476171B1 true EP3476171B1 (en) | 2023-11-29 |
Family
ID=59071105
Family Applications (1)
| Application Number | Title | Priority Date | Filing Date |
|---|---|---|---|
| EP17731015.8A Active EP3476171B1 (en) | 2016-06-24 | 2017-06-05 | System and method of controlling network traffic using preamble detection and automated optimization of random access channel parameters |
Country Status (4)
| Country | Link |
|---|---|
| US (2) | US9913295B2 (en) |
| EP (1) | EP3476171B1 (en) |
| CN (1) | CN109644497B (en) |
| WO (1) | WO2017222789A1 (en) |
Families Citing this family (13)
| Publication number | Priority date | Publication date | Assignee | Title |
|---|---|---|---|---|
| KR101276853B1 (en) * | 2010-08-17 | 2013-06-18 | 엘지전자 주식회사 | A method and an apparatus of transmitting a power headroom report in a wireless communication system supporting multi-carriers |
| US9913295B2 (en) | 2016-06-24 | 2018-03-06 | Alcatel-Lucent Usa Inc. | System and method of controlling network traffic using preamble detection and automated optimization of random access channel parameters |
| WO2019056105A1 (en) * | 2017-09-21 | 2019-03-28 | Sierra Wireless, Inc. | Method and apparatus for supporting sub-channel physical resource block uplink transmission in a wireless communication system |
| KR102356442B1 (en) * | 2017-11-13 | 2022-01-28 | 한국전자통신연구원 | Timing estimation method of random access preamble, random access preamble detection method and random access preamble detection appratus |
| WO2019232801A1 (en) * | 2018-06-08 | 2019-12-12 | Nokia Shanghai Bell Co., Ltd. | Noise floor estimation for signal detection |
| US11032854B2 (en) * | 2019-01-18 | 2021-06-08 | Qualcomm Incorporated | Variable payload size for two-step random access |
| US12193040B2 (en) * | 2019-12-09 | 2025-01-07 | Qualcomm Incorporated | Beam and cell selection based on power configuration |
| WO2021223893A1 (en) | 2020-05-08 | 2021-11-11 | Telefonaktiebolaget Lm Ericsson (Publ) | Narrowband aas receiver with data replay interfacing |
| CN115516773A (en) * | 2020-05-08 | 2022-12-23 | 瑞典爱立信有限公司 | Multifunctional AAS receiver |
| EP4150778B1 (en) | 2020-05-11 | 2025-09-24 | Telefonaktiebolaget LM ERICSSON (PUBL) | Efficient prach scheduling |
| CN113365249B (en) * | 2021-05-06 | 2023-01-03 | 西安交通大学 | Terminal hijacking DDoS attack detection method facing 5G large-scale machine communication |
| US11337257B1 (en) * | 2021-12-23 | 2022-05-17 | King Abdulaziz University | Random-access channel in 5G networks |
| EP4468665A4 (en) | 2022-02-18 | 2025-05-07 | Samsung Electronics Co., Ltd | Mehod and device for detecting preamble signal of random access channel in base station of wireless communication system |
Citations (3)
| Publication number | Priority date | Publication date | Assignee | Title |
|---|---|---|---|---|
| US20100172299A1 (en) * | 2007-06-19 | 2010-07-08 | Patrick Fischer | Enhancement of lte random access procedure |
| US20140112254A1 (en) * | 2011-06-17 | 2014-04-24 | Telefonaktiebolaget L M Ericsson (Publ) | Methods and nodes for random access |
| US20150305066A1 (en) * | 2014-04-21 | 2015-10-22 | Samsung Electronics Co., Ltd. | Method and apparatus for random access in wireless communication system |
Family Cites Families (12)
| Publication number | Priority date | Publication date | Assignee | Title |
|---|---|---|---|---|
| JP4244670B2 (en) * | 2003-03-19 | 2009-03-25 | 日本電気株式会社 | Mobile communication system, radio base station apparatus and operation control method thereof |
| US8000305B2 (en) * | 2006-01-17 | 2011-08-16 | Motorola Mobility, Inc. | Preamble sequencing for random access channel in a communication system |
| CN101594168B (en) * | 2008-05-28 | 2012-08-01 | 中国移动通信集团公司 | Method, device and equipment for detecting lead code of random access channel |
| CN101295999B (en) * | 2008-06-27 | 2014-02-19 | 中兴通讯股份有限公司 | Detection method for accidental precursor access |
| US8805362B2 (en) * | 2008-09-11 | 2014-08-12 | Telefonaktiebolaget Lm Ericsson (Publ) | Method and arrangement for satisfying performance requirements by tuning parameters for accessing a network with random access channels |
| CN102316601B (en) * | 2011-09-28 | 2014-05-07 | 北京北方烽火科技有限公司 | Leader sequence detection method and device for random access channel |
| US9363829B2 (en) * | 2012-02-24 | 2016-06-07 | Interdigital Patent Holdings, Inc. | Random access in dynamic and shared spectrums |
| EP2760248B1 (en) * | 2013-01-28 | 2021-03-10 | Alcatel Lucent | Wireless telecommunications |
| KR102026256B1 (en) | 2013-05-21 | 2019-11-04 | 삼성전자주식회사 | Scheme for transmitting/receiving rach signal in beamforming systems |
| US9756657B2 (en) * | 2013-07-22 | 2017-09-05 | Texas Instruments Incorporated | Wireless network signal to interference plus noise ratio estimation for a random access channel |
| US9615386B2 (en) * | 2014-01-27 | 2017-04-04 | Texas Instruments Incorporated | Random access channel false alarm control |
| US9913295B2 (en) | 2016-06-24 | 2018-03-06 | Alcatel-Lucent Usa Inc. | System and method of controlling network traffic using preamble detection and automated optimization of random access channel parameters |
-
2016
- 2016-06-24 US US15/191,756 patent/US9913295B2/en active Active
-
2017
- 2017-06-05 CN CN201780052285.5A patent/CN109644497B/en active Active
- 2017-06-05 WO PCT/US2017/035870 patent/WO2017222789A1/en not_active Ceased
- 2017-06-05 EP EP17731015.8A patent/EP3476171B1/en active Active
- 2017-06-05 US US16/312,628 patent/US10798748B2/en active Active
Patent Citations (3)
| Publication number | Priority date | Publication date | Assignee | Title |
|---|---|---|---|---|
| US20100172299A1 (en) * | 2007-06-19 | 2010-07-08 | Patrick Fischer | Enhancement of lte random access procedure |
| US20140112254A1 (en) * | 2011-06-17 | 2014-04-24 | Telefonaktiebolaget L M Ericsson (Publ) | Methods and nodes for random access |
| US20150305066A1 (en) * | 2014-04-21 | 2015-10-22 | Samsung Electronics Co., Ltd. | Method and apparatus for random access in wireless communication system |
Also Published As
| Publication number | Publication date |
|---|---|
| US10798748B2 (en) | 2020-10-06 |
| EP3476171A1 (en) | 2019-05-01 |
| CN109644497A (en) | 2019-04-16 |
| WO2017222789A1 (en) | 2017-12-28 |
| US9913295B2 (en) | 2018-03-06 |
| CN109644497B (en) | 2023-04-07 |
| US20190174553A1 (en) | 2019-06-06 |
| US20170374683A1 (en) | 2017-12-28 |
Similar Documents
| Publication | Publication Date | Title |
|---|---|---|
| US10798748B2 (en) | User equipment using random access channel (RACH) parameters to adjust transmit power, and method of using the RACH parameters to adjust transmit power | |
| US11984937B2 (en) | Communication system with beam quality measurement | |
| US9794850B2 (en) | Procedure for formulating a signal to interference plus noise ratio | |
| EP2749110B1 (en) | A radio network node, a controlling radio network node, and methods therein for enabling management of radio resources in a radio communications network | |
| EP2223451B1 (en) | Scrambling code allocation in a cellular communication network | |
| EP2462756B1 (en) | Reducing interference from dominant interfering neighboring base stations | |
| US10404516B2 (en) | Data demodulation method, user equipment, base station, and system | |
| EP3228119B1 (en) | Measurement report triggering for inter-cell coordination in cellular deployment | |
| CN113424459B (en) | Beam management method and device for device communication | |
| EP3751900A1 (en) | Selection of a target cell for handover based on channel impulse response metric | |
| WO2012171498A1 (en) | Interference coordination method and base station thereof | |
| US20220264398A1 (en) | Wireless terminal roaming | |
| EP3571784B1 (en) | Event triggering and reporting with multiple reference signals | |
| US12526684B2 (en) | Load management of overlapping cells based on user throughput | |
| US10299145B1 (en) | Systems and methods for mitigating interference from neighbors | |
| EP3050367B1 (en) | Methods and nodes in a wireless communication network | |
| US20230247510A1 (en) | Communication control apparatus and identifier determination method | |
| Nuraini | Inter-cell interference coordination with soft frequency reuse method for LTE network | |
| Al-Hilfi et al. | LTE Coverage prediction using different propagation models | |
| JP6765544B2 (en) | Downlink signal pre-correction method and equipment | |
| CN115804032A (en) | Enhanced link adaptation improvement with PCI reporting | |
| Courtillat et al. | Multi-Techno-Band Cellular Network Resilience to Shocks and Aging: a Stochastic Geometry Approach | |
| EP2530846A1 (en) | Method for setting up a wireless communication and wireless communication system | |
| WO2024167534A1 (en) | Network node jointly coordinated exploration for user device radio parameter optimization | |
| Jakó et al. | Application of LTE small cells in urban environments for higher capacity |
Legal Events
| Date | Code | Title | Description |
|---|---|---|---|
| STAA | Information on the status of an ep patent application or granted ep patent |
Free format text: STATUS: UNKNOWN |
|
| STAA | Information on the status of an ep patent application or granted ep patent |
Free format text: STATUS: THE INTERNATIONAL PUBLICATION HAS BEEN MADE |
|
| PUAI | Public reference made under article 153(3) epc to a published international application that has entered the european phase |
Free format text: ORIGINAL CODE: 0009012 |
|
| STAA | Information on the status of an ep patent application or granted ep patent |
Free format text: STATUS: REQUEST FOR EXAMINATION WAS MADE |
|
| 17P | Request for examination filed |
Effective date: 20190124 |
|
| AK | Designated contracting states |
Kind code of ref document: A1 Designated state(s): AL AT BE BG CH CY CZ DE DK EE ES FI FR GB GR HR HU IE IS IT LI LT LU LV MC MK MT NL NO PL PT RO RS SE SI SK SM TR |
|
| AX | Request for extension of the european patent |
Extension state: BA ME |
|
| DAV | Request for validation of the european patent (deleted) | ||
| DAX | Request for extension of the european patent (deleted) | ||
| PUAG | Search results despatched under rule 164(2) epc together with communication from examining division |
Free format text: ORIGINAL CODE: 0009017 |
|
| STAA | Information on the status of an ep patent application or granted ep patent |
Free format text: STATUS: EXAMINATION IS IN PROGRESS |
|
| 17Q | First examination report despatched |
Effective date: 20210722 |
|
| B565 | Issuance of search results under rule 164(2) epc |
Effective date: 20210722 |
|
| RIC1 | Information provided on ipc code assigned before grant |
Ipc: H04W 74/00 20090101AFI20210719BHEP Ipc: H04W 74/08 20090101ALI20210719BHEP Ipc: H04L 27/26 20060101ALI20210719BHEP Ipc: H04L 7/04 20060101ALN20210719BHEP |
|
| GRAP | Despatch of communication of intention to grant a patent |
Free format text: ORIGINAL CODE: EPIDOSNIGR1 |
|
| STAA | Information on the status of an ep patent application or granted ep patent |
Free format text: STATUS: GRANT OF PATENT IS INTENDED |
|
| RIC1 | Information provided on ipc code assigned before grant |
Ipc: H04L 7/04 20060101ALN20230524BHEP Ipc: H04L 27/26 20060101ALI20230524BHEP Ipc: H04W 74/08 20090101ALI20230524BHEP Ipc: H04W 74/00 20090101AFI20230524BHEP |
|
| RIC1 | Information provided on ipc code assigned before grant |
Ipc: H04L 7/04 20060101ALN20230602BHEP Ipc: H04L 27/26 20060101ALI20230602BHEP Ipc: H04W 74/08 20090101ALI20230602BHEP Ipc: H04W 74/00 20090101AFI20230602BHEP |
|
| INTG | Intention to grant announced |
Effective date: 20230622 |
|
| RIC1 | Information provided on ipc code assigned before grant |
Ipc: H04L 7/04 20060101ALN20230612BHEP Ipc: H04L 27/26 20060101ALI20230612BHEP Ipc: H04W 74/08 20090101ALI20230612BHEP Ipc: H04W 74/00 20090101AFI20230612BHEP |
|
| GRAS | Grant fee paid |
Free format text: ORIGINAL CODE: EPIDOSNIGR3 |
|
| GRAA | (expected) grant |
Free format text: ORIGINAL CODE: 0009210 |
|
| STAA | Information on the status of an ep patent application or granted ep patent |
Free format text: STATUS: THE PATENT HAS BEEN GRANTED |
|
| RAP3 | Party data changed (applicant data changed or rights of an application transferred) |
Owner name: NOKIA OF AMERICA CORPORATION |
|
| AK | Designated contracting states |
Kind code of ref document: B1 Designated state(s): AL AT BE BG CH CY CZ DE DK EE ES FI FR GB GR HR HU IE IS IT LI LT LU LV MC MK MT NL NO PL PT RO RS SE SI SK SM TR |
|
| REG | Reference to a national code |
Ref country code: GB Ref legal event code: FG4D |
|
| REG | Reference to a national code |
Ref country code: CH Ref legal event code: EP |
|
| REG | Reference to a national code |
Ref country code: DE Ref legal event code: R096 Ref document number: 602017076959 Country of ref document: DE |
|
| REG | Reference to a national code |
Ref country code: IE Ref legal event code: FG4D |
|
| REG | Reference to a national code |
Ref country code: LT Ref legal event code: MG9D |
|
| REG | Reference to a national code |
Ref country code: NL Ref legal event code: MP Effective date: 20231129 |
|
| PG25 | Lapsed in a contracting state [announced via postgrant information from national office to epo] |
Ref country code: GR Free format text: LAPSE BECAUSE OF FAILURE TO SUBMIT A TRANSLATION OF THE DESCRIPTION OR TO PAY THE FEE WITHIN THE PRESCRIBED TIME-LIMIT Effective date: 20240301 |
|
| PG25 | Lapsed in a contracting state [announced via postgrant information from national office to epo] |
Ref country code: IS Free format text: LAPSE BECAUSE OF FAILURE TO SUBMIT A TRANSLATION OF THE DESCRIPTION OR TO PAY THE FEE WITHIN THE PRESCRIBED TIME-LIMIT Effective date: 20240329 |
|
| PG25 | Lapsed in a contracting state [announced via postgrant information from national office to epo] |
Ref country code: LT Free format text: LAPSE BECAUSE OF FAILURE TO SUBMIT A TRANSLATION OF THE DESCRIPTION OR TO PAY THE FEE WITHIN THE PRESCRIBED TIME-LIMIT Effective date: 20231129 |
|
| PG25 | Lapsed in a contracting state [announced via postgrant information from national office to epo] |
Ref country code: ES Free format text: LAPSE BECAUSE OF FAILURE TO SUBMIT A TRANSLATION OF THE DESCRIPTION OR TO PAY THE FEE WITHIN THE PRESCRIBED TIME-LIMIT Effective date: 20231129 |
|
| PG25 | Lapsed in a contracting state [announced via postgrant information from national office to epo] |
Ref country code: LT Free format text: LAPSE BECAUSE OF FAILURE TO SUBMIT A TRANSLATION OF THE DESCRIPTION OR TO PAY THE FEE WITHIN THE PRESCRIBED TIME-LIMIT Effective date: 20231129 Ref country code: IS Free format text: LAPSE BECAUSE OF FAILURE TO SUBMIT A TRANSLATION OF THE DESCRIPTION OR TO PAY THE FEE WITHIN THE PRESCRIBED TIME-LIMIT Effective date: 20240329 Ref country code: GR Free format text: LAPSE BECAUSE OF FAILURE TO SUBMIT A TRANSLATION OF THE DESCRIPTION OR TO PAY THE FEE WITHIN THE PRESCRIBED TIME-LIMIT Effective date: 20240301 Ref country code: ES Free format text: LAPSE BECAUSE OF FAILURE TO SUBMIT A TRANSLATION OF THE DESCRIPTION OR TO PAY THE FEE WITHIN THE PRESCRIBED TIME-LIMIT Effective date: 20231129 Ref country code: BG Free format text: LAPSE BECAUSE OF FAILURE TO SUBMIT A TRANSLATION OF THE DESCRIPTION OR TO PAY THE FEE WITHIN THE PRESCRIBED TIME-LIMIT Effective date: 20240229 |
|
| REG | Reference to a national code |
Ref country code: AT Ref legal event code: MK05 Ref document number: 1637416 Country of ref document: AT Kind code of ref document: T Effective date: 20231129 |
|
| PG25 | Lapsed in a contracting state [announced via postgrant information from national office to epo] |
Ref country code: NL Free format text: LAPSE BECAUSE OF FAILURE TO SUBMIT A TRANSLATION OF THE DESCRIPTION OR TO PAY THE FEE WITHIN THE PRESCRIBED TIME-LIMIT Effective date: 20231129 |
|
| PG25 | Lapsed in a contracting state [announced via postgrant information from national office to epo] |
Ref country code: SE Free format text: LAPSE BECAUSE OF FAILURE TO SUBMIT A TRANSLATION OF THE DESCRIPTION OR TO PAY THE FEE WITHIN THE PRESCRIBED TIME-LIMIT Effective date: 20231129 Ref country code: RS Free format text: LAPSE BECAUSE OF FAILURE TO SUBMIT A TRANSLATION OF THE DESCRIPTION OR TO PAY THE FEE WITHIN THE PRESCRIBED TIME-LIMIT Effective date: 20231129 Ref country code: PL Free format text: LAPSE BECAUSE OF FAILURE TO SUBMIT A TRANSLATION OF THE DESCRIPTION OR TO PAY THE FEE WITHIN THE PRESCRIBED TIME-LIMIT Effective date: 20231129 Ref country code: NO Free format text: LAPSE BECAUSE OF FAILURE TO SUBMIT A TRANSLATION OF THE DESCRIPTION OR TO PAY THE FEE WITHIN THE PRESCRIBED TIME-LIMIT Effective date: 20240229 Ref country code: NL Free format text: LAPSE BECAUSE OF FAILURE TO SUBMIT A TRANSLATION OF THE DESCRIPTION OR TO PAY THE FEE WITHIN THE PRESCRIBED TIME-LIMIT Effective date: 20231129 Ref country code: LV Free format text: LAPSE BECAUSE OF FAILURE TO SUBMIT A TRANSLATION OF THE DESCRIPTION OR TO PAY THE FEE WITHIN THE PRESCRIBED TIME-LIMIT Effective date: 20231129 Ref country code: HR Free format text: LAPSE BECAUSE OF FAILURE TO SUBMIT A TRANSLATION OF THE DESCRIPTION OR TO PAY THE FEE WITHIN THE PRESCRIBED TIME-LIMIT Effective date: 20231129 |
|
| PG25 | Lapsed in a contracting state [announced via postgrant information from national office to epo] |
Ref country code: DK Free format text: LAPSE BECAUSE OF FAILURE TO SUBMIT A TRANSLATION OF THE DESCRIPTION OR TO PAY THE FEE WITHIN THE PRESCRIBED TIME-LIMIT Effective date: 20231129 |
|
| PG25 | Lapsed in a contracting state [announced via postgrant information from national office to epo] |
Ref country code: CZ Free format text: LAPSE BECAUSE OF FAILURE TO SUBMIT A TRANSLATION OF THE DESCRIPTION OR TO PAY THE FEE WITHIN THE PRESCRIBED TIME-LIMIT Effective date: 20231129 Ref country code: AT Free format text: LAPSE BECAUSE OF FAILURE TO SUBMIT A TRANSLATION OF THE DESCRIPTION OR TO PAY THE FEE WITHIN THE PRESCRIBED TIME-LIMIT Effective date: 20231129 |
|
| PG25 | Lapsed in a contracting state [announced via postgrant information from national office to epo] |
Ref country code: SK Free format text: LAPSE BECAUSE OF FAILURE TO SUBMIT A TRANSLATION OF THE DESCRIPTION OR TO PAY THE FEE WITHIN THE PRESCRIBED TIME-LIMIT Effective date: 20231129 |
|
| PG25 | Lapsed in a contracting state [announced via postgrant information from national office to epo] |
Ref country code: SM Free format text: LAPSE BECAUSE OF FAILURE TO SUBMIT A TRANSLATION OF THE DESCRIPTION OR TO PAY THE FEE WITHIN THE PRESCRIBED TIME-LIMIT Effective date: 20231129 Ref country code: SK Free format text: LAPSE BECAUSE OF FAILURE TO SUBMIT A TRANSLATION OF THE DESCRIPTION OR TO PAY THE FEE WITHIN THE PRESCRIBED TIME-LIMIT Effective date: 20231129 Ref country code: RO Free format text: LAPSE BECAUSE OF FAILURE TO SUBMIT A TRANSLATION OF THE DESCRIPTION OR TO PAY THE FEE WITHIN THE PRESCRIBED TIME-LIMIT Effective date: 20231129 Ref country code: IT Free format text: LAPSE BECAUSE OF FAILURE TO SUBMIT A TRANSLATION OF THE DESCRIPTION OR TO PAY THE FEE WITHIN THE PRESCRIBED TIME-LIMIT Effective date: 20231129 Ref country code: EE Free format text: LAPSE BECAUSE OF FAILURE TO SUBMIT A TRANSLATION OF THE DESCRIPTION OR TO PAY THE FEE WITHIN THE PRESCRIBED TIME-LIMIT Effective date: 20231129 Ref country code: DK Free format text: LAPSE BECAUSE OF FAILURE TO SUBMIT A TRANSLATION OF THE DESCRIPTION OR TO PAY THE FEE WITHIN THE PRESCRIBED TIME-LIMIT Effective date: 20231129 Ref country code: CZ Free format text: LAPSE BECAUSE OF FAILURE TO SUBMIT A TRANSLATION OF THE DESCRIPTION OR TO PAY THE FEE WITHIN THE PRESCRIBED TIME-LIMIT Effective date: 20231129 Ref country code: AT Free format text: LAPSE BECAUSE OF FAILURE TO SUBMIT A TRANSLATION OF THE DESCRIPTION OR TO PAY THE FEE WITHIN THE PRESCRIBED TIME-LIMIT Effective date: 20231129 |
|
| PG25 | Lapsed in a contracting state [announced via postgrant information from national office to epo] |
Ref country code: PT Free format text: LAPSE BECAUSE OF FAILURE TO SUBMIT A TRANSLATION OF THE DESCRIPTION OR TO PAY THE FEE WITHIN THE PRESCRIBED TIME-LIMIT Effective date: 20240401 |
|
| PG25 | Lapsed in a contracting state [announced via postgrant information from national office to epo] |
Ref country code: PT Free format text: LAPSE BECAUSE OF FAILURE TO SUBMIT A TRANSLATION OF THE DESCRIPTION OR TO PAY THE FEE WITHIN THE PRESCRIBED TIME-LIMIT Effective date: 20240401 |
|
| REG | Reference to a national code |
Ref country code: DE Ref legal event code: R097 Ref document number: 602017076959 Country of ref document: DE |
|
| PLBE | No opposition filed within time limit |
Free format text: ORIGINAL CODE: 0009261 |
|
| STAA | Information on the status of an ep patent application or granted ep patent |
Free format text: STATUS: NO OPPOSITION FILED WITHIN TIME LIMIT |
|
| PG25 | Lapsed in a contracting state [announced via postgrant information from national office to epo] |
Ref country code: SI Free format text: LAPSE BECAUSE OF FAILURE TO SUBMIT A TRANSLATION OF THE DESCRIPTION OR TO PAY THE FEE WITHIN THE PRESCRIBED TIME-LIMIT Effective date: 20231129 |
|
| PG25 | Lapsed in a contracting state [announced via postgrant information from national office to epo] |
Ref country code: SI Free format text: LAPSE BECAUSE OF FAILURE TO SUBMIT A TRANSLATION OF THE DESCRIPTION OR TO PAY THE FEE WITHIN THE PRESCRIBED TIME-LIMIT Effective date: 20231129 |
|
| 26N | No opposition filed |
Effective date: 20240830 |
|
| PG25 | Lapsed in a contracting state [announced via postgrant information from national office to epo] |
Ref country code: MC Free format text: LAPSE BECAUSE OF FAILURE TO SUBMIT A TRANSLATION OF THE DESCRIPTION OR TO PAY THE FEE WITHIN THE PRESCRIBED TIME-LIMIT Effective date: 20231129 |
|
| REG | Reference to a national code |
Ref country code: CH Ref legal event code: PL |
|
| PG25 | Lapsed in a contracting state [announced via postgrant information from national office to epo] |
Ref country code: LU Free format text: LAPSE BECAUSE OF NON-PAYMENT OF DUE FEES Effective date: 20240605 |
|
| PG25 | Lapsed in a contracting state [announced via postgrant information from national office to epo] |
Ref country code: IE Free format text: LAPSE BECAUSE OF NON-PAYMENT OF DUE FEES Effective date: 20240605 |
|
| PG25 | Lapsed in a contracting state [announced via postgrant information from national office to epo] |
Ref country code: CH Free format text: LAPSE BECAUSE OF NON-PAYMENT OF DUE FEES Effective date: 20240630 Ref country code: BE Free format text: LAPSE BECAUSE OF NON-PAYMENT OF DUE FEES Effective date: 20240630 |
|
| REG | Reference to a national code |
Ref country code: BE Ref legal event code: MM Effective date: 20240630 |
|
| PGFP | Annual fee paid to national office [announced via postgrant information from national office to epo] |
Ref country code: DE Payment date: 20250429 Year of fee payment: 9 |
|
| PGFP | Annual fee paid to national office [announced via postgrant information from national office to epo] |
Ref country code: FR Payment date: 20250508 Year of fee payment: 9 |
|
| PG25 | Lapsed in a contracting state [announced via postgrant information from national office to epo] |
Ref country code: FI Free format text: LAPSE BECAUSE OF FAILURE TO SUBMIT A TRANSLATION OF THE DESCRIPTION OR TO PAY THE FEE WITHIN THE PRESCRIBED TIME-LIMIT Effective date: 20231129 |
|
| PG25 | Lapsed in a contracting state [announced via postgrant information from national office to epo] |
Ref country code: CY Free format text: LAPSE BECAUSE OF FAILURE TO SUBMIT A TRANSLATION OF THE DESCRIPTION OR TO PAY THE FEE WITHIN THE PRESCRIBED TIME-LIMIT; INVALID AB INITIO Effective date: 20170605 |
|
| PG25 | Lapsed in a contracting state [announced via postgrant information from national office to epo] |
Ref country code: HU Free format text: LAPSE BECAUSE OF FAILURE TO SUBMIT A TRANSLATION OF THE DESCRIPTION OR TO PAY THE FEE WITHIN THE PRESCRIBED TIME-LIMIT; INVALID AB INITIO Effective date: 20170605 |
|
| PG25 | Lapsed in a contracting state [announced via postgrant information from national office to epo] |
Ref country code: TR Free format text: LAPSE BECAUSE OF FAILURE TO SUBMIT A TRANSLATION OF THE DESCRIPTION OR TO PAY THE FEE WITHIN THE PRESCRIBED TIME-LIMIT Effective date: 20231129 |
|
| PGFP | Annual fee paid to national office [announced via postgrant information from national office to epo] |
Ref country code: GB Payment date: 20260507 Year of fee payment: 10 |