EP3467702A1 - Method and system for performing data analysis for plant phenotyping - Google Patents
Method and system for performing data analysis for plant phenotyping Download PDFInfo
- Publication number
- EP3467702A1 EP3467702A1 EP17194841.7A EP17194841A EP3467702A1 EP 3467702 A1 EP3467702 A1 EP 3467702A1 EP 17194841 A EP17194841 A EP 17194841A EP 3467702 A1 EP3467702 A1 EP 3467702A1
- Authority
- EP
- European Patent Office
- Prior art keywords
- data
- field
- capturing
- spectral
- spectral data
- Prior art date
- Legal status (The legal status is an assumption and is not a legal conclusion. Google has not performed a legal analysis and makes no representation as to the accuracy of the status listed.)
- Withdrawn
Links
Images



Classifications
-
- A—HUMAN NECESSITIES
- A01—AGRICULTURE; FORESTRY; ANIMAL HUSBANDRY; HUNTING; TRAPPING; FISHING
- A01B—SOIL WORKING IN AGRICULTURE OR FORESTRY; PARTS, DETAILS, OR ACCESSORIES OF AGRICULTURAL MACHINES OR IMPLEMENTS, IN GENERAL
- A01B79/00—Methods for working soil
- A01B79/005—Precision agriculture
-
- G—PHYSICS
- G16—INFORMATION AND COMMUNICATION TECHNOLOGY [ICT] SPECIALLY ADAPTED FOR SPECIFIC APPLICATION FIELDS
- G16B—BIOINFORMATICS, i.e. INFORMATION AND COMMUNICATION TECHNOLOGY [ICT] SPECIALLY ADAPTED FOR GENETIC OR PROTEIN-RELATED DATA PROCESSING IN COMPUTATIONAL MOLECULAR BIOLOGY
- G16B20/00—ICT specially adapted for functional genomics or proteomics, e.g. genotype-phenotype associations
- G16B20/20—Allele or variant detection, e.g. single nucleotide polymorphism [SNP] detection
-
- C—CHEMISTRY; METALLURGY
- C12—BIOCHEMISTRY; BEER; SPIRITS; WINE; VINEGAR; MICROBIOLOGY; ENZYMOLOGY; MUTATION OR GENETIC ENGINEERING
- C12Q—MEASURING OR TESTING PROCESSES INVOLVING ENZYMES, NUCLEIC ACIDS OR MICROORGANISMS; COMPOSITIONS OR TEST PAPERS THEREFOR; PROCESSES OF PREPARING SUCH COMPOSITIONS; CONDITION-RESPONSIVE CONTROL IN MICROBIOLOGICAL OR ENZYMOLOGICAL PROCESSES
- C12Q1/00—Measuring or testing processes involving enzymes, nucleic acids or microorganisms; Compositions therefor; Processes of preparing such compositions
- C12Q1/68—Measuring or testing processes involving enzymes, nucleic acids or microorganisms; Compositions therefor; Processes of preparing such compositions involving nucleic acids
- C12Q1/6876—Nucleic acid products used in the analysis of nucleic acids, e.g. primers or probes
- C12Q1/6888—Nucleic acid products used in the analysis of nucleic acids, e.g. primers or probes for detection or identification of organisms
- C12Q1/6895—Nucleic acid products used in the analysis of nucleic acids, e.g. primers or probes for detection or identification of organisms for plants, fungi or algae
-
- G—PHYSICS
- G01—MEASURING; TESTING
- G01N—INVESTIGATING OR ANALYSING MATERIALS BY DETERMINING THEIR CHEMICAL OR PHYSICAL PROPERTIES
- G01N21/00—Investigating or analysing materials by the use of optical means, i.e. using sub-millimetre waves, infrared, visible or ultraviolet light
- G01N21/17—Systems in which incident light is modified in accordance with the properties of the material investigated
- G01N21/25—Colour; Spectral properties, i.e. comparison of effect of material on the light at two or more different wavelengths or wavelength bands
- G01N21/31—Investigating relative effect of material at wavelengths characteristic of specific elements or molecules, e.g. atomic absorption spectrometry
-
- G—PHYSICS
- G01—MEASURING; TESTING
- G01N—INVESTIGATING OR ANALYSING MATERIALS BY DETERMINING THEIR CHEMICAL OR PHYSICAL PROPERTIES
- G01N33/00—Investigating or analysing materials by specific methods not covered by groups G01N1/00 - G01N31/00
- G01N33/0098—Plants or trees
-
- G—PHYSICS
- G06—COMPUTING OR CALCULATING; COUNTING
- G06V—IMAGE OR VIDEO RECOGNITION OR UNDERSTANDING
- G06V20/00—Scenes; Scene-specific elements
- G06V20/10—Terrestrial scenes
- G06V20/17—Terrestrial scenes taken from planes or by drones
-
- G—PHYSICS
- G06—COMPUTING OR CALCULATING; COUNTING
- G06V—IMAGE OR VIDEO RECOGNITION OR UNDERSTANDING
- G06V20/00—Scenes; Scene-specific elements
- G06V20/10—Terrestrial scenes
- G06V20/188—Vegetation
-
- G—PHYSICS
- G06—COMPUTING OR CALCULATING; COUNTING
- G06V—IMAGE OR VIDEO RECOGNITION OR UNDERSTANDING
- G06V20/00—Scenes; Scene-specific elements
- G06V20/10—Terrestrial scenes
- G06V20/194—Terrestrial scenes using hyperspectral data, i.e. more or other wavelengths than RGB
-
- A—HUMAN NECESSITIES
- A01—AGRICULTURE; FORESTRY; ANIMAL HUSBANDRY; HUNTING; TRAPPING; FISHING
- A01G—HORTICULTURE; CULTIVATION OF VEGETABLES, FLOWERS, RICE, FRUIT, VINES, HOPS OR SEAWEED; FORESTRY; WATERING
- A01G7/00—Botany in general
-
- C—CHEMISTRY; METALLURGY
- C12—BIOCHEMISTRY; BEER; SPIRITS; WINE; VINEGAR; MICROBIOLOGY; ENZYMOLOGY; MUTATION OR GENETIC ENGINEERING
- C12Q—MEASURING OR TESTING PROCESSES INVOLVING ENZYMES, NUCLEIC ACIDS OR MICROORGANISMS; COMPOSITIONS OR TEST PAPERS THEREFOR; PROCESSES OF PREPARING SUCH COMPOSITIONS; CONDITION-RESPONSIVE CONTROL IN MICROBIOLOGICAL OR ENZYMOLOGICAL PROCESSES
- C12Q2600/00—Oligonucleotides characterized by their use
- C12Q2600/13—Plant traits
-
- C—CHEMISTRY; METALLURGY
- C12—BIOCHEMISTRY; BEER; SPIRITS; WINE; VINEGAR; MICROBIOLOGY; ENZYMOLOGY; MUTATION OR GENETIC ENGINEERING
- C12Q—MEASURING OR TESTING PROCESSES INVOLVING ENZYMES, NUCLEIC ACIDS OR MICROORGANISMS; COMPOSITIONS OR TEST PAPERS THEREFOR; PROCESSES OF PREPARING SUCH COMPOSITIONS; CONDITION-RESPONSIVE CONTROL IN MICROBIOLOGICAL OR ENZYMOLOGICAL PROCESSES
- C12Q2600/00—Oligonucleotides characterized by their use
- C12Q2600/158—Expression markers
-
- G—PHYSICS
- G01—MEASURING; TESTING
- G01N—INVESTIGATING OR ANALYSING MATERIALS BY DETERMINING THEIR CHEMICAL OR PHYSICAL PROPERTIES
- G01N21/00—Investigating or analysing materials by the use of optical means, i.e. using sub-millimetre waves, infrared, visible or ultraviolet light
- G01N21/62—Systems in which the material investigated is excited whereby it emits light or causes a change in wavelength of the incident light
- G01N21/63—Systems in which the material investigated is excited whereby it emits light or causes a change in wavelength of the incident light optically excited
- G01N21/64—Fluorescence; Phosphorescence
- G01N21/645—Specially adapted constructive features of fluorimeters
- G01N21/6456—Spatial resolved fluorescence measurements; Imaging
-
- G—PHYSICS
- G01—MEASURING; TESTING
- G01N—INVESTIGATING OR ANALYSING MATERIALS BY DETERMINING THEIR CHEMICAL OR PHYSICAL PROPERTIES
- G01N33/00—Investigating or analysing materials by specific methods not covered by groups G01N1/00 - G01N31/00
- G01N33/24—Earth materials
- G01N33/245—Earth materials for agricultural purposes
-
- G—PHYSICS
- G06—COMPUTING OR CALCULATING; COUNTING
- G06V—IMAGE OR VIDEO RECOGNITION OR UNDERSTANDING
- G06V2201/00—Indexing scheme relating to image or video recognition or understanding
- G06V2201/10—Recognition assisted with metadata
Definitions
- the invention relates to a method for performing data analysis for plant phenotyping of single plants in a field and a data acquisition and evaluation system for performing data analysis for plant phenotyping of single plants in a field. Further, the invention relates to a mobile platform for use in said method and/or in said data acquisition and evaluation system and a use of the mobile platform in said method and/or in said data acquisition and evaluation system.
- Phenotyping generally relates to a process of measuring, describing and analyzing characteristics of plants like yield, stress resistance (e.g. disease resistance) or herbicide tolerance and is usually carried out in applied plant breeding for a better understanding of gene functions and gene effects, since the genotype and the phenotype often do not correlate directly.
- a genotype of a plant is a DNA sequence of the genetic makeup determining a phenotype of the plant.
- the plant phenotype describes observable physical or biochemical characteristics of the plant and is determined by the genotype as well as inherited epigenetic factors and non-inherited environmental influences. Some genes can express a given phenotype in certain environmental conditions. On the contrary, some phenotypes can be the result of several genotypes.
- the identification of agronomic traits is usually done by phenotypic selection. Therefore, the traits, which can be determined before harvesting or independent of harvesting, are often estimated by visual rating and collated in a defined grading scale. For this purpose, breeders have to visit numerous trial parcels which are often physically distant or even global distributed. Besides, the phenotyping shall be performed at all trial parcels within a certain period. Therefore, the visual rating has to be carried out in parallel by many different breeders. Due to the subjective nature of the visual rating, grading may differ according to the breeder. The visual rating can often be influenced by different types of visual rating and/or an amount of plants to be evaluated and/or different environmental conditions of the regions in which the plants are grown.
- Another disadvantage is that certain phenotype characteristics cannot be detected visually and/or are dependent on environmental conditions.
- insufficient distinct traits which are often not visually detectable, may be required for genotyping of plants and for gaining a better understanding of the function and effects of genes.
- the low cost unmanned aerial systems are used for rapid proximal measurement of plants and high-resolution measurements for small plot research. Therefore, the low cost unmanned aerial systems comprise an unmanned aerial system platform for data capturing and a three-band multispectral sensor for measuring vegetation indices (see Haghighattalab et al., "Application of unmanned aerial systems for high-throughput phenotyping of large wheat breeding nurseries.” Plant methods 12.1 (2016): 35 .).
- the data analysis of the low cost unmanned aerial system works semi-automated and the allocation of image data to plot information runs by ground control points.
- spectral data have to be captured under artificial and homogenous conditions, for example horizontally fixed leaves to ensure homogenous light conditions.
- a spectral data analysis has to be performed by a pixel-wise mapping method using disease-specific signatures and spectral angle mapper classification.
- Spectrometers of the type FieldSpec and Agricultural Digital Camera are used for manually measurement of Cercospora infestation severity (see Jansen et al. "Non-invasive spectral phenotyping methods can improve and accelerate Cercospora disease scoring in sugar beet breeding.” Agriculture 4.2 (2014): 147-158 .).
- the analysis of spectra is executed either by estimating the disease severity in pixel ration between NDVI indices values above 0.1 or under 0.1 or by calculating different vegetation indices with spectral information on plot level. This method has the disadvantage that the aimed spectral indices are not disease-specific.
- the described prior art methods all have different disadvantages.
- the prior art methods are not suitable for a high-throughput and high-resolution phenotyping of single plants in field conditions.
- a method for performing data analysis for plant phenotyping of single plants in a field comprising the steps of capturing spectral data via a hyperspectral imaging sensor, capturing image data via an image sensor, capturing georeference data via an inertial measurement unit, preferably via a GNSS aided inertial measurement unit, spatializing the image data to generate georeferenced image data and a digital surface model, spatializing the spectral data, generating georeferenced spectral data based on the spatialized spectral data and the digital surface model and overlaying the georeferenced image data and the georeferenced spectral data with field plan information to generate a high-resolution analysis data set.
- the method is suitable for performing data analysis for plant phenotyping of single plants in a field.
- the field can be a trial field or a production-scale field for growing numerous plants of one genotype or several genotypes and/or for growing numerous plants of one phenotype or several phenotypes.
- the production-scale field usually has a size, which is multiple times the size of the trial field, wherein the usually much smaller trial field is used for performing field trials.
- plant phenotyping can also be referred to phenotyping in short.
- Phenotyping is in particular understood as an overall process for detecting and/or identifying morphological and physical characteristica of plants to determine a phenotype.
- the phenotype is the composite of observable plant traits, for example a plant height, a plant counting, a row closure, a biomass, fruit/seed yield, leave diseases, insect damages, herbicide tolerance, virus infections by symptoms and abiotic stress effects.
- the method implies a single plant resolution.
- phenotyping preferably comprises performing data analysis, which can include capturing of data and/or further steps of processing data.
- phenotyping comprises a step of phenotyping analysis.
- phenotyping analysis is performed after processing data and/or after generating an analysis data set.
- Phenotyping analysis can be a final step in phenotyping.
- the method described herein provides an automated single plant phenotyping and is preferably a high-throughput process. This has the advantage that the phenotype of single plants of numerous fields which are globally distributed can be detected at the same time and the detected phenotypes can be compared preferably at one main server.
- the data analysis principle is based on a process to analyze captured data to allow phenotyping of the single plants, which grow in the field. Therefore, three different sensors are applied for capturing the spectral data, the image data and the georeference data as described hereinafter.
- the hyperspectral imaging sensor is intended for capturing the spectral data
- the image sensor is intended for capturing the image data
- the inertial measurement unit is intended for capturing the georeference data.
- the hyperspectral imaging sensor and/or the image sensor and/or the inertial measurement unit may also be referred to as sensor unit(s).
- the hyperspectral imaging sensor and/or the image sensor can preferably be realized as an electro-magnetic sensor.
- the hyperspectral imaging sensor and/or the image sensor and/or the inertial measurement unit are arranged and/or adapted to capture the data from above.
- the hyperspectral imaging sensor and/or the image sensor and/or the inertial measurement unit are situated above a canopy of the plants while data capturing, preferably up to 1 m, 2 m, 3 m, 5 m, 10 m, 20 m, 30 m, 40 m, 50 m, 75 m or 100 m above the canopy of the plants.
- the captured data preferably show the plants from top in a vertical view or a diagonal view from above.
- the method can be used for all crops.
- the suitability for certain traits is given in particular by the possibility to monitor these traits via sensors by capturing a canopy surface. Therefore, the manifestation of the traits preferably occurs in the canopy of the plants.
- the hyperspectral imaging sensor and/or the image sensor and/or the inertial measurement unit are attached at an underside of a platform, wherein preferably the platform is a mobile platform.
- the mobile platform is movable, in particular horizontally moveable in parallel of the field ground, wherein its underside facing the field ground.
- the hyperspectral imaging sensor collects and processes information from across the electromagnetic spectrum for obtaining the spectrum for each pixel in an image of the field, with the purpose of identifying and detecting plant traits.
- the hyperspectral imaging sensor can be integrated into a push broom scanner.
- the hyperspectral imaging sensor principle is based on dividing images into spectral bands, in particular dividing images into spectral bands that can be extended beyond the visible. Captured spectral data preferably have a high spectral resolution as well as wavelength accuracy and cover a wired range of wavelengths.
- the hyperspectral imaging sensor preferably measures contiguous spectral bands and captures the plants using a large portion of the electromagnetic spectrum.
- the large portion may encompass more than 200 nm, 300 nm, 400 nm, 500 nm, 600 nm, 700 nm, 800 nm, 900 nm or 1000 nm.
- plant traits have unique fingerprints in the electromagnetic spectrum. Known as spectral signatures, these fingerprints enable identification of the plant traits of single plants of the field. It is particularly preferred that the captured spectral data are high-resolution.
- the image sensor in particular detects and conveys information that constitutes an image of single plants of the field, preferably by converting the variable attenuation of light waves, preferably visible light waves, into signals, small bursts of current that convey the information.
- the waves can be light or other electromagnetic radiation. It is particularly preferred that the captured image data are high-resolution.
- the inertial measurement unit preferably is a spatial combination of several inertial sensors for motion detection, e.g. accelerate sensors and rotational speed sensors.
- the inertial measurement unit can also be used for stabilization of the mobile platform.
- the captured georeference data are high-resolution.
- the georeference data can be digital information that can be assigned to a specific location on the field ground, e.g. spatial coordinates (such as GPS coordinates).
- georectification of the captured spectral data and the captured image data is carried out by spatializing.
- the captured georeference data are used for merging captured data and allocating the captured data to a field and/or a single plant of the field.
- Outcomes of spatializing the image data are georeferenced image data and a digital surface model.
- the georeferenced image data and a digital surface model are high-resolution.
- the digital surface model is preferably generated by using an algorithm for combining data of 2D images to 3D images or pseudo 3D images, for example while merging 2D image data to produce a geotiff.
- the digital surface model includes some height information describing an orientation and/or direction of growth of the plant and/or its leaves as well as a height of the plant. These height information are particularly preferred for analyzing the spectral data.
- the digital surface model is used to spatialize the spectral data for generating georeferenced spectral data.
- the georeferenced image data and/or the georeferenced spectral data can be assigned to the fields, field sectors or even single plants or part of single plants.
- a further step comprises overlaying the georeferenced image data and the georeferenced spectral data with the field plan information to generate a high-resolution analysis data set, preferably by using a merging algorithm.
- the georeferenced image data and/or the georeferenced spectral data are high-resolution.
- the field plan information preferably comprise information for defining field locations and field dimensions, in particular field piece information for defining field piece locations and field piece dimensions.
- the step of overlaying the georeferenced image data and the georeferenced spectral data with the field plan information comprises an elimination of interferences which are originated from different background conditions, e.g. sunlight, clouds, temperature, differences in a size, a scale which can be originated from using different lenses and/or sensors as well as changes in physical position.
- the field plan information and/or the captured data are high-resolution and as a consequence also the digital surface model and/or the georeferenced spectral data and/or the georeferenced image data.
- the method can incorporate a highest ground resolution and/or a single plant resolution and/or a geospatial resolution.
- the high-resolution method allows localizing single plants or parts of single plants, preferably in the range of 25 cm, 20 cm, 15 cm, 10 cm, 5 cm, 3 cm, 2 cm or 1 cm around its real position.
- the method has the advantage that the high-resolution data sets are easy to handle and comparable. It also can foster a faster and more effective data analysis.
- the method is suitable for a high-throughput and standardized procedures.
- the method can further comprise a step of phenotyping analysis.
- phenotyping analysis is used to identify plant traits.
- the step of phenotyping analysis preferably comprises analyzing the high-resolution analysis data set for identifying plant traits.
- the analysis data set and/or the analyzed analysis data assigned to the plant trait can be saved in a database.
- the generated analysis data set can be automatically assigned to the plant traits by comparing the analysis data set with reference data sets which are saved in the database.
- the high-resolution analysis data set can be characterized and plant traits can be determined by means of a database analysis.
- further information of the analysis data can be saved in the database which is used for the database analysis, e.g. location of the field, date, time of the day, time of the year, environmental conditions, etc.
- the plant traits can be measured quantitatively and analyzed non-destructively.
- the combination of the sensor units may identify a color, a size, a shape and/or a temperature of the leaves while a location, a size and/or a plant population are supplied by the field plan information.
- the image sensor is a color sensor.
- a color sensor can be used for the selective detection and evaluation of the visible spectral range.
- Such color sensors can be provided for instance in the form of a LAB color sensor, a RGB (red-green-blue) sensor or a true color sensor.
- the principle of an image of the color sensor is preferably based on a color filter array or a color mosaic array for capturing color information.
- the color filter filters the light by wavelength range such that separate filtered intensities include information about the color of light.
- the image sensor is a RGB sensor.
- the RGB sensor - also called Bayer filter - is an example of above mentioned color filters and gives information about the intensity of light in red, green and blue wavelength regions.
- a raw image data captured by said RGB Sensor can be converted to a full-color image by a demosaicing algorithm.
- RGBE filter CYYM filter
- CYGM filter CYGM filter
- RGBW Bayer filter RGBW #1 filter
- RGBW #2 filter RGBW #3 filter
- X-Trans filter X-Trans filter
- the image data comprise a plurality of images of at least one field sector, wherein each image comprises a plurality of picture elements.
- One picture element is preferably one part of image capturing which correspond to one field piece according to high-resolution.
- the plurality of picture elements can be set into grids, e.g. one, two or more lines comprising multiple picture elements.
- the field sector can preferably be a part of the field which is captured via one image capturing, wherein the image capturing comprises multiple field pieces and multiple picture elements.
- the field sector can describe one part of the field captured with one image capturing and comprise multiple picture elements.
- spatializing the image data comprises assigning spatial coordinates to the image data and preferably spatially correcting the image data.
- spatial information can be assigned to individual image pixels.
- This embodiment generates high-resolution georeferenced image data for phenotyping of single plants in a field.
- the spatial correction has the advantage that possible inaccuracies can be corrected to ensure the most accurate spatial information of each individual image pixel.
- spatializing the image data comprises assigning spatial coordinates to the image data and spatially correcting the image data.
- spatializing the spectral data comprises assigning spatial coordinates to spectral data and preferably spatially correcting the spectral data.
- spatial information can be assigned to individual spectral image elements.
- This embodiment generates high-resolution spatialized spectral data for phenotyping of single plants in a field.
- the spatial correction has the advantage that possible inaccuracies can be corrected to ensure the most accurate spatial information of each spectral image element.
- spatializing the spectral data comprises a first step of spatializing the spectral data, which comprises assigning spatial coordinates to spectral data and preferably radiometrically correcting the spectral data and preferably a second step of spatializing the spectral data, which comprises spatially correcting the spectral data.
- spatializing the spectral data comprises assigning spatial coordinates to spectral data and spatially correcting the spectral data.
- a first step of spatializing the spectral data comprises assigning spatial coordinates to spectral data and radiometrically correcting the spectral data and a second step of spatializing the spectral data comprises spatially correcting the spectral data.
- Radiometric correction can preferably reduce or corrects radiometric errors or distortions. This process can improve the interpretability and quality of remote sensed data. Radiometric correction is particularly preferred when comparing captured data over a multiple time periods. The emitted or reflected electromagnetic energy from a surface of the field ground that is observed by a sensor onboard mobile platform does not coincide with the energy emitted or reflected from the same surface observed from a short distance because of the sun's azimuth and evaluation and atmospheric conditions.
- radiometric correction can correct effects due to sensor sensitivity, sun angle and topography and/or absorptions and scattering of solar radiation caused by various atmospheric effects.
- the field plan information comprise field information for defining field locations and field dimensions, in particular field piece information for defining field piece locations and field piece dimensions.
- the field plan information has a precision level of +/- 0.02 m, 0.03 m, 0.04 m, 0.6 m, 0.8 m, 0.10 m.
- the field plan information preferably comprises information of field splitting into field pieces, wherein said field pieces have dimensions to ensure capturing high-resolution data. It is preferably preferred that field pieces form a grid of the field.
- the georeference data and/or the georeferenced image data and/or the georeferenced spectral data comprise georeference coordinates.
- the allocation of captured image data and captured spectral data to field plan information runs automatically by using geolocation data, e.g. from a GPS system.
- overlaying the georeference spectral data and the georeferenced image data with the field plan information comprises an assignment of field piece information according to georeference coordinates.
- information of field pieces can be assigned to the captured spectral data and/or the captured image data.
- the field piece information can be for example an altitude preferably above the sea level, solar hours per day and/or per year, a soil type, etc.
- these field piece information can be considered in the step of phenotyping analysis.
- the method comprises the step of capturing additional data via at least one additional sensor, preferably via a thermal sensor and/or an electro-magnetic sensor.
- the additional data can additionally or alternatively be captured.
- the additional data can be overlaid with the image data, preferably in a way that both images are covering the whole plant in its position, and spatializing said overlaid data to generate the digital surface model and the georeferenced image data.
- the method can comprise the steps of generating georeferenced additional data by the use of georeference data for spatializing the additional data and overlaying the georeferenced additional data, georeferenced image data and georeferenced spectral data with the field plan information to generate a high-resolution analysis data set.
- captured additional data is processed equivalently to the image data.
- captured additional data can be spatialized to georeferenced additional data and a digital surface model.
- the georeferenced additional data can preferably be overlaid with field plan information and the georeferenced spectral data to generate a high-resolution data set.
- the additional sensor is a thermal sensor, preferably an IR (infrared) sensor, for capturing thermal data.
- temperatures of different plant parts or plants compared to their controls are correlated at different time points during development with a genomic database.
- Merging of image data and thermal data preferably is a segmentation process to separate between plants or parts thereof and background like soil, assign leaves to individual plants and ascertain the quality of infections or drought or osmotic stress.
- the additional sensor is an electromagnetic sensor, preferably a SWIR (short-wavelength infrared) camera for capturing short waved infrared data.
- SWIR short-wavelength infrared
- generating the digital surface model comprises multiple recording of an individual picture element by capturing the image data and combining said multiple recorded individual picture elements to a three dimensional image. If applicable - alternatively or additionally - generating the digital surface model can preferably comprise multiple recording of an individual picture element by capturing the additional data and combining said multiple recorded individual picture elements to a three dimensional image.
- multiple recording can describe recording one individual picture element at least double or triple or quadruple or multiple from one perspective in different color and/or wavelength ranges.
- multiple recording can preferably describe recording one individual picture element at least double or triple or quadruple or multiple from different perspectives. It is preferred that the multiple recording can be made while moving the hyperspectral image sensor and/or the image sensor and/or the inertial measurement unit and/or the additional sensor above the field.
- the three dimensional data image can be produced by merging image data to produce a geotiff, wherein the three dimensional data image can include some height information.
- the method preferably comprises the step of using a computer algorithm for phenotyping, in particular phenotyping analysis, that preferably identifies direct traits, leave diseases, insect damages, virus infections by symptoms and/or abiotic stress effects.
- direct traits can be a plant height, a plant counting, a row closure, a biomass, fruit/seed yield, herbicide tolerance and/or abiotic stress effects can caused by nutrient limitation, environmental temperature, exposure to environmental toxins (e.g. ozone or heavy metals) and/or drought or osmotic stress.
- the computer algorithm processes the analysis data set by accessing and/or analyzing a database which preferably comprises reference data sets to be able to determine plant traits as well as the phenotype of the plant. Therefore, the computer algorithm is preferably adapted to consider the analysis data set in relation to reference data sets which are stored in the database.
- Plant traits of interest are usually defined and demanded by the breeders.
- traceability e.g. correlation, heritability
- data traceability may be calculated, e.g. correlation of measured and processed data to the plant trait. Data can be evaluated without knowing the plant genotype.
- the hyperspectral imaging sensor for capturing spectral data and/or the image sensor for capturing image data and/or the inertial measurement unit for capturing georeference data and/or the additional sensor are arranged on a mobile platform.
- the mobile platform is movable, in particular horizontally moveable in parallel of the field ground, wherein its underside facing the field ground. This embodiment has the advantage that data can be captured while moving the mobile platform above the field.
- the mobile platform is a ground-based device and/or an aerial device, preferably an autonomous mobile platform.
- an autonomous mobile platform is an unmanned mobile platform and/or can be remote-controlled.
- This embodiment provides for a particularly easy and time-efficient way to capture data for performing data analysis for plant phenotyping of single plants in a field.
- the mobile platform can be moved horizontally in parallel of the field ground, preferably at an altitude up to 1 m, 2 m, 3 m, 5 m, 10 m, 20 m, 30 m, 40 m, 50 m, 75 m or 100 m above the canopy of the plants.
- the hyperspectral imaging sensor for capturing spectral data and/or the image sensor for capturing image data and/or the inertial measurement unit for capturing georeference data and/or the additional sensor are arranged on a mobile platform, wherein the mobile platform is a ground-based device and/or an aerial device, preferably an autonomous mobile platform.
- the ground-based device can be for example a tractor, a robot or an automat.
- An example of the aerial device is a drone.
- the method comprises the step of creating a motion schedule for the autonomous mobile platform.
- This embodiment provides an automatic motion of the autonomous mobile platform.
- a motion path should be straight while a traverse direction of the autonomous mobile platform above the ground should be preferably north to south or south to north.
- the motion schedule provides preferably that one motion at one timepoint is sufficient for capturing all necessary data. Nevertheless, several measurement timepoints per vegetation period and/or per year can be intended.
- the mobile platform can be automatically controlled on the basis of the previously created motion schedule. Therefore, the mobile platform can be preferably connected with a control unit for controlling the movement of the mobile platform.
- motion data of an actual movement of the mobile platform can be captured during the motion of the mobile platform in accordance with the motion schedule.
- Actual movement data and the data of the motion schedule can differ, e.g. due to environmental conditions.
- This preferred embodiment has the advantage that variations can be recognized for being taken into account in the evaluation of the data or for signalizing these variations in such a way as to enable an operator to take control of the movement.
- the inertial measurement unit is adapted for capturing factual circumstances for comparing said factual circumstances with the considered influencing factors.
- creating the motion schedule should consider several influence factors, which can have a major impact on the high-resolution data.
- a height, a speed and/or the sensors can be influence factors.
- requirements of the sensor units as well as of the data storage are considered while creating the motion schedule.
- the movement of the mobile platform preferably is at an altitude of approximately 2 to 50 meters preferably at an altitude of approximately 25 meters.
- An optimal altitude of the movement depends on a lens and/or sensor properties, especially on the minimum required focus distance.
- a resulting size of the analyzed object in a captured image can be a factor limiting distance to the ground.
- Another speed-limiting factor can be the integration time of the hyperspectral imaging sensor.
- the integration time is adjusted manually or automatically to the ambient light conditions.
- This embodiment is, inter alia, based on the finding that the required ground resolution can depend on the application.
- the ground resolution can be optimized to a fine ground resolution if very small structures, e.g. single leaves, have to be spatially recognized.
- a lower ground resolution can be sufficient if the spectral information have to be spatially distinguishable on the plot.
- the speed of the movement can be adjusted.
- the method comprises pre -processing and/or processing the data on the mobile platform and/or an agricultural station and/or a main server during the operating process and/or in a separate step, which can be offline.
- Pre-processing can be understood as a part of processing. Processing the data in particular refers to performing data analysis for plant phenotyping.
- pre-processing can comprise spatializing the image data to generate georeferenced image data and a digital surface model and/or spatializing the spectral data and/or generating georeferenced spectral data based on the spatialized spectral data and the digital surface.
- establishing a relation between a picture element and a position data can be performed in a separate step offline or real time, e.g. by using a real time tracking (turf) algorithm.
- turf real time tracking
- the agricultural station can be adapted for pre-processing and/or processing captured data.
- the agricultural station can be preferably located at the field or in vicinity of the field, wherein the vicinity of the field describe a distance of up to 50 km, 40 km, 30 km, 20 km, 10 km, 5 km or 1 km, preferably a maximum distance to the place of administration of the field.
- the agricultural station can comprise a memory unit for storage captured and/or pre-processed and/or processed data and particularly preferred a control unit for pre-processing and/or processing captured data.
- the control unit can be preferably adapted for controlling the mobile platform.
- the memory unit can be connected with the controlling unit and the mobile platform for storing and accessing the motion schedule.
- the main server can be adapted for processing captured data and/or pre-processed data.
- the main server can be preferably located at a main location of administration.
- the main server can comprise a memory unit for storage of captured and/or pre-processed and/or processed data and particularly preferred a control unit for processing captured data or pre-processed data.
- the control unit can be preferably adapted for controlling the mobile platform.
- the memory unit can be connected with the controlling unit and the mobile platform for storing and accessing the motion schedule.
- processing captured data can also comprise (further) processing pre-processed data.
- the method comprises pre-processing and/or processing the data individually for each imaged plant on the mobile platform and/or the agricultural station and/or the main server during the operating process.
- the mobile platform and/or the agricultural station and/or the main server comprise a memory unit for storing captured data and/or pre-processed data and/or processed data and/or the motion schedule and/or the field plan information.
- the captured data and/or the pre-processed data and/or the processed data are transferred from the mobile platform to the main server and/or from the agricultural station to the main server via a wire connection and/or a wireless connection.
- the mobile platform and/or the agricultural station and/or the main server comprise a wire connection and/or a wireless connection, preferably wlan and/or cable and/or usb and/or bluetooth, for transferring the captured data and/or the pre-processed data and/or the processed data from the mobile platform to the agricultural station and/or from the mobile platform to the main server and/or from the agricultural station to the main server.
- the mobile platform comprises a memory unit for storing captured data.
- the main server and/or the agricultural station can download said captured data for pre-processing and/or processing. Therefore, the mobile platform and/or the main server and/or the agricultural station comprise an interface, in particular for data transmission, preferably wireless data transmission.
- the data can be pre-processed already on the mobile platform during the operating process. In a further preferred embodiment the data can be pre-processed individually for each imaged plant on the mobile platform during the operating process.
- a data acquisition and evaluation system for performing data analysis for plant phenotyping of single plants in a field, comprising a hyperspectral imaging sensor for capturing spectral data, an image sensor for capturing image data, an inertial measurement unit for capturing georeference data and a control unit, which is adapted to spatialize the image data to generate georeferenced image data and a digital surface model, spatialize the spectral data, generate georeferenced spectral data based on the spatialized spectral data and the digital surface model, overlay the georeferenced image data and georeferenced spectral data with field plan information to generate a high-resolution analysis data set.
- a mobile platform using in at least one method and/or in a data acquisition and evaluation system as described herein, comprising a hyperspectral imaging sensor for capturing spectral data, an image sensor for capturing image data and an inertial measurement unit for capturing georeference data.
- the mobile platform is preferably an autonomous mobile Platform.
- the mobile platform can be an autonomous mobile platform.
- a mobile platform according to a method and/or a data acquisition and evaluation system and/or a mobile platform as described herein.
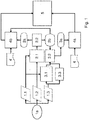
- Figure 1 shows a schematic flow diagram of the method for performing data analysis for plant phenotyping of single plants in a field is shown.
- the flow diagram describes the processing of data after capturing these data 1a.
- the processing can be performed on the mobile platform, an agricultural station and/or a main server.
- pre-processing which is a part of processing, can be performed on the mobile platform, wherein the remaining part of processing can be performed on the agricultural station and/or the main server, and/or the agricultural station, wherein the remaining part of processing can be performed on the main server.
- the method describes steps of processing after capturing georeference data 1.1 via an inertial measurement unit, image data 1.2 via an image sensor and spectral data 1.3 via a hyperspectral imaging sensor.
- the first step according to Fig. 1 is spatializing the image data 2.1, 2.2 and spatializing the spectral data 3.1, 3.2, 3.3.
- Spatializing the image data 2.1, 2.2 comprises assigning spatial coordinates to the image data 2.1 and spatially correcting the image data 2.2 to generate georeferenced image data 2a and a digital surface model 2b by using the georeference data 1.1.
- Spatializing the spectral data 3.1, 3.2, 3.3 comprises assigning spatial coordinates to spectral data 3.1, a radiometric correction 3.3 and spatial correction 3.2 of the spectral data 1.3.
- the spectral data 1.3 where spatialized by using.
- the next step of the method according to Fig. 1 comprises overlaying the georeferenced image data 2a and the georeferenced spectral data 3a with field plan information 4 to generate a high-resolution analysis data set by assigning of plot information according to geo coordinates 4a, 4b.
- a phenotyping analysis 5 the high-resolution analysis data set is analyzed for identifying plant traits.
- the high-resolution analysis data set can be characterized and plant traits can be determined by means of a database analysis.
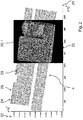
- Fig. 2 shows a field sector 20.1 in geotiff format 20 recorded by an aerial device, which is overlaid with the corresponding field plan information 4 for analyzing single plants in this field sector 20.1.
- the field plan information 4 are mapped out as a shapefile defining the plot locations as well as dimensions and cover plots which are not part of the geotiff.
- axes 21, 22 of the field plan information 4 indicate the north/south and the east/west position of plots and region, which are covered by the image.
- the scale of the easting axis 21 and the northing axis 22 is meters of a distance to a reference point line.
- the field plan information 4 define a field splitting into field pieces 23 which have dimensions to ensure capturing high-resolution data. These field pieces 23 form a grid of the field.
- the field plan information 4 shows blocks 25 which comprise multiple lines 24 of field pieces 23, wherein each line 24 comprises multiple field pieces 23.
- segmentation 32 for separating between a plant 33 and a background 34 can be made by merging captured data. During processing the data captured via different sensor units are preferably merged. Hereby, differences in size, scale often originating from using different lenses and/or sensor units, changes in physical position as well as interferences origination from different environmental conditions, e.g. sunlight, clouds, temperature, etc, can be eliminated.
- Fig. 3 shows a thermography 30.1 and a RGB image 30.2 of a maize plant 33 which are merged 31 and segmented 32. This segmentation 32 separates the maize plant 33 from the background 34 to assign leaves 35 of the plant 33 and preferably to ascertain the quality and/or quantity of infections or drought or osmotic stress.
- a measurement of a pathogen infection is made by merging.
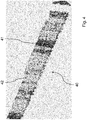
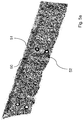
- Fig. 4 shows an image of a field 40 after merging captured spectral data and captured RGB data as described above. Due to high ground resolution and known geospatial sensor information it is possible to get information about single plants. The information which are received from one data-capturing-process can be used to setup a time resolved series of the plant and/or trait development during a vegetation period. A visual indication of e.g. different plant traits 41, 42 provides a high-resolution and a less subjective phenotyping analysis. Due to the visual indications, the soil, healthy leaves and leaf diseases can be differentiated. Plant traits as well as the soil often have unique fingerprints in the electromagnetic spectrum. Known as spectral signatures, these fingerprints enable identification of the plant traits of single plants of the field.
- Fig. 5a the soil 50, healthy leaves 51 and leaf diseases 52 are marked.
- the detection of plant traits can be achieved by comparing each pixel-spectrum with a database, in which reference spectra of different plant traits are deposed.
- Spectral data allow a differentiation of pixels by its underlying chemical composition. Plants, part of the plants or other targets can show the same visual color while having completely different chemical components, e.g. a brown soil and a brown necrotic leaf tissue.
- a spectral comparison shows that if a similarity of the spectra is high enough the pixel can be classified as "leaf disease”-pixel.
- a x-axis 55 scale is wavelength in nm and a y-axis 56 scale is a normalized intensity.
- Fig. 6 shows an example of a single plant analysis.
- the method captures contours 60 and midpoints 61 of the biomass distribution 62 of single plants. Therefore, the method provides the possibility to measure the biomass for single plants. Further, a growth rate of single plants can be calculated on basis of time series biomass measurements.
- a leaf coverage and/or biomass can be measured by comparing captured and merged data of single plants in one trial plot with a spectral reference scale 70.
- the figure shows single plants in different stages of development.
- the upper part of the trial plot 71 comprises a canopy between neighbored plants which has been partially closed already.
- the canopy is often an important parameter for plants.
- Canopy closure which describes that a gap between neighbored plants is closed, is crucial for weed control because weed plants growing between the plants competes often with the plants for nutrients and sunlight. In this way, the canopy closure can often hamper the growth of weed plants significantly.
Landscapes
- Engineering & Computer Science (AREA)
- Life Sciences & Earth Sciences (AREA)
- Physics & Mathematics (AREA)
- Chemical & Material Sciences (AREA)
- Health & Medical Sciences (AREA)
- Analytical Chemistry (AREA)
- General Health & Medical Sciences (AREA)
- General Physics & Mathematics (AREA)
- Theoretical Computer Science (AREA)
- Proteomics, Peptides & Aminoacids (AREA)
- Spectroscopy & Molecular Physics (AREA)
- Multimedia (AREA)
- Bioinformatics & Cheminformatics (AREA)
- Organic Chemistry (AREA)
- Biotechnology (AREA)
- Wood Science & Technology (AREA)
- Biochemistry (AREA)
- Immunology (AREA)
- Zoology (AREA)
- Genetics & Genomics (AREA)
- Pathology (AREA)
- Botany (AREA)
- Biophysics (AREA)
- Molecular Biology (AREA)
- Remote Sensing (AREA)
- General Engineering & Computer Science (AREA)
- Medical Informatics (AREA)
- Microbiology (AREA)
- Mycology (AREA)
- Medicinal Chemistry (AREA)
- Bioinformatics & Computational Biology (AREA)
- Evolutionary Biology (AREA)
- Food Science & Technology (AREA)
- Mechanical Engineering (AREA)
- Soil Sciences (AREA)
- Environmental Sciences (AREA)
- Management, Administration, Business Operations System, And Electronic Commerce (AREA)
- Investigating Or Analysing Materials By Optical Means (AREA)
- Image Processing (AREA)
Abstract
Description
- The invention relates to a method for performing data analysis for plant phenotyping of single plants in a field and a data acquisition and evaluation system for performing data analysis for plant phenotyping of single plants in a field. Further, the invention relates to a mobile platform for use in said method and/or in said data acquisition and evaluation system and a use of the mobile platform in said method and/or in said data acquisition and evaluation system.
- Phenotyping generally relates to a process of measuring, describing and analyzing characteristics of plants like yield, stress resistance (e.g. disease resistance) or herbicide tolerance and is usually carried out in applied plant breeding for a better understanding of gene functions and gene effects, since the genotype and the phenotype often do not correlate directly. A genotype of a plant is a DNA sequence of the genetic makeup determining a phenotype of the plant. The plant phenotype describes observable physical or biochemical characteristics of the plant and is determined by the genotype as well as inherited epigenetic factors and non-inherited environmental influences. Some genes can express a given phenotype in certain environmental conditions. On the contrary, some phenotypes can be the result of several genotypes.
- The identification of agronomic traits is usually done by phenotypic selection. Therefore, the traits, which can be determined before harvesting or independent of harvesting, are often estimated by visual rating and collated in a defined grading scale. For this purpose, breeders have to visit numerous trial parcels which are often physically distant or even global distributed. Besides, the phenotyping shall be performed at all trial parcels within a certain period. Therefore, the visual rating has to be carried out in parallel by many different breeders. Due to the subjective nature of the visual rating, grading may differ according to the breeder. The visual rating can often be influenced by different types of visual rating and/or an amount of plants to be evaluated and/or different environmental conditions of the regions in which the plants are grown.
- For time reasons and the enormous amount of work, breeders often determine an average grade for one trial plot which comprises numerous plants. A disadvantage is that the visual rating does not allow any conclusion about phenotype differences within the one trial plot. Furthermore, there is no exact measuring, describing and analyzing of characteristics and diseases of single plants.
- Another disadvantage is that certain phenotype characteristics cannot be detected visually and/or are dependent on environmental conditions. In particular, insufficient distinct traits, which are often not visually detectable, may be required for genotyping of plants and for gaining a better understanding of the function and effects of genes.
- While some prior art methods are able to provide comprehensive information about the traits of analyzed plants, these methods often involve the destruction of the observed plants or part of the plants and often require an amount of work which is time-consuming and cost-intensive.
- For instance, low cost unmanned aerial systems are used for rapid proximal measurement of plants and high-resolution measurements for small plot research. Therefore, the low cost unmanned aerial systems comprise an unmanned aerial system platform for data capturing and a three-band multispectral sensor for measuring vegetation indices (see Haghighattalab et al., "Application of unmanned aerial systems for high-throughput phenotyping of large wheat breeding nurseries." Plant methods 12.1 (2016): 35.). The data analysis of the low cost unmanned aerial system works semi-automated and the allocation of image data to plot information runs by ground control points.
- For laboratory environment, the use of hyperspectral imaging for small-scale analysis of symptoms caused by different sugar beet diseases has been tested (see Mahlein et al., "Hyperspectral imaging for small-scale analysis of symptoms caused by different sugar beet diseases." Plant methods 8.1 (2012): 3.). In this method, spectral data have to be captured under artificial and homogenous conditions, for example horizontally fixed leaves to ensure homogenous light conditions. A spectral data analysis has to be performed by a pixel-wise mapping method using disease-specific signatures and spectral angle mapper classification.
- Spectrometers of the type FieldSpec and Agricultural Digital Camera are used for manually measurement of Cercospora infestation severity (see Jansen et al. "Non-invasive spectral phenotyping methods can improve and accelerate Cercospora disease scoring in sugar beet breeding." Agriculture 4.2 (2014): 147-158.). The analysis of spectra is executed either by estimating the disease severity in pixel ration between NDVI indices values above 0.1 or under 0.1 or by calculating different vegetation indices with spectral information on plot level. This method has the disadvantage that the aimed spectral indices are not disease-specific.
- The described prior art methods all have different disadvantages. In particular, the prior art methods are not suitable for a high-throughput and high-resolution phenotyping of single plants in field conditions.
- Therefore, it is an object of the present invention to provide a method and a data acquisition and evaluation system for performing data analysis for plant phenotyping of single plants in a field as well as a mobile platform and the use of the mobile platform in said method and/or in said data acquisition and evaluation system, which reduce or eliminate one or more of the above-mentioned disadvantages. In particular, it is an object of the present invention to provide a method and a data acquisition and evaluation system for performing data analysis for plant phenotyping of single plants in a field as well as a mobile platform and the use of the mobile platform in said method and/or in said data acquisition and evaluation system, which enable a reliable and/or time-efficient determination of plant traits.
- According to a first aspect of the invention, it is provided a method for performing data analysis for plant phenotyping of single plants in a field, comprising the steps of capturing spectral data via a hyperspectral imaging sensor, capturing image data via an image sensor, capturing georeference data via an inertial measurement unit, preferably via a GNSS aided inertial measurement unit, spatializing the image data to generate georeferenced image data and a digital surface model, spatializing the spectral data, generating georeferenced spectral data based on the spatialized spectral data and the digital surface model and overlaying the georeferenced image data and the georeferenced spectral data with field plan information to generate a high-resolution analysis data set.
- The method is suitable for performing data analysis for plant phenotyping of single plants in a field. In particular, the field can be a trial field or a production-scale field for growing numerous plants of one genotype or several genotypes and/or for growing numerous plants of one phenotype or several phenotypes. The production-scale field usually has a size, which is multiple times the size of the trial field, wherein the usually much smaller trial field is used for performing field trials.
- Herein, plant phenotyping can also be referred to phenotyping in short. Phenotyping is in particular understood as an overall process for detecting and/or identifying morphological and physical characteristica of plants to determine a phenotype. The phenotype is the composite of observable plant traits, for example a plant height, a plant counting, a row closure, a biomass, fruit/seed yield, leave diseases, insect damages, herbicide tolerance, virus infections by symptoms and abiotic stress effects. For measuring said observable plant traits, the method implies a single plant resolution. Herein, phenotyping preferably comprises performing data analysis, which can include capturing of data and/or further steps of processing data. Further preferably, phenotyping comprises a step of phenotyping analysis. Usually, phenotyping analysis is performed after processing data and/or after generating an analysis data set. Phenotyping analysis can be a final step in phenotyping.
- Inter alia, finding a plant phenotype results from an expression of a plant genotype as well as the influence of environmental factors. Therefore, several phenotypes of plants having the same genotype occur due to a location of the field on which the plants are grown. For comparing an influence of the environmental factors, the method described herein provides an automated single plant phenotyping and is preferably a high-throughput process. This has the advantage that the phenotype of single plants of numerous fields which are globally distributed can be detected at the same time and the detected phenotypes can be compared preferably at one main server.
- It is particularly preferred to perform data analysis to generate a high-resolution analysis data set for plant phenotyping, in particular data analysis as further detail below. The data analysis principle is based on a process to analyze captured data to allow phenotyping of the single plants, which grow in the field. Therefore, three different sensors are applied for capturing the spectral data, the image data and the georeference data as described hereinafter.
- The hyperspectral imaging sensor is intended for capturing the spectral data, the image sensor is intended for capturing the image data and the inertial measurement unit is intended for capturing the georeference data. Herein, the hyperspectral imaging sensor and/or the image sensor and/or the inertial measurement unit may also be referred to as sensor unit(s). Further, herein the hyperspectral imaging sensor and/or the image sensor can preferably be realized as an electro-magnetic sensor.
- Preferably, the hyperspectral imaging sensor and/or the image sensor and/or the inertial measurement unit are arranged and/or adapted to capture the data from above. Further preferably, the hyperspectral imaging sensor and/or the image sensor and/or the inertial measurement unit are situated above a canopy of the plants while data capturing, preferably up to 1 m, 2 m, 3 m, 5 m, 10 m, 20 m, 30 m, 40 m, 50 m, 75 m or 100 m above the canopy of the plants. The captured data preferably show the plants from top in a vertical view or a diagonal view from above.
- Generally, the method can be used for all crops. The suitability for certain traits is given in particular by the possibility to monitor these traits via sensors by capturing a canopy surface. Therefore, the manifestation of the traits preferably occurs in the canopy of the plants.
- In particular, it is preferred that the hyperspectral imaging sensor and/or the image sensor and/or the inertial measurement unit are attached at an underside of a platform, wherein preferably the platform is a mobile platform. The mobile platform is movable, in particular horizontally moveable in parallel of the field ground, wherein its underside facing the field ground.
- The hyperspectral imaging sensor collects and processes information from across the electromagnetic spectrum for obtaining the spectrum for each pixel in an image of the field, with the purpose of identifying and detecting plant traits. In particular, the hyperspectral imaging sensor can be integrated into a push broom scanner. The hyperspectral imaging sensor principle is based on dividing images into spectral bands, in particular dividing images into spectral bands that can be extended beyond the visible. Captured spectral data preferably have a high spectral resolution as well as wavelength accuracy and cover a wired range of wavelengths. The hyperspectral imaging sensor preferably measures contiguous spectral bands and captures the plants using a large portion of the electromagnetic spectrum. Typically, the large portion may encompass more than 200 nm, 300 nm, 400 nm, 500 nm, 600 nm, 700 nm, 800 nm, 900 nm or 1000 nm. Often plant traits have unique fingerprints in the electromagnetic spectrum. Known as spectral signatures, these fingerprints enable identification of the plant traits of single plants of the field. It is particularly preferred that the captured spectral data are high-resolution.
- The image sensor in particular detects and conveys information that constitutes an image of single plants of the field, preferably by converting the variable attenuation of light waves, preferably visible light waves, into signals, small bursts of current that convey the information. The waves can be light or other electromagnetic radiation. It is particularly preferred that the captured image data are high-resolution.
- The inertial measurement unit preferably is a spatial combination of several inertial sensors for motion detection, e.g. accelerate sensors and rotational speed sensors. The inertial measurement unit can also be used for stabilization of the mobile platform. It is particularly preferred that the captured georeference data are high-resolution. In particular, the georeference data can be digital information that can be assigned to a specific location on the field ground, e.g. spatial coordinates (such as GPS coordinates).
- After capturing above mentioned data, georectification of the captured spectral data and the captured image data is carried out by spatializing. The captured georeference data are used for merging captured data and allocating the captured data to a field and/or a single plant of the field. Outcomes of spatializing the image data are georeferenced image data and a digital surface model. In particular, the georeferenced image data and a digital surface model are high-resolution. The digital surface model is preferably generated by using an algorithm for combining data of 2D images to 3D images or pseudo 3D images, for example while merging 2D image data to produce a geotiff. In particular, the digital surface model includes some height information describing an orientation and/or direction of growth of the plant and/or its leaves as well as a height of the plant. These height information are particularly preferred for analyzing the spectral data.
- The digital surface model is used to spatialize the spectral data for generating georeferenced spectral data. Using the field plan information, the georeferenced image data and/or the georeferenced spectral data can be assigned to the fields, field sectors or even single plants or part of single plants.
- A further step comprises overlaying the georeferenced image data and the georeferenced spectral data with the field plan information to generate a high-resolution analysis data set, preferably by using a merging algorithm. Preferably, the georeferenced image data and/or the georeferenced spectral data are high-resolution. The field plan information preferably comprise information for defining field locations and field dimensions, in particular field piece information for defining field piece locations and field piece dimensions. In particular, the step of overlaying the georeferenced image data and the georeferenced spectral data with the field plan information comprises an elimination of interferences which are originated from different background conditions, e.g. sunlight, clouds, temperature, differences in a size, a scale which can be originated from using different lenses and/or sensors as well as changes in physical position.
- It is particularly preferred that the field plan information and/or the captured data are high-resolution and as a consequence also the digital surface model and/or the georeferenced spectral data and/or the georeferenced image data. In this way, generating a high-resolution analysis data set is facilitated. In particular, the method can incorporate a highest ground resolution and/or a single plant resolution and/or a geospatial resolution. The high-resolution method allows localizing single plants or parts of single plants, preferably in the range of 25 cm, 20 cm, 15 cm, 10 cm, 5 cm, 3 cm, 2 cm or 1 cm around its real position.
- The method has the advantage that the high-resolution data sets are easy to handle and comparable. It also can foster a faster and more effective data analysis. Advantageously, the method is suitable for a high-throughput and standardized procedures.
- In particular, the method can further comprise a step of phenotyping analysis. In particular, phenotyping analysis is used to identify plant traits. The step of phenotyping analysis preferably comprises analyzing the high-resolution analysis data set for identifying plant traits.
- In addition, the analysis data set and/or the analyzed analysis data assigned to the plant trait can be saved in a database. Further, the generated analysis data set can be automatically assigned to the plant traits by comparing the analysis data set with reference data sets which are saved in the database. In particular, the high-resolution analysis data set can be characterized and plant traits can be determined by means of a database analysis. Preferably, further information of the analysis data can be saved in the database which is used for the database analysis, e.g. location of the field, date, time of the day, time of the year, environmental conditions, etc.
- It is a further advantage of the method described herein that the plant traits can be measured quantitatively and analyzed non-destructively. In particular, the combination of the sensor units may identify a color, a size, a shape and/or a temperature of the leaves while a location, a size and/or a plant population are supplied by the field plan information.
- In particular, the image sensor is a color sensor. A color sensor can be used for the selective detection and evaluation of the visible spectral range. Such color sensors can be provided for instance in the form of a LAB color sensor, a RGB (red-green-blue) sensor or a true color sensor. The principle of an image of the color sensor is preferably based on a color filter array or a color mosaic array for capturing color information. The color filter filters the light by wavelength range such that separate filtered intensities include information about the color of light.
- According to a preferred embodiment, the image sensor is a RGB sensor. The RGB sensor - also called Bayer filter - is an example of above mentioned color filters and gives information about the intensity of light in red, green and blue wavelength regions. A raw image data captured by said RGB Sensor can be converted to a full-color image by a demosaicing algorithm.
- Further examples for above mentioned color filters are RGBE filter, CYYM filter, CYGM filter, RGBW Bayer filter, RGBW #1 filter, RGBW #2 filter, RGBW #3 filter or X-Trans filter.
- In particular, the image data comprise a plurality of images of at least one field sector, wherein each image comprises a plurality of picture elements. One picture element is preferably one part of image capturing which correspond to one field piece according to high-resolution. Particularly preferred, the plurality of picture elements can be set into grids, e.g. one, two or more lines comprising multiple picture elements. Generally, the field sector can preferably be a part of the field which is captured via one image capturing, wherein the image capturing comprises multiple field pieces and multiple picture elements. Preferably, the field sector can describe one part of the field captured with one image capturing and comprise multiple picture elements.
- In a preferred embodiment, spatializing the image data comprises assigning spatial coordinates to the image data and preferably spatially correcting the image data. Thus, spatial information can be assigned to individual image pixels. This embodiment generates high-resolution georeferenced image data for phenotyping of single plants in a field. The spatial correction has the advantage that possible inaccuracies can be corrected to ensure the most accurate spatial information of each individual image pixel.
- In particular, spatializing the image data comprises assigning spatial coordinates to the image data and spatially correcting the image data.
- It is further preferred that spatializing the spectral data comprises assigning spatial coordinates to spectral data and preferably spatially correcting the spectral data. Thus, spatial information can be assigned to individual spectral image elements. This embodiment generates high-resolution spatialized spectral data for phenotyping of single plants in a field. The spatial correction has the advantage that possible inaccuracies can be corrected to ensure the most accurate spatial information of each spectral image element.
- In a further preferred embodiment, spatializing the spectral data comprises a first step of spatializing the spectral data, which comprises assigning spatial coordinates to spectral data and preferably radiometrically correcting the spectral data and preferably a second step of spatializing the spectral data, which comprises spatially correcting the spectral data.
- Further preferably, spatializing the spectral data comprises assigning spatial coordinates to spectral data and spatially correcting the spectral data.
- It is further preferred that a first step of spatializing the spectral data comprises assigning spatial coordinates to spectral data and radiometrically correcting the spectral data and a second step of spatializing the spectral data comprises spatially correcting the spectral data. Radiometric correction can preferably reduce or corrects radiometric errors or distortions. This process can improve the interpretability and quality of remote sensed data. Radiometric correction is particularly preferred when comparing captured data over a multiple time periods. The emitted or reflected electromagnetic energy from a surface of the field ground that is observed by a sensor onboard mobile platform does not coincide with the energy emitted or reflected from the same surface observed from a short distance because of the sun's azimuth and evaluation and atmospheric conditions. Therefore, in order to obtain the real irradiance or reflectance, it is preferred to correct those radiometric distortions. For instance, radiometric correction can correct effects due to sensor sensitivity, sun angle and topography and/or absorptions and scattering of solar radiation caused by various atmospheric effects.
- In a further preferred embodiment, the field plan information comprise field information for defining field locations and field dimensions, in particular field piece information for defining field piece locations and field piece dimensions. In particular, the field plan information has a precision level of +/- 0.02 m, 0.03 m, 0.04 m, 0.6 m, 0.8 m, 0.10 m. The field plan information preferably comprises information of field splitting into field pieces, wherein said field pieces have dimensions to ensure capturing high-resolution data. It is preferably preferred that field pieces form a grid of the field.
- Preferably, the georeference data and/or the georeferenced image data and/or the georeferenced spectral data comprise georeference coordinates.
- In particular, the allocation of captured image data and captured spectral data to field plan information runs automatically by using geolocation data, e.g. from a GPS system.
- It is further preferred that overlaying the georeference spectral data and the georeferenced image data with the field plan information comprises an assignment of field piece information according to georeference coordinates. In this way, information of field pieces can be assigned to the captured spectral data and/or the captured image data. The field piece information can be for example an altitude preferably above the sea level, solar hours per day and/or per year, a soil type, etc. Advantageously, these field piece information can be considered in the step of phenotyping analysis.
- In a further preferred embodiment, the method comprises the step of capturing additional data via at least one additional sensor, preferably via a thermal sensor and/or an electro-magnetic sensor. In particular, the additional data can additionally or alternatively be captured. In the case of additionally captured additional data, the additional data can be overlaid with the image data, preferably in a way that both images are covering the whole plant in its position, and spatializing said overlaid data to generate the digital surface model and the georeferenced image data. As an alternative or in addition the method can comprise the steps of generating georeferenced additional data by the use of georeference data for spatializing the additional data and overlaying the georeferenced additional data, georeferenced image data and georeferenced spectral data with the field plan information to generate a high-resolution analysis data set.
- It can also be preferred that the captured additional data is processed equivalently to the image data. Preferably, captured additional data can be spatialized to georeferenced additional data and a digital surface model. Further, the georeferenced additional data can preferably be overlaid with field plan information and the georeferenced spectral data to generate a high-resolution data set.
- It is particularly preferred that the additional sensor is a thermal sensor, preferably an IR (infrared) sensor, for capturing thermal data.
- Generally, temperatures of different plant parts or plants compared to their controls are correlated at different time points during development with a genomic database. Merging of image data and thermal data preferably is a segmentation process to separate between plants or parts thereof and background like soil, assign leaves to individual plants and ascertain the quality of infections or drought or osmotic stress.
- It can be further preferred that the additional sensor is an electromagnetic sensor, preferably a SWIR (short-wavelength infrared) camera for capturing short waved infrared data.
- According to a preferred embodiment, generating the digital surface model comprises multiple recording of an individual picture element by capturing the image data and combining said multiple recorded individual picture elements to a three dimensional image. If applicable - alternatively or additionally - generating the digital surface model can preferably comprise multiple recording of an individual picture element by capturing the additional data and combining said multiple recorded individual picture elements to a three dimensional image.
- In particular, multiple recording can describe recording one individual picture element at least double or triple or quadruple or multiple from one perspective in different color and/or wavelength ranges. Alternatively, multiple recording can preferably describe recording one individual picture element at least double or triple or quadruple or multiple from different perspectives. It is preferred that the multiple recording can be made while moving the hyperspectral image sensor and/or the image sensor and/or the inertial measurement unit and/or the additional sensor above the field.
- It is particularly preferred, that the three dimensional data image can be produced by merging image data to produce a geotiff, wherein the three dimensional data image can include some height information.
- The method preferably comprises the step of using a computer algorithm for phenotyping, in particular phenotyping analysis, that preferably identifies direct traits, leave diseases, insect damages, virus infections by symptoms and/or abiotic stress effects. For example, direct traits can be a plant height, a plant counting, a row closure, a biomass, fruit/seed yield, herbicide tolerance and/or abiotic stress effects can caused by nutrient limitation, environmental temperature, exposure to environmental toxins (e.g. ozone or heavy metals) and/or drought or osmotic stress. It is particularly preferred that the computer algorithm processes the analysis data set by accessing and/or analyzing a database which preferably comprises reference data sets to be able to determine plant traits as well as the phenotype of the plant. Therefore, the computer algorithm is preferably adapted to consider the analysis data set in relation to reference data sets which are stored in the database.
- Plant traits of interest are usually defined and demanded by the breeders. After processing data traceability (e.g. correlation, heritability) may be calculated, e.g. correlation of measured and processed data to the plant trait. Data can be evaluated without knowing the plant genotype.
- Further preferably, the hyperspectral imaging sensor for capturing spectral data and/or the image sensor for capturing image data and/or the inertial measurement unit for capturing georeference data and/or the additional sensor are arranged on a mobile platform. In particular, it is preferred that one, two, several or all the sensor units are attached at an underside of the mobile platform. The mobile platform is movable, in particular horizontally moveable in parallel of the field ground, wherein its underside facing the field ground. This embodiment has the advantage that data can be captured while moving the mobile platform above the field.
- It is particularly preferred that the mobile platform is a ground-based device and/or an aerial device, preferably an autonomous mobile platform. Preferably, an autonomous mobile platform is an unmanned mobile platform and/or can be remote-controlled. This embodiment provides for a particularly easy and time-efficient way to capture data for performing data analysis for plant phenotyping of single plants in a field. In particular, the mobile platform can be moved horizontally in parallel of the field ground, preferably at an altitude up to 1 m, 2 m, 3 m, 5 m, 10 m, 20 m, 30 m, 40 m, 50 m, 75 m or 100 m above the canopy of the plants.
- In a preferred embodiment, the hyperspectral imaging sensor for capturing spectral data and/or the image sensor for capturing image data and/or the inertial measurement unit for capturing georeference data and/or the additional sensor are arranged on a mobile platform, wherein the mobile platform is a ground-based device and/or an aerial device, preferably an autonomous mobile platform. The ground-based device can be for example a tractor, a robot or an automat. An example of the aerial device is a drone.
- Preferably, the method comprises the step of creating a motion schedule for the autonomous mobile platform. This embodiment provides an automatic motion of the autonomous mobile platform. In particular, a motion path should be straight while a traverse direction of the autonomous mobile platform above the ground should be preferably north to south or south to north. The motion schedule provides preferably that one motion at one timepoint is sufficient for capturing all necessary data. Nevertheless, several measurement timepoints per vegetation period and/or per year can be intended. In particular, the mobile platform can be automatically controlled on the basis of the previously created motion schedule. Therefore, the mobile platform can be preferably connected with a control unit for controlling the movement of the mobile platform.
- It is further preferred, that motion data of an actual movement of the mobile platform can be captured during the motion of the mobile platform in accordance with the motion schedule. Actual movement data and the data of the motion schedule can differ, e.g. due to environmental conditions. This preferred embodiment has the advantage that variations can be recognized for being taken into account in the evaluation of the data or for signalizing these variations in such a way as to enable an operator to take control of the movement. Further preferably, the inertial measurement unit is adapted for capturing factual circumstances for comparing said factual circumstances with the considered influencing factors.
- In particular, creating the motion schedule should consider several influence factors, which can have a major impact on the high-resolution data. For example, a height, a speed and/or the sensors can be influence factors. Preferably, requirements of the sensor units as well as of the data storage are considered while creating the motion schedule. In order to achieve a ground sampling distance, which enables phenotyping as described herein, the movement of the mobile platform preferably is at an altitude of approximately 2 to 50 meters preferably at an altitude of approximately 25 meters. An optimal altitude of the movement depends on a lens and/or sensor properties, especially on the minimum required focus distance. A resulting size of the analyzed object in a captured image can be a factor limiting distance to the ground. Preferably, when an overlap between two captured data is necessary, determining of the maximum movement speed takes that into account. Another speed-limiting factor can be the integration time of the hyperspectral imaging sensor. Preferably, the integration time is adjusted manually or automatically to the ambient light conditions.
- This embodiment is, inter alia, based on the finding that the required ground resolution can depend on the application. The ground resolution can be optimized to a fine ground resolution if very small structures, e.g. single leaves, have to be spatially recognized. In contrast, a lower ground resolution can be sufficient if the spectral information have to be spatially distinguishable on the plot. In consideration of the required ground resolution the speed of the movement can be adjusted.
- According to a preferred embodiment, the method comprises pre -processing and/or processing the data on the mobile platform and/or an agricultural station and/or a main server during the operating process and/or in a separate step, which can be offline. Pre-processing can be understood as a part of processing. Processing the data in particular refers to performing data analysis for plant phenotyping. For instance, pre-processing can comprise spatializing the image data to generate georeferenced image data and a digital surface model and/or spatializing the spectral data and/or generating georeferenced spectral data based on the spatialized spectral data and the digital surface. In particular, establishing a relation between a picture element and a position data can be performed in a separate step offline or real time, e.g. by using a real time tracking (turf) algorithm.
- It is particularly preferred that the agricultural station can be adapted for pre-processing and/or processing captured data. The agricultural station can be preferably located at the field or in vicinity of the field, wherein the vicinity of the field describe a distance of up to 50 km, 40 km, 30 km, 20 km, 10 km, 5 km or 1 km, preferably a maximum distance to the place of administration of the field. In particular, the agricultural station can comprise a memory unit for storage captured and/or pre-processed and/or processed data and particularly preferred a control unit for pre-processing and/or processing captured data. Further, the control unit can be preferably adapted for controlling the mobile platform. Particularly preferred, the memory unit can be connected with the controlling unit and the mobile platform for storing and accessing the motion schedule.
- It is further preferred that the main server can be adapted for processing captured data and/or pre-processed data. The main server can be preferably located at a main location of administration. In particular, the main server can comprise a memory unit for storage of captured and/or pre-processed and/or processed data and particularly preferred a control unit for processing captured data or pre-processed data. Further, the control unit can be preferably adapted for controlling the mobile platform. Particularly preferred, the memory unit can be connected with the controlling unit and the mobile platform for storing and accessing the motion schedule.
- In particular, processing captured data can also comprise (further) processing pre-processed data.
- Particularly preferred, the method comprises pre-processing and/or processing the data individually for each imaged plant on the mobile platform and/or the agricultural station and/or the main server during the operating process.
- Preferably, the mobile platform and/or the agricultural station and/or the main server comprise a memory unit for storing captured data and/or pre-processed data and/or processed data and/or the motion schedule and/or the field plan information.
- In a preferred embodiment, the captured data and/or the pre-processed data and/or the processed data are transferred from the mobile platform to the main server and/or from the agricultural station to the main server via a wire connection and/or a wireless connection. Therefore, the mobile platform and/or the agricultural station and/or the main server comprise a wire connection and/or a wireless connection, preferably wlan and/or cable and/or usb and/or bluetooth, for transferring the captured data and/or the pre-processed data and/or the processed data from the mobile platform to the agricultural station and/or from the mobile platform to the main server and/or from the agricultural station to the main server.
- It is preferably preferred that the mobile platform comprises a memory unit for storing captured data. Preferably, the main server and/or the agricultural station can download said captured data for pre-processing and/or processing. Therefore, the mobile platform and/or the main server and/or the agricultural station comprise an interface, in particular for data transmission, preferably wireless data transmission.
- In a preferred embodiment the data can be pre-processed already on the mobile platform during the operating process. In a further preferred embodiment the data can be pre-processed individually for each imaged plant on the mobile platform during the operating process.
- According to a further aspect of the invention, it is provided a data acquisition and evaluation system for performing data analysis for plant phenotyping of single plants in a field, comprising a hyperspectral imaging sensor for capturing spectral data, an image sensor for capturing image data, an inertial measurement unit for capturing georeference data and a control unit, which is adapted to spatialize the image data to generate georeferenced image data and a digital surface model, spatialize the spectral data, generate georeferenced spectral data based on the spatialized spectral data and the digital surface model, overlay the georeferenced image data and georeferenced spectral data with field plan information to generate a high-resolution analysis data set.
- According to a further aspect of the invention, it is provided a mobile platform using in at least one method and/or in a data acquisition and evaluation system as described herein, comprising a hyperspectral imaging sensor for capturing spectral data, an image sensor for capturing image data and an inertial measurement unit for capturing georeference data. The mobile platform is preferably an autonomous mobile Platform. Preferably, the mobile platform can be an autonomous mobile platform.
- According to a further aspect of the invention, it is provided a use of a mobile platform according to a method and/or a data acquisition and evaluation system and/or a mobile platform as described herein.
- As to the advantages, preferred embodiments and details of these further aspects and their preferred embodiments, reference is made to the corresponding advantages, preferred embodiments and details described above.
- Preferred embodiments of the invention shall now be described with reference to the attached drawings, in which
-
Fig. 1 :shows a schematic flow diagram of an exemplary method for performing data analysis for plant phenotyping of single plants in a field; -
Fig. 2 :shows a geotiff recorded by an aerial device which is overlaid with corresponding field plan information; -
Fig. 3 : shows merging of captured image data and thermal data; -
Fig. 4 : shows an example of measurements of a pathogen infection; -
Fig. 5A : shows merging of spectral data with RGB data for measuring the pathogen infection according toFig. 4 ; -
Fig. 5B : shows a spectral comparison of leaf disease, healthy leaf and soil according toFig. 4 andFig. 5 ; -
Fig. 6 : shows an example for a single plant analysis; and -
Fig. 7 : shows a measurement of leave coverage and/or a biomass. - In the figures, elements with the same or comparable functions are indicated with the same reference numerals.
-
Figure 1 shows a schematic flow diagram of the method for performing data analysis for plant phenotyping of single plants in a field is shown. The flow diagram describes the processing of data after capturing thesedata 1a. The processing can be performed on the mobile platform, an agricultural station and/or a main server. In particular, pre-processing which is a part of processing, can be performed on the mobile platform, wherein the remaining part of processing can be performed on the agricultural station and/or the main server, and/or the agricultural station, wherein the remaining part of processing can be performed on the main server. - The method describes steps of processing after capturing georeference data 1.1 via an inertial measurement unit, image data 1.2 via an image sensor and spectral data 1.3 via a hyperspectral imaging sensor. The first step according to
Fig. 1 is spatializing the image data 2.1, 2.2 and spatializing the spectral data 3.1, 3.2, 3.3. Spatializing the image data 2.1, 2.2 comprises assigning spatial coordinates to the image data 2.1 and spatially correcting the image data 2.2 to generategeoreferenced image data 2a and adigital surface model 2b by using the georeference data 1.1. Spatializing the spectral data 3.1, 3.2, 3.3 comprises assigning spatial coordinates to spectral data 3.1, a radiometric correction 3.3 and spatial correction 3.2 of the spectral data 1.3. For generating georeferenced spectral data 3a, the spectral data 1.3 where spatialized by using. The next step of the method according toFig. 1 comprises overlaying thegeoreferenced image data 2a and the georeferenced spectral data 3a withfield plan information 4 to generate a high-resolution analysis data set by assigning of plot information according togeo coordinates phenotyping analysis 5 the high-resolution analysis data set is analyzed for identifying plant traits. For example, the high-resolution analysis data set can be characterized and plant traits can be determined by means of a database analysis. -
Fig. 2 shows a field sector 20.1 ingeotiff format 20 recorded by an aerial device, which is overlaid with the correspondingfield plan information 4 for analyzing single plants in this field sector 20.1. Thefield plan information 4 are mapped out as a shapefile defining the plot locations as well as dimensions and cover plots which are not part of the geotiff. Further, axes 21, 22 of thefield plan information 4 indicate the north/south and the east/west position of plots and region, which are covered by the image. The scale of theeasting axis 21 and thenorthing axis 22 is meters of a distance to a reference point line. According toFig. 2 , thefield plan information 4 define a field splitting intofield pieces 23 which have dimensions to ensure capturing high-resolution data. Thesefield pieces 23 form a grid of the field. Further, thefield plan information 4 shows blocks 25 which comprisemultiple lines 24 offield pieces 23, wherein eachline 24 comprisesmultiple field pieces 23. - As can be seen in
Fig. 3 ,segmentation 32 for separating between aplant 33 and abackground 34 can be made by merging captured data. During processing the data captured via different sensor units are preferably merged. Hereby, differences in size, scale often originating from using different lenses and/or sensor units, changes in physical position as well as interferences origination from different environmental conditions, e.g. sunlight, clouds, temperature, etc, can be eliminated.Fig. 3 shows a thermography 30.1 and a RGB image 30.2 of amaize plant 33 which are merged 31 and segmented 32. Thissegmentation 32 separates themaize plant 33 from thebackground 34 to assignleaves 35 of theplant 33 and preferably to ascertain the quality and/or quantity of infections or drought or osmotic stress. - With reference to
Fig. 4 ,5a and5b , a measurement of a pathogen infection is made by merging. -
Fig. 4 shows an image of a field 40 after merging captured spectral data and captured RGB data as described above. Due to high ground resolution and known geospatial sensor information it is possible to get information about single plants. The information which are received from one data-capturing-process can be used to setup a time resolved series of the plant and/or trait development during a vegetation period. A visual indication of e.g.different plant traits - In
Fig. 5a thesoil 50,healthy leaves 51 andleaf diseases 52 are marked. The detection of plant traits can be achieved by comparing each pixel-spectrum with a database, in which reference spectra of different plant traits are deposed. Spectral data allow a differentiation of pixels by its underlying chemical composition. Plants, part of the plants or other targets can show the same visual color while having completely different chemical components, e.g. a brown soil and a brown necrotic leaf tissue. - As can be seen in
Fig. 5b , a spectral comparison shows that if a similarity of the spectra is high enough the pixel can be classified as "leaf disease"-pixel. On the contrary, if the similarity of the spectra is not high enough the pixel can be classified as "healthy leaf"-pixel. Therefore, ax-axis 55 scale is wavelength in nm and a y-axis 56 scale is a normalized intensity. After classification of all pixels of a plant and/or a part of the plant, the pixels of "leaf disease" and "healthy leaf" can be used to calculate a ratio describing the amount of infestation. -
Fig. 6 shows an example of a single plant analysis. The method capturescontours 60 andmidpoints 61 of thebiomass distribution 62 of single plants. Therefore, the method provides the possibility to measure the biomass for single plants. Further, a growth rate of single plants can be calculated on basis of time series biomass measurements. - With reference to
Fig. 7 , a leaf coverage and/or biomass can be measured by comparing captured and merged data of single plants in one trial plot with aspectral reference scale 70. The figure shows single plants in different stages of development. In comparison to the lower part of thetrial plot 72, the upper part of thetrial plot 71 comprises a canopy between neighbored plants which has been partially closed already. The canopy is often an important parameter for plants. Canopy closure, which describes that a gap between neighbored plants is closed, is crucial for weed control because weed plants growing between the plants competes often with the plants for nutrients and sunlight. In this way, the canopy closure can often hamper the growth of weed plants significantly. -
- 1a
- data of a mobile platform
- 1.1
- georeference data
- 1.2
- image data
- 1.3
- spectral data
- 2.1
- assigning spatial coordinates to the image data
- 2.2
- spatially correcting the image data
- 2a
- georeferenced image data
- 2b
- digital surface model
- 3.1
- assigning spatial coordinates to spectral data
- 3.2
- spatially correcting the spectral data
- 3.3
- radiometric correcting the spectral data
- 3a
- georeferenced spectral data
- 4
- field plan information
- 4a, 4b
- assigning of plot information according to geo coordinates
- 5
- phenotyping analysis
- 20
- geotiff
- 20.1
- field sector
- 21
- x-axis, easting [m]
- 22
- y-axis, northing [m]
- 23
- field piece
- 24
- line of
field pieces 23 - 25
- block
- 30.1
- thermography image
- 30.2
- RGB image
- 31
- merging
- 32
- segmentation
- 33
- plant / maize plant
- 34
- background
- 35
- assigning leaves
- 40
- field
- 41, 42
- plant traits
- 50
- soil
- 51
- healthy leaves
- 52
- leaf diseases
- 55
- x-axis, wavelength in nm
- 53
- y-axis, normalized intensity
- 60
- contours
- 61
- midpoint
- 62
- biomass distribution
- 70
- spectral reference scale, number of pixels
- 71
- the upper part of the trial plot
- 72
- lower part of the trial plot
Claims (15)
- A method for performing data analysis for plant phenotyping of single plants in a field, comprising the steps of:- capturing spectral data via a hyperspectral imaging sensor (1.3),- capturing image data via an image sensor (1.2),- capturing georeference data via an inertial measurement unit (1.1),- spatializing the image data (2.1, 2.2) to generate georeferenced image data (2a) and a digital surface model (2b),- spatializing the spectral data (3.1, 3.2),- generating georeferenced spectral data (3a) based on the spatialized spectral data and the digital surface model (2b) and- overlaying the georeferenced image data and the georeferenced spectral data with field plan information (4a, 4b) to generate a high-resolution analysis data set.
- The method according to the preceding claim, wherein the image sensor is a RGB sensor.
- The method according to at least one of the preceding claims, wherein spatializing the image data comprises assigning spatial coordinates to the image data and preferably spatially correcting the image data.
- The method according to at least one of the preceding claims, wherein spatializing the spectral data comprises- a first step of spatializing the spectral data, which comprises∘ assigning spatial coordinates to spectral data and∘ preferably radiometrically correcting the spectral data and- preferably a second step of spatializing the spectral data, which comprises spatially correcting the spectral data.
- The method according to at least one of the preceding claims, wherein the field plan information comprise field information for defining field locations and field dimensions, in particular field piece information for defining field piece locations and field piece dimensions.
- The method according to at least one of the preceding claims, wherein overlaying the georeferenced spectral data and the georeferenced image data with the field plan information comprises an assignment of field piece information according to georeference coordinates.
- The method according to at least one of the preceding claims comprises the step of capturing additional data via at least one additional sensor, preferably via a thermal sensor and/or an electro-magnetic sensor.
- The method according to at least one of the preceding claims, wherein generating the digital surface model comprises- multiple recording of an individual picture element by capturing the image data and- combining said multiple recorded individual picture elements to a three dimensional image.
- The method according to at least one of the preceding claims comprises the step of using a computer algorithm for phenotyping that preferably identifies direct traits and/or leave diseases and/or insect damages and/or virus infections by symptoms and/or abiotic stress effects.
- The method according to at least one of the preceding claims, wherein the hyperspectral imaging sensor for capturing spectral data and the image sensor for capturing image data and the inertial measurement unit for capturing georeference data are arranged on a mobile platform, wherein the mobile platform is a ground-based device and/or an aerial device, preferably an autonomous mobile platform.
- The method according to at least one of the preceding claims comprises pre-processing and/or processing the data on the mobile platform and/or an agricultural station and/or a main station during the operating process and/or in a separate step offline.
- The method according to at least one of the preceding claims, wherein the captured data and/or the pre-processed data and/or the processed data are transferred from the mobile platform to the main server and/or from the agricultural station to the main server via a wire connection and/or a wireless connection.
- A data acquisition and evaluation system for performing data analysis for plant phenotyping of single plants in a field, comprising:- a hyperspectral imaging sensor for capturing spectral data (1.3),- an image sensor for capturing image data (1.2),- an inertial measurement unit for capturing georeference data (1.1) and- a control unit, which is adapted to:∘ spatialize the image data (2.1, 2.2) to generate georeferenced image data (2a) and a digital surface model (2b),∘ spatialize the spectral data (3.1, 3.2),∘ generate georeferenced spectral data (3a) based on the spatialized spectral data and the digital surface model (2b),∘ overlay the georeferenced image data and georeferenced spectral data with field plan information (4a, 4b) to generate a high-resolution analysis data set.
- A mobile platform for use in a method according to at least one of the preceding claims 1-12 and/or in a data acquisition and evaluation system according to the preceding claim, comprising- a hyperspectral imaging sensor for capturing spectral data (1.3),- an image sensor for capturing image data (1.2) and- an inertial measurement unit for capturing georeference data (1.1).
- A use of a mobile platform according to the preceding claims in a method according to at least one of the preceding claims 1-14 and/or in a data acquisition and evaluation system according to claim 13.
Priority Applications (10)
| Application Number | Priority Date | Filing Date | Title |
|---|---|---|---|
| EP17194841.7A EP3467702A1 (en) | 2017-10-04 | 2017-10-04 | Method and system for performing data analysis for plant phenotyping |
| CA3077713A CA3077713A1 (en) | 2017-10-04 | 2018-10-04 | Method and system for performing data analysis for plant phenotyping |
| BR112020005986-2A BR112020005986A2 (en) | 2017-10-04 | 2018-10-04 | method and system for performing data analysis with respect to phenotyping |
| EP24205458.3A EP4527175A1 (en) | 2017-10-04 | 2018-10-04 | Method and system for performing data analysis for plant phenotyping |
| US16/753,044 US12119086B2 (en) | 2017-10-04 | 2018-10-04 | Method and system for performing data analysis for plant phenotyping |
| CN201880075019.9A CN111357009B (en) | 2017-10-04 | 2018-10-04 | Method and system for performing plant phenotyping data analysis |
| PCT/EP2018/077060 WO2019068835A1 (en) | 2017-10-04 | 2018-10-04 | Method and system for performing data analysis for plant phenotyping |
| DK18778956.5T DK3692464T3 (en) | 2017-10-04 | 2018-10-04 | METHOD AND SYSTEM FOR PERFORMING DATA ANALYSIS FOR PLANT PHENOTYPING |
| PL18778956.5T PL3692464T3 (en) | 2017-10-04 | 2018-10-04 | Method and system for performing data analysis for plant phenotyping |
| EP18778956.5A EP3692464B1 (en) | 2017-10-04 | 2018-10-04 | Method and system for performing data analysis for plant phenotyping |
Applications Claiming Priority (1)
| Application Number | Priority Date | Filing Date | Title |
|---|---|---|---|
| EP17194841.7A EP3467702A1 (en) | 2017-10-04 | 2017-10-04 | Method and system for performing data analysis for plant phenotyping |
Publications (1)
| Publication Number | Publication Date |
|---|---|
| EP3467702A1 true EP3467702A1 (en) | 2019-04-10 |
Family
ID=60190536
Family Applications (3)
| Application Number | Title | Priority Date | Filing Date |
|---|---|---|---|
| EP17194841.7A Withdrawn EP3467702A1 (en) | 2017-10-04 | 2017-10-04 | Method and system for performing data analysis for plant phenotyping |
| EP18778956.5A Active EP3692464B1 (en) | 2017-10-04 | 2018-10-04 | Method and system for performing data analysis for plant phenotyping |
| EP24205458.3A Pending EP4527175A1 (en) | 2017-10-04 | 2018-10-04 | Method and system for performing data analysis for plant phenotyping |
Family Applications After (2)
| Application Number | Title | Priority Date | Filing Date |
|---|---|---|---|
| EP18778956.5A Active EP3692464B1 (en) | 2017-10-04 | 2018-10-04 | Method and system for performing data analysis for plant phenotyping |
| EP24205458.3A Pending EP4527175A1 (en) | 2017-10-04 | 2018-10-04 | Method and system for performing data analysis for plant phenotyping |
Country Status (8)
| Country | Link |
|---|---|
| US (1) | US12119086B2 (en) |
| EP (3) | EP3467702A1 (en) |
| CN (1) | CN111357009B (en) |
| BR (1) | BR112020005986A2 (en) |
| CA (1) | CA3077713A1 (en) |
| DK (1) | DK3692464T3 (en) |
| PL (1) | PL3692464T3 (en) |
| WO (1) | WO2019068835A1 (en) |
Cited By (10)
| Publication number | Priority date | Publication date | Assignee | Title |
|---|---|---|---|---|
| ES2795499A1 (en) * | 2019-05-21 | 2020-11-23 | Ambling Ingenieria Y Servicios S L | Improved method and system for the determination of fruit characteristics using hyperspectral imaging (Machine-translation by Google Translate, not legally binding) |
| CN112215169A (en) * | 2020-10-10 | 2021-01-12 | 华中农业大学 | Crop plant height and biomass self-adaptive high-precision resolving method based on low-altitude unmanned-machine passive remote sensing |
| CN112712038A (en) * | 2020-12-31 | 2021-04-27 | 武汉珈和科技有限公司 | Method and system for monitoring wheat lodging condition based on multispectral satellite image |
| CN113155192A (en) * | 2021-04-19 | 2021-07-23 | 河南省农业科学院农业经济与信息研究所 | Intelligent crop table type real-time acquisition device |
| CN114359755A (en) * | 2021-12-24 | 2022-04-15 | 华智生物技术有限公司 | Method, system, equipment and storage medium for extracting rice lodging region |
| CN114812433A (en) * | 2022-04-12 | 2022-07-29 | 中国科学院长春光学精密机械与物理研究所 | Plant phenotype collection device and collection method thereof |
| US20220262112A1 (en) * | 2019-10-04 | 2022-08-18 | Climate Llc | Hybrid vision system for crop land navigation |
| CN119290820A (en) * | 2024-12-13 | 2025-01-10 | 吉林省蔬菜花卉科学研究院 | Estimation method of net photosynthetic rate of onion leaves based on hyperspectral reflectance inversion |
| CN119533302A (en) * | 2024-12-02 | 2025-02-28 | 中国海洋大学 | A high-throughput and accurate shellfish phenotyping system |
| CN121113891A (en) * | 2025-11-10 | 2025-12-12 | 海南大学三亚南繁研究院 | A high-throughput measurement device and method for measuring the photosynthetically active radiation interception rate of rice populations |
Families Citing this family (22)
| Publication number | Priority date | Publication date | Assignee | Title |
|---|---|---|---|---|
| JP6953474B2 (en) * | 2019-06-05 | 2021-10-27 | 野崎 眞次 | Precision agriculture support system and precision agriculture support method |
| AU2021270489A1 (en) * | 2020-05-12 | 2022-11-10 | Monsanto Technology Llc | Automated phenotyping of seed shattering |
| CN112359124A (en) * | 2020-11-10 | 2021-02-12 | 沈阳农业大学 | Method for virtually synthesizing hybrid genotype according to plant parental genotype information and application |
| CN112765290B (en) * | 2020-12-25 | 2025-03-25 | 北京山水云图科技有限公司 | A method for representing soil composition using images |
| CN113065589B (en) * | 2021-03-26 | 2023-08-15 | 北京林业大学 | Method and device for pre-judging whether potential parent relationship exists in sample based on blade characteristics |
| US12111888B2 (en) * | 2021-06-10 | 2024-10-08 | Deere & Company | Localization of individual plants based on high-elevation imagery |
| US12112501B2 (en) * | 2021-06-22 | 2024-10-08 | Deere & Company | Localization of individual plants based on high-elevation imagery |
| DE102021207009A1 (en) | 2021-07-05 | 2023-01-05 | Robert Bosch Gesellschaft mit beschränkter Haftung | Method and device for detecting a plant health condition of plants for an agricultural machine |
| JP7090953B1 (en) * | 2021-10-05 | 2022-06-27 | HarvestX株式会社 | Agricultural support system, agricultural support equipment, agricultural support method and agricultural support program |
| CN114140691B (en) * | 2021-11-25 | 2024-04-23 | 华中农业大学 | A method for predicting crop lodging angle and shape based on UAV visible light images |
| CN116897723A (en) * | 2022-08-01 | 2023-10-20 | 中国农业科学院都市农业研究所 | A light source arrangement system and method based on plant photosensitive gene regulation |
| US12607507B2 (en) * | 2022-11-08 | 2026-04-21 | Purdue Research Foundation | Autonomous phenotype imaging system |
| US12694555B2 (en) * | 2022-12-16 | 2026-07-28 | Purdue Research Foundation | System and method for spatial analysis of leaf images |
| CN116230097A (en) * | 2023-02-09 | 2023-06-06 | 湖南省棉花科学研究所 | A kind of digital breeding method of rapeseed |
| US20260237204A1 (en) * | 2023-02-13 | 2026-08-13 | Pioneer Hi-Bred International, Inc. | Automated phenotyping for seed pod shatter and seed pod drop |
| DE102023105888A1 (en) * | 2023-03-09 | 2024-09-12 | KWS SAAT SE & Co. KGaA | Method for identifying a candidate, namely a gene locus and/or a sequence variant, which is indicative of at least one (phenotypic) characteristic |
| CN119086808B (en) * | 2024-05-21 | 2025-05-02 | 华中农业大学 | Multi-scene self-propelled crop phenotype high-flux nondestructive acquisition equipment |
| CN118661505A (en) * | 2024-07-19 | 2024-09-20 | 湖州师范学院 | Automatic detecting device for seed vitality |
| CN118570685B (en) * | 2024-08-05 | 2024-11-19 | 上海盛图遥感工程技术有限公司 | Unmanned aerial vehicle spectrum remote sensing camouflage investigation method |
| CN119506335A (en) * | 2024-11-15 | 2025-02-25 | 抚顺瑞泽生物科技有限公司 | A cell carrier information processing method and system |
| CN120354283B (en) * | 2025-04-14 | 2026-05-26 | 广东省农业科学院植物保护研究所 | A method and system for identifying viral diseases in cucurbit vegetables based on sensor arrays |
| CN120561515B (en) * | 2025-07-29 | 2025-10-17 | 宁波大龙农业科技有限公司 | Index analysis method for plant phenotype digital diversity |
Citations (2)
| Publication number | Priority date | Publication date | Assignee | Title |
|---|---|---|---|---|
| US5467271A (en) * | 1993-12-17 | 1995-11-14 | Trw, Inc. | Mapping and analysis system for precision farming applications |
| CN106778888A (en) * | 2016-12-27 | 2017-05-31 | 浙江大学 | A kind of orchard pest and disease damage survey system and method based on unmanned aerial vehicle remote sensing |
Family Cites Families (11)
| Publication number | Priority date | Publication date | Assignee | Title |
|---|---|---|---|---|
| USRE49105E1 (en) * | 2002-09-20 | 2022-06-14 | Vi Technologies, Llc | Self-calibrated, remote imaging and data processing system |
| US20090271719A1 (en) * | 2007-04-27 | 2009-10-29 | Lpa Systems, Inc. | System and method for analysis and display of geo-referenced imagery |
| CN101881726B (en) * | 2010-06-18 | 2011-11-02 | 北京农业智能装备技术研究中心 | Nondestructive detection method for comprehensive character living bodies of plant seedlings |
| US8855937B2 (en) * | 2010-10-25 | 2014-10-07 | Trimble Navigation Limited | Crop characteristic estimation |
| EP2766852A1 (en) * | 2011-10-13 | 2014-08-20 | Pioneer Hi-Bred International | Automatic detection of object pixels for hyperspectral analysis |
| US10031116B2 (en) * | 2012-05-30 | 2018-07-24 | Agrigenetics, Inc. | Multivariate genetic evaluation of maize for grain yield and moisture content |
| WO2015006675A2 (en) * | 2013-07-11 | 2015-01-15 | Blue River Technology, Inc. | Method for automatic phenotype measurement and selection |
| MX379063B (en) | 2014-10-27 | 2025-03-11 | Pioneer Hi Bred Int | IMPROVED MOLECULAR METHODS OF REPRODUCTION. |
| US20160205917A1 (en) * | 2015-01-15 | 2016-07-21 | Elwha Llc | Weed eradication method and apparatus |
| CN107064931A (en) * | 2016-12-11 | 2017-08-18 | 天津市矩辉数据科技有限公司 | Farmland reference point screening technique based on remotely-sensed data and GIS-Geographic Information System |
| WO2018191442A1 (en) * | 2017-04-11 | 2018-10-18 | Agerpoint, Inc. | Forestry management tool for assessing risk of catastrophic tree failure due to weather events |
-
2017
- 2017-10-04 EP EP17194841.7A patent/EP3467702A1/en not_active Withdrawn
-
2018
- 2018-10-04 DK DK18778956.5T patent/DK3692464T3/en active
- 2018-10-04 US US16/753,044 patent/US12119086B2/en active Active
- 2018-10-04 PL PL18778956.5T patent/PL3692464T3/en unknown
- 2018-10-04 WO PCT/EP2018/077060 patent/WO2019068835A1/en not_active Ceased
- 2018-10-04 CN CN201880075019.9A patent/CN111357009B/en active Active
- 2018-10-04 EP EP18778956.5A patent/EP3692464B1/en active Active
- 2018-10-04 CA CA3077713A patent/CA3077713A1/en active Pending
- 2018-10-04 BR BR112020005986-2A patent/BR112020005986A2/en unknown
- 2018-10-04 EP EP24205458.3A patent/EP4527175A1/en active Pending
Patent Citations (2)
| Publication number | Priority date | Publication date | Assignee | Title |
|---|---|---|---|---|
| US5467271A (en) * | 1993-12-17 | 1995-11-14 | Trw, Inc. | Mapping and analysis system for precision farming applications |
| CN106778888A (en) * | 2016-12-27 | 2017-05-31 | 浙江大学 | A kind of orchard pest and disease damage survey system and method based on unmanned aerial vehicle remote sensing |
Non-Patent Citations (5)
| Title |
|---|
| HAGHIGHATTALAB ET AL.: "Application of unmanned aerial systems for high-throughput phenotyping of large wheat breeding nurseries", PLANT METHODS, vol. 12.1, 2016, pages 35 |
| JANSEN ET AL.: "Non-invasive spectral phenotyping methods can improve and accelerate Cercospora disease scoring in sugar beet breeding", AGRICULTURE, vol. 4.2, 2014, pages 147 - 158 |
| MAHLEIN ET AL.: "Hyperspectral imaging for small-scale analysis of symptoms caused by different sugar beet diseases", PLANT METHODS, vol. 8.1, 2012, pages 3 |
| MÄKYNEN JUSSI ET AL: "Multi- and hyperspectral UAV imaging system for forest and agriculture applications", NEXT-GENERATION SPECTROSCOPIC TECHNOLOGIES V, SPIE, 1000 20TH ST. BELLINGHAM WA 98225-6705 USA, vol. 8374, no. 1, 11 May 2012 (2012-05-11), pages 1 - 9, XP060003030, DOI: 10.1117/12.918571 * |
| SANKEY TEMUULEN ET AL: "UAV lidar and hyperspectral fusion for forest monitoring in the southwestern USA", REMOTE SENSING OF ENVIRONMENT, ELSEVIER, XX, vol. 195, 18 April 2017 (2017-04-18), pages 30 - 43, XP085023371, ISSN: 0034-4257, DOI: 10.1016/J.RSE.2017.04.007 * |
Cited By (15)
| Publication number | Priority date | Publication date | Assignee | Title |
|---|---|---|---|---|
| ES2795499A1 (en) * | 2019-05-21 | 2020-11-23 | Ambling Ingenieria Y Servicios S L | Improved method and system for the determination of fruit characteristics using hyperspectral imaging (Machine-translation by Google Translate, not legally binding) |
| US11765542B2 (en) * | 2019-10-04 | 2023-09-19 | Climate Llc | Hybrid vision system for crop land navigation |
| US20220262112A1 (en) * | 2019-10-04 | 2022-08-18 | Climate Llc | Hybrid vision system for crop land navigation |
| US12089110B2 (en) | 2019-10-04 | 2024-09-10 | Climate Llc | Hybrid vision system for crop land navigation |
| CN112215169B (en) * | 2020-10-10 | 2022-11-08 | 华中农业大学 | Crop plant height and biomass self-adaptive resolving method based on unmanned aerial vehicle passive remote sensing |
| CN112215169A (en) * | 2020-10-10 | 2021-01-12 | 华中农业大学 | Crop plant height and biomass self-adaptive high-precision resolving method based on low-altitude unmanned-machine passive remote sensing |
| CN112712038A (en) * | 2020-12-31 | 2021-04-27 | 武汉珈和科技有限公司 | Method and system for monitoring wheat lodging condition based on multispectral satellite image |
| CN112712038B (en) * | 2020-12-31 | 2024-05-28 | 武汉珈和科技有限公司 | Method and system for monitoring wheat lodging condition based on multispectral satellite image |
| CN113155192B (en) * | 2021-04-19 | 2022-09-16 | 河南省农业科学院农业经济与信息研究所 | Intelligent crop table type real-time acquisition device |
| CN113155192A (en) * | 2021-04-19 | 2021-07-23 | 河南省农业科学院农业经济与信息研究所 | Intelligent crop table type real-time acquisition device |
| CN114359755A (en) * | 2021-12-24 | 2022-04-15 | 华智生物技术有限公司 | Method, system, equipment and storage medium for extracting rice lodging region |
| CN114812433A (en) * | 2022-04-12 | 2022-07-29 | 中国科学院长春光学精密机械与物理研究所 | Plant phenotype collection device and collection method thereof |
| CN119533302A (en) * | 2024-12-02 | 2025-02-28 | 中国海洋大学 | A high-throughput and accurate shellfish phenotyping system |
| CN119290820A (en) * | 2024-12-13 | 2025-01-10 | 吉林省蔬菜花卉科学研究院 | Estimation method of net photosynthetic rate of onion leaves based on hyperspectral reflectance inversion |
| CN121113891A (en) * | 2025-11-10 | 2025-12-12 | 海南大学三亚南繁研究院 | A high-throughput measurement device and method for measuring the photosynthetically active radiation interception rate of rice populations |
Also Published As
| Publication number | Publication date |
|---|---|
| EP4527175A1 (en) | 2025-03-26 |
| EP3692464B1 (en) | 2024-12-11 |
| CN111357009B (en) | 2024-06-14 |
| CN111357009A (en) | 2020-06-30 |
| WO2019068835A1 (en) | 2019-04-11 |
| US12119086B2 (en) | 2024-10-15 |
| EP3692464A1 (en) | 2020-08-12 |
| CA3077713A1 (en) | 2019-04-11 |
| US20200294620A1 (en) | 2020-09-17 |
| PL3692464T3 (en) | 2025-03-17 |
| DK3692464T3 (en) | 2025-01-13 |
| BR112020005986A2 (en) | 2020-09-29 |
Similar Documents
| Publication | Publication Date | Title |
|---|---|---|
| US12119086B2 (en) | Method and system for performing data analysis for plant phenotyping | |
| Feng et al. | Yield estimation in cotton using UAV-based multi-sensor imagery | |
| Guo et al. | Crop 3D—a LiDAR based platform for 3D high-throughput crop phenotyping | |
| Moriya et al. | Mapping mosaic virus in sugarcane based on hyperspectral images | |
| US11181516B2 (en) | Methods and systems for analyzing a field | |
| Stanton et al. | Unmanned aircraft system-derived crop height and normalized difference vegetation index metrics for sorghum yield and aphid stress assessment | |
| GB2598012A (en) | System and method for crop monitoring | |
| Shirzadifar et al. | Mapping crop stand count and planting uniformity using high resolution imagery in a maize crop | |
| Hall et al. | Optical remote sensing applications in viticulture‐a review | |
| Ballesteros et al. | Combined use of agro-climatic and very high-resolution remote sensing information for crop monitoring | |
| US10585210B2 (en) | Apparatus for radiometric correction and orthorectification of aerial imagery | |
| US20220307971A1 (en) | Systems and methods for phenotyping | |
| CN113029971A (en) | Crop canopy nitrogen monitoring method and system | |
| CN111095339A (en) | Crop cultivation support device | |
| Chapman et al. | Visible, near infrared, and thermal spectral radiance on-board UAVs for high-throughput phenotyping of plant breeding trials | |
| Heinemann et al. | Enhancing model performance through date fusion in multispectral and RGB image-based field phenotyping of wheat grain yield | |
| Liebisch et al. | Flourish-A robotic approach for automation in crop management | |
| Grenzdörffer | Automatic generation of geometric parameters of individual cauliflower plants for rapid phenotyping using drone images | |
| Dandrifosse | Dynamics of wheat organs by close-range multimodal machine vision | |
| Hund et al. | Methodological advances, challenges and perspectives in field phenotyping and its application to forage crops | |
| Enciso et al. | Unmanned Aerial System (UAS) for Precision Agriculture and Management Decisions | |
| Neeser et al. | Performance and cost of field scouting for weeds and diseases using imagery obtained with an Unmanned Aerial Vehicle | |
| Vallone et al. | Vineyard monitoring with UAV to extract vegetation indices | |
| Hatton et al. | Comparison of aerial and ground remote sensing to quantify sudden death syndrome in soybeans | |
| Wilke | UAV remote sensing for the spatial differentiated assessment of plant traits based on multispectral images |
Legal Events
| Date | Code | Title | Description |
|---|---|---|---|
| PUAI | Public reference made under article 153(3) epc to a published international application that has entered the european phase |
Free format text: ORIGINAL CODE: 0009012 |
|
| AK | Designated contracting states |
Kind code of ref document: A1 Designated state(s): AL AT BE BG CH CY CZ DE DK EE ES FI FR GB GR HR HU IE IS IT LI LT LU LV MC MK MT NL NO PL PT RO RS SE SI SK SM TR |
|
| AX | Request for extension of the european patent |
Extension state: BA ME |
|
| RAP1 | Party data changed (applicant data changed or rights of an application transferred) |
Owner name: KWS SAAT SE & CO. KGAA |
|
| 17P | Request for examination filed |
Effective date: 20191010 |
|
| RBV | Designated contracting states (corrected) |
Designated state(s): AL AT BE BG CH CY CZ DE DK EE ES FI FR GB GR HR HU IE IS IT LI LT LU LV MC MK MT NL NO PL PT RO RS SE SI SK SM TR |
|
| STAA | Information on the status of an ep patent application or granted ep patent |
Free format text: STATUS: THE APPLICATION HAS BEEN WITHDRAWN |
|
| 17Q | First examination report despatched |
Effective date: 20210120 |
|
| 18W | Application withdrawn |
Effective date: 20210126 |