EP3413790B1 - Systems and methods for evaluating pigmented tissue lesions - Google Patents
Systems and methods for evaluating pigmented tissue lesions Download PDFInfo
- Publication number
- EP3413790B1 EP3413790B1 EP17750864.5A EP17750864A EP3413790B1 EP 3413790 B1 EP3413790 B1 EP 3413790B1 EP 17750864 A EP17750864 A EP 17750864A EP 3413790 B1 EP3413790 B1 EP 3413790B1
- Authority
- EP
- European Patent Office
- Prior art keywords
- image
- lesion
- lesions
- class
- skin lesion
- Prior art date
- Legal status (The legal status is an assumption and is not a legal conclusion. Google has not performed a legal analysis and makes no representation as to the accuracy of the status listed.)
- Active
Links
Images




Classifications
-
- A—HUMAN NECESSITIES
- A61—MEDICAL OR VETERINARY SCIENCE; HYGIENE
- A61B—DIAGNOSIS; SURGERY; IDENTIFICATION
- A61B5/00—Measuring for diagnostic purposes; Identification of persons
- A61B5/44—Detecting, measuring or recording for evaluating the integumentary system, e.g. skin, hair or nails
- A61B5/441—Skin evaluation, e.g. for skin disorder diagnosis
- A61B5/444—Evaluating skin marks, e.g. mole, nevi, tumour, scar
-
- A—HUMAN NECESSITIES
- A61—MEDICAL OR VETERINARY SCIENCE; HYGIENE
- A61B—DIAGNOSIS; SURGERY; IDENTIFICATION
- A61B5/00—Measuring for diagnostic purposes; Identification of persons
- A61B5/0059—Measuring for diagnostic purposes; Identification of persons using light, e.g. diagnosis by transillumination, diascopy, fluorescence
- A61B5/0077—Devices for viewing the surface of the body, e.g. camera, magnifying lens
-
- A—HUMAN NECESSITIES
- A61—MEDICAL OR VETERINARY SCIENCE; HYGIENE
- A61B—DIAGNOSIS; SURGERY; IDENTIFICATION
- A61B5/00—Measuring for diagnostic purposes; Identification of persons
- A61B5/103—Measuring devices for testing the shape, pattern, colour, size or movement of the body or parts thereof, for diagnostic purposes
- A61B5/107—Measuring physical dimensions, e.g. size of the entire body or parts thereof
- A61B5/1075—Measuring physical dimensions, e.g. size of the entire body or parts thereof for measuring dimensions by non-invasive methods, e.g. for determining thickness of tissue layer
-
- A—HUMAN NECESSITIES
- A61—MEDICAL OR VETERINARY SCIENCE; HYGIENE
- A61B—DIAGNOSIS; SURGERY; IDENTIFICATION
- A61B5/00—Measuring for diagnostic purposes; Identification of persons
- A61B5/103—Measuring devices for testing the shape, pattern, colour, size or movement of the body or parts thereof, for diagnostic purposes
- A61B5/107—Measuring physical dimensions, e.g. size of the entire body or parts thereof
- A61B5/1079—Measuring physical dimensions, e.g. size of the entire body or parts thereof using optical or photographic means
-
- A—HUMAN NECESSITIES
- A61—MEDICAL OR VETERINARY SCIENCE; HYGIENE
- A61B—DIAGNOSIS; SURGERY; IDENTIFICATION
- A61B5/00—Measuring for diagnostic purposes; Identification of persons
- A61B5/145—Measuring characteristics of blood in vivo, e.g. gas concentration or pH-value ; Measuring characteristics of body fluids or tissues, e.g. interstitial fluid or cerebral tissue
- A61B5/14546—Measuring characteristics of blood in vivo, e.g. gas concentration or pH-value ; Measuring characteristics of body fluids or tissues, e.g. interstitial fluid or cerebral tissue for measuring analytes not otherwise provided for, e.g. ions, cytochromes
-
- A—HUMAN NECESSITIES
- A61—MEDICAL OR VETERINARY SCIENCE; HYGIENE
- A61B—DIAGNOSIS; SURGERY; IDENTIFICATION
- A61B5/00—Measuring for diagnostic purposes; Identification of persons
- A61B5/145—Measuring characteristics of blood in vivo, e.g. gas concentration or pH-value ; Measuring characteristics of body fluids or tissues, e.g. interstitial fluid or cerebral tissue
- A61B5/1455—Measuring characteristics of blood in vivo, e.g. gas concentration or pH-value ; Measuring characteristics of body fluids or tissues, e.g. interstitial fluid or cerebral tissue using optical sensors, e.g. spectral photometrical oximeters
- A61B5/14551—Measuring characteristics of blood in vivo, e.g. gas concentration or pH-value ; Measuring characteristics of body fluids or tissues, e.g. interstitial fluid or cerebral tissue using optical sensors, e.g. spectral photometrical oximeters for measuring blood gases
-
- A—HUMAN NECESSITIES
- A61—MEDICAL OR VETERINARY SCIENCE; HYGIENE
- A61B—DIAGNOSIS; SURGERY; IDENTIFICATION
- A61B5/00—Measuring for diagnostic purposes; Identification of persons
- A61B5/44—Detecting, measuring or recording for evaluating the integumentary system, e.g. skin, hair or nails
- A61B5/441—Skin evaluation, e.g. for skin disorder diagnosis
- A61B5/443—Evaluating skin constituents, e.g. elastin, melanin, water
-
- G—PHYSICS
- G06—COMPUTING OR CALCULATING; COUNTING
- G06F—ELECTRIC DIGITAL DATA PROCESSING
- G06F18/00—Pattern recognition
- G06F18/20—Analysing
- G06F18/21—Design or setup of recognition systems or techniques; Extraction of features in feature space; Blind source separation
- G06F18/213—Feature extraction, e.g. by transforming the feature space; Summarisation; Mappings, e.g. subspace methods
- G06F18/2132—Feature extraction, e.g. by transforming the feature space; Summarisation; Mappings, e.g. subspace methods based on discrimination criteria, e.g. discriminant analysis
-
- G—PHYSICS
- G06—COMPUTING OR CALCULATING; COUNTING
- G06F—ELECTRIC DIGITAL DATA PROCESSING
- G06F18/00—Pattern recognition
- G06F18/20—Analysing
- G06F18/21—Design or setup of recognition systems or techniques; Extraction of features in feature space; Blind source separation
- G06F18/217—Validation; Performance evaluation; Active pattern learning techniques
-
- G—PHYSICS
- G06—COMPUTING OR CALCULATING; COUNTING
- G06F—ELECTRIC DIGITAL DATA PROCESSING
- G06F18/00—Pattern recognition
- G06F18/20—Analysing
- G06F18/23—Clustering techniques
-
- G—PHYSICS
- G06—COMPUTING OR CALCULATING; COUNTING
- G06T—IMAGE DATA PROCESSING OR GENERATION, IN GENERAL
- G06T7/00—Image analysis
- G06T7/0002—Inspection of images, e.g. flaw detection
- G06T7/0012—Biomedical image inspection
-
- G—PHYSICS
- G06—COMPUTING OR CALCULATING; COUNTING
- G06V—IMAGE OR VIDEO RECOGNITION OR UNDERSTANDING
- G06V10/00—Arrangements for image or video recognition or understanding
- G06V10/10—Image acquisition
- G06V10/12—Details of acquisition arrangements; Constructional details thereof
- G06V10/14—Optical characteristics of the device performing the acquisition or on the illumination arrangements
- G06V10/143—Sensing or illuminating at different wavelengths
-
- G—PHYSICS
- G06—COMPUTING OR CALCULATING; COUNTING
- G06V—IMAGE OR VIDEO RECOGNITION OR UNDERSTANDING
- G06V10/00—Arrangements for image or video recognition or understanding
- G06V10/10—Image acquisition
- G06V10/12—Details of acquisition arrangements; Constructional details thereof
- G06V10/14—Optical characteristics of the device performing the acquisition or on the illumination arrangements
- G06V10/147—Details of sensors, e.g. sensor lenses
-
- G—PHYSICS
- G06—COMPUTING OR CALCULATING; COUNTING
- G06V—IMAGE OR VIDEO RECOGNITION OR UNDERSTANDING
- G06V10/00—Arrangements for image or video recognition or understanding
- G06V10/40—Extraction of image or video features
- G06V10/42—Global feature extraction by analysis of the whole pattern, e.g. using frequency domain transformations or autocorrelation
- G06V10/435—Computation of moments
-
- G—PHYSICS
- G06—COMPUTING OR CALCULATING; COUNTING
- G06V—IMAGE OR VIDEO RECOGNITION OR UNDERSTANDING
- G06V10/00—Arrangements for image or video recognition or understanding
- G06V10/40—Extraction of image or video features
- G06V10/60—Extraction of image or video features relating to illumination properties, e.g. using a reflectance or lighting model
-
- G—PHYSICS
- G06—COMPUTING OR CALCULATING; COUNTING
- G06V—IMAGE OR VIDEO RECOGNITION OR UNDERSTANDING
- G06V10/00—Arrangements for image or video recognition or understanding
- G06V10/70—Arrangements for image or video recognition or understanding using pattern recognition or machine learning
- G06V10/762—Arrangements for image or video recognition or understanding using pattern recognition or machine learning using clustering, e.g. of similar faces in social networks
-
- G—PHYSICS
- G06—COMPUTING OR CALCULATING; COUNTING
- G06V—IMAGE OR VIDEO RECOGNITION OR UNDERSTANDING
- G06V20/00—Scenes; Scene-specific elements
- G06V20/10—Terrestrial scenes
-
- G—PHYSICS
- G06—COMPUTING OR CALCULATING; COUNTING
- G06V—IMAGE OR VIDEO RECOGNITION OR UNDERSTANDING
- G06V20/00—Scenes; Scene-specific elements
- G06V20/60—Type of objects
- G06V20/69—Microscopic objects, e.g. biological cells or cellular parts
-
- G—PHYSICS
- G06—COMPUTING OR CALCULATING; COUNTING
- G06V—IMAGE OR VIDEO RECOGNITION OR UNDERSTANDING
- G06V30/00—Character recognition; Recognising digital ink; Document-oriented image-based pattern recognition
- G06V30/10—Character recognition
- G06V30/14—Image acquisition
- G06V30/142—Image acquisition using hand-held instruments; Constructional details of the instruments
-
- A—HUMAN NECESSITIES
- A61—MEDICAL OR VETERINARY SCIENCE; HYGIENE
- A61B—DIAGNOSIS; SURGERY; IDENTIFICATION
- A61B2562/00—Details of sensors; Constructional details of sensor housings or probes; Accessories for sensors
- A61B2562/02—Details of sensors specially adapted for in-vivo measurements
- A61B2562/0233—Special features of optical sensors or probes classified in A61B5/00
-
- A—HUMAN NECESSITIES
- A61—MEDICAL OR VETERINARY SCIENCE; HYGIENE
- A61B—DIAGNOSIS; SURGERY; IDENTIFICATION
- A61B2576/00—Medical imaging apparatus involving image processing or analysis
- A61B2576/02—Medical imaging apparatus involving image processing or analysis specially adapted for a particular organ or body part
-
- G—PHYSICS
- G06—COMPUTING OR CALCULATING; COUNTING
- G06T—IMAGE DATA PROCESSING OR GENERATION, IN GENERAL
- G06T2207/00—Indexing scheme for image analysis or image enhancement
- G06T2207/10—Image acquisition modality
- G06T2207/10024—Color image
-
- G—PHYSICS
- G06—COMPUTING OR CALCULATING; COUNTING
- G06T—IMAGE DATA PROCESSING OR GENERATION, IN GENERAL
- G06T2207/00—Indexing scheme for image analysis or image enhancement
- G06T2207/30—Subject of image; Context of image processing
- G06T2207/30004—Biomedical image processing
- G06T2207/30088—Skin; Dermal
-
- G—PHYSICS
- G06—COMPUTING OR CALCULATING; COUNTING
- G06T—IMAGE DATA PROCESSING OR GENERATION, IN GENERAL
- G06T2207/00—Indexing scheme for image analysis or image enhancement
- G06T2207/30—Subject of image; Context of image processing
- G06T2207/30004—Biomedical image processing
- G06T2207/30096—Tumor; Lesion
-
- G—PHYSICS
- G06—COMPUTING OR CALCULATING; COUNTING
- G06V—IMAGE OR VIDEO RECOGNITION OR UNDERSTANDING
- G06V2201/00—Indexing scheme relating to image or video recognition or understanding
- G06V2201/03—Recognition of patterns in medical or anatomical images
-
- G—PHYSICS
- G16—INFORMATION AND COMMUNICATION TECHNOLOGY [ICT] SPECIALLY ADAPTED FOR SPECIFIC APPLICATION FIELDS
- G16H—HEALTHCARE INFORMATICS, i.e. INFORMATION AND COMMUNICATION TECHNOLOGY [ICT] SPECIALLY ADAPTED FOR THE HANDLING OR PROCESSING OF MEDICAL OR HEALTHCARE DATA
- G16H30/00—ICT specially adapted for the handling or processing of medical images
- G16H30/40—ICT specially adapted for the handling or processing of medical images for processing medical images, e.g. editing
Definitions
- the present disclosure relates to a method for discriminating between different types of tissue lesions.
- the present disclosure is directed to a method for discriminating between malignant and benign tissue lesions.
- the 5-year survival rate is 93 to 97% for melanoma detected at an early stage, but drops to between 10 and 20% for advanced stage detection, implying that there is a need for accurate diagnostic devices to enable early detection while avoiding unnecessary biopsies.
- the devices profiled included Aura (Verisante Technology, Inc., Vancouver, British Columbia, Canada), MelaFind (MELA Sciences, Inc., Irvington, New York, USA), and SIMSYS-MoleMate Skin Imaging System (MedX Health, Inc., Hamilton, Ontario, Canada).
- Aura utilizes near-infrared laser light and Raman spectroscopy to distinguish malignant from benign skin lesions and has shown sensitivities ranging from 90 to 99% for specificities ranging from 58 to 15% for discriminating between benign and malignant lesions.
- MelaFind illuminates the skin at 10 wavelengths, measures light scattered back from the skin, and uses image analysis algorithms combined with a skin disorder database to provide treatment suggestion. For discrimination between melanoma and benign pigmented lesions in a population of suspicious lesions, MelaFind showed 98% sensitivity and 9% specificity in a clinical study involving 1,383 patients with 1,831 pigmented skin lesions.
- SIMSYS-MoleMate Skin Imaging System is based on using a handheld, multispectral scanner and computer software to provide dermatoscopic images, dermal and epidermal pathological characteristics, and the ability to catalogue, monitor, and compare lesions over time.
- a randomized controlled trial involving 1,297 patients with 1,580 suspicious pigmented lesions it was found that adding MoleMate to best practices resulted in lower agreement with expert assessment that the lesion was benign and led to a higher proportion of referrals.
- Relevant prior art includes US 2015/297130 A1 .
- the present invention relates to methods for discriminating between different types of tissue lesions.
- the present invention is directed to optical methods for discriminating between malignant and benign tissue lesions.
- an optical transfer device is used to image a tissue lesion for analysis.
- An optical transfer diagnosis (OTD) device is a spectral radiometer that records a set of 30 images, constituting a lesion measurement, in less than 10 seconds. Images are recorded at 10 different wavelengths (from about 365-about 880 nm) from multiple angles of illumination and detection.
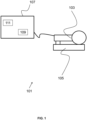
- the OTD system 101 may consist of a handheld unit 103, a docking station 105, and a laptop PC or other computing device 107 comprising a processor 109 coupled to a tangible, non-transient memory 111.
- the handheld unit 103 may include a release button to initiate image recording. Other controls may be performed via a user interface on the attached computing device 107.
- the handheld unit 103 is placed in the docking station 105, where the observation window of the device is placed against a calibration target.
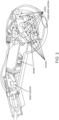
- FIG. 2 shows the inner parts of an exemplary handheld OTD unit.
- a sensor head may contain an illuminating system consisting of, for example, 12 LED or other light-providing devices 305 and an imaging system comprising at least one camera 307 and a series of mirrors 303, as shown in FIG. 3 .
- An exemplary illuminating system shown consists of 12 fixed light-emitting diode (LED) lamps. Each LED is placed at a different angle relative to the skin to enhance the ability to retrieve depth information.
- the polar angles of the LEDs vary between 30 and 45 degrees and the relative azimuth angles between 34 and 145 degrees.
- the polar angles for the detectors vary between 0 and 45 degrees, and the relative azimuth angles between 0 and 180 degrees.
- An exemplary imaging system for a handheld OTD device consists of one correcting lens placed inside the handle plus another correcting lens and five mirrors placed inside a sensor head and a sapphire glass observation window that contacts the area of the skin lesion.
- OTD devices may comprise a camera sensor consisting of, for example, an IEEE (Institute of Electrical and Electronics Engineers) 1394 FireWire camera.
- FIG. 4 illustrates a ray trace of the OTD imaging system according to certain embodiments, where IS: Image sensor; L1: Camera lens; L2: Correcting lens 1; L3: Correcting lens 2; M1: Plane mirror for central view image; M2, M3: Plane mirrors for upper 30 degree oblique image; M4, M5: Plane mirrors for lower 45 degree oblique image; and W: Sapphire glass window.
- An alcohol-based gel interface may be used where the sapphire observation window contacts the skin to provide refractive-index matching and avoid rough-surface scattering, and to obtain illumination and imaging of a selected area of the skin through the circular sapphire observation window.
- the observation window may be between about 1.5 and about 5 cm in diameter and may be, for example, about 2 cm.
- images for analysis using methods of the invention may be obtained using imaging devices such as a dermatoscope, digital camera, smartphone, or tablet.
- imaging devices such as a dermatoscope, digital camera, smartphone, or tablet.
- Single or multiple images may be obtained for analysis and, where multiple images are obtained, they may be obtained at different angles of illumination and detection.
- images are obtained using a dermatoscope, digital camera or a mobile device including a camera (e.g., mobile phone or tablet with camera and LED or other source of illumination or flash)
- the device may prompt a user, via a program stored on a non-transient, tangible memory, to capture a series of images at prescribed orientations relative to a lesion.
- the device camera and/or orienting devices such as gyroscopic or global positioning system features of the device may be used to determine orientation of the camera and light source with respect to the lesion.
- the imaging device may be configured to determine when the desired orientation has been achieved and to automatically capture an image or series of images or prompt a user to capture the image once the appropriate orientation is reached. Each image may be tagged by the device with the angles of illumination and detection at which the image was obtained.
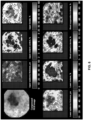
- a set of recorded images may be used to create maps of physiology properties and morphological parameters of the lesion, which are assumed to be different for benign and malignant tissue. Exemplary maps are shown in FIGS. 6 and 8 .
- the map creation is based on (i) a bio-optical model that relates physiological properties of skin tissue to its inherent optical properties, (ii) a radiative transfer model that for a given set of inherent optical properties computes the light backscattered from the skin for a given wavelength and direction of illumination, and (iii) a nonlinear inversion algorithm that compares the computed backscattered light at various wavelengths and directions with that of the recorded image set.
- the data acquisition geometry is designed in such a way that for each combination of illumination and detection directions, the same area of the skin is interrogated. This allows a one-dimensional treatment when the independent-column approximation is invoked and the skin tissue is assumed to have a layered structure: an uppermost layer, the epidermis, consisting of an upper part and a lower part; the dermis, containing the blood circulation; and the subcutis, a strongly scattering fat-containing layer.
- the inherent optical properties of each layer are the absorption and scattering coefficients as well as the scattering phase function (describing the angular variation of the scattered light), each varying with wavelength.
- the retrieved physiology properties and morphological parameters are (1) percentage of hemoglobin concentration, (2) percentage of hemoglobin oxygenation, (3) upper epidermal thickness, (4) lower epidermal thickness, (5) percentage of melanosome concentration in upper epidermis, (6) percentage of melanosome concentration in lower epidermis, and (7) percentage of keratin concentration.
- Each of these seven physiology properties or morphological parameters is retrieved pixel by pixel in the compressed image to create a map covering the zoomed lesion area.
- an entropy value may be calculated and cross entropy values are calculated for different pairs of maps.
- the entropy concept used here is similar to that used in statistical physics and information theory. For example, from the spatial distribution of the melanosome concentration, the entropy of this parameter is computed as the melanosome concentration multiplied by its logarithm and integrated over the area of the lesion.
- lesion measurements may comprise a set of 30 images recorded by an OTD scanner.
- the OTD scanner of the invention records three images simultaneously at different detection angles. This procedure may be repeated for 9 other wavelengths in the range from the near ultraviolet to the near infrared at different illumination angles to produce a lesion measurement that comprises a set of 30 images.
- each pixel corresponds to (i) a particular distance from one of the 10 LED sources of different intensity, (ii) a particular size of the of skin area for each of the 20 images that are recorded by one of the two side-viewing cameras; and (iii) a particular location of the illuminated skin area because of possible movement of the skin with respect to the OTD scanner during the few seconds of sequential illumination by the 10 LEDs.
- a series of pre-processing steps may be performed, including (1) according to claim 1 relative calibration such that the intensity of each pixel is measured in units of the intensity due to backscattering for a corresponding pixel from a target having a Lambert surface; (2) geometrical calibration such that an ellipse of illuminated skin area for a side-viewing camera is transformed into a circle; (3) image registration such that each pixel in any of the 30 images corresponds to the same area of the skin; (4) compression such that the raw image having about 7 ⁇ 10 6 pixels with a spatial resolution of about 25 ⁇ m is replaced by a smoothed image with a total number of pixels that is 100 times less than that of the raw image.
- the compressed image has 10 times less spatial resolution than the raw image, and a byproduct of compression is filtering of spatial high-frequency noise in the raw images due to possible spikes, specular points, and hairs.
- Automated zooming is employed to provide a lesion mask that circumferences the lesion and is characteristic of its shape, and a surrounding mask that creates an area outside the lesion of suitable size and the same outer shape as that of the lesion mask.
- the zooming can provide rotation, translation, and scaling invariant characteristics of the lesion under investigation, both for calibrated images and maps of physiology properties and morphological parameters. Also, zooming can accelerate the processing since only pixels of the lesion and surrounding masks are considered.
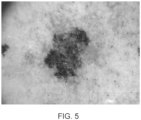
- FIG. 5 shows a dermatoscopic image of a melanoma
- FIG. 6 shows the corresponding RGB image and maps of physiology properties and morphological parameters obtained from OTD recordings and processing using systems and methods of the invention.
- FIGS. 7 and 8 show corresponding results for a compound nevus.
- the maps of physiology properties and morphological parameters in Fig. 6 for a melanoma are quite different from those in Fig. 8 for a compound nevus, indicating that these maps may prove useful in discriminating between benign pigmented lesion and melanomas.
- entropy and cross entropy values are calculated and used to define diagnostic parameters, as discussed below.
- the following 10 morphological parameters may be derived: (1) Size; (2) Histogram width (providing a measure of inhomogeneity of the reflected intensity); (3) Fractal dimension; (4) Moment of inertia; (5) Asphericity; (6) Center distance (representing the physical distance between the geometrical center of the lesion and the center of mass of absorptance); (7) Border length; (8) Average darkness; (9) Area divided by fractal dimension; and (10) Border length divided by fractal dimension.
- Another 10 diagnostic parameters are derived from the maps of physiology properties:
- natural RoI represents a rectangular area that is oriented in accordance with the shape of the lesion, and "standard gridding" means that along the longest side of the natural RoI there are 100 grid points.
- the “original RoI” is the rectangular zoom area of the compressed digital image.
- Clustering is used to obtain a reliable and robust discrimination between class 1 and class 2 lesions through the identification of a set of class 1 clusters, each comprising a certain number of independent measurements on class 1 lesions, and another set of class 2 clusters, each comprising a certain number of independent measurements on class 2 lesions.
- the first step of the clustering procedure is to discretize the diagnostic parameter p j as follows:
- the definition of a clustering index for an independent lesion measurement is based on constructing coincidence vectors C + and C - and probabilistic vectors t + and t - :
- C ⁇ T 1 ⁇ , T 2 ⁇ , ... , T N ⁇ ;
- t ⁇ t 1 ⁇ , t 2 ⁇ , ... , t N ⁇
- t j ⁇ ( ⁇ T j ⁇ ) 1/2 , the sum being over all independent measurements on lesions of the class under consideration.
- the independent measurements are ordered in accordance with the value of the clustering index, and independent measurements having values of the clustering index in a specific interval are taken to belong to the same cluster.
- ordered implies that the independent measurements are placed in sequential order in accordance with the value of the clustering index.
- a total of L 1 clusters is constructed of independent measurements on class 1 lesions relative to the entire set of independent measurements on class 2 lesions.
- S ( c ) is the sum of specificities for the cluster under construction vs. each of the clusters of class 1 lesions.
- the specificity S ( c ) for the cluster under construction vs. cluster #i of class 1 lesions is the ratio between the number of correctly classified measurements of class 2 lesions and the total number of measurements on class 2 lesions contained in the cluster under construction.
- the clustering procedure can then be carried out similarly to the procedure enumerated above for class 1 lesions relative to the entire set of class 2 lesions.
- Optimal values of the weights in Eq. (1) are then determined for separation between the two classes of lesions, called class 1 and class 2.
- the dimension of the optimization problem is reduced by (i) introducing a covariance matrix for independent measurements on lesions of class 1 and class 2, where the two classes are chosen such that the trace of the covariance matrix for class 1 lesions is larger than that for class 2 lesions, (ii) defining a discriminating operator in terms of the two covariance matrices, (iii) constructing eigenvectors and eigenvalues on the basis of the discriminating operator and using only those eigenvalues that are larger than a threshold value, chosen so as to ensure that sufficiently large variations of the diagnostic parameters associated with independent measurements on class 1 lesions are accounted for, and (iv) defining for each independent measurement on a lesion of class 1 or class 2 a set of generalized diagnostic parameters.
- w ⁇ and p ⁇ are generalized weight and diagnostic parameter vectors, respectively, each having a dimension ⁇ that is typically only one third of the number N of original diagnostic parameters.
- p ⁇ d ⁇ 1 ⁇ ⁇ p , d ⁇ 2 ⁇ ⁇ p , ... , d ⁇ min ⁇ ⁇ p .
- ⁇ p p - ⁇ p (2) ⁇
- p the vector of original diagnostic parameters in Eq. (1)
- ⁇ p (2) ⁇ is the average of the vectors of diagnostic parameters for all independent measurements on class 2 lesions.
- the condition ⁇ k > ⁇ min leads to a substantial reduction in the number of diagnostic parameters.
- a cost function is defined, consisting of a master term and a constraint term, where the latter is used to constrain the length of the weight vector to lie on the surface of a hypersphere in N dimensions of radius equal to 1.
- a cost function consisting of a master term and a constraint term, where the latter is used to constrain the length of the weight vector to lie on the surface of a hypersphere in N dimensions of radius equal to 1.
- the master term of the cost function consider a set of independent lesion measurements that is divided into one subset of independent measurements on lesions belonging to class 1 and another subset of independent measurements on lesions belonging to class 2.
- class 1 could comprise independent measurements on malignant lesions and class 2 independent measurements on benign lesions.
- the corresponding generalized diagnostic index D 1 ( w ⁇ ) is computed for each of the class 1 independent lesion measurements as well as the corresponding generalized diagnostic index D 2 ( w ⁇ ) for each of the class 2 independent lesion measurements.
- the mean values ⁇ D 1 ⁇ and ⁇ D 2 ⁇ and the corresponding standard deviations ⁇ 1 and ⁇ 2 are computed.
- J 0 w ⁇ 1 ⁇ 1 ⁇ D * w ⁇ ⁇ exp ⁇ D ⁇ D 1 2 2 ⁇ 1 2 dD + 1 ⁇ 2 ⁇ ⁇ ⁇ D * w ⁇ exp ⁇ D ⁇ D 2 2 ⁇ 2 2 dD
- D* ( w ⁇ ) is the point of intersection of the two Gaussian distributions in Eq. (14)
- J 0 ( w ⁇ ) is the area of overlap of the two Gaussian distributions.
- the minimization of J 0 ( w ⁇ ) will provide the smallest degree of overlap between the two Gaussian distributions, and hence the best separation between independent measurements on class 1 and class 2 lesions.
- the corresponding points on the two distribution curves in FIG. 10 may be interpreted as partial reliabilities of a diagnostic indication.
- r i , j 1 D represents the red (class 1) curve in FIG. 10 and r i , j 2 D ; represents the blue (class 2) curve, then, by definition, r ij 1 D r ij 2 D represents the partial reliability of a diagnostic indication in favor of the measurement belonging to a class 1 [class 2] lesion.
- values for i 1, 2, ..., L 1 .
- the value ⁇ 0:001 is used to avoid zeros appearing in the products in Eq. (17).
- the diagnostic indication by a team of experts associated with a randomly drawn training ensemble comprised of L 1 and L 2 clusters of class 1 and class 2, respectively, is that if D given by Eq. (16) is greater than or equal to zero, then the measurement is regarded to represent a class 1 lesion.
- the diagnostic indication for a lesion by a team of experts associated with this randomly drawn training ensemble is that if the mean value of the modified diagnostic indices D given by Eq. (16) for the measurements taken is greater than or equal to zero, the lesion is regarded to be of class 1.
- This diagnostic indication constitutes a nonlinear binary classifier.
- the final diagnostic indication tool described above may be applied to an unknown lesion measurement as follows:
- each of the 30 images comprising a lesion measurement consists of approximately 10,000 pixels.
- J 0 i ⁇ i , n ⁇ i ⁇ ⁇ i , n T C ⁇ ⁇ 1 i ⁇ i , n ⁇ i ⁇ ⁇ i , n (See Nielsen, et al., "Retrieval of the physiological state of human skin from UV-Vis reflectance spectra: A feasibility study," Photochem. Photobiol. B 93, 23-31 (2008 ).
- i ⁇ i , n is the measured reflected light for pixel #n and wavelength ⁇ i
- i ⁇ i , n is the simulated reflected light for pixel #n and wavelength ⁇ i .
- the classification scheme was developed and optimized on a clinical data set consisting of 1,495 lesion images collected in several clinical studies using OTD devices from 2005 to date.
- K 144 different diagnostic indication rules, each designed to discriminate between suspicious and benign lesions in a population of unselected ("all-comer") lesions.
- All-comer 77% of all available measurements performed on a total of 712 lesions (including 80 malignant lesions) were drawn at random, while the remaining 23% of the measurements were used for validation. Typically three measurements were performed on each lesion.
- Clusters of lesions are constructed for each of the two classes of lesions, between which discrimination is desired, say L 1 and L 2 clusters of class 1 and class 2, respectively.
- FIG. 11 shows the performance in terms of sensitivity and specificity of our binary classifiers for discriminating between malignant and benign lesions for 144 different, randomly drawn training and validation ensembles. In each of the 144 cases included in Fig. 12 , the data set consisted of 34 malignant lesions and 103 benign lesions, all taken from a set of lesions considered by experienced dermatologists to be suspicious and therefore biopsied.
- FIG. 12 shows the performance of the present binary classifiers for discriminating between malignant and benign lesions in a set of unselected ("all-comer") lesions, similar to that a Primary Care Provider (PCP) is faced with.
- each training and validation set includes 34 malignant lesions (as confirmed by biopsy) and 233 benign lesions (as confirmed by dermatoscopy).
- our final diagnostic indication tool can be considered as capable of providing a PCP with reliable, real-time decisions regarding melanoma referrals.
- the OTD device used comprises a spectral reflectance meter that records 30 spectral reflectance images (1 image set) that constitute 1 measurement of a lesion under examination. Images were recorded at 10 different wavelengths (365-880 nm) from multiple polar and azimuth angles of illumination and detection. The image sets were recorded on a digital video disc and processed independently for creation of physiologic-morphologic maps, as described below. Although dermatoscopic images were also obtained for each lesion, these images were not used in the analysis.
- the following 10 morphological parameters were generated: 1) size; 2) histogram width (providing a measure of inhomogeneity of the reflected intensity); 3) fractal dimension; 4) moment of inertia; 5) asphericity; 6) center distance (representing the physical distance between the geometrical center of the lesion and its center of mass of absorptance); 7) border length; 8) average darkness; 9) area divided by fractal dimension; and 10) border length divided by fractal dimension.
- the developed OTD algorithm misdiagnosed 1 of the melanomas as benign (sensitivity, 99%).
- the OTD specificity for the dermatoscopically benign lesions was 93% (384/415); for the lesions that were clinically suspicious but histopathologically benign, the OTD specificity was 36% (78/217); and for all benign lesions included in the study, the OTD specificity was 73% (462/632).
- the high sensitivity and specificity provided by the systems and methods of the invention can help primary care providers substantially reduce the number of referrals for dermatology consultation, excision, or biopsy.
Landscapes
- Engineering & Computer Science (AREA)
- Health & Medical Sciences (AREA)
- Life Sciences & Earth Sciences (AREA)
- Physics & Mathematics (AREA)
- Theoretical Computer Science (AREA)
- General Physics & Mathematics (AREA)
- General Health & Medical Sciences (AREA)
- Medical Informatics (AREA)
- Multimedia (AREA)
- Computer Vision & Pattern Recognition (AREA)
- Molecular Biology (AREA)
- Biomedical Technology (AREA)
- Surgery (AREA)
- Animal Behavior & Ethology (AREA)
- Veterinary Medicine (AREA)
- Public Health (AREA)
- Heart & Thoracic Surgery (AREA)
- Pathology (AREA)
- Biophysics (AREA)
- Data Mining & Analysis (AREA)
- Artificial Intelligence (AREA)
- Evolutionary Computation (AREA)
- Dermatology (AREA)
- Computing Systems (AREA)
- General Engineering & Computer Science (AREA)
- Evolutionary Biology (AREA)
- Bioinformatics & Cheminformatics (AREA)
- Bioinformatics & Computational Biology (AREA)
- Software Systems (AREA)
- Optics & Photonics (AREA)
- Oral & Maxillofacial Surgery (AREA)
- Dentistry (AREA)
- Quality & Reliability (AREA)
- Nuclear Medicine, Radiotherapy & Molecular Imaging (AREA)
- Radiology & Medical Imaging (AREA)
- Vascular Medicine (AREA)
- Databases & Information Systems (AREA)
- Spectroscopy & Molecular Physics (AREA)
- Measuring And Recording Apparatus For Diagnosis (AREA)
- Investigating Or Analysing Biological Materials (AREA)
Description
- This application claims priority to
U.S. Provisional Application Serial No. 62/293579, filed February 10, 2016 - The present disclosure relates to a method for discriminating between different types of tissue lesions. In particular, the present disclosure is directed to a method for discriminating between malignant and benign tissue lesions.
- Malignant melanoma is one of the most rapidly increasing cancers in the world. Successful treatment of melanoma depends on early detection by clinicians with subsequent surgical removal of tumors. In recent years, considerable effort has been expended on developing optical methods for characterizing tissue and monitoring changes. In 2014, the Canadian Agency for Drugs and Technologies in Health published a report on optical scanners for melanoma detection, discussing three different devices (Aura, MelaFind, and SIMSYS-MoleMate) approved for marketing in Canada and/or USA. See V. Foerster, "Optical scanners for melanoma detection" [Issues in emerging health technologies, Issue 123]. Ottawa: Canadian Agency for Drugs and Technologies in Health (2014). As the report confirms, the 5-year survival rate is 93 to 97% for melanoma detected at an early stage, but drops to between 10 and 20% for advanced stage detection, implying that there is a need for accurate diagnostic devices to enable early detection while avoiding unnecessary biopsies. The devices profiled included Aura (Verisante Technology, Inc., Vancouver, British Columbia, Canada), MelaFind (MELA Sciences, Inc., Irvington, New York, USA), and SIMSYS-MoleMate Skin Imaging System (MedX Health, Inc., Hamilton, Ontario, Canada).
- Aura utilizes near-infrared laser light and Raman spectroscopy to distinguish malignant from benign skin lesions and has shown sensitivities ranging from 90 to 99% for specificities ranging from 58 to 15% for discriminating between benign and malignant lesions.
- MelaFind illuminates the skin at 10 wavelengths, measures light scattered back from the skin, and uses image analysis algorithms combined with a skin disorder database to provide treatment suggestion. For discrimination between melanoma and benign pigmented lesions in a population of suspicious lesions, MelaFind showed 98% sensitivity and 9% specificity in a clinical study involving 1,383 patients with 1,831 pigmented skin lesions.
- SIMSYS-MoleMate Skin Imaging System is based on using a handheld, multispectral scanner and computer software to provide dermatoscopic images, dermal and epidermal pathological characteristics, and the ability to catalogue, monitor, and compare lesions over time. In a randomized controlled trial involving 1,297 patients with 1,580 suspicious pigmented lesions it was found that adding MoleMate to best practices resulted in lower agreement with expert assessment that the lesion was benign and led to a higher proportion of referrals. Relevant prior art includes
US 2015/297130 A1 . - Because so much is at stake with regard to early detection and treatment of cancerous skin lesions, the sensitivity and specificity numbers of the existing optical analysis devices leave room for improvement.
- The scope of the invention is in accordance with the appended claims. Accordingly there is provided a method, as defined in
claim 1. Further optional features are provided in the dependent claims. The specification further includes description of exemplary related systems, not part of the present claims. - The objects and features of the present disclosure, which are believed to be novel, are set forth with particularity in the appended claims. The present disclosure, both as to its organization and manner of operation, together with further objectives and advantages, may be best understood by reference to the following description, taken in connection with the accompanying drawings as set forth below:
-
FIG. 1 shows an OTD system with its handheld unit placed in a docking station and connected to a computing device. -
FIG. 2 shows the inner parts of an OTD handheld unit according to certain embodiments.FIG. 3 shows orientation of some of the inner parts of an OTD handheld unit according to certain embodiments. -
FIG. 4 shows a ray trace of the OTD imaging system according to certain embodiments. -
FIG. 5 shows a dermatoscopic image of a melanoma. -
FIG. 6 shows an RGB image and maps of physiology properties and morphological parameters for the melanoma inFIG. 5 . -
FIG. 7 shows a dermatoscopic image of a compound nevis. -
FIG. 8 shows an RGB image and maps of physiology properties and morphological parameters for the compound nevis inFIG. 7 . -
FIG. 9 shows histograms of two classes of lesions and corresponding smooth representations. -
FIG. 10 shows cumulative distributions corresponding to the smooth histograms ofFIG. 9 . -
FIG. 11 shows sensitivity (red) and specificity (blue) for 144 different randomly drawn training and validation sets each consisting of 137 lesions considered to be suspicious. -
FIG. 12 shows sensitivity (red) and specificity (blue) for 144 different randomly drawn training and validation sets each consisting of 267 lesions. - The present invention relates to methods for discriminating between different types of tissue lesions. In particular, the present invention is directed to optical methods for discriminating between malignant and benign tissue lesions.
- In arrangements of the specification, an optical transfer device is used to image a tissue lesion for analysis. An optical transfer diagnosis (OTD) device, of arrangements, is a spectral radiometer that records a set of 30 images, constituting a lesion measurement, in less than 10 seconds. Images are recorded at 10 different wavelengths (from about 365-about 880 nm) from multiple angles of illumination and detection.
- As shown in
FIG. 1 , theOTD system 101 may consist of ahandheld unit 103, adocking station 105, and a laptop PC orother computing device 107 comprising aprocessor 109 coupled to a tangible,non-transient memory 111. Thehandheld unit 103 may include a release button to initiate image recording. Other controls may be performed via a user interface on the attachedcomputing device 107. When not in use, thehandheld unit 103 is placed in thedocking station 105, where the observation window of the device is placed against a calibration target. -
FIG. 2 shows the inner parts of an exemplary handheld OTD unit. A sensor head may contain an illuminating system consisting of, for example, 12 LED or other light-providingdevices 305 and an imaging system comprising at least onecamera 307 and a series ofmirrors 303, as shown inFIG. 3 . - An exemplary illuminating system shown consists of 12 fixed light-emitting diode (LED) lamps. Each LED is placed at a different angle relative to the skin to enhance the ability to retrieve depth information. The polar angles of the LEDs vary between 30 and 45 degrees and the relative azimuth angles between 34 and 145 degrees. The polar angles for the detectors vary between 0 and 45 degrees, and the relative azimuth angles between 0 and 180 degrees.
- An exemplary imaging system for a handheld OTD device consists of one correcting lens placed inside the handle plus another correcting lens and five mirrors placed inside a sensor head and a sapphire glass observation window that contacts the area of the skin lesion. OTD devices may comprise a camera sensor consisting of, for example, an IEEE (Institute of Electrical and Electronics Engineers) 1394 FireWire camera.
- As indicated in
FIG. 4 , the five mirrors may be used to image the same area of the skin viewed from three different angles on three different sections of the camera sensor. To compensate for different object distances for the three angular views, the camera sensor may be slightly tilted relative to the optical axis.FIG. 4 illustrates a ray trace of the OTD imaging system according to certain embodiments, where IS: Image sensor; L1: Camera lens; L2:Correcting lens 1; L3:Correcting lens 2; M1: Plane mirror for central view image; M2, M3: Plane mirrors for upper 30 degree oblique image; M4, M5: Plane mirrors for lower 45 degree oblique image; and W: Sapphire glass window. - An alcohol-based gel interface may be used where the sapphire observation window contacts the skin to provide refractive-index matching and avoid rough-surface scattering, and to obtain illumination and imaging of a selected area of the skin through the circular sapphire observation window. In preferred arrangements, the observation window may be between about 1.5 and about 5 cm in diameter and may be, for example, about 2 cm.
- In certain embodiments, images for analysis using methods of the invention may be obtained using imaging devices such as a dermatoscope, digital camera, smartphone, or tablet. Single or multiple images may be obtained for analysis and, where multiple images are obtained, they may be obtained at different angles of illumination and detection. Where images are obtained using a dermatoscope, digital camera or a mobile device including a camera (e.g., mobile phone or tablet with camera and LED or other source of illumination or flash), the device may prompt a user, via a program stored on a non-transient, tangible memory, to capture a series of images at prescribed orientations relative to a lesion. In certain embodiments, the device camera and/or orienting devices such as gyroscopic or global positioning system features of the device may be used to determine orientation of the camera and light source with respect to the lesion. The imaging device may be configured to determine when the desired orientation has been achieved and to automatically capture an image or series of images or prompt a user to capture the image once the appropriate orientation is reached. Each image may be tagged by the device with the angles of illumination and detection at which the image was obtained.
- On the basis of established absorption and transmission spectra for known skin chromophores and mathematical modeling of skin reflectance, a set of recorded images may be used to create maps of physiology properties and morphological parameters of the lesion, which are assumed to be different for benign and malignant tissue. Exemplary maps are shown in
FIGS. 6 and8 . The map creation is based on (i) a bio-optical model that relates physiological properties of skin tissue to its inherent optical properties, (ii) a radiative transfer model that for a given set of inherent optical properties computes the light backscattered from the skin for a given wavelength and direction of illumination, and (iii) a nonlinear inversion algorithm that compares the computed backscattered light at various wavelengths and directions with that of the recorded image set. - The data acquisition geometry is designed in such a way that for each combination of illumination and detection directions, the same area of the skin is interrogated. This allows a one-dimensional treatment when the independent-column approximation is invoked and the skin tissue is assumed to have a layered structure: an uppermost layer, the epidermis, consisting of an upper part and a lower part; the dermis, containing the blood circulation; and the subcutis, a strongly scattering fat-containing layer. The inherent optical properties of each layer are the absorption and scattering coefficients as well as the scattering phase function (describing the angular variation of the scattered light), each varying with wavelength. The retrieved physiology properties and morphological parameters are (1) percentage of hemoglobin concentration, (2) percentage of hemoglobin oxygenation, (3) upper epidermal thickness, (4) lower epidermal thickness, (5) percentage of melanosome concentration in upper epidermis, (6) percentage of melanosome concentration in lower epidermis, and (7) percentage of keratin concentration. Each of these seven physiology properties or morphological parameters is retrieved pixel by pixel in the compressed image to create a map covering the zoomed lesion area.
- From each map, an entropy value may be calculated and cross entropy values are calculated for different pairs of maps. The entropy concept used here is similar to that used in statistical physics and information theory. For example, from the spatial distribution of the melanosome concentration, the entropy of this parameter is computed as the melanosome concentration multiplied by its logarithm and integrated over the area of the lesion. These entropy and cross entropy values may be used to define diagnostic parameters, as discussed below.
- According to certain arrangements of the specification, lesion measurements may comprise a set of 30 images recorded by an OTD scanner. For a given wavelength and direction of illumination, the OTD scanner of the invention records three images simultaneously at different detection angles. This procedure may be repeated for 9 other wavelengths in the range from the near ultraviolet to the near infrared at different illumination angles to produce a lesion measurement that comprises a set of 30 images.
- For any of the 30 images, each pixel corresponds to (i) a particular distance from one of the 10 LED sources of different intensity, (ii) a particular size of the of skin area for each of the 20 images that are recorded by one of the two side-viewing cameras; and (iii) a particular location of the illuminated skin area because of possible movement of the skin with respect to the OTD scanner during the few seconds of sequential illumination by the 10 LEDs.
- To address issues (i)-(iii) above, a series of pre-processing steps may be performed, including (1) according to
claim 1 relative calibration such that the intensity of each pixel is measured in units of the intensity due to backscattering for a corresponding pixel from a target having a Lambert surface; (2) geometrical calibration such that an ellipse of illuminated skin area for a side-viewing camera is transformed into a circle; (3) image registration such that each pixel in any of the 30 images corresponds to the same area of the skin; (4) compression such that the raw image having about 7 × 106 pixels with a spatial resolution of about 25µm is replaced by a smoothed image with a total number of pixels that is 100 times less than that of the raw image. Thus, the compressed image has 10 times less spatial resolution than the raw image, and a byproduct of compression is filtering of spatial high-frequency noise in the raw images due to possible spikes, specular points, and hairs. - Automated zooming is employed to provide a lesion mask that circumferences the lesion and is characteristic of its shape, and a surrounding mask that creates an area outside the lesion of suitable size and the same outer shape as that of the lesion mask. The zooming can provide rotation, translation, and scaling invariant characteristics of the lesion under investigation, both for calibrated images and maps of physiology properties and morphological parameters. Also, zooming can accelerate the processing since only pixels of the lesion and surrounding masks are considered.
-
FIG. 5 shows a dermatoscopic image of a melanoma, whileFIG. 6 shows the corresponding RGB image and maps of physiology properties and morphological parameters obtained from OTD recordings and processing using systems and methods of the invention.FIGS. 7 and8 show corresponding results for a compound nevus. Clearly, the maps of physiology properties and morphological parameters inFig. 6 for a melanoma are quite different from those inFig. 8 for a compound nevus, indicating that these maps may prove useful in discriminating between benign pigmented lesion and melanomas. As noted above, from these maps, entropy and cross entropy values are calculated and used to define diagnostic parameters, as discussed below. - From the calibrated, registered, compressed, and zoomed OTD image of a lesion obtained from nadir illumination by green light (hereafter referred to as the `nadir green image') the following 10 morphological parameters may be derived: (1) Size; (2) Histogram width (providing a measure of inhomogeneity of the reflected intensity); (3) Fractal dimension; (4) Moment of inertia; (5) Asphericity; (6) Center distance (representing the physical distance between the geometrical center of the lesion and the center of mass of absorptance); (7) Border length; (8) Average darkness; (9) Area divided by fractal dimension; and (10) Border length divided by fractal dimension.
- From the seven maps created from the images, seven entropies and 21 cross entropies are derived, providing a total of 28 physiology properties and morphological parameters. By including also the logarithm of each of the 10 morphological parameters obtained from the nadir green image and the 28 entropy and cross entropy values derived from the seven maps, one obtains a total of 76 diagnostic parameters.
- Another 10 diagnostic parameters are derived from the maps of physiology properties:
- (1) Maximum value of the melanin optical depth in the lesion area;
- (2) Architectural disorder: ratio of maximum to minimum value of the melanin optical depth in the lesion area;
- (3) Blood filling: maximum value of blood content in the surrounding area;
- (4) Angiogenesis: ratio of the number of blood vessels in a surrounding area close to the lesion border to that in an area farther from the lesion border, given by C 1 A 1 L 2=C 2 A 2 L 1, where (with j = 1, 2) C j is the blood concentration in area A j, and L j is the distance from the center of the lesion to the outer border of area A j. Here A 1 is a surrounding area close to the lesion border, and A 2 is a surrounding area farther from the lesion border;
- (5) Ratio of the blood oxygenation in a surrounding area close to the lesion border to that in an area farther from the lesion border, given by C' 1A 1 L 2 =C'2 A 2 L 1, where (with j = 1, 2)

- (6) Melanin contrast: ratio of the total melanin optical depth in the lesion area to that in the surrounding area;
- (7) Blood contrast: ratio of the blood content in the lesion area to that in the surrounding area;
- (8) High spatial Fourier-components of the map of total melanin optical depth in the lesion area (natural region of interest (RoI), standard gridding);
- (9) Entropy of contrast of the map of total melanin optical depth in the lesion area (natural RoI, standard gridding);
- (10) The same entropy of contrast as above, but in the original RoI.
- Above, natural RoI represents a rectangular area that is oriented in accordance with the shape of the lesion, and "standard gridding" means that along the longest side of the natural RoI there are 100 grid points. The "original RoI" is the rectangular zoom area of the compressed digital image. As discussed above, there are N = 86 diagnostic parameters p j (j = 1, 2, ..., N): 2 × 10 morphological parameters derived from the nadir green image; 2 × 28 entropies and cross entropies derived from maps of physiology properties and morphological parameters; and 10 additional physiology parameters derived from maps of physiology properties.
- For each independent lesion measurement, a diagnostic index D may be defined as a weighted sum of the diagnostic parameters p j:

- Here the weight vector w consists of N weights w j (j = 1, 2, ..., N), and p is a vector of N diagnostic parameters p j.
- Clustering is used to obtain a reliable and robust discrimination between
class 1 andclass 2 lesions through the identification of a set ofclass 1 clusters, each comprising a certain number of independent measurements onclass 1 lesions, and another set ofclass 2 clusters, each comprising a certain number of independent measurements onclass 2 lesions. A diagnostic indication algorithm can be trained by considering a set of lesions, some belonging toclass 1 and others toclass 2, for each of which the diagnosis is known, and letting each independent lesion measurement be characterized by N diagnostic parameters p j (j = 1, 2, ..., N). The first step of the clustering procedure is to discretize the diagnostic parameter p j as follows: - 1. Calculate its mean value µj by averaging over the set of independent measurements on
class 2 lesions and its standard deviation σj by averaging over the set of independent measurements onclass 1 lesions, which has higher variability than the set of measurements onclass 2 lesions. - 2. Discretize p j by setting it equal to p* j, where

class 2 lesions. Thus, each discretized diagnostic parameter p * j has a value different from zero only if the value of p * j is sufficiently far away from the mean value µj. - The definition of a clustering index for an independent lesion measurement is based on constructing coincidence vectors C+ and C- and probabilistic vectors t+ and t-:

- The clustering index C for an independent measurement on either a
class 1 or aclass 2 lesion is given by:
- The independent measurements are ordered in accordance with the value of the clustering index, and independent measurements having values of the clustering index in a specific interval are taken to belong to the same cluster.
- To construct clusters of independent measurements on
class 1 lesions relative to the entire set of independent measurements onclass 2 lesions, theclass 1 measurement having the highest clustering index is taken, as given by Eq. (4). Then cm independent measurements are added to this one to obtain a total of c m+1 independent measurements in this first cluster, where cm is obtained from the requirement that the function F(c), given by
class 1 lesions, and S(c) is the specificity, i.e. the ratio between the number of correctly classified independent measurements onclass 2 lesions and the total number of independent measurements onclass 2 lesions. The second factor on the right-hand side of Eq. (5), which increases monotonically with c, linearly for small values and then more slowly, allows for inclusion of many independent measurements in a cluster, but its influence gets weaker as the number c increases, making the specificity decisive. - The number cm of ordered independent measurements on
class 1 lesions relative to the entire set of independent measurements onclass 2 lesions may then found such that the corresponding cluster provides a maximum value of the function F(c) in Eq. (5) for ic = cm. Here ordered implies that the independent measurements are placed in sequential order in accordance with the value of the clustering index. Let us define a virtual cluster as a cluster with a number c of ordered independent measurements onclass 1 lesions relative to the entire set of independent measurements onclass 2 lesions, whereas the corresponding actual cluster contains the optimum number c = cm of ordered independent measurements onclass 1 lesions relative to the entire set of independent measurements onclass 2 lesions. The details of an exemplary cluster construction procedure is as follows: - 1. Consider a virtual cluster defined by the number c relative to the entire set of independent measurements on
class 2 lesions. Start by letting c = 1, then add one ordered independent measurement onclass 1 lesions, so that c becomes equal to 2, and apply the procedure described in items 2-5 below. - 2. Minimize the cost function in Eq. (14) to obtain an optimal generalized weight vector e that gives a diagnostic index value D, as defined in Eq. (15), for an independent measurement on a lesion belonging to either
class 1 orclass 2. - 3. Calculate the diagnostic index values (D values) (i) for all ordered independent measurements on
class 1 lesions in the given virtual cluster and (ii) for all independent measurements onclass 2 lesions. - 4. Choose a threshold for the D values (after the calculation of D values in
item 3 above) to obtain a binary classification rule, according to which an independent measurement having a D value that is larger (smaller) than the threshold value corresponds to a class 1 (class 2) lesion. Thus, all independent measurements belonging toclass 1 have D values larger than the threshold value, implying 100% of correctly classified independent measurements onclass 1 lesions (i.e. sensitivity of 100%). - 5. For the chosen threshold, calculate the specificity S(c) in Eq. (5), which is the number of correctly classified independent measurements on
class 2 lesions (having D values smaller than the threshold) divided by the total number of independent measurements onclass 2 lesions in the training ensemble. Check whether F(c) in Eq. (5) increased due to the addition of one ordered independent measurement onclass 1 lesions. If it did not increase, let the current value of c be equal to cm. Otherwise, increase the number c by 1 and return toitem 2 above - 6. Typically, three independent measurements are performed on each lesion, and if two of the three independent measurements are found to belong to the same cluster, then the third independent measurement is also taken to belong to that cluster. If only one of three independent measurements on a lesion is found to belong to a cluster, the lesion is not included in that cluster, but left for further consideration in the clustering process.
- 7. Construct the next cluster belonging to the remaining set of measurements on
class 1 lesions relative to the entire set of measurements onclass 2 lesions in a similar manner, starting with the measurement having the highest clustering index among the lesion measurements not included in the previous cluster. - Suppose a total of L 1 clusters is constructed of independent measurements on
class 1 lesions relative to the entire set of independent measurements onclass 2 lesions. Similarly to what was done in the construction of clusters of independent measurements onclass 1 lesions, the independent measurement onclass 2 lesions having the highest clustering index are taken, as defined in Eq. (4), and cm independent measurements are added to this independent measurement to obtain a total of cm + 1 measurements in this first cluster amongclass 2 lesions, where cm is obtained from the requirement that the function F(c), given by Eq. (5), shall have its maximum value when c = cm . Here C is the total number of measurements belonging to the available set of independent measurements onclass 2 lesions, and S(c) is the sum of specificities for the cluster under construction vs. each of the clusters ofclass 1 lesions. The specificity S(c) for the cluster under construction vs. cluster #i ofclass 1 lesions is the ratio between the number of correctly classified measurements ofclass 2 lesions and the total number of measurements onclass 2 lesions contained in the cluster under construction. Thus, S(c) is given by
- The clustering procedure can then be carried out similarly to the procedure enumerated above for
class 1 lesions relative to the entire set ofclass 2 lesions. - Optimal values of the weights in Eq. (1) are then determined for separation between the two classes of lesions, called
class 1 andclass 2. The dimension of the optimization problem is reduced by (i) introducing a covariance matrix for independent measurements on lesions ofclass 1 andclass 2, where the two classes are chosen such that the trace of the covariance matrix forclass 1 lesions is larger than that forclass 2 lesions, (ii) defining a discriminating operator in terms of the two covariance matrices, (iii) constructing eigenvectors and eigenvalues on the basis of the discriminating operator and using only those eigenvalues that are larger than a threshold value, chosen so as to ensure that sufficiently large variations of the diagnostic parameters associated with independent measurements onclass 1 lesions are accounted for, and (iv) defining for each independent measurement on a lesion ofclass 1 or class 2 a set of generalized diagnostic parameters. As a result, Eq. (1) becomes
- In order to reduce the dimension of the optimization problem, a set of generalized diagnostic parameters is defined by introducing a covariance matrix for each of the two classes of lesions, given by



class 1 have a larger value of the trace of the covariance matrix than those belonging toclass 2, i.e. Tr{Ṽ(1)} > Tr{V̂(2)}. The next step is to introduce a discriminating operator, defined by
class 1 andclass 2 and reduce the dimension of the optimization problem we extract eigenvectors dα according to
class 1 lesions. - For an independent measurement on a lesion of
class 1 orclass 2, we define a vector p̃ of generalized diagnostic parameters:
class 2 lesions. - The condition α k > α min leads to a substantial reduction in the number of diagnostic parameters. Thus, the number Ñ of generalized diagnostic parameters is typically only one third of the number N = 86 of original diagnostic parameters. The generalized diagnostic index for an independent measurement on a lesion of
class 1 orclass 2 is given by:
- To determine optimal values of the weights in Eq. (5) a cost function is defined, consisting of a master term and a constraint term, where the latter is used to constrain the length of the weight vector to lie on the surface of a hypersphere in Ndimensions of radius equal to 1. For discussion of the master term of the cost function, consider a set of independent lesion measurements that is divided into one subset of independent measurements on lesions belonging to
class 1 and another subset of independent measurements on lesions belonging toclass 2. As an example,class 1 could comprise independent measurements on malignant lesions andclass 2 independent measurements on benign lesions. - For each generalized weight vector w̃, the corresponding generalized diagnostic index D 1(w̃) is computed for each of the
class 1 independent lesion measurements as well as the corresponding generalized diagnostic index D 2(w̃) for each of theclass 2 independent lesion measurements. Next, the mean values 〈D 1〉 and 〈D 2〉 and the corresponding standard deviations σ1 and σ2 are computed. The master term of the cost function is given in terms of these parameters as
class 1 andclass 2 lesions. After minimization of the cost function, Eq. (7) becomes
- For a pair of opposite clusters, consisting of cluster #i of
class 1 lesions and cluster #j ofclass 2 lesions, a probabilistic characterization of an expert can be obtained by proceeding as follows: - 1. For each independent lesion measurement included in a pair of opposite clusters, the D value is computed, given by Eq. (15), where e is the expert.
- 2. Two histograms may be constructed, one for each of the clusters in the pair, where each histogram represents the number of independent measurements having D values within different bins in the interval between the minimum D value (Dmin ) and the maximum D value (D max).
Here Dmin is the absolute value of the largest negative D value forclass 2 lesions (see blue curve inFIG. 9 ), and Dmax is the largest D value forclass 1 lesions (see red curve inFIG. 9 ). As a result, the two histograms are obtained (red forclass 1 and blue for class 2) as illustrated by the vertical lines inFIG. 9 . - 3. Next, the corresponding two smooth histograms shown in
FIG. 9 are constructed that represent probability density functions (pdfs). - 4. Finally, the blue (class 2) pdf in
FIG. 9 is integrated from Dmin to a given D value and the red (class 1) pdf from a given D value to Dmax to obtain the corresponding cumulative distributions inFIG. 10 . - For an independent lesion measurement having a certain D value, the corresponding points on the two distribution curves in
FIG. 10 may be interpreted as partial reliabilities of a diagnostic indication. - If

FIG. 10 and

- The number of
class 1 andclass 2 clusters may be represented by L 1 and L 2, respectively, and a modified diagnostic index D̃ can be defined by

- The diagnostic indication by a team of experts associated with a randomly drawn training ensemble comprised of L1 and L2 clusters of
class 1 andclass 2, respectively, is that if D given by Eq. (16) is greater than or equal to zero, then the measurement is regarded to represent aclass 1 lesion. Typically three measurements are taken of each lesion, and the diagnostic indication for a lesion by a team of experts associated with this randomly drawn training ensemble is that if the mean value of the modified diagnostic indices D given by Eq. (16) for the measurements taken is greater than or equal to zero, the lesion is regarded to be ofclass 1. This diagnostic indication constitutes a nonlinear binary classifier. - In order to construct a final diagnostic indication tool, a large number of different training and validation ensembles may be drawn at random (for example, K = 144 such ensembles, see
FIGS. 11 and12 ) by proceeding as follows: - 1. Drawing at random a major part (e.g. 77%) of the independent measurements on lesions belonging to each of
class 1 andclass 2 and let them constitute a training ensemble, and let the remaining independent lesion measurements constitute a validation ensemble. All multiple measurements on any lesion are included into either the training or the validation ensemble. - 2. The above procedure is repeated K = 144 times to obtain K different training and validation ensembles, where each randomly drawn training ensemble consists of a major part (e.g. 77%) of the independent measurements on lesions belonging to each of
class 1 andclass 2, and where the corresponding validation ensemble consists of the remaining independent lesion measurements. - 3. Constructing statistically independent experts by
- (a) using the set of all experts e j(i) arising from K randomly drawn training ensembles, where j(i) = 1, 2, ..., J(i), i = 1, 2, ..., K (with J(i) being the number of experts associated with randomly drawn training ensemble #i) and the corresponding derivatives

class 1, given by
- (b) finding the principal components sλ ( λ= 1, 2, ..., L *) of S; and
- (c) selecting, for each value of λ, those three experts that have the largest values of the scalar product e j(i) * sλ to obtain 3 × L* candidate experts, and hence 3 L* possible combinations of experts for the final diagnostic indication tool.
- (a) using the set of all experts e j(i) arising from K randomly drawn training ensembles, where j(i) = 1, 2, ..., J(i), i = 1, 2, ..., K (with J(i) being the number of experts associated with randomly drawn training ensemble #i) and the corresponding derivatives
- The best combination of experts for the final diagnostic indication tool can be obtained by constructing the matrices

- The final diagnostic indication tool described above may be applied to an unknown lesion measurement as follows:
- 1. For each of the L * "best" experts of the final diagnostic indication tool, the diagnostic index is calculated for the unknown lesion measurement, and the corresponding reliability values for
class 1 andclass 2 are found. - 2. If the sum of the four largest values of the difference between the reliability for
class 1 and that forclass 2 is greater than zero, the indication is regarded to be that of aclass 1 lesion. - In order to increase the robustness of the maps of physiology properties and morphology parameters obtained by the OTD inversion procedure, statistical information extracted from multiple measurements (typically three) of each lesion may be employed. After compression, each of the 30 images comprising a lesion measurement consists of approximately 10,000 pixels. For each of the 10 different wavelengths λi (i = 1, 2, ..., 10), the average value I λi,m may be computed for measurement #m of the reflected light for each pixel inside the area surrounding the lesion:





- An estimate of the misfit between measured and simulated reflected light for a given pixel (after compression) is given by:

where i λi, n is the measured reflected light for pixel #n and wavelength λi, and i λi,n is the simulated reflected light for pixel #n and wavelength λi. - Use of the result in Eq. (26) in the inversion procedure makes the resulting maps of physiology properties and morphological parameters more robust. Thus, the difference between maps obtained from different measurements of the same lesion becomes significantly smaller. This modification of the inversion procedure requires that it is possible to identify the same area (in the present case the surrounding area of the lesion, which is much brighter than the lesion area) in images corresponding to different measurements of the same lesion and also in images corresponding to different wavelengths λi. It can be shown that the reduced variance of integrated parameters, such as the entropies, will result in increased robustness in the sense of reduced variance of the diagnostic parameters pij (i = 1, 2, ..., N) among multiple measurements on the same lesion #i.
- The classification scheme was developed and optimized on a clinical data set consisting of 1,495 lesion images collected in several clinical studies using OTD devices from 2005 to date. A final diagnostic indication tool was constructed based on K = 144 different diagnostic indication rules, each designed to discriminate between suspicious and benign lesions in a population of unselected ("all-comer") lesions. For training of any of these K diagnostic indication rules 77% of all available measurements performed on a total of 712 lesions (including 80 malignant lesions) were drawn at random, while the remaining 23% of the measurements were used for validation. Typically three measurements were performed on each lesion. For the 712 lesions used for training and validation, the histopathological diagnoses for the dermatoscopically suspicious lesions as well as the diagnoses for the dermatoscopically benign lesions are given in Table 1.
Table 1 Type of lesion No. of lesions Melanoma (n = 64) in situ 21 invasive 43 Basal cell carcinoma (n = 13) pigmented basal cell carcinoma 5 reticulated basal cell carcinoma 1 superficial basal cell carcinoma 3 nodular basal cell carcinoma 4 Squamous cell carcinoma (n = 3) in situ 2 invasive 1 Nevus (n = 604) ordinary compound 551 inflamed compound 3 irritated compound 3 congenital compound 1 lentiginous compound 1 traumatized compound 1 mildly dysplastic melanocytic 1 spitz 1 ordinary junctional 28 lentiginous junctional 2 dermal 9 intradermal 3 Keratosis (n = 28) porokeratosis 2 pigmented actinic keratosis 9 pigmented seborrheic keratosis 15 lichenoid actinic keratosis 2 - Clusters of lesions are constructed for each of the two classes of lesions, between which discrimination is desired, say L 1 and L 2 clusters of
class 1 andclass 2, respectively. Each of the randomly drawn K = 144 training and validation ensembles gives its own diagnostic indication rule, so in total there will be 144 different diagnostic indication rules, and for each of them there will be L 1 × L 2 different experts (nonlinear binary classifiers), each between a pair of opposite clusters. Thus, in total there will be about L 1 × L 2 × 144 different experts. Typically, there will be 5 or 6 clusters of each class. As an example, if there were L 1 = 6 clusters ofclass 1 and L 2 = 5 ofclass 2, the total number of experts would be 4,320, among which, only the L * "best" experts would be used for construction of the final diagnostic indication tool. - The accuracy A of a binary classifier is a measure of how correctly it can identify elements belonging to each of two classes, i.e.

- Alternatively, the accuracy can be expressed in terms of the sensitivity and specificity and the occurrence rates of the elements belonging to the two classes. If the occurrence rate is N 1 for
class 1 and N 2 forclass 2, and a binary classifier has sensitivity Se and specificity Sp, a measure of the accuracy is given by
FIG. 11 shows the performance in terms of sensitivity and specificity of our binary classifiers for discriminating between malignant and benign lesions for 144 different, randomly drawn training and validation ensembles. In each of the 144 cases included inFig. 12 , the data set consisted of 34 malignant lesions and 103 benign lesions, all taken from a set of lesions considered by experienced dermatologists to be suspicious and therefore biopsied. In each case, the classifier was trained using 77% of the available data, chosen at random, while the remaining 23% of the data not used for training constituted a validation set. FromFig. 12 , the sensitivity and specificity are estimated to be 0.95 and 0.20, respectively, so that Eq. (28) gives
- In the US, around 2.5-3 million skin lesions are biopsied annually and a fraction of these - between 50,000 and 100,000 - are diagnosed as melanoma, implying that according to Eq. (11), the accuracy is less than 0.04:


- This result implies that the final diagnostic indication tool can serve as a well-qualified expert, acting in a fast automatic mode to help dermatologists arrive at the correct decision for complicated cases, and thus help eliminate unnecessary biopsies.
-
FIG. 12 shows the performance of the present binary classifiers for discriminating between malignant and benign lesions in a set of unselected ("all-comer") lesions, similar to that a Primary Care Provider (PCP) is faced with. In this case, each training and validation set includes 34 malignant lesions (as confirmed by biopsy) and 233 benign lesions (as confirmed by dermatoscopy). FromFIG. 12 , the sensitivity and specificity are estimated to be 0.95 and 0.85, respectively, so that Eq. (28) gives
- Since the occurrence rate of malignant lesions in an all-comer study is very low, the accuracy of our classifier is expected to be close to the value above of 0.86, which is much higher than the accuracy of a PCP. Thus, our final diagnostic indication tool can be considered as capable of providing a PCP with reliable, real-time decisions regarding melanoma referrals.
- Lesions from 296 patients were scanned prospectively using an OTD device of the invention. A total of 712 lesions from 2 referral sources were imaged. Clinically benign lesions from the skin of volunteers accounted for 415 lesions. These lesions were chosen on the basis of normal dermatoscopic patterns and the absence of melanoma-specific criteria. In addition, the patients reported no known change in the lesion or any symptoms, and most patients had undergone full-body photography that documented no change. Biopsies were not obtained for these lesions.
- Clinically suspicious lesions accounted for the remaining 297 scans and were chosen on the basis of clinical and dermatoscopic findings.
- The clinically suspicious lesions were removed in toto with a saucerization excision technique and sent for histopathologic processing and examination. Pathologic specimens were processed with hematoxylin-eosin staining and, when indicated, immunohistochemical staining with Melan-A. (One lesion was a seborrheic keratosis and did not undergo immuno staining.)
- Two dermatopathologists independently reviewed all specimens and rendered the diagnoses. Prior to removal, three OTD image sets were obtained from each lesion. The time needed to acquire each set was less than 10 seconds.
- The OTD device used comprises a spectral reflectance meter that records 30 spectral reflectance images (1 image set) that constitute 1 measurement of a lesion under examination. Images were recorded at 10 different wavelengths (365-880 nm) from multiple polar and azimuth angles of illumination and detection. The image sets were recorded on a digital video disc and processed independently for creation of physiologic-morphologic maps, as described below. Although dermatoscopic images were also obtained for each lesion, these images were not used in the analysis.
- Established absorption and transmission spectra for known skin chromophores and mathematical modeling of skin reflectance were used in analyzing the images. The images from each set were used to derive physiologic-morphologic maps of the lesions for the following seven parameters: percentage of hemoglobin concentration, percentage of hemoglobin oxygenation, upper epidermal thickness, lower epidermal thickness, percentage of upper melanin concentration, percentage of lower melanin concentration, and percentage of keratin concentration. From each physiologic-morphologic map, an entropy value was calculated and cross-entropy values were calculated between different pairs of maps. The entropy value provides a measure of the disorder in any one of the maps, and the cross-entropy value provides a measure of the correlation between 2 different maps. In addition, from a single green image for a wavelength of 510 nm, the following 10 morphological parameters were generated: 1) size; 2) histogram width (providing a measure of inhomogeneity of the reflected intensity); 3) fractal dimension; 4) moment of inertia; 5) asphericity; 6) center distance (representing the physical distance between the geometrical center of the lesion and its center of mass of absorptance); 7) border length; 8) average darkness; 9) area divided by fractal dimension; and 10) border length divided by fractal dimension.
- For the 7 physiologic-morphologic maps, 28 weights were assigned to the entropy and cross-entropy values, and 28 weights to their logarithms. Similarly, 10 weights were assigned to the 10 morphological parameters and 10 to their logarithms. Another 10 diagnostic parameters were derived from the 7 maps, giving a total of 86 assigned weights. An OTD indication algorithm of the invention was optimized on a clinical data set consisting of 1,495 lesion images collected in several clinical studies from 2005 to present. By comparing the OTD diagnosis of melanoma or nonmelanoma with pathology or dermatoscopy results obtained from clinical data from 712 lesions, an OTD indication algorithm of the present invention was optimized and developed.
- A total of 712 lesions were imaged, including 415 clinically and dermatoscopically benign lesions, 217 clinically suspicious but histopathologically benign lesions, and 80 malignant lesions (64 melanomas, 13 basal cell carcinomas, and 3 squamous cell carcinomas). The developed OTD algorithm misdiagnosed 1 of the melanomas as benign (sensitivity, 99%). The OTD specificity for the dermatoscopically benign lesions was 93% (384/415); for the lesions that were clinically suspicious but histopathologically benign, the OTD specificity was 36% (78/217); and for all benign lesions included in the study, the OTD specificity was 73% (462/632).
- In practice, the high sensitivity and specificity provided by the systems and methods of the invention can help primary care providers substantially reduce the number of referrals for dermatology consultation, excision, or biopsy.
Claims (9)
- A method for discriminating between benign and malignant skin lesions, the method comprising the steps of:generating an image of a skin lesion;performing relative reflectance calibration of the image, wherein the image undergoes relative reflectance calibration comprising measuring intensity of each pixel due to backscattering for a corresponding pixel from a target having a Lambert surface;performing compression of the image wherein the image of the skin lesion is replaced with a smoothed image having 10 times less spatial resolution than the image;performing zooming of the image to create lesion and surrounding area masks in the image;creating, for each of a plurality of physiological properties and morphological parameters, a spatial distribution map covering the area of the skin lesion from the image of the skin lesion;determining entropy values for each of the spatial distribution maps;determining cross entropy values between pairs of the spatial distribution maps;determining, from image, a plurality of morphological parameters;deriving, from the spatial distribution maps of physiological properties and morphological parameters, a plurality of additional diagnostic parameters, the additional diagnostic parameters being selected from the group consisting of maximum value of melanin optical depth; architectural disorder; blood filling; angiogenesis; ratio of blood oxygenation in an area surrounding a lesion border; melanin contrast; blood contrast; high spatial Fourier-components of a map of total melanin optical depth over a lesion area; and entropy of contrast of the map of total melanin optical depth over the lesion area;creating one or more diagnostic indices from the weighted sum of the entropy values, the cross entropy values, the plurality of morphological parameters, and the plurality of additional diagnostic parameters, using one or more weight vectors;determining for each of the one or more diagnostic indices, a reliability value for classification as benign and a reliability value for classification as malignant; andclassifying the skin lesion as benign where the reliability value for classification as benign is greater than the reliability value for classification as malignant.
- The method of claim 1 wherein the physiological properties and morphological parameters obtained through inversion are selected from the group consisting of percentage of hemoglobin concentration; percentage of hemoglobin oxygenation; upper epidermal thickness; lower epidermal thickness; percentage of melanosome concentration in upper epidermis; percentage of melanosome concentration in lower epidermis; and percentage of keratin concentration.
- The method of claim 1 wherein the additional morphological parameters obtained from a nadir image are selected from the group consisting of size; histogram width; fractal dimension; moment of inertia; asphericity; center distance; border length; average darkness; area divided by fractal dimension; and border length divided by fractal dimension.
- The method of claim 1 wherein the one or more weight vectors are determined using clustering analysis of a plurality of pigmented skin lesion images known to be benign or malignant.
- The method of claim 1 wherein the image of the skin lesion is generated by a dermatoscope.
- The method of claim 1 wherein the image of the skin lesion is generated using an optical transfer diagnosis (OTD) system comprising a handheld OTD unit in communication with a computing device.
- The method of claim 1 wherein the image of the skin lesion is generated using a smart phone.
- The method of claim 1 wherein the image of the skin lesion is generated using a tablet.
- The method of claim 1 wherein the image of the skin lesion is generated using a digital camera.
Applications Claiming Priority (2)
| Application Number | Priority Date | Filing Date | Title |
|---|---|---|---|
| US201662293579P | 2016-02-10 | 2016-02-10 | |
| PCT/US2017/017450 WO2017139632A1 (en) | 2016-02-10 | 2017-02-10 | Systems and methods for evaluating pigmented tissue lesions |
Publications (3)
| Publication Number | Publication Date |
|---|---|
| EP3413790A1 EP3413790A1 (en) | 2018-12-19 |
| EP3413790A4 EP3413790A4 (en) | 2019-10-16 |
| EP3413790B1 true EP3413790B1 (en) | 2025-01-29 |
Family
ID=59496052
Family Applications (1)
| Application Number | Title | Priority Date | Filing Date |
|---|---|---|---|
| EP17750864.5A Active EP3413790B1 (en) | 2016-02-10 | 2017-02-10 | Systems and methods for evaluating pigmented tissue lesions |
Country Status (5)
| Country | Link |
|---|---|
| US (1) | US10413232B2 (en) |
| EP (1) | EP3413790B1 (en) |
| AU (1) | AU2017217944B2 (en) |
| CA (2) | CA3204854A1 (en) |
| WO (1) | WO2017139632A1 (en) |
Families Citing this family (13)
| Publication number | Priority date | Publication date | Assignee | Title |
|---|---|---|---|---|
| US11341631B2 (en) * | 2017-08-09 | 2022-05-24 | Shenzhen Keya Medical Technology Corporation | System and method for automatically detecting a physiological condition from a medical image of a patient |
| EP3505048A1 (en) | 2017-12-28 | 2019-07-03 | Koninklijke Philips N.V. | Optical skin sensor using optimal spectral bands to minimize the effect of probe pressure |
| US20190311807A1 (en) | 2018-04-06 | 2019-10-10 | Curai, Inc. | Systems and methods for responding to healthcare inquiries |
| US10847265B2 (en) * | 2018-04-06 | 2020-11-24 | Curai, Inc. | Systems and methods for responding to healthcare inquiries |
| CN108846327B (en) * | 2018-05-29 | 2021-10-01 | 中国人民解放军总医院 | An intelligent discrimination system and method for pigmented moles and melanomas |
| GB2577700B (en) * | 2018-10-02 | 2021-12-08 | Kinsler Veronica | Method and device for determining nature or extent of skin disorder |
| CN109816641B (en) * | 2019-01-08 | 2021-05-14 | 西安电子科技大学 | Multi-scale morphological fusion-based weighted local entropy infrared small target detection method |
| US11574405B2 (en) * | 2019-01-31 | 2023-02-07 | Dr. Maksym Breslavets Medicine Professional Corp. | Analysis of the severity of skin disease through entropy quantification |
| CN110490239B (en) * | 2019-08-06 | 2024-02-27 | 腾讯医疗健康(深圳)有限公司 | Training methods, quality classification methods, devices and equipment for image quality control networks |
| GB2596582B (en) * | 2020-07-02 | 2023-03-01 | Imperial College Innovations Ltd | Image capture and processing |
| CN111839681A (en) * | 2020-07-08 | 2020-10-30 | 胡飞青 | Compression area identification platform and method using content analysis |
| US12490903B2 (en) * | 2020-08-12 | 2025-12-09 | Welch Allyn, Inc. | Dermal image capture |
| CN113139520B (en) * | 2021-05-14 | 2022-07-29 | 江苏中天互联科技有限公司 | Equipment diaphragm performance monitoring method for industrial Internet |
Family Cites Families (8)
| Publication number | Priority date | Publication date | Assignee | Title |
|---|---|---|---|---|
| AU6754900A (en) | 1999-08-03 | 2001-02-19 | Biophysica, Llc | Spectroscopic systems and methods for detecting tissue properties |
| NO325061B1 (en) * | 2001-03-06 | 2008-01-28 | Photosense As | Method and arrangement for determining the optical property of a multilayer tissue |
| US7991557B2 (en) * | 2004-06-19 | 2011-08-02 | Genenews Corporation | Computer system and methods for constructing biological classifiers and uses thereof |
| WO2009117485A2 (en) | 2008-03-18 | 2009-09-24 | Balter, Inc. | Optical method for determining morphological parameters and physiological properties of tissue |
| EP2238449B1 (en) | 2008-01-24 | 2018-06-06 | Balter, Inc. | Method for discriminating between malignant and benign tissue lesions |
| US20120136255A1 (en) * | 2010-06-07 | 2012-05-31 | Shu Feng Fan | Tissue malignant tumor detection method and tissue malignant tumor detection apparatus |
| EP2831813B1 (en) * | 2012-03-28 | 2019-11-06 | University of Houston System | Methods and software for screening and diagnosing skin lesions and plant diseases |
| US8891841B2 (en) * | 2012-06-04 | 2014-11-18 | Verizon Patent And Licensing Inc. | Mobile dermatology collection and analysis system |
-
2017
- 2017-02-10 US US15/430,019 patent/US10413232B2/en active Active
- 2017-02-10 EP EP17750864.5A patent/EP3413790B1/en active Active
- 2017-02-10 CA CA3204854A patent/CA3204854A1/en active Pending
- 2017-02-10 CA CA3014529A patent/CA3014529A1/en active Pending
- 2017-02-10 WO PCT/US2017/017450 patent/WO2017139632A1/en not_active Ceased
- 2017-02-10 AU AU2017217944A patent/AU2017217944B2/en active Active
Also Published As
| Publication number | Publication date |
|---|---|
| US10413232B2 (en) | 2019-09-17 |
| US20170224270A1 (en) | 2017-08-10 |
| AU2017217944A1 (en) | 2018-09-27 |
| EP3413790A1 (en) | 2018-12-19 |
| CA3014529A1 (en) | 2017-08-17 |
| CA3204854A1 (en) | 2017-08-17 |
| EP3413790A4 (en) | 2019-10-16 |
| WO2017139632A1 (en) | 2017-08-17 |
| AU2017217944B2 (en) | 2021-05-13 |
Similar Documents
| Publication | Publication Date | Title |
|---|---|---|
| US10413232B2 (en) | Optical transfer diagnosis for detection and monitoring of tissue disorders | |
| Lu et al. | Spectral-spatial classification for noninvasive cancer detection using hyperspectral imaging | |
| EP2238449B1 (en) | Method for discriminating between malignant and benign tissue lesions | |
| US20200267336A1 (en) | Systems and methods for hyperspectral imaging | |
| Aloupogianni et al. | Hyperspectral and multispectral image processing for gross-level tumor detection in skin lesions: a systematic review | |
| EP2992818B1 (en) | Optical method for determining morphological parameters of skin tissue lesions | |
| US9339194B2 (en) | System, method and article for normalization and enhancement of tissue images | |
| Ramezani et al. | Automatic detection of malignant melanoma using macroscopic images | |
| US20170150903A1 (en) | Systems and methods for hyperspectral medical imaging | |
| Fabelo et al. | Dermatologic hyperspectral imaging system for skin cancer diagnosis assistance | |
| Acha et al. | Segmentation and classification of burn images by color and texture information | |
| US20120314920A1 (en) | Method and device for analyzing hyper-spectral images | |
| CN102831400A (en) | Multispectral face identification method, and system thereof | |
| Vocaturo et al. | Features for melanoma lesions characterization in computer vision systems | |
| US20220095998A1 (en) | Hyperspectral imaging in automated digital dermoscopy screening for melanoma | |
| Kesarwani et al. | Non-invasive anaemia detection by examining palm pallor: A smartphone-based approach | |
| Zhu et al. | Elastic scattering spectroscopy for early detection of breast cancer: partially supervised Bayesian image classification of scanned sentinel lymph nodes | |
| Gupta et al. | Cognitive-Inspired and Computationally Intelligent Early Melanoma Detection Using Feature Analysis Techniques | |
| Stamnes et al. | Optical detection and monitoring of pigmented skin lesions | |
| Yuan et al. | Hyperspectral imaging and SPA–LDA quantitative analysis for detection of colon cancer tissue | |
| Di Leo et al. | A web-based application for dermoscopic measurements and learning | |
| Lu | Objective assessment of psoriasis treatment through skin images. | |
| Cavalcanti | Automated prescreening of melanocytic skin lesions using standard camera images. | |
| De Vita et al. | Statistical image processing for the detection of dermoscopic criteria | |
| Peña Gutiérrez | Novel melanoma diagnosis and prognosis methods based on 3D fringe projection |
Legal Events
| Date | Code | Title | Description |
|---|---|---|---|
| STAA | Information on the status of an ep patent application or granted ep patent |
Free format text: STATUS: THE INTERNATIONAL PUBLICATION HAS BEEN MADE |
|
| PUAI | Public reference made under article 153(3) epc to a published international application that has entered the european phase |
Free format text: ORIGINAL CODE: 0009012 |
|
| STAA | Information on the status of an ep patent application or granted ep patent |
Free format text: STATUS: REQUEST FOR EXAMINATION WAS MADE |
|
| 17P | Request for examination filed |
Effective date: 20180910 |
|
| AK | Designated contracting states |
Kind code of ref document: A1 Designated state(s): AL AT BE BG CH CY CZ DE DK EE ES FI FR GB GR HR HU IE IS IT LI LT LU LV MC MK MT NL NO PL PT RO RS SE SI SK SM TR |
|
| AX | Request for extension of the european patent |
Extension state: BA ME |
|
| RIN1 | Information on inventor provided before grant (corrected) |
Inventor name: STAMNES, JAKOB, J. |
|
| DAV | Request for validation of the european patent (deleted) | ||
| DAX | Request for extension of the european patent (deleted) | ||
| A4 | Supplementary search report drawn up and despatched |
Effective date: 20190917 |
|
| RIC1 | Information provided on ipc code assigned before grant |
Ipc: A61B 5/00 20060101AFI20190911BHEP |
|
| STAA | Information on the status of an ep patent application or granted ep patent |
Free format text: STATUS: EXAMINATION IS IN PROGRESS |
|
| 17Q | First examination report despatched |
Effective date: 20200626 |
|
| P01 | Opt-out of the competence of the unified patent court (upc) registered |
Effective date: 20230517 |
|
| REG | Reference to a national code |
Ref country code: DE Ref legal event code: R079 Free format text: PREVIOUS MAIN CLASS: A61B0005000000 Ipc: G06T0007000000 Ref country code: DE Ref legal event code: R079 Ref document number: 602017087545 Country of ref document: DE Free format text: PREVIOUS MAIN CLASS: A61B0005000000 Ipc: G06T0007000000 |
|
| GRAP | Despatch of communication of intention to grant a patent |
Free format text: ORIGINAL CODE: EPIDOSNIGR1 |
|
| STAA | Information on the status of an ep patent application or granted ep patent |
Free format text: STATUS: GRANT OF PATENT IS INTENDED |
|
| RIC1 | Information provided on ipc code assigned before grant |
Ipc: A61B 5/00 20060101ALI20240410BHEP Ipc: G06V 30/142 20220101ALI20240410BHEP Ipc: G06V 20/10 20220101ALI20240410BHEP Ipc: G06V 10/762 20220101ALI20240410BHEP Ipc: G06V 10/60 20220101ALI20240410BHEP Ipc: G06V 10/42 20220101ALI20240410BHEP Ipc: G06V 10/147 20220101ALI20240410BHEP Ipc: G06V 10/143 20220101ALI20240410BHEP Ipc: G06F 18/23 20230101ALI20240410BHEP Ipc: G06T 7/00 20170101AFI20240410BHEP |
|
| INTG | Intention to grant announced |
Effective date: 20240430 |
|
| GRAJ | Information related to disapproval of communication of intention to grant by the applicant or resumption of examination proceedings by the epo deleted |
Free format text: ORIGINAL CODE: EPIDOSDIGR1 |
|
| STAA | Information on the status of an ep patent application or granted ep patent |
Free format text: STATUS: EXAMINATION IS IN PROGRESS |
|
| GRAP | Despatch of communication of intention to grant a patent |
Free format text: ORIGINAL CODE: EPIDOSNIGR1 |
|
| STAA | Information on the status of an ep patent application or granted ep patent |
Free format text: STATUS: GRANT OF PATENT IS INTENDED |
|
| INTG | Intention to grant announced |
Effective date: 20240827 |
|
| GRAS | Grant fee paid |
Free format text: ORIGINAL CODE: EPIDOSNIGR3 |
|
| GRAA | (expected) grant |
Free format text: ORIGINAL CODE: 0009210 |
|
| STAA | Information on the status of an ep patent application or granted ep patent |
Free format text: STATUS: THE PATENT HAS BEEN GRANTED |
|
| AK | Designated contracting states |
Kind code of ref document: B1 Designated state(s): AL AT BE BG CH CY CZ DE DK EE ES FI FR GB GR HR HU IE IS IT LI LT LU LV MC MK MT NL NO PL PT RO RS SE SI SK SM TR |
|
| REG | Reference to a national code |
Ref country code: GB Ref legal event code: FG4D |
|
| REG | Reference to a national code |
Ref country code: CH Ref legal event code: EP |
|
| REG | Reference to a national code |
Ref country code: DE Ref legal event code: R096 Ref document number: 602017087545 Country of ref document: DE |
|
| REG | Reference to a national code |
Ref country code: IE Ref legal event code: FG4D |
|
| REG | Reference to a national code |
Ref country code: NL Ref legal event code: MP Effective date: 20250129 |
|
| PG25 | Lapsed in a contracting state [announced via postgrant information from national office to epo] |
Ref country code: NL Free format text: LAPSE BECAUSE OF FAILURE TO SUBMIT A TRANSLATION OF THE DESCRIPTION OR TO PAY THE FEE WITHIN THE PRESCRIBED TIME-LIMIT Effective date: 20250129 |
|
| PG25 | Lapsed in a contracting state [announced via postgrant information from national office to epo] |
Ref country code: RS Free format text: LAPSE BECAUSE OF FAILURE TO SUBMIT A TRANSLATION OF THE DESCRIPTION OR TO PAY THE FEE WITHIN THE PRESCRIBED TIME-LIMIT Effective date: 20250429 |
|
| PG25 | Lapsed in a contracting state [announced via postgrant information from national office to epo] |
Ref country code: FI Free format text: LAPSE BECAUSE OF FAILURE TO SUBMIT A TRANSLATION OF THE DESCRIPTION OR TO PAY THE FEE WITHIN THE PRESCRIBED TIME-LIMIT Effective date: 20250129 |
|
| PG25 | Lapsed in a contracting state [announced via postgrant information from national office to epo] |
Ref country code: PL Free format text: LAPSE BECAUSE OF FAILURE TO SUBMIT A TRANSLATION OF THE DESCRIPTION OR TO PAY THE FEE WITHIN THE PRESCRIBED TIME-LIMIT Effective date: 20250129 |
|
| PGFP | Annual fee paid to national office [announced via postgrant information from national office to epo] |
Ref country code: DE Payment date: 20250429 Year of fee payment: 9 |
|
| PG25 | Lapsed in a contracting state [announced via postgrant information from national office to epo] |
Ref country code: ES Free format text: LAPSE BECAUSE OF FAILURE TO SUBMIT A TRANSLATION OF THE DESCRIPTION OR TO PAY THE FEE WITHIN THE PRESCRIBED TIME-LIMIT Effective date: 20250129 |
|
| PGFP | Annual fee paid to national office [announced via postgrant information from national office to epo] |
Ref country code: GB Payment date: 20250428 Year of fee payment: 9 |
|
| REG | Reference to a national code |
Ref country code: LT Ref legal event code: MG9D |
|
| PG25 | Lapsed in a contracting state [announced via postgrant information from national office to epo] |
Ref country code: IS Free format text: LAPSE BECAUSE OF FAILURE TO SUBMIT A TRANSLATION OF THE DESCRIPTION OR TO PAY THE FEE WITHIN THE PRESCRIBED TIME-LIMIT Effective date: 20250529 |
|
| PGFP | Annual fee paid to national office [announced via postgrant information from national office to epo] |
Ref country code: NO Payment date: 20250429 Year of fee payment: 9 |
|
| REG | Reference to a national code |
Ref country code: AT Ref legal event code: MK05 Ref document number: 1764207 Country of ref document: AT Kind code of ref document: T Effective date: 20250129 |
|
| PG25 | Lapsed in a contracting state [announced via postgrant information from national office to epo] |
Ref country code: HR Free format text: LAPSE BECAUSE OF FAILURE TO SUBMIT A TRANSLATION OF THE DESCRIPTION OR TO PAY THE FEE WITHIN THE PRESCRIBED TIME-LIMIT Effective date: 20250129 |
|
| PG25 | Lapsed in a contracting state [announced via postgrant information from national office to epo] |
Ref country code: LV Free format text: LAPSE BECAUSE OF FAILURE TO SUBMIT A TRANSLATION OF THE DESCRIPTION OR TO PAY THE FEE WITHIN THE PRESCRIBED TIME-LIMIT Effective date: 20250129 Ref country code: PT Free format text: LAPSE BECAUSE OF FAILURE TO SUBMIT A TRANSLATION OF THE DESCRIPTION OR TO PAY THE FEE WITHIN THE PRESCRIBED TIME-LIMIT Effective date: 20250529 |
|
| PG25 | Lapsed in a contracting state [announced via postgrant information from national office to epo] |
Ref country code: BG Free format text: LAPSE BECAUSE OF FAILURE TO SUBMIT A TRANSLATION OF THE DESCRIPTION OR TO PAY THE FEE WITHIN THE PRESCRIBED TIME-LIMIT Effective date: 20250129 Ref country code: GR Free format text: LAPSE BECAUSE OF FAILURE TO SUBMIT A TRANSLATION OF THE DESCRIPTION OR TO PAY THE FEE WITHIN THE PRESCRIBED TIME-LIMIT Effective date: 20250430 |
|
| PG25 | Lapsed in a contracting state [announced via postgrant information from national office to epo] |
Ref country code: AT Free format text: LAPSE BECAUSE OF FAILURE TO SUBMIT A TRANSLATION OF THE DESCRIPTION OR TO PAY THE FEE WITHIN THE PRESCRIBED TIME-LIMIT Effective date: 20250129 |
|
| PG25 | Lapsed in a contracting state [announced via postgrant information from national office to epo] |
Ref country code: SE Free format text: LAPSE BECAUSE OF FAILURE TO SUBMIT A TRANSLATION OF THE DESCRIPTION OR TO PAY THE FEE WITHIN THE PRESCRIBED TIME-LIMIT Effective date: 20250129 |
|
| REG | Reference to a national code |
Ref country code: CH Ref legal event code: PL |
|
| PG25 | Lapsed in a contracting state [announced via postgrant information from national office to epo] |
Ref country code: SM Free format text: LAPSE BECAUSE OF FAILURE TO SUBMIT A TRANSLATION OF THE DESCRIPTION OR TO PAY THE FEE WITHIN THE PRESCRIBED TIME-LIMIT Effective date: 20250129 |
|
| PG25 | Lapsed in a contracting state [announced via postgrant information from national office to epo] |
Ref country code: DK Free format text: LAPSE BECAUSE OF FAILURE TO SUBMIT A TRANSLATION OF THE DESCRIPTION OR TO PAY THE FEE WITHIN THE PRESCRIBED TIME-LIMIT Effective date: 20250129 |
|
| PG25 | Lapsed in a contracting state [announced via postgrant information from national office to epo] |
Ref country code: MC Free format text: LAPSE BECAUSE OF FAILURE TO SUBMIT A TRANSLATION OF THE DESCRIPTION OR TO PAY THE FEE WITHIN THE PRESCRIBED TIME-LIMIT Effective date: 20250129 |
|
| PG25 | Lapsed in a contracting state [announced via postgrant information from national office to epo] |
Ref country code: LU Free format text: LAPSE BECAUSE OF NON-PAYMENT OF DUE FEES Effective date: 20250210 Ref country code: IT Free format text: LAPSE BECAUSE OF FAILURE TO SUBMIT A TRANSLATION OF THE DESCRIPTION OR TO PAY THE FEE WITHIN THE PRESCRIBED TIME-LIMIT Effective date: 20250129 |
|
| PG25 | Lapsed in a contracting state [announced via postgrant information from national office to epo] |
Ref country code: CH Free format text: LAPSE BECAUSE OF NON-PAYMENT OF DUE FEES Effective date: 20250228 |
|
| PG25 | Lapsed in a contracting state [announced via postgrant information from national office to epo] |
Ref country code: EE Free format text: LAPSE BECAUSE OF FAILURE TO SUBMIT A TRANSLATION OF THE DESCRIPTION OR TO PAY THE FEE WITHIN THE PRESCRIBED TIME-LIMIT Effective date: 20250129 Ref country code: CZ Free format text: LAPSE BECAUSE OF FAILURE TO SUBMIT A TRANSLATION OF THE DESCRIPTION OR TO PAY THE FEE WITHIN THE PRESCRIBED TIME-LIMIT Effective date: 20250129 |
|
| PG25 | Lapsed in a contracting state [announced via postgrant information from national office to epo] |
Ref country code: RO Free format text: LAPSE BECAUSE OF FAILURE TO SUBMIT A TRANSLATION OF THE DESCRIPTION OR TO PAY THE FEE WITHIN THE PRESCRIBED TIME-LIMIT Effective date: 20250129 |
|
| PG25 | Lapsed in a contracting state [announced via postgrant information from national office to epo] |
Ref country code: SK Free format text: LAPSE BECAUSE OF FAILURE TO SUBMIT A TRANSLATION OF THE DESCRIPTION OR TO PAY THE FEE WITHIN THE PRESCRIBED TIME-LIMIT Effective date: 20250129 |
|
| REG | Reference to a national code |
Ref country code: DE Ref legal event code: R097 Ref document number: 602017087545 Country of ref document: DE |
|
| PLBE | No opposition filed within time limit |
Free format text: ORIGINAL CODE: 0009261 |
|
| STAA | Information on the status of an ep patent application or granted ep patent |
Free format text: STATUS: NO OPPOSITION FILED WITHIN TIME LIMIT |
|
| REG | Reference to a national code |
Ref country code: BE Ref legal event code: MM Effective date: 20250228 |
|
| 26N | No opposition filed |
Effective date: 20251030 |
|
| PG25 | Lapsed in a contracting state [announced via postgrant information from national office to epo] |
Ref country code: FR Free format text: LAPSE BECAUSE OF NON-PAYMENT OF DUE FEES Effective date: 20250329 |
|
| PG25 | Lapsed in a contracting state [announced via postgrant information from national office to epo] |
Ref country code: BE Free format text: LAPSE BECAUSE OF NON-PAYMENT OF DUE FEES Effective date: 20250228 |
|
| PG25 | Lapsed in a contracting state [announced via postgrant information from national office to epo] |
Ref country code: IE Free format text: LAPSE BECAUSE OF NON-PAYMENT OF DUE FEES Effective date: 20250210 |