EP3381368A1 - Method of enabling feature extraction for glucose monitoring using near-infrared (nir) spectroscopy - Google Patents
Method of enabling feature extraction for glucose monitoring using near-infrared (nir) spectroscopy Download PDFInfo
- Publication number
- EP3381368A1 EP3381368A1 EP18164204.2A EP18164204A EP3381368A1 EP 3381368 A1 EP3381368 A1 EP 3381368A1 EP 18164204 A EP18164204 A EP 18164204A EP 3381368 A1 EP3381368 A1 EP 3381368A1
- Authority
- EP
- European Patent Office
- Prior art keywords
- glucose
- nir
- components
- data
- signal
- Prior art date
- Legal status (The legal status is an assumption and is not a legal conclusion. Google has not performed a legal analysis and makes no representation as to the accuracy of the status listed.)
- Withdrawn
Links
Images





Classifications
-
- A—HUMAN NECESSITIES
- A61—MEDICAL OR VETERINARY SCIENCE; HYGIENE
- A61B—DIAGNOSIS; SURGERY; IDENTIFICATION
- A61B5/00—Measuring for diagnostic purposes; Identification of persons
- A61B5/145—Measuring characteristics of blood in vivo, e.g. gas concentration or pH-value ; Measuring characteristics of body fluids or tissues, e.g. interstitial fluid or cerebral tissue
- A61B5/14532—Measuring characteristics of blood in vivo, e.g. gas concentration or pH-value ; Measuring characteristics of body fluids or tissues, e.g. interstitial fluid or cerebral tissue for measuring glucose, e.g. by tissue impedance measurement
-
- A—HUMAN NECESSITIES
- A61—MEDICAL OR VETERINARY SCIENCE; HYGIENE
- A61B—DIAGNOSIS; SURGERY; IDENTIFICATION
- A61B5/00—Measuring for diagnostic purposes; Identification of persons
- A61B5/145—Measuring characteristics of blood in vivo, e.g. gas concentration or pH-value ; Measuring characteristics of body fluids or tissues, e.g. interstitial fluid or cerebral tissue
- A61B5/1455—Measuring characteristics of blood in vivo, e.g. gas concentration or pH-value ; Measuring characteristics of body fluids or tissues, e.g. interstitial fluid or cerebral tissue using optical sensors, e.g. spectral photometrical oximeters
-
- A—HUMAN NECESSITIES
- A61—MEDICAL OR VETERINARY SCIENCE; HYGIENE
- A61B—DIAGNOSIS; SURGERY; IDENTIFICATION
- A61B5/00—Measuring for diagnostic purposes; Identification of persons
- A61B5/72—Signal processing specially adapted for physiological signals or for diagnostic purposes
- A61B5/7203—Signal processing specially adapted for physiological signals or for diagnostic purposes for noise prevention, reduction or removal
-
- A—HUMAN NECESSITIES
- A61—MEDICAL OR VETERINARY SCIENCE; HYGIENE
- A61B—DIAGNOSIS; SURGERY; IDENTIFICATION
- A61B5/00—Measuring for diagnostic purposes; Identification of persons
- A61B5/72—Signal processing specially adapted for physiological signals or for diagnostic purposes
- A61B5/7235—Details of waveform analysis
- A61B5/7239—Details of waveform analysis using differentiation including higher order derivatives
-
- A—HUMAN NECESSITIES
- A61—MEDICAL OR VETERINARY SCIENCE; HYGIENE
- A61B—DIAGNOSIS; SURGERY; IDENTIFICATION
- A61B5/00—Measuring for diagnostic purposes; Identification of persons
- A61B5/72—Signal processing specially adapted for physiological signals or for diagnostic purposes
- A61B5/7235—Details of waveform analysis
- A61B5/725—Details of waveform analysis using specific filters therefor, e.g. Kalman or adaptive filters
-
- G—PHYSICS
- G16—INFORMATION AND COMMUNICATION TECHNOLOGY [ICT] SPECIALLY ADAPTED FOR SPECIFIC APPLICATION FIELDS
- G16H—HEALTHCARE INFORMATICS, i.e. INFORMATION AND COMMUNICATION TECHNOLOGY [ICT] SPECIALLY ADAPTED FOR THE HANDLING OR PROCESSING OF MEDICAL OR HEALTHCARE DATA
- G16H40/00—ICT specially adapted for the management or administration of healthcare resources or facilities; ICT specially adapted for the management or operation of medical equipment or devices
- G16H40/60—ICT specially adapted for the management or administration of healthcare resources or facilities; ICT specially adapted for the management or operation of medical equipment or devices for the operation of medical equipment or devices
- G16H40/63—ICT specially adapted for the management or administration of healthcare resources or facilities; ICT specially adapted for the management or operation of medical equipment or devices for the operation of medical equipment or devices for local operation
-
- A—HUMAN NECESSITIES
- A61—MEDICAL OR VETERINARY SCIENCE; HYGIENE
- A61B—DIAGNOSIS; SURGERY; IDENTIFICATION
- A61B5/00—Measuring for diagnostic purposes; Identification of persons
- A61B5/0059—Measuring for diagnostic purposes; Identification of persons using light, e.g. diagnosis by transillumination, diascopy, fluorescence
- A61B5/0075—Measuring for diagnostic purposes; Identification of persons using light, e.g. diagnosis by transillumination, diascopy, fluorescence by spectroscopy, i.e. measuring spectra, e.g. Raman spectroscopy, infrared absorption spectroscopy
Definitions
- Apparatuses and methods consistent with exemplary embodiments relate to glucose monitoring, and more particularly relate to enabling feature extraction for glucose monitoring through Near-Infrared Spectroscopy.
- Glucose monitoring may be used to measure the level of glucose in a blood sample.
- the glucose monitoring may be performed either invasively or non-invasively.
- the skin of a person is pierced to obtain the blood sample.
- collection of the blood sample may not be required to measure the glucose level, and instead Mid-Infrared (Mid-IR) spectroscopy, Near-Infrared (NIR) spectroscopy, or Raman spectroscopy may be used.
- Mid-IR Mid-Infrared
- NIR Near-Infrared
- Raman spectroscopy Raman spectroscopy
- the NIR spectroscopy has been used for continuous glucose monitoring, in which NIR waves are generated to pass through the skin and a spectrum indicating absorption of the NIR waves by the blood underneath the skin is used in determining the glucose level.
- ⁇ molecular extinction co-efficient
- C concentration of component in sample
- d penetration depth
- A_NIR A_Water + A_Cholesterol + A_Collagen + A_Keratin + A_elastin + A_acid + A_Glucose
- Exemplary embodiments address at least the above problems and/or disadvantages and other disadvantages not described above. Also, the exemplary embodiments are not required to overcome the disadvantages described above.
- a method of extracting a glucose feature comprising: removing noise from a near-infrared (NIR) data; extracting a glucose signal from the NIR data; and removing temporal drift components from the extracted glucose signal.
- NIR near-infrared
- the removing the noise may comprise removing the noise from the NIR data using at least one of an Savitzky-Golay (SG) filter and a Fourier domain filtering.
- SG Savitzky-Golay
- the extracting the glucose signal may comprise removing a signal component of a body composition other than a glucose from the NIR data.
- the body composition other than the glucose may comprise at least one of water, fat and protein.
- the extracting the glucose signal may comprise extracting the glucose signal based on an Extended Multiplicative Scatter Correction (EMSC) regression and data whitening.
- ESC Extended Multiplicative Scatter Correction
- the data whitening may be performed to obtain an orthogonal component of a pure spectrum of a body composition including a glucose.
- the EMSC regression may be applied to resolve the NIR data into signal components of individual body compositions using the orthogonal component of the pure spectrum of the body composition generated by the data whitening.
- the removing temporal drift components may comprise differentiating and smoothing the extracted glucose signal, and removing the temporal drift components by applying a drift removal technique to the differentiated and smoothed glucose signal.
- the removing temporal drift components by applying a drift removal technique may comprise calculating the temporal drift components by differentiating and averaging the differentiated and smoothed glucose signal, and removing the calculated temporal drift components from the differentiated and smoothed glucose signal.
- a method of monitoring glucose including: filtering a near-infrared (NIR) data, which is obtained from a NIR light that is emitted to and returns from a user, by removing noise from the NIR data; extracting a glucose signal from the filtered NIR data by removing one or more body composition components from the filtered NIR data; removing temporal drift components from the extracted glucose signal; generating a data model for glucose prediction by regressing the extracted glucose signal from which the temporal drift components have been removed, based on an expected glucose signal; and predicting a glucose level of the user based on the generated data model.
- NIR near-infrared
- the body composition components may include at least one of water, fat, proteins, and elastin.
- the filtering may be performed using an Savitzky-Golay (SG) filter.
- SG Savitzky-Golay
- the filtering may be performed using a Fourier domain filtering.
- the glucose signal may be extracted based on an Extended Multiplicative Scatter Correction (EMSC) regression and data whitening.
- ESC Extended Multiplicative Scatter Correction
- the data whitening may be performed to obtain orthogonal components of reference spectra of the body composition components.
- the EMSC regression may be applied to resolve an absorption spectrum of the NIR light into individual components of glucose using orthogonal spectra generated by the data whitening.
- the removing the temporal drift components may further include smoothing a differential of the extracted glucose signal by coarsely removing the temporal drift components from the extracted glucose signal.
- the removing the temporal drift components may further include applying a fine drift removal method to the smoothed differential of the extracted glucose signal to remove a residual drift from the extracted glucose signal.
- a glucose monitoring device including: a filtering module configured to remove noise components from a near-infrared (NIR) data generated from a NIR spectrometer; an interferents removal module configured to extract a glucose signal from the NIR data by removing one or more body composition components, the body composition components comprising at least one of water component, fat, proteins, and elastin; and a feature extraction module configured to remove, from the extracted glucose signal, drift components caused due to a drift of the NIR spectrometer; wherein the glucose monitoring device may generate a data model for glucose prediction by regressing the extracted glucose signal from which the drift components have been removed, based on an expected glucose signal; and may predict a glucose level of a user based on the generated data model.
- NIR near-infrared
- the filtering module may include a Savitzky-Golay (SG) filter and a Fourier domain filter to remove the noise components from the NIR data.
- SG Savitzky-Golay
- the interferents removal module may include: a data whitening module configured to obtain orthogonal components of reference spectra of the body composition components to perform an Extended Multiplicative Scatter Correction (EMSC) regression; an EMSC regression module configured to resolve the NIR data into one or more individual components of glucose; and a glucose signal extraction configured to extract the glucose signal from the NIR data from which the noise components have been removed.
- EMC Extended Multiplicative Scatter Correction
- the feature extraction module may include: a SG filter with differential module configured to smooth a differential of the extracted glucose signal; and a drift removal module configured to remove the drift components from the extracted glucose signal.
- a non-transitory computer readable storage medium storing a program that is executable by a computer to perform a method of monitoring glucose.
- the method may include: receiving a near-infrared (NIR) absorption spectrum indicating a plurality of body composition components of a user; filtering the NIR absorption spectrum to remove noise components from the NIR absorption spectrum; removing, from the NIR absorption spectrum, a signal indicating at least one of the plurality of body composition components other than glucose, and drift components to extract a glucose signal from the NIR absorption spectrum; regressing the extracted glucose signal to generate a glucose prediction model; and predicting a glucose level of the user based on the glucose prediction model.
- NIR near-infrared
- a NIR glucose meter described herein may be implemented as a software module or in the form of a hardware chip and be mounted in an electronic device.
- the electronic device may include a mobile phone, a smart phone, a notebook computer, a personal digital assistant (PDA), a portable multimedia player (PMP), a navigation system, an MP3 player, a digital camera, a wearable device, etc.
- the wearable device may include various types of wearable devices, such as a wristwatch type, a wristband type, a ring type, a belt-type, a necklace type, an ankle band type, a thigh band type, a forearm band type, and the like.
- the electronic device is not limited to the above mentioned examples, and the wearable device is also not limited to the above-described examples.
- FIG. 1 is a flowchart illustrating a method of enabling feature extraction for glucose monitoring using near infra-red spectroscopy, according to an exemplary embodiment.
- a raw near-infrared (NIR) data associated with a glucose absorption spectrum of one or more users is received, and in operation 104, the raw NIR data is filtered by removing noise from the raw NIR data.
- the noise may be caused when a NIR light is scattered while the NIR light is emitted to, passes through, and returns from the skin.
- a glucose signal is extracted from the filtered NIR data by removing one or more body composition components, in operation 104.
- the body composition components include at least one of water, fat, and protein (ex. collagen, keratin, and elastin, etc.).
- removal of temporal drift components from the extracted glucose signals is performed.
- a data model for glucose prediction is generated by regressing the extracted glucose features after drift removal with an expected glucose values taken for calibration. The glucose values of the new NIR data are predicted using the generated data model.
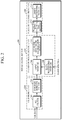
- FIG 2 is a block diagram illustrating a NIR glucose meter 200 according to an exemplary embodiment.
- a particular skin region is illuminated with near-infrared (NIR) light using a NIR spectrometer of the NIR glucose meter 200.
- the NIR light may be partially absorbed and scattered according to its interaction with the constituents of tissue beneath the particular skin region before reflected back to a NIR photo-detector in the NIR glucose meter 200.
- the normalized absorption of NIR spectrum by different constituents is shown in Figure 3A .
- the reflected light contains quantitative information of the constituents of the tissue including water, fat, protein and glucose.
- the reflected light containing NIR spectrum data is made to pass through the NIR glucose meter 200.
- the NIR glucose meter 200 includes a filtering unit 220, an interferents removal unit 230 and a feature extraction unit 240.
- the filtering unit 220, the interferents removal unit 230, and the feature extraction unit 240 may be implemented with one or more processors.
- the filtering unit 220 may remove unwanted noises from the NIR spectrum data.
- the NIR spectrum data may be a near-infrared (NIR) absorption spectrum data of skin that is obtained by measuring NIR emitted toward the skin of the user.
- NIR spectrum data is not limited thereto, and may be a NIR transmittance spectrum data of skin or NIR reflectance spectrum data of a skin.
- the filtering unit 220 may use baseline correction algorithm and/or smoothing algorithm to remove unwanted noises from the NIR spectrum data.
- the filtering unit 220 may use Savitzky-Golay smoothing, Fourier domain filtering, and moving average, etc.
- the filtering unit 220 includes a Savitzky-Golay (SG) filter 202 and a Fourier domain filter 204 to remove unwanted noises from the NIR spectrum data.
- the SG filter 202 may remove spikes present in the NIR spectrum data received from the NIR spectrometer and the Fourier domain filter 204 reduces the impact of interferents of the NIR spectrum data as well as the noise added in the areas where there is no overlap of signal corresponding to glucose.
- an NIR spectrum signal x ( n ) containing raw NIR data is inputted to the SG filter 202.
- the SG filter 202 is a polynomial fit ( n ) filter of order N .
- n is the sample number
- the NIR spectrum signal x ( n ) is smoothened by convoluting first row of matrix H with signal vector of 2 M + 1 samples around the sample of interest.
- H A T A ⁇ 1 A T
- a n , i n i , 0 ⁇ i ⁇ N , ⁇ M ⁇ n ⁇ M
- N is order of polynomial and 2 M + 1 samples considered for measuring error to be minimized.
- the resultant smoothened signal of NIR spectrum is sent to the Fourier domain filter 204.
- the Fourier domain filter 204 reduces the impact of interferents of the NIR spectrum as well as the noise added in the time window where there is no significant overlap of signal corresponding to glucose.
- the NIR spectrum received from the NIR spectrometer is in the range 1530 nm to 1830 nm in wavelength.
- the NIR spectrum of the above range is represented by few samples of a dominant signal in the time domain. This case is valid for all of the interferents in the signal.
- An exemplary Fourier domain representation of signal in the time domain for each constituent of tissue containing interstitial liquid is shown in Figure 3B .
- the Fourier domain filter 204 then applies a Hanning window to suppress the noise.
- the Fourier domain filter 204 may transform time domain signal x sg ( n ) into Fourier domain as shown below.
- X K FFT x sg n
- NIR spectrum is then transformed into Fourier domain and multiplied with a Hanning window as shown below.
- x fd t IFFT X K ⁇ Hanning N win , where N win is the window size.
- Hanning window can be replaced by any Gaussian pulse shape, Raised Cosine pulse shape or any other smoothing response.
- the interferents removal unit 230 may extract a glucose signal from the NIR data by removing one or more body composition components. According to an exemplary embodiment, the interferents removal unit 230 may resolve the skin spectrum into individual component spectrums using a pure spectrum of each body component and extract the glucose signal based on the resolved individual component spectrums. For example, the interferents removal unit 230 may use extended multiplicative scatter algorithm, gradient descent, least square, pseudo inverse, singular value decomposition, etc..
- the interferents removal unit 230 includes an Extended Multiplicative Scatter Correction (EMSC) module 206 and a data whitening module 208 and a glucose spectrum extraction module 210.
- the EMSC module 206 includes an algorithm executed to obtain a spectrum of a glucose signal from the NIR spectrum that is filtered by the SG filter 202 and the Fourier domain filter 304.
- the filtered NIR spectrum may be absorption spectra of a plurality of body constituents.
- the EMSC module 206 receives orthogonal spectra (Q) from the data whitening module 208.
- the EMSC module 206 receive orthogonal spectra of different interferents and regress for compositions in the NIR data. Then, concentrations of components obtained from the NIR data is subtracted from the NIR data to obtain the glucose signal.
- the process of EMSC and data whitening is discussed in detail hereinafter.
- a data whitening module 208 produces orthogonal spectral components Q that are orthogonal to each other such that a pure spectra P of body compositions can be obtained by linear combinations of the orthogonal spectral components Q.
- Matrix P contains pure spectra of all body constituents (e.g., water, fat, collagen, proteins) including glucose.
- the pure spectrum may be an absorption spectrum of pure material (e.g., collagen, elastin, and keratin).
- the pure spectra of body constituents P is sent to the data whitening module 208 that obtains P by performing mean and standard deviation normalization of pure component spectra X .
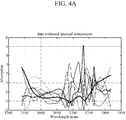
- An exemplary absorption of data whitened spectral components is shown in Figure 4A .
- the data whitening module 208 may obtain P as shown below.
- P i ⁇ P i ⁇ E P i std P , ⁇ i
- the algorithm present in the EMSC module 206 resolves a given spectrum x fd ( n ) after noise filtering into N orthogonal spectra Q components obtained from data whitening module 208.
- the EMSC module 206 may estimate the weights a 0 , a 1 , ..., a m -1 using gradient descent, east square, pseudo inverse, singular value decomposition, etc..
- a differential d th of the estimated spectrum X glucose e is obtained by using the SG-filter 202 one more time.
- the feature extraction unit 240 uses machine learning algorithms like Principal component regression (PCR) or Partial Least square regression (PLSR).
- the feature extraction unit 240 include a SG filter with differential module 212 and a drift removing module 214.
- the SG filter with differential module 212 is another filter that smoothens the extracted glucose spectrum.
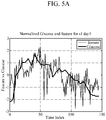
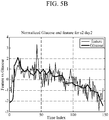
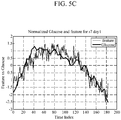
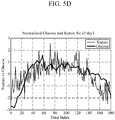
- Figures 5A to 5D illustrate correlations of extraction feature and glucose values after drift removal, according to one exemplary embodiment.
- the SG filter with differential module 212 may obtain a smoothed version of the differential d th of the extracted glucose feature in a frequency domain.
- the glucose feature may be enhanced in the glucose spectrum and a baseline drift of the NIR spectrum of the differential d th may be coarsely eliminated, by using the SG filter with differential module 212.
- the drift removing module 314 may remove a residual baseline drift after applying the SG filter with differential.
- ⁇ may be a N x P feature matrix having P features corresponding to N observations of glucose value in each row. Each row of ⁇ includes extracted glucose features x glucose d of one raw NIR spectrum.
- ⁇ t ⁇ I ⁇ + ⁇ ⁇ ⁇ G t + drift t ⁇
- ⁇ (t, ⁇ ) is a time varying feature x glucose d n and l is non-time varying interference which could be combination of several residual body spectra
- G is glucose value at time t
- drift ( t, ⁇ ) is temporal drift components of a given ⁇ ⁇ ⁇
- ⁇ are constants.
- j corresponds to j ⁇ th observation of glucose feature.
- the ⁇ ( ⁇ ) obtained for both training and prediction data is sent to PCR or PLSR or any other machine learning algorithm for regression.
- the feature extraction unit 240 may remove the temporal drift components from the extracted glucose signal by differentiating the glucose features x glucose d , averaging the differentiated glucose features d ⁇ t ⁇ dt , calculating an average of the temporal drift components ( driftmean ( ⁇ )) , and removing the average of the temporal drift components ( driftmean ( ⁇ )) from the glucose features x glucose d .
- the raw NIR data of one person taken on day 1 is used as calibration data x cal ( n ).
- the calibration data x cal ( n ) is submitted to the feature extraction unit in Figure 2 which gives the output as ⁇ cal ⁇ ⁇ .
- Each row of ⁇ cal ⁇ ⁇ represents an extracted glucose feature of one instance of the NIR spectrum.
- Y cal represents labeled glucose values measured with any other established techniques (e.g., blood glucose test) corresponding to given NIR spectra x cal ( n ).
- Matrices ⁇ cal ⁇ ⁇ , Y cal are submitted to a machine learning algorithm and a model for glucose values is built based on the machine learning algorithm.
- the raw NIR data of the same or a different person taken on day 2 is prediction data x pred ( n ).
- the prediction data x pred ( n ) is submitted to the feature extraction unit in Figure 2 which gives the output as ⁇ pred ⁇ ⁇ .
- This ⁇ pred ⁇ ⁇ is then submitted to the model generated by the machine learning algorithm which in turn predicts glucose values corresponding to ⁇ pred ⁇ ⁇ .
- Figures 6A , 6B and 6C illustrate results of predicted glucose values using principal component regression (PCR), according to one exemplary embodiment.
- s 1 , s 2, ... s 7 are the subjects or people considered for collecting the calibration and prediction data.
- the raw NIR data collected from s1 (on day 1) for about 2 hours on every minute basis is provided to glucose meter for calibration and prediction model for glucose is generated.
- the raw NIR data for s1 on another day (day 1) is generated and submitted for prediction.
- Figure 6A shows the plot of expected and predicted glucose values of s1 on day2.
- an exemplary embodiment can be embodied as computer-readable code on a computer-readable recording medium.
- the computer-readable recording medium is any data storage device that can store data that can be thereafter read by a computer system. Examples of the computer-readable recording medium include read-only memory (ROM), random-access memory (RAM), CD-ROMs, magnetic tapes, floppy disks, and optical data storage devices.
- the computer-readable recording medium can also be distributed over network-coupled computer systems so that the computer-readable code is stored and executed in a distributed fashion.
- an exemplary embodiment may be written as a computer program transmitted over a computer-readable transmission medium, such as a carrier wave, and received and implemented in general-use or special-purpose digital computers that execute the programs.
- one or more units of the above-described apparatuses and devices can include circuitry, a processor, a microprocessor, etc., and may execute a computer program stored in a computer-readable medium.
Landscapes
- Health & Medical Sciences (AREA)
- Life Sciences & Earth Sciences (AREA)
- Engineering & Computer Science (AREA)
- Physics & Mathematics (AREA)
- Biomedical Technology (AREA)
- General Health & Medical Sciences (AREA)
- Medical Informatics (AREA)
- Public Health (AREA)
- Veterinary Medicine (AREA)
- Molecular Biology (AREA)
- Surgery (AREA)
- Animal Behavior & Ethology (AREA)
- Heart & Thoracic Surgery (AREA)
- Biophysics (AREA)
- Pathology (AREA)
- Signal Processing (AREA)
- Artificial Intelligence (AREA)
- Computer Vision & Pattern Recognition (AREA)
- Physiology (AREA)
- Psychiatry (AREA)
- Optics & Photonics (AREA)
- Spectroscopy & Molecular Physics (AREA)
- Emergency Medicine (AREA)
- Business, Economics & Management (AREA)
- General Business, Economics & Management (AREA)
- Epidemiology (AREA)
- Primary Health Care (AREA)
- Measurement Of The Respiration, Hearing Ability, Form, And Blood Characteristics Of Living Organisms (AREA)
- Investigating Or Analysing Materials By Optical Means (AREA)
Abstract
Description
- Apparatuses and methods consistent with exemplary embodiments relate to glucose monitoring, and more particularly relate to enabling feature extraction for glucose monitoring through Near-Infrared Spectroscopy.
- Glucose monitoring may be used to measure the level of glucose in a blood sample. The glucose monitoring may be performed either invasively or non-invasively. In the invasive method, the skin of a person is pierced to obtain the blood sample. In the non-invasive method, collection of the blood sample may not be required to measure the glucose level, and instead Mid-Infrared (Mid-IR) spectroscopy, Near-Infrared (NIR) spectroscopy, or Raman spectroscopy may be used. The NIR spectroscopy has been used for continuous glucose monitoring, in which NIR waves are generated to pass through the skin and a spectrum indicating absorption of the NIR waves by the blood underneath the skin is used in determining the glucose level. The absorption of the NIR waves is defined based on BEER-Lambert law:

- Where ε is molecular extinction co-efficient,
C is concentration of component in sample, and
d is penetration depth. - If the blood is composed of different constituents, then overall absorption can be given as

- The NIR absorption spectrum indicates absorption of several components such as water, fat, protein (Collagen and Keratin), Amino acids, elastin and Glucose. Therefore,

- Further, the concentration of glucose in an interstitial liquid can be approximated as

- Thus, glucose monitoring using NIR spectroscopy is very challenging as the values of glucose absorption is of several orders lesser than other constituents and many times, the glucose information is distorted due to noise components of the NIR data. The order of concentration of different constituents are shown in the below table.
Constituent Water Fat Protein Elastin/Acid Glucose Order of concentration(-) 10^0 10^-1 10^-3 10^-3 10^-4 - Therefore, there is a need for a method for removing the impacts caused by other constituents of the body and NIR spectrometers for effective glucose monitoring.
- Exemplary embodiments address at least the above problems and/or disadvantages and other disadvantages not described above. Also, the exemplary embodiments are not required to overcome the disadvantages described above.
- According to an aspect of an exemplary embodiment, there is provided a method of extracting a glucose feature, the method comprising: removing noise from a near-infrared (NIR) data; extracting a glucose signal from the NIR data; and removing temporal drift components from the extracted glucose signal.
- The removing the noise may comprise removing the noise from the NIR data using at least one of an Savitzky-Golay (SG) filter and a Fourier domain filtering.
- The extracting the glucose signal may comprise removing a signal component of a body composition other than a glucose from the NIR data.
- The body composition other than the glucose may comprise at least one of water, fat and protein.
- The extracting the glucose signal may comprise extracting the glucose signal based on an Extended Multiplicative Scatter Correction (EMSC) regression and data whitening.
- The data whitening may be performed to obtain an orthogonal component of a pure spectrum of a body composition including a glucose.
- The EMSC regression may be applied to resolve the NIR data into signal components of individual body compositions using the orthogonal component of the pure spectrum of the body composition generated by the data whitening.
- The removing temporal drift components may comprise differentiating and smoothing the extracted glucose signal, and removing the temporal drift components by applying a drift removal technique to the differentiated and smoothed glucose signal.
- The removing temporal drift components by applying a drift removal technique may comprise calculating the temporal drift components by differentiating and averaging the differentiated and smoothed glucose signal, and removing the calculated temporal drift components from the differentiated and smoothed glucose signal.
- According to an aspect of another embodiment, there is provided a method of monitoring glucose including: filtering a near-infrared (NIR) data, which is obtained from a NIR light that is emitted to and returns from a user, by removing noise from the NIR data; extracting a glucose signal from the filtered NIR data by removing one or more body composition components from the filtered NIR data; removing temporal drift components from the extracted glucose signal; generating a data model for glucose prediction by regressing the extracted glucose signal from which the temporal drift components have been removed, based on an expected glucose signal; and predicting a glucose level of the user based on the generated data model.
- The body composition components may include at least one of water, fat, proteins, and elastin.
- The filtering may be performed using an Savitzky-Golay (SG) filter.
- The filtering may be performed using a Fourier domain filtering.
- The glucose signal may be extracted based on an Extended Multiplicative Scatter Correction (EMSC) regression and data whitening.
- The data whitening may be performed to obtain orthogonal components of reference spectra of the body composition components.
- The EMSC regression may be applied to resolve an absorption spectrum of the NIR light into individual components of glucose using orthogonal spectra generated by the data whitening.
- The removing the temporal drift components may further include smoothing a differential of the extracted glucose signal by coarsely removing the temporal drift components from the extracted glucose signal.
- The removing the temporal drift components may further include applying a fine drift removal method to the smoothed differential of the extracted glucose signal to remove a residual drift from the extracted glucose signal.
- According to an aspect of another exemplary embodiment, there is provided a glucose monitoring device including: a filtering module configured to remove noise components from a near-infrared (NIR) data generated from a NIR spectrometer; an interferents removal module configured to extract a glucose signal from the NIR data by removing one or more body composition components, the body composition components comprising at least one of water component, fat, proteins, and elastin; and a feature extraction module configured to remove, from the extracted glucose signal, drift components caused due to a drift of the NIR spectrometer; wherein the glucose monitoring device may generate a data model for glucose prediction by regressing the extracted glucose signal from which the drift components have been removed, based on an expected glucose signal; and may predict a glucose level of a user based on the generated data model.
- The filtering module may include a Savitzky-Golay (SG) filter and a Fourier domain filter to remove the noise components from the NIR data.
- The interferents removal module may include: a data whitening module configured to obtain orthogonal components of reference spectra of the body composition components to perform an Extended Multiplicative Scatter Correction (EMSC) regression; an EMSC regression module configured to resolve the NIR data into one or more individual components of glucose; and a glucose signal extraction configured to extract the glucose signal from the NIR data from which the noise components have been removed.
- The feature extraction module may include: a SG filter with differential module configured to smooth a differential of the extracted glucose signal; and a drift removal module configured to remove the drift components from the extracted glucose signal.
- According to an aspect of another exemplary embodiment, there is provided a non-transitory computer readable storage medium storing a program that is executable by a computer to perform a method of monitoring glucose. The method may include: receiving a near-infrared (NIR) absorption spectrum indicating a plurality of body composition components of a user; filtering the NIR absorption spectrum to remove noise components from the NIR absorption spectrum; removing, from the NIR absorption spectrum, a signal indicating at least one of the plurality of body composition components other than glucose, and drift components to extract a glucose signal from the NIR absorption spectrum; regressing the extracted glucose signal to generate a glucose prediction model; and predicting a glucose level of the user based on the glucose prediction model.
- The above and/or other aspects will be more apparent by describing certain exemplary embodiments, with reference to the accompanying drawings, in which:
-
Figure 1 is a flowchart illustrating a method of enabling feature extraction for glucose monitoring using near infra-red spectroscopy, according to an exemplary embodiment. -
Figure 2 is a block diagram illustrating a NIR glucose meter according to an exemplary embodiment. -
Figure 3A illustrates NIR absorption spectra of different constituents of blood, according to an exemplary embodiment. -
Figure 3B illustrates a Fourier domain signal for each constituent of tissue containing interstitial liquid, according to an exemplary embodiment. -
Figure 4A illustrates NIR absorption spectra of different constituents of interstitial liquid, according to an exemplary embodiment. -
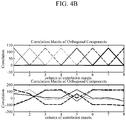
Figure 4B illustrates correlation matrices of orthogonal components and pure spectral components, according to an exemplary embodiment. -
Figures 5A ,5B ,5C , and5D illustrate correlations of extraction feature and glucose values after drift removal, according to an exemplary embodiment. -
Figure 6A ,6B and6C illustrate results of predicted glucose values using principal component regression (PCR), according to an exemplary embodiment. - Exemplary embodiments are described in greater detail below with reference to the accompanying drawings.
- In the following description, like drawing reference numerals are used for like elements, even in different drawings. The matters defined in the description, such as detailed construction and elements, are provided to assist in a comprehensive understanding of the exemplary embodiments. However, it is apparent that the exemplary embodiments can be practiced without those specifically defined matters. Also, well-known functions or constructions are not described in detail since they would obscure the description with unnecessary detail.
- The specification may refer to "an", "one" or "some" embodiment(s) in several locations. This does not necessarily imply that each such reference is to the same embodiment(s), or that the feature only applies to a single embodiment. Single features of different embodiments may also be combined to provide other embodiments.
- As used herein, the singular forms "a", "an" and "the" are intended to include the plural forms as well, unless expressly stated otherwise. It will be further understood that the terms "includes", "comprises", "including" and/or "comprising" when used in this specification, specify the presence of stated features, integers, steps, operations, elements and/or components, but do not preclude the presence or addition of one or more other features, integers, steps, operations, elements, components, and/or groups thereof. As used herein, the term "and/or" includes any and all combinations and arrangements of one or more of the associated listed items.
- Expressions such as "at least one of," when preceding a list of elements, modify the entire list of elements and do not modify the individual elements of the list.
- Unless otherwise defined, all terms (including technical and scientific terms) used herein have the same meaning as commonly understood by one of ordinary skill in the art to which this disclosure pertains. It will be further understood that terms, such as those defined in commonly used dictionaries, should be interpreted as having a meaning that is consistent with their meaning in the context of the relevant art and will not be interpreted in an idealized or overly formal sense unless expressly so defined herein.
- A NIR glucose meter described herein may be implemented as a software module or in the form of a hardware chip and be mounted in an electronic device. In this case, the electronic device may include a mobile phone, a smart phone, a notebook computer, a personal digital assistant (PDA), a portable multimedia player (PMP), a navigation system, an MP3 player, a digital camera, a wearable device, etc., and the wearable device may include various types of wearable devices, such as a wristwatch type, a wristband type, a ring type, a belt-type, a necklace type, an ankle band type, a thigh band type, a forearm band type, and the like. However, the electronic device is not limited to the above mentioned examples, and the wearable device is also not limited to the above-described examples.
-
Figure 1 is a flowchart illustrating a method of enabling feature extraction for glucose monitoring using near infra-red spectroscopy, according to an exemplary embodiment. Inoperation 102, a raw near-infrared (NIR) data associated with a glucose absorption spectrum of one or more users is received, and inoperation 104, the raw NIR data is filtered by removing noise from the raw NIR data. The noise may be caused when a NIR light is scattered while the NIR light is emitted to, passes through, and returns from the skin. Inoperation 106, orthogonal components of a scatter free reference IR spectrum are obtained, and inoperation 108, an Extended Multiplicative Scatter Correction (EMSC) regression is applied to the orthogonal components of the scatter free reference IR spectrum and the filtered NIR data. Inoperation 110, a glucose signal is extracted from the filtered NIR data by removing one or more body composition components, inoperation 104. In one exemplary embodiment, the body composition components include at least one of water, fat, and protein (ex. collagen, keratin, and elastin, etc.). Inoperation 112, removal of temporal drift components from the extracted glucose signals is performed. A data model for glucose prediction is generated by regressing the extracted glucose features after drift removal with an expected glucose values taken for calibration. The glucose values of the new NIR data are predicted using the generated data model. -
Figure 2 is a block diagram illustrating aNIR glucose meter 200 according to an exemplary embodiment. A particular skin region is illuminated with near-infrared (NIR) light using a NIR spectrometer of theNIR glucose meter 200. The NIR light may be partially absorbed and scattered according to its interaction with the constituents of tissue beneath the particular skin region before reflected back to a NIR photo-detector in theNIR glucose meter 200. The normalized absorption of NIR spectrum by different constituents is shown inFigure 3A . The reflected light contains quantitative information of the constituents of the tissue including water, fat, protein and glucose. The reflected light containing NIR spectrum data is made to pass through theNIR glucose meter 200. As shown inFigure 2 , theNIR glucose meter 200 includes afiltering unit 220, aninterferents removal unit 230 and afeature extraction unit 240. Thefiltering unit 220, theinterferents removal unit 230, and thefeature extraction unit 240 may be implemented with one or more processors. - The
filtering unit 220 may remove unwanted noises from the NIR spectrum data. In this case, the NIR spectrum data may be a near-infrared (NIR) absorption spectrum data of skin that is obtained by measuring NIR emitted toward the skin of the user. However, the NIR spectrum data is not limited thereto, and may be a NIR transmittance spectrum data of skin or NIR reflectance spectrum data of a skin. According to an exemplary embodiment, thefiltering unit 220 may use baseline correction algorithm and/or smoothing algorithm to remove unwanted noises from the NIR spectrum data. For example, thefiltering unit 220 may use Savitzky-Golay smoothing, Fourier domain filtering, and moving average, etc. - The
filtering unit 220 includes a Savitzky-Golay (SG)filter 202 and aFourier domain filter 204 to remove unwanted noises from the NIR spectrum data. TheSG filter 202 may remove spikes present in the NIR spectrum data received from the NIR spectrometer and theFourier domain filter 204 reduces the impact of interferents of the NIR spectrum data as well as the noise added in the areas where there is no overlap of signal corresponding to glucose. - The noise removing process using the filtering unit is further explained as follows. In one exemplary embodiment, an NIR spectrum signal x(n) containing raw NIR data is inputted to the
SG filter 202. TheSG filter 202 is a polynomial fit (n) filter of order N. TheSG filter 202 smoothens the NIR spectrum signal x(n) by minimizing the sum of square of errors (E) for 2M +1 samples, wherein the error calculation is given as
- Where n is the sample number.
- By minimizing E with respect to different ak, k ∈ (0, N), the NIR spectrum signal x(n) is smoothened by convoluting first row of matrix H with signal vector of 2M + 1 samples around the sample of interest.

- Where N is order of polynomial and 2M + 1 samples considered for measuring error to be minimized.
- Thus, a smoothed output xsg (n) of the SG filter with zero differential order is obtained as follows

- The resultant smoothened signal of NIR spectrum is sent to the
Fourier domain filter 204. TheFourier domain filter 204 reduces the impact of interferents of the NIR spectrum as well as the noise added in the time window where there is no significant overlap of signal corresponding to glucose. The NIR spectrum received from the NIR spectrometer is in the range 1530 nm to 1830 nm in wavelength. The NIR spectrum of the above range is represented by few samples of a dominant signal in the time domain. This case is valid for all of the interferents in the signal. An exemplary Fourier domain representation of signal in the time domain for each constituent of tissue containing interstitial liquid is shown inFigure 3B . TheFourier domain filter 204 then applies a Hanning window to suppress the noise. For example, theFourier domain filter 204 may transform time domain signal xsg (n) into Fourier domain as shown below.
- The NIR spectrum is then transformed into Fourier domain and multiplied with a Hanning window as shown below.

- It is to be noted that the Hanning window can be replaced by any Gaussian pulse shape, Raised Cosine pulse shape or any other smoothing response.
- The
interferents removal unit 230 may extract a glucose signal from the NIR data by removing one or more body composition components. According to an exemplary embodiment, theinterferents removal unit 230 may resolve the skin spectrum into individual component spectrums using a pure spectrum of each body component and extract the glucose signal based on the resolved individual component spectrums. For example, theinterferents removal unit 230 may use extended multiplicative scatter algorithm, gradient descent, least square, pseudo inverse, singular value decomposition, etc.. - The interferents removal unit 230includes an Extended Multiplicative Scatter Correction (EMSC)
module 206 and adata whitening module 208 and a glucosespectrum extraction module 210. TheEMSC module 206 includes an algorithm executed to obtain a spectrum of a glucose signal from the NIR spectrum that is filtered by theSG filter 202 and the Fourier domain filter 304. The filtered NIR spectrum may be absorption spectra of a plurality of body constituents. TheEMSC module 206 receives orthogonal spectra (Q) from thedata whitening module 208. TheEMSC module 206 receive orthogonal spectra of different interferents and regress for compositions in the NIR data. Then, concentrations of components obtained from the NIR data is subtracted from the NIR data to obtain the glucose signal. The process of EMSC and data whitening is discussed in detail hereinafter. - In order to perform the EMSC algorithm, a
data whitening module 208 produces orthogonal spectral components Q that are orthogonal to each other such that a pure spectra P of body compositions can be obtained by linear combinations of the orthogonal spectral components Q. The pure spectra P are represented as P = [p 0 p 1 ... p n-1], where pk is a column vector representing pure spectrum kth body constituent. Matrix P contains pure spectra of all body constituents (e.g., water, fat, collagen, proteins) including glucose. The pure spectrum may be an absorption spectrum of pure material (e.g., collagen, elastin, and keratin). - The pure spectra of body constituents P is sent to the
data whitening module 208 that obtainsP by performing mean and standard deviation normalization of pure component spectra X. An exemplary absorption of data whitened spectral components is shown inFigure 4A . For example, thedata whitening module 208 may obtainP as shown below.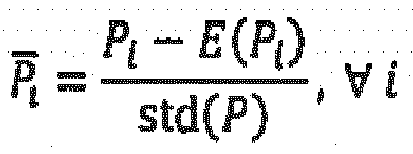
- The
P is then transformed into an orthogonal component Q by data whitening process as follows
- Where E and D are Eigen vector matrix and diagonal matrix of Eigen values of E(
P 'P ), which results in
- An exemplary correlation matrix of orthogonal components Q is shown in
Figure 4B . - In one exemplary embodiment, the algorithm present in the
EMSC module 206 resolves a given spectrum xfd (n) after noise filtering into N orthogonal spectra Q components obtained fromdata whitening module 208. - It may be assumed that xfd (n) is any noise filtered NIR spectrum including pure components P that has orthogonal components generated by the
data whitening module 208 is Q. Then xfd (n) can be resolved into orthogonal spectra Q components as follows
- Where a 0, a 1, ..., a m-1 are strengths of independent components. The
EMSC module 206 may estimate the weights a 0, a 1, ..., a m-1 using gradient descent, east square, pseudo inverse, singular value decomposition, etc.. - The glucose
spectrum extraction module 210 may extract the glucose spectrum by removing body composition components except a glucose from xfd (n). For example, when the orthogonal spectrum of the glucose is q 0 and the strength of the glucose is a 0, the glucosespectrum extraction module 210 may extract the glucose spectrum as follows.
- In turn, a differential dth of the estimated spectrum

filter 202 one more time.
- Once the
interferents removal unit 230 extracts the glucose spectrum, the extracted glucose spectrum is inputted to thefeature extraction unit 240 that uses machine learning algorithms like Principal component regression (PCR) or Partial Least square regression (PLSR). Thefeature extraction unit 240 include a SG filter withdifferential module 212 and adrift removing module 214. The SG filter withdifferential module 212 is another filter that smoothens the extracted glucose spectrum.Figures 5A to 5D illustrate correlations of extraction feature and glucose values after drift removal, according to one exemplary embodiment. The SG filter withdifferential module 212 may obtain a smoothed version of the differential dth of the extracted glucose feature in a frequency domain. The glucose feature may be enhanced in the glucose spectrum and a baseline drift of the NIR spectrum of the differential dth may be coarsely eliminated, by using the SG filter withdifferential module 212. - In another exemplary embodiment, the drift removing module 314 may remove a residual baseline drift after applying the SG filter with differential. φ may be a N x P feature matrix having P features corresponding to N observations of glucose value in each row. Each row of φ includes extracted glucose features

- Any given element of φ is associated with a wavelength λ and time t, represented as

- Where φ(t, λ) is a time varying feature
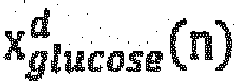
- For a given λ, differentiating φ(t,λ) with respect to time, the following equations are obtained:


- Here, K = αλ * mean(G'(t)) = 0, approx, when the glucose variations sum to zero.
- Each wavelength is compensated for drift as

- Here, j corresponds to j^th observation of glucose feature. The φ̂(λ) obtained for both training and prediction data is sent to PCR or PLSR or any other machine learning algorithm for regression.
- That is, the
feature extraction unit 240 may remove the temporal drift components from the extracted glucose signal by differentiating the glucose features


- For clarity purposes, the method of presenting calibration and training data to a machine learning algorithm is presented herewith. The raw NIR data of one person taken on
day 1 is used as calibration data xcal (n). The calibration data xcal (n) is submitted to the feature extraction unit inFigure 2 which gives the output as


day 2 is prediction data xpred (n). The prediction data xpred (n) is submitted to the feature extraction unit inFigure 2 which gives the output as

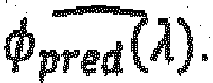
-
Figures 6A ,6B and6C illustrate results of predicted glucose values using principal component regression (PCR), according to one exemplary embodiment. As shown inFigure 6A and6B , s1, s2, ... s7 are the subjects or people considered for collecting the calibration and prediction data. For example, the raw NIR data collected from s1 (on day 1) for about 2 hours on every minute basis is provided to glucose meter for calibration and prediction model for glucose is generated. The raw NIR data for s1 on another day (day 1) is generated and submitted for prediction.Figure 6A shows the plot of expected and predicted glucose values of s1 on day2. The Pearson correlation of expected and predicted values R, Standard Error of prediction between expected and predicted values SEP, and mean absolute relative difference MARD of expected and predicted values of s1 onday 2 are listed in the title of the plot. For the same experiment,figure 5A shows a extracted normalized feature value following normalized glucose values.Figure 6B to 6C show similar experiment results with different samples for calibration and prediction. - While not restricted thereto, an exemplary embodiment can be embodied as computer-readable code on a computer-readable recording medium. The computer-readable recording medium is any data storage device that can store data that can be thereafter read by a computer system. Examples of the computer-readable recording medium include read-only memory (ROM), random-access memory (RAM), CD-ROMs, magnetic tapes, floppy disks, and optical data storage devices. The computer-readable recording medium can also be distributed over network-coupled computer systems so that the computer-readable code is stored and executed in a distributed fashion. Also, an exemplary embodiment may be written as a computer program transmitted over a computer-readable transmission medium, such as a carrier wave, and received and implemented in general-use or special-purpose digital computers that execute the programs. Moreover, it is understood that in exemplary embodiments, one or more units of the above-described apparatuses and devices can include circuitry, a processor, a microprocessor, etc., and may execute a computer program stored in a computer-readable medium.
- The foregoing exemplary embodiments and advantages are merely exemplary and are not to be construed as limiting. The present teaching can be readily applied to other types of apparatuses. Also, the description of the exemplary embodiments is intended to be illustrative, and not to limit the scope of the claims, and many alternatives, modifications, and variations will be apparent to those skilled in the art.
Claims (15)
- A method of extracting a glucose feature, the method comprising:removing noise from a near-infrared, NIR, data;extracting a glucose signal from the NIR data; andremoving temporal drift components from the extracted glucose signal.
- The method of claim 1, wherein the removing the noise comprises removing the noise from the NIR data using at least one of an Savitzky-Golay, SG, filter and a Fourier domain filtering.
- The method of claim 1, wherein the extracting the glucose signal comprises removing a signal component of a body composition other than a glucose from the NIR data,
in particular, wherein the body composition other than the glucose comprises at least one of water, fat and protein. - The method of claim 1, wherein the extracting the glucose signal comprises extracting the glucose signal based on an Extended Multiplicative Scatter Correction, EMSC, regression and data whitening.
- The method of claim 4,
wherein the data whitening is performed to obtain an orthogonal component of a pure spectrum of a body composition including a glucose, and/or
wherein the EMSC regression is applied to resolve the NIR data into signal components of individual body compositions using the orthogonal component of the pure spectrum of the body composition generated by the data whitening. - The method of claim 1, wherein the removing temporal drift components comprises differentiating and smoothing the extracted glucose signal, and removing the temporal drift components by applying a drift removal technique to the differentiated and smoothed glucose signal.
- The method of claim 6, wherein the removing temporal drift components by applying a drift removal technique comprises calculating the temporal drift components by differentiating and averaging the differentiated and smoothed glucose signal, and removing the calculated temporal drift components from the differentiated and smoothed glucose signal.
- A method of monitoring glucose comprising the method of extracting a glucose feature according to claim 1:wherein the NIR data is obtained from a NIR light that is emitted to and returns from a user and filtered by the step of removing noise from the NIR data;wherein the glucose signal is extracted from the filtered NIR data by removing one or more body composition components from the filtered NIR data;the method of monitoring glucose further comprising:generating a data model for glucose prediction by regressing the extracted glucose signal from which the temporal drift components have been removed, based on an expected glucose signal; andpredicting a glucose level of the user based on the generated data model.
- The method of claim 8,
wherein the body composition components comprise at least one of water, fat, proteins, and elastin, and/or
wherein the filtering is performed using an Savitzky-Golay, SG, filter, and/or
wherein the filtering is performed using a Fourier domain filtering. - The method of claim 8, wherein the glucose signal is extracted based on an Extended Multiplicative Scatter Correction, EMSC, regression and data whitening.
- The method of claim 10,
wherein the data whitening is performed to obtain orthogonal components of reference spectra of the body composition components, and/or
wherein the EMSC regression is applied to resolve an absorption spectrum of the NIR light into individual components of glucose using orthogonal spectra generated by the data whitening. - The method of claim 8, wherein the removing the temporal drift components further comprises smoothing a differential of the extracted glucose signal by coarsely removing the temporal drift components from the extracted glucose signal.
- The method of claim 12, wherein the removing the temporal drift components further comprises applying a fine drift removal method to the smoothed differential of the extracted glucose signal to remove a residual drift from the extracted glucose signal.
- A glucose monitoring device, comprising:a filtering module configured to remove noise components from a near-infrared, NIR, data generated from a NIR spectrometer;an interferents removal module configured to extract a glucose signal from the NIR data by removing one or more body composition components, the body composition components comprising at least one of water component, fat, proteins, and elastin; anda feature extraction module configured to remove, from the extracted glucose signal, drift components caused due to a drift of the NIR spectrometer;wherein the glucose monitoring device is configured to generate a data model for glucose prediction by regressing the extracted glucose signal from which the drift components have been removed, based on an expected glucose signal; and predict a glucose level of a user based on the generated data model.
- The glucose monitoring device of claim 14,
wherein the filtering module comprises a Savitzky-Golay, SG, filter and a Fourier domain filter to remove the noise components from the NIR data, and/or
wherein the interferents removal module comprises:a data whitening module configured to obtain orthogonal components of reference spectra of the body composition components to perform an Extended Multiplicative Scatter Correction, EMSC, regression;an EMSC regression module configured to resolve the NIR data into one or more individual components of glucose; anda glucose signal extraction configured to extract the glucose signal from the NIR data from which the noise components have been removed, and/orwherein the feature extraction module comprises:a SG filter with differential module configured to smooth a differential of the extracted glucose signal; anda drift removal module configured to remove the drift components from the extracted glucose signal.
Applications Claiming Priority (2)
| Application Number | Priority Date | Filing Date | Title |
|---|---|---|---|
| IN201741010850 | 2017-03-27 | ||
| KR1020180026210A KR102515832B1 (en) | 2017-03-27 | 2018-03-06 | Glucose feature extraction method, Glucose monitoring apparatus and method |
Publications (1)
| Publication Number | Publication Date |
|---|---|
| EP3381368A1 true EP3381368A1 (en) | 2018-10-03 |
Family
ID=61868175
Family Applications (1)
| Application Number | Title | Priority Date | Filing Date |
|---|---|---|---|
| EP18164204.2A Withdrawn EP3381368A1 (en) | 2017-03-27 | 2018-03-27 | Method of enabling feature extraction for glucose monitoring using near-infrared (nir) spectroscopy |
Country Status (2)
| Country | Link |
|---|---|
| US (1) | US10980484B2 (en) |
| EP (1) | EP3381368A1 (en) |
Cited By (2)
| Publication number | Priority date | Publication date | Assignee | Title |
|---|---|---|---|---|
| EP3531110A1 (en) * | 2018-02-23 | 2019-08-28 | Samsung Electronics Co., Ltd. | Apparatus and method for estimating concentration of blood compound |
| EP3858238A1 (en) | 2020-01-31 | 2021-08-04 | trinamiX GmbH | Portable device and method for providing treatment data to a user |
Families Citing this family (5)
| Publication number | Priority date | Publication date | Assignee | Title |
|---|---|---|---|---|
| US12484815B2 (en) | 2012-06-14 | 2025-12-02 | Medibotics Llc | Biometric wearable device (e.g. finger ring or smart watch) with optical sensors and scanning light beams |
| US11478158B2 (en) | 2013-05-23 | 2022-10-25 | Medibotics Llc | Wearable ring of optical biometric sensors |
| US20200293882A1 (en) * | 2019-03-15 | 2020-09-17 | Samsung Electronics Co., Ltd. | Near-infrared spectroscopy (nir) based glucose prediction using deep learning |
| JP7469799B2 (en) * | 2020-07-08 | 2024-04-17 | 東京都公立大学法人 | Measuring device and measuring method |
| TW202527896A (en) * | 2024-01-11 | 2025-07-16 | 台亞半導體股份有限公司 | Physiological value sensing device and sensing method thereof |
Citations (3)
| Publication number | Priority date | Publication date | Assignee | Title |
|---|---|---|---|---|
| US20040092804A1 (en) * | 2002-02-11 | 2004-05-13 | Bayer Healthcare, Llc | Non-invasive system for the determination of analytes in body fluids |
| KR20110028559A (en) * | 2003-08-11 | 2011-03-18 | 옵갈 리미티드 | Radiation measurement using uncooled microbolometer detector |
| US20150305658A1 (en) * | 2012-12-31 | 2015-10-29 | Omni Medsci. Inc. | Near-infrared lasers for non-invasive monitoring of glucose, ketones, hba1c, and other blood constituents |
Family Cites Families (11)
| Publication number | Priority date | Publication date | Assignee | Title |
|---|---|---|---|---|
| US20050107676A1 (en) | 2003-03-07 | 2005-05-19 | Acosta George M. | Method and apparatus for noninvasive glucose concentration estimation through near-infrared spectroscopy |
| JP2002202258A (en) | 2000-12-28 | 2002-07-19 | Bios Ikagaku Kenkyusho:Kk | Spectroscopic blood sugar level measuring instrument |
| CA2441078A1 (en) | 2001-01-26 | 2002-08-22 | Sensys Medical, Inc. | Noninvasive measurement of glucose through the optical properties of tissue |
| US7547281B2 (en) | 2005-02-01 | 2009-06-16 | Medtronic Minimed, Inc. | Algorithm sensor augmented bolus estimator for semi-closed loop infusion system |
| JP2010526646A (en) | 2007-05-11 | 2010-08-05 | シグメッド,インコーポレーティッド | Non-invasive characterization of physiological parameters |
| US8359164B2 (en) | 2010-03-02 | 2013-01-22 | Weiyong Li | Supervised principal component analysis |
| CN107884340B (en) | 2013-03-21 | 2022-04-01 | 唯亚威通讯技术有限公司 | Spectroscopic characterization of seafood |
| KR101569278B1 (en) | 2014-04-22 | 2015-11-16 | 포항공과대학교 산학협력단 | Quantitaive method of anhydrous galactose in saccharification from red algae |
| CN105510238B (en) * | 2014-09-28 | 2019-04-05 | 天津先阳科技发展有限公司 | Processing, modeling, prediction technique and the processing unit of multiposition diffusion spectroscopic data |
| KR20150112902A (en) | 2015-03-31 | 2015-10-07 | 강원대학교산학협력단 | Simultaneous analysis method for content of nutritional components in various foods with different matrix and form using near-infrared reflectance spectroscopy |
| KR101605995B1 (en) | 2015-08-18 | 2016-04-01 | 충남대학교산학협력단 | Makgeoli quality prediction spectroscopic analysis method |
-
2018
- 2018-03-27 EP EP18164204.2A patent/EP3381368A1/en not_active Withdrawn
- 2018-03-27 US US15/937,295 patent/US10980484B2/en active Active
Patent Citations (3)
| Publication number | Priority date | Publication date | Assignee | Title |
|---|---|---|---|---|
| US20040092804A1 (en) * | 2002-02-11 | 2004-05-13 | Bayer Healthcare, Llc | Non-invasive system for the determination of analytes in body fluids |
| KR20110028559A (en) * | 2003-08-11 | 2011-03-18 | 옵갈 리미티드 | Radiation measurement using uncooled microbolometer detector |
| US20150305658A1 (en) * | 2012-12-31 | 2015-10-29 | Omni Medsci. Inc. | Near-infrared lasers for non-invasive monitoring of glucose, ketones, hba1c, and other blood constituents |
Non-Patent Citations (5)
| Title |
|---|
| BENJAMIN BIRD ET AL: "Two step resonant Mie scattering correction of infrared micro-spectral data: human lymph node tissue", JOURNAL OF BIOPHOTONICS, vol. 3, no. 8-9, 22 April 2010 (2010-04-22), pages 597 - 608, XP055149478, ISSN: 1864-063X, DOI: 10.1002/jbio.201000024 * |
| JUAN ZHANG ET AL: "Quantitative spectroscopic analysis of heterogeneous systems: chemometric methods for the correction of multiplicative light scattering effects", REV ANAL CHEM, vol. 32, no. 2, 2013, pages 113 - 125, XP008180001, DOI: 10.1515/REVAC-2012-0037 * |
| M. TOIVIAINEN ET AL: "Blind source separation in diffuse reflectance NIR spectroscopy using independent component analysis", JOURNAL OF CHEMOMETRICS, vol. 24, no. 7-8, 27 May 2010 (2010-05-27), pages 514 - 522, XP055126170, ISSN: 0886-9383, DOI: 10.1002/cem.1316 * |
| NILS KRISTIAN AFSETH ET AL: "Extended multiplicative signal correction in vibrational spectroscopy, a tutorial", CHEMOMETRICS AND INTELLIGENT LABORATORY SYSTEMS, vol. 117, 1 August 2012 (2012-08-01), NL, pages 92 - 99, XP055267807, ISSN: 0169-7439, DOI: 10.1016/j.chemolab.2012.03.004 * |
| PETER LASCH: "Spectral pre-processing for biomedical vibrational spectroscopy and microspectroscopic imaging", CHEMOMETRICS AND INTELLIGENT LABORATORY SYSTEMS, vol. 117, 1 August 2012 (2012-08-01), NL, pages 100 - 114, XP055397211, ISSN: 0169-7439, DOI: 10.1016/j.chemolab.2012.03.011 * |
Cited By (3)
| Publication number | Priority date | Publication date | Assignee | Title |
|---|---|---|---|---|
| EP3531110A1 (en) * | 2018-02-23 | 2019-08-28 | Samsung Electronics Co., Ltd. | Apparatus and method for estimating concentration of blood compound |
| US11504070B2 (en) | 2018-02-23 | 2022-11-22 | Samsung Electronics Co., Ltd. | Apparatus and method for estimation concentration of blood compound |
| EP3858238A1 (en) | 2020-01-31 | 2021-08-04 | trinamiX GmbH | Portable device and method for providing treatment data to a user |
Also Published As
| Publication number | Publication date |
|---|---|
| US10980484B2 (en) | 2021-04-20 |
| US20180271448A1 (en) | 2018-09-27 |
Similar Documents
| Publication | Publication Date | Title |
|---|---|---|
| US10980484B2 (en) | Method of enabling feature extraction for glucose monitoring using near-infrared (NIR) spectroscopy | |
| US6701170B2 (en) | Blind source separation of pulse oximetry signals | |
| US20050149300A1 (en) | Method and apparatus for enhanced estimation of an analyte property through multiple region transformation | |
| EP3474288B1 (en) | Apparatus and method for obtaining individualized unit spectrum, and apparatus and method for estimating biological component | |
| EP2544124A1 (en) | Methods and systems for non-invasive measurement of glucose levels | |
| US20150025340A1 (en) | Calibration curve creating method and apparatus for the same, and blood component calibration apparatus | |
| Li et al. | Classification of diabetes and measurement of blood glucose concentration noninvasively using near infrared spectroscopy | |
| Vyas et al. | Non-invasive estimation of skin thickness from hyperspectral imaging and validation using echography | |
| US11141083B2 (en) | System and method for obtaining blood glucose concentration using temporal independent component analysis (ICA) | |
| US20180317817A1 (en) | Method of predicting blood glucose level using near-infrared (nir) spectroscopy data | |
| US9320464B2 (en) | Method and measuring instrument for measuring the oxygen saturation in the blood | |
| Chowdhury et al. | Estimation of blood glucose level of type-2 diabetes patients using smartphone video through PCA-DA | |
| Habbu et al. | Noninvasive blood glucose estimation using pulse based cepstral coefficients | |
| US20230023592A1 (en) | Hyperspectral image construction of biological tissue for blood hemoglobin analysis using a smartphone | |
| KR102574085B1 (en) | Apparatus and method for predicting blood glucose concentration | |
| US11089981B2 (en) | Methods and systems for performing universal calibration to non-invasively determine blood glucose concentration | |
| EP3531110B1 (en) | Apparatus and method for estimating concentration of blood compound | |
| KR20200130086A (en) | Method of preprocessing near infrared(nir) spectroscopy data for non-invasive glucose monitoring and apparatus thereof | |
| Barati et al. | Principal component analysis and near-infrared spectroscopy as noninvasive blood glucose assay methods | |
| KR102515832B1 (en) | Glucose feature extraction method, Glucose monitoring apparatus and method | |
| KR102765474B1 (en) | Apparatus and method for determining blood glucose concentration | |
| US20200352517A1 (en) | Method of preprocessing near infrared (nir) spectroscopy data for non-invasive glucose monitoring and apparatus thereof | |
| Suryakala et al. | Chemometric analysis of diffuse reflectance spectral data using singular value decomposition for blood glucose detection | |
| JP2017060640A (en) | Determination method and determination device | |
| Wang et al. | Motion Artefact Removal in Functional Near-Infrared Spectroscopy Signals Based on Robust Estimation |
Legal Events
| Date | Code | Title | Description |
|---|---|---|---|
| PUAI | Public reference made under article 153(3) epc to a published international application that has entered the european phase |
Free format text: ORIGINAL CODE: 0009012 |
|
| STAA | Information on the status of an ep patent application or granted ep patent |
Free format text: STATUS: THE APPLICATION HAS BEEN PUBLISHED |
|
| AK | Designated contracting states |
Kind code of ref document: A1 Designated state(s): AL AT BE BG CH CY CZ DE DK EE ES FI FR GB GR HR HU IE IS IT LI LT LU LV MC MK MT NL NO PL PT RO RS SE SI SK SM TR |
|
| AX | Request for extension of the european patent |
Extension state: BA ME |
|
| STAA | Information on the status of an ep patent application or granted ep patent |
Free format text: STATUS: REQUEST FOR EXAMINATION WAS MADE |
|
| 17P | Request for examination filed |
Effective date: 20190403 |
|
| RBV | Designated contracting states (corrected) |
Designated state(s): AL AT BE BG CH CY CZ DE DK EE ES FI FR GB GR HR HU IE IS IT LI LT LU LV MC MK MT NL NO PL PT RO RS SE SI SK SM TR |
|
| STAA | Information on the status of an ep patent application or granted ep patent |
Free format text: STATUS: EXAMINATION IS IN PROGRESS |
|
| 17Q | First examination report despatched |
Effective date: 20210728 |
|
| STAA | Information on the status of an ep patent application or granted ep patent |
Free format text: STATUS: THE APPLICATION IS DEEMED TO BE WITHDRAWN |
|
| 18D | Application deemed to be withdrawn |
Effective date: 20220726 |