EP3364341A1 - Analyzing digital holographic microscopy data for hematology applications - Google Patents
Analyzing digital holographic microscopy data for hematology applications Download PDFInfo
- Publication number
- EP3364341A1 EP3364341A1 EP18159357.5A EP18159357A EP3364341A1 EP 3364341 A1 EP3364341 A1 EP 3364341A1 EP 18159357 A EP18159357 A EP 18159357A EP 3364341 A1 EP3364341 A1 EP 3364341A1
- Authority
- EP
- European Patent Office
- Prior art keywords
- erythrocytes
- cell
- dhm
- image
- parametric model
- Prior art date
- Legal status (The legal status is an assumption and is not a legal conclusion. Google has not performed a legal analysis and makes no representation as to the accuracy of the status listed.)
- Granted
Links
Images






Classifications
-
- G—PHYSICS
- G01—MEASURING; TESTING
- G01N—INVESTIGATING OR ANALYSING MATERIALS BY DETERMINING THEIR CHEMICAL OR PHYSICAL PROPERTIES
- G01N15/00—Investigating characteristics of particles; Investigating permeability, pore-volume or surface-area of porous materials
- G01N15/10—Investigating individual particles
- G01N15/14—Optical investigation techniques, e.g. flow cytometry
- G01N15/1429—Signal processing
- G01N15/1433—Signal processing using image recognition
-
- G—PHYSICS
- G01—MEASURING; TESTING
- G01N—INVESTIGATING OR ANALYSING MATERIALS BY DETERMINING THEIR CHEMICAL OR PHYSICAL PROPERTIES
- G01N33/00—Investigating or analysing materials by specific methods not covered by groups G01N1/00 - G01N31/00
- G01N33/48—Biological material, e.g. blood, urine; Haemocytometers
- G01N33/483—Physical analysis of biological material
- G01N33/487—Physical analysis of biological material of liquid biological material
- G01N33/49—Blood
-
- G—PHYSICS
- G03—PHOTOGRAPHY; CINEMATOGRAPHY; ANALOGOUS TECHNIQUES USING WAVES OTHER THAN OPTICAL WAVES; ELECTROGRAPHY; HOLOGRAPHY
- G03H—HOLOGRAPHIC PROCESSES OR APPARATUS
- G03H1/00—Holographic processes or apparatus using light, infrared or ultraviolet waves for obtaining holograms or for obtaining an image from them; Details peculiar thereto
- G03H1/04—Processes or apparatus for producing holograms
- G03H1/0443—Digital holography, i.e. recording holograms with digital recording means
-
- G—PHYSICS
- G06—COMPUTING OR CALCULATING; COUNTING
- G06F—ELECTRIC DIGITAL DATA PROCESSING
- G06F18/00—Pattern recognition
- G06F18/20—Analysing
- G06F18/24—Classification techniques
- G06F18/241—Classification techniques relating to the classification model, e.g. parametric or non-parametric approaches
-
- G—PHYSICS
- G06—COMPUTING OR CALCULATING; COUNTING
- G06F—ELECTRIC DIGITAL DATA PROCESSING
- G06F18/00—Pattern recognition
- G06F18/20—Analysing
- G06F18/24—Classification techniques
- G06F18/241—Classification techniques relating to the classification model, e.g. parametric or non-parametric approaches
- G06F18/2411—Classification techniques relating to the classification model, e.g. parametric or non-parametric approaches based on the proximity to a decision surface, e.g. support vector machines
-
- G—PHYSICS
- G06—COMPUTING OR CALCULATING; COUNTING
- G06T—IMAGE DATA PROCESSING OR GENERATION, IN GENERAL
- G06T7/00—Image analysis
- G06T7/0002—Inspection of images, e.g. flaw detection
- G06T7/0012—Biomedical image inspection
-
- G—PHYSICS
- G06—COMPUTING OR CALCULATING; COUNTING
- G06T—IMAGE DATA PROCESSING OR GENERATION, IN GENERAL
- G06T7/00—Image analysis
- G06T7/10—Segmentation; Edge detection
- G06T7/136—Segmentation; Edge detection involving thresholding
-
- G—PHYSICS
- G06—COMPUTING OR CALCULATING; COUNTING
- G06V—IMAGE OR VIDEO RECOGNITION OR UNDERSTANDING
- G06V10/00—Arrangements for image or video recognition or understanding
- G06V10/70—Arrangements for image or video recognition or understanding using pattern recognition or machine learning
- G06V10/764—Arrangements for image or video recognition or understanding using pattern recognition or machine learning using classification, e.g. of video objects
-
- G—PHYSICS
- G06—COMPUTING OR CALCULATING; COUNTING
- G06V—IMAGE OR VIDEO RECOGNITION OR UNDERSTANDING
- G06V20/00—Scenes; Scene-specific elements
- G06V20/60—Type of objects
- G06V20/69—Microscopic objects, e.g. biological cells or cellular parts
-
- G—PHYSICS
- G06—COMPUTING OR CALCULATING; COUNTING
- G06V—IMAGE OR VIDEO RECOGNITION OR UNDERSTANDING
- G06V20/00—Scenes; Scene-specific elements
- G06V20/60—Type of objects
- G06V20/69—Microscopic objects, e.g. biological cells or cellular parts
- G06V20/698—Matching; Classification
-
- G—PHYSICS
- G01—MEASURING; TESTING
- G01N—INVESTIGATING OR ANALYSING MATERIALS BY DETERMINING THEIR CHEMICAL OR PHYSICAL PROPERTIES
- G01N15/00—Investigating characteristics of particles; Investigating permeability, pore-volume or surface-area of porous materials
- G01N15/01—Investigating characteristics of particles; Investigating permeability, pore-volume or surface-area of porous materials specially adapted for biological cells, e.g. blood cells
- G01N2015/016—White blood cells
-
- G—PHYSICS
- G01—MEASURING; TESTING
- G01N—INVESTIGATING OR ANALYSING MATERIALS BY DETERMINING THEIR CHEMICAL OR PHYSICAL PROPERTIES
- G01N15/00—Investigating characteristics of particles; Investigating permeability, pore-volume or surface-area of porous materials
- G01N15/10—Investigating individual particles
- G01N2015/1006—Investigating individual particles for cytology
-
- G—PHYSICS
- G03—PHOTOGRAPHY; CINEMATOGRAPHY; ANALOGOUS TECHNIQUES USING WAVES OTHER THAN OPTICAL WAVES; ELECTROGRAPHY; HOLOGRAPHY
- G03H—HOLOGRAPHIC PROCESSES OR APPARATUS
- G03H1/00—Holographic processes or apparatus using light, infrared or ultraviolet waves for obtaining holograms or for obtaining an image from them; Details peculiar thereto
- G03H1/0005—Adaptation of holography to specific applications
- G03H2001/005—Adaptation of holography to specific applications in microscopy, e.g. digital holographic microscope [DHM]
-
- G—PHYSICS
- G06—COMPUTING OR CALCULATING; COUNTING
- G06T—IMAGE DATA PROCESSING OR GENERATION, IN GENERAL
- G06T2207/00—Indexing scheme for image analysis or image enhancement
- G06T2207/30—Subject of image; Context of image processing
- G06T2207/30004—Biomedical image processing
- G06T2207/30101—Blood vessel; Artery; Vein; Vascular
- G06T2207/30104—Vascular flow; Blood flow; Perfusion
Definitions
- the present disclosure relates generally to analyzing digital holographic microscopy (DHM) for hematology applications.
- DLM digital holographic microscopy
- the various systems, methods, and apparatuses described herein may be applied, for example, red blood cell (RBC) volume measurement and white blood cell (WBC) differential (cell type classification) applications.
- RBC red blood cell
- WBC white blood cell
- Digital holographic microscopy also known as interference phase microscopy
- interference phase microscopy is an imaging technology that provides the ability to quantitatively track sub-nanometric optical thickness changes in transparent specimens.
- DHM captures both phase and intensity.
- the phase information, captured as a hologram can be used to reconstruct extended morphological information (such as depth and surface characteristics) about the specimen using a computer algorithm.
- Modem DHM implementations offer several additional benefits, such as fast scanning/data acquisition speed, low noise, high resolution and the potential for label-free sample acquisition.
- Embodiments of the present invention address and overcome one or more of the above shortcomings and drawbacks, by providing methods, systems, and apparatuses related to analyzing digital holographic microscopy (DHM) for hematology applications. Additionally, as explained in further detail in the disclosure, the technology described herein may be applied to other clinical applications as well.
- DHM digital holographic microscopy
- DHM red blood cell
- WBC white blood cell
- DHM allows for scanning a microfluidic sample in layers to reconstruct the sediment (possibly without waiting for sedimentation); improving the classification accuracy of sediment constituents.
- DHM may also be used for tissue pathology applications through utilization of extended morphology / contrast of DHM (e.g. to discriminate cancerous from healthy cells, in fresh tissue, without labeling).
- extended morphology /contrast of DHM e.g. to differentiate rare cells such as circulating tumor / epithelial cells, stem cells, infected cells, etc.
- a method for analyzing digital holographic microscopy (DHM) data for hematology applications includes receiving a DHM image acquired using a digital holographic microscopy system and identifying one or more erythrocytes in the DHM image. Next, for each respective erythrocyte included in the one or more erythrocytes, a cell thickness value is estimated for the respective erythrocyte using a parametric model and a cell volume value is calculated for the respective erythrocyte using the cell thickness value. In some embodiments, the method further comprising performing a complete blood cell (CBC) test using the cell thickness value and the cell volume value associated with each respective erythrocyte.
- CBC complete blood cell
- the method further comprises performing a segmentation on the DHM image to generate a segmentation mask including boundaries for the one or more erythrocytes.
- This segmentation may be performed, for example, by minimizing a piecewise constant energy functional in a combinatorial optimization framework.
- a connected component analysis may be performed on the segmentation mask to label the one or more erythrocytes.
- the parametric model represents each of the one or more erythrocytes using Cassini ovals.
- the parametric model represents each of the one or more erythrocytes using a cell diameter value, a minimum dimple thickness value, a maximum thickness value and a circle diameter value representative of maximum cell thickness.
- the parameters used in the parametric model may be determined, for example, by minimizing a sum squared error between a depth map estimated from the parametric model and a depth observed from the DHM image.
- an article of manufacture for analyzing DHM data for hematology applications comprise a non-transitory, tangible computer-readable medium holding computer-executable instructions for performing the aforementioned method.
- This article of manufacture may further include instructions for any of the additional features discussed above with respect to the aforementioned method.
- a system for analyzing DHM data for hematology applications comprises a networking component and a modeling processor.
- the networking component is configured to communicate with using a DHM system to retrieve a DHM image.
- the modeling processor is configured to identify one or more erythrocytes in the received DHM image.
- the modeling processor is further configured to estimate a cell thickness value (using a parametric model) and calculate a cell volume for each respective erythrocyte included in the one or more erythrocytes.
- red blood cell (RBC) volume estimation is performed using parametric modeling of erythrocytes to regularize the raw DHM data to match physical models of the erythrocytes, in an attempt to eliminate any distortion caused during the image acquisition process.
- label-free differentiation of white blood cells (WBCs) captured by DHM is performed using a machine learning algorithm which extract characteristic topological changes from a set of training samples DHM images for each sub-type of WBCs (namely, monocytes, neutrophils, basophils, lymphocytes, eosinophils).
- the machine learning algorithm then classifies a new cell into one of the categories automatically based on the learnt DHM image based features.
- "digital staining" or "pseudo-coloring" of the classified DHM images of the cells is performed to resemble conventional staining techniques.
- the digital staining method described herein uses a matched pair of DHM and stained images of a set of cells, and a regression function is learnt to map the DHM image pixel (representing the topology of the cell constituents to a RGB color scheme of conventional staining techniques).
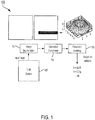
- FIG. 1 provides an illustration of a framework 100 for processing DHM images for erythrocyte volume computation, according to some embodiments.
- a DHM System 105 is used to acquire one or more input images.
- the Digital Holographic Microscopy System 105 may be any system known in the art capable of acquiring DHM images.
- An Image Segmentation Component 110 performs segmentation of the erythrocytes in the acquired input images.
- a Parametric Modeling Component 115 develops a model of the erythrocytes (e.g., using Cassini ovals).
- a Parametric Modeling Component 120 calculates thickness information of each erythrocyte which, in turn, can be used to determine the erythrocyte's volume.
- the segmentation problem performed by the Image Segmentation Component 110 is formulated as an energy minimization problem that minimizes the piecewise constant Mumford-Shah energy functional in a combinatorial optimization framework.
- the constants c 1 and c 2 represent the piecewise constant approximation of the input DHM image
- w pq represents the weights of the Euclidean length regularization
- ⁇ is a weighting coefficient that defines the contribution of the length regularization to the segmentation energy.
- a relatively high value for mu may be used to avoid separating the nucleus from the rest of the cell.
- FIG. 2 provides an example illustration of Segmentation of erythrocytes in optical path difference DHM (OPD-DHM) images.
- Image 205 shows the input image
- image 210 shows the delineation (represented by a dotted line) of the erythrocyte boundaries is imposed on the image 205.
- a normal erythrocyte is generally shaped as a biconcave disk to achieve a large surface area -to-volume ratio.
- FIG. 3 shows a geometry model 300 of a normal erythrocyte.
- There are four main parameters that affect the shape of the cell shown in FIG. 3 ): the diameter of the cell (D), the minimum dimple thickness (t), the maximum thickness (h) and the diameter of the circle that determines the maximum thickness (d).
- the parametric modeling of the cell regularizes the cell surface to match the physical models of the erythrocytes and eliminate any distortion caused during the image acquisition process.
- FIG. 4 provides an example of the parametric modeling of the erythrocytes which illustrates the regularization.
- Image 405 the cell surface is depicted as observed from the DHM image.
- Image 410 shows the cell surface as characterized by the Evans - Fung model.
- the volume of each RBC may be computed.
- the RBC volume may then be used as a clinical measurement in and of itself, or it may be used to derive additional clinically significant values.
- the calculation of RBC volume may be used in determining mean cell volume (MCV) which, in turn, is a critical parameter in a complete blood count (CBC).
- MCV mean cell volume
- CBC complete blood count
- FIG. 5 provides an illustration of a process 500 for calculating cell volume, according to some embodiments.
- an OPD-DHM image of erythrocytes is received.
- the DHM image is segmented to extract all the erythrocytes from the background. Segmentation may be performed, for example, using the combinatorial piece wise constant Mumford-Shah energy functional or any similar technique generally known in art.
- connected component analysis is applied to the segmentation mask to label the independent erythrocytes.
- a measurement process is performed for each erythrocyte.
- the cell surface is approximated, for example, using the Evans-Fung technique.
- the sum squared differences in Equation 4 are optimized and the model parameters C0, C1 and C2 are computed.
- the model is used to estimate the updated cell thickness z(p) using Equation 3.
- the updated cell thickness is used to calculate the cell volume.
- the output of the process 500 is a volume for each erythrocyte.
- the process 500 can be extended to provide the mean hemoglobin content of the cell as well.
- a conventional hematology analyzer may be used for calibration of mean cell volume and conversion of optical density map based volume to the average hemoglobin content.
- Differential blood tests measure the percentage of each type of white blood cell type in a blood cell sample. Identifying each type of white blood cell is a crucial preliminary step to blood differential analysis that is used to diagnose diseases such as infections, anemia and Leukemia.
- the system described herein may be applied to differentiate among the different white blood cell types. Specifically, the described system aims to differentiate five different types of white blood cells, namely: monocytes, basophils, neutrophils, eosinophils and lymphocytes.
- a pipeline of processing the white blood cells comprises the following three steps. The first step is pre-processing where various types of white blood cells are identified and isolated. The second step is training where a classifier is trained from the extracted cells. The third step is classification where a classifier is used to categorize unseen cells. Each of these steps will now be discussed in detail.
- FIG. 6 provides an illustration of a pre-processing framework 600 for classifying white blood cells, as it may be applied in some embodiments.
- a pipeline is used to prepare the training patches for the classifier training step. Initially, a threshold is applied to an input image 605 to capture the bright spots (that are highly likely to be cells). After thresholding, a connected component analysis is applied to the thresholded image 610. Then, as illustrated in image 615, the component size is calculated for each connected component. A component is rejected if its size is below or above predefined thresholds t1 and t2. The rejected components are excluded from training and testing.
- the patches (patch is a rectangular box including the connected component), including the remaining components are used to train the classifier (e.g., a K-Nearest Neighbor classifier).
- various machine learning algorithms may be used for performing five part differential on DHM images of white blood cells.
- a texton-based approach is used, where the textural characteristics of DHM image of cells are used as the main discriminating feature.
- a more data driven approach is employed, where a dictionary of image patches is learned and used to represent the entire image as a histogram. The histogram is then used as the main feature for classification between various cell sub-types.
- classification is based on a convolutional neural network with multiple layers to perform feature extraction, selection, and classification at once with a multi-layer network.
- image classification algorithms are trained using a data set of representative images.
- a training data set is illustrated in FIG. 7 .
- cell images are labelled in one of four categories: monocyte, basophil, neutrophil, and lymphocytes.
- this training set is but one example of a data that may be used in training the classifier.
- other training sets employed in some embodiments may include additional categories (e.g., eosinophils). Additionally (or alternately), the categories could have a finer level of granularity.
- the extracted patches that include the preprocessed cell images are used to train a K-Nearest Neighbor (K-NN) classifier.
- K-NN K-Nearest Neighbor
- the classifier utilized texton based texture features extracted from each patch. Textons are the representation of small texture features by a collection of filter bank responses. Texton based texture classifiers use the histograms of the textons to characterize the texture by the frequency of the textons in a particular patched as compared to the textons of the training data set.
- the texton features are used, in particular, because it is pathologically proven that the granularity of cell nuclei differ in the different cell types and this can be captured using texture features.
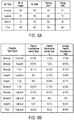
- FIG. 8A provides a table showing an example of a data set that may be used for training and testing for each cell type.
- the classification rate obtained for this example dataset in all the pairwise classifications varies from 75% to 95%.
- FIG. 8B shows pairwise classification results obtained using texton features and KNN classifier for this sample case.
- one or more pairwise classifiers may be combined using voting. Ideally four classifiers should agree on the class label and 6 classifiers would provide random labeling. For example, if 10 classifiers are denoted as C1 to C10, the final class label L for an unknown sample S can be represented as the mode (most frequent value) of the labels of the 10 classifiers. In other words, the majority vote of the 10 pairwise classifiers is labeled for the multi-label classification problem. Combining all the pairwise classification to one multi-label classifier yielded a 76.5% correct classification rate for the example dataset set presented in FIG. 8A .
- a bag of visual words (BOW) approach may be used to solve this multi-class based image classification problem.
- the global image features are represented by vectors of occurrence counts of visual words (a histogram over a vocabulary dictionary based on local image feature). These global image features are then used for classification.
- the pipeline may be divided into three stages: offline vocabulary learning, image classification training and testing.
- a visual vocabulary dictionary may be trained using hierarchical k-means and SIFT (scale-invariant feature transform) descriptor as local image feature.
- SIFT scale-invariant feature transform
- SVM n-label supporting vector machine
- two approaches may be employed. First, each training image may be perturbed at random degree. Secondly, SVM parameters may be determined for the kernel using cross validation on the training data set.
- SIFT descriptor describes invariant local image structure and capturing local texture information. Dense SIFT descriptors may be computed for every ns pixels of each image ( w ⁇ h , where w and h are image width and height respectively. For example, a 128 dimension SIFT descriptor may be used and, thus, there are about w n s ⁇ h n s ⁇ 128 local image features per image. FIG. 9 provides an example of local image feature sampling, as it may be applied in some embodiments. In this example, each white dot represents a location where 128 dimension SIFT descriptor is computed.
- a modified vocabulary tree structure is utilized to construct a visual vocabulary dictionary.
- the vocabulary tree defines a hierarchical quantization using a hierarchical k-means clustering.
- the node 1005 is a visual cluster center. 2 n d leaf nodes are finally used as visual vocabulary words. n d is the depth of the binary tree.
- the initial k-means algorithm is applied on to the training data (a collection of SIFT descriptors derived from training data set) and then partitioned into 2 groups, where each group comprises SIFT descriptors closest to the cluster center.
- a SIFT descriptor (a vector) is passed down the tree by each level via comparing this feature vector to the 2 cluster centers and choosing the closest one.
- the visual word histogram is computed for all the dense SIFT descriptors on each image.
- FIG. 11 provides a visualization of the workflow for the transformation from local image features (dense SIFT descriptor) to global image features (vocabulary histogram).
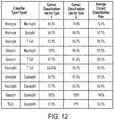
- the results obtained by combining SIFT features with SVM classification for an example dataset are depicted in FIG. 12 . Combining these pairwise classifiers yielded an 84% correct classification rate for the 5-type classification problem.
- a Deep Learning (DL) architecture is used to perform the 5-type classification. While SVM is mainly formulated for binary classification, DL is inherently a multi-label classifier. To illustrate the DL classification technique, the convolutional network was directly trained for the multi-label classification problem. 500 cells were used for training, 100 for each category and the rest of the cells were used for testing.
- DL Deep Learning
- FIG. 13 shows the structure of a feed-forward neural network with one hidden layer (also referred to as an "AE"). Ignoring the bias term (the nodes labeled as "+1" in FIG. 13 ), the input and output layers have the same number of nodes.
- the objective of such auto encoders is to learn a transfer function between the input layer (features that represent the images) and the output layer (the labels for the image). If the hidden layer has a size equal or larger than the input layer, potentially, an AE may learn an identity transformation.
- an AE is set up with a hidden layer with fewer nodes than the input.
- DAE denoising auto-encoder
- a certain percentage (e.g., 50%) of input nodes are randomly picked to be disturbed (e.g., set the value to zero) and the DAE is required to reconstruct the original input vector given a contaminated observation.
- the hidden layer may have more nodes than the input to achieve an over-complete representation.
- the output layer is discarded and another AE is stacked using the activation response of the already trained hidden layer as input to the new AE. This process can be repeated to train and expand a network layer by layer.
- the output of the hidden layers can be treated as high-level image features to train a classifier.
- the various categories of white blood cells may be presented to the pathologist in a graphical user interface (GUI) for final confirmation.
- GUI graphical user interface
- the probability of a given cell belonging to a certain sub-type may be calculated and presented numerically or graphically to the pathologist during the final check.
- FIG. 14 shows a GUI which provides for results visualization and facilitates user interaction and correction, according to some embodiments.
- the pathologist will have a chance to make a modification based on the DHM image of the cells.
- the results of the automatic blood differential is depicted at the top two rows 1405 displaying the percentage of each blood cell type and the possible diagnosis based on these percentages.
- the bottom part of the figure 1410 shows how the user can modify the results.
- the system shows the top cell candidates for user interactions. These cells are chosen and sorted based on the difference of the top two probabilities.
- the system displays the extracted cell (extracted by our preprocessing pipeline) and displays the probability of it belonging to each WBC type.
- the user can accept the label or choose a new label by simply marking a check box. If the user changes the label, the system may automatically update the counts, the percentages and the possible diagnosis, which changes the top row and displays the new results.
- a pseudo-colorization scheme which converts the DHM images into an image with a color pattern similar to cell images stained for conventional staining methodologies such as the Wright and Giemsa methodologies.
- Giemsa-Wright stains use solutions which include eosin Y, azure B, and methylene blue for staining. These solutions bind to the constituents of the cells including nucleus and granules differently and thereby provide a more pronounced coloring which is essential for visual inspection of the cells. From a DHM image of a cell, we obtain different optical density patterns for the cell constituents and that could be used as a feature to perform colorization.
- the method that we envision is based on having matched pairs of cells which are imaged both with DHM and Giemsa staining respectively.
- a simple regression function is used, which can be implemented using a machine learning technique such as a convolutional neural network to map optical density maps from DHM to the RGB color scheme consistent with Giemsa-Wright staining protocol.
- the regression map could work either on the single pixel or groups of pixels (i.e., image patches).
- a Markov random field based regularization may be utilized to make sure that the neighboring pixels with similar optical density will be colored similarly.
- Giemsa and Wright stains other staining protocols can be learned based on set of matching pairs of cellular images and the stained version can be digitally reproduced from the DHM images.
- the mean cell volume computation for RBC described herein and/or the WBC five part differential may be used as key measurements for a Complete Blood Count (CBC) test.
- CBC Complete Blood Count
- a CBC test evaluates an individual's overall health and may be used in the detection of blood-related disorders such as anemia, infection and leukemia. So, for example, abnormal increases or decreases in particular WBC counts may be used as an indicator of an underlying medical condition that calls for further evaluation.
- the five part differential methodology for white blood cell sub-typing is applied on raw fringe pattern images prior to the reconstruction as well.
- multiple images of the same cell could be used and the results could be averaged.
- the systems and methods described herein may also be applied to clinical applications outside the cell classification space.
- the size calculation and classification of various objects based on the methodology described can be extended for urine analysis applications, where the size of urine sediments are measured and various kinds are identified by analyzing the DHM images using the methodology described.
- DHM technology particularly reductions in size, complexity and cost - these (and other) applications could be performed within a clinical environment or at the point of care (in a decentralized manner).
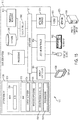
- FIG. 15 illustrates an exemplary computing environment 1500 within which embodiments of the invention may be implemented.
- this computing environment 1500 may be configured to execute one or more of the components of the framework 100 for processing DHM images illustrated in FIG 1 . Additionally (or alternatively), this computing environment 1500 may be configured to perform one or more of the processes described herein (e.g., the process 500 for calculating cell volume shown in FIG. 1 .
- the computing environment 1500 may include computer system 1510, which is one example of a computing system upon which embodiments of the invention may be implemented.
- Computers and computing environments, such as computer system 1510 and computing environment 1500 are known to those of skill in the art and thus are described briefly here.
- the computer system 1510 may include a communication mechanism such as a bus 1521 or other communication mechanism for communicating information within the computer system 1510.
- the computer system 1510 further includes one or more processors 1520 coupled with the bus 1521 for processing the information.
- the processors 1520 may include one or more central processing units (CPUs), graphical processing units (GPUs), or any other processor known in the art.
- the computer system 1510 also includes a system memory 1530 coupled to the bus 1521 for storing information and instructions to be executed by processors 1520.
- the system memory 1530 may include computer readable storage media in the form of volatile and/or nonvolatile memory, such as read only memory (ROM) 1531 and/or random access memory (RAM) 1532.
- the system memory RAM 1532 may include other dynamic storage device(s) (e.g., dynamic RAM, static RAM, and synchronous DRAM).
- the system memory ROM 1531 may include other static storage device(s) (e.g., programmable ROM, erasable PROM, and electrically erasable PROM).
- the system memory 1530 may be used for storing temporary variables or other intermediate information during the execution of instructions by the processors 1520.
- BIOS basic input/output system
- BIOS basic input/output system
- RAM 1532 may contain data and/or program modules that are immediately accessible to and/or presently being operated on by the processors 1520.
- System memory 1530 may additionally include, for example, operating system 1534, application programs 1535, other program modules 1536 and program data 1537.
- the computer system 1510 also includes a disk controller 1540 coupled to the bus 1521 to control one or more storage devices for storing information and instructions, such as a hard disk 1541 and a removable media drive 1542 (e.g., floppy disk drive, compact disc drive, tape drive, and/or solid state drive).
- a hard disk 1541 and a removable media drive 1542 e.g., floppy disk drive, compact disc drive, tape drive, and/or solid state drive.
- the storage devices may be added to the computer system 1510 using an appropriate device interface (e.g., a small computer system interface (SCSI), integrated device electronics (IDE), Universal Serial Bus (USB), or FireWire).
- SCSI small computer system interface
- IDE integrated device electronics
- USB Universal Serial Bus
- FireWire FireWire
- the computer system 1510 may also include a display controller 1565 coupled to the bus 1521 to control a display 1566, such as a cathode ray tube (CRT) or liquid crystal display (LCD), for displaying information to a computer user.
- the computer system includes an input interface 1560 and one or more input devices, such as a keyboard 1562 and a pointing device 1561, for interacting with a computer user and providing information to the processor 1520.
- the pointing device 1561 for example, may be a mouse, a trackball, or a pointing stick for communicating direction information and command selections to the processor 1520 and for controlling cursor movement on the display 1566.
- the display 1566 may provide a touch screen interface which allows input to supplement or replace the communication of direction information and command selections by the pointing device 1561.
- the computer system 1510 may perform a portion or all of the processing steps of embodiments of the invention in response to the processors 1520 executing one or more sequences of one or more instructions contained in a memory, such as the system memory 1530. Such instructions may be read into the system memory 1530 from another computer readable medium, such as a hard disk 1541 or a removable media drive 1542.
- the hard disk 1541 may contain one or more datastores and data files used by embodiments of the present invention. Datastore contents and data files may be encrypted to improve security.
- the processors 1520 may also be employed in a multi-processing arrangement to execute the one or more sequences of instructions contained in system memory 1530.
- hard-wired circuitry may be used in place of or in combination with software instructions. Thus, embodiments are not limited to any specific combination of hardware circuitry and software.
- the computer system 1510 may include at least one computer readable medium or memory for holding instructions programmed according to embodiments of the invention and for containing data structures, tables, records, or other data described herein.
- the term "computer readable medium” as used herein refers to any medium that participates in providing instructions to the processor 1520 for execution.
- a computer readable medium may take many forms including, but not limited to, non-volatile media, volatile media, and transmission media.
- Non-limiting examples of non-volatile media include optical disks, solid state drives, magnetic disks, and magneto-optical disks, such as hard disk 1541 or removable media drive 1542.
- Non-limiting examples of volatile media include dynamic memory, such as system memory 1530.
- Non-limiting examples of transmission media include coaxial cables, copper wire, and fiber optics, including the wires that make up the bus 1521.
- Transmission media may also take the form of acoustic or light waves, such as those generated during radio wave and infrared data communications.
- the computing environment 1500 may further include the computer system 1510 operating in a networked environment using logical connections to one or more remote computers, such as remote computer 1580.
- Remote computer 1580 may be a personal computer (laptop or desktop), a mobile device, a server, a router, a network PC, a peer device or other common network node, and typically includes many or all of the elements described above relative to computer system 1510.
- computer system 1510 may include modem 1572 for establishing communications over a network 1571, such as the Internet. Modem 1572 may be connected to bus 1521 via user network interface 1570, or via another appropriate mechanism.
- Network 1571 may be any network or system generally known in the art, including the Internet, an intranet, a local area network (LAN), a wide area network (WAN), a metropolitan area network (MAN), a direct connection or series of connections, a cellular telephone network, or any other network or medium capable of facilitating communication between computer system 1510 and other computers (e.g., remote computer 1580).
- the network 1571 may be wired, wireless or a combination thereof. Wired connections may be implemented using Ethernet, Universal Serial Bus (USB), RJ-11 or any other wired connection generally known in the art.
- Wireless connections may be implemented using Wi-Fi, WiMAX, and Bluetooth, infrared, cellular networks, satellite or any other wireless connection methodology generally known in the art. Additionally, several networks may work alone or in communication with each other to facilitate communication in the network 1571.
- the networking component may include network interface 1570 or some combination of hardware and software offering similar functionality.
- the networking component is configured to communicate with a DHM system to retrieve DHM images.
- the networking component may include a specialized interface for communicating with DHM systems.
- the modeling processor is included in a computing system (e.g. computer system 1510) and is configured with instructions that enable it to train a classifier for cell types present in cell images extracted from DHM images received via the networking component.
- the modeling processor may include additional functionality, as described in this disclosure, to support this task (e.g., segmentation, identifying connected components, etc.).
- the modeling processor is further configured to use the classifier to determine the probability that new cell images belong to one of the types used to train the classifier.
- the GUI may then be presented on a display (e.g., display 1566) for review by a user.
- the embodiments of the present disclosure may be implemented with any combination of hardware and software.
- the embodiments of the present disclosure may be included in an article of manufacture (e.g., one or more computer program products) having, for example, computer-readable, non-transitory media.
- the media has embodied therein, for instance, computer readable program code for providing and facilitating the mechanisms of the embodiments of the present disclosure.
- the article of manufacture can be included as part of a computer system or sold separately.
- An executable application comprises code or machine readable instructions for conditioning the processor to implement predetermined functions, such as those of an operating system, a context data acquisition system or other information processing system, for example, in response to user command or input.
- An executable procedure is a segment of code or machine readable instruction, sub-routine, or other distinct section of code or portion of an executable application for performing one or more particular processes. These processes may include receiving input data and/or parameters, performing operations on received input data and/or performing functions in response to received input parameters, and providing resulting output data and/or parameters.
- a graphical user interface comprises one or more display images, generated by a display processor and enabling user interaction with a processor or other device and associated data acquisition and processing functions.
- the GUI also includes an executable procedure or executable application.
- the executable procedure or executable application conditions the display processor to generate signals representing the GUI display images. These signals are supplied to a display device which displays the image for viewing by the user.
- the processor under control of an executable procedure or executable application, manipulates the GUI display images in response to signals received from the input devices. In this way, the user may interact with the display image using the input devices, enabling user interaction with the processor or other device.
- An activity performed automatically is performed in response to one or more executable instructions or device operation without user direct initiation of the activity.
Landscapes
- Engineering & Computer Science (AREA)
- Health & Medical Sciences (AREA)
- Life Sciences & Earth Sciences (AREA)
- Physics & Mathematics (AREA)
- General Physics & Mathematics (AREA)
- Theoretical Computer Science (AREA)
- General Health & Medical Sciences (AREA)
- Biomedical Technology (AREA)
- Chemical & Material Sciences (AREA)
- Computer Vision & Pattern Recognition (AREA)
- Molecular Biology (AREA)
- Multimedia (AREA)
- Pathology (AREA)
- Immunology (AREA)
- Biochemistry (AREA)
- Analytical Chemistry (AREA)
- Hematology (AREA)
- Computing Systems (AREA)
- Evolutionary Computation (AREA)
- Data Mining & Analysis (AREA)
- Artificial Intelligence (AREA)
- Medical Informatics (AREA)
- Dispersion Chemistry (AREA)
- Signal Processing (AREA)
- Ecology (AREA)
- Food Science & Technology (AREA)
- Medicinal Chemistry (AREA)
- Urology & Nephrology (AREA)
- Biophysics (AREA)
- Bioinformatics & Computational Biology (AREA)
- Bioinformatics & Cheminformatics (AREA)
- Software Systems (AREA)
- Evolutionary Biology (AREA)
- General Engineering & Computer Science (AREA)
- Databases & Information Systems (AREA)
- Quality & Reliability (AREA)
- Radiology & Medical Imaging (AREA)
- Nuclear Medicine, Radiotherapy & Molecular Imaging (AREA)
- Image Analysis (AREA)
- Investigating Or Analysing Biological Materials (AREA)
Abstract
Description
- This application claims the benefit of
U.S. Provisional Application Serial No. 62/012,636 filed June 16, 2014 - The present disclosure relates generally to analyzing digital holographic microscopy (DHM) for hematology applications. The various systems, methods, and apparatuses described herein may be applied, for example, red blood cell (RBC) volume measurement and white blood cell (WBC) differential (cell type classification) applications.
- Digital holographic microscopy (DHM), also known as interference phase microscopy, is an imaging technology that provides the ability to quantitatively track sub-nanometric optical thickness changes in transparent specimens. Unlike traditional digital microscopy, in which only intensity (amplitude) information about a specimen is captured, DHM captures both phase and intensity. The phase information, captured as a hologram, can be used to reconstruct extended morphological information (such as depth and surface characteristics) about the specimen using a computer algorithm. Modem DHM implementations offer several additional benefits, such as fast scanning/data acquisition speed, low noise, high resolution and the potential for label-free sample acquisition.
- Conventional cellular analysis techniques such as volume measurement and classification rely on two-dimensional cellular images that lack topographical information. Thus, while these techniques may analyze a cell based on information such as intensity, their accuracy is limited due to a lack of knowledge of the size and shape of the cell. Accordingly, it is desired to provide cellular analysis techniques which are applicable to imaging modalities such as DHM that provide more detailed information regarding cellular structure.
- Embodiments of the present invention address and overcome one or more of the above shortcomings and drawbacks, by providing methods, systems, and apparatuses related to analyzing digital holographic microscopy (DHM) for hematology applications. Additionally, as explained in further detail in the disclosure, the technology described herein may be applied to other clinical applications as well.
- The ability of DHM to achieve high-resolution, wide field imaging with extended depth and morphological information in a potentially label-free manner positions the technology for use in several clinical applications. For example, in the area of hematology DHM may be used for red blood cell (RBC) volume measurement, white blood cell (WBC) differential (cell type classification). For urine sediment analysis DHM allows for scanning a microfluidic sample in layers to reconstruct the sediment (possibly without waiting for sedimentation); improving the classification accuracy of sediment constituents. DHM may also be used for tissue pathology applications through utilization of extended morphology / contrast of DHM (e.g. to discriminate cancerous from healthy cells, in fresh tissue, without labeling). Similarly, for rare cell detection applications may utilize extended morphology /contrast of DHM (e.g. to differentiate rare cells such as circulating tumor / epithelial cells, stem cells, infected cells, etc.).
- According to some embodiments of the present invention, a method for analyzing digital holographic microscopy (DHM) data for hematology applications includes receiving a DHM image acquired using a digital holographic microscopy system and identifying one or more erythrocytes in the DHM image. Next, for each respective erythrocyte included in the one or more erythrocytes, a cell thickness value is estimated for the respective erythrocyte using a parametric model and a cell volume value is calculated for the respective erythrocyte using the cell thickness value. In some embodiments, the method further comprising performing a complete blood cell (CBC) test using the cell thickness value and the cell volume value associated with each respective erythrocyte.
- Various enhancements, modifications, or additions may be added to the aforementioned method in different embodiments of the present invention. For example, in some embodiments, the method further comprises performing a segmentation on the DHM image to generate a segmentation mask including boundaries for the one or more erythrocytes. This segmentation may be performed, for example, by minimizing a piecewise constant energy functional in a combinatorial optimization framework. Following the segmentation, a connected component analysis may be performed on the segmentation mask to label the one or more erythrocytes. In some embodiments, the parametric model represents each of the one or more erythrocytes using Cassini ovals. In other embodiments, the parametric model represents each of the one or more erythrocytes using a cell diameter value, a minimum dimple thickness value, a maximum thickness value and a circle diameter value representative of maximum cell thickness. The parameters used in the parametric model may be determined, for example, by minimizing a sum squared error between a depth map estimated from the parametric model and a depth observed from the DHM image.
- According to another aspect of the present invention, as described in some embodiments, an article of manufacture for analyzing DHM data for hematology applications comprise a non-transitory, tangible computer-readable medium holding computer-executable instructions for performing the aforementioned method. This article of manufacture may further include instructions for any of the additional features discussed above with respect to the aforementioned method.
- A system for analyzing DHM data for hematology applications comprises a networking component and a modeling processor. The networking component is configured to communicate with using a DHM system to retrieve a DHM image. The modeling processor is configured to identify one or more erythrocytes in the received DHM image. The modeling processor is further configured to estimate a cell thickness value (using a parametric model) and calculate a cell volume for each respective erythrocyte included in the one or more erythrocytes.
- Additional features and advantages of the invention will be made apparent from the following detailed description of illustrative embodiments that proceeds with reference to the accompanying drawings.
- The foregoing and other aspects of the present invention are best understood from the following detailed description when read in connection with the accompanying drawings. For the purpose of illustrating the invention, there is shown in the drawings embodiments that are presently preferred, it being understood, however, that the invention is not limited to the specific instrumentalities disclosed. Included in the drawings are the following Figures:
-
FIG. 1 provides an illustration of a framework for processing DHM images for erythrocyte volume computation, according to some embodiments; -
FIG. 2 provides an example illustration of segmentation of erythrocytes in optical path difference DHM (OPD-DHM) images, as may performed in some embodiments; -
FIG. 3 shows a geometry model of a normal erythrocyte, as may be utilized in some embodiments; -
FIG. 4 provides an example of the parametric modeling of the erythrocytes which illustrates the regularization; -
FIG. 5 provides an illustration of a process for calculating cell volume, according to some embodiments; -
FIG. 6 provides an illustration of a pre-processing framework for classifying white blood cells, as it may be applied in some embodiments; -
FIG. 7 shows a sample of the white blood cells used in training and testing, according to some embodiments; -
FIG. 8A provides a table showing an example of a data set that may be used for training and testing for each cell type, as may be used in some embodiments; -
FIG. 8B shows pairwise classification results obtained using texton features and KNN classifier for this sample case, as may be obtained according to some embodiments; -
FIG. 9 provides an example of local image feature sampling, as it may be applied in some embodiments; -
FIG. 10 shows a complete binary search tree structure which represents a vocabulary dictionary structures; -
FIG. 11 provides a visualization of the workflow for the transformation from local image features (dense SIFT descriptor) to a global image features (vocabulary histogram), as may be applied in some embodiments; -
FIG. 12 shows Pairwise Classification results using SIFT and SVM classification, obtained according to some embodiments; -
FIG. 13 shows the structure of a feed-forward neural network with one hidden layer that may be utilized in some embodiments; -
FIG. 14 shows a GUI which provides for results visualization and facilitates user interaction and correction, according to some embodiments; -
FIG. 15 illustrates an exemplary computing environment within which embodiments of the invention may be implemented - The following disclosure describes the present invention according to several embodiments directed at methods, systems, and apparatuses related to analyzing digital holographic microscopy (DHM) for hematology and other clinical applications. Briefly, the techniques discussed herein comprise of three principle ideas that may be applied in different configurations in the various embodiments described herein. First, in some embodiments, red blood cell (RBC) volume estimation is performed using parametric modeling of erythrocytes to regularize the raw DHM data to match physical models of the erythrocytes, in an attempt to eliminate any distortion caused during the image acquisition process. Second, in some embodiments, label-free differentiation of white blood cells (WBCs) captured by DHM is performed using a machine learning algorithm which extract characteristic topological changes from a set of training samples DHM images for each sub-type of WBCs (namely, monocytes, neutrophils, basophils, lymphocytes, eosinophils). The machine learning algorithm then classifies a new cell into one of the categories automatically based on the learnt DHM image based features. Third, in some embodiments, "digital staining" or "pseudo-coloring" of the classified DHM images of the cells is performed to resemble conventional staining techniques. The digital staining method described herein uses a matched pair of DHM and stained images of a set of cells, and a regression function is learnt to map the DHM image pixel (representing the topology of the cell constituents to a RGB color scheme of conventional staining techniques).
-
FIG. 1 provides an illustration of aframework 100 for processing DHM images for erythrocyte volume computation, according to some embodiments. Briefly, aDHM System 105 is used to acquire one or more input images. The DigitalHolographic Microscopy System 105 may be any system known in the art capable of acquiring DHM images. AnImage Segmentation Component 110 performs segmentation of the erythrocytes in the acquired input images. Next, aParametric Modeling Component 115 develops a model of the erythrocytes (e.g., using Cassini ovals). Then, aParametric Modeling Component 120 calculates thickness information of each erythrocyte which, in turn, can be used to determine the erythrocyte's volume. - Various segmentation techniques may be applied to the input image to segment the erythrocytes. For example, in some embodiments, the segmentation problem performed by the
Image Segmentation Component 110 is formulated as an energy minimization problem that minimizes the piecewise constant Mumford-Shah energy functional in a combinatorial optimization framework. The segmentation energy can be described as follows. Given an image u and an image of interest u: Ω → R, where Ω is an open bounded subset in R2 that comprises several connected components Ωi and bounded by a closed boundary C = ∂Ω, find a piecewise constant approximation such that u is constant within the components Ωi and sharp in the transition across the boundary C. This is formulated as:

- The constants c1 and c2 represent the piecewise constant approximation of the input DHM image, wpq represents the weights of the Euclidean length regularization, and µ is a weighting coefficient that defines the contribution of the length regularization to the segmentation energy. A relatively high value for mu may be used to avoid separating the nucleus from the rest of the cell.
-
FIG. 2 provides an example illustration of Segmentation of erythrocytes in optical path difference DHM (OPD-DHM) images.Image 205 shows the input image, whileimage 210 shows the delineation (represented by a dotted line) of the erythrocyte boundaries is imposed on theimage 205. - A normal erythrocyte is generally shaped as a biconcave disk to achieve a large surface area -to-volume ratio. For example,
FIG. 3 shows ageometry model 300 of a normal erythrocyte. There are four main parameters that affect the shape of the cell (shown inFIG. 3 ): the diameter of the cell (D), the minimum dimple thickness (t), the maximum thickness (h) and the diameter of the circle that determines the maximum thickness (d). - Using the geometric understanding presented in
FIG. 3 , there are several biconcave models for the erythrocyte surface representation that may be applied byParametric Modeling Component 120 to characterize the shape and geometry of each erythrocyte. For example, some embodiments utilize the Evans-Fung Model technique generally known in the art which utilizes the following equation:

- In some embodiments, the parametric modeling of the cell regularizes the cell surface to match the physical models of the erythrocytes and eliminate any distortion caused during the image acquisition process.
FIG. 4 provides an example of the parametric modeling of the erythrocytes which illustrates the regularization. InImage 405, the cell surface is depicted as observed from the DHM image.Image 410 shows the cell surface as characterized by the Evans - Fung model. - After performing the segmentation and the parametric modeling for each cell, the volume of each RBC may be computed. The RBC volume may then be used as a clinical measurement in and of itself, or it may be used to derive additional clinically significant values. For example, the calculation of RBC volume may be used in determining mean cell volume (MCV) which, in turn, is a critical parameter in a complete blood count (CBC).
-
FIG. 5 provides an illustration of aprocess 500 for calculating cell volume, according to some embodiments. Atstep 505, an OPD-DHM image of erythrocytes is received. Next, atstep 510, the DHM image is segmented to extract all the erythrocytes from the background. Segmentation may be performed, for example, using the combinatorial piece wise constant Mumford-Shah energy functional or any similar technique generally known in art. Atstep 515, connected component analysis is applied to the segmentation mask to label the independent erythrocytes. - Continuing with references to
FIG. 5 , at steps 520 - 530 a measurement process is performed for each erythrocyte. Atstep 520, the cell surface is approximated, for example, using the Evans-Fung technique. The sum squared differences inEquation 4 are optimized and the model parameters C0, C1 and C2 are computed. Next, atstep 525, the model is used to estimate the updated cell thickness z(p) using Equation 3. Then, atstep 530, the updated cell thickness is used to calculate the cell volume. The output of theprocess 500 is a volume for each erythrocyte. - The
process 500 can be extended to provide the mean hemoglobin content of the cell as well. For this, a conventional hematology analyzer may be used for calibration of mean cell volume and conversion of optical density map based volume to the average hemoglobin content. - Differential blood tests measure the percentage of each type of white blood cell type in a blood cell sample. Identifying each type of white blood cell is a crucial preliminary step to blood differential analysis that is used to diagnose diseases such as infections, anemia and Leukemia. To address this step, the system described herein may be applied to differentiate among the different white blood cell types. Specifically, the described system aims to differentiate five different types of white blood cells, namely: monocytes, basophils, neutrophils, eosinophils and lymphocytes. Briefly, a pipeline of processing the white blood cells comprises the following three steps. The first step is pre-processing where various types of white blood cells are identified and isolated. The second step is training where a classifier is trained from the extracted cells. The third step is classification where a classifier is used to categorize unseen cells. Each of these steps will now be discussed in detail.
-
FIG. 6 provides an illustration of apre-processing framework 600 for classifying white blood cells, as it may be applied in some embodiments. During the pre-processing step, a pipeline is used to prepare the training patches for the classifier training step. Initially, a threshold is applied to aninput image 605 to capture the bright spots (that are highly likely to be cells). After thresholding, a connected component analysis is applied to thethresholded image 610. Then, as illustrated inimage 615, the component size is calculated for each connected component. A component is rejected if its size is below or above predefined thresholds t1 and t2. The rejected components are excluded from training and testing. The patches (patch is a rectangular box including the connected component), including the remaining components are used to train the classifier (e.g., a K-Nearest Neighbor classifier). - Following the
pre-processing framework 600, various machine learning algorithms may be used for performing five part differential on DHM images of white blood cells. For example, in some embodiments, a texton-based approach is used, where the textural characteristics of DHM image of cells are used as the main discriminating feature. In other embodiments, a more data driven approach is employed, where a dictionary of image patches is learned and used to represent the entire image as a histogram. The histogram is then used as the main feature for classification between various cell sub-types. In other embodiments, classification is based on a convolutional neural network with multiple layers to perform feature extraction, selection, and classification at once with a multi-layer network. Each of these different approaches is described in detail below. - As is generally understood in the art, image classification algorithms are trained using a data set of representative images. One example of a training data set is illustrated in
FIG. 7 . In this example, cell images are labelled in one of four categories: monocyte, basophil, neutrophil, and lymphocytes. It should be noted that this training set is but one example of a data that may be used in training the classifier. For example, other training sets employed in some embodiments may include additional categories (e.g., eosinophils). Additionally (or alternately), the categories could have a finer level of granularity. - In embodiments where the texton-based approach is used for classification, the extracted patches that include the preprocessed cell images are used to train a K-Nearest Neighbor (K-NN) classifier. The classifier utilized texton based texture features extracted from each patch. Textons are the representation of small texture features by a collection of filter bank responses. Texton based texture classifiers use the histograms of the textons to characterize the texture by the frequency of the textons in a particular patched as compared to the textons of the training data set. The texton features are used, in particular, because it is pathologically proven that the granularity of cell nuclei differ in the different cell types and this can be captured using texture features.
- To illustrate the texton-based approach, consider a combination of the texton based texture feature representation with a simple K-NN classifier.
FIG. 8A provides a table showing an example of a data set that may be used for training and testing for each cell type. The classification rate obtained for this example dataset in all the pairwise classifications varies from 75% to 95%.FIG. 8B shows pairwise classification results obtained using texton features and KNN classifier for this sample case. - To provide a multi-label classifier using the previous pairwise classification, one or more pairwise classifiers may be combined using voting. Ideally four classifiers should agree on the class label and 6 classifiers would provide random labeling. For example, if 10 classifiers are denoted as C1 to C10, the final class label L for an unknown sample S can be represented as the mode (most frequent value) of the labels of the 10 classifiers. In other words, the majority vote of the 10 pairwise classifiers is labeled for the multi-label classification problem. Combining all the pairwise classification to one multi-label classifier yielded a 76.5% correct classification rate for the example dataset set presented in
FIG. 8A . - In some embodiments, a bag of visual words (BOW) approach may be used to solve this multi-class based image classification problem. In the BOW approach, the global image features are represented by vectors of occurrence counts of visual words (a histogram over a vocabulary dictionary based on local image feature). These global image features are then used for classification. The pipeline may be divided into three stages: offline vocabulary learning, image classification training and testing. In the offline vocabulary learning stage, a visual vocabulary dictionary may be trained using hierarchical k-means and SIFT (scale-invariant feature transform) descriptor as local image feature. For classification, one against one n-label supporting vector machine (SVM) may be utilized. To avoid an over-fitting problem, two approaches may be employed. First, each training image may be perturbed at random degree. Secondly, SVM parameters may be determined for the kernel using cross validation on the training data set.
- SIFT descriptor describes invariant local image structure and capturing local texture information. Dense SIFT descriptors may be computed for every ns pixels of each image (w × h, where w and h are image width and height respectively. For example, a 128 dimension SIFT descriptor may be used and, thus, there are about

FIG. 9 provides an example of local image feature sampling, as it may be applied in some embodiments. In this example, each white dot represents a location where 128 dimension SIFT descriptor is computed. - In some embodiments, a modified vocabulary tree structure is utilized to construct a visual vocabulary dictionary. The vocabulary tree defines a hierarchical quantization using a hierarchical k-means clustering.
FIG. 10 shows a complete binary (k=2) search tree structure which represents a vocabulary dictionary structures. Thenode 1005 is a visual cluster center. 2 nd leaf nodes are finally used as visual vocabulary words. nd is the depth of the binary tree. In the vocabulary tree learning stage, first the initial k-means algorithm is applied on to the training data (a collection of SIFT descriptors derived from training data set) and then partitioned into 2 groups, where each group comprises SIFT descriptors closest to the cluster center. This process is then recursively applied until tree depth reaches nd. In the online stage, a SIFT descriptor (a vector) is passed down the tree by each level via comparing this feature vector to the 2 cluster centers and choosing the closest one. The visual word histogram is computed for all the dense SIFT descriptors on each image. -
FIG. 11 provides a visualization of the workflow for the transformation from local image features (dense SIFT descriptor) to global image features (vocabulary histogram). The results obtained by combining SIFT features with SVM classification for an example dataset are depicted inFIG. 12 . Combining these pairwise classifiers yielded an 84% correct classification rate for the 5-type classification problem. - In some embodiments, a Deep Learning (DL) architecture is used to perform the 5-type classification. While SVM is mainly formulated for binary classification, DL is inherently a multi-label classifier. To illustrate the DL classification technique, the convolutional network was directly trained for the multi-label classification problem. 500 cells were used for training, 100 for each category and the rest of the cells were used for testing.
- For this example DL application, an auto-encoder convolutional neural network (CNN) was used to train the marginal space learning (MSL) classifier.
FIG. 13 shows the structure of a feed-forward neural network with one hidden layer (also referred to as an "AE"). Ignoring the bias term (the nodes labeled as "+1" inFIG. 13 ), the input and output layers have the same number of nodes. The objective of such auto encoders is to learn a transfer function between the input layer (features that represent the images) and the output layer (the labels for the image). If the hidden layer has a size equal or larger than the input layer, potentially, an AE may learn an identity transformation. To prevent such a trivial solution, previously, an AE is set up with a hidden layer with fewer nodes than the input. Recently, denoising auto-encoder (DAE) was proposed to learn a more meaningful representation of the input. A certain percentage (e.g., 50%) of input nodes are randomly picked to be disturbed (e.g., set the value to zero) and the DAE is required to reconstruct the original input vector given a contaminated observation. With DAE, the hidden layer may have more nodes than the input to achieve an over-complete representation. After training an AE, the output layer is discarded and another AE is stacked using the activation response of the already trained hidden layer as input to the new AE. This process can be repeated to train and expand a network layer by layer. After pre-training, the output of the hidden layers can be treated as high-level image features to train a classifier. Alternatively, we can add one more layer for the target output and the whole network can be refined using back-propagation. - After the classification is done, the various categories of white blood cells may be presented to the pathologist in a graphical user interface (GUI) for final confirmation. The probability of a given cell belonging to a certain sub-type may be calculated and presented numerically or graphically to the pathologist during the final check.
-
FIG. 14 shows a GUI which provides for results visualization and facilitates user interaction and correction, according to some embodiments. As shown in theFIG. 14 , the pathologist will have a chance to make a modification based on the DHM image of the cells. The results of the automatic blood differential is depicted at the top tworows 1405 displaying the percentage of each blood cell type and the possible diagnosis based on these percentages. The bottom part of the figure 1410 shows how the user can modify the results. The system shows the top cell candidates for user interactions. These cells are chosen and sorted based on the difference of the top two probabilities. The system displays the extracted cell (extracted by our preprocessing pipeline) and displays the probability of it belonging to each WBC type. The user can accept the label or choose a new label by simply marking a check box. If the user changes the label, the system may automatically update the counts, the percentages and the possible diagnosis, which changes the top row and displays the new results. - Additionally, in order for pathologist to best be able to review the images, in some embodiments, a pseudo-colorization scheme is utilized which converts the DHM images into an image with a color pattern similar to cell images stained for conventional staining methodologies such as the Wright and Giemsa methodologies. For example, Giemsa-Wright stains use solutions which include eosin Y, azure B, and methylene blue for staining. These solutions bind to the constituents of the cells including nucleus and granules differently and thereby provide a more pronounced coloring which is essential for visual inspection of the cells. From a DHM image of a cell, we obtain different optical density patterns for the cell constituents and that could be used as a feature to perform colorization. The method that we envision is based on having matched pairs of cells which are imaged both with DHM and Giemsa staining respectively. In some embodiments a simple regression function is used, which can be implemented using a machine learning technique such as a convolutional neural network to map optical density maps from DHM to the RGB color scheme consistent with Giemsa-Wright staining protocol. The regression map could work either on the single pixel or groups of pixels (i.e., image patches). In addition, a Markov random field based regularization may be utilized to make sure that the neighboring pixels with similar optical density will be colored similarly. Aside from Giemsa and Wright stains, other staining protocols can be learned based on set of matching pairs of cellular images and the stained version can be digitally reproduced from the DHM images.
- In some embodiments, the mean cell volume computation for RBC described herein and/or the WBC five part differential may be used as key measurements for a Complete Blood Count (CBC) test. As is understood in the art, a CBC test evaluates an individual's overall health and may be used in the detection of blood-related disorders such as anemia, infection and leukemia. So, for example, abnormal increases or decreases in particular WBC counts may be used as an indicator of an underlying medical condition that calls for further evaluation.
- Various other extensions, enhancements, or other modifications may be made or added to the techniques described herein to provide additional functionality. For example, in some embodiments, the five part differential methodology for white blood cell sub-typing is applied on raw fringe pattern images prior to the reconstruction as well. In order to increase the overall accuracy of either RBC volume or WBC classification, multiple images of the same cell could be used and the results could be averaged. The systems and methods described herein may also be applied to clinical applications outside the cell classification space. For example, the size calculation and classification of various objects based on the methodology described can be extended for urine analysis applications, where the size of urine sediments are measured and various kinds are identified by analyzing the DHM images using the methodology described. Additionally, given the latest advancements in DHM technology - particularly reductions in size, complexity and cost - these (and other) applications could be performed within a clinical environment or at the point of care (in a decentralized manner).
-
FIG. 15 illustrates anexemplary computing environment 1500 within which embodiments of the invention may be implemented. For example, thiscomputing environment 1500 may be configured to execute one or more of the components of theframework 100 for processing DHM images illustrated inFIG 1 . Additionally (or alternatively), thiscomputing environment 1500 may be configured to perform one or more of the processes described herein (e.g., theprocess 500 for calculating cell volume shown inFIG. 1 . Thecomputing environment 1500 may includecomputer system 1510, which is one example of a computing system upon which embodiments of the invention may be implemented. Computers and computing environments, such ascomputer system 1510 andcomputing environment 1500, are known to those of skill in the art and thus are described briefly here. - As shown in
FIG. 15 , thecomputer system 1510 may include a communication mechanism such as abus 1521 or other communication mechanism for communicating information within thecomputer system 1510. Thecomputer system 1510 further includes one ormore processors 1520 coupled with thebus 1521 for processing the information. Theprocessors 1520 may include one or more central processing units (CPUs), graphical processing units (GPUs), or any other processor known in the art. - The
computer system 1510 also includes asystem memory 1530 coupled to thebus 1521 for storing information and instructions to be executed byprocessors 1520. Thesystem memory 1530 may include computer readable storage media in the form of volatile and/or nonvolatile memory, such as read only memory (ROM) 1531 and/or random access memory (RAM) 1532. Thesystem memory RAM 1532 may include other dynamic storage device(s) (e.g., dynamic RAM, static RAM, and synchronous DRAM). Thesystem memory ROM 1531 may include other static storage device(s) (e.g., programmable ROM, erasable PROM, and electrically erasable PROM). In addition, thesystem memory 1530 may be used for storing temporary variables or other intermediate information during the execution of instructions by theprocessors 1520. A basic input/output system (BIOS) 1533 containing the basic routines that help to transfer information between elements withincomputer system 1510, such as during start-up, may be stored inROM 1531.RAM 1532 may contain data and/or program modules that are immediately accessible to and/or presently being operated on by theprocessors 1520.System memory 1530 may additionally include, for example,operating system 1534,application programs 1535,other program modules 1536 andprogram data 1537. - The
computer system 1510 also includes adisk controller 1540 coupled to thebus 1521 to control one or more storage devices for storing information and instructions, such as ahard disk 1541 and a removable media drive 1542 (e.g., floppy disk drive, compact disc drive, tape drive, and/or solid state drive). The storage devices may be added to thecomputer system 1510 using an appropriate device interface (e.g., a small computer system interface (SCSI), integrated device electronics (IDE), Universal Serial Bus (USB), or FireWire). - The
computer system 1510 may also include adisplay controller 1565 coupled to thebus 1521 to control adisplay 1566, such as a cathode ray tube (CRT) or liquid crystal display (LCD), for displaying information to a computer user. The computer system includes aninput interface 1560 and one or more input devices, such as akeyboard 1562 and apointing device 1561, for interacting with a computer user and providing information to theprocessor 1520. Thepointing device 1561, for example, may be a mouse, a trackball, or a pointing stick for communicating direction information and command selections to theprocessor 1520 and for controlling cursor movement on thedisplay 1566. Thedisplay 1566 may provide a touch screen interface which allows input to supplement or replace the communication of direction information and command selections by thepointing device 1561. - The
computer system 1510 may perform a portion or all of the processing steps of embodiments of the invention in response to theprocessors 1520 executing one or more sequences of one or more instructions contained in a memory, such as thesystem memory 1530. Such instructions may be read into thesystem memory 1530 from another computer readable medium, such as ahard disk 1541 or aremovable media drive 1542. Thehard disk 1541 may contain one or more datastores and data files used by embodiments of the present invention. Datastore contents and data files may be encrypted to improve security. Theprocessors 1520 may also be employed in a multi-processing arrangement to execute the one or more sequences of instructions contained insystem memory 1530. In alternative embodiments, hard-wired circuitry may be used in place of or in combination with software instructions. Thus, embodiments are not limited to any specific combination of hardware circuitry and software. - As stated above, the
computer system 1510 may include at least one computer readable medium or memory for holding instructions programmed according to embodiments of the invention and for containing data structures, tables, records, or other data described herein. The term "computer readable medium" as used herein refers to any medium that participates in providing instructions to theprocessor 1520 for execution. A computer readable medium may take many forms including, but not limited to, non-volatile media, volatile media, and transmission media. Non-limiting examples of non-volatile media include optical disks, solid state drives, magnetic disks, and magneto-optical disks, such ashard disk 1541 or removable media drive 1542. Non-limiting examples of volatile media include dynamic memory, such assystem memory 1530. Non-limiting examples of transmission media include coaxial cables, copper wire, and fiber optics, including the wires that make up thebus 1521. Transmission media may also take the form of acoustic or light waves, such as those generated during radio wave and infrared data communications. - The
computing environment 1500 may further include thecomputer system 1510 operating in a networked environment using logical connections to one or more remote computers, such asremote computer 1580.Remote computer 1580 may be a personal computer (laptop or desktop), a mobile device, a server, a router, a network PC, a peer device or other common network node, and typically includes many or all of the elements described above relative tocomputer system 1510. When used in a networking environment,computer system 1510 may includemodem 1572 for establishing communications over anetwork 1571, such as the Internet.Modem 1572 may be connected tobus 1521 viauser network interface 1570, or via another appropriate mechanism. -
Network 1571 may be any network or system generally known in the art, including the Internet, an intranet, a local area network (LAN), a wide area network (WAN), a metropolitan area network (MAN), a direct connection or series of connections, a cellular telephone network, or any other network or medium capable of facilitating communication betweencomputer system 1510 and other computers (e.g., remote computer 1580). Thenetwork 1571 may be wired, wireless or a combination thereof. Wired connections may be implemented using Ethernet, Universal Serial Bus (USB), RJ-11 or any other wired connection generally known in the art. Wireless connections may be implemented using Wi-Fi, WiMAX, and Bluetooth, infrared, cellular networks, satellite or any other wireless connection methodology generally known in the art. Additionally, several networks may work alone or in communication with each other to facilitate communication in thenetwork 1571. - As one application of the
exemplary computing environment 1500 to the technology described herein, consider an example system for analyzing DHM data for hematology applications which includes a network component, a modeling processor, and a GUI. The networking component may includenetwork interface 1570 or some combination of hardware and software offering similar functionality. The networking component is configured to communicate with a DHM system to retrieve DHM images. Thus, in some embodiments, the networking component may include a specialized interface for communicating with DHM systems. The modeling processor is included in a computing system (e.g. computer system 1510) and is configured with instructions that enable it to train a classifier for cell types present in cell images extracted from DHM images received via the networking component. The modeling processor may include additional functionality, as described in this disclosure, to support this task (e.g., segmentation, identifying connected components, etc.). The modeling processor is further configured to use the classifier to determine the probability that new cell images belong to one of the types used to train the classifier. The GUI may then be presented on a display (e.g., display 1566) for review by a user. - The embodiments of the present disclosure may be implemented with any combination of hardware and software. In addition, the embodiments of the present disclosure may be included in an article of manufacture (e.g., one or more computer program products) having, for example, computer-readable, non-transitory media. The media has embodied therein, for instance, computer readable program code for providing and facilitating the mechanisms of the embodiments of the present disclosure. The article of manufacture can be included as part of a computer system or sold separately.
- While various aspects and embodiments have been disclosed herein, other aspects and embodiments will be apparent to those skilled in the art. The various aspects and embodiments disclosed herein are for purposes of illustration and are not intended to be limiting, with the true scope and spirit being indicated by the following claims.
- An executable application, as used herein, comprises code or machine readable instructions for conditioning the processor to implement predetermined functions, such as those of an operating system, a context data acquisition system or other information processing system, for example, in response to user command or input. An executable procedure is a segment of code or machine readable instruction, sub-routine, or other distinct section of code or portion of an executable application for performing one or more particular processes. These processes may include receiving input data and/or parameters, performing operations on received input data and/or performing functions in response to received input parameters, and providing resulting output data and/or parameters.
- A graphical user interface (GUI), as used herein, comprises one or more display images, generated by a display processor and enabling user interaction with a processor or other device and associated data acquisition and processing functions. The GUI also includes an executable procedure or executable application. The executable procedure or executable application conditions the display processor to generate signals representing the GUI display images. These signals are supplied to a display device which displays the image for viewing by the user. The processor, under control of an executable procedure or executable application, manipulates the GUI display images in response to signals received from the input devices. In this way, the user may interact with the display image using the input devices, enabling user interaction with the processor or other device.
- The functions and process steps herein may be performed automatically or wholly or partially in response to user command. An activity (including a step) performed automatically is performed in response to one or more executable instructions or device operation without user direct initiation of the activity.
- The system and processes of the figures are not exclusive. Other systems, processes and menus may be derived in accordance with the principles of the invention to accomplish the same objectives. Although this invention has been described with reference to particular embodiments, it is to be understood that the embodiments and variations shown and described herein are for illustration purposes only. Modifications to the current design may be implemented by those skilled in the art, without departing from the scope of the invention. As described herein, the various systems, subsystems, agents, managers and processes can be implemented using hardware components, software components, and/or combinations thereof. No claim element herein is to be construed under the provisions of 35 U.S.C. 112, sixth paragraph, unless the element is expressly recited using the phrase "means for."
Claims (15)
- A method for analyzing digital holographic microscopy (DHM) data for hematology applications, the method comprising:receiving a DHM image acquired using a digital holographic microscopy system;identifying one or more erythrocytes in the DHM image;for each respective erythrocyte included in the one or more erythrocytes,estimating a cell thickness value for the respective erythrocyte using a parametric model, andcalculating a cell volume value for the respective erythrocyte using the cell thickness value.
- The method of claim 1, wherein the one or more erythrocytes in the DHM image are labeled by a process comprising:performing a segmentation on the DHM image to generate a segmentation mask including boundaries for the one or more erythrocytes; andperforming a connected component analysis on the segmentation mask to label the one or more erythrocytes.
- The method of claim 2, wherein the segmentation is performed by minimizing a piecewise constant energy functional in a combinatorial optimization framework.
- The method of claim 1, wherein the parametric model represents each of the one or more erythrocytes using Cassini ovals.
- The method of claim 1, wherein the parametric model represents each of the one or more erythrocytes using a cell diameter value, a minimum dimple thickness value, a maximum thickness value and a circle diameter value representative of maximum cell thickness.
- The method of claim 1, further comprising:performing a complete blood cell (CBC) test using the cell thickness value and the cell volume value associated with each respective erythrocyte included in the one or more erythrocytes.
- The method of claim 1, wherein parameters used in the parametric model are determined by minimizing a sum squared error between a depth map estimated from the parametric model and a depth observed from the DHM image.
- An article of manufacture for analyzing digital holographic microscopy (DHM) data for hematology applications, the article of manufacture comprising a non-transitory, tangible computer-readable medium holding computer-executable instructions for performing a method comprising:receiving a DHM image acquired using a digital holographic microscopy system;identifying one or more erythrocytes in the DHM image;for each respective erythrocyte included in the one or more erythrocytes,estimating a cell thickness value for the respective erythrocyte using a parametric model, andcalculating a cell volume value for the respective erythrocyte using the cell thickness value.
- The article of manufacture of claim 8, wherein the one or more erythrocytes in the DHM image are labeled by a process comprising:performing a segmentation on the DHM image to generate a segmentation mask including boundaries for the one or more erythrocytes; andperforming a connected component analysis on the segmentation mask to label the one or more erythrocytes.
- The article of manufacture of claim 9, wherein the segmentation is performed by minimizing a piecewise constant energy functional in a combinatorial optimization framework.
- The article of manufacture of claim 8, wherein the parametric model represents each of the one or more erythrocytes using Cassini ovals.
- The article of manufacture of claim 8, wherein the parametric model represents each of the one or more erythrocytes using a cell diameter value, a minimum dimple thickness value, a maximum thickness value and a circle diameter value representative of maximum cell thickness.
- The article of manufacture of claim 8, wherein the method further comprises:
performing a complete blood cell (CBC) test using the cell thickness value and the cell volume value associated with each respective erythrocyte included in the one or more erythrocytes. - The article of manufacture of claim 8, wherein parameters used in the parametric model are determined by minimizing a sum squared error between a depth map estimated from the parametric model and a depth observed from the DHM image.
- A system for analyzing digital holographic microscopy (DHM) data for hematology applications, the system comprising:a networking component configured to communicate with a digital holographic microscopy system to retrieve a DHM image;a modeling processor configured to:identify one or more erythrocytes in the DHM image;for each respective erythrocyte included in the one or more erythrocytes,estimate a cell thickness value for the respective erythrocyte using a parametric model, andcalculate a cell volume value for the respective erythrocyte using the cell thickness value.
Applications Claiming Priority (3)
| Application Number | Priority Date | Filing Date | Title |
|---|---|---|---|
| US201462012636P | 2014-06-16 | 2014-06-16 | |
| EP15741628.0A EP3155558A1 (en) | 2014-06-16 | 2015-06-16 | Analyzing digital holographic microscopy data for hematology applications |
| PCT/US2015/035945 WO2015195609A1 (en) | 2014-06-16 | 2015-06-16 | Analyzing digital holographic microscopy data for hematology applications |
Related Parent Applications (1)
| Application Number | Title | Priority Date | Filing Date |
|---|---|---|---|
| EP15741628.0A Division EP3155558A1 (en) | 2014-06-16 | 2015-06-16 | Analyzing digital holographic microscopy data for hematology applications |
Publications (3)
| Publication Number | Publication Date |
|---|---|
| EP3364341A1 true EP3364341A1 (en) | 2018-08-22 |
| EP3364341C0 EP3364341C0 (en) | 2024-07-24 |
| EP3364341B1 EP3364341B1 (en) | 2024-07-24 |
Family
ID=53488476
Family Applications (2)
| Application Number | Title | Priority Date | Filing Date |
|---|---|---|---|
| EP15741628.0A Withdrawn EP3155558A1 (en) | 2014-06-16 | 2015-06-16 | Analyzing digital holographic microscopy data for hematology applications |
| EP18159357.5A Active EP3364341B1 (en) | 2014-06-16 | 2015-06-16 | Analyzing digital holographic microscopy data for hematology applications |
Family Applications Before (1)
| Application Number | Title | Priority Date | Filing Date |
|---|---|---|---|
| EP15741628.0A Withdrawn EP3155558A1 (en) | 2014-06-16 | 2015-06-16 | Analyzing digital holographic microscopy data for hematology applications |
Country Status (5)
| Country | Link |
|---|---|
| US (3) | US10706260B2 (en) |
| EP (2) | EP3155558A1 (en) |
| JP (2) | JP6503382B2 (en) |
| CN (2) | CN108426994B (en) |
| WO (2) | WO2015195609A1 (en) |
Families Citing this family (77)
| Publication number | Priority date | Publication date | Assignee | Title |
|---|---|---|---|---|
| CN105095921B (en) * | 2014-04-30 | 2019-04-30 | 西门子医疗保健诊断公司 | Method and apparatus for processing blocks to be processed of urine sediment images |
| CN105095901B (en) * | 2014-04-30 | 2019-04-12 | 西门子医疗保健诊断公司 | Method and apparatus for handling the block to be processed of sediment urinalysis image |
| EP3155558A1 (en) | 2014-06-16 | 2017-04-19 | Siemens Healthcare Diagnostics Inc. | Analyzing digital holographic microscopy data for hematology applications |
| US10614287B2 (en) | 2014-06-16 | 2020-04-07 | Siemens Healthcare Diagnostics Inc. | Virtual staining of cells in digital holographic microscopy images using general adversarial networks |
| EP2985719A1 (en) * | 2014-08-15 | 2016-02-17 | IMEC vzw | A system and method for cell recognition |
| FR3030749B1 (en) * | 2014-12-19 | 2020-01-03 | Commissariat A L'energie Atomique Et Aux Energies Alternatives | METHOD OF IDENTIFYING BIOLOGICAL PARTICLES BY STACKS OF DEFOCALIZED HOLOGRAPHIC IMAGES |
| US9721186B2 (en) * | 2015-03-05 | 2017-08-01 | Nant Holdings Ip, Llc | Global signatures for large-scale image recognition |
| KR101692634B1 (en) * | 2015-08-28 | 2017-01-03 | 연세대학교 산학협력단 | Method and Device for Transforming 2D Image into 3D |
| US9971966B2 (en) * | 2016-02-26 | 2018-05-15 | Google Llc | Processing cell images using neural networks |
| US10055839B2 (en) * | 2016-03-04 | 2018-08-21 | Siemens Aktiengesellschaft | Leveraging on local and global textures of brain tissues for robust automatic brain tumor detection |
| EP3220130B1 (en) * | 2016-03-16 | 2023-03-01 | Siemens Healthcare GmbH | High accuracy 5-part differential with digital holographic microscopy and untouched leukocytes from peripheral blood |
| MX392246B (en) | 2016-07-08 | 2025-03-24 | Avent Inc | SYSTEM AND METHOD FOR THE AUTOMATIC DETECTION, LOCATION AND SEMANTIC SEGMENTATION OF ANATOMICAL OBJECTS. |
| US10504004B2 (en) * | 2016-09-16 | 2019-12-10 | General Dynamics Mission Systems, Inc. | Systems and methods for deep model translation generation |
| WO2018091486A1 (en) | 2016-11-16 | 2018-05-24 | Ventana Medical Systems, Inc. | Convolutional neural networks for locating objects of interest in images of biological samples |
| US10289925B2 (en) * | 2016-11-29 | 2019-05-14 | Sap Se | Object classification in image data using machine learning models |
| CN108229508B (en) * | 2016-12-15 | 2022-01-04 | 富士通株式会社 | Training apparatus and training method for training image processing apparatus |
| FR3060746B1 (en) * | 2016-12-21 | 2019-05-24 | Commissariat A L'energie Atomique Et Aux Energies Alternatives | METHOD FOR NUMBERING PARTICLES IN AN IMAGING SAMPLE WITHOUT LENS |
| JP6873390B2 (en) * | 2017-03-02 | 2021-05-19 | 株式会社島津製作所 | Cell analysis method and cell analysis device |
| CN108537092B (en) * | 2017-03-02 | 2020-11-10 | 爱威科技股份有限公司 | Variant red blood cell identification method and device |
| US10365606B2 (en) * | 2017-04-07 | 2019-07-30 | Thanh Nguyen | Apparatus, optical system, and method for digital holographic microscopy |
| CN110506278B (en) * | 2017-04-19 | 2023-11-10 | 西门子医疗有限公司 | Object detection in latent space |
| CN110720034B (en) * | 2017-05-07 | 2022-10-18 | 艾珀尔有限公司 | Identification method, classification analysis method, identification device, classification analysis device, and recording medium |
| US10593082B2 (en) * | 2017-07-18 | 2020-03-17 | Becton, Dickinson And Company | Dynamic display of multi-parameter quantitative biological data |
| CN107451994A (en) * | 2017-07-25 | 2017-12-08 | 宸盛科华(北京)科技有限公司 | Object detecting method and device based on generation confrontation network |
| EP3669227B8 (en) * | 2017-08-15 | 2024-02-28 | Siemens Healthineers AG | Identifying the quality of the cell images acquired with digital holographic microscopy using convolutional neural networks |
| EP3685355B1 (en) * | 2017-09-19 | 2024-07-10 | Siemens Healthcare Diagnostics Inc. | Virtual staining of cells in digital holographic microscopy images using general adversarial networks |
| EP3462170B1 (en) | 2017-09-29 | 2020-09-16 | Siemens Healthcare GmbH | Specific malaria detection with digital optical microscopy |
| GB2567155B (en) | 2017-10-02 | 2022-03-02 | Room4 Group Ltd | Histopathological image analysis |
| EP3700419A4 (en) * | 2017-10-26 | 2021-11-10 | Essenlix Corporation | Rapid measurement of platelets |
| US20200256856A1 (en) * | 2017-10-26 | 2020-08-13 | Essenlix Corporation | System and methods of image-based assay using crof and machine learning |
| FR3073047B1 (en) * | 2017-11-02 | 2021-01-29 | Commissariat Energie Atomique | OPTICAL PROCESS FOR ESTIMATING A REPRESENTATIVE VOLUME OF PARTICLES PRESENT IN A SAMPLE |
| CN107767384B (en) * | 2017-11-03 | 2021-12-03 | 电子科技大学 | Image semantic segmentation method based on countermeasure training |
| WO2019099592A1 (en) * | 2017-11-14 | 2019-05-23 | miDiagnostics NV | Classification of a population of objects by convolutional dictionary learning with class proportion data |
| CN108197525B (en) * | 2017-11-20 | 2020-08-11 | 中国科学院自动化研究所 | Face image generation method and device |
| CN108693097A (en) * | 2017-12-13 | 2018-10-23 | 青岛汉朗智能医疗科技有限公司 | Erythrocyte aggregation detection method and system |
| KR102282722B1 (en) * | 2017-12-15 | 2021-07-29 | 주식회사 내일해 | Apparatus and Method For Detecting Defects |
| WO2019117453A1 (en) * | 2017-12-15 | 2019-06-20 | 주식회사 내일해 | Method for generating three-dimensional shape information of object to be measured, defect detection method, and defect detection device |
| EP3502660A1 (en) * | 2017-12-22 | 2019-06-26 | IMEC vzw | Fast and robust fourier domain-based cell differentiation |
| EP3754595A4 (en) * | 2018-02-16 | 2021-09-08 | Nikon Corporation | CALCULATION DEVICE, CALCULATION PROGRAM AND CALCULATION METHOD |
| JP7070656B2 (en) * | 2018-03-06 | 2022-05-18 | 株式会社島津製作所 | Cell image analysis method, cell image analysis device, and learning model creation method |
| KR20200141044A (en) * | 2018-03-07 | 2020-12-17 | 베르딕 홀딩스 피티와이 엘티디 | How to identify biological substances under a microscope |
| US11978211B2 (en) | 2018-03-08 | 2024-05-07 | Shimadzu Corporation | Cellular image analysis method, cellular image analysis device, and learning model creation method |
| EP3540631A1 (en) * | 2018-03-15 | 2019-09-18 | Siemens Healthcare GmbH | In vitro method of marking-free determination of a cell type of a white blood cell |
| CN108491809B (en) * | 2018-03-28 | 2023-09-22 | 百度在线网络技术(北京)有限公司 | Method and apparatus for generating near infrared image generation model |
| CN108629369A (en) * | 2018-04-19 | 2018-10-09 | 中南大学 | A kind of Visible Urine Sediment Components automatic identifying method based on Trimmed SSD |
| JP7678424B2 (en) * | 2018-05-10 | 2025-05-16 | 学校法人順天堂 | Image analysis method, device, computer program, and method for generating deep learning algorithm |
| EP3575773A1 (en) * | 2018-05-28 | 2019-12-04 | Universität für Bodenkultur Wien | A method for determining a three-dimensional particle distribution in a medium |
| EP3575848A1 (en) * | 2018-05-30 | 2019-12-04 | Siemens Healthcare Diagnostics Inc. | Analyser for three-dimensional analysis of a medical sample by means of a light field camera |
| JP6627069B2 (en) | 2018-06-01 | 2020-01-08 | 株式会社フロンティアファーマ | Image processing method, drug sensitivity test method, and image processing device |
| EP3805401B1 (en) * | 2018-06-01 | 2023-09-27 | Frontier Pharma, Inc. | Image processing method, medicine sensitivity test method and image processing device |
| CN108804878B (en) * | 2018-06-16 | 2020-08-11 | 志诺维思(北京)基因科技有限公司 | Dyeing simulation method and device |
| US10929716B2 (en) * | 2018-09-12 | 2021-02-23 | Molecular Devices, Llc | System and method for label-free identification and classification of biological samples |
| CN109582562B (en) * | 2018-10-19 | 2021-04-30 | 北京航空航天大学 | Intelligent software testing and cloud platform construction method based on generation countermeasure network |
| CN117782948A (en) * | 2018-11-19 | 2024-03-29 | 深圳迈瑞生物医疗电子股份有限公司 | Methods for analyzing cells, cell analysis equipment and computer-readable storage media |
| JP7101809B2 (en) | 2018-11-30 | 2022-07-15 | 富士フイルム株式会社 | Image processing equipment, image processing methods, and programs |
| KR102638267B1 (en) | 2018-12-03 | 2024-02-21 | 삼성전자주식회사 | Semiconductor wafer fault analysis system and operation method thereof |
| GB2579797B (en) * | 2018-12-13 | 2022-11-16 | Room4 Group Ltd | Classification of cell nuclei |
| CN109754398A (en) * | 2019-01-14 | 2019-05-14 | 武汉兰丁医学高科技有限公司 | A kind of computer based myeloplast automark method and system |
| US11068694B2 (en) * | 2019-01-23 | 2021-07-20 | Molecular Devices, Llc | Image analysis system and method of using the image analysis system |
| US10885631B2 (en) * | 2019-02-01 | 2021-01-05 | Essen Instruments, Inc. | Label-free cell segmentation using phase contrast and brightfield imaging |
| EP3928250A1 (en) * | 2019-02-20 | 2021-12-29 | Bluerock Therapeutics LP | Detecting cells of interest in large image datasets using artificial intelligence |
| JP7352365B2 (en) * | 2019-03-22 | 2023-09-28 | シスメックス株式会社 | Cell analysis method, deep learning algorithm training method, cell analysis device, deep learning algorithm training device, cell analysis program, and deep learning algorithm training program |
| JP7381003B2 (en) | 2019-04-26 | 2023-11-15 | 学校法人順天堂 | METHODS, APPARATUS AND COMPUTER PROGRAMS TO ASSIST DISEASE ANALYSIS AND METHODS, APPARATUS AND PROGRAMS FOR TRAINING COMPUTER ALGORITHM |
| WO2020244779A1 (en) * | 2019-06-07 | 2020-12-10 | Leica Microsystems Cms Gmbh | A system and method for processing biology-related data, a system and method for controlling a microscope and a microscope |
| KR102264612B1 (en) * | 2019-06-24 | 2021-06-14 | 국민대학교산학협력단 | The method for differentiation of white blood cell using blood images |
| CN110648309B (en) * | 2019-08-12 | 2024-05-28 | 平安科技(深圳)有限公司 | Method and related equipment for generating anti-network synthesized erythrocyte image based on condition |
| KR102338050B1 (en) | 2019-08-30 | 2021-12-13 | 포항공과대학교 산학협력단 | Method for analyzing atomic structure of stem images |
| JP7530709B2 (en) * | 2019-10-11 | 2024-08-08 | 株式会社島津製作所 | Cell image analysis method and cell analysis device |
| KR102253227B1 (en) | 2019-12-02 | 2021-05-18 | 포항공과대학교 산학협력단 | Method for analyzing atomic images of low dimensional materials |
| US20230245478A1 (en) * | 2020-07-30 | 2023-08-03 | Hamamatsu Photonics K.K. | Assessment device, assessment method, assessment program, and recording medium |
| CN112085841B (en) * | 2020-09-17 | 2024-04-02 | 西安交通大学 | Digital hologram generating system and method based on deep feedforward neural network |
| FR3115378A1 (en) * | 2020-10-20 | 2022-04-22 | Biomerieux | Method for classifying an input image representing a particle in a sample |
| US12078597B2 (en) * | 2020-11-19 | 2024-09-03 | Sony Group Corporation | Framework for image based unsupervised cell clustering and sorting |
| US12254624B2 (en) * | 2020-12-09 | 2025-03-18 | The Chinese University Of Hong Kong | Artificial intelligence enabled reagent-free imaging hematology analyzer |
| EP4123501A1 (en) * | 2021-07-20 | 2023-01-25 | Siemens Healthcare Diagnostics, Inc. | Medical diagnosis assistance system and method |
| CN115050024B (en) * | 2022-06-21 | 2023-08-22 | 广州医科大学 | Intelligent real-time identification method and system for granulocytes with interpretability |
| US20250166173A1 (en) * | 2023-11-21 | 2025-05-22 | L&T Technology Services Limited | Method and system of analysing blood smear image using deep learning model |
Family Cites Families (39)
| Publication number | Priority date | Publication date | Assignee | Title |
|---|---|---|---|---|
| US4125828A (en) * | 1972-08-04 | 1978-11-14 | Med-El Inc. | Method and apparatus for automated classification and analysis of cells |
| KR100303608B1 (en) * | 1997-05-22 | 2001-11-22 | 박호군 | Blood cell automatic recognition method and apparatus |
| US6350613B1 (en) * | 1998-03-07 | 2002-02-26 | Belton Dickinson & Co. | Determination of white blood cell differential and reticulocyte counts |
| AU2004294569A1 (en) * | 2003-11-26 | 2005-06-16 | Separation Technology, Inc. | Method and apparatus for ultrasonic determination of hematocrit and hemoglobin concentrations |
| US7907769B2 (en) * | 2004-05-13 | 2011-03-15 | The Charles Stark Draper Laboratory, Inc. | Image-based methods for measuring global nuclear patterns as epigenetic markers of cell differentiation |
| SE528697C2 (en) | 2005-03-11 | 2007-01-30 | Hemocue Ab | Volumetric determination of the number of white blood cells in a blood sample |
| CN1945326A (en) | 2006-10-13 | 2007-04-11 | 江西特康科技有限公司 | Five classifying full blood cell analysis method based on vision shape |
| WO2010061319A1 (en) * | 2008-11-27 | 2010-06-03 | Koninklijke Philips Electronics N.V. | Generation of a multicolour image of an unstained biological specimen |
| JP5438962B2 (en) * | 2008-12-25 | 2014-03-12 | シスメックス株式会社 | Cell image display device |
| US8269827B2 (en) * | 2009-09-29 | 2012-09-18 | General Electric Company | System and methods for mapping fluorescent images into a bright field color space |
| EP2534540B1 (en) | 2010-02-09 | 2019-05-22 | Phase Holographic Imaging PHI AB | Method using digital holographic microscopy and imaging on labelled cell samples |
| EP3388833B1 (en) * | 2010-08-05 | 2021-12-29 | Abbott Point Of Care, Inc. | Method and apparatus for automated whole blood sample analyses from microscopy images |
| CN102278951B (en) * | 2010-09-14 | 2012-09-05 | 北京航空航天大学 | Digital holography-based three-dimensional micro-observation apparatus for cell dynamic of living organism |
| JP2014506122A (en) | 2010-12-07 | 2014-03-13 | ライフ テクノロジーズ コーポレーション | Virtual cell staining system |
| EP2676173B1 (en) | 2011-02-16 | 2023-03-29 | Phase Holographic Imaging Phi AB | Determination of physical parameters associated with erythrocytes |
| US9684281B2 (en) * | 2011-07-19 | 2017-06-20 | Ovizio Imaging Systems NV/SA | Method and system for detecting and/or classifying cancerous cells in a cell sample |
| US20130046793A1 (en) * | 2011-08-19 | 2013-02-21 | Qualcomm Incorporated | Fast matching of image features using multi-dimensional tree data structures |
| US9164479B2 (en) * | 2011-09-16 | 2015-10-20 | University Of Massachusetts | Systems and methods of dual-plane digital holographic microscopy |
| US20130094750A1 (en) * | 2011-10-12 | 2013-04-18 | Tolga Tasdizen | Methods and systems for segmentation of cells for an automated differential counting system |
| WO2013080163A1 (en) * | 2011-12-02 | 2013-06-06 | Csir | Material analysis system, method and device |
| EP2602608B1 (en) * | 2011-12-07 | 2016-09-14 | Imec | Analysis and sorting of biological cells in flow |
| KR102094326B1 (en) | 2012-05-03 | 2020-03-30 | 미디얼 리서치 리미티드 | Methods and systems of evaluating a risk of a gastrointestinal cancer |
| WO2014031735A1 (en) | 2012-08-21 | 2014-02-27 | Cambridge Research & Instrumentation, Inc. | Visualization and measurement of cell compartments |
| AU2014249011A1 (en) * | 2013-03-11 | 2015-09-24 | Roche Diagnostics Hematology, Inc. | Imaging blood cells |
| US9135682B2 (en) | 2013-03-15 | 2015-09-15 | Indian Institute Of Technology Delhi | Image recovery from single shot digital hologram |
| US9129189B2 (en) * | 2013-08-14 | 2015-09-08 | Qualcomm Incorporated | Performing vocabulary-based visual search using multi-resolution feature descriptors |
| US9668699B2 (en) | 2013-10-17 | 2017-06-06 | Siemens Healthcare Gmbh | Method and system for anatomical object detection using marginal space deep neural networks |
| US10126709B2 (en) * | 2013-12-02 | 2018-11-13 | Imec Vzw | Apparatus and method for performing in-line lens-free digital holography of an object |
| US10074006B2 (en) * | 2014-03-17 | 2018-09-11 | Carnegie Mellon University | Methods and systems for disease classification |
| EP3155558A1 (en) | 2014-06-16 | 2017-04-19 | Siemens Healthcare Diagnostics Inc. | Analyzing digital holographic microscopy data for hematology applications |
| US20170328924A1 (en) * | 2014-11-26 | 2017-11-16 | Ronald Jones | Automated microscopic cell analysis |
| WO2016140693A1 (en) * | 2015-03-02 | 2016-09-09 | Siemens Aktiengesellschaft | Classification of cellular images and videos |
| EP3268894A1 (en) * | 2015-03-11 | 2018-01-17 | Siemens Aktiengesellschaft | Systems and methods for deconvolutional network based classification of cellular images and videos |
| US10641698B2 (en) * | 2015-06-12 | 2020-05-05 | Cytochip Inc. | Methods for complete blood count measurement |
| RU2018107453A (en) * | 2015-08-10 | 2019-09-12 | Эссенликс Корп. | DEVICES FOR ANALYSIS AND METHODS IN BIOLOGY / CHEMISTRY, PROVIDING SIMPLIFIED STAGES, SAMPLES OF SMALL VOLUME, INCREASED SPEED AND EASE OF APPLICATION |
| CN108139711B (en) | 2015-09-22 | 2023-12-12 | 西门子保健有限责任公司 | Automatic reference in digital holographic microscopy reconstruction |
| EP3220130B1 (en) | 2016-03-16 | 2023-03-01 | Siemens Healthcare GmbH | High accuracy 5-part differential with digital holographic microscopy and untouched leukocytes from peripheral blood |
| EP3455626B1 (en) * | 2016-05-11 | 2025-08-06 | S.D. Sight Diagnostics Ltd. | Performing optical measurements on a sample |
| KR20170141029A (en) * | 2016-06-14 | 2017-12-22 | 조선대학교산학협력단 | Morphology parameters based red blood cell inspection method and digital holographic microscopy used in the same |
-
2015
- 2015-06-16 EP EP15741628.0A patent/EP3155558A1/en not_active Withdrawn
- 2015-06-16 WO PCT/US2015/035945 patent/WO2015195609A1/en not_active Ceased
- 2015-06-16 US US15/580,136 patent/US10706260B2/en active Active
- 2015-06-16 WO PCT/US2015/035999 patent/WO2015195642A1/en not_active Ceased
- 2015-06-16 JP JP2016572573A patent/JP6503382B2/en active Active
- 2015-06-16 US US15/318,831 patent/US10176363B2/en active Active
- 2015-06-16 CN CN201810094733.4A patent/CN108426994B/en active Active
- 2015-06-16 CN CN201580032575.4A patent/CN106462746B/en active Active
- 2015-06-16 EP EP18159357.5A patent/EP3364341B1/en active Active
-
2018
- 2018-02-14 JP JP2018024140A patent/JP6704005B2/en active Active
- 2018-11-16 US US16/193,587 patent/US10671833B2/en active Active
Non-Patent Citations (4)
| Title |
|---|
| BAGHLI ISMAHAN ET AL: "Hybrid framework based on evidence theory for blood cell image segmentation", PROGRESS IN BIOMEDICAL OPTICS AND IMAGING, SPIE - INTERNATIONAL SOCIETY FOR OPTICAL ENGINEERING, BELLINGHAM, WA, US, vol. 9038, 13 March 2014 (2014-03-13), pages 903815 - 903815, XP060036368, ISSN: 1605-7422, ISBN: 978-1-62841-502-5, DOI: 10.1117/12.2042142 * |
| GLORIA D?AZ ET AL: "Automatic Analysis of Microscopic Images in Hematological Cytology Applications", AUTOMATIC ANALYSIS OF MICROSCOPIC IMAGES IN HEMATOLOGICAL CYTOLOGY APPLICATIONS, 31 December 2009 (2009-12-31), pages 1 - 26, XP055180187, Retrieved from the Internet <URL:https://hal-ensta.archives-ouvertes.fr/hal-01131027/document> [retrieved on 20150330], DOI: 10.4018/978-1-60566-956-4.ch008> * |
| J O RICARDO ET AL: "Digital holography microscopy in 3D biologic samples analysis", JOURNAL OF PHYSICS: CONFERENCE SERIES, vol. 274, 1 January 2011 (2011-01-01), pages 012066, XP055209796, DOI: 10.1088/1742-6596/274/1/012066 * |
| SHARIF J M ET AL: "Red blood cell segmentation using masking and watershed algorithm: A preliminary study", BIOMEDICAL ENGINEERING (ICOBE), 2012 INTERNATIONAL CONFERENCE ON, IEEE, 27 February 2012 (2012-02-27), pages 258 - 262, XP032157409, ISBN: 978-1-4577-1990-5, DOI: 10.1109/ICOBE.2012.6179016 * |
Also Published As
| Publication number | Publication date |
|---|---|
| US20170132450A1 (en) | 2017-05-11 |
| US10706260B2 (en) | 2020-07-07 |
| JP2017519985A (en) | 2017-07-20 |
| CN106462746A (en) | 2017-02-22 |
| EP3364341C0 (en) | 2024-07-24 |
| US10176363B2 (en) | 2019-01-08 |
| CN108426994B (en) | 2020-12-25 |
| JP6503382B2 (en) | 2019-04-17 |
| US20190087638A1 (en) | 2019-03-21 |
| WO2015195642A1 (en) | 2015-12-23 |
| CN106462746B (en) | 2020-03-10 |
| WO2015195609A1 (en) | 2015-12-23 |
| JP6704005B2 (en) | 2020-06-03 |
| EP3155558A1 (en) | 2017-04-19 |
| EP3364341B1 (en) | 2024-07-24 |
| US20180144182A1 (en) | 2018-05-24 |
| CN108426994A (en) | 2018-08-21 |
| JP2018119969A (en) | 2018-08-02 |
| US10671833B2 (en) | 2020-06-02 |
Similar Documents
| Publication | Publication Date | Title |
|---|---|---|
| US10671833B2 (en) | Analyzing digital holographic microscopy data for hematology applications | |
| William et al. | Cervical cancer classification from Pap-smears using an enhanced fuzzy C-means algorithm | |
| Ayas et al. | Random forest-based tuberculosis bacteria classification in images of ZN-stained sputum smear samples | |
| Parab et al. | Red blood cell classification using image processing and CNN | |
| US20190042826A1 (en) | Automatic nuclei segmentation in histopathology images | |
| Shirazi et al. | Extreme learning machine based microscopic red blood cells classification | |
| Al‐Tahhan et al. | Accurate automatic detection of acute lymphatic leukemia using a refined simple classification | |
| US12292370B2 (en) | Systematic characterization of objects in a biological sample | |
| Röhrl et al. | Towards interpretable classification of leukocytes based on deep learning | |
| PS | Improved DeepMitosisNet framework for detection of mitosis in histopathology images | |
| CN115270874B (en) | A method and system for flow cytometry cell classification and counting based on density estimation | |
| Tikkanen et al. | Training based cell detection from bright-field microscope images | |
| Rota et al. | On automated Flow Cytometric analysis for MRD estimation of Acute Lymphoblastic Leukaemia: A comparison among different approaches | |
| Gamarra et al. | A study of image analysis algorithms for segmentation, feature extraction and classification of cells | |
| Alom et al. | Deep Learning-driven Automatic Nuclei Segmentation of Label-free Live Cell Chromatin-sensitive Partial Wave Spectroscopic Microscopy Imaging | |
| Thapa et al. | Enhanced Breast Cancer Classification from Histopathological Images Using Integrated SVM and CNN Frameworks | |
| Suneetha et al. | Unsupervised Learning Approach for Polycystic Ovary Syndrome Diagnosis Through CNN Feature Extraction and Clustering Algorithms | |
| Vats et al. | New Developments in Computational Methods for CNN-Based Models-Based Blood Cell Classification | |
| Gamarra et al. | Cell identification using image analysis: A literature survey | |
| Hradel et al. | Interpretable diagnosis of breast cancer from histological images using Siamese neural networks | |
| Achmadi et al. | Application of Optical Character Recognizer Prototype and Convulsion Neural Network for Vehicle License Plate Detection | |
| Ozkan | Classification of Plant Leaf Diseases Using Image Processing and Machine Learning on Real-World Images | |
| Geeitha et al. | Advanced Ensemble Learning for Cervical Cancer Risk Prediction using Behavioral and Psychosocial Features | |
| Alkrimi et al. | Comparison of Different Classification Techniques Using Knowledge Discovery to Detect Malaria-infected Red Blood Cells | |
| KHORRAMI | CANCER DETECTION FROM HISTOPATHOLOGY IMAGES |
Legal Events
| Date | Code | Title | Description |
|---|---|---|---|
| PUAI | Public reference made under article 153(3) epc to a published international application that has entered the european phase |
Free format text: ORIGINAL CODE: 0009012 |
|
| STAA | Information on the status of an ep patent application or granted ep patent |
Free format text: STATUS: THE APPLICATION HAS BEEN PUBLISHED |
|
| AC | Divisional application: reference to earlier application |
Ref document number: 3155558 Country of ref document: EP Kind code of ref document: P |
|
| AK | Designated contracting states |
Kind code of ref document: A1 Designated state(s): AL AT BE BG CH CY CZ DE DK EE ES FI FR GB GR HR HU IE IS IT LI LT LU LV MC MK MT NL NO PL PT RO RS SE SI SK SM TR |
|
| STAA | Information on the status of an ep patent application or granted ep patent |
Free format text: STATUS: REQUEST FOR EXAMINATION WAS MADE |
|
| 17P | Request for examination filed |
Effective date: 20190219 |
|
| RBV | Designated contracting states (corrected) |
Designated state(s): AL AT BE BG CH CY CZ DE DK EE ES FI FR GB GR HR HU IE IS IT LI LT LU LV MC MK MT NL NO PL PT RO RS SE SI SK SM TR |
|
| STAA | Information on the status of an ep patent application or granted ep patent |
Free format text: STATUS: EXAMINATION IS IN PROGRESS |
|
| 17Q | First examination report despatched |
Effective date: 20210223 |
|
| REG | Reference to a national code |
Ref country code: DE Free format text: PREVIOUS MAIN CLASS: G06K0009000000 Ref country code: DE Ref legal event code: R079 Ref document number: 602015089343 Country of ref document: DE Free format text: PREVIOUS MAIN CLASS: G06K0009000000 Ipc: G06V0010764000 |
|
| REG | Reference to a national code |
Ref country code: DE Ref legal event code: R079 Free format text: PREVIOUS MAIN CLASS: G06V0010764000 Ipc: G01N0033490000 Ref country code: DE Ref legal event code: R079 Ref document number: 602015089343 Country of ref document: DE Free format text: PREVIOUS MAIN CLASS: G06V0010764000 Ipc: G01N0033490000 |
|
| GRAP | Despatch of communication of intention to grant a patent |
Free format text: ORIGINAL CODE: EPIDOSNIGR1 |
|
| STAA | Information on the status of an ep patent application or granted ep patent |
Free format text: STATUS: GRANT OF PATENT IS INTENDED |
|
| RIC1 | Information provided on ipc code assigned before grant |
Ipc: G06V 20/69 20220101ALI20240201BHEP Ipc: G06V 10/764 20220101AFI20240201BHEP |
|
| RIC1 | Information provided on ipc code assigned before grant |
Ipc: G06V 20/69 20220101ALI20240205BHEP Ipc: G06V 10/764 20220101ALI20240205BHEP Ipc: G03H 1/04 20060101ALI20240205BHEP Ipc: G01N 15/10 20060101ALI20240205BHEP Ipc: G01N 15/1433 20240101ALI20240205BHEP Ipc: G01N 33/49 20060101AFI20240205BHEP |
|
| INTG | Intention to grant announced |
Effective date: 20240220 |
|
| GRAS | Grant fee paid |
Free format text: ORIGINAL CODE: EPIDOSNIGR3 |
|
| GRAA | (expected) grant |
Free format text: ORIGINAL CODE: 0009210 |
|
| STAA | Information on the status of an ep patent application or granted ep patent |
Free format text: STATUS: THE PATENT HAS BEEN GRANTED |
|
| AC | Divisional application: reference to earlier application |
Ref document number: 3155558 Country of ref document: EP Kind code of ref document: P |
|
| AK | Designated contracting states |
Kind code of ref document: B1 Designated state(s): AL AT BE BG CH CY CZ DE DK EE ES FI FR GB GR HR HU IE IS IT LI LT LU LV MC MK MT NL NO PL PT RO RS SE SI SK SM TR |
|
| REG | Reference to a national code |
Ref country code: GB Ref legal event code: FG4D |
|
| REG | Reference to a national code |
Ref country code: CH Ref legal event code: EP |
|
| REG | Reference to a national code |
Ref country code: IE Ref legal event code: FG4D Ref country code: DE Ref legal event code: R096 Ref document number: 602015089343 Country of ref document: DE |
|
| U01 | Request for unitary effect filed |
Effective date: 20240730 |
|
| U07 | Unitary effect registered |
Designated state(s): AT BE BG DE DK EE FI FR IT LT LU LV MT NL PT RO SE SI Effective date: 20240902 |
|
| PG25 | Lapsed in a contracting state [announced via postgrant information from national office to epo] |
Ref country code: NO Free format text: LAPSE BECAUSE OF FAILURE TO SUBMIT A TRANSLATION OF THE DESCRIPTION OR TO PAY THE FEE WITHIN THE PRESCRIBED TIME-LIMIT Effective date: 20241024 |
|
| PG25 | Lapsed in a contracting state [announced via postgrant information from national office to epo] |
Ref country code: GR Free format text: LAPSE BECAUSE OF FAILURE TO SUBMIT A TRANSLATION OF THE DESCRIPTION OR TO PAY THE FEE WITHIN THE PRESCRIBED TIME-LIMIT Effective date: 20241025 Ref country code: PL Free format text: LAPSE BECAUSE OF FAILURE TO SUBMIT A TRANSLATION OF THE DESCRIPTION OR TO PAY THE FEE WITHIN THE PRESCRIBED TIME-LIMIT Effective date: 20240724 |
|
| PG25 | Lapsed in a contracting state [announced via postgrant information from national office to epo] |
Ref country code: IS Free format text: LAPSE BECAUSE OF FAILURE TO SUBMIT A TRANSLATION OF THE DESCRIPTION OR TO PAY THE FEE WITHIN THE PRESCRIBED TIME-LIMIT Effective date: 20241124 |
|
| PG25 | Lapsed in a contracting state [announced via postgrant information from national office to epo] |
Ref country code: HR Free format text: LAPSE BECAUSE OF FAILURE TO SUBMIT A TRANSLATION OF THE DESCRIPTION OR TO PAY THE FEE WITHIN THE PRESCRIBED TIME-LIMIT Effective date: 20240724 |
|
| PG25 | Lapsed in a contracting state [announced via postgrant information from national office to epo] |
Ref country code: RS Free format text: LAPSE BECAUSE OF FAILURE TO SUBMIT A TRANSLATION OF THE DESCRIPTION OR TO PAY THE FEE WITHIN THE PRESCRIBED TIME-LIMIT Effective date: 20241024 Ref country code: ES Free format text: LAPSE BECAUSE OF FAILURE TO SUBMIT A TRANSLATION OF THE DESCRIPTION OR TO PAY THE FEE WITHIN THE PRESCRIBED TIME-LIMIT Effective date: 20240724 |
|
| PG25 | Lapsed in a contracting state [announced via postgrant information from national office to epo] |
Ref country code: RS Free format text: LAPSE BECAUSE OF FAILURE TO SUBMIT A TRANSLATION OF THE DESCRIPTION OR TO PAY THE FEE WITHIN THE PRESCRIBED TIME-LIMIT Effective date: 20241024 Ref country code: PL Free format text: LAPSE BECAUSE OF FAILURE TO SUBMIT A TRANSLATION OF THE DESCRIPTION OR TO PAY THE FEE WITHIN THE PRESCRIBED TIME-LIMIT Effective date: 20240724 Ref country code: NO Free format text: LAPSE BECAUSE OF FAILURE TO SUBMIT A TRANSLATION OF THE DESCRIPTION OR TO PAY THE FEE WITHIN THE PRESCRIBED TIME-LIMIT Effective date: 20241024 Ref country code: IS Free format text: LAPSE BECAUSE OF FAILURE TO SUBMIT A TRANSLATION OF THE DESCRIPTION OR TO PAY THE FEE WITHIN THE PRESCRIBED TIME-LIMIT Effective date: 20241124 Ref country code: HR Free format text: LAPSE BECAUSE OF FAILURE TO SUBMIT A TRANSLATION OF THE DESCRIPTION OR TO PAY THE FEE WITHIN THE PRESCRIBED TIME-LIMIT Effective date: 20240724 Ref country code: GR Free format text: LAPSE BECAUSE OF FAILURE TO SUBMIT A TRANSLATION OF THE DESCRIPTION OR TO PAY THE FEE WITHIN THE PRESCRIBED TIME-LIMIT Effective date: 20241025 Ref country code: ES Free format text: LAPSE BECAUSE OF FAILURE TO SUBMIT A TRANSLATION OF THE DESCRIPTION OR TO PAY THE FEE WITHIN THE PRESCRIBED TIME-LIMIT Effective date: 20240724 |
|
| PG25 | Lapsed in a contracting state [announced via postgrant information from national office to epo] |
Ref country code: SM Free format text: LAPSE BECAUSE OF FAILURE TO SUBMIT A TRANSLATION OF THE DESCRIPTION OR TO PAY THE FEE WITHIN THE PRESCRIBED TIME-LIMIT Effective date: 20240724 |
|
| PG25 | Lapsed in a contracting state [announced via postgrant information from national office to epo] |
Ref country code: CZ Free format text: LAPSE BECAUSE OF FAILURE TO SUBMIT A TRANSLATION OF THE DESCRIPTION OR TO PAY THE FEE WITHIN THE PRESCRIBED TIME-LIMIT Effective date: 20240724 |
|
| PG25 | Lapsed in a contracting state [announced via postgrant information from national office to epo] |
Ref country code: SK Free format text: LAPSE BECAUSE OF FAILURE TO SUBMIT A TRANSLATION OF THE DESCRIPTION OR TO PAY THE FEE WITHIN THE PRESCRIBED TIME-LIMIT Effective date: 20240724 |
|
| PLBE | No opposition filed within time limit |
Free format text: ORIGINAL CODE: 0009261 |
|
| STAA | Information on the status of an ep patent application or granted ep patent |
Free format text: STATUS: NO OPPOSITION FILED WITHIN TIME LIMIT |
|
| 26N | No opposition filed |
Effective date: 20250425 |
|
| U20 | Renewal fee for the european patent with unitary effect paid |
Year of fee payment: 11 Effective date: 20250620 |
|
| PGFP | Annual fee paid to national office [announced via postgrant information from national office to epo] |
Ref country code: GB Payment date: 20250710 Year of fee payment: 11 |
|
| REG | Reference to a national code |
Ref country code: CH Ref legal event code: H13 Free format text: ST27 STATUS EVENT CODE: U-0-0-H10-H13 (AS PROVIDED BY THE NATIONAL OFFICE) Effective date: 20260127 |
|
| PG25 | Lapsed in a contracting state [announced via postgrant information from national office to epo] |
Ref country code: MC Free format text: LAPSE BECAUSE OF FAILURE TO SUBMIT A TRANSLATION OF THE DESCRIPTION OR TO PAY THE FEE WITHIN THE PRESCRIBED TIME-LIMIT Effective date: 20240724 |
|
| PG25 | Lapsed in a contracting state [announced via postgrant information from national office to epo] |
Ref country code: IE Free format text: LAPSE BECAUSE OF NON-PAYMENT OF DUE FEES Effective date: 20250616 |
|
| PG25 | Lapsed in a contracting state [announced via postgrant information from national office to epo] |
Ref country code: CH Free format text: LAPSE BECAUSE OF NON-PAYMENT OF DUE FEES Effective date: 20250630 |