EP3359972B1 - Method and system for determining phasor components of a periodic waveform - Google Patents
Method and system for determining phasor components of a periodic waveform Download PDFInfo
- Publication number
- EP3359972B1 EP3359972B1 EP16777984.2A EP16777984A EP3359972B1 EP 3359972 B1 EP3359972 B1 EP 3359972B1 EP 16777984 A EP16777984 A EP 16777984A EP 3359972 B1 EP3359972 B1 EP 3359972B1
- Authority
- EP
- European Patent Office
- Prior art keywords
- frequency
- periodic waveform
- gaussian
- gaussian window
- peak
- Prior art date
- Legal status (The legal status is an assumption and is not a legal conclusion. Google has not performed a legal analysis and makes no representation as to the accuracy of the status listed.)
- Active
Links
Images

Classifications
-
- G—PHYSICS
- G01—MEASURING; TESTING
- G01R—MEASURING ELECTRIC VARIABLES; MEASURING MAGNETIC VARIABLES
- G01R23/00—Arrangements for measuring frequencies; Arrangements for analysing frequency spectra
- G01R23/16—Spectrum analysis; Fourier analysis
- G01R23/165—Spectrum analysis; Fourier analysis using filters
- G01R23/167—Spectrum analysis; Fourier analysis using filters with digital filters
-
- G—PHYSICS
- G01—MEASURING; TESTING
- G01R—MEASURING ELECTRIC VARIABLES; MEASURING MAGNETIC VARIABLES
- G01R19/00—Arrangements for measuring currents or voltages or for indicating presence or sign thereof
- G01R19/25—Arrangements for measuring currents or voltages or for indicating presence or sign thereof using digital measurement techniques
- G01R19/2506—Arrangements for conditioning or analysing measured signals, e.g. for indicating peak values ; Details concerning sampling, digitizing or waveform capturing
-
- G—PHYSICS
- G01—MEASURING; TESTING
- G01R—MEASURING ELECTRIC VARIABLES; MEASURING MAGNETIC VARIABLES
- G01R19/00—Arrangements for measuring currents or voltages or for indicating presence or sign thereof
- G01R19/25—Arrangements for measuring currents or voltages or for indicating presence or sign thereof using digital measurement techniques
- G01R19/2513—Arrangements for monitoring electric power systems, e.g. power lines or loads; Logging
-
- G—PHYSICS
- G06—COMPUTING OR CALCULATING; COUNTING
- G06F—ELECTRIC DIGITAL DATA PROCESSING
- G06F17/00—Digital computing or data processing equipment or methods, specially adapted for specific functions
- G06F17/10—Complex mathematical operations
- G06F17/14—Fourier, Walsh or analogous domain transformations, e.g. Laplace, Hilbert, Karhunen-Loeve, transforms
- G06F17/141—Discrete Fourier transforms
- G06F17/142—Fast Fourier transforms, e.g. using a Cooley-Tukey type algorithm
-
- H—ELECTRICITY
- H02—GENERATION; CONVERSION OR DISTRIBUTION OF ELECTRIC POWER
- H02H—EMERGENCY PROTECTIVE CIRCUIT ARRANGEMENTS
- H02H1/00—Details of emergency protective circuit arrangements
- H02H1/0092—Details of emergency protective circuit arrangements concerning the data processing means, e.g. expert systems, neural networks
-
- Y—GENERAL TAGGING OF NEW TECHNOLOGICAL DEVELOPMENTS; GENERAL TAGGING OF CROSS-SECTIONAL TECHNOLOGIES SPANNING OVER SEVERAL SECTIONS OF THE IPC; TECHNICAL SUBJECTS COVERED BY FORMER USPC CROSS-REFERENCE ART COLLECTIONS [XRACs] AND DIGESTS
- Y02—TECHNOLOGIES OR APPLICATIONS FOR MITIGATION OR ADAPTATION AGAINST CLIMATE CHANGE
- Y02E—REDUCTION OF GREENHOUSE GAS [GHG] EMISSIONS, RELATED TO ENERGY GENERATION, TRANSMISSION OR DISTRIBUTION
- Y02E40/00—Technologies for an efficient electrical power generation, transmission or distribution
- Y02E40/70—Smart grids as climate change mitigation technology in the energy generation sector
-
- Y—GENERAL TAGGING OF NEW TECHNOLOGICAL DEVELOPMENTS; GENERAL TAGGING OF CROSS-SECTIONAL TECHNOLOGIES SPANNING OVER SEVERAL SECTIONS OF THE IPC; TECHNICAL SUBJECTS COVERED BY FORMER USPC CROSS-REFERENCE ART COLLECTIONS [XRACs] AND DIGESTS
- Y02—TECHNOLOGIES OR APPLICATIONS FOR MITIGATION OR ADAPTATION AGAINST CLIMATE CHANGE
- Y02E—REDUCTION OF GREENHOUSE GAS [GHG] EMISSIONS, RELATED TO ENERGY GENERATION, TRANSMISSION OR DISTRIBUTION
- Y02E60/00—Enabling technologies; Technologies with a potential or indirect contribution to GHG emissions mitigation
-
- Y—GENERAL TAGGING OF NEW TECHNOLOGICAL DEVELOPMENTS; GENERAL TAGGING OF CROSS-SECTIONAL TECHNOLOGIES SPANNING OVER SEVERAL SECTIONS OF THE IPC; TECHNICAL SUBJECTS COVERED BY FORMER USPC CROSS-REFERENCE ART COLLECTIONS [XRACs] AND DIGESTS
- Y04—INFORMATION OR COMMUNICATION TECHNOLOGIES HAVING AN IMPACT ON OTHER TECHNOLOGY AREAS
- Y04S—SYSTEMS INTEGRATING TECHNOLOGIES RELATED TO POWER NETWORK OPERATION, COMMUNICATION OR INFORMATION TECHNOLOGIES FOR IMPROVING THE ELECTRICAL POWER GENERATION, TRANSMISSION, DISTRIBUTION, MANAGEMENT OR USAGE, i.e. SMART GRIDS
- Y04S10/00—Systems supporting electrical power generation, transmission or distribution
- Y04S10/22—Flexible AC transmission systems [FACTS] or power factor or reactive power compensating or correcting units
Definitions
- the present disclosure generally relates to waveform analysis.
- it relates to a method and a system for determining phasor components of a periodic waveform.
- Accurate waveform measurements are desirable in a number of fields.
- An example is electrical measurements, for example impedance measurements.
- these types of measurements involve analysis of the signal in the frequency domain.
- amplitude measurement using frequency analysis has required that the sample speed, analysed time, and signal frequency are adapted such that exactly an integer number of periods are analysed. This is called synchronised sampling.
- the signal frequency must always be known prior to the measurement, otherwise the estimated amplitude will receive an error that is dependent of the difference between the assumed frequency and the actual frequency of the signal.
- interpolated Fast Fourier Transform as disclosed in e.g. " High-Accuracy measurements via Interpolated FFT” by Jain et al., published in IEEE Transactions on Instruments and Measurements, Vol. Im-28, No. 2, June 1978 , may be used.
- FFT Fast Fourier Transform
- usually two or a maximum of three frequency bins are used for the interpolation.
- dielectric response measurements are extreme in precision requirements. Modern insulation materials often have losses in the range 10 -4 or less, whereas a precision of 10 -2 is sufficient in most other electrical measurements.
- balancing circuit To achieve high precision, most dielectric response techniques use a balancing circuit to suppress the dominating capacitive current. Traditionally, this is done in a bridge circuit where one bridge arm is adjusted to minimize the difference current. Balancing techniques require careful control and well-defined waveforms and are therefore impossible to perform on equipment in service.
- US 2013/018620 A1 discloses a method and system for time synchronization of phase of signals.
- a sampled signal may correspond to the digitized signal or to a decimation of the digitized signal.
- a spectral window is preferably applied on the signal block subjected to a transform.
- the spectral window will preferably have a shape close to a Gaussian and will exhibit a high side lobe rejection rate.
- the transform converts the temporal signal into spectral information where the energy of a tone gets regrouped at a frequency with an amplitude and a phase.
- this transform will correspond to a fast Fourier transform (FFT).
- FFT fast Fourier transform
- the spectral information is submitted to a component estimator. This estimator finds the amplitude, the phase and the frequency in order of spectral line of one or several tones.
- EP 0 399 704 A2 discloses an apparatus, e.g. a spectrum analyser or frequency counter, for determining the frequency and/or amplitude of a spectral line in the frequency spectrum of an input signal, comprising a window-defining filter for shaping and truncating the input signal amplitude as a function of time, means for applying a discrete Fourier transform to the filtered input signal to store representations of signal amplitude at each of several predetermined, contiguous frequency bins, and means for interpolating between the stored values of signal amplitude to determine the frequency and/or amplitude of an amplitude peak in the input signal, wherein the interpolation means fits the stored values to a Gaussian or near-Gaussian curve which is close to the Fourier transform of the window function defined by the filter.
- WO 93/19378 A1 discloses a signal analyzer which generates a time varying spectrum for input signals with frequency components which change in time.
- the signal analyzer includes a converter generating a sequence of digital signals representative of an input signal.
- the sequence of digital signals is supplied to a digital signal processor which computes orthogonal-like discrete Gabor transform coefficients Cm,n in response to the sequence, and a time varying spectrum of the input signal energy in response to the coefficients.
- a data processor processes the spectrum for further analysis or display.
- One particular analysis step for which the time varying spectrum is useful is in partitioning the input signal into separate components.
- the orthogonal-like discrete Gabor transform coefficients are computed using a non-periodic, localized discrete window function h and a discrete auxiliary function y, similar to h.
- the time varying spectrum is computed utilizing a cross-term deleted Wigner-Ville distribution.
- EP 2 278 343 A2 discloses a system and method of making frequency domain measurements on a waveform acquired by a time domain instrument, such as an oscilloscope, using built-in FFT spectral analysis in the time domain instrument so that a user can perform the compliance measurements using the oscilloscope alone.
- the results of the measurement made by the oscilloscope are made comparable to those made by a spectral analyzer by improving dynamic range, noise floor, and measurement accuracy, by averaging on the time domain oscilloscope.
- An object of the present disclosure is therefore to provide a method and a system which solves or at least mitigate the problems of the prior art.
- the sample window utilised influences the accuracy of frequency domain measurements.
- the spill level which is the amplitude function far from a frequency peak in the frequency domain.
- the spill can thus be rendered insignificant which enables close-lying frequencies, for example harmonics, to be properly measured.
- the frequency peak can thus be approximated with a high degree of precision.
- step d) involves estimating an amplitude of the frequency peak and a frequency of the frequency peak by adapting the amplitude and frequency of a Gaussian function that is based on the Fourier transform of the Gaussian window function to fit the group of consecutive frequency bins.
- a Gaussian function that is based on the Fourier transform of the Gaussian window function to fit the group of consecutive frequency bins.
- One embodiment comprises obtaining a respective phase, provided by the frequency transform, of at least some of the frequency bins, and interpolating between the phases to determine a frequency peak phase, which is the phase of the frequency peak.
- the width parameter of the Gaussian function forming the Gaussian window function is dimensioned to contain at least two periods of the periodic waveform.
- the group of frequency bins contains at least five frequency bins.
- the frequency transform is a discrete Fourier transform.
- the Gaussian function has the unique property under the Fourier transform that it is its own transformed function, and the frequency peak can be approximated with a high degree of precision by means of a Gaussian function.
- Gaussian window function There is hence a synergistic effect obtained by the combination of Gaussian window function, the discrete Fourier transform and the use of the Gaussian function which is the Fourier transform of the Gaussian window function, to approximate the frequency peak.
- An accuracy ratio of the determined amplitude and frequency values relative to the actual amplitude and frequency of the same order as the ratio between the frequency peak amplitude and the noise around the frequency peak amplitude may thereby be obtained.
- the Gaussian window function is defined by a Gaussian function e ⁇ (-((t-T 0 /2)/t w ) ⁇ 2).
- the periodic waveform is a measurement of one of voltage and current.
- a computer program product comprising a computer program according to the second aspect, and a computer-readable medium on which the computer program is stored.
- a phasor determination system configured to determine phasors of a periodic waveform as defined in claim 10.
- the processing circuitry is configured to determine phasor components by estimating an amplitude of the frequency peak and a frequency of the frequency peak by adapting the amplitude and frequency of a Gaussian function that is based on the Fourier transform of the Gaussian window function to fit the group of consecutive frequency bins.
- the processing circuitry is configured to obtain a respective phase, provided by the frequency transform, of at least some of the frequency bins, and interpolating between the phases to determine a frequency peak phase, which is the phase of the frequency peak.
- the width parameter of the Gaussian function forming the Gaussian window function is dimensioned to contain at least two periods of the periodic waveform.
- the periodic waveform is a measurement of one of current and voltage.
- Fig. 1 shows an example of phasor determination system 1 configured to determine phasor components of a periodic waveform.
- Phasor components are features that define a waveform, and these are amplitude, frequency and phase.
- the phasor determination system 1 comprises processing circuitry 3.
- the phasor determination system 1 may according to one variation furthermore comprise a storage medium 5.
- the processing circuitry 3 uses any combination of one or more of a suitable central processing unit (CPU), multiprocessor, microcontroller, digital signal processor (DSP), application specific integrated circuit (ASIC), field programmable gate arrays (FPGA) etc., capable of executing any herein disclosed operations, or steps.
- CPU central processing unit
- DSP digital signal processor
- ASIC application specific integrated circuit
- FPGA field programmable gate arrays
- the processing circuitry 3 is configured to cause the phasor determination system 1 to perform a set of operations, or steps, a)-d). These operations, or steps, a)-d) will be disclosed below.
- the storage medium 5 may store the set of operations
- the processing circuitry 3 may be configured to retrieve the set of operations from the storage medium 5 to cause the phasor determination system 1 to perform the set of operations.
- the processing circuitry 3 may be configured to by itself cause the phasor determination system 1 to perform the set of operations.
- the set of operations may be provided as a set of executable instructions.
- the processing circuitry 3 is thereby arranged to execute methods as herein disclosed.
- the storage medium 5 may also comprise persistent storage, which, for example, can be any single one or combination of magnetic memory, optical memory, solid state memory or even remotely mounted memory.
- a step a) the processing circuitry 3 is configured to sample the periodic waveform.
- the periodic waveform is obtained from a measurement of a signal.
- the periodic waveform may be measured by means of a waveform measurement sensor and provided to the processing circuitry 3.
- the phasor determination system 1 may therefore also comprise a waveform measurement sensor operatively connected to the processing circuitry 3.
- the present method provides higher accuracy than existing methods for any number of samples, it is beneficial to use as high sample frequency as possible for any fixed Gaussian window function width.
- the Gaussian window function may be defined by the Gaussian function e ⁇ (-((t-T 0 /2)/t w ) ⁇ 2 ), where t w is the width parameter of the Gaussian window function and T 0 /2 is the centre of the Gaussian window function.
- the Gaussian window function is thus centred at the middle of the analysed/sampled periodic waveform of duration T 0 .
- the processing circuitry 2 is configured to determine a frequency spectrum of the sampled periodic waveform by means of a frequency transform, utilizing a Gaussian window function 7.
- the ratio n p defined by the duration T 0 of the sampling of the periodic waveform divided by the width parameter t w of the Gaussian window function is at least 5.
- This frequency transform is beneficially a discrete Fourier transformation, for example a fast Fourier transform (FFT).
- a region of the frequency spectrum containing a frequency peak defined by a group of consecutive frequency bins, each being defined by a frequency value and a magnitude value is selected. This selection may for example be obtained by the processing circuitry 3 by identifying a region of the frequency spectrum which has a pronounced frequency peak.
- step d) phasor components of the periodic waveform are determined based on the group of consecutive frequency bins.
- step d) involves estimating an amplitude of the frequency peak and a frequency of the frequency peak by adapting the amplitude and frequency of a Gaussian function that is based on the Fourier transform of the Gaussian window function to fit the group of consecutive frequency bins.
- the Gaussian function which is based on the Fourier transform of the Gaussian window function is hence fitted to the frequency peak by varying the amplitude and the frequency parameters of this Gaussian function.
- the best fit may be obtained by minimising the difference between the frequency bin amplitude values and the corresponding Gaussian function values.
- step d) a very accurate estimation of the amplitude and frequency of the frequency peak may be obtained.
- the Gaussian function is so well-suited for approximating the frequency peak due to the utilisation of the Gaussian window function
- a plurality of frequency bins for example at least five, at least ten, or at least 15-20 frequency bins of the group of frequency bins, may be utilised in the approximation procedure.
- a better curve fit may be obtained, resulting in a more accurate estimation of the frequency and amplitude of the frequency peak.
- the Fourier transform of the Gaussian window function is of the form exp((-1/4) ⁇ 2 t w 2 ).
- the Gaussian function utilised for approximating the frequency peak herein is based on the Fourier transform of the Gaussian and may for example be of the form A0 ⁇ exp(-( ⁇ (f-f0)tw) ⁇ 2), where A0 is the amplitude and f0 is the frequency of the frequency peak, and where ⁇ has been replaced with 2 ⁇ (f-f0) because of the transition from angular velocity to frequency and to describe a peak at frequency f0.
- the values of the amplitude A0 and the frequency f0 are hence varied and the amplitude value A0, and corresponding frequency value f0, of that Gaussian function which minimises the difference between the amplitude of the Gaussian function and the frequency bin magnitude values are selected.
- the amplitude and frequency of the frequency peak is thereby determined.
- the amplitude and frequency of the frequency peak is thereby determined with an accuracy that is determined by the magnitude of the noise.
- the method can be carried out for multiple frequency peaks of the frequency spectrum such that essentially the entire spectrum, i.e. all frequencies, of the periodic waveform may be determined or estimated in an accurate manner.
- step d) is carried out for each selected frequency peak, i.e. pronounced peak, of the frequency spectrum.
- the phase of the frequency peak for which the amplitude and frequency has been determined in step d) may according to one variation of the method also be determined.
- the phase may be determined based on the phase of at least some of the frequency bins that define the selected frequency peak.
- Each frequency bin is a component of a complex-valued sequence obtained by the frequency transform and each frequency bin is thus associated with a respective amplitude and phase.
- Fig. 3a shows an example of a Gaussian window function 7 and a periodic waveform 8.
- the width parameter t w is indicated in this figure, as is the duration T 0 of the sampling of the periodic waveform.
- n p is in the range 6-7, but n p could also be greater than 7, for example 8, 9, 10 or even greater than that. The larger the value of n p , the better spill suppression in the frequency domain may be obtained.
- n p determines the width of the frequency peak and the spill level.
- Fig. 3b the spill level is shown below a frequency peak.
- the width of the frequency peak is found by the ratio n p 2 2 ⁇ ⁇ .
- Fig. 4 shows an example of a frequency peak P defined by a group of frequency bins H0-H6. Each frequency bin H0-H6 has a respective magnitude value and frequency value.
- step d) of the method the shape of the frequency peak P can be approximated by a Gaussian function, as schematically shown with the dashed line. In this way, the amplitude of the Gaussian function approximating the frequency peak P can be obtained. Furthermore, as can be understood from Fig.
- the amplitude A as well as the frequency f0 provides a more accurate estimation of the actual amplitude and frequency of the particular frequency peak, shown by the difference d1 in amplitude between frequency bins H3/H4 provided by the frequency transform and the amplitude A, and the difference d2 between the frequency of e.g. frequency bin H3 and the estimated frequency f0.
- Fig. 5 shows a comparison between a first curve C1 of a frequency spectrum determined by means of a long record rectangular window, and a second curve C2 which is the frequency spectrum determined by means of the method presented herein.
- a third curve C3 shows two periods of an FFT. As can be seen, the second curve C2 is much more detailed than the first curve C1.
- the method presented herein may be used for a number of applications.
- One field of use is within electrical or electronic measurements, for example for impedance measurements, including upstream impedance measurements, dielectric response, transformer monitoring, generator protection, and on-line cable diagnostics.
Landscapes
- Physics & Mathematics (AREA)
- General Physics & Mathematics (AREA)
- Engineering & Computer Science (AREA)
- Mathematical Physics (AREA)
- Data Mining & Analysis (AREA)
- Theoretical Computer Science (AREA)
- Computational Mathematics (AREA)
- Mathematical Analysis (AREA)
- Mathematical Optimization (AREA)
- Pure & Applied Mathematics (AREA)
- Power Engineering (AREA)
- Databases & Information Systems (AREA)
- Algebra (AREA)
- Software Systems (AREA)
- General Engineering & Computer Science (AREA)
- Discrete Mathematics (AREA)
- Artificial Intelligence (AREA)
- Evolutionary Computation (AREA)
- Measurement Of Resistance Or Impedance (AREA)
- Measuring Frequencies, Analyzing Spectra (AREA)
- Measuring Phase Differences (AREA)
- Measurement And Recording Of Electrical Phenomena And Electrical Characteristics Of The Living Body (AREA)
- Investigating Or Analyzing Materials By The Use Of Electric Means (AREA)
- Complex Calculations (AREA)
Description
- The present disclosure generally relates to waveform analysis. In particular, it relates to a method and a system for determining phasor components of a periodic waveform.
- Accurate waveform measurements are desirable in a number of fields. An example is electrical measurements, for example impedance measurements. Generally, these types of measurements involve analysis of the signal in the frequency domain.
- Traditionally, amplitude measurement using frequency analysis has required that the sample speed, analysed time, and signal frequency are adapted such that exactly an integer number of periods are analysed. This is called synchronised sampling. In this case, the signal frequency must always be known prior to the measurement, otherwise the estimated amplitude will receive an error that is dependent of the difference between the assumed frequency and the actual frequency of the signal.
- In order to reduce the problems with synchronised sampling, interpolated Fast Fourier Transform (FFT) as disclosed in e.g. "High-Accuracy measurements via Interpolated FFT" by Jain et al., published in IEEE Transactions on Instruments and Measurements, Vol. Im-28, No. 2, June 1978, may be used. Here, usually two or a maximum of three frequency bins are used for the interpolation.
- It is also known to use windows for harmonic analysis, as disclosed in "On the Use of Windows for Harmonic Analysis with Discrete Fourier Transform" by Harris, published in Proceedings of the IEEE, vol. 66, No. 1, January 1978, to detect harmonic signals in the presence of broad-band noise, and in the presence of nearby harmonic interference.
- Among the measurements performed for testing and development of high-voltage equipment, dielectric response measurements are extreme in precision requirements. Modern insulation materials often have losses in the range 10-4 or less, whereas a precision of 10-2 is sufficient in most other electrical measurements.
- To achieve high precision, most dielectric response techniques use a balancing circuit to suppress the dominating capacitive current. Traditionally, this is done in a bridge circuit where one bridge arm is adjusted to minimize the difference current. Balancing techniques require careful control and well-defined waveforms and are therefore impossible to perform on equipment in service.
- Modern instrumentation technology has advanced so far that instrumentation for measurements with resolution as high as 10-6 is commercially available for frequency ranges up to 10 kHz and higher.
- The paper "Straight Dielectric Response Measurements with High Precision", by J. Hedberg and T. Bengtsson, Nord-IS 2005, paper 27, discloses a dielectric response instrument with high precision. According to this paper, the digital processing of the measurements made by the measurement circuit involve discrete Fourier transform of the measurement data in order to extract the frequency and complex amplitude in the peaks of the Fourier transformed data. It is further disclosed that it is advantageous to sample very long records to improve accuracy.
-
US 2013/018620 A1 discloses a method and system for time synchronization of phase of signals. A sampled signal may correspond to the digitized signal or to a decimation of the digitized signal. In order to limit the error introduced by the spectral overlapping of the components, a spectral window is preferably applied on the signal block subjected to a transform. The spectral window will preferably have a shape close to a Gaussian and will exhibit a high side lobe rejection rate. The transform converts the temporal signal into spectral information where the energy of a tone gets regrouped at a frequency with an amplitude and a phase. Preferably, this transform will correspond to a fast Fourier transform (FFT). The spectral information is submitted to a component estimator. This estimator finds the amplitude, the phase and the frequency in order of spectral line of one or several tones. -
EP 0 399 704 A2 discloses an apparatus, e.g. a spectrum analyser or frequency counter, for determining the frequency and/or amplitude of a spectral line in the frequency spectrum of an input signal, comprising a window-defining filter for shaping and truncating the input signal amplitude as a function of time, means for applying a discrete Fourier transform to the filtered input signal to store representations of signal amplitude at each of several predetermined, contiguous frequency bins, and means for interpolating between the stored values of signal amplitude to determine the frequency and/or amplitude of an amplitude peak in the input signal, wherein the interpolation means fits the stored values to a Gaussian or near-Gaussian curve which is close to the Fourier transform of the window function defined by the filter. -
WO 93/19378 A1 -
EP 2 278 343 A2 - The present inventors have realised that further aspects in the digital domain other than sample size may impact the precision in waveform analysis.
- An object of the present disclosure is therefore to provide a method and a system which solves or at least mitigate the problems of the prior art.
- Hence, according to a first aspect of the present disclosure there is provided a method of determining phasor components of a periodic waveform as defined in
claim 1. - It has been realised by the present inventors that the sample window utilised influences the accuracy of frequency domain measurements. Of special interest is the spill level, which is the amplitude function far from a frequency peak in the frequency domain. It is highly beneficial to use the Gaussian window function for high-precision measurements, as the spill level can be adjusted to the noise level in the data. The spill can thus be rendered insignificant which enables close-lying frequencies, for example harmonics, to be properly measured. The frequency peak can thus be approximated with a high degree of precision. By utilising a value of np equal to or greater than 5, the noise level will be supressed sufficiently to be able to find very weak frequency peaks in the proximity of larger frequency peaks. A very precise determination of the phasor components of a periodic waveform may thereby be obtained.
- According to one embodiment step d) involves estimating an amplitude of the frequency peak and a frequency of the frequency peak by adapting the amplitude and frequency of a Gaussian function that is based on the Fourier transform of the Gaussian window function to fit the group of consecutive frequency bins. By means of utilising the Fourier transform of the Gaussian window function and by means of an np greater than 5 extremely precise amplitude estimations may be made. Compared to regular FFT, which has a frequency resolution of 1/T0 and the amplitude within 30% of the actual, according to the present concept measurement accuracy within parts per million in laboratory measurements may be obtained and within 0.01 % accuracy in electrical grid measurements.
- One embodiment comprises obtaining a respective phase, provided by the frequency transform, of at least some of the frequency bins, and interpolating between the phases to determine a frequency peak phase, which is the phase of the frequency peak.
- According to one embodiment the width parameter of the Gaussian function forming the Gaussian window function is dimensioned to contain at least two periods of the periodic waveform.
- According to one embodiment the group of frequency bins contains at least five frequency bins.
- According to one embodiment the frequency transform is a discrete Fourier transform. The Gaussian function has the unique property under the Fourier transform that it is its own transformed function, and the frequency peak can be approximated with a high degree of precision by means of a Gaussian function. There is hence a synergistic effect obtained by the combination of Gaussian window function, the discrete Fourier transform and the use of the Gaussian function which is the Fourier transform of the Gaussian window function, to approximate the frequency peak. An accuracy ratio of the determined amplitude and frequency values relative to the actual amplitude and frequency of the same order as the ratio between the frequency peak amplitude and the noise around the frequency peak amplitude may thereby be obtained.
- According to one embodiment the Gaussian window function is defined by a Gaussian function e^(-((t-T0/2)/tw)^2).
- According to one embodiment the periodic waveform is a measurement of one of voltage and current.
- According to a second aspect of the present disclosure there is provided a computer program for determining phasors of a periodic waveform as defined in claim 8.
- According to a third aspect of the present disclosure there is provided a computer program product comprising a computer program according to the second aspect, and a computer-readable medium on which the computer program is stored.
- According to a fourth aspect of the present disclosure there is provided a phasor determination system configured to determine phasors of a periodic waveform as defined in claim 10.
- According to one embodiment the processing circuitry is configured to determine phasor components by estimating an amplitude of the frequency peak and a frequency of the frequency peak by adapting the amplitude and frequency of a Gaussian function that is based on the Fourier transform of the Gaussian window function to fit the group of consecutive frequency bins.
- According to one embodiment the processing circuitry is configured to obtain a respective phase, provided by the frequency transform, of at least some of the frequency bins, and interpolating between the phases to determine a frequency peak phase, which is the phase of the frequency peak.
- According to one embodiment the width parameter of the Gaussian function forming the Gaussian window function is dimensioned to contain at least two periods of the periodic waveform.
- According to one embodiment the periodic waveform is a measurement of one of current and voltage.
- Generally, all terms used in the claims are to be interpreted according to their ordinary meaning in the technical field, unless explicitly defined otherwise herein. All references to "a/an/the element, apparatus, component, means, etc. are to be interpreted openly as referring to at least one instance of the element, apparatus, component, means, etc., unless explicitly stated otherwise. Moreover, any steps of the method presented herein need not necessarily be performed in the described order, unless explicitly stated so.
- The specific embodiments of the inventive concept will now be described, by way of example, with reference to the accompanying drawings, in which:
-
Fig. 1 is a block diagram of an example of a phasor determination system; -
Fig. 2 is a flowchart of a method of determining phasors of a waveform; -
Figs 3a-3b show a Gaussian window function and a selected frequency peak in the frequency domain; -
Fig. 4 shows an example of approximation or curve fitting of a frequency peak in the frequency domain; and -
Fig. 5 shows an example comparing the accuracy of the spectrum of a waveform by the method inFig. 2 with a traditional manner of obtaining the frequency spectrum by means of Fourier transform. - The inventive concept will now be described more fully hereinafter with reference to the accompanying drawings, in which exemplifying embodiments are shown. The inventive concept may, however, be embodied in many different forms and should not be construed as limited to the embodiments set forth herein; rather, these embodiments are provided by way of example so that this disclosure will be thorough and complete, and will fully convey the scope of the inventive concept to those skilled in the art. Like numbers refer to like elements throughout the description.
-
Fig. 1 shows an example ofphasor determination system 1 configured to determine phasor components of a periodic waveform. Phasor components are features that define a waveform, and these are amplitude, frequency and phase. - The
phasor determination system 1 comprisesprocessing circuitry 3. Thephasor determination system 1 may according to one variation furthermore comprise astorage medium 5. - The
processing circuitry 3 uses any combination of one or more of a suitable central processing unit (CPU), multiprocessor, microcontroller, digital signal processor (DSP), application specific integrated circuit (ASIC), field programmable gate arrays (FPGA) etc., capable of executing any herein disclosed operations, or steps. - Particularly, the
processing circuitry 3 is configured to cause thephasor determination system 1 to perform a set of operations, or steps, a)-d). These operations, or steps, a)-d) will be disclosed below. For example, thestorage medium 5 may store the set of operations, and theprocessing circuitry 3 may be configured to retrieve the set of operations from thestorage medium 5 to cause thephasor determination system 1 to perform the set of operations. Alternatively, theprocessing circuitry 3 may be configured to by itself cause thephasor determination system 1 to perform the set of operations. The set of operations may be provided as a set of executable instructions. - Thus the
processing circuitry 3 is thereby arranged to execute methods as herein disclosed. Thestorage medium 5 may also comprise persistent storage, which, for example, can be any single one or combination of magnetic memory, optical memory, solid state memory or even remotely mounted memory. - With reference to
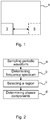
Fig. 2 , a method of determining or estimating phasors of a periodic waveform will now be described. - In a step a) the
processing circuitry 3 is configured to sample the periodic waveform. - The periodic waveform is obtained from a measurement of a signal. To this end, the periodic waveform may be measured by means of a waveform measurement sensor and provided to the
processing circuitry 3. Thephasor determination system 1 may therefore also comprise a waveform measurement sensor operatively connected to theprocessing circuitry 3. - Although the present method provides higher accuracy than existing methods for any number of samples, it is beneficial to use as high sample frequency as possible for any fixed Gaussian window function width.
- The Gaussian window function may be defined by the Gaussian function e^(-((t-T0/2)/tw)^2), where tw is the width parameter of the Gaussian window function and T0/2 is the centre of the Gaussian window function. The Gaussian window function is thus centred at the middle of the analysed/sampled periodic waveform of duration T0.
- In a step b) the
processing circuitry 2 is configured to determine a frequency spectrum of the sampled periodic waveform by means of a frequency transform, utilizing aGaussian window function 7. The ratio np defined by the duration T0 of the sampling of the periodic waveform divided by the width parameter tw of the Gaussian window function is at least 5. This frequency transform is beneficially a discrete Fourier transformation, for example a fast Fourier transform (FFT). - In a step c) a region of the frequency spectrum containing a frequency peak defined by a group of consecutive frequency bins, each being defined by a frequency value and a magnitude value, is selected. This selection may for example be obtained by the
processing circuitry 3 by identifying a region of the frequency spectrum which has a pronounced frequency peak. - In step d) phasor components of the periodic waveform are determined based on the group of consecutive frequency bins.
- According to one variation step d) involves estimating an amplitude of the frequency peak and a frequency of the frequency peak by adapting the amplitude and frequency of a Gaussian function that is based on the Fourier transform of the Gaussian window function to fit the group of consecutive frequency bins. The Gaussian function which is based on the Fourier transform of the Gaussian window function is hence fitted to the frequency peak by varying the amplitude and the frequency parameters of this Gaussian function.
- Here, the best fit may be obtained by minimising the difference between the frequency bin amplitude values and the corresponding Gaussian function values.
- By means of step d) a very accurate estimation of the amplitude and frequency of the frequency peak may be obtained.
- Beneficially, since the Gaussian function is so well-suited for approximating the frequency peak due to the utilisation of the Gaussian window function, a plurality of frequency bins, for example at least five, at least ten, or at least 15-20 frequency bins of the group of frequency bins, may be utilised in the approximation procedure. Thereby a better curve fit may be obtained, resulting in a more accurate estimation of the frequency and amplitude of the frequency peak.
- The Fourier transform of the Gaussian window function is of the form exp((-1/4)ω2tw 2). The Gaussian function utilised for approximating the frequency peak herein is based on the Fourier transform of the Gaussian and may for example be of the form A0∗exp(-(π(f-f0)tw)^2), where A0 is the amplitude and f0 is the frequency of the frequency peak, and where ω has been replaced with 2π(f-f0) because of the transition from angular velocity to frequency and to describe a peak at frequency f0. The values of the amplitude A0 and the frequency f0 are hence varied and the amplitude value A0, and corresponding frequency value f0, of that Gaussian function which minimises the difference between the amplitude of the Gaussian function and the frequency bin magnitude values are selected. The amplitude and frequency of the frequency peak is thereby determined. In particular, the amplitude and frequency of the frequency peak is thereby determined with an accuracy that is determined by the magnitude of the noise.
- The method can be carried out for multiple frequency peaks of the frequency spectrum such that essentially the entire spectrum, i.e. all frequencies, of the periodic waveform may be determined or estimated in an accurate manner. Thus, generally step d) is carried out for each selected frequency peak, i.e. pronounced peak, of the frequency spectrum.
- The phase of the frequency peak for which the amplitude and frequency has been determined in step d) may according to one variation of the method also be determined. The phase may be determined based on the phase of at least some of the frequency bins that define the selected frequency peak. Each frequency bin is a component of a complex-valued sequence obtained by the frequency transform and each frequency bin is thus associated with a respective amplitude and phase. By interpolating between these phases, the frequency peak phase, i.e. the phase of the frequency peak obtained by determining the maximum of the Gaussian function and the corresponding frequency is step d), can be determined.
-
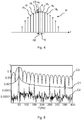
Fig. 3a shows an example of aGaussian window function 7 and a periodic waveform 8. The width parameter tw is indicated in this figure, as is the duration T0 of the sampling of the periodic waveform. As previously mentioned, the factor np defined by the ratio np=T0/tw, may according to one variation be at least 5. Preferably, np is in the range 6-7, but np could also be greater than 7, for example 8, 9, 10 or even greater than that. The larger the value of np, the better spill suppression in the frequency domain may be obtained. np determines the width of the frequency peak and the spill level. - In
Fig. 3b , the spill level is shown below a frequency peak. As can be seen, the height of the frequency peak is dependent of the ratio np=T0/tw, and so is the width of the frequency peak. The width of the frequency peak is found by theratio 
-
Fig. 4 shows an example of a frequency peak P defined by a group of frequency bins H0-H6. Each frequency bin H0-H6 has a respective magnitude value and frequency value. By means of step d) of the method, the shape of the frequency peak P can be approximated by a Gaussian function, as schematically shown with the dashed line. In this way, the amplitude of the Gaussian function approximating the frequency peak P can be obtained. Furthermore, as can be understood fromFig. 4 , the amplitude A as well as the frequency f0 provides a more accurate estimation of the actual amplitude and frequency of the particular frequency peak, shown by the difference d1 in amplitude between frequency bins H3/H4 provided by the frequency transform and the amplitude A, and the difference d2 between the frequency of e.g. frequency bin H3 and the estimated frequency f0. -
Fig. 5 shows a comparison between a first curve C1 of a frequency spectrum determined by means of a long record rectangular window, and a second curve C2 which is the frequency spectrum determined by means of the method presented herein. A third curve C3 shows two periods of an FFT. As can be seen, the second curve C2 is much more detailed than the first curve C1. - The method presented herein may be used for a number of applications. One field of use is within electrical or electronic measurements, for example for impedance measurements, including upstream impedance measurements, dielectric response, transformer monitoring, generator protection, and on-line cable diagnostics.
- The inventive concept has mainly been described above with reference to a few examples. However, as is readily appreciated by a person skilled in the art, other embodiments than the ones disclosed above are equally possible within the scope of the inventive concept, as defined by the appended claims.
Claims (14)
- A method of determining phasor components of a periodic waveform, wherein the method comprises:a) sampling the periodic waveform,b) determining a frequency spectrum of the sampled periodic waveform by means of a frequency transform utilizing a Gaussian window (7), wherein a ratio np defined by the duration (T0) of the sampling of the periodic waveform divided by the width (tw) of the Gaussian window is at least 5, where the Gaussian window is defined by the Gaussian function e^(-((t-T0/2)/tw)^2), where tw is the width of the Gaussian window and T0 is the duration of the sampling of the periodic waveform,c) selecting a region of the frequency spectrum containing a frequency peak (P) defined by a group of consecutive frequency bins (H0-H6) each being defined by a frequency value and a magnitude value, andd) determining phasor components of the periodic waveform based on the group of consecutive frequency bins (H0-H6).
- The method as claimed in claim 1, wherein step d) involves estimating an amplitude of the frequency peak and a frequency of the frequency peak by adapting the amplitude and frequency of a Gaussian function that is based on the Fourier transform of the Gaussian window to fit the group of consecutive frequency bins.
- The method as claimed in any of the preceding claims, comprising obtaining a respective phase, provided by the frequency transform, of at least some of the frequency bins (H0-H6), and interpolating between the phases to determine a frequency peak phase, which is the phase of the frequency peak.
- The method as claimed in any of the preceding claims, wherein the width (tw) of the Gaussian function forming the Gaussian window is dimensioned to contain at least two periods of the periodic waveform (8).
- The method as claimed in any of the preceding claims, wherein the group of frequency bins (H0-H6) contains at least five frequency bins.
- The method as claimed in any of the preceding claims, wherein the frequency transform is a discrete Fourier transform.
- The method as claimed in any of the preceding claims, wherein the periodic waveform (8) is a measurement of one of voltage and current.
- A computer program for determining phasors of a periodic waveform, the computer program comprising computer code, which when run on a processing unit of a phasor determination system causes the phasor determination system to: sample the periodic waveform, determine a frequency spectrum of the sampled periodic waveform by means of a frequency transform utilizing a Gaussian window (7), wherein a ratio np defined by the duration (T0) of the sampling of the periodic waveform divided by the width (tw) of the Gaussian window (7) is at least 5, where the Gaussian window is defined by the Gaussian function e^(-((t-T0/2)/tw)^2), where tw is the width of the Gaussian window and T0 is the duration of the sampling of the periodic waveform, select a region of the frequency spectrum containing a frequency peak (P) defined by a group of consecutive frequency bins (H0-H6) each being defined by a frequency value and a magnitude value, and to determine phasor components of the periodic waveform based on the group of consecutive frequency bins (H0-H6).
- A computer program product comprising a computer program according to claim 8, and a computer-readable medium on which the computer program is stored.
- A phasor determination system (1) configured to determine phasors of a periodic waveform, comprising:
processing circuitry (3) configured to:sample the periodic waveform,determine a frequency spectrum of the sampled periodic waveform by means of a frequency transform utilizing a Gaussian window (7), wherein a ratio np defined by the duration (T0) of the sampling of the periodic waveform divided by the width (tw) of the Gaussian window is at least 5, where the Gaussian window is defined by the Gaussian function e^(-((t-T0/2)/tw)^2), where tw is the width of the Gaussian window and T0 is the duration of the sampling of the periodic waveform,select a region of the frequency spectrum containing a frequency peak (P) defined by a group of consecutive frequency bins (H0-H6) each being defined by a frequency value and a magnitude value, anddetermine phasor components of the periodic waveform based on the group of consecutive frequency bins (H0-H6). - The phasor determination system as claimed in claim 10, wherein the processing circuitry is configured to determine phasor components by estimating an amplitude of the frequency peak and a frequency of the frequency peak by adapting the amplitude and frequency of a Gaussian function that is based on the Fourier transform of the Gaussian window to fit the group of consecutive frequency bins.
- The phasor determination system (1) as claimed in claim 10 or 11, wherein the processing circuitry (3) is configured to obtain a respective phase, provided by the frequency transform, of at least some of the frequency bins (H0-H6), and interpolating between the phases to determine a frequency peak phase.
- The phasor determination system (1) as claimed in any of claims 10-12, wherein width (tw) of the Gaussian function forming the Gaussian window is dimensioned to contain at least two periods of the periodic waveform (8).
- The phasor determination system (1) as claimed in any of claims 10-13, wherein the periodic waveform (8) is a measurement of one of current and voltage.
Applications Claiming Priority (2)
| Application Number | Priority Date | Filing Date | Title |
|---|---|---|---|
| EP15188598.5A EP3153872A1 (en) | 2015-10-06 | 2015-10-06 | Method and system for determining phasor components of a periodic waveform |
| PCT/EP2016/073725 WO2017060265A1 (en) | 2015-10-06 | 2016-10-05 | Method and system for determining phasor components of a periodic waveform |
Publications (2)
| Publication Number | Publication Date |
|---|---|
| EP3359972A1 EP3359972A1 (en) | 2018-08-15 |
| EP3359972B1 true EP3359972B1 (en) | 2019-08-07 |
Family
ID=54292611
Family Applications (2)
| Application Number | Title | Priority Date | Filing Date |
|---|---|---|---|
| EP15188598.5A Withdrawn EP3153872A1 (en) | 2015-10-06 | 2015-10-06 | Method and system for determining phasor components of a periodic waveform |
| EP16777984.2A Active EP3359972B1 (en) | 2015-10-06 | 2016-10-05 | Method and system for determining phasor components of a periodic waveform |
Family Applications Before (1)
| Application Number | Title | Priority Date | Filing Date |
|---|---|---|---|
| EP15188598.5A Withdrawn EP3153872A1 (en) | 2015-10-06 | 2015-10-06 | Method and system for determining phasor components of a periodic waveform |
Country Status (6)
| Country | Link |
|---|---|
| US (1) | US10309995B2 (en) |
| EP (2) | EP3153872A1 (en) |
| CN (1) | CN108139435B (en) |
| BR (1) | BR112018005347B1 (en) |
| CA (1) | CA3001168C (en) |
| WO (1) | WO2017060265A1 (en) |
Families Citing this family (1)
| Publication number | Priority date | Publication date | Assignee | Title |
|---|---|---|---|---|
| EP3961843A1 (en) | 2020-09-01 | 2022-03-02 | Hitachi Energy Switzerland AG | Providing a frequency of an electrical quantity in an electrical power system |
Family Cites Families (11)
| Publication number | Priority date | Publication date | Assignee | Title |
|---|---|---|---|---|
| GB2232494B (en) * | 1989-05-24 | 1993-01-27 | Marconi Instruments Ltd | Frequency spectrum determination using interpolation |
| US5353233A (en) * | 1992-03-17 | 1994-10-04 | National Instruments, Inc. | Method and apparatus for time varying spectrum analysis |
| US20110093225A1 (en) * | 2009-10-20 | 2011-04-21 | Ramesh P E | Method of making frequency domain measurements on a time domain instrument |
| CA2699596A1 (en) * | 2010-03-24 | 2011-09-24 | Hydro-Quebec | System and method of phase synchronization of signals produced by respective units of measure |
| US10060957B2 (en) * | 2010-07-29 | 2018-08-28 | Power Monitors, Inc. | Method and apparatus for a cloud-based power quality monitor |
| US8489351B2 (en) * | 2010-09-30 | 2013-07-16 | Schneider Electric USA, Inc. | System and method for frequency measurement based on quadratic forms |
| CN102539915B (en) | 2012-01-06 | 2013-10-30 | 中国矿业大学 | Method for accurately calculating power harmonic wave parameters through adopting time delay Fourier transform frequency measurement method |
| CN102565627A (en) | 2012-01-17 | 2012-07-11 | 上海交通大学 | A Double-terminal Ranging Method Based on Windowed Lifting Wavelet Transform |
| CN202975110U (en) | 2012-11-28 | 2013-06-05 | 珠海思创电气有限公司 | Electrical parameter measurement module |
| FI124421B (en) | 2013-08-16 | 2014-08-29 | Arcteq Relays Oy | Procedures and systems for measuring quantities in an AC system |
| CN104714075B (en) * | 2015-02-05 | 2017-06-30 | 湖南大学 | A kind of electric network voltage flicker envelope parameters extracting method |
-
2015
- 2015-10-06 EP EP15188598.5A patent/EP3153872A1/en not_active Withdrawn
-
2016
- 2016-10-05 CA CA3001168A patent/CA3001168C/en active Active
- 2016-10-05 BR BR112018005347-3A patent/BR112018005347B1/en active IP Right Grant
- 2016-10-05 EP EP16777984.2A patent/EP3359972B1/en active Active
- 2016-10-05 CN CN201680058471.5A patent/CN108139435B/en active Active
- 2016-10-05 US US15/766,718 patent/US10309995B2/en active Active
- 2016-10-05 WO PCT/EP2016/073725 patent/WO2017060265A1/en not_active Ceased
Non-Patent Citations (1)
| Title |
|---|
| None * |
Also Published As
| Publication number | Publication date |
|---|---|
| BR112018005347A2 (en) | 2018-10-09 |
| CA3001168C (en) | 2018-10-23 |
| EP3359972A1 (en) | 2018-08-15 |
| CA3001168A1 (en) | 2017-04-13 |
| WO2017060265A1 (en) | 2017-04-13 |
| US10309995B2 (en) | 2019-06-04 |
| BR112018005347B1 (en) | 2023-03-07 |
| US20180321290A1 (en) | 2018-11-08 |
| EP3153872A1 (en) | 2017-04-12 |
| CN108139435A (en) | 2018-06-08 |
| CN108139435B (en) | 2020-01-31 |
| BR112018005347A8 (en) | 2022-12-20 |
Similar Documents
| Publication | Publication Date | Title |
|---|---|---|
| Wen et al. | Frequency estimation of distorted and noisy signals in power systems by FFT-based approach | |
| US10942210B2 (en) | Reflected-wave processing apparatus | |
| CN100353169C (en) | Method for testing electronic component and its instrument | |
| CN108664901B (en) | Detection method of power quality disturbance signal in microgrid based on improved LMD | |
| CN103995178A (en) | Voltage sag detection method for S-transformation on basis of time-frequency gathering characteristic criteria | |
| Chen et al. | Virtual instrumentation and educational platform for time-varying harmonic and interharmonic detection | |
| Grillo et al. | An efficient extension of the zero-crossing technique to measure frequency of noisy signals | |
| US5528134A (en) | AC power analyzer | |
| Ramos et al. | Comparison of frequency estimation algorithms for power quality assessment | |
| TWI405979B (en) | Probability density function separating apparatus, probability density function separating method, noise separating apparatus, noise separating method, testing apparatus, testing method, calculating apparatus, calculating method, program, and recording m | |
| CN113917226A (en) | A voltage sag detection method and system based on threshold detection and windowed interpolation FFT | |
| RU2363005C1 (en) | Method of spectral analysis of polyharmonic signals and device to this end | |
| CA3001168C (en) | Method and system for determining phasor components of a periodic waveform | |
| Minzhong et al. | Error analysis for dielectric loss factor measurement based on harmonic analysis | |
| EP4597140A1 (en) | Monitoring module and method of monitoring performance degradation of capacitor | |
| Mendonça et al. | Variable window length applied to a modified Hanning filter for optimal amplitude estimation of power systems signals | |
| Aiello et al. | A comparison of spectrum estimation techniques for nonstationary signals in induction motor drive measurements | |
| JP3650767B2 (en) | Jitter measuring apparatus, jitter measuring method, and test apparatus | |
| D'Elia et al. | Software customization to provide digital oscilloscope with enhanced period-measurement features | |
| Bracale et al. | A New, Sliding-Window Prony and DFT Scheme for the Calculation of Power-Quality Indices in the Presence of Non-stationary Waveforms. | |
| Lin et al. | Novel complex filter with recursive algorithm for phasor computation in power-quality monitoring | |
| Agrež et al. | Estimation of the power quality changing parameters using DFT coefficients | |
| Zhang et al. | Dielectric loss angle measurement method based on frequency-shift filtering reconstruction and phase difference correction | |
| JPH09325164A (en) | Insulator loss current measurement method | |
| CN109948111A (en) | A kind of EMI receiver wave detector model based on discrete mathematics |
Legal Events
| Date | Code | Title | Description |
|---|---|---|---|
| STAA | Information on the status of an ep patent application or granted ep patent |
Free format text: STATUS: UNKNOWN |
|
| STAA | Information on the status of an ep patent application or granted ep patent |
Free format text: STATUS: THE INTERNATIONAL PUBLICATION HAS BEEN MADE |
|
| PUAI | Public reference made under article 153(3) epc to a published international application that has entered the european phase |
Free format text: ORIGINAL CODE: 0009012 |
|
| STAA | Information on the status of an ep patent application or granted ep patent |
Free format text: STATUS: REQUEST FOR EXAMINATION WAS MADE |
|
| 17P | Request for examination filed |
Effective date: 20180507 |
|
| AK | Designated contracting states |
Kind code of ref document: A1 Designated state(s): AL AT BE BG CH CY CZ DE DK EE ES FI FR GB GR HR HU IE IS IT LI LT LU LV MC MK MT NL NO PL PT RO RS SE SI SK SM TR |
|
| AX | Request for extension of the european patent |
Extension state: BA ME |
|
| DAV | Request for validation of the european patent (deleted) | ||
| DAX | Request for extension of the european patent (deleted) | ||
| GRAP | Despatch of communication of intention to grant a patent |
Free format text: ORIGINAL CODE: EPIDOSNIGR1 |
|
| STAA | Information on the status of an ep patent application or granted ep patent |
Free format text: STATUS: GRANT OF PATENT IS INTENDED |
|
| INTG | Intention to grant announced |
Effective date: 20190412 |
|
| GRAS | Grant fee paid |
Free format text: ORIGINAL CODE: EPIDOSNIGR3 |
|
| GRAA | (expected) grant |
Free format text: ORIGINAL CODE: 0009210 |
|
| STAA | Information on the status of an ep patent application or granted ep patent |
Free format text: STATUS: THE PATENT HAS BEEN GRANTED |
|
| AK | Designated contracting states |
Kind code of ref document: B1 Designated state(s): AL AT BE BG CH CY CZ DE DK EE ES FI FR GB GR HR HU IE IS IT LI LT LU LV MC MK MT NL NO PL PT RO RS SE SI SK SM TR |
|
| REG | Reference to a national code |
Ref country code: GB Ref legal event code: FG4D |
|
| REG | Reference to a national code |
Ref country code: CH Ref legal event code: EP Ref country code: AT Ref legal event code: REF Ref document number: 1164671 Country of ref document: AT Kind code of ref document: T Effective date: 20190815 |
|
| REG | Reference to a national code |
Ref country code: DE Ref legal event code: R096 Ref document number: 602016018286 Country of ref document: DE |
|
| REG | Reference to a national code |
Ref country code: IE Ref legal event code: FG4D |
|
| REG | Reference to a national code |
Ref country code: NL Ref legal event code: MP Effective date: 20190807 |
|
| REG | Reference to a national code |
Ref country code: LT Ref legal event code: MG4D |
|
| PG25 | Lapsed in a contracting state [announced via postgrant information from national office to epo] |
Ref country code: LT Free format text: LAPSE BECAUSE OF FAILURE TO SUBMIT A TRANSLATION OF THE DESCRIPTION OR TO PAY THE FEE WITHIN THE PRESCRIBED TIME-LIMIT Effective date: 20190807 Ref country code: HR Free format text: LAPSE BECAUSE OF FAILURE TO SUBMIT A TRANSLATION OF THE DESCRIPTION OR TO PAY THE FEE WITHIN THE PRESCRIBED TIME-LIMIT Effective date: 20190807 Ref country code: BG Free format text: LAPSE BECAUSE OF FAILURE TO SUBMIT A TRANSLATION OF THE DESCRIPTION OR TO PAY THE FEE WITHIN THE PRESCRIBED TIME-LIMIT Effective date: 20191107 Ref country code: NL Free format text: LAPSE BECAUSE OF FAILURE TO SUBMIT A TRANSLATION OF THE DESCRIPTION OR TO PAY THE FEE WITHIN THE PRESCRIBED TIME-LIMIT Effective date: 20190807 Ref country code: PT Free format text: LAPSE BECAUSE OF FAILURE TO SUBMIT A TRANSLATION OF THE DESCRIPTION OR TO PAY THE FEE WITHIN THE PRESCRIBED TIME-LIMIT Effective date: 20191209 Ref country code: NO Free format text: LAPSE BECAUSE OF FAILURE TO SUBMIT A TRANSLATION OF THE DESCRIPTION OR TO PAY THE FEE WITHIN THE PRESCRIBED TIME-LIMIT Effective date: 20191107 Ref country code: SE Free format text: LAPSE BECAUSE OF FAILURE TO SUBMIT A TRANSLATION OF THE DESCRIPTION OR TO PAY THE FEE WITHIN THE PRESCRIBED TIME-LIMIT Effective date: 20190807 Ref country code: FI Free format text: LAPSE BECAUSE OF FAILURE TO SUBMIT A TRANSLATION OF THE DESCRIPTION OR TO PAY THE FEE WITHIN THE PRESCRIBED TIME-LIMIT Effective date: 20190807 |
|
| REG | Reference to a national code |
Ref country code: AT Ref legal event code: MK05 Ref document number: 1164671 Country of ref document: AT Kind code of ref document: T Effective date: 20190807 |
|
| PG25 | Lapsed in a contracting state [announced via postgrant information from national office to epo] |
Ref country code: RS Free format text: LAPSE BECAUSE OF FAILURE TO SUBMIT A TRANSLATION OF THE DESCRIPTION OR TO PAY THE FEE WITHIN THE PRESCRIBED TIME-LIMIT Effective date: 20190807 Ref country code: GR Free format text: LAPSE BECAUSE OF FAILURE TO SUBMIT A TRANSLATION OF THE DESCRIPTION OR TO PAY THE FEE WITHIN THE PRESCRIBED TIME-LIMIT Effective date: 20191108 Ref country code: IS Free format text: LAPSE BECAUSE OF FAILURE TO SUBMIT A TRANSLATION OF THE DESCRIPTION OR TO PAY THE FEE WITHIN THE PRESCRIBED TIME-LIMIT Effective date: 20191207 Ref country code: AL Free format text: LAPSE BECAUSE OF FAILURE TO SUBMIT A TRANSLATION OF THE DESCRIPTION OR TO PAY THE FEE WITHIN THE PRESCRIBED TIME-LIMIT Effective date: 20190807 Ref country code: ES Free format text: LAPSE BECAUSE OF FAILURE TO SUBMIT A TRANSLATION OF THE DESCRIPTION OR TO PAY THE FEE WITHIN THE PRESCRIBED TIME-LIMIT Effective date: 20190807 Ref country code: LV Free format text: LAPSE BECAUSE OF FAILURE TO SUBMIT A TRANSLATION OF THE DESCRIPTION OR TO PAY THE FEE WITHIN THE PRESCRIBED TIME-LIMIT Effective date: 20190807 |
|
| PG25 | Lapsed in a contracting state [announced via postgrant information from national office to epo] |
Ref country code: TR Free format text: LAPSE BECAUSE OF FAILURE TO SUBMIT A TRANSLATION OF THE DESCRIPTION OR TO PAY THE FEE WITHIN THE PRESCRIBED TIME-LIMIT Effective date: 20190807 |
|
| PG25 | Lapsed in a contracting state [announced via postgrant information from national office to epo] |
Ref country code: AT Free format text: LAPSE BECAUSE OF FAILURE TO SUBMIT A TRANSLATION OF THE DESCRIPTION OR TO PAY THE FEE WITHIN THE PRESCRIBED TIME-LIMIT Effective date: 20190807 Ref country code: EE Free format text: LAPSE BECAUSE OF FAILURE TO SUBMIT A TRANSLATION OF THE DESCRIPTION OR TO PAY THE FEE WITHIN THE PRESCRIBED TIME-LIMIT Effective date: 20190807 Ref country code: DK Free format text: LAPSE BECAUSE OF FAILURE TO SUBMIT A TRANSLATION OF THE DESCRIPTION OR TO PAY THE FEE WITHIN THE PRESCRIBED TIME-LIMIT Effective date: 20190807 Ref country code: RO Free format text: LAPSE BECAUSE OF FAILURE TO SUBMIT A TRANSLATION OF THE DESCRIPTION OR TO PAY THE FEE WITHIN THE PRESCRIBED TIME-LIMIT Effective date: 20190807 Ref country code: PL Free format text: LAPSE BECAUSE OF FAILURE TO SUBMIT A TRANSLATION OF THE DESCRIPTION OR TO PAY THE FEE WITHIN THE PRESCRIBED TIME-LIMIT Effective date: 20190807 |
|
| PG25 | Lapsed in a contracting state [announced via postgrant information from national office to epo] |
Ref country code: SM Free format text: LAPSE BECAUSE OF FAILURE TO SUBMIT A TRANSLATION OF THE DESCRIPTION OR TO PAY THE FEE WITHIN THE PRESCRIBED TIME-LIMIT Effective date: 20190807 Ref country code: IS Free format text: LAPSE BECAUSE OF FAILURE TO SUBMIT A TRANSLATION OF THE DESCRIPTION OR TO PAY THE FEE WITHIN THE PRESCRIBED TIME-LIMIT Effective date: 20200224 Ref country code: SK Free format text: LAPSE BECAUSE OF FAILURE TO SUBMIT A TRANSLATION OF THE DESCRIPTION OR TO PAY THE FEE WITHIN THE PRESCRIBED TIME-LIMIT Effective date: 20190807 Ref country code: MC Free format text: LAPSE BECAUSE OF FAILURE TO SUBMIT A TRANSLATION OF THE DESCRIPTION OR TO PAY THE FEE WITHIN THE PRESCRIBED TIME-LIMIT Effective date: 20190807 Ref country code: CZ Free format text: LAPSE BECAUSE OF FAILURE TO SUBMIT A TRANSLATION OF THE DESCRIPTION OR TO PAY THE FEE WITHIN THE PRESCRIBED TIME-LIMIT Effective date: 20190807 |
|
| REG | Reference to a national code |
Ref country code: CH Ref legal event code: PL |
|
| REG | Reference to a national code |
Ref country code: DE Ref legal event code: R097 Ref document number: 602016018286 Country of ref document: DE |
|
| PLBE | No opposition filed within time limit |
Free format text: ORIGINAL CODE: 0009261 |
|
| STAA | Information on the status of an ep patent application or granted ep patent |
Free format text: STATUS: NO OPPOSITION FILED WITHIN TIME LIMIT |
|
| PG2D | Information on lapse in contracting state deleted |
Ref country code: IS |
|
| PG25 | Lapsed in a contracting state [announced via postgrant information from national office to epo] |
Ref country code: CH Free format text: LAPSE BECAUSE OF NON-PAYMENT OF DUE FEES Effective date: 20191031 Ref country code: LI Free format text: LAPSE BECAUSE OF NON-PAYMENT OF DUE FEES Effective date: 20191031 Ref country code: LU Free format text: LAPSE BECAUSE OF NON-PAYMENT OF DUE FEES Effective date: 20191005 |
|
| 26N | No opposition filed |
Effective date: 20200603 |
|
| REG | Reference to a national code |
Ref country code: BE Ref legal event code: MM Effective date: 20191031 |
|
| PG25 | Lapsed in a contracting state [announced via postgrant information from national office to epo] |
Ref country code: SI Free format text: LAPSE BECAUSE OF FAILURE TO SUBMIT A TRANSLATION OF THE DESCRIPTION OR TO PAY THE FEE WITHIN THE PRESCRIBED TIME-LIMIT Effective date: 20190807 Ref country code: BE Free format text: LAPSE BECAUSE OF NON-PAYMENT OF DUE FEES Effective date: 20191031 |
|
| PG25 | Lapsed in a contracting state [announced via postgrant information from national office to epo] |
Ref country code: IE Free format text: LAPSE BECAUSE OF NON-PAYMENT OF DUE FEES Effective date: 20191005 |
|
| REG | Reference to a national code |
Ref country code: DE Ref legal event code: R081 Ref document number: 602016018286 Country of ref document: DE Owner name: HITACHI ENERGY SWITZERLAND AG, CH Free format text: FORMER OWNER: ABB SCHWEIZ AG, BADEN, CH Ref country code: DE Ref legal event code: R081 Ref document number: 602016018286 Country of ref document: DE Owner name: HITACHI ENERGY LTD, CH Free format text: FORMER OWNER: ABB SCHWEIZ AG, BADEN, CH Ref country code: DE Ref legal event code: R081 Ref document number: 602016018286 Country of ref document: DE Owner name: ABB POWER GRIDS SWITZERLAND AG, CH Free format text: FORMER OWNER: ABB SCHWEIZ AG, BADEN, CH |
|
| PG25 | Lapsed in a contracting state [announced via postgrant information from national office to epo] |
Ref country code: CY Free format text: LAPSE BECAUSE OF FAILURE TO SUBMIT A TRANSLATION OF THE DESCRIPTION OR TO PAY THE FEE WITHIN THE PRESCRIBED TIME-LIMIT Effective date: 20190807 |
|
| PG25 | Lapsed in a contracting state [announced via postgrant information from national office to epo] |
Ref country code: MT Free format text: LAPSE BECAUSE OF FAILURE TO SUBMIT A TRANSLATION OF THE DESCRIPTION OR TO PAY THE FEE WITHIN THE PRESCRIBED TIME-LIMIT Effective date: 20190807 Ref country code: HU Free format text: LAPSE BECAUSE OF FAILURE TO SUBMIT A TRANSLATION OF THE DESCRIPTION OR TO PAY THE FEE WITHIN THE PRESCRIBED TIME-LIMIT; INVALID AB INITIO Effective date: 20161005 |
|
| REG | Reference to a national code |
Ref country code: GB Ref legal event code: 732E Free format text: REGISTERED BETWEEN 20211104 AND 20211110 |
|
| REG | Reference to a national code |
Ref country code: DE Ref legal event code: R081 Ref document number: 602016018286 Country of ref document: DE Owner name: HITACHI ENERGY SWITZERLAND AG, CH Free format text: FORMER OWNER: ABB POWER GRIDS SWITZERLAND AG, BADEN, CH Ref country code: DE Ref legal event code: R081 Ref document number: 602016018286 Country of ref document: DE Owner name: HITACHI ENERGY LTD, CH Free format text: FORMER OWNER: ABB POWER GRIDS SWITZERLAND AG, BADEN, CH |
|
| PG25 | Lapsed in a contracting state [announced via postgrant information from national office to epo] |
Ref country code: MK Free format text: LAPSE BECAUSE OF FAILURE TO SUBMIT A TRANSLATION OF THE DESCRIPTION OR TO PAY THE FEE WITHIN THE PRESCRIBED TIME-LIMIT Effective date: 20190807 |
|
| P01 | Opt-out of the competence of the unified patent court (upc) registered |
Effective date: 20230527 |
|
| REG | Reference to a national code |
Ref country code: DE Ref legal event code: R082 Ref document number: 602016018286 Country of ref document: DE Representative=s name: DENNEMEYER & ASSOCIATES RECHTSANWALTSGESELLSCH, DE Ref country code: DE Ref legal event code: R082 Ref document number: 602016018286 Country of ref document: DE Representative=s name: DENNEMEYER & ASSOCIATES S.A., DE Ref country code: DE Ref legal event code: R081 Ref document number: 602016018286 Country of ref document: DE Owner name: HITACHI ENERGY LTD, CH Free format text: FORMER OWNER: HITACHI ENERGY SWITZERLAND AG, BADEN, CH |
|
| REG | Reference to a national code |
Ref country code: GB Ref legal event code: 732E Free format text: REGISTERED BETWEEN 20240718 AND 20240724 |
|
| REG | Reference to a national code |
Ref country code: DE Ref legal event code: R082 Ref document number: 602016018286 Country of ref document: DE Representative=s name: DENNEMEYER & ASSOCIATES RECHTSANWALTSGESELLSCH, DE |
|
| PGFP | Annual fee paid to national office [announced via postgrant information from national office to epo] |
Ref country code: DE Payment date: 20251021 Year of fee payment: 10 |
|
| PGFP | Annual fee paid to national office [announced via postgrant information from national office to epo] |
Ref country code: GB Payment date: 20251022 Year of fee payment: 10 |
|
| PGFP | Annual fee paid to national office [announced via postgrant information from national office to epo] |
Ref country code: IT Payment date: 20251024 Year of fee payment: 10 |
|
| PGFP | Annual fee paid to national office [announced via postgrant information from national office to epo] |
Ref country code: FR Payment date: 20251030 Year of fee payment: 10 |