EP3358440A1 - System and method of determining whether an electronic device is in contact with a human body - Google Patents
System and method of determining whether an electronic device is in contact with a human body Download PDFInfo
- Publication number
- EP3358440A1 EP3358440A1 EP18154723.3A EP18154723A EP3358440A1 EP 3358440 A1 EP3358440 A1 EP 3358440A1 EP 18154723 A EP18154723 A EP 18154723A EP 3358440 A1 EP3358440 A1 EP 3358440A1
- Authority
- EP
- European Patent Office
- Prior art keywords
- electronic device
- energy
- motion signal
- filter
- contact
- Prior art date
- Legal status (The legal status is an assumption and is not a legal conclusion. Google has not performed a legal analysis and makes no representation as to the accuracy of the status listed.)
- Withdrawn
Links
Images




Classifications
-
- G—PHYSICS
- G06—COMPUTING OR CALCULATING; COUNTING
- G06F—ELECTRIC DIGITAL DATA PROCESSING
- G06F1/00—Details not covered by groups G06F3/00 - G06F13/00 and G06F21/00
- G06F1/26—Power supply means, e.g. regulation thereof
- G06F1/32—Means for saving power
- G06F1/3203—Power management, i.e. event-based initiation of a power-saving mode
- G06F1/3234—Power saving characterised by the action undertaken
- G06F1/3296—Power saving characterised by the action undertaken by lowering the supply or operating voltage
-
- G—PHYSICS
- G06—COMPUTING OR CALCULATING; COUNTING
- G06F—ELECTRIC DIGITAL DATA PROCESSING
- G06F3/00—Input arrangements for transferring data to be processed into a form capable of being handled by the computer; Output arrangements for transferring data from processing unit to output unit, e.g. interface arrangements
- G06F3/01—Input arrangements or combined input and output arrangements for interaction between user and computer
- G06F3/03—Arrangements for converting the position or the displacement of a member into a coded form
- G06F3/033—Pointing devices displaced or positioned by the user, e.g. mice, trackballs, pens or joysticks; Accessories therefor
- G06F3/0346—Pointing devices displaced or positioned by the user, e.g. mice, trackballs, pens or joysticks; Accessories therefor with detection of the device orientation or free movement in a three-dimensional [3D] space, e.g. 3D mice, 6-DOF [six degrees of freedom] pointers using gyroscopes, accelerometers or tilt-sensors
-
- G—PHYSICS
- G06—COMPUTING OR CALCULATING; COUNTING
- G06F—ELECTRIC DIGITAL DATA PROCESSING
- G06F1/00—Details not covered by groups G06F3/00 - G06F13/00 and G06F21/00
- G06F1/16—Constructional details or arrangements
- G06F1/1613—Constructional details or arrangements for portable computers
- G06F1/1633—Constructional details or arrangements of portable computers not specific to the type of enclosures covered by groups G06F1/1615 - G06F1/1626
- G06F1/1684—Constructional details or arrangements related to integrated I/O peripherals not covered by groups G06F1/1635 - G06F1/1675
- G06F1/169—Constructional details or arrangements related to integrated I/O peripherals not covered by groups G06F1/1635 - G06F1/1675 the I/O peripheral being an integrated pointing device, e.g. trackball in the palm rest area, mini-joystick integrated between keyboard keys, touch pads or touch stripes
- G06F1/1692—Constructional details or arrangements related to integrated I/O peripherals not covered by groups G06F1/1635 - G06F1/1675 the I/O peripheral being an integrated pointing device, e.g. trackball in the palm rest area, mini-joystick integrated between keyboard keys, touch pads or touch stripes the I/O peripheral being a secondary touch screen used as control interface, e.g. virtual buttons or sliders
-
- G—PHYSICS
- G06—COMPUTING OR CALCULATING; COUNTING
- G06F—ELECTRIC DIGITAL DATA PROCESSING
- G06F1/00—Details not covered by groups G06F3/00 - G06F13/00 and G06F21/00
- G06F1/16—Constructional details or arrangements
- G06F1/20—Cooling means
- G06F1/206—Cooling means comprising thermal management
-
- G—PHYSICS
- G06—COMPUTING OR CALCULATING; COUNTING
- G06F—ELECTRIC DIGITAL DATA PROCESSING
- G06F1/00—Details not covered by groups G06F3/00 - G06F13/00 and G06F21/00
- G06F1/26—Power supply means, e.g. regulation thereof
- G06F1/32—Means for saving power
- G06F1/3203—Power management, i.e. event-based initiation of a power-saving mode
- G06F1/3206—Monitoring of events, devices or parameters that trigger a change in power modality
-
- G—PHYSICS
- G06—COMPUTING OR CALCULATING; COUNTING
- G06F—ELECTRIC DIGITAL DATA PROCESSING
- G06F1/00—Details not covered by groups G06F3/00 - G06F13/00 and G06F21/00
- G06F1/26—Power supply means, e.g. regulation thereof
- G06F1/32—Means for saving power
- G06F1/3203—Power management, i.e. event-based initiation of a power-saving mode
- G06F1/3206—Monitoring of events, devices or parameters that trigger a change in power modality
- G06F1/3231—Monitoring the presence, absence or movement of users
-
- G—PHYSICS
- G06—COMPUTING OR CALCULATING; COUNTING
- G06N—COMPUTING ARRANGEMENTS BASED ON SPECIFIC COMPUTATIONAL MODELS
- G06N20/00—Machine learning
-
- Y—GENERAL TAGGING OF NEW TECHNOLOGICAL DEVELOPMENTS; GENERAL TAGGING OF CROSS-SECTIONAL TECHNOLOGIES SPANNING OVER SEVERAL SECTIONS OF THE IPC; TECHNICAL SUBJECTS COVERED BY FORMER USPC CROSS-REFERENCE ART COLLECTIONS [XRACs] AND DIGESTS
- Y02—TECHNOLOGIES OR APPLICATIONS FOR MITIGATION OR ADAPTATION AGAINST CLIMATE CHANGE
- Y02D—CLIMATE CHANGE MITIGATION TECHNOLOGIES IN INFORMATION AND COMMUNICATION TECHNOLOGIES [ICT], I.E. INFORMATION AND COMMUNICATION TECHNOLOGIES AIMING AT THE REDUCTION OF THEIR OWN ENERGY USE
- Y02D10/00—Energy efficient computing, e.g. low power processors, power management or thermal management
Definitions
- the present invention relates generally to electronic devices, and, in particular, to a system and method of determining whether an electronic device is in contact with a human body.
- One aspect that users often encounter with the use of laptop computers is overheating of the base of the laptop computer.
- Power supply components of laptop computers may be located on the bottom surface of the keyboard portion of the laptop computer.
- the base of the laptop computer can overheat, burn, or cause discomfort to the user if the laptop computer is resting on the user's lap. While elevated temperatures generally do not damage electronics and circuitry of the laptop computer, it can cause harm to human skin.
- wearable electronics A new area for consumer electronic devices that provides individuals with computing capabilities and information on the go is wearable electronics.
- wearable electronics include the smart watch and wireless (e.g. Bluetooth) headphones.
- individuals sometimes wear their cell phones on their person, such as by attaching their cell phone to their body using a resilient sleeve (e.g. an arm or fitness band) during various activities (e.g. while exercising).
- a resilient sleeve e.g. an arm or fitness band
- the electronic device may be in contact (e.g. direct or indirect contact) with human skin.
- the laptop computer in response to a determination that a laptop computer is in contact with a human body, the laptop computer may adapt its behavior or operation to avoid elevated temperatures so that harm to human skin is prevented.
- the wearable electronic device in response to a determination that a wearable electronic device is not in contact with a human body, the wearable electronic device may be placed in a low-power mode in an effort to reduce power consumption and extend battery life.
- a system may include a motion sensor configured to generate a motion signal in response to a movement of an electronic device, and at least one feature detection circuit configured to determine at least one metric based on the motion signal.
- the system may further include a classifying circuit configured to determine whether the electronic device is in contact with a human body based on the at least one metric.
- a system may include an accelerometer configured to generate an output signal in response to a vibration or orientation of an electronic device.
- the system may further include a plurality of feature detection circuits having inputs coupled to an output of the accelerometer, the plurality of feature detection circuits being configured to determine a plurality of metrics indicative of a plurality of characteristics of the output signal.
- the system may additionally include a classifying circuit configured to determine whether the electronic device is in contact with a human body based on the plurality of metrics, and a controller configured to adapt an operation of the electronic device based on whether the electronic device is in contact with the human body.
- a method may include generating a motion signal in response to a movement of an electronic device; determining at least one characteristic of the motion signal; generating at least one metric indicative of the at least one characteristic of the motion signal; and determining whether the electronic device is in contact with a human body based on the at least one metric.
- FIG. 1 shows a block diagram of an electronic device 101 including a detection system 100, in accordance with an embodiment.
- the detection system 100 may be within, attached, or coupled to the electronic device 101.
- the detection system 100 may be used to determine whether the electronic device 101 is in contact with the body of a human user.
- a state monitor 112 e.g. a controller of the detection system 100 or the electronic device 101
- the state monitor 112 may be placed in a low-power mode in an effort to reduce power consumption and extend battery life.
- the electronic device 101 may be a laptop computer or a wearable electronic device (e.g. a smart watch, mobile phone, wireless headphones, or the like).
- the detection system 100 includes a motion sensor 102.
- the motion sensor 102 may be an accelerometer or a device configured to sense vibration or acceleration of the electronic device 101.
- the electronic device 101 having the motion sensor 102 may be a laptop computer having an accelerometer coupled or attached to a base of the laptop computer.
- the electronic device 101 having the motion sensor 102 may be a cell phone having an accelerometer included within the cell phone.
- the detection system 100 may be an accelerometer-based detection system 100.
- the motion sensor 102 may generate time series data, which is depicted in FIG. 1 as sensor data 102x, 102y, 102z.
- FIG. 2 shows sensor data 102x, 102y, 102z generated by the motion sensor 102, in accordance with an embodiment.
- the motion sensor 102 may be configured to sense vibration or acceleration of the electronic device 101 in each axis of motion.
- the motion sensor 102 may generate sensor data 102x, 102y, 102z that is indicative of vibration or acceleration of the electronic device 101 in the lateral axis (e.g. referred to as the "x axis"), longitudinal axis (e.g. referred to as the "y axis”), and vertical or normal axis (e.g. referred to as the "z axis”), respectively.
- the lateral axis e.g
- the sensor data 102x, 102y, 102z may be time series data having a plurality of samples.
- the sensor data 102x, 102y, 102z may be generated by sampling an analog signal sensed by the motion sensor 102.
- the motion sensor 102 may include a sampling circuit therein.
- the sampling circuit may be implemented using one or more sampling circuits known in the art (e.g. a sample-and-hold circuit).
- the sensor data 102x, 102y, 102z is obtained by sampling the analog signal sensed by the motion sensor 102 at a sampling frequency of 50 Hz with a full scale range of ⁇ 2 g.
- the sampling frequency may depend, at least in part, on a characteristic vibration of a human body, which, as described below in respect of FIGS. 4 and 5A to 5E , is between about 5 Hz and about 15 Hz. As such, to fulfill the Nyquist sampling theorem, the rate at which the analog signal of the motion sensor 102 is sampled is greater than or equal to about 30 Hz.
- the sensor data 102x, 102y, 102z generated by the motion sensor 102 may depend, at least in part, on a placement of the electronic device 101, an orientation (e.g. tilt) of the electronic device 101, and the activity performed on or using the electronic device 101.
- the electronic device 101 may be placed on a part of the human body (e.g. a lap) or on an inanimate object (e.g. a desk).
- the sensor data 102x, 102y, 102z generated when the electronic device 101 is placed on a part of the human body may be different from the sensor data 102x, 102y, 102z generated when the electronic device 101 is placed on an inanimate object.
- the electronic device 101 may be flat (e.g. when placed on a flat desk) or inclined with respect to a horizontal plane (e.g. when placed on a human lap).
- the sensor data 102x, 102y, 102z generated when the electronic device 101 is flat may be different from the sensor data 102x, 102y, 102z generated when the electronic device 101 is inclined with respect to a horizontal plane.
- the electronic device 101 may be used for passive activity, normal typing, or intense typing.
- the sensor data 102x, 102y, 102z generated when the electronic device 101 is used for passive activity may be different from the sensor data 102x, 102y, 102z generated when the electronic device 101 is used for normal or intense typing. Since the placement, orientation, and activity performed on or using the electronic device 101 may affect the sensor data 102x, 102y, 102z, it follows that each of these features may be determined or extracted from the sensor data 102x, 102y, 102z and used, either individually or in combination, to determine whether the electronic device 101 is in contact with the body of a human user.
- FIGS. 3A to 3C show various placements and orientations of the electronic device 101 in an embodiment where the electronic device 101 is a laptop computer.
- the electronic device 101 may be placed on a flat desk (e.g. as in FIG. 3A ), on a human lap in a first orientation (e.g. as in FIG. 3B ), or on a human lap in a second orientation (e.g. as in FIG. 3C ).
- the sensor data 102x, 102y, 102z shown in FIG. 2 may be generated by placing the electronic device 101 in the various orientations depicted in FIGS 3A to 3C . For example, the sensor data 102x, 102y, 102z during time periods P1, P2, and P3 in FIG.
- the sensor data 102x, 102y, 102z during time periods P4, P5, and P6 in FIG. 2 may be generated when the electronic device 101 is placed on a human lap in a first orientation (e.g. as in FIG. 3B ).
- the sensor data 102x, 102y, 102z during time periods P7, P8, and P9 in FIG. 2 may be generated when the electronic device 101 is placed on a human lap in a second orientation (e.g. as in FIG. 3C ).
- three different activities may be performed on or using the electronic device 101.
- no typing may be performed on the electronic device 101, and the electronic device 101 may be used for passive activity such as watching a video, listening to audio, reading, or web browsing.
- normal typing e.g. associated with replying to emails, coding, or chatting
- heavy or intense typing e.g. associated with gaming
- the activity performed on or using the electronic device 101 may affect the sensor data 102x, 102y, 102z generated by the motion sensor 102, and this is observed in the sensor data 102x, 102y, 102z shown in FIG. 2 .
- the electronic device 101 is on a flat desk (e.g. during time periods P1, P2, and P3 shown in FIG. 2 )
- less vibrations are observed in the sensor data 102x, 102y, 102z when the electronic device 101 is used for passive activity (e.g. in time period P1) than when typing is performed on or using the electronic device 101 (e.g. in time periods P2 and P3).
- vibrations that occur during time period P3 have greater amplitude than vibrations that occur during time period P2.
- typing has a significant vector component in the vertical direction (e.g. the z axis)
- a significant amount of the vibrations observed in the sensor data 102x, 102y, 102z occurs in the normal axis sensor data 102z.
- the significant vector component in the vertical direction also manifests itself in the normal axis sensor data 102z being centered about -1 g during time periods P1, P2, and P3 (as opposed to the lateral axis sensor data 102x and the longitudinal axis sensor data 102y being centered about o g during time periods P1, P2, and P3).
- a similar trend may be observed when the electronic device 101 is on a human lap in a first orientation (e.g. during time periods P4, P5, and P6 shown in FIG. 2 ). For example, less vibrations are observed in the sensor data 102x, 102y, 102z when the electronic device 101 is used for passive activity (e.g. in time period P4) than when typing is performed on or using the electronic device 101 (e.g. in time periods P5 and P6). Additionally, since more intense typing is performed during time period P6, vibrations that occur during time period P6 have greater amplitude than vibrations that occur during time period P5.
- a significant amount of the vibrations observed in the sensor data 102x, 102y, 102z occurs in the normal axis sensor data 102z since typing has a significant vector component in the vertical direction (e.g. the z axis).
- the significant vector component in the vertical direction also manifests itself in the normal axis sensor data 102z being centered about -1 g during time periods P4, P5, and P6 (as opposed to the lateral axis sensor data 102x being centered about approximately 0.2 g and the longitudinal axis sensor data 102y being centered about 0 g during time periods P4, P5, and P6).
- the above-described trend may also be observed when the electronic device 101 is on a human lap in a second orientation (e.g. during time periods P7, P8, and P9 shown in FIG. 2 ).
- less vibrations are observed in the sensor data 102x, 102y, 102z when the electronic device 101 is used for passive activity (e.g. in time period P7) than when typing is performed on or using the electronic device 101 (e.g. in time periods P8 and P9).
- vibrations that occur during time period P9 have greater amplitude than vibrations that occur during time period P8.
- a significant amount of the vibrations observed in the sensor data 102x, 102y, 102z occurs in the normal axis sensor data 102z since typing has a significant vector component in the vertical direction (e.g. the z axis).
- the significant vector component in the vertical direction also manifests itself in the normal axis sensor data 102z being centered about -1 g during time periods P7, P8, and P9 (as opposed to the lateral axis sensor data 102x being centered about approximately -0.2 g and the longitudinal axis sensor data 102y being centered about 0 g during time periods P7, P8, and P9).
- the orientation (e.g. tilt) of the electronic device 101 may affect the sensor data 102x, 102y, 102z generated by the motion sensor 102, and this is also observed in the sensor data 102x, 102y, 102z shown in FIG. 2 .
- the angle subtended between the base of the laptop computer and the horizontal plane is substantially zero.
- the orientation or tilt of the electronic device 101 affects the sensor data 102x, 102y, 102z.
- the lateral axis sensor data 102x and the longitudinal axis sensor data 102y are centered about 0 g during time periods P1, P2, and P3 since the angle subtended between the base of the laptop computer and the horizontal plane is substantially zero.
- the angle subtended between the base of the laptop computer and the horizontal plane is not substantially zero.
- the orientation or tilt of the electronic device 101 affects the sensor data 102x, 102y, 102z.
- the lateral axis sensor data 102x is offset from 0 g, while the longitudinal axis sensor data 102y is centered about 0 g during time periods P4 to P9 since the angle subtended between the base of the laptop computer and the horizontal plane is not substantially zero.
- the offset of the lateral axis sensor data 102x from 0 g is positive during time periods P4, P5, and P6, but negative during time periods P7, P8, and P9. This is, again, due to the different orientations of the laptop computer in the time periods P4, P5, and P6 and the time periods P7, P8 and P9. For example, during the time periods P4, P5, and P6, the laptop computer is tilted downwards (e.g. as shown in FIG. 3B ), thereby causing the positive offset of the lateral axis sensor data 102x from 0 g during time periods P4, P5, and P6.
- the laptop computer is tilted upwards (e.g. as shown in FIG. 3C ), thereby causing the negative offset of the lateral axis sensor data 102x from o g during time periods P7, P8, and P9.
- the amount of activity performed on or using the electronic device 101 may be determined from the sensor data 102x, 102y, 102z, and such a determination may be used to determine whether the electronic device 101 is in contact with the body of a human user. Additionally, it follows that the orientation (or tilt) of the electronic device 101 may be determined from the sensor data 102x, 102y, 102z, and such orientation or tilt may be used to determine whether the electronic device 101 is in contact with the body of a human user.
- the detection system 100 may include a first feature detection circuit 104-1, a second feature detection circuit 104-2, or both.
- Each of the first feature detection circuit 104-1 and the second detection circuit 104-2 may be configured to receive the sensor data 102x, 102y, 102z as an input signal.
- the first feature detection circuit 104-1 may be configured to determine the amount of activity performed on or using the electronic device 101 from the sensor data 102x, 102y, 102z.
- the second feature detection circuit 104-2 may be configured to determine the orientation of the electronic device 101 from the sensor data 102x, 102y, 102z.
- At least a portion of the first feature detection circuit 104-1 may be included in a processor (e.g. of the electronic device 101).
- the first feature detection circuit 104-1 may output a first metric 106-1 that is indicative of the amount of activity performed on or using the electronic device 101.
- the first metric 106-1 may be, or may be indicative of, the total number of zero crossings that occur in the sensor data 102x, 102y, 102z in a predetermined time window (e.g. a window having about 100 samples).
- the number of zero crossings that occur in each of the 3 axes of motion may be computed in a running window of about 100 samples, and the number of zero crossings that occur in each of the 3 axes of motion may be summed (e.g. by the first feature detection circuit 104-1) to produce the first metric 106-1.
- a greater number of zero crossings may be indicative of a greater amount of activity performed on or using the electronic device 101, while a smaller number of zero crossings may be indicative of a lesser amount of activity performed on or using the electronic device 101.
- the number of zero crossings that occur in the time periods P1, P2, and P3 may be greater than the number of zero crossings that occur in the time periods P4, P5, and P6 or in the time periods P7, P8, and P9.
- both the lateral axis sensor data 102x and the longitudinal axis sensor data 102y being centered about 0 g during time periods P1, P2, and P3, thereby increasing the total number of zero crossings that occur in the time periods P1, P2, and P3 (e.g. compared to time periods P4, P5, and P6 or time periods P7, P8, and P9).
- the normal axis sensor data 102z is centered about -1 g during time periods P1, P2, and P3, and therefore has a minimal contribution to the total number of zero crossings that occur in the time periods P1, P2, and P3 despite its large vibrational amplitudes.
- the longitudinal axis sensor data 102y may be centered about 0 g during time periods P4, P5, and P6.
- the normal axis sensor data 102z is centered about -1 g during time periods P4, P5, and P6, and therefore has a minimal contribution to the total number of zero crossings that occur in the time periods P4, P5, and P6 despite its large vibrational amplitudes.
- the lateral axis sensor data 102x is centered about 0.2 g and has small vibrational amplitudes during time periods P4, P5, and P6, and therefore has a minimal contribution to the total number of zero crossings that occur in the time periods P4, P5, and P6.
- the longitudinal axis sensor data 102y may be centered about 0 g during time periods P7, P8, and P9.
- the normal axis sensor data 102z is centered about -1 g during time periods P7, P8, and P9, and therefore has a minimal contribution to the total number of zero crossings that occur in the time periods P7, P8, and P9 despite its large vibrational amplitudes.
- the lateral axis sensor data 102x is centered about -0.2 g and has small vibrational amplitudes during time periods P7, P8, and P9, and therefore has a minimal contribution to the total number of zero crossings that occur in the time periods P7, P8, and P9.
- a smaller number of zero crossings may indicate that the electronic device 101 is in contact with the body of a human user.
- the sensor data 102x, 102y, 102z may resemble white noise when the electronic device 101 is in contact with an inanimate object (e.g. a table).
- White noise may typically be characterized by random fluctuations that occur over a wide range of frequencies and this may result in a higher number of zero crossings in a predetermined time window (e.g. in comparison with sensor data 102x, 102y, 102z generated when the electronic device 101 is in contact with a human body).
- the sensor data 102x, 102y, 102z may contain fluctuations that have frequency components in a predetermined range (e.g. by virtue of contact with a human body, as described below). Consequently, the number of zero crossings may be lower when the electronic device 101 is in contact with a human body (e.g. in comparison with sensor data 102x, 102y, 102z generated when the electronic device 101 is not in contact with a human body). This leads to a similar result of a smaller number of zero crossings indicating that the electronic device 101 is in contact with the body of a human user.
- the amount of activity performed on or using the electronic device 101 may be insufficient or inaccurate in indicating whether the electronic device 101 is in contact with the body of a human user.
- the electronic device 101 may be placed on an inclined desk and not be in contact with the body of a human user.
- using solely the first metric 106-1 e.g. indicative of the total number of zero crossings that occur in the sensor data 102x, 102y, 102z in a predetermined window of time
- the first metric 106-1 may erroneously lead to a determination that the electronic device 101 is in contact with the body of a human user. Consequently, additional features may need to be determined or extracted from the sensor data 102x, 102y, 102z in order to accurately determine whether the electronic device 101 is in contact with the body of a human user.
- the orientation or tilt of the electronic device 101 may affect the sensor data 102x, 102y, 102z generated by the motion sensor 102, and this may be used (e.g. in addition to the first metric 106-1) to determine whether the electronic device 101 is in contact with the body of a human user.
- the second feature detection circuit 104-2 may be configured to determine the orientation of the electronic device 101 from the sensor data 102x, 102y, 102z. At least a portion of the second feature detection circuit 104-2 may be included in a processor (e.g. of the electronic device 101).
- the second feature detection circuit 104-2 may output a second metric 106-2 that is indicative of the orientation of the electronic device 101.
- the second metric 106-2 may be determined by computing a mean orientation (e.g. mean tilt angle) of the electronic device 101 in a predetermined time window (e.g. a window having about 100 samples).
- the second metric 106-2 may be, or may be indicative of, an angle subtended between the electronic device 101 (e.g. a base or any other plane of the electronic device 101) and a reference plane (e.g. a horizontal plane or leveled ground).
- a greater angle subtended between the electronic device 101 and a reference plane may indicate that the electronic device 101 is on an inclined plane (e.g. on a part of the body of a human user), while a smaller angle may indicate that the electronic device 101 is on a substantially flat plane (e.g. on a flat desk).
- the second metric 106-2 may be expressed in terms of roll and pitch.
- the motion sensor 102 e.g.
- accelerometer may measure the gravitational force exerted on the electronic device 101 in each plane of motion (e.g. vectors AccX, AccY, AccZ), and the angle subtended between the electronic device 101 and a reference plane may be determined from the vectors AccX, AccY, AccZ.
- roll may be given as atan (AccY/AccZ)
- pitch may be given by atan AccY / AccZ 2 + AccY 2 .
- the second metric 106-2 may be a rate of change of the angle subtended between the electronic device 101 and a reference plane.
- the angle subtended between the electronic device 101 and a reference plane may not change as frequently as when the electronic device 101 is in contact with the body of a human user.
- the orientation of the electronic device 101 may be insufficient or inaccurate in indicating whether the electronic device 101 is in contact with the body of a human user.
- the electronic device 101 may be placed on an inclined desk and not be in contact with the body of a human user.
- the orientation of the electronic device 101 may erroneously lead to a determination that the electronic device 101 is in contact with the body of a human user. Consequently, additional features may need to be determined or extracted from the sensor data 102x, 102y, 102z in order to accurately determine whether the electronic device 101 is in contact with the body of a human user.
- the placement of the electronic device 101 e.g.
- the sensor data 102x, 102y, 102z generated by the motion sensor 102 may affect the sensor data 102x, 102y, 102z generated by the motion sensor 102, and this may be observed in a spectrogram of the sensor data 102x, 102y, 102z shown in FIG. 2 .
- FIG. 4 shows a spectrogram 400 of the sensor data 102x, 102y, 102z shown in FIG. 2 , in accordance with an embodiment.
- the spectrogram 400 shows the variation of frequencies with respect to time, and in the spectrogram 400 show in FIG. 4 , the horizontal axis denotes frequency (measured in Hz) and ranges from 0 Hz to about 25 Hz, while the vertical axis denotes time (measured in seconds).
- the spectrogram 400 is a short-time Fourier transform (STFT) of the norm (or magnitude) of the sensor data 102x, 102y, 102z shown in FIG. 2 , in which a sliding window of about 100 samples is used.
- STFT short-time Fourier transform
- a hotter color e.g. a more yellow, orange, or red color
- a cooler color e.g. a more cyan or blue color
- Human bodies on average, have a characteristic vibration in the range from about 5 Hz to about 15 Hz (e.g. indicated in FIG. 4 as frequency band FB).
- a characteristic vibration of the human body may be sensed by the motion sensor 102 and may manifest itself in the sensor data 102x, 102y, 102z.
- the contribution of the characteristic vibration of the human body to the sensor data 102x, 102y, 102z may be observed in the spectrogram 400 in the regions of the spectrogram 400 encompassed by the boundaries 402 and 404.
- the frequencies in the frequency band FB have greater amplitudes in comparison to frequencies outside the frequency band FB.
- time period P4 e.g. when the electronic device 101 is placed on a human lap in a first orientation and used for passive activity
- the frequencies between 5 Hz and about 15 Hz have greater amplitudes in comparison to frequencies outside the frequency band FB.
- time period P7 e.g.
- the frequencies between 5 Hz and about 15 Hz have greater amplitudes in comparison to frequencies outside the frequency band FB.
- time period P1 e.g. when the electronic device 101 is placed on a desk and used for passive activity
- the frequencies between 5 Hz and about 15 Hz have amplitudes that are similar to frequencies outside the frequency band FB.
- time period P1 there is no additional contribution to frequencies within the frequency band FB, and thus, a low and almost white noise is observed in the spectrogram 400 during time period P1.
- vibrations other than from the human body there may be sources of vibrations other than from the human body, examples being vibrations generated by typing performed on or using the electronic device 101 or vibrations generated by a fan or a cooling mechanism included in the electronic device 101. Nonetheless, vibrations introduced into the sensor data 102x, 102y, 102z by a fan or a cooling mechanism tend to be localized in frequency, thereby manifesting as a peak in the frequency response or spectrum of the sensor data 102x, 102y, 102z. Furthermore, vibrations introduced into the sensor data 102x, 102y, 102z by typing tend to be evenly spread in frequency, thereby manifesting as white noise in the frequency response or spectrum of the sensor data 102x, 102y, 102z. This is also observed in the spectrogram 400 shown in FIG. 4 .
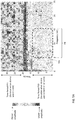
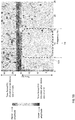
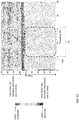
- FIGS. 5A to 5E show spectrograms illustrating the frequency content of the sensor data 102x, 102y, 102z obtained when the electronic device 101 is in contact with various parts of the human body, in accordance with an embodiment.
- the horizontal axis denotes frequency (measured in Hz) and ranges from 0 Hz to about 25 Hz, while the vertical axis denotes time (measured in seconds).
- the spectrograms of FIGS. 5A to 5E are short-time Fourier transform (STFT) of the norm (or magnitude) of sensor data 102x, 102y, 102z.
- STFT short-time Fourier transform
- the sensor data 102x, 102y, 102z was collected by initially placing the electronic device 101 having the motion sensor 102 on a particular part of the human body (e.g. indicated in FIGS. 5A to 5E as time period P10), followed by placing the electronic device 101 having the motion sensor 102 on a desk (e.g. indicated in FIGS. 5A to 5E as time period P11).
- the spectrograms in FIGS. 5A to 5E are shown with a default color map and derives from a conversion in shades of grey of a color map (attached to the filing documents) wherein the amplitude of a particular frequency at a particular time is represented by the intensity or color of each point in the spectrogram.
- a hotter color e.g. a more yellow, orange, or red color
- a cooler color e.g. a more cyan or blue color
- the spectrograms may be expected that there is a concentration of energy in the spectrograms within the frequency band FB (e.g. between about 5 Hz and about 15 Hz) when the electronic device 101 is in contact with a particular part of the human body (e.g. during time period P10).
- the spectrogram is uniform across all frequencies between 0 Hz and about 25 Hz when the electronic device 101 is placed on a desk (e.g. during time period P11). Indeed, this is seen in the spectrograms shown in FIGS. 5A to 5E .
- the characteristic vibration of the human body manifests in the spectrogram in the regions of the spectrogram encompassed by the boundary 502.
- the frequencies between 5 Hz and about 15 Hz have greater amplitudes in comparison to frequencies outside the frequency band FB.
- the frequencies between 5 Hz and about 15 Hz have amplitudes that are similar to frequencies outside the frequency band FB.
- the characteristic vibration of the human body manifests in the spectrogram in the regions of the spectrogram encompassed by the boundary 504.
- the frequencies between 5 Hz and about 15 Hz have greater amplitudes in comparison to frequencies outside the frequency band FB.
- the frequencies between 5 Hz and about 15 Hz have amplitudes that are similar to frequencies outside the frequency band FB.
- the characteristic vibration of the human body manifests in the spectrogram in the regions of the spectrogram encompassed by the boundary 506.
- the frequencies between 5 Hz and about 15 Hz have greater amplitudes in comparison to frequencies outside the frequency band FB.
- the frequencies between 5 Hz and about 15 Hz have amplitudes that are similar to frequencies outside the frequency band FB.
- the characteristic vibration of the human body manifests in the spectrogram in the regions of the spectrogram encompassed by the boundary 508.
- the frequencies between 5 Hz and about 15 Hz have greater amplitudes in comparison to frequencies outside the frequency band FB.
- the frequencies between 5 Hz and about 15 Hz have amplitudes that are similar to frequencies outside the frequency band FB.
- the characteristic vibration of the human body manifests in the spectrogram in the regions of the spectrogram encompassed by the boundary 510.
- the frequencies between 5 Hz and about 15 Hz have greater amplitudes in comparison to frequencies outside the frequency band FB.
- the frequencies between 5 Hz and about 15 Hz have amplitudes that are similar to frequencies outside the frequency band FB.
- the detection system 100 may include a third feature detection circuit 104-3 configured to receive the sensor data 102x, 102y, 102z as an input signal.
- the third feature detection circuit 104-3 may be configured to determine a spectral feature of the sensor data 102x, 102y, 102z.
- At least a portion of the third feature detection circuit 104-3 may be included in a processor (e.g. of the electronic device 101).
- the third feature detection circuit 104-3 may output a third metric 106-3 that is indicative of the spectral energy present in the frequency band FB (e.g. about 5 Hz to about 15 Hz).
- the third metric 106-3 may be, or may be indicative of, at least one of the following: an energy in the frequency band FB; a ratio of the energy in the frequency band FB to the total energy of the sensor data 102x, 102y, 102z; a ratio of the energy in the frequency band FB to the energy outside the frequency band FB; an average of the energy in the frequency band FB; an average of a ratio of the energy in the frequency band FB to the total energy of the sensor data 102x, 102y, 102z; or an average of a ratio of the energy in the frequency band FB to the energy outside the frequency band FB.
- FIG. 6 shows a block diagram 600 illustrating the internal circuitry of the third feature detection circuit 104-3, in accordance with an embodiment. Additionally, FIG. 7 shows a method 700 of determining the third metric 106-3, in accordance with an embodiment. The method 700 may be executed by the third feature detection circuit 104-3 shown in FIG. 6 .
- the third metric 106-3 determined by the third feature detection circuit 104-3 may be, or may be indicative of, an average normalized power of the sensor data 102x, 102y, 102z (e.g. an average of a ratio of the energy in the frequency band FB to the energy outside the frequency band FB).
- the average normalized power may be determined for a predetermined time window.
- the predetermined time window may be about 2 seconds or may include about 100 samples of the sensor data 102x, 102y, 102z.
- the third feature detection circuit 104-3 may include a magnitude computation circuit 602, which is configured to determine the magnitude (or norm) of acceleration for each sample of the sensor data 102x, 102y, 102z (e.g. as in step 702 of method 700).
- a magnitude computation circuit 602 which is configured to determine the magnitude (or norm) of acceleration for each sample of the sensor data 102x, 102y, 102z (e.g. as in step 702 of method 700).
- AccX[ n ] each sample of the lateral axis sensor data 102x
- each sample of the longitudinal axis sensor data 102y is denoted by AccY[ n ]
- each sample of the normal axis sensor data 102z is denoted by AccZ[ n ].
- the magnitude of acceleration (denoted as
- ) for each sample n of the sensor data 102x, 102y, 102z may be determined by performing the following mathematical operation: Acc n AccX n 2 + AccY n 2 + AccZ n 2 .
- a processor e.g. of the electronic device 101
- the magnitude computation circuit 602 and the mathematical operation described above may be implemented by such a processor.
- the third feature detection circuit 104-3 may further include a summer 604, which is configured to compensate for the acceleration due to gravity (e.g. as in step 704 of method 700). This may be accomplished by subtracting 1 from the magnitude of acceleration
- the output of the summer 604 may be a compensated magnitude of acceleration 605.
- the third feature detection circuit 104-3 may include a first filter 606-1 and a second filter 606-2, each of which may be configured to receive, as an input, the compensated magnitude of acceleration 605.
- the first filter 606-1 and the second filter 606-2 may filter the compensated magnitude of acceleration 605 (e.g. as in steps 706 and 707 of method 700).
- the first filter 606-1 and the second filter 606-2 may have different passband frequencies.
- the first filter 606-1 may be a bandpass filter having a passband between about 5 Hz and about 15 Hz.
- the passband of the first filter 606-1 may be the frequency band FB in which the characteristic vibrations of the human body occur.
- the second filter 606-2 may be a high-pass filter having a cutoff frequency of about 15 Hz.
- the second filter 606-2 may pass frequencies above or equal to about 15 Hz, while substantially eliminating frequencies below about 15 Hz.
- the third feature detection circuit 104-3 may include a first energy computation circuit 608-1 and a second energy computation circuit 608-2.
- the first energy computation circuit 608-1 may be configured to determine the energy of the output of the first filter 606-1
- the second energy computation circuit 608-2 may be configured to determine the energy of the output of the second filter 606-2 (e.g. as in step 708 of method 700). Consequently, the first energy computation circuit 608-1 may be configured to determine the energy of the sensor data 102x, 102y, 102z in the frequency band FB
- the second energy computation circuit 608-2 may be configured to determine the energy of the sensor data 102x, 102y, 102z outside the frequency band FB.
- the energy of the output of each of the first filter 606-1 and 606-2 is determined for a running window of 100 samples (e.g. about 2 seconds based on a sampling frequency of 50 Hz) and overlapping at each sample n.
- at least a portion of the third feature detection circuit 104-3 may be included in a processor (e.g. of the electronic device 101), and in the example of FIG. 6 , the energy computation circuits 608-1 and 608-2, and the mathematical operations described above, may be implemented by such a processor.
- the third feature detection circuit 104-3 may further include a normalized power computation circuit 610, which may be configured to determine a normalized power based on the energy of the output of the first filter 606-1 and the energy of the output of the second filter 606-2 (e.g. as in step 710 of method 700).
- the normalized power computation circuit 610 may be configured to determine the ratio of the energy of the sensor data 102x, 102y, 102z in the frequency band FB to the energy of the sensor data 102x, 102y, 102z outside the frequency band FB.
- a processor e.g. of the electronic device 101
- the normalized power computation circuit 610 and the mathematical operation described above, may be implemented by such a processor.
- the third feature detection circuit 104-3 may further include an averaging circuit 612 configured to determine an average normalized power based on the output of the normalized power computation circuit 610 (e.g. as in step 712 of method 700). Consequently, the averaging circuit 612 may be configured to determine an average of a ratio of the energy in the frequency band FB to the energy outside the frequency band FB.
- the average normalized power is determined for a running window of 100 samples (e.g. about 2 seconds based on a sampling frequency of 50 Hz) and overlapping at each sample n.
- a portion of the third feature detection circuit 104-3 may be included in a processor (e.g. of the electronic device 101), and in the example of FIG. 6 , the averaging circuit 612, and the mathematical operation described above, may be implemented by such a processor.
- the average normalized power AV_Norm_PWR [ n ] may be output by the third feature detection circuit 104-3 as the third metric 106-3.
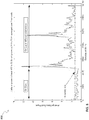
- FIG. 8 shows a plot 800 of the average normalized power AV_Norm_PWR [ n ] of the sensor data 102x, 102y, 102z shown in FIG. 2 using the method 700 of FIG. 7 , in accordance with an embodiment.
- the horizontal axis denotes the sample index n
- the vertical axis denotes average normalized power in arbitrary units.
- the average normalized power AV_Norm_PWR [ n ] (which may be an average of a ratio of the energy in the frequency band FB to the energy outside the frequency band FB) in larger when the electronic device 101 is in contact with a human body.
- FIG. 8 shows that the increase in the average normalized power AV_Norm_PWR [ n ] is well above a threshold, thereby suggesting that a noise baseline rejection may be used in conjunction with the average normalized power AV_Norm_PWR [ n ] to determine whether the electronic device 101 is in contact with a human body.
- the threshold is set to about 1.8, although other threshold levels may be possible in other embodiments, depending on the noise baseline generated using the method 700 of FIG. 7 .
- the detection system 100 includes a classifying circuit 108, which may be configured to determine whether the electronic device 101 is in contact with a human body based on at least the third metric 106-3.
- the classifying circuit 108 may use merely the third metric 106-3 (e.g. the average normalized power of the sensor data 102x, 102y, 102z) to determine whether the electronic device 101 is in contact with a human body.
- the classifying circuit 108 may use the third metric 106-3 and at least one of the first metric 106-1 (e.g.
- the second method 106-2 e.g. an angle subtended between the electronic device 101 and a reference plane to determine whether the electronic device 101 is in contact with a human body.
- the classifying circuit 108 may generate a decision based, at least in part, on the first metric 106-1 (e.g. where a smaller number of zero crossings may indicate that the electronic device 101 is in contact with the body of a human user).
- the classifying circuit 108 may generate a decision based, at least in part, on the second metric 106-2 (e.g. where a greater angle subtended between the electronic device 101 and a reference plane, or a greater rate of change thereof, may indicate that the electronic device 101 is in contact with the body of a human user).
- the classifying circuit 108 may generate a decision based, at least in part, on the third metric 106-3 (e.g. where an average normalized power above a threshold may indicate that the electronic device 101 is in contact with the body of a human user).
- the classifying circuit 108 may be a machine learning classifier implemented using machine learning techniques, examples being a decision tree, linear regression, logistic regression, support vector machine (SVM), naive Bayes, k-nearest neighbors, k-means, random forest, gradient boost, among others.
- the classifying circuit 108 may implement a time-based voting method. In a time-based voting method, the classifying circuit 108 may output an interim decision every time a new set of metrics 106-1, 106-2, and 106-3 is computed. A history of the interim decisions of the classifying circuit 108 for a given set of metrics 106-1, 106-2, and 106-3 may be maintained (e.g.
- a final decision of the classifying circuit 108 may be based on this history of interim decisions.
- the metrics 106-1, 106-2, and 106-3 may be computed every 2 seconds.
- there may be a new interim decision from the classifying circuit 108 every 2 seconds, and the interim decisions of the classifying circuit 108 for a 30 second window of time may be stored in history.
- a voting may be performed, and the interim decision with the highest vote may be declared as the final decision of the classifying circuit 108.
- An output 110 of the classifying circuit 108 may indicate whether the electronic device 101 is in contact with a human body.
- the output 110 of the classifying circuit 108 may be expressed as a ternary signal, where ternary o indicates an unknown state, where ternary 1 indicates a determination that the electronic device 101 is in contact with a human body, and where ternary 2 indicates a determination that the electronic device 101 is not in contact with a human body.
- the output 110 of the classifying circuit 108 may be updated every 5 seconds or less.
- the detection system 100 may include a state monitor 112, and the output 110 of the classifying circuit 108 may be provided to the state monitor 112.
- the state monitor 112 may be implemented using a controller and a memory register.
- the output 110 of the classifying circuit 108 may be stored in the memory register of the state monitor 112, and the controller of the state monitor 112 may be configured to read the content of the memory register.
- the state monitor 112 may generate an interrupt signal 114 that may adapt the behavior or operation of electronic device 101 is such a way that high temperatures are circumvented and burning of human skin is avoided.
- the interrupt signal 114 generated by the state monitor may control a cooling fan of the laptop computer to reduce internal temperatures of the laptop computer, thereby avoiding harm to human skin.
- the interrupt signal 114 may place the electronic device 101 in a power-down mode in an effort to reduce power consumption and extend battery life.
- the interrupt signal 114 may place the headphones in a low-power mode in response to the output 110 of the classifying circuit 108 indicating that the headphones are not in contact with a human body.
- the interrupt signal 114 may turn on the sensor in response to the output 110 of the classifying circuit 108 indicating that the sensor is in contact with a human body, or turn off the sensor in response to the output 110 of the classifying circuit 108 indicating that the sensor is not in contact with a human body.
- the state monitor 112 stores a previous output 110 of the classifying circuit 108 (e.g. in the memory register) and compares the previous output 110 to a current output 110 of the classifying circuit 108. Such a comparison may be performed by the controller of the state monitor 112.
- the state monitor 112 may output the interrupt signal 114 in response to the current output 110 of the classifying circuit 108 being different from the previous output 110 of the classifying circuit 108.
- this generation of the interrupt signal 114 may be useful in applications where the interrupt signal 114 places the electronic device 101 in a power-down mode (e.g. when not in contact with a human body) or power-up mode (e.g. when in contact with a human body) in an effort to reduce power consumption and extend battery life.
- the human body has a characteristic vibration that can be measured using a motion sensor like an accelerometer.
- This characteristic vibration ranges from about 5 Hz to about 15 Hz (e.g. denoted as the frequency band FB) and can be observed using the frequency response of a motion signal generated by the motion sensor.
- This characteristic vibration may be sensed on almost all parts of the human body, including the hand, lap, head, arm, and chest.
- the characteristic vibration may be analyzed and used to determine whether an electronic device is in contact with a human body.
- a metric e.g.
- the third metric 106-3 may be used that is indicative of at least one of the following: an energy in the frequency band FB; a ratio of the energy in the frequency band FB to the total energy of the motion signal generated by the motion sensor; a ratio of the energy in the frequency band FB to the energy outside the frequency band FB; an average of the energy in the frequency band FB; an average of a ratio of the energy in the frequency band FB to the total energy of the motion signal generated by the motion sensor; or an average of a ratio of the energy in the frequency band FB to the energy outside the frequency band FB.
- the behavior or operation of the electronic device 101 may be adapted (e.g.
- the interrupt signal 114) may be used to reduce elevated temperatures or to reduce power consumption and extend battery life.
- other metrics e.g. the first metric 106-1 and the second metric 106-2
- metrics indicative of the orientation of the electronic device 101 and/or the amount of activity performed on or using the electronic device 101 may also be used to determine whether the electronic device 101 is in contact with a human body.
- the detection system 100 shown in FIG. 1 and the solution provided by it may be implemented using limited resources (e.g. one accelerometer) and can be broadly used since each feature (e.g. orientation, activity, and spectral property) may be determined or extracted when the electronic device is in contact with any part of the human body.
- a system may include a motion sensor configured to generate a motion signal in response to a movement of an electronic device, and at least one feature detection circuit configured to determine at least one metric based on the motion signal.
- the system may further include a classifying circuit configured to determine whether the electronic device is in contact with a human body based on the at least one metric.
- a system may include an accelerometer configured to generate an output signal in response to a vibration or orientation of an electronic device.
- the system may further include a plurality of feature detection circuits having inputs coupled to an output of the accelerometer, the plurality of feature detection circuits being configured to determine a plurality of metrics indicative of a plurality of characteristics of the output signal.
- the system may additionally include a classifying circuit configured to determine whether the electronic device is in contact with a human body based on the plurality of metrics, and a controller configured to adapt an operation of the electronic device based on whether the electronic device is in contact with the human body.
- a method may include generating a motion signal in response to a movement of an electronic device; determining at least one characteristic of the motion signal; generating at least one metric indicative of the at least one characteristic of the motion signal; and determining whether the electronic device is in contact with a human body based on the at least one metric.
- DSP digital signal processor
- ASIC Application Specific Integrated Circuit
- FPGA field programmable gate array
- a processor may be a microprocessor, but in the alternative, the processor may be any conventional processor, controller, microcontroller, or state machine.
- a processor may also be implemented as a combination of computing devices, e.g., a combination of a DSP and a microprocessor, a plurality of microprocessors, one or more microprocessors in conjunction with a DSP core, or any other such configuration.
- RAM Random Access Memory
- ROM Read Only Memory
- EPROM Electrically Programmable ROM
- EEPROM Electrically Erasable Programmable ROM
- registers a hard disk, a removable disk, a CD-ROM, or any other form of computer-readable medium known in the art.
- An exemplary storage medium is coupled to the processor such that the processor can read information from, and write information to, the storage medium.
- the storage medium may be integral to the processor.
- the processor and the storage medium may reside in an ASIC.
Landscapes
- Engineering & Computer Science (AREA)
- Theoretical Computer Science (AREA)
- General Engineering & Computer Science (AREA)
- General Physics & Mathematics (AREA)
- Physics & Mathematics (AREA)
- Software Systems (AREA)
- Human Computer Interaction (AREA)
- Computer Hardware Design (AREA)
- Evolutionary Computation (AREA)
- Computing Systems (AREA)
- Medical Informatics (AREA)
- Mathematical Physics (AREA)
- Data Mining & Analysis (AREA)
- Computer Vision & Pattern Recognition (AREA)
- Artificial Intelligence (AREA)
- Measurement Of The Respiration, Hearing Ability, Form, And Blood Characteristics Of Living Organisms (AREA)
Abstract
Description
- The present invention relates generally to electronic devices, and, in particular, to a system and method of determining whether an electronic device is in contact with a human body.
- As electronic devices become more ubiquitous and as individuals become more mobile, there is an increasing need to provide computing capabilities and information on the go. Such a need can be met, at least in part, by laptop computers and wearable electronics.
- One aspect that users often encounter with the use of laptop computers is overheating of the base of the laptop computer. Power supply components of laptop computers may be located on the bottom surface of the keyboard portion of the laptop computer. During long periods of use or during intense use (e.g. during gaming), the base of the laptop computer can overheat, burn, or cause discomfort to the user if the laptop computer is resting on the user's lap. While elevated temperatures generally do not damage electronics and circuitry of the laptop computer, it can cause harm to human skin.
- A new area for consumer electronic devices that provides individuals with computing capabilities and information on the go is wearable electronics. Examples of wearable electronics include the smart watch and wireless (e.g. Bluetooth) headphones. Additionally, individuals sometimes wear their cell phones on their person, such as by attaching their cell phone to their body using a resilient sleeve (e.g. an arm or fitness band) during various activities (e.g. while exercising). There is a widely felt need in the wearable electronics industry for a way to power the devices so that they can be used for longer periods of time.
- In either laptop computers or wearable electronics, the electronic device may be in contact (e.g. direct or indirect contact) with human skin. As such, it may be desirable to provide a system and method of determining whether the electronic device is in contact with a human body, thereby allowing the electronic device to adapt its behavior or operation accordingly. As an illustration, in response to a determination that a laptop computer is in contact with a human body, the laptop computer may adapt its behavior or operation to avoid elevated temperatures so that harm to human skin is prevented. As another illustration, in response to a determination that a wearable electronic device is not in contact with a human body, the wearable electronic device may be placed in a low-power mode in an effort to reduce power consumption and extend battery life.
- According to the invention, there are provided a system and a method of determining whether an electronic device is in contact with a human body, as defined in the attached claims.
- A system may include a motion sensor configured to generate a motion signal in response to a movement of an electronic device, and at least one feature detection circuit configured to determine at least one metric based on the motion signal. The system may further include a classifying circuit configured to determine whether the electronic device is in contact with a human body based on the at least one metric.
- A system may include an accelerometer configured to generate an output signal in response to a vibration or orientation of an electronic device. The system may further include a plurality of feature detection circuits having inputs coupled to an output of the accelerometer, the plurality of feature detection circuits being configured to determine a plurality of metrics indicative of a plurality of characteristics of the output signal. The system may additionally include a classifying circuit configured to determine whether the electronic device is in contact with a human body based on the plurality of metrics, and a controller configured to adapt an operation of the electronic device based on whether the electronic device is in contact with the human body.
- A method may include generating a motion signal in response to a movement of an electronic device; determining at least one characteristic of the motion signal; generating at least one metric indicative of the at least one characteristic of the motion signal; and determining whether the electronic device is in contact with a human body based on the at least one metric.
- The patent or application file contains drawings executed in color, that are filed together with their conversion in shades of grey for sake of publication.
- For a more complete understanding of the present invention, and the advantages thereof, reference is now made to the following descriptions taken in conjunction with the accompanying drawings, in which:
-
FIG. 1 shows a block diagram of an electronic device including a detection system, in accordance with an embodiment; -
FIG. 2 shows sensor data generated by a motion sensor, in accordance with an embodiment; -
FIGS. 3A to 3C show various placements and orientations of an electronic device, in accordance with an embodiment; -
FIG. 4 shows a spectrogram of the sensor data shown inFIG. 2 , in accordance with an embodiment; -
FIGS. 5A to 5E show spectrograms illustrating the frequency content of sensor data obtained when an electronic device is in contact with various parts of the human body, in accordance with an embodiment; -
FIG. 6 shows a block diagram illustrating the internal circuitry of a feature detection circuit, in accordance with an embodiment; -
FIG. 7 shows a method of determining an average normalized power of sensor data, in accordance with an embodiment -
FIG. 8 shows a plot of the average normalized power of the sensor data shown inFIG. 2 using the method shown inFIG. 7 , in accordance with an embodiment. - Corresponding numerals and symbols in the different figures generally refer to corresponding parts unless otherwise indicated. The figures are drawn to clearly illustrate the relevant aspects of the embodiments and are not necessarily drawn to scale.
-
FIG. 1 shows a block diagram of anelectronic device 101 including adetection system 100, in accordance with an embodiment. Thedetection system 100 may be within, attached, or coupled to theelectronic device 101. Thedetection system 100 may be used to determine whether theelectronic device 101 is in contact with the body of a human user. In response to a determination that theelectronic device 101 is in contact with the body of a human user, a state monitor 112 (e.g. a controller of thedetection system 100 or the electronic device 101) may adapt the behavior or operation of theelectronic device 101 so that elevated temperatures in theelectronic device 101 are prevented or substantially reduced. In so doing, harm to human skin may be prevented or substantially reduced. Alternatively, or additionally, in response to a determination that theelectronic device 101 is not in contact with the body of a human user, thestate monitor 112 may be placed in a low-power mode in an effort to reduce power consumption and extend battery life. - The
electronic device 101 may be a laptop computer or a wearable electronic device (e.g. a smart watch, mobile phone, wireless headphones, or the like). Thedetection system 100 includes amotion sensor 102. Themotion sensor 102 may be an accelerometer or a device configured to sense vibration or acceleration of theelectronic device 101. For example, theelectronic device 101 having themotion sensor 102 may be a laptop computer having an accelerometer coupled or attached to a base of the laptop computer. As another example, theelectronic device 101 having themotion sensor 102 may be a cell phone having an accelerometer included within the cell phone. In examples where themotion sensor 102 is an accelerometer, thedetection system 100 may be an accelerometer-baseddetection system 100. Themotion sensor 102 may generate time series data, which is depicted inFIG. 1 assensor data -
FIG. 2 showssensor data motion sensor 102, in accordance with an embodiment. In the example shown inFIG. 2 , thesensor data motion sensor 102 may be configured to sense vibration or acceleration of theelectronic device 101 in each axis of motion. For example, themotion sensor 102 may generatesensor data electronic device 101 in the lateral axis (e.g. referred to as the "x axis"), longitudinal axis (e.g. referred to as the "y axis"), and vertical or normal axis (e.g. referred to as the "z axis"), respectively. - The
sensor data sensor data motion sensor 102. In such embodiments, themotion sensor 102 may include a sampling circuit therein. The sampling circuit may be implemented using one or more sampling circuits known in the art (e.g. a sample-and-hold circuit). In the example shown inFIG. 2 , thesensor data motion sensor 102 at a sampling frequency of 50 Hz with a full scale range of ± 2 g. The sampling frequency may depend, at least in part, on a characteristic vibration of a human body, which, as described below in respect ofFIGS. 4 and5A to 5E , is between about 5 Hz and about 15 Hz. As such, to fulfill the Nyquist sampling theorem, the rate at which the analog signal of themotion sensor 102 is sampled is greater than or equal to about 30 Hz. - The
sensor data motion sensor 102 may depend, at least in part, on a placement of theelectronic device 101, an orientation (e.g. tilt) of theelectronic device 101, and the activity performed on or using theelectronic device 101. As an illustration, with respect to the placement of theelectronic device 101, theelectronic device 101 may be placed on a part of the human body (e.g. a lap) or on an inanimate object (e.g. a desk). Thesensor data electronic device 101 is placed on a part of the human body may be different from thesensor data electronic device 101 is placed on an inanimate object. As a further illustration, with respect to the orientation of theelectronic device 101, theelectronic device 101 may be flat (e.g. when placed on a flat desk) or inclined with respect to a horizontal plane (e.g. when placed on a human lap). Thesensor data electronic device 101 is flat may be different from thesensor data electronic device 101 is inclined with respect to a horizontal plane. As an additional illustration, with respect to the activity performed on or using theelectronic device 101, theelectronic device 101 may be used for passive activity, normal typing, or intense typing. Thesensor data electronic device 101 is used for passive activity may be different from thesensor data electronic device 101 is used for normal or intense typing. Since the placement, orientation, and activity performed on or using theelectronic device 101 may affect thesensor data sensor data electronic device 101 is in contact with the body of a human user. -
FIGS. 3A to 3C show various placements and orientations of theelectronic device 101 in an embodiment where theelectronic device 101 is a laptop computer. Theelectronic device 101 may be placed on a flat desk (e.g. as inFIG. 3A ), on a human lap in a first orientation (e.g. as inFIG. 3B ), or on a human lap in a second orientation (e.g. as inFIG. 3C ). Thesensor data FIG. 2 may be generated by placing theelectronic device 101 in the various orientations depicted inFIGS 3A to 3C . For example, thesensor data FIG. 2 may be generated when theelectronic device 101 is placed on a flat desk (e.g. as inFIG. 3A ). Thesensor data FIG. 2 may be generated when theelectronic device 101 is placed on a human lap in a first orientation (e.g. as inFIG. 3B ). Thesensor data FIG. 2 may be generated when theelectronic device 101 is placed on a human lap in a second orientation (e.g. as inFIG. 3C ). - For a given placement, three different activities may be performed on or using the
electronic device 101. For example, in time periods P1, P4, and P7 shown inFIG. 2 , no typing may be performed on theelectronic device 101, and theelectronic device 101 may be used for passive activity such as watching a video, listening to audio, reading, or web browsing. However, in time periods P2, P5, and P8 shown inFIG. 2 , normal typing (e.g. associated with replying to emails, coding, or chatting) may be performed on or using theelectronic device 101. Furthermore, in time periods P3, P6, and P9 shown inFIG. 2 , heavy or intense typing (e.g. associated with gaming) may be performed on or using theelectronic device 101. - As described above, the activity performed on or using the
electronic device 101 may affect thesensor data motion sensor 102, and this is observed in thesensor data FIG. 2 . For example, when theelectronic device 101 is on a flat desk (e.g. during time periods P1, P2, and P3 shown inFIG. 2 ), less vibrations are observed in thesensor data electronic device 101 is used for passive activity (e.g. in time period P1) than when typing is performed on or using the electronic device 101 (e.g. in time periods P2 and P3). Additionally, since more intense typing is performed during time period P3, vibrations that occur during time period P3 have greater amplitude than vibrations that occur during time period P2. Even further, since typing has a significant vector component in the vertical direction (e.g. the z axis), a significant amount of the vibrations observed in thesensor data axis sensor data 102z. The significant vector component in the vertical direction also manifests itself in the normalaxis sensor data 102z being centered about -1 g during time periods P1, P2, and P3 (as opposed to the lateralaxis sensor data 102x and the longitudinalaxis sensor data 102y being centered about o g during time periods P1, P2, and P3). - A similar trend may be observed when the
electronic device 101 is on a human lap in a first orientation (e.g. during time periods P4, P5, and P6 shown inFIG. 2 ). For example, less vibrations are observed in thesensor data electronic device 101 is used for passive activity (e.g. in time period P4) than when typing is performed on or using the electronic device 101 (e.g. in time periods P5 and P6). Additionally, since more intense typing is performed during time period P6, vibrations that occur during time period P6 have greater amplitude than vibrations that occur during time period P5. Similarly, a significant amount of the vibrations observed in thesensor data axis sensor data 102z since typing has a significant vector component in the vertical direction (e.g. the z axis). The significant vector component in the vertical direction also manifests itself in the normalaxis sensor data 102z being centered about -1 g during time periods P4, P5, and P6 (as opposed to the lateralaxis sensor data 102x being centered about approximately 0.2 g and the longitudinalaxis sensor data 102y being centered about 0 g during time periods P4, P5, and P6). - The above-described trend may also be observed when the
electronic device 101 is on a human lap in a second orientation (e.g. during time periods P7, P8, and P9 shown inFIG. 2 ). For example, less vibrations are observed in thesensor data electronic device 101 is used for passive activity (e.g. in time period P7) than when typing is performed on or using the electronic device 101 (e.g. in time periods P8 and P9). Additionally, since more intense typing is performed during time period P9, vibrations that occur during time period P9 have greater amplitude than vibrations that occur during time period P8. Similarly, a significant amount of the vibrations observed in thesensor data axis sensor data 102z since typing has a significant vector component in the vertical direction (e.g. the z axis). The significant vector component in the vertical direction also manifests itself in the normalaxis sensor data 102z being centered about -1 g during time periods P7, P8, and P9 (as opposed to the lateralaxis sensor data 102x being centered about approximately -0.2 g and the longitudinalaxis sensor data 102y being centered about 0 g during time periods P7, P8, and P9). - As described above, the orientation (e.g. tilt) of the
electronic device 101 may affect thesensor data motion sensor 102, and this is also observed in thesensor data FIG. 2 . For example, during time periods P1, P2, and P3 when theelectronic device 101 is on a flat desk, the angle subtended between the base of the laptop computer and the horizontal plane is substantially zero. The orientation or tilt of theelectronic device 101 affects thesensor data FIG. 2 , the lateralaxis sensor data 102x and the longitudinalaxis sensor data 102y are centered about 0 g during time periods P1, P2, and P3 since the angle subtended between the base of the laptop computer and the horizontal plane is substantially zero. - On the other hand, during time periods P4, P5, and P6 when the
electronic device 101 is on a human lap in the first orientation, the angle subtended between the base of the laptop computer and the horizontal plane is not substantially zero. This is also the case during time periods P7, P8, and P9 when theelectronic device 101 is on a human lap in the second orientation. The orientation or tilt of theelectronic device 101 affects thesensor data FIG. 2 , the lateralaxis sensor data 102x is offset from 0 g, while the longitudinalaxis sensor data 102y is centered about 0 g during time periods P4 to P9 since the angle subtended between the base of the laptop computer and the horizontal plane is not substantially zero. - As shown in
FIG. 2 , the offset of the lateralaxis sensor data 102x from 0 g is positive during time periods P4, P5, and P6, but negative during time periods P7, P8, and P9. This is, again, due to the different orientations of the laptop computer in the time periods P4, P5, and P6 and the time periods P7, P8 and P9. For example, during the time periods P4, P5, and P6, the laptop computer is tilted downwards (e.g. as shown inFIG. 3B ), thereby causing the positive offset of the lateralaxis sensor data 102x from 0 g during time periods P4, P5, and P6. On the other hand, during the time periods P7, P8, and P9, the laptop computer is tilted upwards (e.g. as shown inFIG. 3C ), thereby causing the negative offset of the lateralaxis sensor data 102x from o g during time periods P7, P8, and P9. - Based on the description above, it follows that the amount of activity performed on or using the
electronic device 101 may be determined from thesensor data electronic device 101 is in contact with the body of a human user. Additionally, it follows that the orientation (or tilt) of theelectronic device 101 may be determined from thesensor data electronic device 101 is in contact with the body of a human user. - Consequently, referring back to
FIG. 1 , thedetection system 100 may include a first feature detection circuit 104-1, a second feature detection circuit 104-2, or both. Each of the first feature detection circuit 104-1 and the second detection circuit 104-2 may be configured to receive thesensor data electronic device 101 from thesensor data electronic device 101 from thesensor data - At least a portion of the first feature detection circuit 104-1 may be included in a processor (e.g. of the electronic device 101). The first feature detection circuit 104-1 may output a first metric 106-1 that is indicative of the amount of activity performed on or using the
electronic device 101. In some embodiments, the first metric 106-1 may be, or may be indicative of, the total number of zero crossings that occur in thesensor data - A greater number of zero crossings may be indicative of a greater amount of activity performed on or using the
electronic device 101, while a smaller number of zero crossings may be indicative of a lesser amount of activity performed on or using theelectronic device 101. For example, referring toFIG. 2 , the number of zero crossings that occur in the time periods P1, P2, and P3 may be greater than the number of zero crossings that occur in the time periods P4, P5, and P6 or in the time periods P7, P8, and P9. This may be a result of both the lateralaxis sensor data 102x and the longitudinalaxis sensor data 102y being centered about 0 g during time periods P1, P2, and P3, thereby increasing the total number of zero crossings that occur in the time periods P1, P2, and P3 (e.g. compared to time periods P4, P5, and P6 or time periods P7, P8, and P9). The normalaxis sensor data 102z is centered about -1 g during time periods P1, P2, and P3, and therefore has a minimal contribution to the total number of zero crossings that occur in the time periods P1, P2, and P3 despite its large vibrational amplitudes. - On the other hand, only the longitudinal
axis sensor data 102y may be centered about 0 g during time periods P4, P5, and P6. The normalaxis sensor data 102z is centered about -1 g during time periods P4, P5, and P6, and therefore has a minimal contribution to the total number of zero crossings that occur in the time periods P4, P5, and P6 despite its large vibrational amplitudes. Furthermore, the lateralaxis sensor data 102x is centered about 0.2 g and has small vibrational amplitudes during time periods P4, P5, and P6, and therefore has a minimal contribution to the total number of zero crossings that occur in the time periods P4, P5, and P6. - Similarly, only the longitudinal
axis sensor data 102y may be centered about 0 g during time periods P7, P8, and P9. The normalaxis sensor data 102z is centered about -1 g during time periods P7, P8, and P9, and therefore has a minimal contribution to the total number of zero crossings that occur in the time periods P7, P8, and P9 despite its large vibrational amplitudes. Furthermore, the lateralaxis sensor data 102x is centered about -0.2 g and has small vibrational amplitudes during time periods P7, P8, and P9, and therefore has a minimal contribution to the total number of zero crossings that occur in the time periods P7, P8, and P9. - Consequently, based on the above-description of the total number of zero crossings that occur in the
sensor data electronic device 101 is in contact with the body of a human user. - As another example of how the total number of zero crossings that occur in the
sensor data electronic device 101 is in contact with the body of a human user, thesensor data electronic device 101 is in contact with an inanimate object (e.g. a table). White noise may typically be characterized by random fluctuations that occur over a wide range of frequencies and this may result in a higher number of zero crossings in a predetermined time window (e.g. in comparison withsensor data electronic device 101 is in contact with a human body). On the other hand, when theelectronic device 101 is in contact with a human body, thesensor data electronic device 101 is in contact with a human body (e.g. in comparison withsensor data electronic device 101 is not in contact with a human body). This leads to a similar result of a smaller number of zero crossings indicating that theelectronic device 101 is in contact with the body of a human user. - The amount of activity performed on or using the
electronic device 101, by itself, may be insufficient or inaccurate in indicating whether theelectronic device 101 is in contact with the body of a human user. For example, theelectronic device 101 may be placed on an inclined desk and not be in contact with the body of a human user. As such, using solely the first metric 106-1 (e.g. indicative of the total number of zero crossings that occur in thesensor data electronic device 101 is in contact with the body of a human user. Consequently, additional features may need to be determined or extracted from thesensor data electronic device 101 is in contact with the body of a human user. - As described above, the orientation or tilt of the
electronic device 101 may affect thesensor data motion sensor 102, and this may be used (e.g. in addition to the first metric 106-1) to determine whether theelectronic device 101 is in contact with the body of a human user. As described above, the second feature detection circuit 104-2 may be configured to determine the orientation of theelectronic device 101 from thesensor data electronic device 101. The second metric 106-2 may be determined by computing a mean orientation (e.g. mean tilt angle) of theelectronic device 101 in a predetermined time window (e.g. a window having about 100 samples). - In some embodiments, the second metric 106-2 may be, or may be indicative of, an angle subtended between the electronic device 101 (e.g. a base or any other plane of the electronic device 101) and a reference plane (e.g. a horizontal plane or leveled ground). A greater angle subtended between the
electronic device 101 and a reference plane may indicate that theelectronic device 101 is on an inclined plane (e.g. on a part of the body of a human user), while a smaller angle may indicate that theelectronic device 101 is on a substantially flat plane (e.g. on a flat desk). The second metric 106-2 may be expressed in terms of roll and pitch. For example, the motion sensor 102 (e.g. accelerometer) may measure the gravitational force exerted on theelectronic device 101 in each plane of motion (e.g. vectors AccX, AccY, AccZ), and the angle subtended between theelectronic device 101 and a reference plane may be determined from the vectors AccX, AccY, AccZ. Illustratively, roll may be given as atan (AccY/AccZ), while pitch may be given by atan
- Alternatively, or in addition, the second metric 106-2 may be a rate of change of the angle subtended between the
electronic device 101 and a reference plane. When theelectronic device 101 is placed on an inanimate object (e.g. a flat or an inclined desk), the angle subtended between theelectronic device 101 and a reference plane may not change as frequently as when theelectronic device 101 is in contact with the body of a human user. - The orientation of the
electronic device 101, by itself, may be insufficient or inaccurate in indicating whether theelectronic device 101 is in contact with the body of a human user. For example, theelectronic device 101 may be placed on an inclined desk and not be in contact with the body of a human user. Using solely the orientation of theelectronic device 101 may erroneously lead to a determination that theelectronic device 101 is in contact with the body of a human user. Consequently, additional features may need to be determined or extracted from thesensor data electronic device 101 is in contact with the body of a human user. As described above, the placement of the electronic device 101 (e.g. on a part of the human or on an inanimate object) may affect thesensor data motion sensor 102, and this may be observed in a spectrogram of thesensor data FIG. 2 . -
FIG. 4 shows aspectrogram 400 of thesensor data FIG. 2 , in accordance with an embodiment. Thespectrogram 400 shows the variation of frequencies with respect to time, and in thespectrogram 400 show inFIG. 4 , the horizontal axis denotes frequency (measured in Hz) and ranges from 0 Hz to about 25 Hz, while the vertical axis denotes time (measured in seconds). Thespectrogram 400 is a short-time Fourier transform (STFT) of the norm (or magnitude) of thesensor data FIG. 2 , in which a sliding window of about 100 samples is used. Thespectrogram 400 inFIG. 4 is shown with a default map and derives from a conversion in shades of grey of a color map (attached to the filing documents) wherein the amplitude of a particular frequency at a particular time is represented by the intensity or color of each point in thespectrogram 400. Illustratively, in the original color map, a hotter color (e.g. a more yellow, orange, or red color) indicates a higher amplitude of a particular frequency at a particular time, while a cooler color (e.g. a more cyan or blue color) indicates a lower amplitude of a particular frequency at a particular time. - Human bodies, on average, have a characteristic vibration in the range from about 5 Hz to about 15 Hz (e.g. indicated in
FIG. 4 as frequency band FB). As such, when theelectronic device 101 is in contact with a human body (e.g. as in time periods P4 to P9 inFIGS. 2 and4 ), such characteristic vibration of the human body may be sensed by themotion sensor 102 and may manifest itself in thesensor data - The contribution of the characteristic vibration of the human body to the
sensor data spectrogram 400 in the regions of thespectrogram 400 encompassed by theboundaries electronic device 101 is in contact with the human body, the frequencies in the frequency band FB have greater amplitudes in comparison to frequencies outside the frequency band FB. For example, in time period P4 (e.g. when theelectronic device 101 is placed on a human lap in a first orientation and used for passive activity), the frequencies between 5 Hz and about 15 Hz have greater amplitudes in comparison to frequencies outside the frequency band FB. Similarly, in time period P7 (e.g. when theelectronic device 101 is placed on a human lap in a second orientation and used for passive activity), the frequencies between 5 Hz and about 15 Hz have greater amplitudes in comparison to frequencies outside the frequency band FB. In comparison, in time period P1 (e.g. when theelectronic device 101 is placed on a desk and used for passive activity), the frequencies between 5 Hz and about 15 Hz have amplitudes that are similar to frequencies outside the frequency band FB. As such, during time period P1, there is no additional contribution to frequencies within the frequency band FB, and thus, a low and almost white noise is observed in thespectrogram 400 during time period P1. - There may be sources of vibrations other than from the human body, examples being vibrations generated by typing performed on or using the
electronic device 101 or vibrations generated by a fan or a cooling mechanism included in theelectronic device 101. Nonetheless, vibrations introduced into thesensor data sensor data sensor data sensor data spectrogram 400 shown inFIG. 4 . - In particular, for a given time period in which the
electronic device 101 is not in contact with the human body but where typing occurs (e.g. in time periods P2 and P3), all frequencies in the range of 0 Hz and about 25 Hz show increased amplitudes. As such, as mentioned above, typing contributes to an increased noise floor, but such noise is almost white (e.g. uniform across all frequencies between 0 Hz and about 25 Hz). On the other hand, for a given time period in which theelectronic device 101 is in contact with the human body but where typing occurs (e.g. in time periods P5, P6, P8, and P9), there is an increase in the amplitude of all frequencies between 0 Hz and about 25 Hz, but there is a concentration of energy in thespectrogram 400 within the frequency band FB (e.g. between about 5 Hz and about 15 Hz). The concentration of energy in thespectrogram 400 within the frequency band FB when theelectronic device 101 is in contact with a lap of the human body is also observed when theelectronic device 101 is in contact with the hand, head, arm, or chest of the human body. This is shown in the spectrograms illustrated inFIGS. 5A to 5E . -
FIGS. 5A to 5E show spectrograms illustrating the frequency content of thesensor data electronic device 101 is in contact with various parts of the human body, in accordance with an embodiment. In the spectrograms ofFIGS. 5A to 5E , the horizontal axis denotes frequency (measured in Hz) and ranges from 0 Hz to about 25 Hz, while the vertical axis denotes time (measured in seconds). The spectrograms ofFIGS. 5A to 5E are short-time Fourier transform (STFT) of the norm (or magnitude) ofsensor data sensor data electronic device 101 having themotion sensor 102 on a particular part of the human body (e.g. indicated inFIGS. 5A to 5E as time period P10), followed by placing theelectronic device 101 having themotion sensor 102 on a desk (e.g. indicated inFIGS. 5A to 5E as time period P11). The spectrograms inFIGS. 5A to 5E are shown with a default color map and derives from a conversion in shades of grey of a color map (attached to the filing documents) wherein the amplitude of a particular frequency at a particular time is represented by the intensity or color of each point in the spectrogram. Illustratively, in the original color map, a hotter color (e.g. a more yellow, orange, or red color) indicates a higher amplitude of a particular frequency at a particular time, while a cooler color (e.g. a more cyan or blue color) indicates a lower amplitude of a particular frequency at a particular time. - Based on the description given above in respect of
FIG. 4 , it may be expected that there is a concentration of energy in the spectrograms within the frequency band FB (e.g. between about 5 Hz and about 15 Hz) when theelectronic device 101 is in contact with a particular part of the human body (e.g. during time period P10). On the other hand, it may also be expected that the spectrogram is uniform across all frequencies between 0 Hz and about 25 Hz when theelectronic device 101 is placed on a desk (e.g. during time period P11). Indeed, this is seen in the spectrograms shown inFIGS. 5A to 5E . - As shown in
FIG. 5A , the characteristic vibration of the human body manifests in the spectrogram in the regions of the spectrogram encompassed by theboundary 502. When theelectronic device 101 is in contact with a hand or a wrist of the human body (during time period P10), the frequencies between 5 Hz and about 15 Hz have greater amplitudes in comparison to frequencies outside the frequency band FB. Conversely, when the electronic device is in placed on a desk (during time period P11), the frequencies between 5 Hz and about 15 Hz have amplitudes that are similar to frequencies outside the frequency band FB. - As shown in
FIG. 5B , the characteristic vibration of the human body manifests in the spectrogram in the regions of the spectrogram encompassed by theboundary 504. When theelectronic device 101 is in contact with an arm of the human body (during time period P10), the frequencies between 5 Hz and about 15 Hz have greater amplitudes in comparison to frequencies outside the frequency band FB. Conversely, when the electronic device is in placed on a desk (during time period P11), the frequencies between 5 Hz and about 15 Hz have amplitudes that are similar to frequencies outside the frequency band FB. - As shown in
FIG. 5C , the characteristic vibration of the human body manifests in the spectrogram in the regions of the spectrogram encompassed by theboundary 506. When theelectronic device 101 is in contact with the chest of the human body (during time period P10), the frequencies between 5 Hz and about 15 Hz have greater amplitudes in comparison to frequencies outside the frequency band FB. Conversely, when the electronic device is in placed on a desk (during time period P11), the frequencies between 5 Hz and about 15 Hz have amplitudes that are similar to frequencies outside the frequency band FB. - As shown in
FIG. 5D , the characteristic vibration of the human body manifests in the spectrogram in the regions of the spectrogram encompassed by theboundary 508. When theelectronic device 101 is in contact with the head of the human body (during time period P10), the frequencies between 5 Hz and about 15 Hz have greater amplitudes in comparison to frequencies outside the frequency band FB. Conversely, when the electronic device is in placed on a desk (during time period P11), the frequencies between 5 Hz and about 15 Hz have amplitudes that are similar to frequencies outside the frequency band FB. - As shown in
FIG. 5E , the characteristic vibration of the human body manifests in the spectrogram in the regions of the spectrogram encompassed by theboundary 510. When theelectronic device 101 is in contact with the lap of the human body (during time period P10), the frequencies between 5 Hz and about 15 Hz have greater amplitudes in comparison to frequencies outside the frequency band FB. Conversely, when the electronic device is in placed on a desk (during time period P11), the frequencies between 5 Hz and about 15 Hz have amplitudes that are similar to frequencies outside the frequency band FB. - Consequently, based on the description given above in respect of
FIGS. 4 and5A to 5E , spectral features of thesensor data electronic device 101 is in contact with a human body. As such, referring back toFIG. 1 , thedetection system 100 may include a third feature detection circuit 104-3 configured to receive thesensor data sensor data - At least a portion of the third feature detection circuit 104-3 may be included in a processor (e.g. of the electronic device 101). The third feature detection circuit 104-3 may output a third metric 106-3 that is indicative of the spectral energy present in the frequency band FB (e.g. about 5 Hz to about 15 Hz). In some embodiments, the third metric 106-3 may be, or may be indicative of, at least one of the following: an energy in the frequency band FB; a ratio of the energy in the frequency band FB to the total energy of the
sensor data sensor data -
FIG. 6 shows a block diagram 600 illustrating the internal circuitry of the third feature detection circuit 104-3, in accordance with an embodiment. Additionally,FIG. 7 shows amethod 700 of determining the third metric 106-3, in accordance with an embodiment. Themethod 700 may be executed by the third feature detection circuit 104-3 shown inFIG. 6 . In the example shown inFIGS. 6 and7 , the third metric 106-3 determined by the third feature detection circuit 104-3 may be, or may be indicative of, an average normalized power of thesensor data sensor data - As shown in
FIG. 6 , the third feature detection circuit 104-3 may include a magnitude computation circuit 602, which is configured to determine the magnitude (or norm) of acceleration for each sample of thesensor data step 702 of method 700). Suppose each sample is denoted by the index n, each sample of the lateralaxis sensor data 102x is denoted by AccX[n], each sample of the longitudinalaxis sensor data 102y is denoted by AccY[n], and each sample of the normalaxis sensor data 102z is denoted by AccZ[n]. Then, the magnitude of acceleration (denoted as |Acc[n]|) for each sample n of thesensor data 
FIG. 6 , the magnitude computation circuit 602 and the mathematical operation described above may be implemented by such a processor. - The third feature detection circuit 104-3 may further include a
summer 604, which is configured to compensate for the acceleration due to gravity (e.g. as instep 704 of method 700). This may be accomplished by subtracting 1 from the magnitude of acceleration |Acc[n]| for each sample n of thesensor data FIG. 6 . The output of thesummer 604 may be a compensated magnitude ofacceleration 605. - The third feature detection circuit 104-3 may include a first filter 606-1 and a second filter 606-2, each of which may be configured to receive, as an input, the compensated magnitude of
acceleration 605. The first filter 606-1 and the second filter 606-2 may filter the compensated magnitude of acceleration 605 (e.g. as insteps - The third feature detection circuit 104-3 may include a first energy computation circuit 608-1 and a second energy computation circuit 608-2. The first energy computation circuit 608-1 may be configured to determine the energy of the output of the first filter 606-1, while the second energy computation circuit 608-2 may be configured to determine the energy of the output of the second filter 606-2 (e.g. as in
step 708 of method 700). Consequently, the first energy computation circuit 608-1 may be configured to determine the energy of thesensor data sensor data - In some embodiments, the energy of the output of each of the first filter 606-1 and the second filter 606-2 may be determined for a running time window having a predetermined duration (e.g. about 2 seconds or about 100 samples). For example, suppose each sample is denoted by the index n, each sample of the output of the first filter 606-1 is denoted by AccBP[n], and each sample of the output of the second filter 606-2 is denoted by AccHP[n]. Then, the energy of each sample n of the output of the first filter 606-1 (denoted as EN_BP[n]) may be determined by performing the following mathematical operation:


FIG. 6 , the energy computation circuits 608-1 and 608-2, and the mathematical operations described above, may be implemented by such a processor. - The third feature detection circuit 104-3 may further include a normalized
power computation circuit 610, which may be configured to determine a normalized power based on the energy of the output of the first filter 606-1 and the energy of the output of the second filter 606-2 (e.g. as instep 710 of method 700). For example, the normalizedpower computation circuit 610 may be configured to determine the ratio of the energy of thesensor data sensor data FIG. 6 , the normalizedpower computation circuit 610, and the mathematical operation described above, may be implemented by such a processor. - The third feature detection circuit 104-3 may further include an averaging
circuit 612 configured to determine an average normalized power based on the output of the normalized power computation circuit 610 (e.g. as instep 712 of method 700). Consequently, the averagingcircuit 612 may be configured to determine an average of a ratio of the energy in the frequency band FB to the energy outside the frequency band FB. Suppose each sample is denoted by the index n, then the average normalized power (denoted as AV_Norm_PWR [n]) may be determined by performing the following mathematical operation: AV_Norm_PWR[n] =
FIG. 6 , the averagingcircuit 612, and the mathematical operation described above, may be implemented by such a processor. As shown in the example ofFIG. 6 , the average normalized power AV_Norm_PWR [n] may be output by the third feature detection circuit 104-3 as the third metric 106-3. -
FIG. 8 shows aplot 800 of the average normalized power AV_Norm_PWR [n] of thesensor data FIG. 2 using themethod 700 ofFIG. 7 , in accordance with an embodiment. In theplot 800, the horizontal axis denotes the sample index n, while the vertical axis denotes average normalized power in arbitrary units. As shown inFIG. 8 , the average normalized power AV_Norm_PWR [n] (which may be an average of a ratio of the energy in the frequency band FB to the energy outside the frequency band FB) in larger when theelectronic device 101 is in contact with a human body. This may be attributed to the characteristic vibration of the human body that increases the energy of frequencies in the frequency band FB (relative to frequencies outside the frequency band FB) when theelectronic device 101 is in contact with a human body.FIG. 8 also shows that the increase in the average normalized power AV_Norm_PWR [n] is well above a threshold, thereby suggesting that a noise baseline rejection may be used in conjunction with the average normalized power AV_Norm_PWR [n] to determine whether theelectronic device 101 is in contact with a human body. In the example shown inFIG. 8 , the threshold is set to about 1.8, although other threshold levels may be possible in other embodiments, depending on the noise baseline generated using themethod 700 ofFIG. 7 . - Referring back to
FIG. 1 , thedetection system 100 includes aclassifying circuit 108, which may be configured to determine whether theelectronic device 101 is in contact with a human body based on at least the third metric 106-3. In other words, in some embodiments, the classifyingcircuit 108 may use merely the third metric 106-3 (e.g. the average normalized power of thesensor data electronic device 101 is in contact with a human body. In other embodiments, the classifyingcircuit 108 may use the third metric 106-3 and at least one of the first metric 106-1 (e.g. the total number of zero crossings that occur in thesensor data electronic device 101 and a reference plane) to determine whether theelectronic device 101 is in contact with a human body. - The
classifying circuit 108 may generate a decision based, at least in part, on the first metric 106-1 (e.g. where a smaller number of zero crossings may indicate that theelectronic device 101 is in contact with the body of a human user). Theclassifying circuit 108 may generate a decision based, at least in part, on the second metric 106-2 (e.g. where a greater angle subtended between theelectronic device 101 and a reference plane, or a greater rate of change thereof, may indicate that theelectronic device 101 is in contact with the body of a human user). Theclassifying circuit 108 may generate a decision based, at least in part, on the third metric 106-3 (e.g. where an average normalized power above a threshold may indicate that theelectronic device 101 is in contact with the body of a human user). - The
classifying circuit 108 may be a machine learning classifier implemented using machine learning techniques, examples being a decision tree, linear regression, logistic regression, support vector machine (SVM), naive Bayes, k-nearest neighbors, k-means, random forest, gradient boost, among others. To further enhance the accuracy of the determination of whether theelectronic device 101 is in contact with a human body, the classifyingcircuit 108 may implement a time-based voting method. In a time-based voting method, the classifyingcircuit 108 may output an interim decision every time a new set of metrics 106-1, 106-2, and 106-3 is computed. A history of the interim decisions of theclassifying circuit 108 for a given set of metrics 106-1, 106-2, and 106-3 may be maintained (e.g. stored in a memory) and a final decision of theclassifying circuit 108 may be based on this history of interim decisions. As an example of the time-based voting method, the metrics 106-1, 106-2, and 106-3 may be computed every 2 seconds. In such an example, there may be a new interim decision from the classifyingcircuit 108 every 2 seconds, and the interim decisions of theclassifying circuit 108 for a 30 second window of time may be stored in history. As such, there may be 15 interim decisions that theclassifying circuit 108 may use to render a final decision. Out of these 15 interim decisions, a voting may be performed, and the interim decision with the highest vote may be declared as the final decision of theclassifying circuit 108. - An
output 110 of theclassifying circuit 108 may indicate whether theelectronic device 101 is in contact with a human body. For example, theoutput 110 of theclassifying circuit 108 may be expressed as a ternary signal, where ternary o indicates an unknown state, where ternary 1 indicates a determination that theelectronic device 101 is in contact with a human body, and where ternary 2 indicates a determination that theelectronic device 101 is not in contact with a human body. Theoutput 110 of theclassifying circuit 108 may be updated every 5 seconds or less. - The
detection system 100 may include astate monitor 112, and theoutput 110 of theclassifying circuit 108 may be provided to thestate monitor 112. The state monitor 112 may be implemented using a controller and a memory register. Theoutput 110 of theclassifying circuit 108 may be stored in the memory register of thestate monitor 112, and the controller of thestate monitor 112 may be configured to read the content of the memory register. - In response to the
output 110 of theclassifying circuit 108 indicating that theelectronic device 101 is in contact with a human body, thestate monitor 112 may generate an interruptsignal 114 that may adapt the behavior or operation ofelectronic device 101 is such a way that high temperatures are circumvented and burning of human skin is avoided. For example, in an embodiment where theelectronic device 101 is a laptop computer, the interruptsignal 114 generated by the state monitor may control a cooling fan of the laptop computer to reduce internal temperatures of the laptop computer, thereby avoiding harm to human skin. - Additionally or alternative, the interrupt
signal 114 may place theelectronic device 101 in a power-down mode in an effort to reduce power consumption and extend battery life. For example, in an embodiment where theelectronic device 101 is a pair of Bluetooth headphones, the interruptsignal 114 may place the headphones in a low-power mode in response to theoutput 110 of theclassifying circuit 108 indicating that the headphones are not in contact with a human body. As another example, in an embodiment were theelectronic device 101 is a wearable heart rate sensor, the interruptsignal 114 may turn on the sensor in response to theoutput 110 of theclassifying circuit 108 indicating that the sensor is in contact with a human body, or turn off the sensor in response to theoutput 110 of theclassifying circuit 108 indicating that the sensor is not in contact with a human body. - In some embodiments, the state monitor 112 stores a
previous output 110 of the classifying circuit 108 (e.g. in the memory register) and compares theprevious output 110 to acurrent output 110 of theclassifying circuit 108. Such a comparison may be performed by the controller of thestate monitor 112. The state monitor 112 may output the interruptsignal 114 in response to thecurrent output 110 of theclassifying circuit 108 being different from theprevious output 110 of theclassifying circuit 108. Illustratively, this generation of the interruptsignal 114 may be useful in applications where the interruptsignal 114 places theelectronic device 101 in a power-down mode (e.g. when not in contact with a human body) or power-up mode (e.g. when in contact with a human body) in an effort to reduce power consumption and extend battery life. - In summary, the human body has a characteristic vibration that can be measured using a motion sensor like an accelerometer. This characteristic vibration ranges from about 5 Hz to about 15 Hz (e.g. denoted as the frequency band FB) and can be observed using the frequency response of a motion signal generated by the motion sensor. This characteristic vibration may be sensed on almost all parts of the human body, including the hand, lap, head, arm, and chest. The characteristic vibration may be analyzed and used to determine whether an electronic device is in contact with a human body. In particular, a metric (e.g. the third metric 106-3) may be used that is indicative of at least one of the following: an energy in the frequency band FB; a ratio of the energy in the frequency band FB to the total energy of the motion signal generated by the motion sensor; a ratio of the energy in the frequency band FB to the energy outside the frequency band FB; an average of the energy in the frequency band FB; an average of a ratio of the energy in the frequency band FB to the total energy of the motion signal generated by the motion sensor; or an average of a ratio of the energy in the frequency band FB to the energy outside the frequency band FB. In response to a determination that the
electronic device 101 is in contact with a human body, the behavior or operation of theelectronic device 101 may be adapted (e.g. using the interrupt signal 114) to reduce elevated temperatures or to reduce power consumption and extend battery life. Additionally, other metrics (e.g. the first metric 106-1 and the second metric 106-2) may be combined with metric indicative of the characteristic vibration of the human body. For example, metrics indicative of the orientation of theelectronic device 101 and/or the amount of activity performed on or using theelectronic device 101 may also be used to determine whether theelectronic device 101 is in contact with a human body. Thedetection system 100 shown inFIG. 1 and the solution provided by it may be implemented using limited resources (e.g. one accelerometer) and can be broadly used since each feature (e.g. orientation, activity, and spectral property) may be determined or extracted when the electronic device is in contact with any part of the human body. - A system may include a motion sensor configured to generate a motion signal in response to a movement of an electronic device, and at least one feature detection circuit configured to determine at least one metric based on the motion signal. The system may further include a classifying circuit configured to determine whether the electronic device is in contact with a human body based on the at least one metric.
- A system may include an accelerometer configured to generate an output signal in response to a vibration or orientation of an electronic device. The system may further include a plurality of feature detection circuits having inputs coupled to an output of the accelerometer, the plurality of feature detection circuits being configured to determine a plurality of metrics indicative of a plurality of characteristics of the output signal. The system may additionally include a classifying circuit configured to determine whether the electronic device is in contact with a human body based on the plurality of metrics, and a controller configured to adapt an operation of the electronic device based on whether the electronic device is in contact with the human body.
- A method may include generating a motion signal in response to a movement of an electronic device; determining at least one characteristic of the motion signal; generating at least one metric indicative of the at least one characteristic of the motion signal; and determining whether the electronic device is in contact with a human body based on the at least one metric.
- Those of skill in the art will further appreciate that the various illustrative logical blocks, modules, circuits, and algorithms described in connection with the embodiments disclosed herein may be implemented as electronic hardware, instructions stored in memory or in another computer-readable medium and executed by a processor or other processing device, or combinations of both. The devices and processing systems described herein may be employed in any circuit, hardware component, integrated circuit (IC), or IC chip, as examples. Memory disclosed herein may be any type and size of memory and may be configured to store any type of information desired. To clearly illustrate this interchangeability, various illustrative components, blocks, modules, circuits, and steps have been described above generally in terms of their functionality. How such functionality is implemented depends upon the particular application, design choices, and/or design constraints imposed on the overall system. Skilled artisans may implement the described functionality in varying ways for each particular application, but such implementation decisions should not be interpreted as causing a departure from the scope of the present invention.
- The various illustrative logical blocks, modules, and circuits described in connection with the embodiments disclosed herein may be implemented or performed with a processor, a digital signal processor (DSP), an Application Specific Integrated Circuit (ASIC), a field programmable gate array (FPGA) or other programmable logic device, discrete gate or transistor logic, discrete hardware components, or any combination thereof designed to perform the functions described herein. A processor may be a microprocessor, but in the alternative, the processor may be any conventional processor, controller, microcontroller, or state machine. A processor may also be implemented as a combination of computing devices, e.g., a combination of a DSP and a microprocessor, a plurality of microprocessors, one or more microprocessors in conjunction with a DSP core, or any other such configuration.
- The embodiments disclosed herein may be embodied in hardware and in instructions that are stored in hardware, and may reside, for example, in Random Access Memory (RAM), flash memory, Read Only Memory (ROM), Electrically Programmable ROM (EPROM), Electrically Erasable Programmable ROM (EEPROM), registers, a hard disk, a removable disk, a CD-ROM, or any other form of computer-readable medium known in the art. An exemplary storage medium is coupled to the processor such that the processor can read information from, and write information to, the storage medium. In the alternative, the storage medium may be integral to the processor. The processor and the storage medium may reside in an ASIC.
- While this invention has been described with reference to illustrative embodiments, this description is not intended to be construed in a limiting sense. Various modifications and combinations of the illustrative embodiments, as well as other embodiments of the invention, will be apparent to persons skilled in the art upon reference to the description. It is therefore intended that the appended claims encompass any such modifications or embodiments.
Claims (17)
- A system intended to be coupled to an electronic device (101), comprising:a motion sensor (102) configured to generate a motion signal in response to a movement of the electronic device (101);at least one feature detection circuit (104-1, 104-2, 104-3) configured to determine at least one metric based on the motion signal; anda classifying circuit (108) configured to determine whether the electronic device (100) is in contact with a human body based on the at least one metric.
- The system of claim 1, wherein the at least one feature detection circuit (104-3) is configured to determine a spectral feature of the motion signal, and wherein the at least one metric is indicative of the spectral feature.
- The system of claim 2, wherein the spectral feature comprises at least one of an energy in a frequency band, a ratio of the energy in the frequency band to a total energy of the motion signal, a ratio of the energy in the frequency band to an energy outside the frequency band or an average thereof.
- The system of claim 3, wherein the frequency band is between about 5 Hz and about 15 Hz.
- The system of claim 2 or 3, wherein the at least one feature detection circuit comprises:a magniture computation circuit (602) determining a magnitude of acceleration for each sample of the motion signal;a first filter (606-1) filtering the magnitude of acceleration in a first frequency band;a second filter (606-2) filtering the magnitude of acceleration in a second frequency band;an energy computation circuit (608-1, 608-2) determining a first energy as an energy of an output of the first filter and a second energy as an energy of an output of the second filter;a normalized power computation circuit (610) determining a ratio of the first energy to the second energy; andan averaging circuit (612) determining an average of the ratio determined by the normalized power computation circuit (610).
- The system of any of claims 1-5, wherein the motion sensor (102) comprises an accelerometer, and wherein the motion signal comprises an acceleration of the electronic device 100 in each axis of motion.
- The system of any of claims 1-6, wherein the at least one feature detection circuit (104-1) is configured to determine an orientation of the electronic device based on the motion signal, and wherein the at least one metric is indicative of the orientation of the electronic device.
- The system of any of claims 1-7, wherein the at least one feature detection circuit (104-2) is configured to determine an amount of activity performed on the electronic device based on the motion signal, and wherein the at least one metric is indicative of the amount of activity performed on the electronic device.
- The system of any of claims 2-6, further comprising:a second feature detection circuit (104-1) configured to determine an orientation of the electronic device based on the motion signal and to determine a second metric indicative of the orientation of the electronic device;a third feature detection circuit (104-2) configured to determine an amount of activity performed on the electronic device based on the motion signal and to determine a third metric indicative of the amount of activity performed on the electronic device;wherein the classifying circuit (108) is configured to determine whether the electronic device (101i)s in contact with a human body based on the at least one and the second and third metrics; anda controller (112) configured to adapt an operation of the electronic device based on whether the electronic device is in contact with the human body.
- The system of claim 9, wherein the controller (112) is configured to place the electronic device (101) is a low-power mode in response to a determination that the electronic device is not in contact with the human body.
- The system of claim 9 or 10, wherein the third feature detection circuit (104-2) is configured to determine a number of zero crossings of the motion signal in a predetermined time, and wherein the third metrics comprises a zero crossing metric indicative of the number of zero crossings of the motion signal in the predetermined time.
- The system of any of claims 1-11, wherein the classifying circuit (108) comprises a machine learning classifier.
- A method, comprising:generating a motion signal in response to a movement of an electronic device 101;determining at least one characteristic of the motion signal;generating at least one metric indicative of the at least one characteristic of the motion signal; anddetermining whether the electronic device is in contact with a human body based on the at least one metric.
- The method of claim 13, wherein determining at least one characteristic of the motion signal comprises determining an average normalized power of the motion signal.
- The method of claim 14, wherein determining whether the electronic device (101) is in contact with the human body comprises determining that the electronic device is in contact with the human body in response to the average normalized power of the motion signal being greater than a predetermined threshold.
- The method of claim 14 or 15, wherein determining the average normalized power of the motion signal comprises:determining a magnitude of acceleration for each sample of the motion signal;filtering the magnitude of acceleration using a first filter (606-1);filtering the magnitude of acceleration using a second filter (606-2);determining an energy of an output of the first filter and an energy of an output of the second filter;determining a ratio of the energy of the output of the first filter to the energy of the output of the second filter; anddetermining an average of the ratio of the energy of the output of the first filter to the energy of the output of the second filter.
- The method of claim 16, wherein the first filter (606-1) comprises a bandpass filter having a passband between about (5) Hz and about (15) Hz, and wherein the second filter (606-2) comprises a high-pass filter having a cutoff frequency of about (15) Hz.
Applications Claiming Priority (1)
| Application Number | Priority Date | Filing Date | Title |
|---|---|---|---|
| US15/423,318 US10802572B2 (en) | 2017-02-02 | 2017-02-02 | System and method of determining whether an electronic device is in contact with a human body |
Publications (1)
| Publication Number | Publication Date |
|---|---|
| EP3358440A1 true EP3358440A1 (en) | 2018-08-08 |
Family
ID=61198677
Family Applications (1)
| Application Number | Title | Priority Date | Filing Date |
|---|---|---|---|
| EP18154723.3A Withdrawn EP3358440A1 (en) | 2017-02-02 | 2018-02-01 | System and method of determining whether an electronic device is in contact with a human body |
Country Status (3)
| Country | Link |
|---|---|
| US (1) | US10802572B2 (en) |
| EP (1) | EP3358440A1 (en) |
| CN (2) | CN208367638U (en) |
Cited By (1)
| Publication number | Priority date | Publication date | Assignee | Title |
|---|---|---|---|---|
| US11599178B2 (en) | 2020-02-17 | 2023-03-07 | Stmicroelectronics S.R.L. | Method, electronic device system and computer-readable medium for managing transitions between a plurality of power states of an electronic device based on sensor data indicative of a change in an angle between a plane of base portion of the electronic device and plane of a lid portion of the electronic device |
Families Citing this family (24)
| Publication number | Priority date | Publication date | Assignee | Title |
|---|---|---|---|---|
| CA2958003C (en) | 2016-02-19 | 2022-04-05 | Paul Stanley Addison | System and methods for video-based monitoring of vital signs |
| US10802572B2 (en) * | 2017-02-02 | 2020-10-13 | Stmicroelectronics, Inc. | System and method of determining whether an electronic device is in contact with a human body |
| US10939824B2 (en) | 2017-11-13 | 2021-03-09 | Covidien Lp | Systems and methods for video-based monitoring of a patient |
| WO2019135877A1 (en) | 2018-01-08 | 2019-07-11 | Covidien Lp | Systems and methods for video-based non-contact tidal volume monitoring |
| US11547313B2 (en) | 2018-06-15 | 2023-01-10 | Covidien Lp | Systems and methods for video-based patient monitoring during surgery |
| WO2020033613A1 (en) | 2018-08-09 | 2020-02-13 | Covidien Lp | Video-based patient monitoring systems and associated methods for detecting and monitoring breathing |
| US11617520B2 (en) | 2018-12-14 | 2023-04-04 | Covidien Lp | Depth sensing visualization modes for non-contact monitoring |
| US11315275B2 (en) | 2019-01-28 | 2022-04-26 | Covidien Lp | Edge handling methods for associated depth sensing camera devices, systems, and methods |
| US11150708B2 (en) * | 2019-11-26 | 2021-10-19 | International Business Machines Corporation | Cooling system control component |
| US11484208B2 (en) | 2020-01-31 | 2022-11-01 | Covidien Lp | Attached sensor activation of additionally-streamed physiological parameters from non-contact monitoring systems and associated devices, systems, and methods |
| CN111381648A (en) * | 2020-03-03 | 2020-07-07 | 合肥联宝信息技术有限公司 | Cooling method, system, electronic equipment and computer storage medium |
| TWI783215B (en) * | 2020-03-05 | 2022-11-11 | 緯創資通股份有限公司 | Signal processing system and a method of determining noise reduction and compensation thereof |
| CN115244950B (en) * | 2020-03-12 | 2025-12-12 | 唯听助听器公司 | Audio streaming device |
| US12357194B2 (en) | 2020-07-09 | 2025-07-15 | Covidien Lp | Informative display for non-contact patient monitoring |
| JP7428383B2 (en) * | 2020-08-31 | 2024-02-06 | 国立大学法人岩手大学 | Swallowing function evaluation method and system using similarity of swallowing pattern images |
| US12514468B2 (en) | 2020-12-02 | 2026-01-06 | Covidien Lp | Patient position monitoring methods and systems |
| US12390124B2 (en) | 2021-01-27 | 2025-08-19 | Covidien Lp | Systems and methods for non-contact respiratory monitoring |
| US12437875B1 (en) * | 2021-08-31 | 2025-10-07 | United Services Automobile Association (Usaa) | Health management based on conditions at a user's residence |
| US12490904B2 (en) | 2021-10-08 | 2025-12-09 | Covidien Lp | Enhanced image for non-contact monitoring |
| US12482557B2 (en) | 2021-12-09 | 2025-11-25 | Covidien Lp | Systems and methods for improved non-contact patient monitoring of incubated neonates |
| US12374128B2 (en) | 2021-12-21 | 2025-07-29 | Covidien Lp | Non-contact depth sensing monitoring in vehicles |
| CN114428644B (en) * | 2022-01-24 | 2024-06-21 | 西安闻泰信息技术有限公司 | Working mode switching method, device, electronic device and storage medium |
| US20230371832A1 (en) * | 2022-05-19 | 2023-11-23 | Google Llc | Health metric measurements using head-mounted device |
| US12175024B2 (en) | 2022-10-20 | 2024-12-24 | Stmicroelectronics S.R.L. | System and method for determining whether an electronic device is located on a stationary or stable surface |
Citations (4)
| Publication number | Priority date | Publication date | Assignee | Title |
|---|---|---|---|---|
| US20110141006A1 (en) * | 2009-12-15 | 2011-06-16 | Apple Inc. | Detecting docking status of a portable device using motion sensor data |
| US20120016641A1 (en) * | 2010-07-13 | 2012-01-19 | Giuseppe Raffa | Efficient gesture processing |
| US20140365803A1 (en) * | 2013-06-07 | 2014-12-11 | Apple Inc. | Motion Fencing |
| US20150331462A1 (en) * | 2012-12-17 | 2015-11-19 | Hewlett-Packard Development Company, L.P. | Temperature Based on Touching Portable Computing Device |
Family Cites Families (8)
| Publication number | Priority date | Publication date | Assignee | Title |
|---|---|---|---|---|
| US4704696A (en) * | 1984-01-26 | 1987-11-03 | Texas Instruments Incorporated | Method and apparatus for voice control of a computer |
| US4973899A (en) * | 1989-08-24 | 1990-11-27 | Sundstrand Corporation | Current sensor and method utilizing multiple layers of thin film magneto-optic material and signal processing to make the output independent of system losses |
| US20090265671A1 (en) | 2008-04-21 | 2009-10-22 | Invensense | Mobile devices with motion gesture recognition |
| US8175728B2 (en) * | 2007-12-13 | 2012-05-08 | Georgia Tech Research Corporation | Detecting user gestures with a personal mobile communication device |
| US9632622B2 (en) * | 2009-07-16 | 2017-04-25 | Apple Inc. | Ground detection for touch sensitive device |
| US8542202B2 (en) * | 2009-12-31 | 2013-09-24 | Motorola Mobility Llc | Electronic device and method for determining a touch input applied to a capacitive touch panel system incorporated therein |
| US9122735B2 (en) * | 2010-04-30 | 2015-09-01 | Lenovo (Singapore) Pte. Ltd. | Method and apparatus for modifying a transition to an altered power state of an electronic device based on accelerometer output |
| US10802572B2 (en) | 2017-02-02 | 2020-10-13 | Stmicroelectronics, Inc. | System and method of determining whether an electronic device is in contact with a human body |
-
2017
- 2017-02-02 US US15/423,318 patent/US10802572B2/en active Active
-
2018
- 2018-02-01 EP EP18154723.3A patent/EP3358440A1/en not_active Withdrawn
- 2018-02-01 CN CN201820179008.2U patent/CN208367638U/en active Active
- 2018-02-01 CN CN201810103837.7A patent/CN108415588B/en active Active
Patent Citations (4)
| Publication number | Priority date | Publication date | Assignee | Title |
|---|---|---|---|---|
| US20110141006A1 (en) * | 2009-12-15 | 2011-06-16 | Apple Inc. | Detecting docking status of a portable device using motion sensor data |
| US20120016641A1 (en) * | 2010-07-13 | 2012-01-19 | Giuseppe Raffa | Efficient gesture processing |
| US20150331462A1 (en) * | 2012-12-17 | 2015-11-19 | Hewlett-Packard Development Company, L.P. | Temperature Based on Touching Portable Computing Device |
| US20140365803A1 (en) * | 2013-06-07 | 2014-12-11 | Apple Inc. | Motion Fencing |
Cited By (1)
| Publication number | Priority date | Publication date | Assignee | Title |
|---|---|---|---|---|
| US11599178B2 (en) | 2020-02-17 | 2023-03-07 | Stmicroelectronics S.R.L. | Method, electronic device system and computer-readable medium for managing transitions between a plurality of power states of an electronic device based on sensor data indicative of a change in an angle between a plane of base portion of the electronic device and plane of a lid portion of the electronic device |
Also Published As
| Publication number | Publication date |
|---|---|
| CN208367638U (en) | 2019-01-11 |
| US20180217660A1 (en) | 2018-08-02 |
| CN108415588B (en) | 2022-05-13 |
| CN108415588A (en) | 2018-08-17 |
| US10802572B2 (en) | 2020-10-13 |
Similar Documents
| Publication | Publication Date | Title |
|---|---|---|
| US10802572B2 (en) | System and method of determining whether an electronic device is in contact with a human body | |
| US11166104B2 (en) | Detecting use of a wearable device | |
| CN107667330B (en) | Technology for controlling the intensity of haptic feedback | |
| US11719718B2 (en) | System and method for determining whether an electronic device is located on a stationary or stable surface | |
| US11026600B2 (en) | Activity classification in a multi-axis activity monitor device | |
| US9268399B2 (en) | Adaptive sensor sampling for power efficient context aware inferences | |
| Gummeson et al. | An energy harvesting wearable ring platform for gestureinput on surfaces | |
| US20130035893A1 (en) | Methods, devices, and apparatuses for activity classification using temporal scaling of time-referenced features | |
| US10437314B2 (en) | Detecting wearing state of wearable devices using body capacitance | |
| US9602490B2 (en) | User authentication confidence based on multiple devices | |
| US11583197B2 (en) | Method and device for detecting cardiac arrhythmia based on photoplethysmographic signal | |
| KR102194788B1 (en) | Method for operating and an electronic device thereof | |
| US9857879B2 (en) | Finger gesture sensing device | |
| EP3315914B1 (en) | Step counting method, device and terminal | |
| US20240085185A1 (en) | Submersion detection, underwater depth and low-latency temperature estimation using wearable device | |
| Yang et al. | Physical activity recognition with mobile phones: challenges, methods, and applications | |
| Granell et al. | Less is more: Efficient back-of-device tap input detection using built-in smartphone sensors | |
| US20180299833A1 (en) | Electronic device, monitoring method and non-transient computer readable recording medium | |
| Skoglund et al. | Activity tracking using ear-level accelerometers | |
| US20240134468A1 (en) | System and method for determining whether an electronic device is located on a stationary or stable surface | |
| KR102813226B1 (en) | An electronic device for recognizing gesture of user from sensor signal of user and method for recognizing gesture using the same | |
| US20250035665A1 (en) | Systems and methods for on-stationary surface detection | |
| KR20250123771A (en) | Electronic devices and their control methods | |
| Witt | Enabling Implicit Interaction in Wearable Applications: Don’t use sensors only for one task. | |
| WO2022086500A1 (en) | Barometer adaptive sampling by tight integration with other sensors and actuators |
Legal Events
| Date | Code | Title | Description |
|---|---|---|---|
| PUAI | Public reference made under article 153(3) epc to a published international application that has entered the european phase |
Free format text: ORIGINAL CODE: 0009012 |
|
| STAA | Information on the status of an ep patent application or granted ep patent |
Free format text: STATUS: THE APPLICATION HAS BEEN PUBLISHED |
|
| AK | Designated contracting states |
Kind code of ref document: A1 Designated state(s): AL AT BE BG CH CY CZ DE DK EE ES FI FR GB GR HR HU IE IS IT LI LT LU LV MC MK MT NL NO PL PT RO RS SE SI SK SM TR |
|
| AX | Request for extension of the european patent |
Extension state: BA ME |
|
| STAA | Information on the status of an ep patent application or granted ep patent |
Free format text: STATUS: REQUEST FOR EXAMINATION WAS MADE |
|
| 17P | Request for examination filed |
Effective date: 20190201 |
|
| RBV | Designated contracting states (corrected) |
Designated state(s): AL AT BE BG CH CY CZ DE DK EE ES FI FR GB GR HR HU IE IS IT LI LT LU LV MC MK MT NL NO PL PT RO RS SE SI SK SM TR |
|
| STAA | Information on the status of an ep patent application or granted ep patent |
Free format text: STATUS: EXAMINATION IS IN PROGRESS |
|
| 17Q | First examination report despatched |
Effective date: 20191011 |
|
| STAA | Information on the status of an ep patent application or granted ep patent |
Free format text: STATUS: THE APPLICATION HAS BEEN WITHDRAWN |
|
| 18W | Application withdrawn |
Effective date: 20200212 |