EP3348998A1 - Quantitative analysis method and analysis apparatus for polymer structure - Google Patents
Quantitative analysis method and analysis apparatus for polymer structure Download PDFInfo
- Publication number
- EP3348998A1 EP3348998A1 EP17775840.6A EP17775840A EP3348998A1 EP 3348998 A1 EP3348998 A1 EP 3348998A1 EP 17775840 A EP17775840 A EP 17775840A EP 3348998 A1 EP3348998 A1 EP 3348998A1
- Authority
- EP
- European Patent Office
- Prior art keywords
- polymer
- value
- molecular weight
- quantitative analysis
- structure according
- Prior art date
- Legal status (The legal status is an assumption and is not a legal conclusion. Google has not performed a legal analysis and makes no representation as to the accuracy of the status listed.)
- Granted
Links
- 0 CC1=C(C)C(C)=C(C)C1(*C12C(CCCC3)=C3C=C1)[I+]2(N)#Ic1ccccc1 Chemical compound CC1=C(C)C(C)=C(C)C1(*C12C(CCCC3)=C3C=C1)[I+]2(N)#Ic1ccccc1 0.000 description 1
Images

Classifications
-
- G—PHYSICS
- G01—MEASURING; TESTING
- G01N—INVESTIGATING OR ANALYSING MATERIALS BY DETERMINING THEIR CHEMICAL OR PHYSICAL PROPERTIES
- G01N24/00—Investigating or analyzing materials by the use of nuclear magnetic resonance, electron paramagnetic resonance or other spin effects
- G01N24/002—Using resonance on molecular beams
-
- G—PHYSICS
- G01—MEASURING; TESTING
- G01N—INVESTIGATING OR ANALYSING MATERIALS BY DETERMINING THEIR CHEMICAL OR PHYSICAL PROPERTIES
- G01N11/00—Investigating flow properties of materials, e.g. viscosity, plasticity; Analysing materials by determining flow properties
-
- C—CHEMISTRY; METALLURGY
- C08—ORGANIC MACROMOLECULAR COMPOUNDS; THEIR PREPARATION OR CHEMICAL WORKING-UP; COMPOSITIONS BASED THEREON
- C08F—MACROMOLECULAR COMPOUNDS OBTAINED BY REACTIONS ONLY INVOLVING CARBON-TO-CARBON UNSATURATED BONDS
- C08F210/00—Copolymers of unsaturated aliphatic hydrocarbons having only one carbon-to-carbon double bond
- C08F210/16—Copolymers of ethene with alpha-alkenes, e.g. EP rubbers
-
- G—PHYSICS
- G01—MEASURING; TESTING
- G01N—INVESTIGATING OR ANALYSING MATERIALS BY DETERMINING THEIR CHEMICAL OR PHYSICAL PROPERTIES
- G01N33/00—Investigating or analysing materials by specific methods not covered by groups G01N1/00 - G01N31/00
- G01N33/44—Resins; Plastics; Rubber; Leather
- G01N33/442—Resins; Plastics
-
- G—PHYSICS
- G16—INFORMATION AND COMMUNICATION TECHNOLOGY [ICT] SPECIALLY ADAPTED FOR SPECIFIC APPLICATION FIELDS
- G16C—COMPUTATIONAL CHEMISTRY; CHEMOINFORMATICS; COMPUTATIONAL MATERIALS SCIENCE
- G16C20/00—Chemoinformatics, i.e. ICT specially adapted for the handling of physicochemical or structural data of chemical particles, elements, compounds or mixtures
-
- G—PHYSICS
- G16—INFORMATION AND COMMUNICATION TECHNOLOGY [ICT] SPECIALLY ADAPTED FOR SPECIFIC APPLICATION FIELDS
- G16C—COMPUTATIONAL CHEMISTRY; CHEMOINFORMATICS; COMPUTATIONAL MATERIALS SCIENCE
- G16C60/00—Computational materials science, i.e. ICT specially adapted for investigating the physical or chemical properties of materials or phenomena associated with their design, synthesis, processing, characterisation or utilisation
-
- C—CHEMISTRY; METALLURGY
- C08—ORGANIC MACROMOLECULAR COMPOUNDS; THEIR PREPARATION OR CHEMICAL WORKING-UP; COMPOSITIONS BASED THEREON
- C08F—MACROMOLECULAR COMPOUNDS OBTAINED BY REACTIONS ONLY INVOLVING CARBON-TO-CARBON UNSATURATED BONDS
- C08F4/00—Polymerisation catalysts
- C08F4/42—Metals; Metal hydrides; Metallo-organic compounds; Use thereof as catalyst precursors
- C08F4/44—Metals; Metal hydrides; Metallo-organic compounds; Use thereof as catalyst precursors selected from light metals, zinc, cadmium, mercury, copper, silver, gold, boron, gallium, indium, thallium, rare earths or actinides
- C08F4/60—Metals; Metal hydrides; Metallo-organic compounds; Use thereof as catalyst precursors selected from light metals, zinc, cadmium, mercury, copper, silver, gold, boron, gallium, indium, thallium, rare earths or actinides together with refractory metals, iron group metals, platinum group metals, manganese, rhenium technetium or compounds thereof
- C08F4/62—Refractory metals or compounds thereof
- C08F4/64—Titanium, zirconium, hafnium or compounds thereof
- C08F4/659—Component covered by group C08F4/64 containing a transition metal-carbon bond
- C08F4/65912—Component covered by group C08F4/64 containing a transition metal-carbon bond in combination with an organoaluminium compound
-
- C—CHEMISTRY; METALLURGY
- C08—ORGANIC MACROMOLECULAR COMPOUNDS; THEIR PREPARATION OR CHEMICAL WORKING-UP; COMPOSITIONS BASED THEREON
- C08F—MACROMOLECULAR COMPOUNDS OBTAINED BY REACTIONS ONLY INVOLVING CARBON-TO-CARBON UNSATURATED BONDS
- C08F4/00—Polymerisation catalysts
- C08F4/42—Metals; Metal hydrides; Metallo-organic compounds; Use thereof as catalyst precursors
- C08F4/44—Metals; Metal hydrides; Metallo-organic compounds; Use thereof as catalyst precursors selected from light metals, zinc, cadmium, mercury, copper, silver, gold, boron, gallium, indium, thallium, rare earths or actinides
- C08F4/60—Metals; Metal hydrides; Metallo-organic compounds; Use thereof as catalyst precursors selected from light metals, zinc, cadmium, mercury, copper, silver, gold, boron, gallium, indium, thallium, rare earths or actinides together with refractory metals, iron group metals, platinum group metals, manganese, rhenium technetium or compounds thereof
- C08F4/62—Refractory metals or compounds thereof
- C08F4/64—Titanium, zirconium, hafnium or compounds thereof
- C08F4/659—Component covered by group C08F4/64 containing a transition metal-carbon bond
- C08F4/65916—Component covered by group C08F4/64 containing a transition metal-carbon bond supported on a carrier, e.g. silica, MgCl2, polymer
-
- G—PHYSICS
- G01—MEASURING; TESTING
- G01N—INVESTIGATING OR ANALYSING MATERIALS BY DETERMINING THEIR CHEMICAL OR PHYSICAL PROPERTIES
- G01N11/00—Investigating flow properties of materials, e.g. viscosity, plasticity; Analysing materials by determining flow properties
- G01N2011/0026—Investigating specific flow properties of non-Newtonian fluids
- G01N2011/0033—Yield stress; Residual stress at zero shear rate
-
- G—PHYSICS
- G01—MEASURING; TESTING
- G01N—INVESTIGATING OR ANALYSING MATERIALS BY DETERMINING THEIR CHEMICAL OR PHYSICAL PROPERTIES
- G01N11/00—Investigating flow properties of materials, e.g. viscosity, plasticity; Analysing materials by determining flow properties
- G01N2011/0026—Investigating specific flow properties of non-Newtonian fluids
- G01N2011/004—Stress relaxation time
-
- G—PHYSICS
- G01—MEASURING; TESTING
- G01N—INVESTIGATING OR ANALYSING MATERIALS BY DETERMINING THEIR CHEMICAL OR PHYSICAL PROPERTIES
- G01N24/00—Investigating or analyzing materials by the use of nuclear magnetic resonance, electron paramagnetic resonance or other spin effects
- G01N24/08—Investigating or analyzing materials by the use of nuclear magnetic resonance, electron paramagnetic resonance or other spin effects by using nuclear magnetic resonance
Definitions
- the present application relates to a method for quantitative analysis of polymer structure and an analyzer.
- a polymer is classified into a linear polymer or a branched polymer according to its shape.
- the linear polymer designates as the word a shape in which monomers constituting the polymer are linearly bonded to form a main chain.
- Various kinds of chains are branched for such a linear polymer, so that the polymer may have side chains.
- the polymer structure having such side chains is referred to as a branched polymer and such a branched polymer has physical properties of polymers that differ greatly depending on the molecular weight, distribution and number of the side chains. In this way, it is important in analyzing polymer characteristics to identify the existence of side chains that have a great influence on the physical properties of polymers and to accurately measure the structures thereof.
- the GPC column analysis uses a method of comparing the viscosity of a branched polymer passing through a GPC column to the viscosity of a linear polymer having the same molecular weight or a method of comparing the gyration radius of a branched polymer passing through a GPC column to the gyration radius of a linear polymer using light scattering, and the like, but these methods can be analyzed only for the components having a weight average molecular weight of 100,000 or more due to the sensitivity limitation of the analyzing equipment, so that there is a problem that the analysis is difficult for the weight average molecular weight of less than 100,000.
- the NMR analysis can discriminate the length of side chains having 6 or less carbon atoms, there is a problem that it is difficult to determine the length of side chains having 7 or more carbon atoms.
- the weight average molecular weight of the side chains affecting rheological properties is usually 1000 or more, the NMR analysis has a problem that it is not known whether the side chain determined to have a carbon number of 7 or more affecting the rheological properties is a long chain branch or a short chain branch.
- the present invention is intended to provide a method for analysis of a polymer structure capable of quantitatively analyzing a polymer structure by repeating a process of predicting rheological properties and/or molecular weight distribution from structural parameters of the polymer and comparing them with the measured values. Moreover, in the case of a polymer mixture, it is intended to provide a method for analysis of a polymer structure capable of quantitatively analyzing the structure and content ratio of each polymer in the mixture.
- the present application relates to a method for quantitative analysis of a polymer structure.
- the method for quantitative analysis of a polymer structure in the present application may comprise steps of:
- the method for quantitative analysis of a polymer structure may further comprise, in the step (C), a step of predicting the molecular weight distribution of the polymer to which the random value is assigned and comparing the predicted molecular weight distribution value of the polymer with the measured molecular weight distribution value of the polymer to determine the value of the structural parameter of the polymer.
- the polymer structure analysis method may determine polymer structural parameter values by comparing the measured values and the predicted values of the rheological properties and/or the molecular weight distribution of a polymer having a weight average molecular weight of 100,000 or less and a carbon number in the side chain of 6 or more.
- Figure 1 is a flowchart of a quantitative analysis method of a polymer structure of the present invention.
- the present invention relates to a quantitative analysis method of a polymer structure, a computer readable recording medium containing a program capable of carrying out the method, and an analyzer capable of performing the method.
- the polymer structure quantitative analysis method of the present application can determine structural parameter values of the arbitrarily selected polymer by predicting rheological properties or molecular weight distribution of the polymer from random values of structural parameters of the arbitrarily selected polymer, for example, weight average molecular weights of the main chain or side chains, polydispersity indexes or numbers of side chains, and comparing them with the measured values of the rheological properties or molecular weight distribution.
- the analysis method according to the present application not only solves the problem that the object to be measured has a weight average molecular weight of 100,000 or more, or the carbon number of the side chain is limited to 6 or less, in the conventional GPC column analysis method or NMR analysis method, but also can analyze the structural parameters of the polymer quantitatively, even if only the rheological properties and/or molecular weight distribution of the polymer are measured, and moreover, can analyze the structure and the content ratio of each polymer in the polymer mixture.
- the present application relates to a method for quantitative analysis of a polymer structure.
- the analysis method provides a method for quantitative analysis of a polymer structure comprising steps of:
- the step (a) may be a step of arbitrarily selecting a polymer to be analyzed, and measuring rheological properties of the selected polymer.
- the rheological properties of the selected polymer can be measured using a rheometer.
- the rheometer is not particularly limited as long as it is a device capable of measuring rheological properties, and for example, a rotational rheometer can be used.
- the rotational rheometer can measure, for example, shear storage elastic modulus (G'), shear loss elastic modulus (G”) and shear complex viscosity ( ⁇ *).
- the polymer selected in the step (a) may be at least one selected from the group consisting of a linear polymer, a branched polymer, a linear polymer mixture and a branched polymer mixture.
- the linear polymer mixture may be a mixture in which linear polymers having different structural parameters are mixed by physical force
- the branched polymer mixture may be a mixture in which polymers having different structural parameters are mixed by physical force
- the mixed polymer is a polymer having identical constituent elements to each other, but may be a polymer having a different shape such as a linear or branched shape.
- the branched polymer may be a polymer having a weight average molecular weight ratio of side chains to the main chain of 40% or less, or having a weight average molecular weight in only the side chains of 3,000 or more.
- the weight average molecular weight ratio of the side chain to the main chain is more than 40%, the analytical reliability of the branched polymer may deteriorate because the side chain may act as a part of the main chain other than the side chain depending on the position occupied in the main chain.
- the weight average molecular weight of the side chain in the branched polymer is less than 3,000, the difference in the rheological properties of the polymer due to the side chain is insignificant, so that the use of the analysis method using the difference of rheological properties may be limited as the quantitative analysis method of the polymer structure of the present application.
- the selected structural parameters may be one or more selected from the group consisting of a polymer shape; a weight average molecular weight (Mw) of the main chain or side chain; a polydispersity index (PDI) of the main chain or side chain; and a number of side chains.
- the polymer shape parameter is a parameter capable of distinguishing whether the polymer to be analyzed is a linear or branched polymer and specifically, represents a parameter capable of qualitatively distinguishing the branched polymer which can appear as a comblike shape, a star shape or an H-shape depending on the side chains bonded to the branched polymer.
- the random value can be usually assigned without particular limitation within a numerical range possible as structural parameter values.
- the selected structural parameter of the polymer is polydispersity index
- a value of 1 to 10 can be assigned as a random value.
- the structural parameters may further include a mass fraction between the mixed polymers.
- the mass fraction in the parameters By including the mass fraction in the parameters, the structure and content ratio of each component in the polymer mixture can be quantitatively analyzed.
- the weight average molecular weight and polydispersity index parameters of each polymer in the polymer mixture can be calculated by a multiplication method with the mass fraction parameter to be applied to the prediction of the rheological properties and/or molecular weight distribution in the step (c).
- a step strain of a shear flow is applied to the polymer to which the random value is assigned, where the rheological properties can be predicted from a stress relaxation behavior of the polymer induced by the step strain.
- the stress relaxation behavior may vary by the lengths of the main chain and side chains of the polymer, the molecular weight distribution, and the hierarchical structure.
- stress relaxation behavior means the stress change behavior of the polymer over time when the step strain of the shear flow has been applied to the polymer.
- the stress change behavior depends on the nature of the polymer. For example, when the polymer is a perfect elastic body having only elasticity, a stress is generated immediately after applying the step strain thereto, and the stress is maintained at a constant value without dissipation with time. On the other hand, when the polymer is a perfect viscous body having only viscosity, the stress dissipates and is completely relaxed as soon as the step strain is applied. In addition, when the polymer is a general viscoelastic body having elasticity and viscosity at the same time, if the strain is completed, the stress begins to dissipate, but the stress remains as much as the ratio of the retained elasticity.
- the stress change behavior depends on the structure of the polymer. For example, when the step strain of the shear flow has been applied to a polymer, the shape of the polymer is also deformed, and then in the course of the relaxation of the polymer through the stress relaxation behavior with time, the length and molecular weight distribution of the main chain and side chains in the polymer, and the hierarchical structure of the side chain can affect the stress change behavior.
- the relaxation time can be longer than that of the linear polymer because the main chain cannot be relaxed unless the side chain is relaxed. Also, when the number of side chains is large or the side chains have a complex structure present in various stages, the relaxation time of the polymer can be increased.
- the prediction of the rheological properties from the stress relaxation behavior can be done using a Doi-Edwards numerical analysis model.
- the rheological properties can be expressed by a storage elastic modulus (G') and a loss elastic modulus (G") with respect to changes in angular velocity, where the storage elastic modulus (G') and the loss elastic modulus (G") can be calculated using a Doi-Edwards numerical analysis model.
- a stress relaxation elastic modulus G(t) over time can be calculated by Equation 1 below disclosed in R. G. Larson, Macromolecules 2001, 34, 4556-4571 .
- G t / G N 0 2 ⁇ 0 1 exp ⁇ t / t ' ⁇ t ' d ⁇ t '
- Equation 1 G N 0 is a plateau modulus of the polymer, t' is a relaxation time of the polymer, and ⁇ represents a volume ratio of the un-relaxed polymer.
- Equation 2 the storage elastic modulus (G') and the loss elastic modulus (G") over time can be calculated by Equations 2 and 3 below.
- G ' ⁇ / G N 0 2 ⁇ 0 1 ⁇ 2 t ' 2 1 + ⁇ 2 t ' 2 ⁇ t ' d ⁇ t '
- G ' ' ⁇ / G N 0 2 ⁇ 0 1 ⁇ 2 t ' 2 1 + ⁇ 2 t ' 2 ⁇ t ' d ⁇ t '
- ⁇ represents an angular velocity (angular frequency, [rad/s]) of the strain applied to the polymer.
- the method of the present application can further apply a McLeish-Larson Pom-Pom model to apply the branched polymers to the Doi-Edwards numerical analysis model.
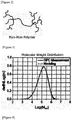
- the Pom-Pom model is a model in which a branched polymer structure is assumed as a polymer having a plurality of side chains at both ends of one main chain as in Figure 2 .
- the Pom-Pom polymer of Figure 2 can be simulated as a linear polymer by adjusting the number and shape of a plurality of side chains at both ends.
- the comparison between the predicted rheological property values of the polymer and the measured rheological property values of the polymer may be made by calculating an error value ( ⁇ ) between the predicted rheological property value of the polymer and the measured rheological property value of the polymer and checking whether the error value ( ⁇ ) is less than a predetermined error reference value ( ⁇ s ).
- the error reference value ( ⁇ s ) may be a value in which the difference from the measured value of the rheological property is determined within a range of 0.1% to 10%, preferably within a range of 0.1% to 5%, but is not limited thereto.
- the random value assigned in the step (B) may be a definite value of the polymer structure parameter.
- the quantitative analysis method of the polymer structure may be performed by repeating the step (B) and the step (C), for example, so that the number of the definite values can be derived in a range of 10 to 100. If the number of the definite values is less than 10, reliability with respect to the average value may be lowered due to a small number of samples, whereas if the number of the definite values exceeds 100, the average value converges and thus there is no difference from the average value of 100 definite values.
- the definite value may have a range expressed by the minimum value and the maximum value of a plurality of definite values derived by repeating the step (B) and the step (C) two or more times.
- the definite value may have an average value for a plurality of definite values derived by repeating the step (B) and the step (C) two or more times.
- the step (A) may further comprise a step of measuring the molecular weight distribution of the polymer, where the method capable of measuring the molecular weight distribution is not particularly limited, and for example, GPC may be used.
- the step (C) may further comprise a step of predicting the molecular weight distribution of the polymer to which the random value is assigned, and comparing the predicted molecular weight distribution value of the polymer with the measured molecular weight distribution value of the polymer to determine the value of the structural parameter of the polymer.
- the prediction of the molecular weight distribution of the polymer can be made by assuming a log normal distribution on the polymer to which the random value is assigned.
- the molecular weight distribution prediction can be predicted by Equation 4 below.
- P M 1 M 2 ⁇ exp ⁇ ln M ⁇ ⁇ 2 2 ⁇ 2
- P(M) is a probability that a polymer having a molecular weight of M exists
- ⁇ 2 is a logarithm value of polydispersity index (PDI) of the main chain
- ⁇ represents a median value of the molecular weight distribution.
- the median value of the molecular weight distribution means the difference between the logarithm value of the weight average molecular weight of the main chain and 1/2 of the logarithm value of the polydispersity index (PDI) of the main chain.
- the quantitative analysis method of a polymer structure according to the present application can obtain a result value closer to the actual polymer structure parameter than the polymer structure parameter value obtained using only rheological properties.
- the present application relates to a computer-readable recording medium comprising a program capable of performing the quantitative analysis method of the polymer.
- the computer-readable recording medium may comprise a program for executing the quantitative analysis method of the polymer structure.
- the present application relates to an analyzer for performing the quantitative analysis method of the polymer structure.
- the analyzer provides a quantitative analyzer of a polymer structure comprising:
- the quantitative analyzer of a polymer structure according to the present application may further comprise a second predicting part for predicting the molecular weight distribution of the polymer to which the random value is assigned.
- a polystyrene (PS) mixed solution was prepared by a liquid phase mixing method in which polystyrene (PS) 300K (weight average molecular weight: 300,000, PDI 3.79) and polystyrene (PS) 120K (weight average molecular weight: 120,000, PDI 2.98), two linear polymers knowing a weight average molecular weight and polydispersity index, were each dissolved in THF (tetrahydrofuran), then mixed at a ratio of 1:1 and stirred.
- PS polystyrene
- the polystyrene (PS) mixed solution was poured into n-hexane, precipitated and then separated to prepare a polystyrene (PS) polymer mixture.
- Rheological properties of the prepared polystyrene (PS) polymer mixture were measured using a rotational rheometer. Furthermore, the molecular weight distribution was measured using GPC.
- Table 1 below shows numerical ranges of random values for polystyrene (PS) mixture of (1) above.
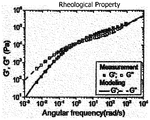
- the random values were set within the numerical ranges of Table 1, and the rheological properties of the polystyrene (PS) mixture were predicted according to the Doi-Edwards numerical analysis model. Also, the molecular weight distribution was predicted according to the above-mentioned Equation 4. Then the measured values of the rheological properties and the molecular weight distribution of the polystyrene (PS) mixture measured in the above (1) were each compared with the predicted values of the rheological properties and the molecular weight distribution of the polystyrene (PS) mixture, and the results are shown in Figures 3 and 4 .
- the definite values derived by the quantitative analysis method of the polymer structure according to the present application have very similar values to the measured values of the structural parameters of the polystyrene (PS) mixture.
- PS polystyrene
- the PDI among the above structural parameters there is a difference between the measured value and the definite value, but this difference is an error to occur because in the case of the actual polymer, the value of the PDI increases toward a specific value depending on the polymerization method or condition and simultaneously represents an asymmetric value, whereas the predicted value of the structural parameter according to the present application is calculated in bilateral symmetry upon predicting the PDI.
- Such an error is considered together with the calculated structural parameters, for example, the molecular weight or the weight ratio, and as shown in Figure 3 , the predicted value of the molecular weight distribution value for the entire mixture can be confirmed to a reliable level with respect to the measured value.
- Samples for the structural analysis were low density polyethylene and a continuous polymerization reactor, which is a slurry loop process of isobutene, was used as a polymerization reactor, where the reactor volume was 140 L and the reaction flow rate was operated at about 7 m/s. All gas streams (ethylene and hydrogen) and 1-hexene, which is a comonomer, required for the polymerization were continuously introduced, where the individual flow rates were adjusted as needed. The concentrations of all gas streams and 1-hexene, which is a comonomer, were confirmed by on-line gas chromatography. Each of the catalysts prepared above was used as a catalyst, and the isobutene slurry was introduced thereto.
- a random value having an error value between the predicted value and the measured value of less than 5% was derived as a definite value, and 70 definite values were again derived by repeating from the process of setting a random value to the process of comparing the predicted value and the measured value of the rheological property to derive a definite value.
- the ranges expressed by the minimum values and the maximum values of the derived definite values were shown in Table 6 below.
- Tables 5 and 6 above show that the analysis using the existing analyzer can only measure the structural parameter values of the entire polymer mixture, but the structural parameters for each of low molecular weight linear structures, high molecular weight linear structures and branched polymer structures cannot be known.
- the tables show that the structural parameter values can be quantitatively analyzed for each of low molecular weight linear structure, high molecular weight linear structure and branched structure polymers mixed in the polymer mixture.
Landscapes
- Life Sciences & Earth Sciences (AREA)
- Chemical & Material Sciences (AREA)
- Health & Medical Sciences (AREA)
- Physics & Mathematics (AREA)
- Engineering & Computer Science (AREA)
- Pathology (AREA)
- Immunology (AREA)
- Analytical Chemistry (AREA)
- Biochemistry (AREA)
- General Health & Medical Sciences (AREA)
- General Physics & Mathematics (AREA)
- Theoretical Computer Science (AREA)
- Computing Systems (AREA)
- Medicinal Chemistry (AREA)
- Food Science & Technology (AREA)
- Bioinformatics & Cheminformatics (AREA)
- Bioinformatics & Computational Biology (AREA)
- Spectroscopy & Molecular Physics (AREA)
- High Energy & Nuclear Physics (AREA)
- Crystallography & Structural Chemistry (AREA)
- Chemical Kinetics & Catalysis (AREA)
- Polymers & Plastics (AREA)
- Organic Chemistry (AREA)
- Addition Polymer Or Copolymer, Post-Treatments, Or Chemical Modifications (AREA)
Abstract
Description
- The present application relates to a method for quantitative analysis of polymer structure and an analyzer.
- The present application claims the benefit of priority based on Korean Patent Application No.
10-2016-0038881 filed on March 31, 2016 - Generally, a polymer is classified into a linear polymer or a branched polymer according to its shape. The linear polymer designates as the word a shape in which monomers constituting the polymer are linearly bonded to form a main chain. Various kinds of chains are branched for such a linear polymer, so that the polymer may have side chains. The polymer structure having such side chains is referred to as a branched polymer and such a branched polymer has physical properties of polymers that differ greatly depending on the molecular weight, distribution and number of the side chains. In this way, it is important in analyzing polymer characteristics to identify the existence of side chains that have a great influence on the physical properties of polymers and to accurately measure the structures thereof.
- As the existing method for analysis of side chains, GPC column analysis and NMR analysis were used.
- The GPC column analysis uses a method of comparing the viscosity of a branched polymer passing through a GPC column to the viscosity of a linear polymer having the same molecular weight or a method of comparing the gyration radius of a branched polymer passing through a GPC column to the gyration radius of a linear polymer using light scattering, and the like, but these methods can be analyzed only for the components having a weight average molecular weight of 100,000 or more due to the sensitivity limitation of the analyzing equipment, so that there is a problem that the analysis is difficult for the weight average molecular weight of less than 100,000.
- Furthermore, although the NMR analysis can discriminate the length of side chains having 6 or less carbon atoms, there is a problem that it is difficult to determine the length of side chains having 7 or more carbon atoms. In particular, considering the fact that the weight average molecular weight of the side chains affecting rheological properties is usually 1000 or more, the NMR analysis has a problem that it is not known whether the side chain determined to have a carbon number of 7 or more affecting the rheological properties is a long chain branch or a short chain branch.
- The present invention is intended to provide a method for analysis of a polymer structure capable of quantitatively analyzing a polymer structure by repeating a process of predicting rheological properties and/or molecular weight distribution from structural parameters of the polymer and comparing them with the measured values. Moreover, in the case of a polymer mixture, it is intended to provide a method for analysis of a polymer structure capable of quantitatively analyzing the structure and content ratio of each polymer in the mixture.
- It is the object of the present invention to provide a method for quantitative analysis of a polymer structure which predicts rheological properties and/or molecular weight distribution of a polymer and compares them with the measured values to determine polymer structural parameter values.
- In one example regarding the present application, the present application relates to a method for quantitative analysis of a polymer structure. The method for quantitative analysis of a polymer structure in the present application may comprise steps of:
- (A) measuring rheological properties of a polymer;
- (B) selecting any one of structural parameters that the polymer may have, and assigning a random value to the selected structural parameter; and
- (C) predicting the rheological property of the polymer to which the random value is assigned and comparing the predicted rheological property value of the polymer with the measured rheological property value of the polymer to determine the value of the structural parameter of the polymer.
- In another example regarding the present application, the method for quantitative analysis of a polymer structure may further comprise, in the step (C), a step of predicting the molecular weight distribution of the polymer to which the random value is assigned and comparing the predicted molecular weight distribution value of the polymer with the measured molecular weight distribution value of the polymer to determine the value of the structural parameter of the polymer.
- The polymer structure analysis method according to the present application may determine polymer structural parameter values by comparing the measured values and the predicted values of the rheological properties and/or the molecular weight distribution of a polymer having a weight average molecular weight of 100,000 or less and a carbon number in the side chain of 6 or more.
-
Figure 1 is a flowchart of a quantitative analysis method of a polymer structure of the present invention. - The present invention relates to a quantitative analysis method of a polymer structure, a computer readable recording medium containing a program capable of carrying out the method, and an analyzer capable of performing the method.
- The polymer structure quantitative analysis method of the present application can determine structural parameter values of the arbitrarily selected polymer by predicting rheological properties or molecular weight distribution of the polymer from random values of structural parameters of the arbitrarily selected polymer, for example, weight average molecular weights of the main chain or side chains, polydispersity indexes or numbers of side chains, and comparing them with the measured values of the rheological properties or molecular weight distribution. The analysis method according to the present application not only solves the problem that the object to be measured has a weight average molecular weight of 100,000 or more, or the carbon number of the side chain is limited to 6 or less, in the conventional GPC column analysis method or NMR analysis method, but also can analyze the structural parameters of the polymer quantitatively, even if only the rheological properties and/or molecular weight distribution of the polymer are measured, and moreover, can analyze the structure and the content ratio of each polymer in the polymer mixture.
- Hereinafter, the polymer structure quantitative analysis method of the present application will be described in detail.
- In one example regarding the present application, the present application relates to a method for quantitative analysis of a polymer structure. The analysis method provides a method for quantitative analysis of a polymer structure comprising steps of:
- (A) measuring rheological properties of the polymer;
- (B) selecting one or more parameters among structural parameters that the polymer may have, and assigning random values to the selected structural parameters; and
- (C) predicting rheological properties of the polymer to which the random values are assigned, and comparing the predicted rheological property values of the polymer with the measured rheological property values of the polymer to determine the structural parameter values of the polymer.
- The step (a) may be a step of arbitrarily selecting a polymer to be analyzed, and measuring rheological properties of the selected polymer.
- In one example, in step (a), the rheological properties of the selected polymer can be measured using a rheometer. The rheometer is not particularly limited as long as it is a device capable of measuring rheological properties, and for example, a rotational rheometer can be used. The rotational rheometer can measure, for example, shear storage elastic modulus (G'), shear loss elastic modulus (G") and shear complex viscosity (η*).
- The polymer selected in the step (a) may be at least one selected from the group consisting of a linear polymer, a branched polymer, a linear polymer mixture and a branched polymer mixture.
- In one example, the linear polymer mixture may be a mixture in which linear polymers having different structural parameters are mixed by physical force, and the branched polymer mixture may be a mixture in which polymers having different structural parameters are mixed by physical force. In another example, the mixed polymer is a polymer having identical constituent elements to each other, but may be a polymer having a different shape such as a linear or branched shape.
- In one example, the branched polymer may be a polymer having a weight average molecular weight ratio of side chains to the main chain of 40% or less, or having a weight average molecular weight in only the side chains of 3,000 or more. When the weight average molecular weight ratio of the side chain to the main chain is more than 40%, the analytical reliability of the branched polymer may deteriorate because the side chain may act as a part of the main chain other than the side chain depending on the position occupied in the main chain. Furthermore, when the weight average molecular weight of the side chain in the branched polymer is less than 3,000, the difference in the rheological properties of the polymer due to the side chain is insignificant, so that the use of the analysis method using the difference of rheological properties may be limited as the quantitative analysis method of the polymer structure of the present application.
- In the step (b), the selected structural parameters may be one or more selected from the group consisting of a polymer shape; a weight average molecular weight (Mw) of the main chain or side chain; a polydispersity index (PDI) of the main chain or side chain; and a number of side chains.
- The polymer shape parameter is a parameter capable of distinguishing whether the polymer to be analyzed is a linear or branched polymer and specifically, represents a parameter capable of qualitatively distinguishing the branched polymer which can appear as a comblike shape, a star shape or an H-shape depending on the side chains bonded to the branched polymer.
- Also, in the step (b), the random value can be usually assigned without particular limitation within a numerical range possible as structural parameter values. For example, when the selected structural parameter of the polymer is polydispersity index, a value of 1 to 10 can be assigned as a random value.
- In one example, when the polymer selected in the step (a) is a polymer mixture, the structural parameters may further include a mass fraction between the mixed polymers. By including the mass fraction in the parameters, the structure and content ratio of each component in the polymer mixture can be quantitatively analyzed. For example, the weight average molecular weight and polydispersity index parameters of each polymer in the polymer mixture can be calculated by a multiplication method with the mass fraction parameter to be applied to the prediction of the rheological properties and/or molecular weight distribution in the step (c).
- In the step (c), a step strain of a shear flow is applied to the polymer to which the random value is assigned, where the rheological properties can be predicted from a stress relaxation behavior of the polymer induced by the step strain. The stress relaxation behavior may vary by the lengths of the main chain and side chains of the polymer, the molecular weight distribution, and the hierarchical structure.
- In the present application, the term "stress relaxation behavior" means the stress change behavior of the polymer over time when the step strain of the shear flow has been applied to the polymer.
- The stress change behavior depends on the nature of the polymer. For example, when the polymer is a perfect elastic body having only elasticity, a stress is generated immediately after applying the step strain thereto, and the stress is maintained at a constant value without dissipation with time. On the other hand, when the polymer is a perfect viscous body having only viscosity, the stress dissipates and is completely relaxed as soon as the step strain is applied. In addition, when the polymer is a general viscoelastic body having elasticity and viscosity at the same time, if the strain is completed, the stress begins to dissipate, but the stress remains as much as the ratio of the retained elasticity.
- Also, the stress change behavior depends on the structure of the polymer. For example, when the step strain of the shear flow has been applied to a polymer, the shape of the polymer is also deformed, and then in the course of the relaxation of the polymer through the stress relaxation behavior with time, the length and molecular weight distribution of the main chain and side chains in the polymer, and the hierarchical structure of the side chain can affect the stress change behavior.
- In one example, in the case of a general linear polymer having no side chain, the longer the length of the main chain is, the larger the influence of the surrounding polymers is, and thus the time required for the relaxation can be increased. Furthermore, the wider the molecular weight distribution is, the more the polymers having large molecular weight are present, and thus the overall relaxation time can be increased. On the other hand, in the case of a polymer having a side chain, the relaxation time can be longer than that of the linear polymer because the main chain cannot be relaxed unless the side chain is relaxed. Also, when the number of side chains is large or the side chains have a complex structure present in various stages, the relaxation time of the polymer can be increased.
- In one example, the prediction of the rheological properties from the stress relaxation behavior can be done using a Doi-Edwards numerical analysis model.
- In one example, the rheological properties can be expressed by a storage elastic modulus (G') and a loss elastic modulus (G") with respect to changes in angular velocity, where the storage elastic modulus (G') and the loss elastic modulus (G") can be calculated using a Doi-Edwards numerical analysis model.
- Specifically, according to the Doi-Edwards numerical analysis model, a stress relaxation elastic modulus G(t) over time can be calculated by Equation 1 below disclosed in R. G. Larson, Macromolecules 2001, 34, 4556-4571.

- In Equation 1 above,

- Also, from Equation 1 above, the storage elastic modulus (G') and the loss elastic modulus (G") over time can be calculated by Equations 2 and 3 below.


- In Equations 2 and 3 above, ω represents an angular velocity (angular frequency, [rad/s]) of the strain applied to the polymer. In addition, the method of the present application can further apply a McLeish-Larson Pom-Pom model to apply the branched polymers to the Doi-Edwards numerical analysis model.
- The Pom-Pom model is a model in which a branched polymer structure is assumed as a polymer having a plurality of side chains at both ends of one main chain as in
Figure 2 . In addition, the Pom-Pom polymer ofFigure 2 can be simulated as a linear polymer by adjusting the number and shape of a plurality of side chains at both ends. - In the step (c), the comparison between the predicted rheological property values of the polymer and the measured rheological property values of the polymer may be made by calculating an error value (ε) between the predicted rheological property value of the polymer and the measured rheological property value of the polymer and checking whether the error value (ε) is less than a predetermined error reference value (εs).
- In one example, the error reference value (εs) may be a value in which the difference from the measured value of the rheological property is determined within a range of 0.1% to 10%, preferably within a range of 0.1% to 5%, but is not limited thereto.
- With regard to the determination of the structural parameter value of the polymer in the step (c), when the error value is less than a predetermined error reference value, the random value assigned in the step (B) may be a definite value of the polymer structure parameter.
- In one example, the quantitative analysis method of the polymer structure may be performed by repeating the step (B) and the step (C), for example, so that the number of the definite values can be derived in a range of 10 to 100. If the number of the definite values is less than 10, reliability with respect to the average value may be lowered due to a small number of samples, whereas if the number of the definite values exceeds 100, the average value converges and thus there is no difference from the average value of 100 definite values.
- The definite value may have a range expressed by the minimum value and the maximum value of a plurality of definite values derived by repeating the step (B) and the step (C) two or more times. In another example, the definite value may have an average value for a plurality of definite values derived by repeating the step (B) and the step (C) two or more times.
- Also, the step (A) may further comprise a step of measuring the molecular weight distribution of the polymer, where the method capable of measuring the molecular weight distribution is not particularly limited, and for example, GPC may be used.
- Furthermore, the step (C) may further comprise a step of predicting the molecular weight distribution of the polymer to which the random value is assigned, and comparing the predicted molecular weight distribution value of the polymer with the measured molecular weight distribution value of the polymer to determine the value of the structural parameter of the polymer.
- The prediction of the molecular weight distribution of the polymer can be made by assuming a log normal distribution on the polymer to which the random value is assigned.
- In one example, the molecular weight distribution prediction can be predicted by Equation 4 below.

- In Equation 4 above, P(M) is a probability that a polymer having a molecular weight of M exists, σ2 is a logarithm value of polydispersity index (PDI) of the main chain, and µ represents a median value of the molecular weight distribution. The median value of the molecular weight distribution means the difference between the logarithm value of the weight average molecular weight of the main chain and 1/2 of the logarithm value of the polydispersity index (PDI) of the main chain.
- In the present application, the detailed description of the process of comparing the predicted molecular weight distribution value of the polymer with the measured molecular weight distribution value of the polymer and the process of deriving the definite value is the same as the process of the rheological property described above.
- By using the molecular weight distribution of the polymer together with the above-described rheological properties of the polymer, the quantitative analysis method of a polymer structure according to the present application can obtain a result value closer to the actual polymer structure parameter than the polymer structure parameter value obtained using only rheological properties.
- The present application relates to a computer-readable recording medium comprising a program capable of performing the quantitative analysis method of the polymer.
- The computer-readable recording medium may comprise a program for executing the quantitative analysis method of the polymer structure.
- The present application relates to an analyzer for performing the quantitative analysis method of the polymer structure. The analyzer provides a quantitative analyzer of a polymer structure comprising:
- a first measuring part for measuring rheological properties of a polymer;
- a setting part for selecting any one of structural parameters of the arbitrarily selected polymer and assigning a random value to the selected structural parameter;
- a first predicting part for predicting the rheological property of the polymer to which the random value is assigned; and
- a calculating part for comparing the predicted rheological property value of the polymer with the measured value of the rheological property of the polymer to determine the value of the structural parameter of the polymer.
- In addition, it may further comprise a second measuring part for measuring the molecular weight distribution of the polymer using GPC. Furthermore, the quantitative analyzer of a polymer structure according to the present application may further comprise a second predicting part for predicting the molecular weight distribution of the polymer to which the random value is assigned. The configurations or terms overlapping with the above-mentioned contents are the same as the configurations or terms related to the analysis method and thus the description thereof is omitted.
- Hereinafter, the present invention will be described in detail through examples. However, the scope of protection of the present invention is not limited by the examples described below.
- A polystyrene (PS) mixed solution was prepared by a liquid phase mixing method in which polystyrene (PS) 300K (weight average molecular weight: 300,000, PDI 3.79) and polystyrene (PS) 120K (weight average molecular weight: 120,000, PDI 2.98), two linear polymers knowing a weight average molecular weight and polydispersity index, were each dissolved in THF (tetrahydrofuran), then mixed at a ratio of 1:1 and stirred.
- The polystyrene (PS) mixed solution was poured into n-hexane, precipitated and then separated to prepare a polystyrene (PS) polymer mixture. Rheological properties of the prepared polystyrene (PS) polymer mixture were measured using a rotational rheometer. Furthermore, the molecular weight distribution was measured using GPC.
- Table 1 below shows numerical ranges of random values for polystyrene (PS) mixture of (1) above.
[Table 1] Polystyrene (PS) 300K Polystyrene (PS) 120K Structural parameter Mw PDI Wt (%) Mw PDI Wt (%) Random value 100K∼500K 1∼10 10∼90 100K∼500K 1∼10 10∼90 Mw: weight average molecular weight, PDI: polydispersity index, Wt: weight ratio of each polymer in polymer mixture, K: 1,000 units - The random values were set within the numerical ranges of Table 1, and the rheological properties of the polystyrene (PS) mixture were predicted according to the Doi-Edwards numerical analysis model. Also, the molecular weight distribution was predicted according to the above-mentioned Equation 4. Then the measured values of the rheological properties and the molecular weight distribution of the polystyrene (PS) mixture measured in the above (1) were each compared with the predicted values of the rheological properties and the molecular weight distribution of the polystyrene (PS) mixture, and the results are shown in
Figures 3 and4 . - In
Figures 3 and4 , a value in which the error range of the measured value and the predicted value was less than 5% was derived as the definite value. In addition, from the setting of the random value, the process of deriving the definite value by comparing the measured value and the predicted value of the rheological property was repeated to derive 70 definite values. The ranges expressed by the minimum values and the maximum values of the above-derived definite values were shown in Table 2 below.[Table 2] Polystyrene (PS) 300K Polystyrene (PS) 120K Structural parameter Mw PDI Wt (%) Mw PDI Wt (%) Definite value 288K∼339K 2∼2.4 45.5∼55.5 102K∼144K 3.4∼4.5 45.5∼55.5 Measured value 300K 3.79 50 120K 2.98 50 Measured value: actual structural parameter value measured using an analyzer, Error range: error of definite value to measured value, Mw: weight average molecular weight, PDI: polydispersity index, Wt: weight ratio of each polymer in polymer mixture, K: 1,000 units - From Table 2 above, it can be confirmed that the definite values derived by the quantitative analysis method of the polymer structure according to the present application have very similar values to the measured values of the structural parameters of the polystyrene (PS) mixture. In the case of the PDI among the above structural parameters, there is a difference between the measured value and the definite value, but this difference is an error to occur because in the case of the actual polymer, the value of the PDI increases toward a specific value depending on the polymerization method or condition and simultaneously represents an asymmetric value, whereas the predicted value of the structural parameter according to the present application is calculated in bilateral symmetry upon predicting the PDI. Such an error is considered together with the calculated structural parameters, for example, the molecular weight or the weight ratio, and as shown in
Figure 3 , the predicted value of the molecular weight distribution value for the entire mixture can be confirmed to a reliable level with respect to the measured value. -

- (a) TMCP-Li (1.3 g, 10 mmol), CuCN (45 mg, 5 mol%) and THF (10 mL) were poured into a 250 mL Schlenk flask. Dichlorodiphenylsilane (2.5 g, 10 mmol) was added dropwise thereto at -20°C or lower, and then the mixture was stirred at room temperature for 16 hours. The temperature was lowered to -20°C and indene-lithium (indene-Li, 1.2 g, 10 mmol in 10 mL of THF) was added dropwise thereto. The mixture was stirred at room temperature for 24 hours and dried in a vacuum to remove the solvent. The residue was filtered with hexane to remove LiCl, and in the filtrate, hexane was dried in a vacuum to obtain an intermediate.
The prepared intermediate (4.2 g, 10 mmol) and THF (15 mL) were poured into a 100 mL Schlenk flask and the temperature was lowered to -20°C. N-Butyl lithium (n-BuLi, 2.5 M in hexane, 8.4 mL, 21 mmol) was slowly added dropwise and stirred at room temperature for 6 hours. ZrCl4(THF)2 (3.8 g, 10 mmol) and toluene (15 mL) were poured into a 250 mL Schlenk flask and stirred at -20°C or lower. The lithiated ligand solution was slowly added thereto. After stirring the mixture at room temperature for 48 hours, the solvent was removed by drying in a vacuum. The residue was dissolved in dichloromethane and filtered to remove lithium chloride (LiCl), and then dichloromethane was dried in a vacuum. 30 mL of toluene was added thereto, stirred for 16 hours, and then filtered to obtain an intermediate as a lemon color solid (2.1 g, 3.6 mmol, yield 36%).
1H NMR (500 MHz, CDCl3): 8.08-8.12 (m, 2H), 7.98-8.05 (m, 2H), 7.77 (d,1H), 7.47-7.53 (m, 3H), 7.42-7.46 (m, 3H), 7.37-7.41 (m, 2H), 6.94 (t, 1H), 6.23 (d,1H), 1.98 (s, 3H), 1.95 (s, 3H), 1.68 (s, 3H), 1.52 (s, 3H). - (b) The intermediate (1.0 g, 1.7 mmol) finally prepared in (a) above, Pd/C (10 mol %) and dichloromethane (40 mL) were injected into a 100 mL high-pressure reactor, and H2 (60 bar) was charged, followed by stirring at 80°C for 24 hours. At the end of the reaction, the reactant was passed through a celite pad to remove the solid, thereby obtaining catalyst A (0.65 g, 1.1 mmol, yield 65%).
1H NMR (500 MHz, CDCl3): 7.90-8.00 (m, 4H), 7.38-7.45 (m, 6H), 6.80 (s,1H), 5.71 (s, 1H), 3.50-3.15 (m, 1H), 2.75-2.85 (m, 1H), 2.50-2.60 (m, 1H), 2.12 (s,3H), 2.03 (s, 3H), 1.97-2.07 (m, 1H), 1.76 (s, 3H), 1.53-1.70 (m, 4H), 1.48 (s, 3H). -

- It was purchased from Strem (CAS No.: 12148-49-1).
- To a 10 L high-pressure reactor, 4.0 kg of toluene solution was added and 800 g of silica (Grace Davison, SP2410) was introduced, and then stirred while raising the temperature of the reactor to 40°C.
- 1.5 kg of a 30 wt% methylaluminoxane (MAO)/toluene solution (Albemarle) was introduced, the temperature was raised to 80°C, and then the mixture was stirred at 200 rpm for 12 hours. Catalyst A and Catalyst B were introduced into a 2 L Schlenk flask at a ratio of 7.4 g: 4.9 g, 7.4 g: 9.8 g, 7.4 g: 19.6 g, and 7.4 g: 0 g, respectively, 25 g of butyl aluminum was added to 1 L of toluene and reacted at 40°C for 60 minutes, and then the reaction mixture was introduced into the high-pressure reactor, the temperature was raised to 80°C, and then the mixture was stirred for 2 hours. After lowering the reactor temperature to room temperature, the stirring was stopped, and the mixture was allowed to stand for 30 minutes and then decanted. To the reactor, 3.0 kg of hexane was introduced and the hexane slurry solution was transferred to a filter dryer and filtered. After purging with 1.5 bar of argon for 10 minutes, four mixed catalysts of Table 3 below were prepared by drying the mixtures under a vacuum at 40°C for 3 hours.
[Table 3] Mixed catalyst 1 Mixed catalyst 2 Mixed catalyst 3 Mixed catalyst 4 Catalyst A content (g) 7.4 7.4 7.4 7.4 Catalyst B content (g) 4.9 9.8 19.6 0 - Samples for the structural analysis were low density polyethylene and a continuous polymerization reactor, which is a slurry loop process of isobutene, was used as a polymerization reactor, where the reactor volume was 140 L and the reaction flow rate was operated at about 7 m/s. All gas streams (ethylene and hydrogen) and 1-hexene, which is a comonomer, required for the polymerization were continuously introduced, where the individual flow rates were adjusted as needed. The concentrations of all gas streams and 1-hexene, which is a comonomer, were confirmed by on-line gas chromatography. Each of the catalysts prepared above was used as a catalyst, and the isobutene slurry was introduced thereto. The reactor pressure was maintained at 40 bar and the polymerization temperature was 84°C. The specific polymerization conditions were as shown in Table 4 below.
[Table 4] Sample 1 Sample 2 Sample 3 Sample 4 Mixed catalyst Mixed catalyst 1 Mixed catalyst 2 Mixed catalyst 3 Mixed catalyst 4 Ethylene inflow 25 24 24 23 Hydrogen input 8 20 5 8 Hexane input 9.2 10.1 8.9 8.8 Slurry density 550 545 550 554 Activity 4.1 4.4 4.9 3.8 Bulk density 0.40 0.39 0.41 0.39 Setting efficiency 50 49 53 52 <Unit> Ethylene inflow: kg/hr, Hydrogen and hexane input: ppm, Slurry density: g/L, Activity: kg-PE/kg-SiO2/hr, Bulk density: g/mL, Setting efficiency: % - For Samples 1 to 4 above, the measured data of number average molecular weights, weight average molecular weights and polydispersity indexes are shown in Table 5 below, which are measured at 160°C by dissolving each sample in 1,2,4-trichlorobenzene containing 0.0125% BHT at 160°C for 10 hours to be subjected to pretreatment and using PL-S260 from Agilent Technology, a conventional analyzer.
[Table 5] Structural parameter Mn Mw PDI Measured value Sample 1 30,761 99,135 3.2 Sample 2 31,797 95,754 3.0 Sample 3 36,135 102,203 2.8 Sample 4 40,300 102,400 2.5 - For Samples 1 to 4 above, rheological properties and molecular weight distribution were measured using a rotational rheometer and GPC. Then, the weight ratio (Wt), the weight average molecular weight (Mw) and the number of side chains of each polymer in the polymer mixture were selected as the structural parameters of the four samples, and random values of the selected structural parameters were set. Thereafter, the rheological properties and the molecular weight distribution were predicted from the random values using the polymer structure analysis method according to the present invention. A random value having an error value between the predicted value and the measured value of less than 5% was derived as a definite value, and 70 definite values were again derived by repeating from the process of setting a random value to the process of comparing the predicted value and the measured value of the rheological property to derive a definite value. The ranges expressed by the minimum values and the maximum values of the derived definite values were shown in Table 6 below.
[Table 6] Low molecular weight linear structure polymer High molecular weight linear structure polymer Branched structure polymer Structural parameter Wt (%) Mw Wt (%) Mw Wt (%) Main chain Mw Side chain Mw Number of side chains Definite value Sample 1 22.0± 6.8 33K± 10K 47.2± 7.1 61K± 7K 30.9± 3.3 220K± 28K 48K±20K 0.046 Sample 2 13.3± 6.0 26K± 10K 54.2± 8.0 61K± 6K 32.7± 4.0 202K± 24K 43K±24K 0.043 Sample 3 17.2± 4.5 31K± 8K 49.8± 8.0 75K± 8K 33.2± 6.3 202K± 26K 44K±26K 0.041 Sample 4 9.7± 5.4 29K± 13K 61.8± 7.3 91K± 11K 28.5± 4.6 160K± 20K 28K±15K 0.047 Number of side chains: number of side chains present in a carbon number of 1000, Wt: weight ratio of each polymer in polymer mixture - Tables 5 and 6 above show that the analysis using the existing analyzer can only measure the structural parameter values of the entire polymer mixture, but the structural parameters for each of low molecular weight linear structures, high molecular weight linear structures and branched polymer structures cannot be known. On the other hand, when using the quantitative analysis method of the polymer structure according to the present application, the tables show that the structural parameter values can be quantitatively analyzed for each of low molecular weight linear structure, high molecular weight linear structure and branched structure polymers mixed in the polymer mixture.
Claims (20)
- A method for quantitative analysis of a polymer structure comprising steps of:(A) measuring rheological properties of the polymer;(B) selecting one or more parameters among structural parameters that said polymer may have, and assigning random values to said selected structural parameters; and(C) predicting rheological properties of the polymer to which the random values are assigned, and comparing said predicted rheological property values of the polymer with the measured rheological property values of the polymer to determine the values of the structural parameters of the polymer.
- The method for quantitative analysis of a polymer structure according to claim 1, wherein the step (A) is performed by a rheometer.
- The method for quantitative analysis of a polymer structure according to claim 1, wherein in the step (A), the polymer is at least one selected from the group consisting of a linear polymer, a branched polymer, a linear polymer mixture and a branched polymer mixture.
- The method for quantitative analysis of a polymer structure according to claim 3, wherein the branched polymer has a weight average molecular weight ratio of side chains to the main chain of 40% or less, or a weight average molecular weight in only the side chains of 3,000 or more.
- The method for quantitative analysis of a polymer structure according to claim 3, wherein the structural parameter selected in the step (B) is one or more selected from a shape of the polymer; a weight average molecular weight (Mw) of the main chain or side chains; a polydispersity index (PDI) of the main chain or side chains; or a number of the side chains.
- The method for quantitative analysis of a polymer structure according to claim 5, wherein, when the polymer selected in the step (A) is a polymer mixture, said structural parameter further comprises a mass fraction between the mixed polymers.
- The method for quantitative analysis of a polymer structure according to claim 1, wherein in the step (C), a step strain of a shear flow is applied to the polymer to which the random value is assigned, where the rheological properties are predicted from a stress relaxation behavior of the polymer induced by said step strain.
- The method for quantitative analysis of a polymer structure according to claim 7, wherein the prediction of the rheological properties of the polymer from the stress relaxation behavior is made using a Doi-Edwards numerical analysis model.
- The method for quantitative analysis of a polymer structure according to claim 1, wherein the comparison, which is performed in the step (C), between said predicted rheological property values of the polymer and said measured rheological property values of the polymer is made by calculating an error value (ε) between the predicted rheological property value of the polymer and the measured rheological property value of the polymer and checking whether said error value (ε) is less than a predetermined error reference value (εs).
- The method for quantitative analysis of a polymer structure according to claim 9, wherein the determination of the structural parameter value of the polymer in the step (C) is made by setting the random value assigned in the step (B) as a definite value, when said error value is less than a predetermined error reference value (εs).
- The method for quantitative analysis of a polymer structure according to claim 10, wherein the step (B) and the step (C) are repeated.
- The method for quantitative analysis of a polymer structure according to claim 11, wherein said definite value is expressed by the minimum value and the maximum value of a plurality of definite values derived by repeating said step (B) and said step (C) two or more times.
- The method for quantitative analysis of a polymer structure according to claim 11 or 12, wherein said definite value is expressed by an average value of a plurality of definite values derived by repeating said step (B) and said step (C) two or more times.
- The method for quantitative analysis of a polymer structure according to claim 1, wherein the step (A) further comprises a step of measuring molecular weight distribution of the polymer using GPC.
- The method for quantitative analysis of a polymer structure according to claim 14, wherein the step (C) further comprises a step of predicting the molecular weight distribution of the polymer to which the random value is assigned, and comparing said predicted molecular weight distribution value of the polymer with the measured molecular weight distribution value of the polymer to determine the value of the structural parameter of the polymer.
- The method for quantitative analysis of a polymer structure according to claim 15, wherein the prediction of the molecular weight distribution of the polymer is made by assuming a log normal distribution on the polymer to which the random value is assigned.
- A computer-readable recording medium, wherein a program for executing the method of any one of claims 1 to 16 is recorded.
- A quantitative analyzer of a polymer structure comprising:a first measuring part for measuring rheological properties of a polymer;a setting part for selecting any one of structural parameters of the arbitrarily selected polymer and assigning a random value to said selected structural parameter;a first predicting part for predicting the rheological property of the polymer to which the random value is assigned; anda calculating part for comparing said predicted rheological property value of the polymer with the measured value of the rheological property of the polymer to determine the value of the structural parameter of the polymer.
- The quantitative analyzer of a polymer structure according to claim 18, further comprising a second measuring part for measuring said molecular weight distribution of the polymer using GPC.
- The quantitative analyzer of a polymer structure according to claim 18, further comprising a second predicting part for predicting the molecular weight distribution of the polymer to which the random value is assigned.
Applications Claiming Priority (2)
| Application Number | Priority Date | Filing Date | Title |
|---|---|---|---|
| KR1020160038881A KR102001610B1 (en) | 2016-03-31 | 2016-03-31 | Quantitative analysis method for polymer structure and device using the same |
| PCT/KR2017/003455 WO2017171416A1 (en) | 2016-03-31 | 2017-03-30 | Quantitative analysis method and analysis apparatus for polymer structure |
Publications (3)
| Publication Number | Publication Date |
|---|---|
| EP3348998A1 true EP3348998A1 (en) | 2018-07-18 |
| EP3348998A4 EP3348998A4 (en) | 2019-04-10 |
| EP3348998B1 EP3348998B1 (en) | 2022-05-04 |
Family
ID=59965001
Family Applications (1)
| Application Number | Title | Priority Date | Filing Date |
|---|---|---|---|
| EP17775840.6A Active EP3348998B1 (en) | 2016-03-31 | 2017-03-30 | Quantitative analysis method and analysis apparatus for polymer structure |
Country Status (5)
| Country | Link |
|---|---|
| US (1) | US11169066B2 (en) |
| EP (1) | EP3348998B1 (en) |
| KR (1) | KR102001610B1 (en) |
| CN (1) | CN108291882B (en) |
| WO (1) | WO2017171416A1 (en) |
Cited By (2)
| Publication number | Priority date | Publication date | Assignee | Title |
|---|---|---|---|---|
| EP3476869A4 (en) * | 2016-12-20 | 2019-07-24 | LG Chem, Ltd. | OLEFIN POLYMER AND PROCESS FOR PREPARING THE SAME |
| EP3476867A4 (en) * | 2016-12-20 | 2019-09-11 | LG Chem, Ltd. | POLYOLEFIN FILM |
Families Citing this family (5)
| Publication number | Priority date | Publication date | Assignee | Title |
|---|---|---|---|---|
| KR102001610B1 (en) * | 2016-03-31 | 2019-10-01 | 주식회사 엘지화학 | Quantitative analysis method for polymer structure and device using the same |
| KR102284858B1 (en) * | 2018-02-23 | 2021-07-30 | 주식회사 엘지에너지솔루션 | Method of measuring phase stability of slurry of anode mixture |
| KR102197541B1 (en) * | 2018-11-30 | 2020-12-31 | 엘에스니꼬동제련 주식회사 | Method for predicting rheological properties of paste |
| KR102616696B1 (en) * | 2019-03-19 | 2023-12-20 | 주식회사 엘지화학 | Method for evaluating crosslinking degree of ethylene vinyl acetate copolymer |
| CN112201316B (en) * | 2020-09-10 | 2024-01-30 | 中国石油天然气股份有限公司 | Dynamic gel forming strength quantitative selection method for chromium gel for deep profile control of oil field |
Family Cites Families (14)
| Publication number | Priority date | Publication date | Assignee | Title |
|---|---|---|---|---|
| JPH10326272A (en) * | 1997-05-23 | 1998-12-08 | Ube Ind Ltd | Polymer melt viscoelasticity estimation device and program recording medium |
| US6917159B2 (en) * | 2003-08-14 | 2005-07-12 | Eastman Kodak Company | Microcavity OLED device |
| US7838605B2 (en) * | 2003-10-17 | 2010-11-23 | Univation Technologies, Llc | Polymerization monitoring and control using improved leading indicators |
| GB0607943D0 (en) * | 2006-04-21 | 2006-05-31 | Novartis Ag | Biomarkers for chronic transplant dysfunction |
| KR100829706B1 (en) * | 2007-05-29 | 2008-05-14 | 호남석유화학 주식회사 | Prediction of Physical Properties of Polymer Products |
| CN102854155A (en) * | 2011-06-28 | 2013-01-02 | 罗文宇 | Quantitative analysis method and system for substances |
| JP5548180B2 (en) * | 2011-11-24 | 2014-07-16 | 住友ゴム工業株式会社 | Method for simulating polymer materials |
| KR101340739B1 (en) * | 2012-06-18 | 2014-01-03 | 주식회사 엘지화학 | Apparatus and method for analyzing side chain of polymer |
| US9834630B2 (en) * | 2014-06-09 | 2017-12-05 | King Fahd University Of Petroleum And Minerals | Supported metallocene catalyst for olefin polymerization |
| US9932443B2 (en) * | 2014-12-05 | 2018-04-03 | University Of South Florida | Peptide-based materials |
| US10428286B2 (en) * | 2015-09-18 | 2019-10-01 | California Institute Of Technology | Associative polymers for use in a flow and related compositions, methods and systems |
| KR102001610B1 (en) * | 2016-03-31 | 2019-10-01 | 주식회사 엘지화학 | Quantitative analysis method for polymer structure and device using the same |
| KR102139364B1 (en) * | 2016-12-20 | 2020-07-29 | 주식회사 엘지화학 | Olefin polymer and preparation method thereof |
| US11053356B2 (en) * | 2017-03-07 | 2021-07-06 | California Institute Of Technology | Control of polymer architectures by living ring-opening metathesis copolymerization |
-
2016
- 2016-03-31 KR KR1020160038881A patent/KR102001610B1/en active Active
-
2017
- 2017-03-30 EP EP17775840.6A patent/EP3348998B1/en active Active
- 2017-03-30 US US15/767,519 patent/US11169066B2/en active Active
- 2017-03-30 WO PCT/KR2017/003455 patent/WO2017171416A1/en not_active Ceased
- 2017-03-30 CN CN201780004169.6A patent/CN108291882B/en active Active
Cited By (2)
| Publication number | Priority date | Publication date | Assignee | Title |
|---|---|---|---|---|
| EP3476869A4 (en) * | 2016-12-20 | 2019-07-24 | LG Chem, Ltd. | OLEFIN POLYMER AND PROCESS FOR PREPARING THE SAME |
| EP3476867A4 (en) * | 2016-12-20 | 2019-09-11 | LG Chem, Ltd. | POLYOLEFIN FILM |
Also Published As
| Publication number | Publication date |
|---|---|
| CN108291882B (en) | 2021-04-02 |
| WO2017171416A1 (en) | 2017-10-05 |
| EP3348998A4 (en) | 2019-04-10 |
| KR20170112184A (en) | 2017-10-12 |
| CN108291882A (en) | 2018-07-17 |
| US20180306694A1 (en) | 2018-10-25 |
| KR102001610B1 (en) | 2019-10-01 |
| EP3348998B1 (en) | 2022-05-04 |
| US11169066B2 (en) | 2021-11-09 |
Similar Documents
| Publication | Publication Date | Title |
|---|---|---|
| EP3348998A1 (en) | Quantitative analysis method and analysis apparatus for polymer structure | |
| Graebling et al. | Linear viscoelastic behavior of some incompatible polymer blends in the melt. Interpretation of data with a model of emulsion of viscoelastic liquids | |
| Paulo et al. | Synthesis of hyperbranched polyisobutylenes by inimer-type living polymerization. 1. Investigation of the effect of reaction conditions | |
| Baurngaertel et al. | The relaxation time spectrum of nearly monodisperse polybutadiene melts | |
| Burgess et al. | Reaction to effect the transformation of anionic polymerization into cationic polymerization: 3. Analysis of block copolymer formation by gel permeation chromatography | |
| Snijkers et al. | Viscoelasticity, nonlinear shear start-up, and relaxation of entangled star polymers | |
| Terashima et al. | In situ and time-resolved small-angle neutron scattering observation of star polymer formation via arm-linking reaction in ruthenium-catalyzed living radical polymerization | |
| Stadler et al. | Rheological Characterization of Long‐chain Branched Polyethylenes and Comparison with Classical Analytical Methods | |
| KR20080042742A (en) | Method for measuring molecular weight distribution of polymer | |
| Chen et al. | Combined synthesis, TGIC characterization, and rheological measurement and prediction of symmetric H polybutadienes and their blends with linear and star-shaped polybutadienes | |
| EP3517976A1 (en) | Method for evaluating physical properties of polyethylene resin | |
| Dossi et al. | Understanding and controlling the glass transition of HTPB oligomers | |
| EA019563B1 (en) | Cable layer comprising propylene homopolymer, use thereof as insulation or semiconductive layer, and cable comprising such layer | |
| Roland | Rheology of a miscible polymer blend | |
| Chambon et al. | Synthesis, temperature gradient interaction chromatography, and rheology of entangled styrene comb polymers | |
| Langela et al. | Microphase reorientation in block copolymer melts as detected via FT rheology and 2D SAXS | |
| Shivokhin et al. | Interplay of entanglement and association effects on the dynamics of semidilute solutions of multisticker polymer chains | |
| Snijkers et al. | Architectural dispersity in model branched polymers: Analysis and rheological consequences | |
| Rodríguez-Guadarrama | Application of online near infrared spectroscopy to study the kinetics of anionic polymerization of butadiene | |
| Grotian genannt Klages et al. | Coupling Kinetic Modelling with SAOS and LAOS Rheology of Poly (n‐butyl acrylate) | |
| Lange et al. | Gelation behaviour during chainwise crosslinking polymerisation of methacrylate resins | |
| Shaikh et al. | A new high‐throughput approach to measure copolymerization reactivity ratios using real‐time FTIR monitoring | |
| Reis et al. | Development of calibration models for estimation of monomer concentration by Raman spectroscopy during emulsion polymerization: Facing the medium heterogeneity | |
| Thomson et al. | Catalytic chain transfer mediated emulsion polymerization: compartmentalization and its effects on the molecular weight distribution | |
| Niu et al. | Polymerization of 1-octene by a pyridylamidohafnium catalyst: A SEC, 1H NMR and small angle neutron scattering study |
Legal Events
| Date | Code | Title | Description |
|---|---|---|---|
| STAA | Information on the status of an ep patent application or granted ep patent |
Free format text: STATUS: THE INTERNATIONAL PUBLICATION HAS BEEN MADE |
|
| PUAI | Public reference made under article 153(3) epc to a published international application that has entered the european phase |
Free format text: ORIGINAL CODE: 0009012 |
|
| STAA | Information on the status of an ep patent application or granted ep patent |
Free format text: STATUS: REQUEST FOR EXAMINATION WAS MADE |
|
| 17P | Request for examination filed |
Effective date: 20180411 |
|
| AK | Designated contracting states |
Kind code of ref document: A1 Designated state(s): AL AT BE BG CH CY CZ DE DK EE ES FI FR GB GR HR HU IE IS IT LI LT LU LV MC MK MT NL NO PL PT RO RS SE SI SK SM TR |
|
| AX | Request for extension of the european patent |
Extension state: BA ME |
|
| REG | Reference to a national code |
Ref country code: DE Ref legal event code: R079 Ref document number: 602017056971 Country of ref document: DE Free format text: PREVIOUS MAIN CLASS: G01N0024000000 Ipc: G01N0033440000 |
|
| A4 | Supplementary search report drawn up and despatched |
Effective date: 20190314 |
|
| RIC1 | Information provided on ipc code assigned before grant |
Ipc: G16C 20/00 20190101ALI20190307BHEP Ipc: G01N 11/00 20060101ALI20190307BHEP Ipc: G01N 33/44 20060101AFI20190307BHEP |
|
| DAV | Request for validation of the european patent (deleted) | ||
| DAX | Request for extension of the european patent (deleted) | ||
| STAA | Information on the status of an ep patent application or granted ep patent |
Free format text: STATUS: EXAMINATION IS IN PROGRESS |
|
| 17Q | First examination report despatched |
Effective date: 20191031 |
|
| GRAP | Despatch of communication of intention to grant a patent |
Free format text: ORIGINAL CODE: EPIDOSNIGR1 |
|
| STAA | Information on the status of an ep patent application or granted ep patent |
Free format text: STATUS: GRANT OF PATENT IS INTENDED |
|
| INTG | Intention to grant announced |
Effective date: 20220107 |
|
| GRAS | Grant fee paid |
Free format text: ORIGINAL CODE: EPIDOSNIGR3 |
|
| GRAA | (expected) grant |
Free format text: ORIGINAL CODE: 0009210 |
|
| STAA | Information on the status of an ep patent application or granted ep patent |
Free format text: STATUS: THE PATENT HAS BEEN GRANTED |
|
| AK | Designated contracting states |
Kind code of ref document: B1 Designated state(s): AL AT BE BG CH CY CZ DE DK EE ES FI FR GB GR HR HU IE IS IT LI LT LU LV MC MK MT NL NO PL PT RO RS SE SI SK SM TR |
|
| REG | Reference to a national code |
Ref country code: GB Ref legal event code: FG4D |
|
| REG | Reference to a national code |
Ref country code: CH Ref legal event code: EP |
|
| REG | Reference to a national code |
Ref country code: AT Ref legal event code: REF Ref document number: 1489575 Country of ref document: AT Kind code of ref document: T Effective date: 20220515 |
|
| REG | Reference to a national code |
Ref country code: DE Ref legal event code: R096 Ref document number: 602017056971 Country of ref document: DE |
|
| REG | Reference to a national code |
Ref country code: IE Ref legal event code: FG4D |
|
| REG | Reference to a national code |
Ref country code: LT Ref legal event code: MG9D |
|
| REG | Reference to a national code |
Ref country code: NL Ref legal event code: MP Effective date: 20220504 |
|
| REG | Reference to a national code |
Ref country code: AT Ref legal event code: MK05 Ref document number: 1489575 Country of ref document: AT Kind code of ref document: T Effective date: 20220504 |
|
| PG25 | Lapsed in a contracting state [announced via postgrant information from national office to epo] |
Ref country code: SE Free format text: LAPSE BECAUSE OF FAILURE TO SUBMIT A TRANSLATION OF THE DESCRIPTION OR TO PAY THE FEE WITHIN THE PRESCRIBED TIME-LIMIT Effective date: 20220504 Ref country code: PT Free format text: LAPSE BECAUSE OF FAILURE TO SUBMIT A TRANSLATION OF THE DESCRIPTION OR TO PAY THE FEE WITHIN THE PRESCRIBED TIME-LIMIT Effective date: 20220905 Ref country code: NO Free format text: LAPSE BECAUSE OF FAILURE TO SUBMIT A TRANSLATION OF THE DESCRIPTION OR TO PAY THE FEE WITHIN THE PRESCRIBED TIME-LIMIT Effective date: 20220804 Ref country code: NL Free format text: LAPSE BECAUSE OF FAILURE TO SUBMIT A TRANSLATION OF THE DESCRIPTION OR TO PAY THE FEE WITHIN THE PRESCRIBED TIME-LIMIT Effective date: 20220504 Ref country code: LT Free format text: LAPSE BECAUSE OF FAILURE TO SUBMIT A TRANSLATION OF THE DESCRIPTION OR TO PAY THE FEE WITHIN THE PRESCRIBED TIME-LIMIT Effective date: 20220504 Ref country code: HR Free format text: LAPSE BECAUSE OF FAILURE TO SUBMIT A TRANSLATION OF THE DESCRIPTION OR TO PAY THE FEE WITHIN THE PRESCRIBED TIME-LIMIT Effective date: 20220504 Ref country code: GR Free format text: LAPSE BECAUSE OF FAILURE TO SUBMIT A TRANSLATION OF THE DESCRIPTION OR TO PAY THE FEE WITHIN THE PRESCRIBED TIME-LIMIT Effective date: 20220805 Ref country code: FI Free format text: LAPSE BECAUSE OF FAILURE TO SUBMIT A TRANSLATION OF THE DESCRIPTION OR TO PAY THE FEE WITHIN THE PRESCRIBED TIME-LIMIT Effective date: 20220504 Ref country code: ES Free format text: LAPSE BECAUSE OF FAILURE TO SUBMIT A TRANSLATION OF THE DESCRIPTION OR TO PAY THE FEE WITHIN THE PRESCRIBED TIME-LIMIT Effective date: 20220504 Ref country code: BG Free format text: LAPSE BECAUSE OF FAILURE TO SUBMIT A TRANSLATION OF THE DESCRIPTION OR TO PAY THE FEE WITHIN THE PRESCRIBED TIME-LIMIT Effective date: 20220804 Ref country code: AT Free format text: LAPSE BECAUSE OF FAILURE TO SUBMIT A TRANSLATION OF THE DESCRIPTION OR TO PAY THE FEE WITHIN THE PRESCRIBED TIME-LIMIT Effective date: 20220504 |
|
| PG25 | Lapsed in a contracting state [announced via postgrant information from national office to epo] |
Ref country code: RS Free format text: LAPSE BECAUSE OF FAILURE TO SUBMIT A TRANSLATION OF THE DESCRIPTION OR TO PAY THE FEE WITHIN THE PRESCRIBED TIME-LIMIT Effective date: 20220504 Ref country code: PL Free format text: LAPSE BECAUSE OF FAILURE TO SUBMIT A TRANSLATION OF THE DESCRIPTION OR TO PAY THE FEE WITHIN THE PRESCRIBED TIME-LIMIT Effective date: 20220504 Ref country code: LV Free format text: LAPSE BECAUSE OF FAILURE TO SUBMIT A TRANSLATION OF THE DESCRIPTION OR TO PAY THE FEE WITHIN THE PRESCRIBED TIME-LIMIT Effective date: 20220504 Ref country code: IS Free format text: LAPSE BECAUSE OF FAILURE TO SUBMIT A TRANSLATION OF THE DESCRIPTION OR TO PAY THE FEE WITHIN THE PRESCRIBED TIME-LIMIT Effective date: 20220904 |
|
| PG25 | Lapsed in a contracting state [announced via postgrant information from national office to epo] |
Ref country code: SM Free format text: LAPSE BECAUSE OF FAILURE TO SUBMIT A TRANSLATION OF THE DESCRIPTION OR TO PAY THE FEE WITHIN THE PRESCRIBED TIME-LIMIT Effective date: 20220504 Ref country code: SK Free format text: LAPSE BECAUSE OF FAILURE TO SUBMIT A TRANSLATION OF THE DESCRIPTION OR TO PAY THE FEE WITHIN THE PRESCRIBED TIME-LIMIT Effective date: 20220504 Ref country code: RO Free format text: LAPSE BECAUSE OF FAILURE TO SUBMIT A TRANSLATION OF THE DESCRIPTION OR TO PAY THE FEE WITHIN THE PRESCRIBED TIME-LIMIT Effective date: 20220504 Ref country code: EE Free format text: LAPSE BECAUSE OF FAILURE TO SUBMIT A TRANSLATION OF THE DESCRIPTION OR TO PAY THE FEE WITHIN THE PRESCRIBED TIME-LIMIT Effective date: 20220504 Ref country code: DK Free format text: LAPSE BECAUSE OF FAILURE TO SUBMIT A TRANSLATION OF THE DESCRIPTION OR TO PAY THE FEE WITHIN THE PRESCRIBED TIME-LIMIT Effective date: 20220504 Ref country code: CZ Free format text: LAPSE BECAUSE OF FAILURE TO SUBMIT A TRANSLATION OF THE DESCRIPTION OR TO PAY THE FEE WITHIN THE PRESCRIBED TIME-LIMIT Effective date: 20220504 |
|
| REG | Reference to a national code |
Ref country code: DE Ref legal event code: R097 Ref document number: 602017056971 Country of ref document: DE |
|
| PLBE | No opposition filed within time limit |
Free format text: ORIGINAL CODE: 0009261 |
|
| STAA | Information on the status of an ep patent application or granted ep patent |
Free format text: STATUS: NO OPPOSITION FILED WITHIN TIME LIMIT |
|
| PG25 | Lapsed in a contracting state [announced via postgrant information from national office to epo] |
Ref country code: AL Free format text: LAPSE BECAUSE OF FAILURE TO SUBMIT A TRANSLATION OF THE DESCRIPTION OR TO PAY THE FEE WITHIN THE PRESCRIBED TIME-LIMIT Effective date: 20220504 |
|
| 26N | No opposition filed |
Effective date: 20230207 |
|
| PG25 | Lapsed in a contracting state [announced via postgrant information from national office to epo] |
Ref country code: SI Free format text: LAPSE BECAUSE OF FAILURE TO SUBMIT A TRANSLATION OF THE DESCRIPTION OR TO PAY THE FEE WITHIN THE PRESCRIBED TIME-LIMIT Effective date: 20220504 |
|
| PG25 | Lapsed in a contracting state [announced via postgrant information from national office to epo] |
Ref country code: MC Free format text: LAPSE BECAUSE OF FAILURE TO SUBMIT A TRANSLATION OF THE DESCRIPTION OR TO PAY THE FEE WITHIN THE PRESCRIBED TIME-LIMIT Effective date: 20220504 |
|
| REG | Reference to a national code |
Ref country code: CH Ref legal event code: PL |
|
| REG | Reference to a national code |
Ref country code: BE Ref legal event code: MM Effective date: 20230331 |
|
| PG25 | Lapsed in a contracting state [announced via postgrant information from national office to epo] |
Ref country code: LU Free format text: LAPSE BECAUSE OF NON-PAYMENT OF DUE FEES Effective date: 20230330 |
|
| REG | Reference to a national code |
Ref country code: IE Ref legal event code: MM4A |
|
| PG25 | Lapsed in a contracting state [announced via postgrant information from national office to epo] |
Ref country code: IT Free format text: LAPSE BECAUSE OF FAILURE TO SUBMIT A TRANSLATION OF THE DESCRIPTION OR TO PAY THE FEE WITHIN THE PRESCRIBED TIME-LIMIT Effective date: 20220504 Ref country code: IE Free format text: LAPSE BECAUSE OF NON-PAYMENT OF DUE FEES Effective date: 20230330 Ref country code: CH Free format text: LAPSE BECAUSE OF NON-PAYMENT OF DUE FEES Effective date: 20230331 Ref country code: LI Free format text: LAPSE BECAUSE OF NON-PAYMENT OF DUE FEES Effective date: 20230331 |
|
| PG25 | Lapsed in a contracting state [announced via postgrant information from national office to epo] |
Ref country code: BE Free format text: LAPSE BECAUSE OF NON-PAYMENT OF DUE FEES Effective date: 20230331 |
|
| PG25 | Lapsed in a contracting state [announced via postgrant information from national office to epo] |
Ref country code: BG Free format text: LAPSE BECAUSE OF FAILURE TO SUBMIT A TRANSLATION OF THE DESCRIPTION OR TO PAY THE FEE WITHIN THE PRESCRIBED TIME-LIMIT Effective date: 20220504 |
|
| PG25 | Lapsed in a contracting state [announced via postgrant information from national office to epo] |
Ref country code: BG Free format text: LAPSE BECAUSE OF FAILURE TO SUBMIT A TRANSLATION OF THE DESCRIPTION OR TO PAY THE FEE WITHIN THE PRESCRIBED TIME-LIMIT Effective date: 20220504 |
|
| PG25 | Lapsed in a contracting state [announced via postgrant information from national office to epo] |
Ref country code: CY Free format text: LAPSE BECAUSE OF FAILURE TO SUBMIT A TRANSLATION OF THE DESCRIPTION OR TO PAY THE FEE WITHIN THE PRESCRIBED TIME-LIMIT; INVALID AB INITIO Effective date: 20170330 |
|
| PG25 | Lapsed in a contracting state [announced via postgrant information from national office to epo] |
Ref country code: HU Free format text: LAPSE BECAUSE OF FAILURE TO SUBMIT A TRANSLATION OF THE DESCRIPTION OR TO PAY THE FEE WITHIN THE PRESCRIBED TIME-LIMIT; INVALID AB INITIO Effective date: 20170330 |
|
| PG25 | Lapsed in a contracting state [announced via postgrant information from national office to epo] |
Ref country code: TR Free format text: LAPSE BECAUSE OF FAILURE TO SUBMIT A TRANSLATION OF THE DESCRIPTION OR TO PAY THE FEE WITHIN THE PRESCRIBED TIME-LIMIT Effective date: 20220504 |
|
| PGFP | Annual fee paid to national office [announced via postgrant information from national office to epo] |
Ref country code: GB Payment date: 20260224 Year of fee payment: 10 |
|
| PGFP | Annual fee paid to national office [announced via postgrant information from national office to epo] |
Ref country code: DE Payment date: 20260220 Year of fee payment: 10 |
|
| PGFP | Annual fee paid to national office [announced via postgrant information from national office to epo] |
Ref country code: FR Payment date: 20260224 Year of fee payment: 10 |