EP3315991A1 - Time of arrival (toa) measurements - Google Patents
Time of arrival (toa) measurements Download PDFInfo
- Publication number
- EP3315991A1 EP3315991A1 EP16196384.8A EP16196384A EP3315991A1 EP 3315991 A1 EP3315991 A1 EP 3315991A1 EP 16196384 A EP16196384 A EP 16196384A EP 3315991 A1 EP3315991 A1 EP 3315991A1
- Authority
- EP
- European Patent Office
- Prior art keywords
- sample
- correlation
- peak
- data
- toa
- Prior art date
- Legal status (The legal status is an assumption and is not a legal conclusion. Google has not performed a legal analysis and makes no representation as to the accuracy of the status listed.)
- Withdrawn
Links
Images







Classifications
-
- G—PHYSICS
- G01—MEASURING; TESTING
- G01S—RADIO DIRECTION-FINDING; RADIO NAVIGATION; DETERMINING DISTANCE OR VELOCITY BY USE OF RADIO WAVES; LOCATING OR PRESENCE-DETECTING BY USE OF THE REFLECTION OR RERADIATION OF RADIO WAVES; ANALOGOUS ARRANGEMENTS USING OTHER WAVES
- G01S5/00—Position-fixing by co-ordinating two or more direction or position line determinations; Position-fixing by co-ordinating two or more distance determinations
- G01S5/02—Position-fixing by co-ordinating two or more direction or position line determinations; Position-fixing by co-ordinating two or more distance determinations using radio waves
- G01S5/0205—Details
- G01S5/0221—Receivers
- G01S5/02213—Receivers arranged in a network for determining the position of a transmitter
-
- G—PHYSICS
- G01—MEASURING; TESTING
- G01S—RADIO DIRECTION-FINDING; RADIO NAVIGATION; DETERMINING DISTANCE OR VELOCITY BY USE OF RADIO WAVES; LOCATING OR PRESENCE-DETECTING BY USE OF THE REFLECTION OR RERADIATION OF RADIO WAVES; ANALOGOUS ARRANGEMENTS USING OTHER WAVES
- G01S11/00—Systems for determining distance or velocity not using reflection or reradiation
-
- G—PHYSICS
- G01—MEASURING; TESTING
- G01S—RADIO DIRECTION-FINDING; RADIO NAVIGATION; DETERMINING DISTANCE OR VELOCITY BY USE OF RADIO WAVES; LOCATING OR PRESENCE-DETECTING BY USE OF THE REFLECTION OR RERADIATION OF RADIO WAVES; ANALOGOUS ARRANGEMENTS USING OTHER WAVES
- G01S11/00—Systems for determining distance or velocity not using reflection or reradiation
- G01S11/02—Systems for determining distance or velocity not using reflection or reradiation using radio waves
-
- G—PHYSICS
- G01—MEASURING; TESTING
- G01S—RADIO DIRECTION-FINDING; RADIO NAVIGATION; DETERMINING DISTANCE OR VELOCITY BY USE OF RADIO WAVES; LOCATING OR PRESENCE-DETECTING BY USE OF THE REFLECTION OR RERADIATION OF RADIO WAVES; ANALOGOUS ARRANGEMENTS USING OTHER WAVES
- G01S11/00—Systems for determining distance or velocity not using reflection or reradiation
- G01S11/14—Systems for determining distance or velocity not using reflection or reradiation using ultrasonic, sonic or infrasonic waves
-
- G—PHYSICS
- G01—MEASURING; TESTING
- G01S—RADIO DIRECTION-FINDING; RADIO NAVIGATION; DETERMINING DISTANCE OR VELOCITY BY USE OF RADIO WAVES; LOCATING OR PRESENCE-DETECTING BY USE OF THE REFLECTION OR RERADIATION OF RADIO WAVES; ANALOGOUS ARRANGEMENTS USING OTHER WAVES
- G01S5/00—Position-fixing by co-ordinating two or more direction or position line determinations; Position-fixing by co-ordinating two or more distance determinations
- G01S5/02—Position-fixing by co-ordinating two or more direction or position line determinations; Position-fixing by co-ordinating two or more distance determinations using radio waves
- G01S5/0205—Details
- G01S5/021—Calibration, monitoring or correction
-
- G—PHYSICS
- G01—MEASURING; TESTING
- G01S—RADIO DIRECTION-FINDING; RADIO NAVIGATION; DETERMINING DISTANCE OR VELOCITY BY USE OF RADIO WAVES; LOCATING OR PRESENCE-DETECTING BY USE OF THE REFLECTION OR RERADIATION OF RADIO WAVES; ANALOGOUS ARRANGEMENTS USING OTHER WAVES
- G01S5/00—Position-fixing by co-ordinating two or more direction or position line determinations; Position-fixing by co-ordinating two or more distance determinations
- G01S5/02—Position-fixing by co-ordinating two or more direction or position line determinations; Position-fixing by co-ordinating two or more distance determinations using radio waves
- G01S5/04—Position of source determined by a plurality of spaced direction-finders
-
- G—PHYSICS
- G01—MEASURING; TESTING
- G01S—RADIO DIRECTION-FINDING; RADIO NAVIGATION; DETERMINING DISTANCE OR VELOCITY BY USE OF RADIO WAVES; LOCATING OR PRESENCE-DETECTING BY USE OF THE REFLECTION OR RERADIATION OF RADIO WAVES; ANALOGOUS ARRANGEMENTS USING OTHER WAVES
- G01S13/00—Systems using the reflection or reradiation of radio waves, e.g. radar systems; Analogous systems using reflection or reradiation of waves whose nature or wavelength is irrelevant or unspecified
- G01S13/74—Systems using reradiation of radio waves, e.g. secondary radar systems; Analogous systems
-
- G—PHYSICS
- G01—MEASURING; TESTING
- G01S—RADIO DIRECTION-FINDING; RADIO NAVIGATION; DETERMINING DISTANCE OR VELOCITY BY USE OF RADIO WAVES; LOCATING OR PRESENCE-DETECTING BY USE OF THE REFLECTION OR RERADIATION OF RADIO WAVES; ANALOGOUS ARRANGEMENTS USING OTHER WAVES
- G01S5/00—Position-fixing by co-ordinating two or more direction or position line determinations; Position-fixing by co-ordinating two or more distance determinations
- G01S5/02—Position-fixing by co-ordinating two or more direction or position line determinations; Position-fixing by co-ordinating two or more distance determinations using radio waves
- G01S5/14—Determining absolute distances from a plurality of spaced points of known location
-
- H—ELECTRICITY
- H04—ELECTRIC COMMUNICATION TECHNIQUE
- H04L—TRANSMISSION OF DIGITAL INFORMATION, e.g. TELEGRAPHIC COMMUNICATION
- H04L5/00—Arrangements affording multiple use of the transmission path
- H04L5/14—Two-way operation using the same type of signal, i.e. duplex
Definitions
- Time of arrival (TOA) operations may permit to estimate distances of a transmitter which sends a transmission (e.g., radio-frequency transmissions or ultrasound transmissions) from a receiver which receives the transmissions.
- TOA estimations may be obtained by correlating a received signal with a stored signal and by retrieving a sample which carries the peak value of a correlation function.
- TOA estimations may have a resolution (e.g., expressed in meters) limited by the sampling rate.
- US 7,653004 B2 discloses a method for performing a TOA measurement. According thereto, a correlation is first identified by comparing the received correlation profile with different reference correlation functions. On the basis of the comparison, the TOA is corrected by an estimated phase delay.
- WO 2006063768 A1 discloses a method for performing a TOA measurement from the inflection edge of a correlation profile.
- US 7,054,126 B2 discloses a method for performing a TOA measurement using square-root raised-cosine pulse shaping and chip matched filters on direct sequence spreading waveforms.
- a method for time of arrival, TOA, measurements comprising:
- the correlation data (e.g., correlation values) of the samples preceding and/or following the peak sample have information regarding the TOA and/or distance which is even more accurate that the information that may be obtained by simply identifying the peak in the correlation function.
- the correlation data may be adapted to the environment using pre-assigned configuration data.
- a "subsample'' resolution may be obtained, i.e., a resolution (e.g., in terms of distances that may be determined) that goes beyond the maximum resolution possible with the sampling rate of receiver when sampling the received signal.
- the pre-assigned configuration data vary according to the distance.
- a configuration session obtaining a plurality of data from configuration signals received from a plurality of different distances, to obtain pre-assigned configuration data in association to distances or time delays.
- the pre-assigned data may be extremely precise.
- the pre-assigned configuration data may also have a subsample resolution, which permits to increase the accuracy of the distance data obtained by the correlation data of the samples close to the peak sample.
- the at least one additional sample preceding and/or following the peak sample comprises at least the sample immediately preceding the peak sample, and/or at least the sample immediately following the peak sample, and/or a sample preceding or following the peak sample of a determined number of samples.
- These samples may provide particularly accurate information on the real distance and/or TOA.
- a configuration session may a simulation session, e.g., in which the received signals are simulated over a simulated channel simulating the features of the transmission channel.
- the quotient: R i + 1 ⁇ R i ⁇ 1 R i + 1 + R i ⁇ 1 may provide accurate information on the real distance and/or TOA of the received signal.
- This quotient may be calculated, in the measurement session, in the step of determining the TOA and/or the distance.
- This quotient may additionally or alternatively calculated in the configuration session, to obtain accurate information on the transmission channel.
- a method for performing difference time of arrival measurements comprising measuring a first TOA for a first transmission, a second TOA for a second transmission, and measuring a distance by subtracting the first TOA from the second TOA, wherein at least one of the measurements are performed with a method according to examples above and/or below.
- a method for performing round trip time, RTT, measurements comprising transmitting a first signal from a first device to a second device, transmitting a second signal from a first device to a second device, and performing the method one of the examples above and/or below for calculating the distance between the first and the second devices for at least the first and/or the second signals.
- a device comprising:
- the device may perform one of the methods discussed above and/or below.
- a storage device containing pre-assigned configuration data to be combined to the correlation data of at least one of the samples preceding and/or following the sample with the peak to adapt a measurement to the transmission channel.
- a system comprising a transmitter and a receiver (e.g., one of the devices above and/or below) and is to measure a TOA of a signal received from the transmitter at least in the determining step or in the configuration session.
- the sampling rate of the signals transmitted/received in the configuration session is the same of the sampling rate of the signals transmitted/received in the measurement (operation) session. Notwithstanding, information may be obtained at a subsample resolution by performing a great number of configuration measurements in the configuration session.
- the transceiver it is possible to perform real configuration measurements in the configuration session using a hardware chain for the transceiver. Cables of different length may be used for this configuration session to get a correlation profile at each length.
- the cable may directly connect the transmitter to the receiver output.
- the exact signal propagation time for each cable may be controlled with a measurement instrument set at the defined carrier frequency.
- the transmitter and the receiver may be synchronized.
- the number of cables used may be related to the number of subsamples (K). Accordingly, pre-assigned configuration data may be calculated for each measurement with a different cable length. Knowing the exact signal propagation time for each cable,
- transmissions and/or signals may be, for example, radio-frequency and/or ultrasound transmission and/or signals.
- the transmitter and/or the receiver may be, for example, movable and/or may be engaged to moving means.
- the transmitter and/or the receiver may be, for example, engaged to a satellite.
- Fig. 1A shows a method 120.
- the method 120 may be used to perform measurements using a TOA technique.
- the method 120 may use configuration data which may have been obtained, for example, in a preceding method, e.g., in a configuration (offline) session 110 (shown in Fig. 1 E) .
- Reference numeral 100 in Fig. 1E refers to a sequence of methods 110 and 120.
- the method 110 may be performed (even days or years) before the start of method 120.
- the method 120 may comprise an operation session during which TOA measurements are performed and/or prepared.
- the method 120 may use pre-assigned configuration data.
- the configuration data may be data obtained using a configuration session such as a session defined by the method 110, for example.
- the method 120 may be performed on a measurement signal which has (when received) a sampling rate (measurement sampling rate).
- a transmission received by a transmitter may be sampled at the sampling rate.
- the sampling rate may be such that a measurement received signal is processed as a succession of discrete samples (each sample associated to a particular time instant). Therefore, a received signal may be represented as a succession of samples (e.g., 0, 1, 2, ..., i-1, i, i+1, ..., I), each of which is associated to a value (which may be connected, for example, to electromagnetic or ultrasound magnitudes), which received by the receiver by sampling (the received signal may be physically obtained by an antenna).
- the received signals may be processed, e.g., using a digital signal processor (DSP) or another computing device, to obtain data which may permit to obtain a measurement of the TOA (time delay of a transmission), which is connected to the environment (transmission channel).
- DSP digital signal processor
- the sampling time is associated to a resolution.
- the time delays and/or the distances that that may be recognized are discrete in number.
- a correlation process may be performed on a received measurement signal.
- a correlation function (measurement correlation function) may be derived.
- a peak sample may be determined in the measurement correlation function to permit an estimation of a TOA and/or a distance associated to the received signal.
- correlation cross-correlation
- I is the reference code length in samples
- i is a value which indicates how far y shall be shifted so that y and x correspond.
- x * is the complex conjugate of x.
- the sign R(i) will be used instead of R xy [i] for simplicity.
- reference may be made to the peak of the absolute value (e.g., only a positive value).
- the correlation function quantifies how y[i+1] and x[i] matches which is associated to a probability of the two functions being in phase.
- the correlation may have a sampling rate which may be the same of (or may be associated to) the received measurement signal.
- a synchronization of the signals may be a prerequisite to perform the correlation.
- the resolution achievable by the correlation processes is bounded to the distance between adjacent samples. If, for example, the distance between sample i-1 (at instant t 1 ) and i (at instant t 2 ) is 10 ns, information is provided for instants t 1 and t 2 , but the correlation does not give the same accurate information on different instants (such as, for example, t 1 ⁇ t ⁇ t 2 ) .
- a peak sample may be retrieved in the correlation function.
- the peak sample may directly associate the measurement received signal to a distance (e.g., between the antenna of the transmitter and the antenna of the receiver).
- a TOA it is possible to estimate a TOA by determining the peak sample, which is the sample (in the succession of samples of the correlation profile) which has the maximum value (e.g., the maximum absolute value).
- the information provided by the correlation (and the estimated TOAs and distances, as well) may have a maximum resolution, which may be bounded to the sampling rate of the received measurement signal. The fact that the resolution is limited (maximum achievable resolution) may, for example, cause a granularity of distances.
- maximum resolution which may be bounded to the sampling rate of the received measurement signal.
- the peak value in the correlation profile may be retrieved at an i th sample (associated to a particular TOA and/or a particular distance), while at a second instant the peak value may be retrieved at an (i+1) th sample (associated to another TOA and/or another distance), but the determination of the peak values, as such, does not give information on the signal time of flight (TOF) at an instant intermediate between the i th sample and the (i+1) th sample (and, therefore, does not information on the distance of receiver form the transmitter). Therefore, a peak sample determination, as such, estimates a TOF whose resolution is limited by the sampling rate (coarse estimation). Therefore, at least at step 124, additional data, other than the position of the peak in the correlation profile, are collected from the correlation profile to correct the estimation that may be computed using the peak sample determination.
- TOF signal time of flight
- correlation data of at least one additional sample preceding and/or following the peak sample in the measurement correlation function may be determined. For example, it is possible to determine the sample immediately preceding the peak sample and/or the sample immediately following the peak sample.
- the immediately preceding or following sample may be the sample which precedes or follows the peak sample of just one sample in the measurement received function (adjacent samples). For example, if a received function is received as a succession of 1, 2, ..., i-1, i, i+1, ... , I, samples, and the peak sample is the i th sample of the succession, the immediately preceding sample is the (i-1) th sample, while the immediately following sample is the (i+1) th sample.
- the time delay from the immediately preceding/following samples and the peak sample is, therefore, 10 ns.
- the correlation values and/or data may also be obtained in step 124. For example, the correlation value of the peak and/or the correlation values of at least one of the samples i-2, i-1, i, i+1, i+2 may be collected.
- values associated to the correlation values of the at least one additional sample preceding and/or following the peak sample may be retrieved.
- a value (or modified versions thereof, such as a normalized value) of the correlation function at the at least one additional sample preceding and/or following the peak sample may be retrieved.
- a difference between a correlation value of a sample preceding the peak value and a correlation value of a sample following the peak value may be performed.
- the difference may be an algebraic difference, so as the sign ("+" or "-" may be taken in account.
- a sum of a correlation value of a sample preceding the peak value and a correlation value of a sample following the peak value may be performed.
- a quotient (e.g., of a correlation value of a sample preceding the peak value and a correlation value of a sample following the peak value at the numerator, and a sum of a correlation value of a sample preceding the peak value and a correlation value of a sample following the peak value at the denominator) may be calculated.
- the quotient (which may be named corrIndex in the present document) may be: R i + 1 ⁇ R i ⁇ 1 R i + 1 + R i ⁇ 1
- step 124 besides the determination of a peak sample which may give a first information on the TOA, data associated to other samples (e.g., data associated to correlation values of the samples closed, and preferably adjacent, to the peak sample) may be obtained.
- data associated to other samples e.g., data associated to correlation values of the samples closed, and preferably adjacent, to the peak sample
- a TOA and/or a distance may be calculated on the basis of the peak sample and correction data derived by the at least one additional sample. For example, a coarse estimation of the TOA or distance may be performed from the peak sample in the correlation profile (e.g., the sample with the maximum absolute value). This estimation may be corrected using a correction data derived at least by the correlation data of at least one additional sample preceding and/or following the peak sample. For example, the quotient discussed above (corrIndex) may be used to correct the estimation obtained from the peak sample.
- the correlation values close to the maximum of the correlation function may carry information additional information on the signal TOF (which may provide information on the distance of the transmitter).
- the determination of the TOA or distance values may be more accurate (at least, may reach an accuracy level which is similar to an accuracy level that would be achieved with an increased sampling rate).
- corrIndex R i + 1 ⁇ R i ⁇ 1 R i + 1 + R i ⁇ 1
- the correlation value R(i-1) at the sample immediately preceding the peak sample i is compared to the correlation value R(i+1) at the sample immediately following the peak sample i. If R(i-1) > R(i+1), it is possible to derive additional information on the position of the transmitter. For example, it is possible to derive the probability of the transmitter being actually closer to the receiver than estimated by simply retrieving the peak sample. R(i-1) > R(i+1) gives the idea that, with a better resolution (higher sampling rate), the peak value would not be retrieved at the time instant associated to the i th sample, but in a sample associated to a preceding time instant.
- R(i-1) ⁇ R(i+1) there is a high probability for the real distance to be greater than estimated when simply retrieving the peak sample.
- R(i-1) ⁇ R(i+1) gives the idea that, with a better resolution (higher sampling rate), the peak value would be identified after the time instant associated to the i th sample.
- data obtained by the correlation data of at least one additional sample preceding and/or following the peak sample permit to derive correction data for a TOA measurement.
- the estimated TOA or distance may be corrected using the correction data.
- a transformation such as, for example, a linear combination
- a transformation may be performed to transform the estimated TOA into a corrected measurement through a composition with a value associated to a correction data (e.g., a transformed value).
- correction data adapted (e.g., calibrated) to the transmission channel may be obtained using pre-assigned configuration data.
- the pre-assigned configuration data may have been defined, for example, in a configuration session (e.g., using method 110).
- the pre-assigned configuration data may give information about the environment.
- the pre-assigned configuration data may permit to increase the accuracy of the TOA measurement, so that the correction data obtained by the correlation data of at least one additional sample preceding and/or following the peak sample are processed to be adapted to the specific environmental conditions of the transmit channel.
- the pre-assigned configuration data may be in the form of functions (e.g., linear functions) which may transform a first correction data into a second correction data which keeps in account the situation of the place onto which TOA measurements are carried out.
- the pre-assigned configuration data may comprise a function obtained by inference or interpolation from data signals obtained in a configuration session data (e.g., with method 110). Fitting functions, (e.g., linear fitting function, quadratic fitting functions, or others) may be used.
- Each correction data may be associated to a particular TOA value, range, distance range, or TOA range, e.g., after having adapted the data from the correlation function (e.g., peak sample, value on the samples close to the peak sample).
- the correlation function e.g., peak sample, value on the samples close to the peak sample.
- each discrete TOA value (or distance) which may be estimated may be pre-assigned (e.g., in a configuration session) to at least one configuration data.
- the measurement resolution of time delays and distances is increased beyond the maximum resolution bounded to the sampling rate. It is therefore possible to conclude that the present examples reach a subsample resolution (subsample accuracy).
- Fig. 1E shows a method 110 (which performs a configuration session) which may be used to obtain configuration data (e.g., a plurality of configuration data) from configuration signals received from a plurality of different locations (e.g., from a transmitter which moves through different locations, so that the locations are known, or the distance from the location is known).
- the configuration data may comprise, for example, data obtained from TOA data achieved by performing correlations on the received configuration signals.
- the configuration data may provide information on the transmission channel.
- the configuration data may be used, in the subsequent operation session(s), to better estimate the TOA or distance.
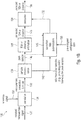
- Fig. 1B shows a device 130.
- the device 130 may be a device for measuring a TOA and/or a distance.
- the device 130 may perform the method 120, for example.
- the device 130 may be configured by using the method 110.
- the device 130 may be part of a receiver device which receives transmissions sent by a transmitter whose distance is to be calculated.
- a received measurement signal 132 (which may be a signal sampled at a particular sampling rate) may be provided to a correlation unit 134.
- the received measurement signal 132 may be correlated (cross-correlated) with a reference signal 133 (which may be stored in a memory) to obtain a measurement correlation function 136.
- the measurement correlation function 136 may be provided as an absolute value (e.g., with only positive numeric values), as a normalized value (e.g., by dividing values by a particular value), or similar.
- the measurement correlation function 136 may be provided to a sample determination unit 138.
- the sample determination unit 138 may determine the peak sample 140 of the measurement correlation function 136.
- the peak sample may be the sample which has the maximum value (e.g., between the absolute values and/or normalized values) of the correlation function.
- the sample determination unit 138 may also recognize other samples, such as a sample preceding (e.g., immediately preceding) the peak sample 140 and/or a sample following (e.g., immediately following) the peak sample 140.
- the peak sample 140 may be input to a TOA or distance estimation unit 144, which may estimate a TOA (and/or a distance associated to the TOA) 146.
- the TOA may be coarsely estimated on the basis of the position of the peak in the correlation function (the position of the peak being associated to a particular TOA, the TOA being associated to a particular distance).
- the estimation performed by the unit 144 has a limited resolution: in a radio-frequency (RF) signal, for example, the maximum distance resolution of some meters may be achievable, e.g., when the sampling time is in the tens of nanoseconds (approximately, electromagnetic waves travel at the speed of three meters in ten nanoseconds).
- RF radio-frequency
- a correction data determination unit 148 may be provided.
- the correction data determination unit 148 may make use of the correlation data (e.g., value) 142 of the sample(s) close to (e.g., immediately before and after) the peak sample 140 in the measurement correlation function 136 and/or the estimated TOA or distance 146. From the data of the close samples it is possible to derive information of the position of a transmitter which is even more accurate than the information inferred by the position of the peak sample.
- the correction data determination unit 148 may be input with data associated to the measurement correlation function 136 (e.g., peak sample 140 and/or correlation data 142 associated to the samples close to the peak sample 140, the estimated TOA or distance 146).
- data associated to the measurement correlation function 136 e.g., peak sample 140 and/or correlation data 142 associated to the samples close to the peak sample 140, the estimated TOA or distance 146.
- the correction data determination unit 148 may be input with pre-assigned configuration data 150 (e.g., obtained with method 110).
- the configuration data 150 may be stored, for example, in a memory and be at disposal of the correction data determination unit 148.
- the configuration data 150 may comprise look-up tables and/or functions (e.g., fitting functions).
- the configuration data 150 may contain information on the environment (transmission channel), as they may have been obtained from actual measurements (e.g., in the configuration session and/or with method 110). The actual measurements may have been obtained at a subsample resolution with respect to the maximum resolution of the measurement (e.g., the resolution associated to the sampling rate).
- the configuration data 150 may permit to perform transformations so that sample information associated to the peaks 140 and/or correlation data 142 associated to the samples close to the peaks may be transformed into correction data which take into account the conditions of the transmission channel. Therefore, there may be accurate data (e.g., at the subsample accuracy) at disposal of the correction data determination unit 148 for modifying the estimated TOA (or distance) 146.
- the correlation data (e.g., correlation values) 142 of the samples close to (e.g., immediately before and after) the peak sample 140 may be transformed to adapt the estimated TOA (or distance) 146 to high resolution corrected TOA or distance values 156.
- a correction unit 154 may be used to modify the estimated TOA or distances with the correction data. Notably, not only is the TOA (or distance) 146 corrected, but it also keep into account the conditions of the transmission channel.
- the correction unit 154 there is the possibility of correcting the TOA or distance 146 by composition with (e.g., addition of) a value 152 associated to the correction data, the value 152 being in the subsample resolution.
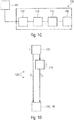
- Fig. 1C shows a transmission device 160 which may be a TOA or distance calculation system 160.
- the device 160 may comprise an antenna 161.
- the device 160 may comprise a receiving transceiver 162, which may be connected to a the antenna 161.
- the device 160 may comprise the device 130.
- the device 160 may comprise a filter 164.
- the device 160 may also comprise a I/O unit 166, which may provide as an output to a user or to an external device a calculation of the TOA (or a distance), e.g., the value 156.
- Fig. 1D shows a transmitter device 170 whose distance D 1 at instant t 1 is to be determined by the device 130 or 160.
- the transmitter device 170 may be moved to have a distance D 2 from the device 130 or 160 at instant t 2 .
- Reference numeral 180 refers to a systems which comprises the a transmitter 170 and a receiver 130 or 160 for calculating the distance (e.g., in real time).
- TOA measurements based on retrieving the sample peak in the correlation function are limited in the accuracy by virtue of the maximum sampling time (which has a finite value). If, in an RF environment, the sampling time is 10 ns, the maximum accuracy of a TOA measurement based only on retrieving the peak sample may have a resolution of approximately 3 m. Therefore, by sampling at 10 ns, only distances which are approximately multiple of 3 m would be detectable without approximation.
- Fig. 1 may concern a simulated receiver, a simulated transmitter, and a simulated channel.
- FIG. 2A A comparative example is provided by Figs. 2A and 2B .
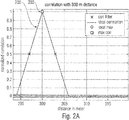
- Fig. 2A an ideal profile 200 for a correlation on a signal received from a distance of 300 m is aligned with the reference signal (0°) and provides a correct peak.
- Fig. 2B which refer to an estimation without correction, e.g., by simply retrieving the maximum in the correlation profile
- a detected maximum 206 deviates from the ideal maximum 204 with a ⁇ d which is 1.5 m in this case.
- the abscissa is provided in meters (as a consequence of the distance being associated to the peak position in the correlation sample).
- a correlation filter that computes the correlation may be used.
- the TOA measurement may be, at best, correct.
- a transmitter e.g., 170
- the TOA measurement may be, at best, correct.
- a certain amount of error may be present.
- Fig. 2C shows a first correlation profile (function) 210 (which may represent a measurement correlation function 136) of a first received signal received in a measurement session from a distance which is exactly detectable by retrieving the peak sample when correlating a received function (i.e., the transmitter is placed at a distance which is multiple to approximately 3 m for a 10 ns sample time).
- a peak 240 may be identified (e.g., by the sample determination unit 138 or step 124). Accordingly, the peak sample may be identified (in Fig.
- the peak sample is in the 18 th sample
- the TOA and/or distance may be coarsely estimated (e.g., by unit 144).
- Two other samples, associated to the correlation values 242', may be identified as the samples immediately before and after the sample with the peak 240.
- Fig. 2C also shows a second correlation profile (function) 212 of a second received signal received in the same measurement session, but after that the transmitter has moved of half meter (e.g., the distance is now approximately 2.5 m).
- a second peak in may be retrieved.
- the peak of the second correlation profile 212 is at the position of the peak of the first correlation 210. This is due to the fact that the first and second received signals are received from distances which are too close to each other to be distinguished at the resolution of the present sampling rate.
- the positions of the samples immediately before and after the peak sample in the second correlation profile 212 are different from the samples 242' of the first correlation profile 210.
- the pre-assigned configuration data 150 As the pre-assigned configuration data have been collected from a plurality of TOAs and/or distances which have distances smaller than the measurement resolution associated to the sampling rate, the pre-assigned configuration data are suitable for adapting to the transmission channel (e.g., calibrating) the correlation data associated to the samples preceding and/or following the peak sample.
- the correlation value R(i-1) (which is the 16 th sample) is higher than the correlation value R(i+1) (which is the 18 th sample). It is therefore possible to infer that, with an increased resolution (e.g., with a much better higher sampling rate), the "real peak” would be retrieved before the instant associated to the peak sample. Therefore, the above-identified quotient corrIndex R i + 1 ⁇ R i ⁇ 1 R i + 1 + R i ⁇ 1 may provide a more accurate information on the position of the transmitter with respect to the estimation based on simply retrieving the peak value in the correlation function.
- the correction data to be used for measuring the distance may be obtained by adapting the data obtained by the samples preceding and/or following the peak sample with data associated to the transmission channel, these data having being obtained at a subsampling resolution (the subsampling resolution being higher than the sampling resolution of the measurements performed by the sample determination unit 138, for example).
- An example of pre-assigned configuration data 150 (which may be obtained with method 110) is provided in Fig. 6A .
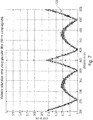
- the pre-assigned configuration data 150 (correction index) may take the form of a linear function 600.
- the linear function 600 may have been obtained, for example, by inference, interpolation, least square method, or other statistical methods.
- the linear function 600 may be used to transform data from a measurement correlation function (e.g., data associated to the peak preceding and/or following the peak sample) into data which keep into account the features of the environment (transmission channel). Different environments, therefore, may be associated to different linear functions (e.g., different slopes).
- a measurement correlation function e.g., data associated to the peak preceding and/or following the peak sample
- Different environments may be associated to different linear functions (e.g., different slopes).
- a quadratic function 610 is shown.
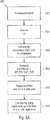
- Fig. 3 shows a method 300 which may be performed as an embodiment of method 120 and/or by the device 130 or 160.
- a correlations R is computed, e.g., by obtaining the measurement correlation function 136.
- the correlation R may have a sample resolution (which may be, for example a resolution associated to the sampling rate of the received signal and/or the sampling rate of the correlation function).
- an initial coarse TOA e.g., TOA 146 or a coarse distance may be identified (e.g., through units 138 and 144).
- the value corrlndex may embody the quotient discussed above and may give an idea of the "real position" of the peak.
- the real distance or TOA
- the value diff_R R ( i + 1) - R ( i - 1) is greater than zero.
- the correction data 152 may be calculated, e.g., by adapting the corrlndex to the environment conditions.
- b may be related to the number of correlations, for example. This term “b” may be used to adjust, in some cases, for slight deviations when linear fitting is performed (e.g., when a linear equation may approximately fit corrlndex but error margin is acceptable). It is also possible to choose a higher degree fitting function (e.g., a quadratic fitting function).
- the quotient corrlndex calculated on the basis of the correlation values of the samples close to the peak sample, may therefore be scaled by a quantity "a".
- "a" and “b” may be the coefficients of a linear transformation which keeps in account the conditions of the transmission channel.
- Other ways of adapting the correction data to the particular transmission channel may be defined (e.g., using a quadratic transformation, and so on).
- Data such as, "a” and "b”, which are pre-assigned may have been obtained in a configuration method (e.g., method 110).
- data "a” and "b” provide a modeled profile which permit to correct the imprecise TOA estimated by simply searching for the peak sample in the correlation profile.
- the correction data may be composed (e.g., algebraically summed) to the initial TOA or distance estimated at step 304 (e.g., by unit 144).
- the final TOA may be a linear combination between an estimated TOA and a correction value, for example:
- Final_TOA estimated_TOA + CorrectionK / 2 / K
- K may be a fixed number. K may be associated to the number of subsamples of the configuration session, for example (i.e., the number of configuration signals, received by different distances in the configuration, for which the correlations have been performed).
- the pre-assigned configuration data 150 may be the same for all the TOAs (or distances). As can be seen from Fig. 6A , for example, the data a, b are constant, as they are coefficients of a linear function. Also the parameter K (number of subsamples) may in general be fixed.
- a transmitter such as the transmitter device 170, which, as shown in Fig. 1D , may move between different positions in different time instants.
- the transmitter may move from a distance D 1 to a distance D 2 between time instants t 1 and t 2 .
- the transmitter and/or the receiver may have units (e.g., GPS unit, clock unit, storage device, calculation unit etc.) which permit to keep into account data associated to the position (e.g., coordinate data, geographical data, and so on) or the receiver is capable of taking the relative distances into account without the need for a synchronization scheme.
- the transmitter and/or the receiver may be engaged to a moving device, which may transport it along different positions (e.g., geographical locations).
- the transmitter and/or the receiver may be engaged to a satellite, for example.
- Fig. 4 shows a receiver 430 which may be, for example, the device 130 and/or 160.
- the receiver 430 may define the configuration data 150.
- Fig. 4 shows the scheme of the device 430, with units which may be the same of the units of Fig. 1B (the same units may be retrieved by substituting "4" with "1" in the first digit of the reference numerals).
- a received measurement signal 432 may be input to a correlation unit 434.
- the received measurement signal 432 may be correlated with a reference signal 433 (which may be stored in a memory) to obtain a configuration correlation function 436.
- the measurement correlation function 436 may be provided to a sample determination unit 438.
- the sample determination unit 438 may determine the peak sample 440 of the measurement correlation function 436.
- the sample determination unit 438 may also determine data (e.g., correlation values) from other samples, such as a sample preceding (e.g., immediately preceding) the peak sample 440 and/or a sample following (e.g., immediately following) the peak sample 440.
- the peak sample 440 and the other samples may be provided to a configuration data definition unit 449 to provide (and/or save in a memory) configuration data which, in operation, will provide the pre-assigned configuration data 150.
- An example of the configuration data 150 defined by the configuration data definition unit 449 may be, for example the coefficients "a" and "b" discussed above.
- the distance separating the transmitter (e.g., 170) and the receiver may be changed (the receiver and/or the transmitter may change the position). Therefore, the receiver 430 may receive a configuration signal from each of a plurality of distances.
- the configuration signal may be a continuous or burst electromagnetic or ultrasound transmission, which may notwithstanding be taken at different distances separating the transmitter and receiver during different time instants. Therefore, the receiver 430 may obtain data from a plurality of received configuration signals, each of which may be processed (e.g., using different correlations). In some examples, it is possible to use a single correlator, where measurements are carried at different time instants.
- the receiver 430 may correlate each of the received configuration signals, and for each of them determine the peak sample 442 and correlation data (such as correlation values) associated to the at least one additional sample 442 preceding and/or following the peak sample 442. At least some of these operations may be performed not in real time (e.g., after having received and stored all the signals received by the transmitter), such as offline.
- the transmitter or receiver may spatially move while sending a configuration transmission, so that the receiver receives in different time instants signals at different distances.
- the configuration session may be performed on a simulation level.
- the distance displacement at the simulation may be performed for example with a simulated channel and software transceiver modules.
- a hardware chain for the transceiver may be used.
- Reference may be made to Fig. 1D where the a cable is not shown but is provided between the devices 170 and 130/160. Cables of different length may be used for this configuration session to get a correlation profile at each length.
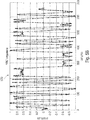
- Fig. 10 shows measurements performed for different cable lengths (1002: 350 cm; 1004: 375 cm; 1006: 400 cm).
- the cable may directly connect the transmitter to the receiver output.
- the exact signal propagation time for each cable may be controlled with a measurement instrument set at the defined carrier frequency (for example a network analyser).
- the transmitter e.g., 170 in Fig.
- the number of cables used may be related to the number of subsamples (K). Following the steps in 120 the value of corrlndex may be calculated for each measurement with a different cable length. Knowing the exact signal propagation time for each cable, the profile in Fig. 6A may be then obtained with real data. The number of corrlndex(k) values is equal to the number of measurements taken within one sample (i.e. the relative propagation time from the cable length is in subsamples).
- the configuration session may have a resolution which is greater (subsample resolution). If, for example, the sampling rate to be used at the measurement session is 10 ns (associated to a maximum resolution of approximately 3 m), the configuration session may be so that the receiver collects configuration signals when the transmitter has travelled a distance less than 3 m (e.g., every 300 mm, to obtain a configuration resolution 10 times greater than that achievable with the simple detection of the peak value in the correlation). Hence, in the configuration session, the received configuration signals are received from a succession of distances which with a resolution better than the resolution of a TOA measurement when only based on retrieving the peak sample. Therefore, it is possible to obtain information at subsample resolution which may be used to adapt, in the measurement sessions, the data obtained from the correlation values of the samples close to the peak sample to the environment.
- the receiver 430 may receive two different signals which provide different correlation profiles 210 and 212 which may have been transmitted by the transmitter from different positions (e.g., from distances of half meter). The distance between the different positions (e.g., the half meter) is within the maximum resolution (notably, the correlation profiles 210 and 212 have the same maximum 240). However, it is possible to obtain information from correlation data (e.g., 442) of at least one additional sample preceding and/or following the peak sample (e.g., data R(i-1) and R(i+1)). These data may permit to calculate the configuration data 150 (e.g., the coefficients "a" and "b") which will be used in the measurement session.
- correlation data e.g., 442
- the position of the transmitter is in general known for each signal that is received by the receiver: the transmitter may have the knowledge of the position, e.g., an absolute position and may store or transmit data relating to the position, so as to permit to associate a particular configuration signal, as received by the receiver, to the transmitter's position. Even if the absolute position is not known, the relative distance between different measurements may be sufficient. For this step a number of measurements related to subsamples may be taken. Even if the absolute TOA is not known, the configuration data can be extracted from the correlation profiles taken at several instants within one sample.
- the configuration session it is possible associate the distance of the receiver from the transmitter with values (e.g., 242") of the correlation data (e.g., R(i-1) and/or R(i+1)) of at least one additional sample (e.g, i-1 and/or i+1) preceding and/or following the peak sample. It is possible to determine, as a feedback, the behaviour of the transmission channel on the basis of the transmitted data.
- the configuration may therefore provide pre-assigned configuration data (calibration data) which will be used, in the operation session, to adapt the correction data to the environment.
- the collected configuration data 150 may be considered to be at a subsampling rate, as they have a precision which goes beyond the resolution provided by the sampling rate.
- Fig. 1F shows a method 110' for performing a configuration session (e.g., to implement method 110 and/or performed by the device 430).
- a plurality of correlation processes for a plurality of configuration signals may be performed to obtain multiple configuration correlation functions at different distances (e.g., associated to different subsamples).
- the distance between the signals is at a subsample resolution with respect to the sample resolution of the measurement method 120, for example (e.g., the time distance between two consecutive samples of the measurement received signal 132 is associated to a different of distances which is greater than the distances for which the correlations are calculated in the configuration session).
- the configuration signals from which the calculations are made may be either obtained though actual measurements or simulated.
- the peak sample and data of at least one sample preceding and/or following the peak sample for each configuration may be determined.
- configuration data (e.g., data 150) are associated to the transmission channel.
- the configuration data have a subsample resolution and, therefore, may be used to obtain the correction data for correcting the estimated TOA and/or distance.
- FIG. 5A An example of configuration session is provided by the method 500 in Fig. 5A , which may embody a step 110, for example, and which may embodied, for example, the operations of the device 430, for receiving transmissions performed, for example, by the transmitter 170.
- a transmission is started by the transmitter (the transmission will continue in the subsequent steps).
- the transmission may be at baseband.
- a sequence code 520 of 64 length shaped with an RRC filter with 10 samples per symbol at the transmitter is shown in Fig. 5B .
- other pulse shaped filters may be used.
- the transmission is actually performed on the transmission channel.
- the transmission is received as a single signal 432 in Fig. 4 (it may be sampled, filtered and so on).
- correlations R() are performed, e.g., using the correlation unit 434.
- Each received signal may be understood as relating to a subsample "k".
- the reference to subsamples is justified in that information is provided on data which would not be achievable by simply estimating a distance or a TOA retrieving the peak sample.
- the peak sample and correlation data of at least one additional sample preceding and/or following the peak sample is acquired.
- a projection of corrlndex(k) may be made over a finite number (e.g., K) of subsamples (e.g., of received configuration signals 432).
- the number of subsamples may be, for example, the number of received configuration signals that are received by the receiver in the configuration session.
- a regression technique e.g., linear regression
- a linear fitting function (or a quadratic fitting function) may be calculated from the multiple sample data for example, coefficients a, b for a linear fitting function and/or coefficients a, b, c, for a quadratic function may be calculated.
- Fig. 6A shows a graph 600 (abscissa: subsamples k; ordinate: amplitude) in which multiple points (each point associated to data obtained from a correlation to a configuration signal received by the receiver during a configuration session) have been used to approximate a linear function (e.g., using a linear fitting, linear regression) by a single line 602.
- a least square method may be used to calculate the line 602.
- the coefficients a and b may be the values a and b to be used in step 308 to embody the pre-assigned configuration data 150.
- the pre-assigned configuration data 150 may be easily obtained in the configuration session in the subsample resolution.
- the configuration data 150 may be defined for each discrete value (TOA or distance) or for each possible peak sample which will be identifiable by performing correlations.
- the having computed the corrlndex at 306 having calculated the subsample correction as corrIndex/a-b/a with the pre-assigned configuration values a and b (obtained in the configuration session), it is possible to calculate the final TOA as a linear combination of the estimated TOA and a correction value.
- TOA_fine TOA_coarse + Correction ⁇ K / 2 / K .
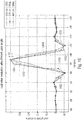
- Fig. 7 has a graph 700 showing in ordinate errors 700 in calculating the TOA after having applied the fitting method with a sampling time of 10 ns (abscissa: distance transmitter-receiver). It is possible to see that the error may be less than 1 cm, where in Fig. 2B the error could have been 1,5 m. the error increase in the middle occurs when R(i-1) and R(i+1) are close to each other.
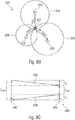
- Fig. 8A shows a time difference of arrival, TDOA, localization system 800 comprising a transmitter 802 (which may be, for example, a mobile phone, a mobile terminal, a smartphone, a localization device, or a similar apparatus) which has to be localized (e.g., its distance has to be determined) and at least three synchronized receivers Rx1 804, Rx2 806, and Rx3 808 (which may be base stations, e.g., of a mobile communication network, such as a GSM network or similar, or devices at known positions).
- the transmitter 802 may be, for example the transmitter 170; at least one of the receivers Rx1 804, Rx2 806, and Rx3 808 may be one of the device 130, 160, 430.
- the distances d1, d2, d3 of the transmitter 802 from the receivers Rx1 804, Rx2 806, and Rx3 808 may be calculated using one of the methods 100, 120 and/or 300.
- By calculating the difference between TOAs and, for example, by determining curves 810, 812 for which the difference of the distances from two receivers is constant), it is possible to localize the transmitter 802 in a coordinate system (e.g., a geographical coordinate system).
- a configuration session (e.g., using the method 110 and/or 500 and /or the device 430) may be performed. It is not strictly necessary that the transmitter that has performed the configuration session is the same of the transmitter 802 which is actually localized in the measurement session.
- the localization of the transmitter 802 may be performed, for example, by exchanging data (e.g., distances d1, d2, d3) between the receivers 804-808 and/or the transmitter 802.
- data e.g., distances d1, d2, d3
- the correction data preferably on the basis of the pre-assigned configuration data 150
- Fig. 8B shows a positioning system 822 which may be a TOA positioning system.
- a receiver 822 (which may be, for example, a mobile phone, a mobile terminal, a smartphone, a localization device, or a similar apparatus) is to be localized.
- the distances (e.g., indicated with 834, 836, 838) of the receiver 822 from at least three (preferably at least four) transmitters Tx1 824, Tx2 826, Tx3 828 (which may be base station (or devices at known position), or in any case transmitters with known position) may be calculated. Accordingly, it is possible to retrieve the position (e.g., in geographical coordinates) of the receiver.
- the receiver 822 may be, for example, one of the devices 130, 160, or 430, and/or may perform any of the methods 100 ,120, and 300. It is not necessary, in some examples, for the receiver 822 to also be the same receiver that has performed the configuration session. By calculating the correction data (preferably on the basis of the pre-assigned configuration data 150 at a subsample resolution), it is possible to increase the accuracy of the measurements.
- Fig. 8C shows a round trip time (RTT) system 840 for measuring the distance between two devices 842 and 844 (e.g. mounted on satellites or at least one being mounted on a satellite).
- the round trip time t roundt may be obtained at least by a first transmission time t p for transmitting a first signal 846 from the device 842 to the device 844.
- a time delay t reply may elapse for permitting the processing to the device 844.
- a second transmission time t p for transmitting a second signal 848 from the device 844 to the device 842 (e.g., in response to the first signal 846) may also be calculated.
- t p from t roundt and t reply (e.g., by subtracting t reply from t roundt and subsequently dividing by 2) to obtain a time proportional to the distance between the devices 842 and 844.
- the distance between the devices 842 and 844 it is possible to use a method 100, 120, or 300. Therefore, when the first signal 846 is transmitted, the device 844 may be embodied by the device 130 and/or 160. Additionally or alternatively, when the second signal is transmitted, the device 846 may be embodied by the device 130 and/or 160.
- a configuration session may have been performed at a subsample resolution to prepare the configuration data for the devices 842, 846. By calculating the correction data (preferably on the basis of the pre-assigned configuration data 150), it is possible to increase the accuracy of the measurements.
- Fig. 9 shows a device 900 (which may implement at least one of the devices 130, 160, 170, 430, 802-808, 822-828, 842, 844) comprising a processor 902 which may execute instructions.
- the device 900 may comprise a memory 904 which may comprise processor readable instructions 906 which, when performed by the processor 902, cause the processor 902 to perform one of the methods above (e.g., 100, 110, 120, 300, 500).
- the memory 904 may also contain data 908.
- the data 908 may contain, for example pre-assigned configuration data (e.g., data 150).
- the data 908 may contain location data, to be used for performing the configuration at a subsample resolution.
- the device 900 may comprise a transmission/reception unit 910 and an antenna 912, e.g., to perform the signal transmissions or receptions discussed above.
- the device 900 may comprise an input/output (I/O) device for communication of data to an external device (e.g., a communication network and/or a display device to communicate a result to a user) and/or for receiving selections from a user.
- I/O input/output
- a particular example may comprise:
- Time of arrival (TOA) estimate is fundamental for applications like ranging, positioning and time synchronization applications.
- the TOA is often derived from the correlation result between the received signal and a reference signal.
- the TOA can be directly be derived from the correlation peak the accuracy is however limited by the sampling rate. Hence a high resolution approach must be carried after the correlation to obtain sub-sample corrections.
- the profile of the correlation result is also dependent on the channel characteristics. These characteristics generates extra errors if not compensated or taken into account.
- Figs. 2A and 2B show the ideal correlation profile in red and the computed correlation at the receiver side with sampling rate of 10ns.
- the received signal is aligned with the reference signal (0°) and the resulting subsampling correction is hence zero.
- the detected maximum deviates from the ideal maximum with a ⁇ d which is 1.5 m in this case.
- the method proposed for estimating the subsample corrections may operate in two modes (sessions).
- first mode configuration session
- second mode measurement session
- the subsample correction are estimated based on the modeled profile directly from the computed correlation at the receiver side.
- Fig. 5A shows the offline operation in the first mode.
- a pulse shaped transmit sequence is sent over a channel.
- Fig. 5B shows a sequence shaped with an RRC filter (however any pulse shaped filter can be used for this method).
- the channel in this scenario emulates the effect of time-delay on the received correlation profile.
- the next step correlation profile is collected over K subsamples as shown in Fig. 2C for time delays k1 and k2 within one sample.
- R(i,k) represents the correlation maximum between the received signal y and the reference signal x.
- R(i-1,k) and R(i+1,k) represents the points in correlation profile before and after the maximum respectively.
- R (i-1,k) and R (i+1,k) are collected over K correlations.
- index corrIndex(k) diff_R xy (k) / sum_R xy (k).
- the digital receiver can correct the TOA using the coefficients a and b in the above case.
- TOA_fine TOA_coarse + Correction ⁇ K / 2 / K .
- K may be a fixed value.
- K may be the number of subsamples (correlations calculated in the configuration session).
- TOA which is often fundamental for distance for measurements
- the sample accuracy is not often sufficient for applications like positioning and ranging.
- the current methods are inaccurate or have a high computational complexity.
- the present methods target small devices because of the low complexity and the accurate extraction of the TOA form one snapshot given that the correlation profile is not distorted.
- Two modes of operations may be executed: offline mode (configuration session) and operation mode (measurement session).
- offline mode mapping of the correlation profile to the corresponding time delay is performed, and later, fitted to an algebraic equation. This procedure may be performed once.
- operation mode the receiver calculates the correlation profile index and solvers the algebraic equations to perform measurement sin the subsample accuracy.
- a last step in the TOA measurements may be corrected by subsample corrections.
- aspects have been described in the context of an apparatus, it is clear that these aspects also represent a description of the corresponding method, where a block or device corresponds to a method step or a feature of a method step. Analogously, aspects described in the context of a method step also represent a description of a corresponding block or item or feature of a corresponding apparatus.
- Some or all of the method steps may be executed by (or using) a hardware apparatus, like for example, a microprocessor, a programmable computer or an electronic circuit. In some embodiments, some one or more of the most important method steps may be executed by such an apparatus.
- embodiments of the invention can be implemented in hardware or in software.
- the implementation can be performed using a digital storage medium, for example a floppy disk, a DVD, a Blu-Ray, a CD, a ROM, a PROM, an EPROM, an EEPROM or a FLASH memory, having electronically readable control signals stored thereon, which cooperate (or are capable of cooperating) with a programmable computer system such that the respective method is performed. Therefore, the digital storage medium may be computer readable.
- Some embodiments according to the invention comprise a data carrier having electronically readable control signals, which are capable of cooperating with a programmable computer system, such that one of the methods described herein is performed.
- embodiments of the present invention can be implemented as a computer program product with a program code, the program code being operative for performing one of the methods when the computer program product runs on a computer.
- the program code may for example be stored on a machine readable carrier.
- inventions comprise the computer program for performing one of the methods described herein, stored on a machine readable carrier.
- an embodiment of the inventive method is, therefore, a computer program having a program code for performing one of the methods described herein, when the computer program runs on a computer.
- a further embodiment of the inventive methods is, therefore, a data carrier (or a digital storage medium, or a computer-readable medium) comprising, recorded thereon, the computer program for performing one of the methods described herein.
- the data carrier, the digital storage medium or the recorded medium are typically tangible and/or non-transitionary.
- a further embodiment of the inventive method is, therefore, a data stream or a sequence of signals representing the computer program for performing one of the methods described herein.
- the data stream or the sequence of signals may for example be configured to be transferred via a data communication connection, for example via the Internet.
- a further embodiment comprises a processing means, for example a computer, or a programmable logic device, configured to or adapted to perform one of the methods described herein.
- a processing means for example a computer, or a programmable logic device, configured to or adapted to perform one of the methods described herein.
- a further embodiment comprises a computer having installed thereon the computer program for performing one of the methods described herein.
- a further embodiment according to the invention comprises an apparatus or a system configured to transfer (for example, electronically or optically) a computer program for performing one of the methods described herein to a receiver.
- the receiver may, for example, be a computer, a mobile device, a memory device or the like.
- the apparatus or system may, for example, comprise a file server for transferring the computer program to the receiver.
- a programmable logic device for example a field programmable gate array
- a field programmable gate array may cooperate with a microprocessor in order to perform one of the methods described herein.
- the methods are preferably performed by any hardware apparatus.
- the apparatus described herein may be implemented using a hardware apparatus, or using a computer, or using a combination of a hardware apparatus and a computer.
- the methods described herein may be performed using a hardware apparatus, or using a computer, or using a combination of a hardware apparatus and a computer.
Landscapes
- Physics & Mathematics (AREA)
- Engineering & Computer Science (AREA)
- General Physics & Mathematics (AREA)
- Radar, Positioning & Navigation (AREA)
- Remote Sensing (AREA)
- Radar Systems Or Details Thereof (AREA)
- Position Fixing By Use Of Radio Waves (AREA)
Abstract
There is provided a method (120) and/or an apparatus for time of arrival, TOA, measurements, comprising:
performing (122), at a sample resolution, a correlation process on a received measurement signal to obtain a measurement correlation function;
determining (124) a peak sample and correlation data of at least one additional sample preceding and/or following the peak sample in the measurement correlation function;
determining (126) a TOA and/or distance on the basis of the peak sample and correction data obtained by at least the correlation data of the at least one additional sample preceding and/or following the peak sample and preassigned configuration data associated to the transmission channel obtained at a subsample resolution.
performing (122), at a sample resolution, a correlation process on a received measurement signal to obtain a measurement correlation function;
determining (124) a peak sample and correlation data of at least one additional sample preceding and/or following the peak sample in the measurement correlation function;
determining (126) a TOA and/or distance on the basis of the peak sample and correction data obtained by at least the correlation data of the at least one additional sample preceding and/or following the peak sample and preassigned configuration data associated to the transmission channel obtained at a subsample resolution.
Description
- Time of arrival (TOA) operations may permit to estimate distances of a transmitter which sends a transmission (e.g., radio-frequency transmissions or ultrasound transmissions) from a receiver which receives the transmissions. TOA estimations may be obtained by correlating a received signal with a stored signal and by retrieving a sample which carries the peak value of a correlation function.
- TOA estimations may have a resolution (e.g., expressed in meters) limited by the sampling rate. The higher the sampling rate, the higher the resolution. As the sampling rate cannot be infinite, the maximum resolution is limited.
-
US 7,653004 B2 discloses a method for performing a TOA measurement. According thereto, a correlation is first identified by comparing the received correlation profile with different reference correlation functions. On the basis of the comparison, the TOA is corrected by an estimated phase delay. -
WO 2006063768 A1 discloses a method for performing a TOA measurement from the inflection edge of a correlation profile. -
US 7,054,126 B2 discloses a method for performing a TOA measurement using square-root raised-cosine pulse shaping and chip matched filters on direct sequence spreading waveforms. - According to examples, there is provided a method for time of arrival, TOA, measurements, comprising:
- performing (122), at a sample resolution, a correlation process on a received measurement signal (132) to obtain a measurement correlation function (136);
- determining a peak sample and correlation data of at least one additional sample preceding and/or following the peak sample in the measurement correlation function;
- determining a TOA and/or distance on the basis of the peak sample and correction data obtained by at least the correlation data of the at least one additional sample preceding and/or following the peak sample (140) and pre-assigned configuration data (150) associated to the transmission channel obtained at a subsample resolution.
- The correlation data (e.g., correlation values) of the samples preceding and/or following the peak sample have information regarding the TOA and/or distance which is even more accurate that the information that may be obtained by simply identifying the peak in the correlation function. The correlation data may be adapted to the environment using pre-assigned configuration data. A "subsample'' resolution may be obtained, i.e., a resolution (e.g., in terms of distances that may be determined) that goes beyond the maximum resolution possible with the sampling rate of receiver when sampling the received signal.
- According to an aspect, the pre-assigned configuration data vary according to the distance.
- Accordingly, it is possible to obtain precise information on the basis of the distance estimated by retrieving the correlation peak.
- According to an aspect, there is provided transforming the correlation data of the at least one additional sample preceding and/or following the peak sample (according to a transformation function obtained experimentally.
- Accordingly, it is possible to adapt the correction data to the transmission channel.
- According to an aspect, there is provided a configuration session obtaining a plurality of data from configuration signals received from a plurality of different distances, to obtain pre-assigned configuration data in association to distances or time delays.
- Accordingly, the pre-assigned data may be extremely precise.
- According to an aspect, there is provided using pre-assigned configuration data with a resolution greater than the resolution of the determining step to estimate the a TOA and/or distance.
- Accordingly, precision may be further increased. Notably, as the correlation data on the samples close to the peak sample provide information at a subsample resolution, the pre-assigned configuration data may also have a subsample resolution, which permits to increase the accuracy of the distance data obtained by the correlation data of the samples close to the peak sample.
- According to an aspect, the at least one additional sample preceding and/or following the peak sample comprises at least the sample immediately preceding the peak sample, and/or at least the sample immediately following the peak sample, and/or a sample preceding or following the peak sample of a determined number of samples.
- These samples may provide particularly accurate information on the real distance and/or TOA.
- According to an aspect, it is possible to provide a configuration session comprising:
- performing a plurality of correlation processes for a plurality of configuration signals to obtain multiple configuration correlation functions associated to different distances at a subsample resolution;
- for each configuration correlation process, determining the peak sample and data of at least one sample preceding and/or following the peak sample for each correlation;
- associating configuration data to the transmission channel.
- Accordingly, it is possible to obtain precise configuration data from the configuration session, the configuration data being at a subsample resolution.
- According to an aspect, a configuration session may a simulation session, e.g., in which the received signals are simulated over a simulated channel simulating the features of the transmission channel.
- According to an aspect, there is provided (in the configuration session and/or in the operation session) comparing and/or measuring the difference between the correlation value of a sample preceding the peak sample with the correlation value of a sample following the peak sample, and/or
- comparing or calculating a ratio between:
- the difference between the correlation value of a sample preceding the peak sample and the correlation value of a sample following the peak sample; and
- the sum of the correlation value of a sample preceding the peak sample and the correlation value of a sample following the peak sample.
- The quotient:

- According to an aspect, there is provided a method for performing difference time of arrival measurements, TDOA, comprising measuring a first TOA for a first transmission, a second TOA for a second transmission, and measuring a distance by subtracting the first TOA from the second TOA, wherein at least one of the measurements are performed with a method according to examples above and/or below.
- According to an aspect, there is provided a method for performing round trip time, RTT, measurements, comprising transmitting a first signal from a first device to a second device, transmitting a second signal from a first device to a second device, and performing the method one of the examples above and/or below for calculating the distance between the first and the second devices for at least the first and/or the second signals.
- According to an aspect, there is provided a device comprising:
- a TOA or distance estimation unit for estimating, at first resolution, a TOA or a distance from a position of the peak in a correlation function obtained by processing a received signal, wherein the first resolution is associated to the sampling time of the received signal and/or correlation function; and
- a correction unit to modify the estimated TOA or distance on the basis of at least correlation data of at least one of the samples preceding and/or following the sample with the maximum value of the correlation function and pre-assigned configuration data having a resolution higher than the first resolution.
- According to an aspect, the device may perform one of the methods discussed above and/or below.
- According to an aspect, there is provided a storage device containing pre-assigned configuration data to be combined to the correlation data of at least one of the samples preceding and/or following the sample with the peak to adapt a measurement to the transmission channel.
- According to an aspect, there is provided a system comprising a transmitter and a receiver (e.g., one of the devices above and/or below) and is to measure a TOA of a signal received from the transmitter at least in the determining step or in the configuration session.
- Accordingly, the examples above and below have low complexity (e.g., in terms of resource utilization, such as the number of additions, multiplications, and so on, which are to be processed) with respect to methods according to the prior art.
- Further, no correlation data are distorted, hence accuracy is increased.
- In some examples, the sampling rate of the signals transmitted/received in the configuration session is the same of the sampling rate of the signals transmitted/received in the measurement (operation) session. Notwithstanding, information may be obtained at a subsample resolution by performing a great number of configuration measurements in the configuration session.
- According to an example, it is possible to perform real configuration measurements in the configuration session using a hardware chain for the transceiver. Cables of different length may be used for this configuration session to get a correlation profile at each length. The cable may directly connect the transmitter to the receiver output. The exact signal propagation time for each cable may be controlled with a measurement instrument set at the defined carrier frequency. The transmitter and the receiver may be synchronized. The number of cables used may be related to the number of subsamples (K). Accordingly, pre-assigned configuration data may be calculated for each measurement with a different cable length. Knowing the exact signal propagation time for each cable,
- In some examples, there is provided comparing and/or measuring the difference between the correlation value (242") of a sample preceding the peak sample (140) with the correlation value (242") of a sample following the peak sample (140), and/or
- calculating ratio between:
- the difference between the correlation value (242") of a sample following the peak sample (140) and the correlation value (242") of a sample preceding the peak sample (140); and
- the sum of the correlation value (242") of a sample following the peak sample (140) and the correlation value (242") of a sample preceding the peak sample (140).
- In some examples, there is provided comprising, in the configuration session performed at a subsample resolution:
- calculating a ratio between:
- the difference between the correlation value (242") of a sample following the peak sample (440) and the correlation value (242") of a sample preceding the peak sample (440); and
- the sum of the correlation value (242") of a sample following the peak sample (440) and the correlation value (242") of a sample preceding the peak sample (440).
- In this document, transmissions and/or signals may be, for example, radio-frequency and/or ultrasound transmission and/or signals.
- The transmitter and/or the receiver may be, for example, movable and/or may be engaged to moving means. The transmitter and/or the receiver may be, for example, engaged to a satellite.
-
-
Fig. 1A shows a method according to an example. -
Fig. 1B shows a device according to an example. -
Fig. 1C shows a device according to an example. -
Fig. 1D shows a system according to an example. -
Fig. 1E shows a method according to an example. -
Fig. 1F shows a method according to an example. -
Figs. 2A ,2B , and2C show comparative results by implementing different examples. -
Fig. 3 shows a device according to an example implementing a method according to an example. -
Fig. 4 shows a method according to an example. -
Fig. 5A shows a method according to an example. -
Fig. 5B shows a result of an implementation according to an example. -
Fig. 6A and 6B show functions according to an example. -
Fig. 7 shows results according to an example. -
Fig. 8A shows a system according to an example. -
Fig. 8B shows a system according to an example. -
Fig. 8C shows a system according to an example. -
Fig. 9 shows a device according to an example. -
Fig. 10 shows comparative results by implementing different examples. -
Fig. 1A shows amethod 120. Themethod 120 may be used to perform measurements using a TOA technique. Themethod 120 may use configuration data which may have been obtained, for example, in a preceding method, e.g., in a configuration (offline) session 110 (shown inFig. 1 E) .Reference numeral 100 inFig. 1E refers to a sequence ofmethods method 110 may be performed (even days or years) before the start ofmethod 120. - The
method 120 may comprise an operation session during which TOA measurements are performed and/or prepared. Themethod 120 may use pre-assigned configuration data. The configuration data may be data obtained using a configuration session such as a session defined by themethod 110, for example. - The
method 120 may be performed on a measurement signal which has (when received) a sampling rate (measurement sampling rate). For example, a transmission received by a transmitter may be sampled at the sampling rate. The sampling rate may be such that a measurement received signal is processed as a succession of discrete samples (each sample associated to a particular time instant). Therefore, a received signal may be represented as a succession of samples (e.g., 0, 1, 2, ..., i-1, i, i+1, ..., I), each of which is associated to a value (which may be connected, for example, to electromagnetic or ultrasound magnitudes), which received by the receiver by sampling (the received signal may be physically obtained by an antenna). The received signals may be processed, e.g., using a digital signal processor (DSP) or another computing device, to obtain data which may permit to obtain a measurement of the TOA (time delay of a transmission), which is connected to the environment (transmission channel). - The sampling time is associated to a resolution. In fact, the time delays and/or the distances that that may be recognized are discrete in number.
- At
step 122, a correlation process (cross-correlation) may be performed on a received measurement signal. A correlation function (measurement correlation function) may be derived. A peak sample may be determined in the measurement correlation function to permit an estimation of a TOA and/or a distance associated to the received signal. - An example of correlation (cross-correlation) may be provided by the formula

- Notably, the resolution achievable by the correlation processes is bounded to the distance between adjacent samples. If, for example, the distance between sample i-1 (at instant t1) and i (at instant t2) is 10 ns, information is provided for instants t1 and t2, but the correlation does not give the same accurate information on different instants (such as, for example, t1<t<t2).
- At
step 124, a peak sample may be retrieved in the correlation function. The peak sample may directly associate the measurement received signal to a distance (e.g., between the antenna of the transmitter and the antenna of the receiver). In particular, it is possible to estimate a TOA by determining the peak sample, which is the sample (in the succession of samples of the correlation profile) which has the maximum value (e.g., the maximum absolute value). The information provided by the correlation (and the estimated TOAs and distances, as well) may have a maximum resolution, which may be bounded to the sampling rate of the received measurement signal. The fact that the resolution is limited (maximum achievable resolution) may, for example, cause a granularity of distances. In general terms: - the higher the sample rate;
- the lower the time distance between different samples in the received signal;
- the higher the resolution (and the accuracy);
- the lower the time distance between different TOAs (time delays) that may be measured; and
- the lower the length between different distances which may be estimated with a TOA measurement.
- For example, when a receiver estimates the distance of a transmitter which moves towards the receiver, at a first instant the peak value in the correlation profile may be retrieved at an ith sample (associated to a particular TOA and/or a particular distance), while at a second instant the peak value may be retrieved at an (i+1)th sample (associated to another TOA and/or another distance), but the determination of the peak values, as such, does not give information on the signal time of flight (TOF) at an instant intermediate between the ith sample and the (i+1)th sample (and, therefore, does not information on the distance of receiver form the transmitter). Therefore, a peak sample determination, as such, estimates a TOF whose resolution is limited by the sampling rate (coarse estimation). Therefore, at least at
step 124, additional data, other than the position of the peak in the correlation profile, are collected from the correlation profile to correct the estimation that may be computed using the peak sample determination. - At
step 124, correlation data of at least one additional sample preceding and/or following the peak sample in the measurement correlation function may be determined. For example, it is possible to determine the sample immediately preceding the peak sample and/or the sample immediately following the peak sample. The immediately preceding or following sample may be the sample which precedes or follows the peak sample of just one sample in the measurement received function (adjacent samples). For example, if a received function is received as a succession of 1, 2, ..., i-1, i, i+1, ... , I, samples, and the peak sample is the ith sample of the succession, the immediately preceding sample is the (i-1)th sample, while the immediately following sample is the (i+1)th sample. If the samples of the received function are acquired every 10 ns, the time delay from the immediately preceding/following samples and the peak sample is, therefore, 10 ns. The correlation values and/or data may also be obtained instep 124. For example, the correlation value of the peak and/or the correlation values of at least one of the samples i-2, i-1, i, i+1, i+2 may be collected. - At
step 124, values associated to the correlation values of the at least one additional sample preceding and/or following the peak sample may be retrieved. For example, a value (or modified versions thereof, such as a normalized value) of the correlation function at the at least one additional sample preceding and/or following the peak sample may be retrieved. A difference between a correlation value of a sample preceding the peak value and a correlation value of a sample following the peak value may be performed. The difference may be an algebraic difference, so as the sign ("+" or "-") may be taken in account. A sum of a correlation value of a sample preceding the peak value and a correlation value of a sample following the peak value may be performed. A quotient (e.g., of a correlation value of a sample preceding the peak value and a correlation value of a sample following the peak value at the numerator, and a sum of a correlation value of a sample preceding the peak value and a correlation value of a sample following the peak value at the denominator) may be calculated. For example, if a correlation value is R(i) at the peak sample i, the quotient (which may be named corrIndex in the present document) may be:
- Hence, at
step 124, besides the determination of a peak sample which may give a first information on the TOA, data associated to other samples (e.g., data associated to correlation values of the samples closed, and preferably adjacent, to the peak sample) may be obtained. - At
step 126, a TOA and/or a distance may be calculated on the basis of the peak sample and correction data derived by the at least one additional sample. For example, a coarse estimation of the TOA or distance may be performed from the peak sample in the correlation profile (e.g., the sample with the maximum absolute value). This estimation may be corrected using a correction data derived at least by the correlation data of at least one additional sample preceding and/or following the peak sample. For example, the quotient discussed above (corrIndex) may be used to correct the estimation obtained from the peak sample. - The correlation values close to the maximum of the correlation function (e.g., the values of the correlation profile measured at the samples which are adjacent to the peak sample) may carry information additional information on the signal TOF (which may provide information on the distance of the transmitter). By using the values of the correlation function at the samples which are close to the maximum value, the determination of the TOA or distance values may be more accurate (at least, may reach an accuracy level which is similar to an accuracy level that would be achieved with an increased sampling rate). Reference can be made, for example, to the above-discussed quotient (the ith sample being the peak sample):

- Here, the correlation value R(i-1) at the sample immediately preceding the peak sample i is compared to the correlation value R(i+1) at the sample immediately following the peak sample i. If R(i-1) > R(i+1), it is possible to derive additional information on the position of the transmitter. For example, it is possible to derive the probability of the transmitter being actually closer to the receiver than estimated by simply retrieving the peak sample. R(i-1) > R(i+1) gives the idea that, with a better resolution (higher sampling rate), the peak value would not be retrieved at the time instant associated to the ith sample, but in a sample associated to a preceding time instant. Analogously, if R(i-1) < R(i+1), there is a high probability for the real distance to be greater than estimated when simply retrieving the peak sample. R(i-1) < R(i+1) gives the idea that, with a better resolution (higher sampling rate), the peak value would be identified after the time instant associated to the ith sample.
- Therefore, data obtained by the correlation data of at least one additional sample preceding and/or following the peak sample permit to derive correction data for a TOA measurement.
- At
step 126, the estimated TOA or distance may be corrected using the correction data. For example, a transformation (such as, for example, a linear combination) may be performed to transform the estimated TOA into a corrected measurement through a composition with a value associated to a correction data (e.g., a transformed value). - At
step 126, correction data adapted (e.g., calibrated) to the transmission channel may be obtained using pre-assigned configuration data. The pre-assigned configuration data may have been defined, for example, in a configuration session (e.g., using method 110). The pre-assigned configuration data may give information about the environment. The pre-assigned configuration data may permit to increase the accuracy of the TOA measurement, so that the correction data obtained by the correlation data of at least one additional sample preceding and/or following the peak sample are processed to be adapted to the specific environmental conditions of the transmit channel. The pre-assigned configuration data may be in the form of functions (e.g., linear functions) which may transform a first correction data into a second correction data which keeps in account the situation of the place onto which TOA measurements are carried out. The pre-assigned configuration data may comprise a function obtained by inference or interpolation from data signals obtained in a configuration session data (e.g., with method 110). Fitting functions, (e.g., linear fitting function, quadratic fitting functions, or others) may be used. - Each correction data may be associated to a particular TOA value, range, distance range, or TOA range, e.g., after having adapted the data from the correlation function (e.g., peak sample, value on the samples close to the peak sample). As the determination of distances and TOAs as by retrieving the peak value permits to obtain, at best, discrete estimations, each discrete TOA value (or distance) which may be estimated may be pre-assigned (e.g., in a configuration session) to at least one configuration data.
- By using correction data based on the data (e.g., value) of the at least one additional sample preceding and/or following the peak sample in combination to the pre-assigned configuration data, the measurement resolution of time delays and distances is increased beyond the maximum resolution bounded to the sampling rate. It is therefore possible to conclude that the present examples reach a subsample resolution (subsample accuracy).
-
Fig. 1E shows a method 110 (which performs a configuration session) which may be used to obtain configuration data (e.g., a plurality of configuration data) from configuration signals received from a plurality of different locations (e.g., from a transmitter which moves through different locations, so that the locations are known, or the distance from the location is known). The configuration data may comprise, for example, data obtained from TOA data achieved by performing correlations on the received configuration signals. The configuration data may provide information on the transmission channel. The configuration data may be used, in the subsequent operation session(s), to better estimate the TOA or distance. -
Fig. 1B shows adevice 130. Thedevice 130 may be a device for measuring a TOA and/or a distance. Thedevice 130 may perform themethod 120, for example. Thedevice 130 may be configured by using themethod 110. Thedevice 130 may be part of a receiver device which receives transmissions sent by a transmitter whose distance is to be calculated. - In operation, a received measurement signal 132 (which may be a signal sampled at a particular sampling rate) may be provided to a
correlation unit 134. The receivedmeasurement signal 132 may be correlated (cross-correlated) with a reference signal 133 (which may be stored in a memory) to obtain ameasurement correlation function 136. Themeasurement correlation function 136 may be provided as an absolute value (e.g., with only positive numeric values), as a normalized value (e.g., by dividing values by a particular value), or similar. By correlating a received function with a pre-stored function, it is possible to determine a maximum in the correlation profile, the sample having the maximum value being related to the TOA of the received measurement signal (and to the distance of the transmitter). - The
measurement correlation function 136 may be provided to asample determination unit 138. Thesample determination unit 138 may determine thepeak sample 140 of themeasurement correlation function 136. The peak sample may be the sample which has the maximum value (e.g., between the absolute values and/or normalized values) of the correlation function. Thesample determination unit 138 may also recognize other samples, such as a sample preceding (e.g., immediately preceding) thepeak sample 140 and/or a sample following (e.g., immediately following) thepeak sample 140. Thepeak sample 140 may be input to a TOA ordistance estimation unit 144, which may estimate a TOA (and/or a distance associated to the TOA) 146. The TOA may be coarsely estimated on the basis of the position of the peak in the correlation function (the position of the peak being associated to a particular TOA, the TOA being associated to a particular distance). In general terms, the estimation performed by theunit 144 has a limited resolution: in a radio-frequency (RF) signal, for example, the maximum distance resolution of some meters may be achievable, e.g., when the sampling time is in the tens of nanoseconds (approximately, electromagnetic waves travel at the speed of three meters in ten nanoseconds). - A correction
data determination unit 148 may be provided. The correctiondata determination unit 148 may make use of the correlation data (e.g., value) 142 of the sample(s) close to (e.g., immediately before and after) thepeak sample 140 in themeasurement correlation function 136 and/or the estimated TOA ordistance 146. From the data of the close samples it is possible to derive information of the position of a transmitter which is even more accurate than the information inferred by the position of the peak sample. - The correction
data determination unit 148 may be input with data associated to the measurement correlation function 136 (e.g.,peak sample 140 and/orcorrelation data 142 associated to the samples close to thepeak sample 140, the estimated TOA or distance 146). - The correction
data determination unit 148 may be input with pre-assigned configuration data 150 (e.g., obtained with method 110). Theconfiguration data 150 may be stored, for example, in a memory and be at disposal of the correctiondata determination unit 148. Theconfiguration data 150 may comprise look-up tables and/or functions (e.g., fitting functions). Theconfiguration data 150 may contain information on the environment (transmission channel), as they may have been obtained from actual measurements (e.g., in the configuration session and/or with method 110). The actual measurements may have been obtained at a subsample resolution with respect to the maximum resolution of the measurement (e.g., the resolution associated to the sampling rate). Theconfiguration data 150 may permit to perform transformations so that sample information associated to thepeaks 140 and/orcorrelation data 142 associated to the samples close to the peaks may be transformed into correction data which take into account the conditions of the transmission channel. Therefore, there may be accurate data (e.g., at the subsample accuracy) at disposal of the correctiondata determination unit 148 for modifying the estimated TOA (or distance) 146. - By using the
configuration data 150, the correlation data (e.g., correlation values) 142 of the samples close to (e.g., immediately before and after) thepeak sample 140 may be transformed to adapt the estimated TOA (or distance) 146 to high resolution corrected TOA or distance values 156. Acorrection unit 154 may be used to modify the estimated TOA or distances with the correction data. Notably, not only is the TOA (or distance) 146 corrected, but it also keep into account the conditions of the transmission channel. - For example, in the
correction unit 154, there is the possibility of correcting the TOA ordistance 146 by composition with (e.g., addition of) avalue 152 associated to the correction data, thevalue 152 being in the subsample resolution. -
Fig. 1C shows atransmission device 160 which may be a TOA ordistance calculation system 160. Thedevice 160 may comprise anantenna 161. Thedevice 160 may comprise a receivingtransceiver 162, which may be connected to a theantenna 161. Thedevice 160 may comprise thedevice 130. Thedevice 160 may comprise afilter 164. Thedevice 160 may also comprise a I/O unit 166, which may provide as an output to a user or to an external device a calculation of the TOA (or a distance), e.g., thevalue 156. -
Fig. 1D shows atransmitter device 170 whose distance D1 at instant t1 is to be determined by thedevice transmitter device 170 may be moved to have a distance D2 from thedevice Reference numeral 180 refers to a systems which comprises the atransmitter 170 and areceiver - In general terms, TOA measurements based on retrieving the sample peak in the correlation function are limited in the accuracy by virtue of the maximum sampling time (which has a finite value). If, in an RF environment, the sampling time is 10 ns, the maximum accuracy of a TOA measurement based only on retrieving the peak sample may have a resolution of approximately 3 m. Therefore, by sampling at 10 ns, only distances which are approximately multiple of 3 m would be detectable without approximation.
- In some examples,
Fig. 1 may concern a simulated receiver, a simulated transmitter, and a simulated channel. - A comparative example is provided by
Figs. 2A and2B . InFig. 2A , anideal profile 200 for a correlation on a signal received from a distance of 300 m is aligned with the reference signal (0°) and provides a correct peak. However, with 180° phase difference as shown inFig. 2B (which refer to an estimation without correction, e.g., by simply retrieving the maximum in the correlation profile), a detectedmaximum 206 deviates from theideal maximum 204 with a Δd which is 1.5 m in this case. InFigs. 2A and2B , the abscissa is provided in meters (as a consequence of the distance being associated to the peak position in the correlation sample). A correlation filter that computes the correlation may be used. - In systems which do not have correction data, only when a transmitter (e.g., 170) transmits a signal from a position at a distance which is a multiple of the distance travelled by the waves, the TOA measurement may be, at best, correct. When the transmitter transmits from a different position, a certain amount of error may be present.
- Notwithstanding, It is possible to correct the deviation of the TOA measurements, e.g., by implementing the
method 120 and/or using thedevice Fig. 2C shows a first correlation profile (function) 210 (which may represent a measurement correlation function 136) of a first received signal received in a measurement session from a distance which is exactly detectable by retrieving the peak sample when correlating a received function (i.e., the transmitter is placed at a distance which is multiple to approximately 3 m for a 10 ns sample time). Apeak 240 may be identified (e.g., by thesample determination unit 138 or step 124). Accordingly, the peak sample may be identified (inFig. 2C the peak sample is in the 18th sample), and the TOA and/or distance may be coarsely estimated (e.g., by unit 144). Two other samples, associated to the correlation values 242', may be identified as the samples immediately before and after the sample with thepeak 240. -
Fig. 2C also shows a second correlation profile (function) 212 of a second received signal received in the same measurement session, but after that the transmitter has moved of half meter (e.g., the distance is now approximately 2.5 m). By performing the second correlation (e.g., by repeatingstep 122 for a new signal), a second peak in may be retrieved. In this case, the peak of thesecond correlation profile 212 is at the position of the peak of thefirst correlation 210. This is due to the fact that the first and second received signals are received from distances which are too close to each other to be distinguished at the resolution of the present sampling rate. However, the positions of the samples immediately before and after the peak sample in thesecond correlation profile 212, are different from the samples 242' of thefirst correlation profile 210. Therefore, even if, from the position of thepeaks 240 the distance of the transmitter would not be measured with a great precision, it is notwithstanding possible to use samples close to the peak sample (e.g.,samples 242") to reconstruct a more exact location of the transmitter at a subsample resolution. Using thecorrection data 152 obtained by the data carried by thesamples 242" (e.g., values 142), it is possible to correct the results of the estimation. - However, it has been noted that even using the values of the samples preceding and following the peak sample, it is still possible to increase accuracy, e.g., by using the
pre-assigned configuration data 150. As the pre-assigned configuration data have been collected from a plurality of TOAs and/or distances which have distances smaller than the measurement resolution associated to the sampling rate, the pre-assigned configuration data are suitable for adapting to the transmission channel (e.g., calibrating) the correlation data associated to the samples preceding and/or following the peak sample. - For
samples 242", the correlation value R(i-1) (which is the 16th sample) is higher than the correlation value R(i+1) (which is the 18th sample). It is therefore possible to infer that, with an increased resolution (e.g., with a much better higher sampling rate), the "real peak" would be retrieved before the instant associated to the peak sample. Therefore, the above-identified quotient corrIndex
- However, by adapting data obtained from the samples close to the peak sample (e.g., from the quotient corrlndex) using pre-assigned data at a higher resolution (subsampling resolution), it is possible to further increase the accuracy of the corrected TOA and/or distances 156.
- The correction data to be used for measuring the distance (or TOA) may be obtained by adapting the data obtained by the samples preceding and/or following the peak sample with data associated to the transmission channel, these data having being obtained at a subsampling resolution (the subsampling resolution being higher than the sampling resolution of the measurements performed by the
sample determination unit 138, for example). An example of pre-assigned configuration data 150 (which may be obtained with method 110) is provided inFig. 6A . The pre-assigned configuration data 150 (correction index) may take the form of alinear function 600. Thelinear function 600 may have been obtained, for example, by inference, interpolation, least square method, or other statistical methods. Thelinear function 600 may be used to transform data from a measurement correlation function (e.g., data associated to the peak preceding and/or following the peak sample) into data which keep into account the features of the environment (transmission channel). Different environments, therefore, may be associated to different linear functions (e.g., different slopes). - In
Fig. 6B , a quadratic function 610 is shown. The quadratic function may be expressed, for example as y=ax2+bx+c. In one case, for example, it may be:
-
Fig. 3 shows amethod 300 which may be performed as an embodiment ofmethod 120 and/or by thedevice - At step 302 (which may embody step 122), a correlations R is computed, e.g., by obtaining the
measurement correlation function 136. The correlation R may have a sample resolution (which may be, for example a resolution associated to the sampling rate of the received signal and/or the sampling rate of the correlation function). - At
step 304, an initial coarse TOA (e.g., TOA 146) or a coarse distance may be identified (e.g., throughunits 138 and 144). - At
step 306, calculations associated to the correlation function 136 (e.g., to the correlation data of at least one additional sample preceding and/or following thepeak sample 242") are performed (e.g., at the correction data determination unit 148). For example, it is possible to calculate values such as:


- Hence, the value corrlndex may embody the quotient discussed above and may give an idea of the "real position" of the peak. Notably, if the real distance (or TOA) is greater than the distance estimated by retrieving the peak sample in the correlation profile, then the value diff_R = R(i + 1) - R(i - 1) is greater than zero.
- At step 308 (which may be performed by the correction
data determination unit 148 and/or in step 126), thecorrection data 152 may be calculated, e.g., by adapting the corrlndex to the environment conditions. For example, the correction may be performed using a linear transformation which may translate corrIndex by a pre-assigned configuration data "b" and scale by a pre-assigned configuration data "a" according a formula such as:
- The term "b" may be related to the number of correlations, for example. This term "b" may be used to adjust, in some cases, for slight deviations when linear fitting is performed (e.g., when a linear equation may approximately fit corrlndex but error margin is acceptable). It is also possible to choose a higher degree fitting function (e.g., a quadratic fitting function).
- The quotient corrlndex, calculated on the basis of the correlation values of the samples close to the peak sample, may therefore be scaled by a quantity "a". Basically, "a" and "b" may be the coefficients of a linear transformation which keeps in account the conditions of the transmission channel. Other ways of adapting the correction data to the particular transmission channel may be defined (e.g., using a quadratic transformation, and so on). Data such as, "a" and "b", which are pre-assigned, may have been obtained in a configuration method (e.g., method 110). Basically, data "a" and "b" provide a modeled profile which permit to correct the imprecise TOA estimated by simply searching for the peak sample in the correlation profile.
- At step 310 (which may be embodied by
correction unit 154 and/or performed in step 126), the correction data may be composed (e.g., algebraically summed) to the initial TOA or distance estimated at step 304 (e.g., by unit 144). - Therefore, the final TOA may be a linear combination between an estimated TOA and a correction value, for example:

- K may be a fixed number. K may be associated to the number of subsamples of the configuration session, for example (i.e., the number of configuration signals, received by different distances in the configuration, for which the correlations have been performed).
- The
pre-assigned configuration data 150 may be the same for all the TOAs (or distances). As can be seen fromFig. 6A , for example, the data a, b are constant, as they are coefficients of a linear function. Also the parameter K (number of subsamples) may in general be fixed. - Examples of a configuration session are here discussed. In some examples, it is possible to use a transmitter such as the
transmitter device 170, which, as shown inFig. 1D , may move between different positions in different time instants. For example, the transmitter may move from a distance D1 to a distance D2 between time instants t1 and t2. The transmitter and/or the receiver may have units (e.g., GPS unit, clock unit, storage device, calculation unit etc.) which permit to keep into account data associated to the position (e.g., coordinate data, geographical data, and so on) or the receiver is capable of taking the relative distances into account without the need for a synchronization scheme. The transmitter and/or the receiver may be engaged to a moving device, which may transport it along different positions (e.g., geographical locations). The transmitter and/or the receiver may be engaged to a satellite, for example. -
Fig. 4 shows areceiver 430 which may be, for example, thedevice 130 and/or 160. Thereceiver 430 may define theconfiguration data 150.Fig. 4 shows the scheme of thedevice 430, with units which may be the same of the units ofFig. 1B (the same units may be retrieved by substituting "4" with "1" in the first digit of the reference numerals). A receivedmeasurement signal 432 may be input to acorrelation unit 434. The receivedmeasurement signal 432 may be correlated with a reference signal 433 (which may be stored in a memory) to obtain aconfiguration correlation function 436. Themeasurement correlation function 436 may be provided to asample determination unit 438. Thesample determination unit 438 may determine thepeak sample 440 of themeasurement correlation function 436. Thesample determination unit 438 may also determine data (e.g., correlation values) from other samples, such as a sample preceding (e.g., immediately preceding) thepeak sample 440 and/or a sample following (e.g., immediately following) thepeak sample 440. Thepeak sample 440 and the other samples may be provided to a configurationdata definition unit 449 to provide (and/or save in a memory) configuration data which, in operation, will provide thepre-assigned configuration data 150. An example of theconfiguration data 150 defined by the configurationdata definition unit 449 may be, for example the coefficients "a" and "b" discussed above. - During the configuration session (e.g., method 110), the distance separating the transmitter (e.g., 170) and the receiver may be changed (the receiver and/or the transmitter may change the position). Therefore, the
receiver 430 may receive a configuration signal from each of a plurality of distances. The configuration signal may be a continuous or burst electromagnetic or ultrasound transmission, which may notwithstanding be taken at different distances separating the transmitter and receiver during different time instants. Therefore, thereceiver 430 may obtain data from a plurality of received configuration signals, each of which may be processed (e.g., using different correlations). In some examples, it is possible to use a single correlator, where measurements are carried at different time instants. Thereceiver 430 may correlate each of the received configuration signals, and for each of them determine thepeak sample 442 and correlation data (such as correlation values) associated to the at least oneadditional sample 442 preceding and/or following thepeak sample 442. At least some of these operations may be performed not in real time (e.g., after having received and stored all the signals received by the transmitter), such as offline. - In the configuration session, the transmitter or receiver may spatially move while sending a configuration transmission, so that the receiver receives in different time instants signals at different distances.
- In some examples, the configuration session may be performed on a simulation level. The distance displacement at the simulation may be performed for example with a simulated channel and software transceiver modules.
- When performing real configuration measurements in the configuration session, a hardware chain for the transceiver may be used. Reference may be made to
Fig. 1D , where the a cable is not shown but is provided between thedevices Fig. 10 shows measurements performed for different cable lengths (1002: 350 cm; 1004: 375 cm; 1006: 400 cm). The cable may directly connect the transmitter to the receiver output. The exact signal propagation time for each cable may be controlled with a measurement instrument set at the defined carrier frequency (for example a network analyser). The transmitter (e.g., 170 inFig. 1D ) and receiver (e.g., 130, 160, 430) should be synchronized in this step otherwise it will not be possible to measure the relative propagation time at different instants due to the frequency offsets. The number of cables used may be related to the number of subsamples (K). Following the steps in 120 the value of corrlndex may be calculated for each measurement with a different cable length. Knowing the exact signal propagation time for each cable, the profile inFig. 6A may be then obtained with real data. The number of corrlndex(k) values is equal to the number of measurements taken within one sample (i.e. the relative propagation time from the cable length is in subsamples). - With respect to the measurement session (e.g., method 120), the configuration session may have a resolution which is greater (subsample resolution). If, for example, the sampling rate to be used at the measurement session is 10 ns (associated to a maximum resolution of approximately 3 m), the configuration session may be so that the receiver collects configuration signals when the transmitter has travelled a distance less than 3 m (e.g., every 300 mm, to obtain a
configuration resolution 10 times greater than that achievable with the simple detection of the peak value in the correlation). Hence, in the configuration session, the received configuration signals are received from a succession of distances which with a resolution better than the resolution of a TOA measurement when only based on retrieving the peak sample. Therefore, it is possible to obtain information at subsample resolution which may be used to adapt, in the measurement sessions, the data obtained from the correlation values of the samples close to the peak sample to the environment. - Reference may be made to
Fig. 2C . Thereceiver 430 may receive two different signals which providedifferent correlation profiles - Other than in the measurement session, in the configuration session the position of the transmitter is in general known for each signal that is received by the receiver: the transmitter may have the knowledge of the position, e.g., an absolute position and may store or transmit data relating to the position, so as to permit to associate a particular configuration signal, as received by the receiver, to the transmitter's position. Even if the absolute position is not known, the relative distance between different measurements may be sufficient. For this step a number of measurements related to subsamples may be taken. Even if the absolute TOA is not known, the configuration data can be extracted from the correlation profiles taken at several instants within one sample. Hence, in the configuration session, it is possible associate the distance of the receiver from the transmitter with values (e.g., 242") of the correlation data (e.g., R(i-1) and/or R(i+1)) of at least one additional sample (e.g, i-1 and/or i+1) preceding and/or following the peak sample. It is possible to determine, as a feedback, the behaviour of the transmission channel on the basis of the transmitted data. The configuration may therefore provide pre-assigned configuration data (calibration data) which will be used, in the operation session, to adapt the correction data to the environment.
- If the configuration signals 432 are received from distances which are less than the maximum resolution which is normally achievable with a simple determination of the peak sample, the collected
configuration data 150 may be considered to be at a subsampling rate, as they have a precision which goes beyond the resolution provided by the sampling rate. -
Fig. 1F shows a method 110' for performing a configuration session (e.g., to implementmethod 110 and/or performed by the device 430). - At
step 112, a plurality of correlation processes for a plurality of configuration signals may be performed to obtain multiple configuration correlation functions at different distances (e.g., associated to different subsamples). The distance between the signals is at a subsample resolution with respect to the sample resolution of themeasurement method 120, for example (e.g., the time distance between two consecutive samples of the measurement receivedsignal 132 is associated to a different of distances which is greater than the distances for which the correlations are calculated in the configuration session). The configuration signals from which the calculations are made may be either obtained though actual measurements or simulated. - At
step 114, for each configuration correlation process performed at step 121, the peak sample and data of at least one sample preceding and/or following the peak sample for each configuration may be determined. - At
step 116, configuration data (e.g., data 150) are associated to the transmission channel. The configuration data have a subsample resolution and, therefore, may be used to obtain the correction data for correcting the estimated TOA and/or distance. - An example of configuration session is provided by the
method 500 inFig. 5A , which may embody astep 110, for example, and which may embodied, for example, the operations of thedevice 430, for receiving transmissions performed, for example, by thetransmitter 170. - At
step 502, a transmission is started by the transmitter (the transmission will continue in the subsequent steps). According to examples, the transmission may be at baseband. Asequence code 520 of 64 length shaped with an RRC filter with 10 samples per symbol at the transmitter is shown inFig. 5B . However, other pulse shaped filters may be used. - At
step 504, the transmission is actually performed on the transmission channel. The transmission is received as asingle signal 432 inFig. 4 (it may be sampled, filtered and so on). - At
step 506, correlations R() are performed, e.g., using thecorrelation unit 434. Each received signal may be understood as relating to a subsample "k". The reference to subsamples is justified in that information is provided on data which would not be achievable by simply estimating a distance or a TOA retrieving the peak sample. Further, using thesample determination unit 438, the peak sample and correlation data of at least one additional sample preceding and/or following the peak sample is acquired. - At step 508 (which may be performed, for example, by the configuration data definition unit 449), configuration data may be obtained for a subsample "k". For example, if the peak sample in the kth correlation profile is sample "i", the following calculations may be performed:


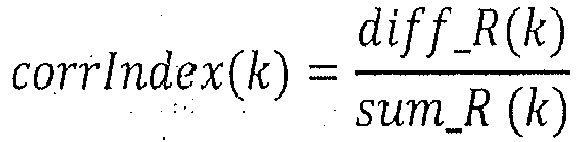
- At
step 510, a projection of corrlndex(k) may be made over a finite number (e.g., K) of subsamples (e.g., of received configuration signals 432). The number of subsamples may be, for example, the number of received configuration signals that are received by the receiver in the configuration session. - Projection of different corrlndex(k) for k=0... K may reflect the fact that, while the k values "corrIndex(k)" are samples (e.g., they are obtained as a succession of values), it is possible to obtain a continuous function which approximates the different data obtained by the different configuration signals.
- At
step 512, a regression technique (e.g., linear regression) may be used to obtain a continuous function. A linear fitting function (or a quadratic fitting function) may be calculated from the multiple sample data for example, coefficients a, b for a linear fitting function and/or coefficients a, b, c, for a quadratic function may be calculated. -
Fig. 6A shows a graph 600 (abscissa: subsamples k; ordinate: amplitude) in which multiple points (each point associated to data obtained from a correlation to a configuration signal received by the receiver during a configuration session) have been used to approximate a linear function (e.g., using a linear fitting, linear regression) by asingle line 602. A least square method may be used to calculate theline 602. The linear function may be described as:
- The coefficients a and b may be the values a and b to be used in
step 308 to embody thepre-assigned configuration data 150. As it can be understood, thepre-assigned configuration data 150 may be easily obtained in the configuration session in the subsample resolution. - The
configuration data 150 may be defined for each discrete value (TOA or distance) or for each possible peak sample which will be identifiable by performing correlations. - Accordingly, during the measurement session (operation session) it is possible to calculate a TOA from the estimated TOA and the function estimated by the corrlndex on the basis of the data obtained by the at least one sample close to the peak sample. The following three cases may be taken in account:
- For example, in the
measurement method 300, after having identified the TOA at 304, the having computed the corrlndex at 306, having calculated the subsample correction as corrIndex/a-b/a with the pre-assigned configuration values a and b (obtained in the configuration session), it is possible to calculate the final TOA as a linear combination of the estimated TOA and a correction value. For example:
- Correction may be, for example, obtained as:

-
Fig. 7 has agraph 700 showing inordinate errors 700 in calculating the TOA after having applied the fitting method with a sampling time of 10 ns (abscissa: distance transmitter-receiver). It is possible to see that the error may be less than 1 cm, where inFig. 2B the error could have been 1,5 m. the error increase in the middle occurs when R(i-1) and R(i+1) are close to each other. -
Fig. 8A shows a time difference of arrival, TDOA,localization system 800 comprising a transmitter 802 (which may be, for example, a mobile phone, a mobile terminal, a smartphone, a localization device, or a similar apparatus) which has to be localized (e.g., its distance has to be determined) and at least threesynchronized receivers Rx1 804,Rx2 806, and Rx3 808 (which may be base stations, e.g., of a mobile communication network, such as a GSM network or similar, or devices at known positions). Thetransmitter 802 may be, for example thetransmitter 170; at least one of thereceivers Rx1 804,Rx2 806, andRx3 808 may be one of thedevice transmitter 802 from thereceivers Rx1 804,Rx2 806, andRx3 808 may be calculated using one of themethods curves transmitter 802 in a coordinate system (e.g., a geographical coordinate system). A configuration session (e.g., using themethod 110 and/or 500 and /or the device 430) may be performed. It is not strictly necessary that the transmitter that has performed the configuration session is the same of thetransmitter 802 which is actually localized in the measurement session. The localization of thetransmitter 802 may be performed, for example, by exchanging data (e.g., distances d1, d2, d3) between the receivers 804-808 and/or thetransmitter 802. By calculating the correction data (preferably on the basis of the pre-assigned configuration data 150), it is possible to increase the accuracy of the measurements. -
Fig. 8B shows apositioning system 822 which may be a TOA positioning system. A receiver 822 (which may be, for example, a mobile phone, a mobile terminal, a smartphone, a localization device, or a similar apparatus) is to be localized. For example, the distances (e.g., indicated with 834, 836, 838) of thereceiver 822 from at least three (preferably at least four)transmitters Tx1 824,Tx2 826, Tx3 828 (which may be base station (or devices at known position), or in any case transmitters with known position) may be calculated. Accordingly, it is possible to retrieve the position (e.g., in geographical coordinates) of the receiver. Thereceiver 822 may be, for example, one of thedevices methods receiver 822 to also be the same receiver that has performed the configuration session. By calculating the correction data (preferably on the basis of thepre-assigned configuration data 150 at a subsample resolution), it is possible to increase the accuracy of the measurements. -
Fig. 8C shows a round trip time (RTT)system 840 for measuring the distance between twodevices 842 and 844 (e.g. mounted on satellites or at least one being mounted on a satellite). As can be seen fromFig. 8C , the round trip time troundt may be obtained at least by a first transmission time tp for transmitting afirst signal 846 from thedevice 842 to thedevice 844. A time delay treply may elapse for permitting the processing to thedevice 844. A second transmission time tp for transmitting asecond signal 848 from thedevice 844 to the device 842 (e.g., in response to the first signal 846) may also be calculated. It is possible to calculate tp from troundt and treply (e.g., by subtracting treply from troundt and subsequently dividing by 2) to obtain a time proportional to the distance between thedevices devices method first signal 846 is transmitted, thedevice 844 may be embodied by thedevice 130 and/or 160. Additionally or alternatively, when the second signal is transmitted, thedevice 846 may be embodied by thedevice 130 and/or 160. A configuration session may have been performed at a subsample resolution to prepare the configuration data for thedevices -
Fig. 9 shows a device 900 (which may implement at least one of thedevices processor 902 which may execute instructions. Thedevice 900 may comprise amemory 904 which may comprise processorreadable instructions 906 which, when performed by theprocessor 902, cause theprocessor 902 to perform one of the methods above (e.g., 100, 110, 120, 300, 500). Thememory 904 may also containdata 908. Thedata 908 may contain, for example pre-assigned configuration data (e.g., data 150). When thedevice 900 implement a transmitter in the configuration session, thedata 908 may contain location data, to be used for performing the configuration at a subsample resolution. Thedevice 900 may comprise a transmission/reception unit 910 and anantenna 912, e.g., to perform the signal transmissions or receptions discussed above. Thedevice 900 may comprise an input/output (I/O) device for communication of data to an external device (e.g., a communication network and/or a display device to communicate a result to a user) and/or for receiving selections from a user. - In view of the above, it is possible to see that a particular example may comprise:
- A configuration session with:
- o Transmitting signals from a transmitter (e.g., step 502);
- o Computing correlations over K subsamples (e.g., step 506);
- o Computing for each subsample k a corrlndex(k) (e.g., step 508);
- o Projecting the corrlndex to the K subsamples (e.g., step 510) to obtain a fitting function (e.g., a continuous function);
- o Estimating the fitting coefficients a and b (e.g., step 512);
- A subsequent measurement session with:
- o Receiving a signal from a transmitter whose distance is to be measured (e.g., step 302);
- o Estimate a coarse TOA and/or distance (e.g., step 504);
- o Compute a corrlndex (e.g., step 506);
- o Calculate correction data (Correction) a Correction=corrlndex/a-b/a
- o Correct the TOA using a linear combination between the estimated TOA (TOA_Coarse) and the correction data (Correction), for example according to a formula TOA_fine=TOA_Coarse+(Correction*K/2)K.
- Time of arrival (TOA) estimate is fundamental for applications like ranging, positioning and time synchronization applications. The TOA is often derived from the correlation result between the received signal and a reference signal. The TOA can be directly be derived from the correlation peak the accuracy is however limited by the sampling rate. Hence a high resolution approach must be carried after the correlation to obtain sub-sample corrections. The profile of the correlation result is also dependent on the channel characteristics. These characteristics generates extra errors if not compensated or taken into account.
- In addition to accuracy, the computational intensity plays an important role in the choice of the algorithm due to the limited resources on the target platform.
- In the presence of a line of sight (LOS) signal reception, the correlation profile carry the required time delay information to calculate the TOA. The correlation maximum provides a coarse TOA estimate in sample accuracy. To achieve higher accuracy, the initial TOA estimate has to be corrected in subsample resolution.
Figs. 2A and2B show the ideal correlation profile in red and the computed correlation at the receiver side with sampling rate of 10ns. InFig. 2A the received signal is aligned with the reference signal (0°) and the resulting subsampling correction is hence zero. However with 180° phase difference as shown inFig. 2B the detected maximum deviates from the ideal maximum with a Δd which is 1.5 m in this case. - The method proposed for estimating the subsample corrections may operate in two modes (sessions). In the first mode (configuration session) the effects of the channel and transmit sequence on the correlation profile are modeled. The second mode (measurement session) is the during operation: the subsample correction are estimated based on the modeled profile directly from the computed correlation at the receiver side.
- The flowchart in
Fig. 5A shows the offline operation in the first mode. A pulse shaped transmit sequence is sent over a channel.Fig. 5B shows a sequence shaped with an RRC filter (however any pulse shaped filter can be used for this method). - The channel in this scenario emulates the effect of time-delay on the received correlation profile. The next step correlation profile is collected over K subsamples as shown in
Fig. 2C for time delays k1 and k2 within one sample. R(i,k) represents the correlation maximum between the received signal y and the reference signal x. R(i-1,k) and R(i+1,k) represents the points in correlation profile before and after the maximum respectively. R (i-1,k) and R (i+1,k) are collected over K correlations. For each k correlation diff R (k) and sum_R (k) are computed, represented by:

- The index corrIndex(k) is then computed as corrIndex(k) = diff_Rxy(k)/sum_Rxy(k).
Fig. 6A shows the index corrIndex(k) für K=1000. In some cases quadratic fitting might be more suitable. - During operation, or in the second mode (measurement session), the digital receiver can correct the TOA using the coefficients a and b in the above case. The subsample correction is simply computed as


- Therefore, it is possible to resume that TOA, which is often fundamental for distance for measurements, may be normally estimated by means of a cross-correlation between a received signal and a reference signal. The sample accuracy is not often sufficient for applications like positioning and ranging. The current methods are inaccurate or have a high computational complexity. The present methods target small devices because of the low complexity and the accurate extraction of the TOA form one snapshot given that the correlation profile is not distorted.
- Two modes of operations may be executed: offline mode (configuration session) and operation mode (measurement session). In the offline mode the mapping of the correlation profile to the corresponding time delay is performed, and later, fitted to an algebraic equation. This procedure may be performed once. In the operation mode (measurement session) the receiver calculates the correlation profile index and solvers the algebraic equations to perform measurement sin the subsample accuracy. A last step in the TOA measurements may be corrected by subsample corrections.
- Although some aspects have been described in the context of an apparatus, it is clear that these aspects also represent a description of the corresponding method, where a block or device corresponds to a method step or a feature of a method step. Analogously, aspects described in the context of a method step also represent a description of a corresponding block or item or feature of a corresponding apparatus. Some or all of the method steps may be executed by (or using) a hardware apparatus, like for example, a microprocessor, a programmable computer or an electronic circuit. In some embodiments, some one or more of the most important method steps may be executed by such an apparatus.
- Depending on certain implementation requirements, embodiments of the invention can be implemented in hardware or in software. The implementation can be performed using a digital storage medium, for example a floppy disk, a DVD, a Blu-Ray, a CD, a ROM, a PROM, an EPROM, an EEPROM or a FLASH memory, having electronically readable control signals stored thereon, which cooperate (or are capable of cooperating) with a programmable computer system such that the respective method is performed. Therefore, the digital storage medium may be computer readable.
- Some embodiments according to the invention comprise a data carrier having electronically readable control signals, which are capable of cooperating with a programmable computer system, such that one of the methods described herein is performed.
- Generally, embodiments of the present invention can be implemented as a computer program product with a program code, the program code being operative for performing one of the methods when the computer program product runs on a computer. The program code may for example be stored on a machine readable carrier.
- Other embodiments comprise the computer program for performing one of the methods described herein, stored on a machine readable carrier.
- In other words, an embodiment of the inventive method is, therefore, a computer program having a program code for performing one of the methods described herein, when the computer program runs on a computer.
- A further embodiment of the inventive methods is, therefore, a data carrier (or a digital storage medium, or a computer-readable medium) comprising, recorded thereon, the computer program for performing one of the methods described herein. The data carrier, the digital storage medium or the recorded medium are typically tangible and/or non-transitionary.
- A further embodiment of the inventive method is, therefore, a data stream or a sequence of signals representing the computer program for performing one of the methods described herein. The data stream or the sequence of signals may for example be configured to be transferred via a data communication connection, for example via the Internet.
- A further embodiment comprises a processing means, for example a computer, or a programmable logic device, configured to or adapted to perform one of the methods described herein.
- A further embodiment comprises a computer having installed thereon the computer program for performing one of the methods described herein.
- A further embodiment according to the invention comprises an apparatus or a system configured to transfer (for example, electronically or optically) a computer program for performing one of the methods described herein to a receiver. The receiver may, for example, be a computer, a mobile device, a memory device or the like. The apparatus or system may, for example, comprise a file server for transferring the computer program to the receiver.
- In some embodiments, a programmable logic device (for example a field programmable gate array) may be used to perform some or all of the functionalities of the methods described herein. In some embodiments, a field programmable gate array may cooperate with a microprocessor in order to perform one of the methods described herein. Generally, the methods are preferably performed by any hardware apparatus.
- The apparatus described herein may be implemented using a hardware apparatus, or using a computer, or using a combination of a hardware apparatus and a computer.
- The methods described herein may be performed using a hardware apparatus, or using a computer, or using a combination of a hardware apparatus and a computer.
- The above described embodiments are merely illustrative for the principles of the present invention. It is understood that modifications and variations of the arrangements and the details described herein will be apparent to others skilled in the art. It is the intent, therefore, to be limited only by the scope of the impending patent claims and not by the specific details presented by way of description and explanation of the embodiments herein.
Claims (16)
- A method (120) for time of arrival, TOA, measurements, comprising:performing (122), at a sample resolution, a correlation process on a received measurement signal (132) to obtain a measurement correlation function (136);determining (124) a peak sample (140) and correlation data (142) of at least one additional sample preceding and/or following the peak sample (140) in the measurement correlation function (136);determining (126) a TOA and/or distance (146) on the basis of the peak sample (140) and correction data (152) obtained by at least the correlation data (142) of the at least one additional sample preceding and/or following the peak sample (140) and pre-assigned configuration data (150) associated to the transmission channel obtained at a subsample resolution.
- The method of claim 1, further comprising a configuration session comprising:performing a plurality of correlation processes for a plurality of configuration signals to obtain multiple configuration correlation functions associated to different distances at a subsample resolution;for each configuration correlation process, determining the peak sample and data of at least one sample preceding and/or following the peak sample for each correlation;associating configuration data to the transmission channel.
- The method of any of the preceding claims, further comprising transforming the correlation data (142) of the at least one additional sample preceding and/or following the peak sample (140) according to a transformation function (600) obtained experimentally.
- The method of any of the preceding claims, further comprising a configuration session (110) obtaining a plurality of data from configuration signals received from a plurality of different distances and/or time delays, to obtain pre-assigned configuration data (150) in association to distances or time delays (146).
- The method of any of the preceding claims, further comprising performing a transmission from a transmitter (170) in movement so as to obtain different configuration signals associated to different distances and/or TOAs at the receiver (130, 160, 430).
- The method of any of the preceding claims, wherein the at least one additional sample, preceding and/or following the peak sample (140) comprises at least the sample immediately preceding the peak sample (140), and/or at least the sample immediately following the peak sample (140).
- The method of any of the preceding claims, further comprising, when determining the correlation data of at least one sample preceding and/or following the peak sample, comparing and/or measuring the difference between the correlation value (242") of a sample preceding the peak sample (140) with the correlation value (242") of a sample following the peak sample (140), and/or
calculating a ratio between:- the difference between the correlation value (242") of a sample following the peak sample (140) and the correlation value (242") of a sample preceding the peak sample (140); and- the sum of the correlation value (242") of a sample following the peak sample (140) and the correlation value (242") of a sample preceding the peak sample (140). - The method of any of the preceding claims, further comprising, in the configuration session performed at a subsample resolution:comparing and/or measuring the difference between the correlation value (242") of a sample preceding the peak sample (140) with the correlation value (242") of a sample following the peak sample (440), and/orcalculating a ratio between:- the difference between the correlation value (242") of a sample following the peak sample (440) and the correlation value (242") of a sample preceding the peak sample (440); and- the sum of the correlation value (242") of a sample following the peak sample (440) and the correlation value (242") of a sample preceding the peak sample (440).
- The method of any of the preceding claims, further comprising obtaining a linear function (600) from values of the ratios of claim 8, further comprising, when determining the correction data, scaling the ratio of claim 7 by a value associated to an angular coefficient of the linear function.
- The method of any of the preceding claims, further comprising correcting the estimated TOA or distance with a value associated to the scaled ratio of claim 9.
- A method for performing difference time of arrival measurements, TDOA, comprising measuring a first TOA for a first transmission, a second TOA for a second transmission, and measuring a distance by subtracting the first TOA from the second TOA, wherein at least one of the measurements are performed with a method according to any of claims 1-10.
- A method for performing round trip time, RTT, measurements, comprising transmitting a first signal (846) from a first device (842) to a second device (844), transmitting a second signal (848) from a first device (842) to a second device (844), and performing the method of any of claims 1-10 for calculating the distance between the first and the second devices (842, 844) for at least the first and/or the second signals (846, 848).
- The method of any of the preceding claims, wherein the pre-assigned configuration data are obtained by simulation or by performing measurements on cable.
- A device (130, 160, 430) comprising:a TOA or distance estimation unit (144) for estimating, at first resolution, a TOA or a distance (146) from a position of the peak in a correlation function obtained by processing a received signal (142), wherein the first resolution is associated to the sampling time of the received signal and/or correlation function; anda correction unit (154) to modify the estimated TOA or distance (146) on the basis of at least correlation data (142) of at least one of the samples preceding and/or following the sample with the maximum value of the correlation function and pre-assigned configuration data (150) having a resolution higher than the first resolution.
- A system comprising a transmitter (170) and a receiver (130, 160, 430), wherein the receiver is the device of one of claims 13 or 14 and is to measure a TOA of a signal received from the transmitter at least in the determining (126) step or in the configuration session (110).
- A device (900) comprising non-transitory storage means which contain processor readable instructions which, when performed by a processor, cause the processor to perform the method of any of claims 1-13.
Priority Applications (8)
| Application Number | Priority Date | Filing Date | Title |
|---|---|---|---|
| EP16196384.8A EP3315991A1 (en) | 2016-10-28 | 2016-10-28 | Time of arrival (toa) measurements |
| PCT/EP2017/077328 WO2018077959A1 (en) | 2016-10-28 | 2017-10-25 | Time of arrival (toa) measurements |
| EP17787930.1A EP3532861B1 (en) | 2016-10-28 | 2017-10-25 | Time of arrival (toa) measurements |
| JP2019522671A JP6843234B2 (en) | 2016-10-28 | 2017-10-25 | Measurement of arrival time (TOA) |
| CN201780081274.XA CN110168396B (en) | 2016-10-28 | 2017-10-25 | Time of Arrival (TOA) measurement |
| ES17787930T ES3014236T3 (en) | 2016-10-28 | 2017-10-25 | Time of arrival (toa) measurements |
| EP24219842.2A EP4542255A3 (en) | 2016-10-28 | 2017-10-25 | Time of arrival (toa) measurements |
| US16/395,127 US11187775B2 (en) | 2016-10-28 | 2019-04-25 | Time of arrival (TOA) measurements |
Applications Claiming Priority (1)
| Application Number | Priority Date | Filing Date | Title |
|---|---|---|---|
| EP16196384.8A EP3315991A1 (en) | 2016-10-28 | 2016-10-28 | Time of arrival (toa) measurements |
Publications (1)
| Publication Number | Publication Date |
|---|---|
| EP3315991A1 true EP3315991A1 (en) | 2018-05-02 |
Family
ID=57211390
Family Applications (3)
| Application Number | Title | Priority Date | Filing Date |
|---|---|---|---|
| EP16196384.8A Withdrawn EP3315991A1 (en) | 2016-10-28 | 2016-10-28 | Time of arrival (toa) measurements |
| EP17787930.1A Active EP3532861B1 (en) | 2016-10-28 | 2017-10-25 | Time of arrival (toa) measurements |
| EP24219842.2A Pending EP4542255A3 (en) | 2016-10-28 | 2017-10-25 | Time of arrival (toa) measurements |
Family Applications After (2)
| Application Number | Title | Priority Date | Filing Date |
|---|---|---|---|
| EP17787930.1A Active EP3532861B1 (en) | 2016-10-28 | 2017-10-25 | Time of arrival (toa) measurements |
| EP24219842.2A Pending EP4542255A3 (en) | 2016-10-28 | 2017-10-25 | Time of arrival (toa) measurements |
Country Status (6)
| Country | Link |
|---|---|
| US (1) | US11187775B2 (en) |
| EP (3) | EP3315991A1 (en) |
| JP (1) | JP6843234B2 (en) |
| CN (1) | CN110168396B (en) |
| ES (1) | ES3014236T3 (en) |
| WO (1) | WO2018077959A1 (en) |
Cited By (2)
| Publication number | Priority date | Publication date | Assignee | Title |
|---|---|---|---|---|
| EP3968049A1 (en) * | 2020-09-11 | 2022-03-16 | NXP USA, Inc. | Methods and apparatus for estimating a time-of-arrival or a distance between two devices |
| US20220171020A1 (en) * | 2020-12-01 | 2022-06-02 | Nordic Semiconductor Asa | Determining distance between two radio transceivers |
Families Citing this family (19)
| Publication number | Priority date | Publication date | Assignee | Title |
|---|---|---|---|---|
| US20210011151A1 (en) * | 2019-07-10 | 2021-01-14 | GM Global Technology Operations LLC | Radar range ambiguity resolution using multi-rate sampling |
| CN110554364B (en) * | 2019-08-30 | 2021-07-13 | 中国空间技术研究院 | A test system and method for measuring accuracy of radar signal pulse arrival time |
| US11297583B2 (en) * | 2020-03-03 | 2022-04-05 | Qualcomm Incorporated | Premium device-aided low-tier device group delay calibration for NR positioning |
| US11294024B2 (en) * | 2020-03-10 | 2022-04-05 | Deeyook Location Technologies Ltd. | System, apparatus, and/or method for determining a time of flight for one or more receivers and transmitters |
| US11297594B2 (en) * | 2020-05-29 | 2022-04-05 | At&T Intellectual Property I, L.P. | Automated cell location estimation and validation |
| JP7471194B2 (en) * | 2020-10-07 | 2024-04-19 | 株式会社日立製作所 | Entity relationship estimation device, entity relationship estimation method, and entity relationship estimation program |
| WO2021253018A2 (en) * | 2020-10-15 | 2021-12-16 | Futurewei Technologies, Inc. | Apparatus and methods for determining line of sight (los) from intensity measurements |
| CN112444800A (en) * | 2020-10-19 | 2021-03-05 | 中科传启(苏州)科技有限公司 | Correction method of ultrasonic distance measuring device |
| KR102602218B1 (en) * | 2020-10-23 | 2023-11-14 | 주식회사 우리별 | Mlat receiver precise time correction method |
| KR20230107884A (en) | 2020-11-30 | 2023-07-18 | 베이징 시아오미 모바일 소프트웨어 컴퍼니 리미티드 | LOCATION DETERMINATIONMETHOD AND APPARATUS, AND COMMUNICATION DEVICE |
| CN112946569B (en) * | 2021-02-01 | 2024-11-26 | Oppo广东移动通信有限公司 | Measurement distance correction method, device, medium and electronic equipment |
| US11943738B2 (en) * | 2021-03-03 | 2024-03-26 | Qualcomm Incorporated | Shared requirement for a double differential timing procedure |
| US12279178B2 (en) | 2021-05-17 | 2025-04-15 | At&T Intellectual Property I, L.P. | Automated cell azimuth estimation and validation |
| FR3129218B1 (en) * | 2021-11-18 | 2023-09-29 | Commissariat Energie Atomique | Method for determining a corrected distance |
| CN114689056B (en) * | 2022-04-08 | 2023-04-18 | 上海柯锐芯微电子有限公司 | Accurate ranging method based on UWB SS-TWR |
| CN114839641B (en) * | 2022-04-25 | 2025-12-12 | 安徽欧思微科技有限公司 | Ranging methods, devices, receiving equipment and storage media |
| US12498476B2 (en) * | 2023-01-11 | 2025-12-16 | Qualcomm Incorporated | Techniques for joint sidelink positioning |
| EP4418011A1 (en) * | 2023-02-20 | 2024-08-21 | Stichting IMEC Nederland | A method and a device for determining time duration for signal propagation |
| US20250264569A1 (en) * | 2024-02-20 | 2025-08-21 | Qualcomm Incorporated | Subsample configuration for positioning |
Citations (6)
| Publication number | Priority date | Publication date | Assignee | Title |
|---|---|---|---|---|
| US20030227895A1 (en) * | 2002-06-05 | 2003-12-11 | Strutt Guenael T. | System and method for improving the accuracy of time of arrival measurements in a wireless ad-hoc communications network |
| WO2004051302A1 (en) * | 2002-12-02 | 2004-06-17 | Nokia Corporation | Determination of the position of a pulse peak |
| WO2006063768A1 (en) | 2004-12-13 | 2006-06-22 | Fraunhofer-Gesellschaft zur Förderung der angewandten Forschung e.V. | Device and method for determining an arrival moment of a reception sequence |
| US20070121679A1 (en) * | 2005-11-30 | 2007-05-31 | Strutt Guenael J | Method and system for improving time of arrival (TOA) measurements in a wirless communication network |
| US20110207477A1 (en) * | 2010-02-25 | 2011-08-25 | Telefonaktiebolaget L M Ericsson (Publ) | Methods and Nodes in a Wireless Communication Network |
| US20120032855A1 (en) * | 2006-10-05 | 2012-02-09 | Ivan Reede | High-resolution ranging and location finding using multicarrier signals |
Family Cites Families (19)
| Publication number | Priority date | Publication date | Assignee | Title |
|---|---|---|---|---|
| US5828694A (en) * | 1996-07-01 | 1998-10-27 | Trimble Navigation Limited | Determination of multipath tracking error |
| US6118808A (en) | 1996-07-12 | 2000-09-12 | General Electric Company | GPS receiver with efficient signal acquisition |
| US6111536A (en) * | 1998-05-26 | 2000-08-29 | Time Domain Corporation | System and method for distance measurement by inphase and quadrature signals in a radio system |
| US6219345B1 (en) * | 1998-09-30 | 2001-04-17 | Conexant Systems, Inc. | Timing estimation in mobile communication systems using parabolic interpolator |
| GB0009830D0 (en) * | 2000-04-25 | 2000-06-07 | Koninkl Philips Electronics Nv | Time of arrival estimation for positioning systems |
| US7006556B2 (en) * | 2001-05-18 | 2006-02-28 | Global Locate, Inc. | Method and apparatus for performing signal correlation at multiple resolutions to mitigate multipath interference |
| US6804494B2 (en) * | 2001-06-11 | 2004-10-12 | Qualcomm Inc. | System and method for the detection and compensation of radio signal time of arrival errors |
| US7474994B2 (en) * | 2001-12-14 | 2009-01-06 | Qualcomm Incorporated | System and method for wireless signal time of arrival |
| JP2003198427A (en) * | 2001-12-28 | 2003-07-11 | Fujitsu Ltd | CDMA receiver |
| US7095813B2 (en) * | 2002-05-16 | 2006-08-22 | Qualcomm Incorporated | System and method for the detection and compensation of radio signal time of arrival errors |
| CN1592434A (en) * | 2003-09-04 | 2005-03-09 | 华为技术有限公司 | Method of estimating arrival time additing delay error |
| JP2008051681A (en) * | 2006-08-25 | 2008-03-06 | Seiko Epson Corp | POSITIONING DEVICE, ITS CONTROL METHOD, CONTROL PROGRAM, AND RECORDING MEDIUM |
| US7844280B2 (en) * | 2006-12-12 | 2010-11-30 | Trueposition, Inc. | Location of wideband OFDM transmitters with limited receiver bandwidth |
| US7391368B1 (en) * | 2007-03-06 | 2008-06-24 | Cisco Technology, Inc. | Determining the time of arrival of a wireless signal |
| JP2009186240A (en) * | 2008-02-04 | 2009-08-20 | Sumitomo Electric Ind Ltd | Receiving device, ranging system, positioning system, computer program, and reception time specifying method |
| JP2012518170A (en) * | 2009-02-13 | 2012-08-09 | テレフオンアクチーボラゲット エル エム エリクソン(パブル) | Method and apparatus for determining real time difference in location of mobile terminal |
| US8041336B2 (en) * | 2009-05-29 | 2011-10-18 | Itt Manufacturing Enterprises, Inc. | Methods and apparatus for accurately determining signal time of arrival |
| CN102508200B (en) * | 2011-11-16 | 2013-09-18 | 东南大学 | Plural spread spectrum signal TDOA (time difference of arrival) measuring method |
| CA2868257C (en) * | 2012-03-29 | 2019-04-09 | Rx Networks Inc. | Method and apparatus for determining a position of a gnss receiver |
-
2016
- 2016-10-28 EP EP16196384.8A patent/EP3315991A1/en not_active Withdrawn
-
2017
- 2017-10-25 ES ES17787930T patent/ES3014236T3/en active Active
- 2017-10-25 WO PCT/EP2017/077328 patent/WO2018077959A1/en not_active Ceased
- 2017-10-25 EP EP17787930.1A patent/EP3532861B1/en active Active
- 2017-10-25 EP EP24219842.2A patent/EP4542255A3/en active Pending
- 2017-10-25 JP JP2019522671A patent/JP6843234B2/en active Active
- 2017-10-25 CN CN201780081274.XA patent/CN110168396B/en active Active
-
2019
- 2019-04-25 US US16/395,127 patent/US11187775B2/en active Active
Patent Citations (8)
| Publication number | Priority date | Publication date | Assignee | Title |
|---|---|---|---|---|
| US20030227895A1 (en) * | 2002-06-05 | 2003-12-11 | Strutt Guenael T. | System and method for improving the accuracy of time of arrival measurements in a wireless ad-hoc communications network |
| US7054126B2 (en) | 2002-06-05 | 2006-05-30 | Meshnetworks, Inc. | System and method for improving the accuracy of time of arrival measurements in a wireless ad-hoc communications network |
| WO2004051302A1 (en) * | 2002-12-02 | 2004-06-17 | Nokia Corporation | Determination of the position of a pulse peak |
| WO2006063768A1 (en) | 2004-12-13 | 2006-06-22 | Fraunhofer-Gesellschaft zur Förderung der angewandten Forschung e.V. | Device and method for determining an arrival moment of a reception sequence |
| US20070121679A1 (en) * | 2005-11-30 | 2007-05-31 | Strutt Guenael J | Method and system for improving time of arrival (TOA) measurements in a wirless communication network |
| US7653004B2 (en) | 2005-11-30 | 2010-01-26 | Motorola, Inc. | Method and system for improving time of arrival (TOA) measurements in a wireless communication network |
| US20120032855A1 (en) * | 2006-10-05 | 2012-02-09 | Ivan Reede | High-resolution ranging and location finding using multicarrier signals |
| US20110207477A1 (en) * | 2010-02-25 | 2011-08-25 | Telefonaktiebolaget L M Ericsson (Publ) | Methods and Nodes in a Wireless Communication Network |
Non-Patent Citations (1)
| Title |
|---|
| KONIG S ET AL: "Precise time of flight measurements in IEEE 802.11 networks by cross-correlating the sampled signal with a continuous Barker code", MOBILE ADHOC AND SENSOR SYSTEMS (MASS), 2010 IEEE 7TH INTERNATIONAL CONFERENCE ON, IEEE, PISCATAWAY, NJ, USA, 8 November 2010 (2010-11-08), pages 642 - 649, XP031832058, ISBN: 978-1-4244-7488-2 * |
Cited By (6)
| Publication number | Priority date | Publication date | Assignee | Title |
|---|---|---|---|---|
| EP3968049A1 (en) * | 2020-09-11 | 2022-03-16 | NXP USA, Inc. | Methods and apparatus for estimating a time-of-arrival or a distance between two devices |
| US11621898B2 (en) | 2020-09-11 | 2023-04-04 | Nxp Usa, Inc. | Methods and apparatus for estimating a time-of-arrival or a distance between two device |
| US20220171020A1 (en) * | 2020-12-01 | 2022-06-02 | Nordic Semiconductor Asa | Determining distance between two radio transceivers |
| GB2601494A (en) * | 2020-12-01 | 2022-06-08 | Nordic Semiconductor Asa | Determining distance between two radio transceivers |
| EP4009076A1 (en) * | 2020-12-01 | 2022-06-08 | Nordic Semiconductor ASA | Determining distance between two radio transceivers |
| US12181600B2 (en) | 2020-12-01 | 2024-12-31 | Nordic Semiconductor Asa | Determining distance between two radio transceivers |
Also Published As
| Publication number | Publication date |
|---|---|
| JP6843234B2 (en) | 2021-03-17 |
| EP3532861A1 (en) | 2019-09-04 |
| EP4542255A3 (en) | 2025-07-09 |
| CN110168396B (en) | 2023-05-05 |
| CN110168396A (en) | 2019-08-23 |
| WO2018077959A1 (en) | 2018-05-03 |
| EP3532861B1 (en) | 2024-12-25 |
| US20190250241A1 (en) | 2019-08-15 |
| ES3014236T3 (en) | 2025-04-21 |
| JP2019537716A (en) | 2019-12-26 |
| US11187775B2 (en) | 2021-11-30 |
| EP4542255A2 (en) | 2025-04-23 |
Similar Documents
| Publication | Publication Date | Title |
|---|---|---|
| US11187775B2 (en) | Time of arrival (TOA) measurements | |
| US10859666B1 (en) | Method and system for radiofrequency localization of transmitting devices via a mesh network | |
| US12413385B2 (en) | Methods for time synchronization and localization in a mesh network | |
| EP1396092B1 (en) | System and method for the detection and compensation of radio signal time of arrival errors | |
| CN101568850B (en) | Portable, iterative geolocation of RF emitters | |
| US8199047B2 (en) | High-precision radio frequency ranging system | |
| US9213083B1 (en) | Hyperbolic positioning method using broadcast digital television signals and monitor receiver ranging | |
| WO2003107029A2 (en) | Improvements in radio positioning systems | |
| US9591609B1 (en) | Base station location derived from wireless terminal information | |
| US20250067833A1 (en) | Method and system for radiofrequency localization of transmitting devices via a mesh network | |
| Yan et al. | Asynchronous differential TDOA for non-GPS navigation using signals of opportunity | |
| AU2002305881B2 (en) | System and method of estimation of time of arrival | |
| EP2642312B1 (en) | Hardware-reduced system for TDOA-locating of radio frequency emitters | |
| US11102750B2 (en) | Positioning system based on distributed transmission and reception of Wi-Fi signals | |
| KR102041470B1 (en) | METHOD AND APPARATUS FOR eLoran-BASED TIME SYNCHRONIZATION | |
| HK40009957B (en) | Time of arrival (toa) measurements | |
| HK40009957A (en) | Time of arrival (toa) measurements | |
| US9408173B1 (en) | Base station timing derived from wireless terminal information |
Legal Events
| Date | Code | Title | Description |
|---|---|---|---|
| PUAI | Public reference made under article 153(3) epc to a published international application that has entered the european phase |
Free format text: ORIGINAL CODE: 0009012 |
|
| AK | Designated contracting states |
Kind code of ref document: A1 Designated state(s): AL AT BE BG CH CY CZ DE DK EE ES FI FR GB GR HR HU IE IS IT LI LT LU LV MC MK MT NL NO PL PT RO RS SE SI SK SM TR |
|
| AX | Request for extension of the european patent |
Extension state: BA ME |
|
| STAA | Information on the status of an ep patent application or granted ep patent |
Free format text: STATUS: THE APPLICATION IS DEEMED TO BE WITHDRAWN |
|
| 18D | Application deemed to be withdrawn |
Effective date: 20181103 |