EP3301192A1 - Breast tumour grading - Google Patents
Breast tumour grading Download PDFInfo
- Publication number
- EP3301192A1 EP3301192A1 EP17199243.1A EP17199243A EP3301192A1 EP 3301192 A1 EP3301192 A1 EP 3301192A1 EP 17199243 A EP17199243 A EP 17199243A EP 3301192 A1 EP3301192 A1 EP 3301192A1
- Authority
- EP
- European Patent Office
- Prior art keywords
- grade
- expression
- genbank accession
- tumour
- accession number
- Prior art date
- Legal status (The legal status is an assumption and is not a legal conclusion. Google has not performed a legal analysis and makes no representation as to the accuracy of the status listed.)
- Withdrawn
Links
- 206010028980 Neoplasm Diseases 0.000 title claims abstract description 395
- 210000000481 breast Anatomy 0.000 title claims abstract description 134
- 238000000034 method Methods 0.000 claims abstract description 291
- 230000014509 gene expression Effects 0.000 claims abstract description 227
- 101000942617 Homo sapiens Condensin complex subunit 2 Proteins 0.000 claims abstract description 21
- 102100032311 Aurora kinase A Human genes 0.000 claims abstract description 20
- 102100032951 Condensin complex subunit 2 Human genes 0.000 claims abstract description 19
- 102100024299 Maternal embryonic leucine zipper kinase Human genes 0.000 claims abstract description 18
- 101710154611 Maternal embryonic leucine zipper kinase Proteins 0.000 claims abstract description 18
- 239000002299 complementary DNA Substances 0.000 claims abstract description 18
- 238000000338 in vitro Methods 0.000 claims abstract description 16
- 101000798300 Homo sapiens Aurora kinase A Proteins 0.000 claims abstract description 13
- 108090000623 proteins and genes Proteins 0.000 claims description 261
- 230000004083 survival effect Effects 0.000 claims description 74
- 239000000523 sample Substances 0.000 claims description 69
- 238000002493 microarray Methods 0.000 claims description 46
- 206010006187 Breast cancer Diseases 0.000 claims description 39
- 208000026310 Breast neoplasm Diseases 0.000 claims description 39
- 238000004458 analytical method Methods 0.000 claims description 30
- 238000004422 calculation algorithm Methods 0.000 claims description 29
- 208000011580 syndromic disease Diseases 0.000 claims description 24
- 201000010099 disease Diseases 0.000 claims description 22
- 208000037265 diseases, disorders, signs and symptoms Diseases 0.000 claims description 22
- 238000005259 measurement Methods 0.000 claims description 22
- 238000011282 treatment Methods 0.000 claims description 22
- 238000010606 normalization Methods 0.000 claims description 16
- 238000003491 array Methods 0.000 claims description 12
- 238000009396 hybridization Methods 0.000 claims description 12
- 238000012545 processing Methods 0.000 claims description 11
- 238000010208 microarray analysis Methods 0.000 claims description 10
- 238000003753 real-time PCR Methods 0.000 claims description 8
- 238000001356 surgical procedure Methods 0.000 claims description 7
- 230000002068 genetic effect Effects 0.000 description 62
- 210000004027 cell Anatomy 0.000 description 51
- 206010001488 Aggression Diseases 0.000 description 40
- 238000002560 therapeutic procedure Methods 0.000 description 31
- 230000002962 histologic effect Effects 0.000 description 30
- 102000004169 proteins and genes Human genes 0.000 description 26
- 150000001875 compounds Chemical class 0.000 description 21
- 210000001165 lymph node Anatomy 0.000 description 19
- 230000002062 proliferating effect Effects 0.000 description 19
- 238000012549 training Methods 0.000 description 19
- 238000001514 detection method Methods 0.000 description 18
- 201000011510 cancer Diseases 0.000 description 17
- 108091032973 (ribonucleotides)n+m Proteins 0.000 description 15
- 102100038595 Estrogen receptor Human genes 0.000 description 14
- 108010038795 estrogen receptors Proteins 0.000 description 13
- 238000004393 prognosis Methods 0.000 description 12
- RJKFOVLPORLFTN-LEKSSAKUSA-N Progesterone Chemical compound C1CC2=CC(=O)CC[C@]2(C)[C@@H]2[C@@H]1[C@@H]1CC[C@H](C(=O)C)[C@@]1(C)CC2 RJKFOVLPORLFTN-LEKSSAKUSA-N 0.000 description 11
- 101000830894 Homo sapiens Targeting protein for Xklp2 Proteins 0.000 description 10
- 102100024813 Targeting protein for Xklp2 Human genes 0.000 description 10
- 238000013459 approach Methods 0.000 description 10
- 230000015572 biosynthetic process Effects 0.000 description 10
- 238000003745 diagnosis Methods 0.000 description 10
- 239000000203 mixture Substances 0.000 description 10
- 238000005192 partition Methods 0.000 description 10
- 230000035755 proliferation Effects 0.000 description 10
- 102000005962 receptors Human genes 0.000 description 10
- 108020003175 receptors Proteins 0.000 description 10
- 230000001225 therapeutic effect Effects 0.000 description 10
- 108020004414 DNA Proteins 0.000 description 9
- 230000022131 cell cycle Effects 0.000 description 9
- 230000000694 effects Effects 0.000 description 9
- 230000006870 function Effects 0.000 description 9
- 239000000463 material Substances 0.000 description 9
- 230000037361 pathway Effects 0.000 description 9
- 108090000765 processed proteins & peptides Proteins 0.000 description 9
- 150000003384 small molecules Chemical class 0.000 description 9
- 239000000126 substance Substances 0.000 description 9
- 230000008859 change Effects 0.000 description 8
- 102000004196 processed proteins & peptides Human genes 0.000 description 8
- 238000000638 solvent extraction Methods 0.000 description 8
- 238000009121 systemic therapy Methods 0.000 description 8
- 238000012360 testing method Methods 0.000 description 8
- 108090000461 Aurora Kinase A Proteins 0.000 description 7
- 102100024486 Borealin Human genes 0.000 description 7
- 102100025832 Centromere-associated protein E Human genes 0.000 description 7
- 241000282414 Homo sapiens Species 0.000 description 7
- 101000762405 Homo sapiens Borealin Proteins 0.000 description 7
- 101000914247 Homo sapiens Centromere-associated protein E Proteins 0.000 description 7
- 101000619112 Homo sapiens Proline-rich protein 11 Proteins 0.000 description 7
- 101000631713 Homo sapiens Signal peptide, CUB and EGF-like domain-containing protein 2 Proteins 0.000 description 7
- 102100040243 Microtubule-associated protein tau Human genes 0.000 description 7
- 102100022566 Proline-rich protein 11 Human genes 0.000 description 7
- 102100028932 Signal peptide, CUB and EGF-like domain-containing protein 2 Human genes 0.000 description 7
- 230000000875 corresponding effect Effects 0.000 description 7
- 239000003814 drug Substances 0.000 description 7
- 239000000543 intermediate Substances 0.000 description 7
- 108020004999 messenger RNA Proteins 0.000 description 7
- 230000000394 mitotic effect Effects 0.000 description 7
- 102000039446 nucleic acids Human genes 0.000 description 7
- 108020004707 nucleic acids Proteins 0.000 description 7
- 150000007523 nucleic acids Chemical class 0.000 description 7
- 210000004881 tumor cell Anatomy 0.000 description 7
- 208000005623 Carcinogenesis Diseases 0.000 description 6
- 101000891579 Homo sapiens Microtubule-associated protein tau Proteins 0.000 description 6
- 108091000080 Phosphotransferase Proteins 0.000 description 6
- 230000027455 binding Effects 0.000 description 6
- 230000031018 biological processes and functions Effects 0.000 description 6
- 230000036952 cancer formation Effects 0.000 description 6
- 231100000504 carcinogenesis Toxicity 0.000 description 6
- 239000000262 estrogen Substances 0.000 description 6
- 206010061289 metastatic neoplasm Diseases 0.000 description 6
- 102000020233 phosphotransferase Human genes 0.000 description 6
- 239000000186 progesterone Substances 0.000 description 6
- 229960003387 progesterone Drugs 0.000 description 6
- 238000011160 research Methods 0.000 description 6
- 238000003786 synthesis reaction Methods 0.000 description 6
- 102100025250 C-X-C motif chemokine 14 Human genes 0.000 description 5
- 102100024479 Cell division cycle-associated protein 3 Human genes 0.000 description 5
- 102100025064 Cellular tumor antigen p53 Human genes 0.000 description 5
- 102100036109 Dual specificity protein kinase TTK Human genes 0.000 description 5
- 102100021238 Dynamin-2 Human genes 0.000 description 5
- 101000640855 Homo sapiens 3-oxo-5-alpha-steroid 4-dehydrogenase 1 Proteins 0.000 description 5
- 101000858068 Homo sapiens C-X-C motif chemokine 14 Proteins 0.000 description 5
- 101000980907 Homo sapiens Cell division cycle-associated protein 3 Proteins 0.000 description 5
- 101000659223 Homo sapiens Dual specificity protein kinase TTK Proteins 0.000 description 5
- 101000817607 Homo sapiens Dynamin-2 Proteins 0.000 description 5
- 101000931462 Homo sapiens Protein FosB Proteins 0.000 description 5
- 101000861454 Homo sapiens Protein c-Fos Proteins 0.000 description 5
- 102000029749 Microtubule Human genes 0.000 description 5
- 108091022875 Microtubule Proteins 0.000 description 5
- 108700020796 Oncogene Proteins 0.000 description 5
- 102100020847 Protein FosB Human genes 0.000 description 5
- 102100027584 Protein c-Fos Human genes 0.000 description 5
- 102100030510 Stanniocalcin-2 Human genes 0.000 description 5
- 241000269368 Xenopus laevis Species 0.000 description 5
- 210000003483 chromatin Anatomy 0.000 description 5
- 238000005516 engineering process Methods 0.000 description 5
- 230000001394 metastastic effect Effects 0.000 description 5
- 210000004688 microtubule Anatomy 0.000 description 5
- 230000004879 molecular function Effects 0.000 description 5
- 230000006654 negative regulation of apoptotic process Effects 0.000 description 5
- 238000012216 screening Methods 0.000 description 5
- 238000007619 statistical method Methods 0.000 description 5
- 238000013517 stratification Methods 0.000 description 5
- 210000005239 tubule Anatomy 0.000 description 5
- 238000010200 validation analysis Methods 0.000 description 5
- 230000003612 virological effect Effects 0.000 description 5
- 102100033393 Anillin Human genes 0.000 description 4
- IJGRMHOSHXDMSA-UHFFFAOYSA-N Atomic nitrogen Chemical compound N#N IJGRMHOSHXDMSA-UHFFFAOYSA-N 0.000 description 4
- 102100023444 Centromere protein K Human genes 0.000 description 4
- 108010077544 Chromatin Proteins 0.000 description 4
- 102100023774 Cold-inducible RNA-binding protein Human genes 0.000 description 4
- 102100032020 EH domain-containing protein 2 Human genes 0.000 description 4
- 102100023374 Forkhead box protein M1 Human genes 0.000 description 4
- 102100037858 G1/S-specific cyclin-E1 Human genes 0.000 description 4
- 102100021023 Gamma-glutamyl hydrolase Human genes 0.000 description 4
- 108010033040 Histones Proteins 0.000 description 4
- 101000732632 Homo sapiens Anillin Proteins 0.000 description 4
- 101000907931 Homo sapiens Centromere protein K Proteins 0.000 description 4
- 101000921226 Homo sapiens EH domain-containing protein 2 Proteins 0.000 description 4
- 101000738568 Homo sapiens G1/S-specific cyclin-E1 Proteins 0.000 description 4
- 101000593405 Homo sapiens Myb-related protein B Proteins 0.000 description 4
- 101000817237 Homo sapiens Protein ECT2 Proteins 0.000 description 4
- 101000980900 Homo sapiens Sororin Proteins 0.000 description 4
- 101000701446 Homo sapiens Stanniocalcin-2 Proteins 0.000 description 4
- 102100026632 Mimecan Human genes 0.000 description 4
- 102100034670 Myb-related protein B Human genes 0.000 description 4
- 102100040437 Protein ECT2 Human genes 0.000 description 4
- 102100033947 Protein regulator of cytokinesis 1 Human genes 0.000 description 4
- 102100038427 RNA-binding protein Nova-1 Human genes 0.000 description 4
- 102100024483 Sororin Human genes 0.000 description 4
- NKANXQFJJICGDU-QPLCGJKRSA-N Tamoxifen Chemical compound C=1C=CC=CC=1C(/CC)=C(C=1C=CC(OCCN(C)C)=CC=1)/C1=CC=CC=C1 NKANXQFJJICGDU-QPLCGJKRSA-N 0.000 description 4
- 102000040945 Transcription factor Human genes 0.000 description 4
- 108091023040 Transcription factor Proteins 0.000 description 4
- 102000005789 Vascular Endothelial Growth Factors Human genes 0.000 description 4
- 108010019530 Vascular Endothelial Growth Factors Proteins 0.000 description 4
- 238000009098 adjuvant therapy Methods 0.000 description 4
- 230000009087 cell motility Effects 0.000 description 4
- 230000004663 cell proliferation Effects 0.000 description 4
- 238000010276 construction Methods 0.000 description 4
- 229940079593 drug Drugs 0.000 description 4
- 238000003560 gene expression detection method Methods 0.000 description 4
- 230000012010 growth Effects 0.000 description 4
- 238000003018 immunoassay Methods 0.000 description 4
- NOESYZHRGYRDHS-UHFFFAOYSA-N insulin Chemical compound N1C(=O)C(NC(=O)C(CCC(N)=O)NC(=O)C(CCC(O)=O)NC(=O)C(C(C)C)NC(=O)C(NC(=O)CN)C(C)CC)CSSCC(C(NC(CO)C(=O)NC(CC(C)C)C(=O)NC(CC=2C=CC(O)=CC=2)C(=O)NC(CCC(N)=O)C(=O)NC(CC(C)C)C(=O)NC(CCC(O)=O)C(=O)NC(CC(N)=O)C(=O)NC(CC=2C=CC(O)=CC=2)C(=O)NC(CSSCC(NC(=O)C(C(C)C)NC(=O)C(CC(C)C)NC(=O)C(CC=2C=CC(O)=CC=2)NC(=O)C(CC(C)C)NC(=O)C(C)NC(=O)C(CCC(O)=O)NC(=O)C(C(C)C)NC(=O)C(CC(C)C)NC(=O)C(CC=2NC=NC=2)NC(=O)C(CO)NC(=O)CNC2=O)C(=O)NCC(=O)NC(CCC(O)=O)C(=O)NC(CCCNC(N)=N)C(=O)NCC(=O)NC(CC=3C=CC=CC=3)C(=O)NC(CC=3C=CC=CC=3)C(=O)NC(CC=3C=CC(O)=CC=3)C(=O)NC(C(C)O)C(=O)N3C(CCC3)C(=O)NC(CCCCN)C(=O)NC(C)C(O)=O)C(=O)NC(CC(N)=O)C(O)=O)=O)NC(=O)C(C(C)CC)NC(=O)C(CO)NC(=O)C(C(C)O)NC(=O)C1CSSCC2NC(=O)C(CC(C)C)NC(=O)C(NC(=O)C(CCC(N)=O)NC(=O)C(CC(N)=O)NC(=O)C(NC(=O)C(N)CC=1C=CC=CC=1)C(C)C)CC1=CN=CN1 NOESYZHRGYRDHS-UHFFFAOYSA-N 0.000 description 4
- 208000030776 invasive breast carcinoma Diseases 0.000 description 4
- 230000011278 mitosis Effects 0.000 description 4
- 238000000491 multivariate analysis Methods 0.000 description 4
- 238000004806 packaging method and process Methods 0.000 description 4
- 229920001184 polypeptide Polymers 0.000 description 4
- 239000000047 product Substances 0.000 description 4
- 238000007634 remodeling Methods 0.000 description 4
- 238000000926 separation method Methods 0.000 description 4
- 230000002103 transcriptional effect Effects 0.000 description 4
- 241000271566 Aves Species 0.000 description 3
- 102100021663 Baculoviral IAP repeat-containing protein 5 Human genes 0.000 description 3
- 108010012236 Chemokines Proteins 0.000 description 3
- 102000019034 Chemokines Human genes 0.000 description 3
- 102100024203 Collagen alpha-1(XIV) chain Human genes 0.000 description 3
- 102100026398 Cyclic AMP-responsive element-binding protein 3 Human genes 0.000 description 3
- 102100032857 Cyclin-dependent kinase 1 Human genes 0.000 description 3
- 102100034770 Cyclin-dependent kinase inhibitor 3 Human genes 0.000 description 3
- 102100033167 Elastin Human genes 0.000 description 3
- LFQSCWFLJHTTHZ-UHFFFAOYSA-N Ethanol Chemical compound CCO LFQSCWFLJHTTHZ-UHFFFAOYSA-N 0.000 description 3
- 102000003688 G-Protein-Coupled Receptors Human genes 0.000 description 3
- 108090000045 G-Protein-Coupled Receptors Proteins 0.000 description 3
- 101000721661 Homo sapiens Cellular tumor antigen p53 Proteins 0.000 description 3
- 101000906744 Homo sapiens Cold-inducible RNA-binding protein Proteins 0.000 description 3
- 101000855520 Homo sapiens Cyclic AMP-responsive element-binding protein 3 Proteins 0.000 description 3
- 101000868333 Homo sapiens Cyclin-dependent kinase 1 Proteins 0.000 description 3
- 101000907578 Homo sapiens Forkhead box protein M1 Proteins 0.000 description 3
- 101000957259 Homo sapiens Mitotic spindle assembly checkpoint protein MAD2A Proteins 0.000 description 3
- 101000604114 Homo sapiens RNA-binding protein Nova-1 Proteins 0.000 description 3
- 102100030536 Kinetochore protein Spc24 Human genes 0.000 description 3
- 101710184619 Kinetochore protein Spc24 Proteins 0.000 description 3
- 238000003657 Likelihood-ratio test Methods 0.000 description 3
- 206010027476 Metastases Diseases 0.000 description 3
- 102100038792 Mitotic spindle assembly checkpoint protein MAD2A Human genes 0.000 description 3
- 102100039902 Plasma membrane ascorbate-dependent reductase CYBRD1 Human genes 0.000 description 3
- 102100025803 Progesterone receptor Human genes 0.000 description 3
- 230000018199 S phase Effects 0.000 description 3
- 239000012190 activator Substances 0.000 description 3
- 150000001413 amino acids Chemical class 0.000 description 3
- 230000003321 amplification Effects 0.000 description 3
- 230000008901 benefit Effects 0.000 description 3
- 230000024245 cell differentiation Effects 0.000 description 3
- 230000001413 cellular effect Effects 0.000 description 3
- 238000012937 correction Methods 0.000 description 3
- 238000009795 derivation Methods 0.000 description 3
- 238000013461 design Methods 0.000 description 3
- 230000004069 differentiation Effects 0.000 description 3
- 229940011871 estrogen Drugs 0.000 description 3
- 238000010195 expression analysis Methods 0.000 description 3
- -1 for example Proteins 0.000 description 3
- 230000003054 hormonal effect Effects 0.000 description 3
- 230000001900 immune effect Effects 0.000 description 3
- 230000003993 interaction Effects 0.000 description 3
- 230000004048 modification Effects 0.000 description 3
- 238000012986 modification Methods 0.000 description 3
- 230000000877 morphologic effect Effects 0.000 description 3
- 238000003199 nucleic acid amplification method Methods 0.000 description 3
- 231100000590 oncogenic Toxicity 0.000 description 3
- 230000002246 oncogenic effect Effects 0.000 description 3
- 238000003752 polymerase chain reaction Methods 0.000 description 3
- 230000002265 prevention Effects 0.000 description 3
- 230000008569 process Effects 0.000 description 3
- 108090000468 progesterone receptors Proteins 0.000 description 3
- 238000000746 purification Methods 0.000 description 3
- 230000022983 regulation of cell cycle Effects 0.000 description 3
- 230000003362 replicative effect Effects 0.000 description 3
- 230000004044 response Effects 0.000 description 3
- 238000012163 sequencing technique Methods 0.000 description 3
- 239000007790 solid phase Substances 0.000 description 3
- 210000001519 tissue Anatomy 0.000 description 3
- 230000006444 vascular growth Effects 0.000 description 3
- 101150033839 4 gene Proteins 0.000 description 2
- 101150101112 7 gene Proteins 0.000 description 2
- 108050000246 AAA domains Proteins 0.000 description 2
- 102100024387 AF4/FMR2 family member 3 Human genes 0.000 description 2
- 101710184661 AF4/FMR2 family member 3 Proteins 0.000 description 2
- 102100039864 ATPase family AAA domain-containing protein 2 Human genes 0.000 description 2
- 108091006112 ATPases Proteins 0.000 description 2
- 102000057290 Adenosine Triphosphatases Human genes 0.000 description 2
- 108020005544 Antisense RNA Proteins 0.000 description 2
- 102100039409 Axonemal dynein light intermediate polypeptide 1 Human genes 0.000 description 2
- 201000009030 Carcinoma Diseases 0.000 description 2
- 102100038099 Cell division cycle protein 20 homolog Human genes 0.000 description 2
- 102000011682 Centromere Protein A Human genes 0.000 description 2
- 108010076303 Centromere Protein A Proteins 0.000 description 2
- 102100033686 Cilia- and flagella-associated protein 70 Human genes 0.000 description 2
- 102000004057 Claudin-5 Human genes 0.000 description 2
- 108090000582 Claudin-5 Proteins 0.000 description 2
- 102100032952 Condensin complex subunit 3 Human genes 0.000 description 2
- 101710157591 Cyclin-dependent kinase inhibitor 3 Proteins 0.000 description 2
- 102100037753 DEP domain-containing protein 1A Human genes 0.000 description 2
- 230000004543 DNA replication Effects 0.000 description 2
- 102100033720 DNA replication licensing factor MCM6 Human genes 0.000 description 2
- 102100033587 DNA topoisomerase 2-alpha Human genes 0.000 description 2
- 102100028735 Dachshund homolog 1 Human genes 0.000 description 2
- 206010061819 Disease recurrence Diseases 0.000 description 2
- 102100030011 Endoribonuclease Human genes 0.000 description 2
- 101710199605 Endoribonuclease Proteins 0.000 description 2
- 102100030881 Enoyl-CoA hydratase domain-containing protein 2, mitochondrial Human genes 0.000 description 2
- 108010037362 Extracellular Matrix Proteins Proteins 0.000 description 2
- 102000010834 Extracellular Matrix Proteins Human genes 0.000 description 2
- 102100037854 G1/S-specific cyclin-E2 Human genes 0.000 description 2
- 102100037488 G2 and S phase-expressed protein 1 Human genes 0.000 description 2
- 102100032340 G2/mitotic-specific cyclin-B1 Human genes 0.000 description 2
- 101000887284 Homo sapiens ATPase family AAA domain-containing protein 2 Proteins 0.000 description 2
- 101001036313 Homo sapiens Axonemal dynein light intermediate polypeptide 1 Proteins 0.000 description 2
- 101000944483 Homo sapiens Cilia- and flagella-associated protein 70 Proteins 0.000 description 2
- 101000909626 Homo sapiens Collagen alpha-1(XIV) chain Proteins 0.000 description 2
- 101000942622 Homo sapiens Condensin complex subunit 3 Proteins 0.000 description 2
- 101000950642 Homo sapiens DEP domain-containing protein 1A Proteins 0.000 description 2
- 101001018484 Homo sapiens DNA replication licensing factor MCM6 Proteins 0.000 description 2
- 101000801505 Homo sapiens DNA topoisomerase 2-alpha Proteins 0.000 description 2
- 101000915055 Homo sapiens Dachshund homolog 1 Proteins 0.000 description 2
- 101000919883 Homo sapiens Enoyl-CoA hydratase domain-containing protein 2, mitochondrial Proteins 0.000 description 2
- 101000738575 Homo sapiens G1/S-specific cyclin-E2 Proteins 0.000 description 2
- 101001026457 Homo sapiens G2 and S phase-expressed protein 1 Proteins 0.000 description 2
- 101000868643 Homo sapiens G2/mitotic-specific cyclin-B1 Proteins 0.000 description 2
- 101001075374 Homo sapiens Gamma-glutamyl hydrolase Proteins 0.000 description 2
- 101001081176 Homo sapiens Hyaluronan mediated motility receptor Proteins 0.000 description 2
- 101001008949 Homo sapiens Kinesin-like protein KIF14 Proteins 0.000 description 2
- 101001043562 Homo sapiens Low-density lipoprotein receptor-related protein 2 Proteins 0.000 description 2
- 101000896657 Homo sapiens Mitotic checkpoint serine/threonine-protein kinase BUB1 Proteins 0.000 description 2
- 101000991410 Homo sapiens Nucleolar and spindle-associated protein 1 Proteins 0.000 description 2
- 101000745252 Homo sapiens Plasma membrane ascorbate-dependent reductase CYBRD1 Proteins 0.000 description 2
- 101000945496 Homo sapiens Proliferation marker protein Ki-67 Proteins 0.000 description 2
- 101000583797 Homo sapiens Protein MCM10 homolog Proteins 0.000 description 2
- 101000575639 Homo sapiens Ribonucleoside-diphosphate reductase subunit M2 Proteins 0.000 description 2
- 101000837581 Homo sapiens Ubiquitin-conjugating enzyme E2 T Proteins 0.000 description 2
- 102100027735 Hyaluronan mediated motility receptor Human genes 0.000 description 2
- 102000004877 Insulin Human genes 0.000 description 2
- 108090001061 Insulin Proteins 0.000 description 2
- 102100037852 Insulin-like growth factor I Human genes 0.000 description 2
- XEEYBQQBJWHFJM-UHFFFAOYSA-N Iron Chemical compound [Fe] XEEYBQQBJWHFJM-UHFFFAOYSA-N 0.000 description 2
- 102100023133 Jupiter microtubule associated homolog 1 Human genes 0.000 description 2
- 102100027631 Kinesin-like protein KIF14 Human genes 0.000 description 2
- 108010058141 LDL-Receptor Related Proteins Proteins 0.000 description 2
- 102000006259 LDL-Receptor Related Proteins Human genes 0.000 description 2
- 102100021922 Low-density lipoprotein receptor-related protein 2 Human genes 0.000 description 2
- 108091054455 MAP kinase family Proteins 0.000 description 2
- 102000043136 MAP kinase family Human genes 0.000 description 2
- 238000000585 Mann–Whitney U test Methods 0.000 description 2
- 108091013859 Mimecan Proteins 0.000 description 2
- 102100021691 Mitotic checkpoint serine/threonine-protein kinase BUB1 Human genes 0.000 description 2
- 102000007399 Nuclear hormone receptor Human genes 0.000 description 2
- 108020005497 Nuclear hormone receptor Proteins 0.000 description 2
- 102100030991 Nucleolar and spindle-associated protein 1 Human genes 0.000 description 2
- 108091034117 Oligonucleotide Proteins 0.000 description 2
- 102100034836 Proliferation marker protein Ki-67 Human genes 0.000 description 2
- 102100030962 Protein MCM10 homolog Human genes 0.000 description 2
- 102100026006 Ribonucleoside-diphosphate reductase subunit M2 Human genes 0.000 description 2
- 240000004808 Saccharomyces cerevisiae Species 0.000 description 2
- 101710113029 Serine/threonine-protein kinase Proteins 0.000 description 2
- 241000252794 Sphinx Species 0.000 description 2
- 108010002687 Survivin Proteins 0.000 description 2
- 102100028705 Ubiquitin-conjugating enzyme E2 T Human genes 0.000 description 2
- 238000007792 addition Methods 0.000 description 2
- 239000002671 adjuvant Substances 0.000 description 2
- 230000002491 angiogenic effect Effects 0.000 description 2
- 230000000692 anti-sense effect Effects 0.000 description 2
- 230000006907 apoptotic process Effects 0.000 description 2
- 238000003556 assay Methods 0.000 description 2
- 239000011324 bead Substances 0.000 description 2
- 150000001720 carbohydrates Chemical class 0.000 description 2
- 235000014633 carbohydrates Nutrition 0.000 description 2
- 102000022628 chromatin binding proteins Human genes 0.000 description 2
- 108091013410 chromatin binding proteins Proteins 0.000 description 2
- 230000024321 chromosome segregation Effects 0.000 description 2
- 239000003184 complementary RNA Substances 0.000 description 2
- 230000002596 correlated effect Effects 0.000 description 2
- 238000002790 cross-validation Methods 0.000 description 2
- 230000021953 cytokinesis Effects 0.000 description 2
- 230000034994 death Effects 0.000 description 2
- 230000001419 dependent effect Effects 0.000 description 2
- 230000018109 developmental process Effects 0.000 description 2
- 238000009826 distribution Methods 0.000 description 2
- 210000002744 extracellular matrix Anatomy 0.000 description 2
- 108010062699 gamma-Glutamyl Hydrolase Proteins 0.000 description 2
- 230000006882 induction of apoptosis Effects 0.000 description 2
- 229940125396 insulin Drugs 0.000 description 2
- 239000007788 liquid Substances 0.000 description 2
- 230000036210 malignancy Effects 0.000 description 2
- 230000003211 malignant effect Effects 0.000 description 2
- 238000007726 management method Methods 0.000 description 2
- 239000003550 marker Substances 0.000 description 2
- 230000001404 mediated effect Effects 0.000 description 2
- 230000021121 meiosis Effects 0.000 description 2
- 230000004060 metabolic process Effects 0.000 description 2
- 230000035772 mutation Effects 0.000 description 2
- 230000000869 mutational effect Effects 0.000 description 2
- 229910052757 nitrogen Inorganic materials 0.000 description 2
- 238000002515 oligonucleotide synthesis Methods 0.000 description 2
- 239000002245 particle Substances 0.000 description 2
- 230000000144 pharmacologic effect Effects 0.000 description 2
- 238000013439 planning Methods 0.000 description 2
- 230000026447 protein localization Effects 0.000 description 2
- 230000018883 protein targeting Effects 0.000 description 2
- 230000001105 regulatory effect Effects 0.000 description 2
- 230000003938 response to stress Effects 0.000 description 2
- 238000010187 selection method Methods 0.000 description 2
- 230000035945 sensitivity Effects 0.000 description 2
- 239000007787 solid Substances 0.000 description 2
- 229960001603 tamoxifen Drugs 0.000 description 2
- 230000000381 tumorigenic effect Effects 0.000 description 2
- 230000006663 ubiquitin-proteasome pathway Effects 0.000 description 2
- 239000013598 vector Substances 0.000 description 2
- 101150084750 1 gene Proteins 0.000 description 1
- 101150016096 17 gene Proteins 0.000 description 1
- 101150028074 2 gene Proteins 0.000 description 1
- 101150090724 3 gene Proteins 0.000 description 1
- 102100034254 3-oxo-5-alpha-steroid 4-dehydrogenase 1 Human genes 0.000 description 1
- RSJCLODJSVZNQA-BQYQJAHWSA-N 4-[2-[4-[(e)-3-ethoxyprop-1-enyl]phenyl]-4-[4-(propan-2-ylamino)phenyl]-1h-imidazol-5-yl]-n-propan-2-ylaniline Chemical compound C1=CC(/C=C/COCC)=CC=C1C1=NC(C=2C=CC(NC(C)C)=CC=2)=C(C=2C=CC(NC(C)C)=CC=2)N1 RSJCLODJSVZNQA-BQYQJAHWSA-N 0.000 description 1
- 101150096316 5 gene Proteins 0.000 description 1
- WOVKYSAHUYNSMH-RRKCRQDMSA-N 5-bromodeoxyuridine Chemical compound C1[C@H](O)[C@@H](CO)O[C@H]1N1C(=O)NC(=O)C(Br)=C1 WOVKYSAHUYNSMH-RRKCRQDMSA-N 0.000 description 1
- 101150039504 6 gene Proteins 0.000 description 1
- 208000030507 AIDS Diseases 0.000 description 1
- 102000015936 AP-1 transcription factor Human genes 0.000 description 1
- 108050004195 AP-1 transcription factor Proteins 0.000 description 1
- 102100029325 ATP-dependent DNA helicase PIF1 Human genes 0.000 description 1
- 102100033404 Acidic leucine-rich nuclear phosphoprotein 32 family member E Human genes 0.000 description 1
- 102100023003 Ankyrin repeat domain-containing protein 30A Human genes 0.000 description 1
- 108020004491 Antisense DNA Proteins 0.000 description 1
- 102100021569 Apoptosis regulator Bcl-2 Human genes 0.000 description 1
- 108091023037 Aptamer Proteins 0.000 description 1
- 102100029464 Aquaporin-9 Human genes 0.000 description 1
- 102000006809 Arylamine N-Acetyltransferase Human genes 0.000 description 1
- 108020005224 Arylamine N-acetyltransferase Proteins 0.000 description 1
- 102100032306 Aurora kinase B Human genes 0.000 description 1
- 229940122155 Bradykinin receptor antagonist Drugs 0.000 description 1
- 102100023701 C-C motif chemokine 18 Human genes 0.000 description 1
- 102100025248 C-X-C motif chemokine 10 Human genes 0.000 description 1
- 102100025279 C-X-C motif chemokine 11 Human genes 0.000 description 1
- 108700020472 CDC20 Proteins 0.000 description 1
- 102100022210 COX assembly mitochondrial protein 2 homolog Human genes 0.000 description 1
- 102100039196 CX3C chemokine receptor 1 Human genes 0.000 description 1
- 101100004287 Caenorhabditis elegans best-6 gene Proteins 0.000 description 1
- 102100036419 Calmodulin-like protein 5 Human genes 0.000 description 1
- CURLTUGMZLYLDI-UHFFFAOYSA-N Carbon dioxide Chemical compound O=C=O CURLTUGMZLYLDI-UHFFFAOYSA-N 0.000 description 1
- 208000009458 Carcinoma in Situ Diseases 0.000 description 1
- 108010078791 Carrier Proteins Proteins 0.000 description 1
- 101150023302 Cdc20 gene Proteins 0.000 description 1
- 102100024485 Cell division cycle-associated protein 7 Human genes 0.000 description 1
- 102100023343 Centromere protein I Human genes 0.000 description 1
- 102100035366 Centromere protein M Human genes 0.000 description 1
- 102100031219 Centrosomal protein of 55 kDa Human genes 0.000 description 1
- 101800001299 Cerebellin Proteins 0.000 description 1
- 102400001244 Cerebellin Human genes 0.000 description 1
- 241001227713 Chiron Species 0.000 description 1
- 102100032920 Chromobox protein homolog 2 Human genes 0.000 description 1
- 102100020736 Chromosome-associated kinesin KIF4A Human genes 0.000 description 1
- 102100033682 Cilia- and flagella-associated protein 69 Human genes 0.000 description 1
- 102100038446 Claudin-5 Human genes 0.000 description 1
- 101710164904 Cold-inducible RNA-binding protein Proteins 0.000 description 1
- 101710106877 Collagen alpha-1(XIV) chain Proteins 0.000 description 1
- 102100021507 Costars family protein ABRACL Human genes 0.000 description 1
- 102000003909 Cyclin E Human genes 0.000 description 1
- 108090000257 Cyclin E Proteins 0.000 description 1
- 102100025191 Cyclin-A2 Human genes 0.000 description 1
- 102100032522 Cyclin-dependent kinases regulatory subunit 2 Human genes 0.000 description 1
- 102100022027 Cytochrome P450 4X1 Human genes 0.000 description 1
- 102100022034 Cytochrome P450 4Z1 Human genes 0.000 description 1
- 102000004127 Cytokines Human genes 0.000 description 1
- 108090000695 Cytokines Proteins 0.000 description 1
- 102100037810 DEP domain-containing protein 1B Human genes 0.000 description 1
- 238000007399 DNA isolation Methods 0.000 description 1
- 238000000018 DNA microarray Methods 0.000 description 1
- 102100029905 DNA polymerase epsilon subunit 3 Human genes 0.000 description 1
- 239000003298 DNA probe Substances 0.000 description 1
- 238000012270 DNA recombination Methods 0.000 description 1
- 102100022928 DNA repair protein RAD51 homolog 1 Human genes 0.000 description 1
- 102100036218 DNA replication complex GINS protein PSF2 Human genes 0.000 description 1
- 102100025450 DNA replication factor Cdt1 Human genes 0.000 description 1
- 101710167406 DNA replication factor Cdt1 Proteins 0.000 description 1
- 102100030960 DNA replication licensing factor MCM2 Human genes 0.000 description 1
- 102100021389 DNA replication licensing factor MCM4 Human genes 0.000 description 1
- 230000006820 DNA synthesis Effects 0.000 description 1
- 108010053770 Deoxyribonucleases Proteins 0.000 description 1
- 102000016911 Deoxyribonucleases Human genes 0.000 description 1
- 102100037980 Disks large-associated protein 5 Human genes 0.000 description 1
- 102100032246 Double zinc ribbon and ankyrin repeat-containing protein 1 Human genes 0.000 description 1
- 241000255581 Drosophila <fruit fly, genus> Species 0.000 description 1
- 206010059866 Drug resistance Diseases 0.000 description 1
- 102100034428 Dual specificity protein phosphatase 1 Human genes 0.000 description 1
- 102100024739 E3 ubiquitin-protein ligase UHRF1 Human genes 0.000 description 1
- 238000002965 ELISA Methods 0.000 description 1
- 102100023226 Early growth response protein 1 Human genes 0.000 description 1
- 108010014258 Elastin Proteins 0.000 description 1
- 108010067770 Endopeptidase K Proteins 0.000 description 1
- 102000004190 Enzymes Human genes 0.000 description 1
- 108090000790 Enzymes Proteins 0.000 description 1
- 102100031005 Epididymal sperm-binding protein 1 Human genes 0.000 description 1
- 102000044591 ErbB-4 Receptor Human genes 0.000 description 1
- 102100029075 Exonuclease 1 Human genes 0.000 description 1
- 102100024516 F-box only protein 5 Human genes 0.000 description 1
- 102100034554 Fanconi anemia group I protein Human genes 0.000 description 1
- 102100034553 Fanconi anemia group J protein Human genes 0.000 description 1
- 238000000729 Fisher's exact test Methods 0.000 description 1
- 102100035047 Flavin-containing monooxygenase 5 Human genes 0.000 description 1
- 108010008599 Forkhead Box Protein M1 Proteins 0.000 description 1
- 102100033201 G2/mitotic-specific cyclin-B2 Human genes 0.000 description 1
- 102100031158 GAS2-like protein 3 Human genes 0.000 description 1
- 208000031448 Genomic Instability Diseases 0.000 description 1
- 102100027618 Heme transporter HRG1 Human genes 0.000 description 1
- 102100024025 Heparanase Human genes 0.000 description 1
- 102100028896 Heterogeneous nuclear ribonucleoprotein Q Human genes 0.000 description 1
- 102100022130 High mobility group protein B3 Human genes 0.000 description 1
- 102100029009 High mobility group protein HMG-I/HMG-Y Human genes 0.000 description 1
- 102100023919 Histone H2A.Z Human genes 0.000 description 1
- 102100034523 Histone H4 Human genes 0.000 description 1
- 102100022107 Holliday junction recognition protein Human genes 0.000 description 1
- 101001125842 Homo sapiens ATP-dependent DNA helicase PIF1 Proteins 0.000 description 1
- 101000732665 Homo sapiens Acidic leucine-rich nuclear phosphoprotein 32 family member E Proteins 0.000 description 1
- 101000757191 Homo sapiens Ankyrin repeat domain-containing protein 30A Proteins 0.000 description 1
- 101000971171 Homo sapiens Apoptosis regulator Bcl-2 Proteins 0.000 description 1
- 101000771413 Homo sapiens Aquaporin-9 Proteins 0.000 description 1
- 101000884385 Homo sapiens Arylamine N-acetyltransferase 1 Proteins 0.000 description 1
- 101000798306 Homo sapiens Aurora kinase B Proteins 0.000 description 1
- 101000896234 Homo sapiens Baculoviral IAP repeat-containing protein 5 Proteins 0.000 description 1
- 101000978371 Homo sapiens C-C motif chemokine 18 Proteins 0.000 description 1
- 101000858088 Homo sapiens C-X-C motif chemokine 10 Proteins 0.000 description 1
- 101000858060 Homo sapiens C-X-C motif chemokine 11 Proteins 0.000 description 1
- 101000900446 Homo sapiens COX assembly mitochondrial protein 2 homolog Proteins 0.000 description 1
- 101000746022 Homo sapiens CX3C chemokine receptor 1 Proteins 0.000 description 1
- 101000714353 Homo sapiens Calmodulin-like protein 5 Proteins 0.000 description 1
- 101000884317 Homo sapiens Cell division cycle protein 20 homolog Proteins 0.000 description 1
- 101000980893 Homo sapiens Cell division cycle-associated protein 7 Proteins 0.000 description 1
- 101000907944 Homo sapiens Centromere protein I Proteins 0.000 description 1
- 101000737696 Homo sapiens Centromere protein M Proteins 0.000 description 1
- 101000776447 Homo sapiens Centrosomal protein of 55 kDa Proteins 0.000 description 1
- 101000797586 Homo sapiens Chromobox protein homolog 2 Proteins 0.000 description 1
- 101001139157 Homo sapiens Chromosome-associated kinesin KIF4A Proteins 0.000 description 1
- 101000944490 Homo sapiens Cilia- and flagella-associated protein 69 Proteins 0.000 description 1
- 101000882896 Homo sapiens Claudin-5 Proteins 0.000 description 1
- 101000677808 Homo sapiens Costars family protein ABRACL Proteins 0.000 description 1
- 101000934320 Homo sapiens Cyclin-A2 Proteins 0.000 description 1
- 101000945639 Homo sapiens Cyclin-dependent kinase inhibitor 3 Proteins 0.000 description 1
- 101000942317 Homo sapiens Cyclin-dependent kinases regulatory subunit 2 Proteins 0.000 description 1
- 101000896948 Homo sapiens Cytochrome P450 4X1 Proteins 0.000 description 1
- 101000896935 Homo sapiens Cytochrome P450 4Z1 Proteins 0.000 description 1
- 101000950656 Homo sapiens DEP domain-containing protein 1B Proteins 0.000 description 1
- 101000864175 Homo sapiens DNA polymerase epsilon subunit 3 Proteins 0.000 description 1
- 101000620735 Homo sapiens DNA repair protein RAD51 homolog 1 Proteins 0.000 description 1
- 101000736065 Homo sapiens DNA replication complex GINS protein PSF2 Proteins 0.000 description 1
- 101000583807 Homo sapiens DNA replication licensing factor MCM2 Proteins 0.000 description 1
- 101000615280 Homo sapiens DNA replication licensing factor MCM4 Proteins 0.000 description 1
- 101000951365 Homo sapiens Disks large-associated protein 5 Proteins 0.000 description 1
- 101001016174 Homo sapiens Double zinc ribbon and ankyrin repeat-containing protein 1 Proteins 0.000 description 1
- 101000924017 Homo sapiens Dual specificity protein phosphatase 1 Proteins 0.000 description 1
- 101000760417 Homo sapiens E3 ubiquitin-protein ligase UHRF1 Proteins 0.000 description 1
- 101001049697 Homo sapiens Early growth response protein 1 Proteins 0.000 description 1
- 101001063556 Homo sapiens Epididymal sperm-binding protein 1 Proteins 0.000 description 1
- 101000882584 Homo sapiens Estrogen receptor Proteins 0.000 description 1
- 101001034811 Homo sapiens Eukaryotic translation initiation factor 4 gamma 2 Proteins 0.000 description 1
- 101001052797 Homo sapiens F-box only protein 5 Proteins 0.000 description 1
- 101000848174 Homo sapiens Fanconi anemia group I protein Proteins 0.000 description 1
- 101000848171 Homo sapiens Fanconi anemia group J protein Proteins 0.000 description 1
- 101000713023 Homo sapiens G2/mitotic-specific cyclin-B2 Proteins 0.000 description 1
- 101001066167 Homo sapiens GAS2-like protein 3 Proteins 0.000 description 1
- 101000893897 Homo sapiens Guanidinoacetate N-methyltransferase Proteins 0.000 description 1
- 101001081412 Homo sapiens Heme transporter HRG1 Proteins 0.000 description 1
- 101001047819 Homo sapiens Heparanase Proteins 0.000 description 1
- 101000839069 Homo sapiens Heterogeneous nuclear ribonucleoprotein Q Proteins 0.000 description 1
- 101001045794 Homo sapiens High mobility group protein B3 Proteins 0.000 description 1
- 101000986380 Homo sapiens High mobility group protein HMG-I/HMG-Y Proteins 0.000 description 1
- 101000905054 Homo sapiens Histone H2A.Z Proteins 0.000 description 1
- 101001067880 Homo sapiens Histone H4 Proteins 0.000 description 1
- 101001045907 Homo sapiens Holliday junction recognition protein Proteins 0.000 description 1
- 101000852852 Homo sapiens Innate immunity activator protein Proteins 0.000 description 1
- 101001057504 Homo sapiens Interferon-stimulated gene 20 kDa protein Proteins 0.000 description 1
- 101001013150 Homo sapiens Interstitial collagenase Proteins 0.000 description 1
- 101001006789 Homo sapiens Kinesin heavy chain isoform 5C Proteins 0.000 description 1
- 101001008953 Homo sapiens Kinesin-like protein KIF11 Proteins 0.000 description 1
- 101001091231 Homo sapiens Kinesin-like protein KIF18A Proteins 0.000 description 1
- 101001027621 Homo sapiens Kinesin-like protein KIF20A Proteins 0.000 description 1
- 101000605743 Homo sapiens Kinesin-like protein KIF23 Proteins 0.000 description 1
- 101001050567 Homo sapiens Kinesin-like protein KIF2C Proteins 0.000 description 1
- 101001006776 Homo sapiens Kinesin-like protein KIFC1 Proteins 0.000 description 1
- 101001112162 Homo sapiens Kinetochore protein NDC80 homolog Proteins 0.000 description 1
- 101000590482 Homo sapiens Kinetochore protein Nuf2 Proteins 0.000 description 1
- 101001003581 Homo sapiens Lamin-B1 Proteins 0.000 description 1
- 101000941877 Homo sapiens Leucine-rich repeat serine/threonine-protein kinase 1 Proteins 0.000 description 1
- 101001039189 Homo sapiens Leucine-rich repeat-containing protein 17 Proteins 0.000 description 1
- 101001077840 Homo sapiens Lipid-phosphate phosphatase Proteins 0.000 description 1
- 101000899339 Homo sapiens Lymphoid-specific helicase Proteins 0.000 description 1
- 101000762967 Homo sapiens Lymphokine-activated killer T-cell-originated protein kinase Proteins 0.000 description 1
- 101000946053 Homo sapiens Lysosomal-associated transmembrane protein 4A Proteins 0.000 description 1
- 101000592685 Homo sapiens Meiotic nuclear division protein 1 homolog Proteins 0.000 description 1
- 101000687968 Homo sapiens Membrane-associated tyrosine- and threonine-specific cdc2-inhibitory kinase Proteins 0.000 description 1
- 101000947699 Homo sapiens Microfibril-associated glycoprotein 4 Proteins 0.000 description 1
- 101001018298 Homo sapiens Microtubule-associated serine/threonine-protein kinase 4 Proteins 0.000 description 1
- 101000794228 Homo sapiens Mitotic checkpoint serine/threonine-protein kinase BUB1 beta Proteins 0.000 description 1
- 101000623800 Homo sapiens Musculoskeletal embryonic nuclear protein 1 Proteins 0.000 description 1
- 101000995164 Homo sapiens Netrin-4 Proteins 0.000 description 1
- 101000582005 Homo sapiens Neuron navigator 3 Proteins 0.000 description 1
- 101001007901 Homo sapiens Nuclear pore complex protein Nup88 Proteins 0.000 description 1
- 101001118493 Homo sapiens Nuclear pore glycoprotein p62 Proteins 0.000 description 1
- 101000744394 Homo sapiens Oxidized purine nucleoside triphosphate hydrolase Proteins 0.000 description 1
- 101000585555 Homo sapiens PCNA-associated factor Proteins 0.000 description 1
- 101001071236 Homo sapiens PHD finger protein 19 Proteins 0.000 description 1
- 101001098930 Homo sapiens Pachytene checkpoint protein 2 homolog Proteins 0.000 description 1
- 101000615933 Homo sapiens Phosphoserine aminotransferase Proteins 0.000 description 1
- 101000583385 Homo sapiens Phytanoyl-CoA dioxygenase domain-containing protein 1 Proteins 0.000 description 1
- 101000691476 Homo sapiens Placenta-specific protein 9 Proteins 0.000 description 1
- 101000829779 Homo sapiens Probable G-protein coupled receptor 19 Proteins 0.000 description 1
- 101001117517 Homo sapiens Prostaglandin E2 receptor EP3 subtype Proteins 0.000 description 1
- 101000721172 Homo sapiens Protein DBF4 homolog A Proteins 0.000 description 1
- 101000848917 Homo sapiens Protein FAM72D Proteins 0.000 description 1
- 101000877851 Homo sapiens Protein FAM83D Proteins 0.000 description 1
- 101000909882 Homo sapiens Protein cornichon homolog 4 Proteins 0.000 description 1
- 101001122995 Homo sapiens Protein phosphatase 1 regulatory subunit 3C Proteins 0.000 description 1
- 101000668168 Homo sapiens RNA-binding motif, single-stranded-interacting protein 3 Proteins 0.000 description 1
- 101000694802 Homo sapiens Receptor-type tyrosine-protein phosphatase T Proteins 0.000 description 1
- 101001100103 Homo sapiens Retinoic acid-induced protein 2 Proteins 0.000 description 1
- 101000697600 Homo sapiens Serine/threonine-protein kinase 32B Proteins 0.000 description 1
- 101000777293 Homo sapiens Serine/threonine-protein kinase Chk1 Proteins 0.000 description 1
- 101000601441 Homo sapiens Serine/threonine-protein kinase Nek2 Proteins 0.000 description 1
- 101000911790 Homo sapiens Sister chromatid cohesion protein DCC1 Proteins 0.000 description 1
- 101000694025 Homo sapiens Sodium channel protein type 7 subunit alpha Proteins 0.000 description 1
- 101000694021 Homo sapiens Sodium channel subunit beta-4 Proteins 0.000 description 1
- 101000639975 Homo sapiens Sodium-dependent noradrenaline transporter Proteins 0.000 description 1
- 101000618133 Homo sapiens Sperm-associated antigen 5 Proteins 0.000 description 1
- 101000700646 Homo sapiens Steroid receptor-associated and regulated protein Proteins 0.000 description 1
- 101000716994 Homo sapiens Suppressor APC domain-containing protein 2 Proteins 0.000 description 1
- 101000648546 Homo sapiens Sushi domain-containing protein 3 Proteins 0.000 description 1
- 101000669970 Homo sapiens Thrombospondin type-1 domain-containing protein 4 Proteins 0.000 description 1
- 101000809797 Homo sapiens Thymidylate synthase Proteins 0.000 description 1
- 101000866298 Homo sapiens Transcription factor E2F8 Proteins 0.000 description 1
- 101000836150 Homo sapiens Transforming acidic coiled-coil-containing protein 3 Proteins 0.000 description 1
- 101000830843 Homo sapiens Tumor protein p63-regulated gene 1 protein Proteins 0.000 description 1
- 101000807354 Homo sapiens Ubiquitin-conjugating enzyme E2 C Proteins 0.000 description 1
- 101000837565 Homo sapiens Ubiquitin-conjugating enzyme E2 S Proteins 0.000 description 1
- 101000794517 Homo sapiens Uncharacterized protein C1orf21 Proteins 0.000 description 1
- 101000867817 Homo sapiens Voltage-dependent L-type calcium channel subunit alpha-1D Proteins 0.000 description 1
- 101000771675 Homo sapiens WD repeat and HMG-box DNA-binding protein 1 Proteins 0.000 description 1
- 101000743863 Homo sapiens ZW10 interactor Proteins 0.000 description 1
- 101000723827 Homo sapiens Zinc finger CCHC domain-containing protein 24 Proteins 0.000 description 1
- 101000964425 Homo sapiens Zinc finger and BTB domain-containing protein 16 Proteins 0.000 description 1
- 102100035692 Importin subunit alpha-1 Human genes 0.000 description 1
- 102100036724 Innate immunity activator protein Human genes 0.000 description 1
- 102100032832 Integrin alpha-7 Human genes 0.000 description 1
- 102100027268 Interferon-stimulated gene 20 kDa protein Human genes 0.000 description 1
- 102000014150 Interferons Human genes 0.000 description 1
- 108010050904 Interferons Proteins 0.000 description 1
- 208000037396 Intraductal Noninfiltrating Carcinoma Diseases 0.000 description 1
- 102000004310 Ion Channels Human genes 0.000 description 1
- 108090000862 Ion Channels Proteins 0.000 description 1
- 238000010824 Kaplan-Meier survival analysis Methods 0.000 description 1
- 102100027928 Kinesin heavy chain isoform 5C Human genes 0.000 description 1
- 102100027629 Kinesin-like protein KIF11 Human genes 0.000 description 1
- 102100034895 Kinesin-like protein KIF18A Human genes 0.000 description 1
- 102100037694 Kinesin-like protein KIF20A Human genes 0.000 description 1
- 102100038406 Kinesin-like protein KIF23 Human genes 0.000 description 1
- 102100023424 Kinesin-like protein KIF2C Human genes 0.000 description 1
- 102100027942 Kinesin-like protein KIFC1 Human genes 0.000 description 1
- 102100023890 Kinetochore protein NDC80 homolog Human genes 0.000 description 1
- 102100032431 Kinetochore protein Nuf2 Human genes 0.000 description 1
- 102100026517 Lamin-B1 Human genes 0.000 description 1
- 102000052922 Large Neutral Amino Acid-Transporter 1 Human genes 0.000 description 1
- 102100032656 Leucine-rich repeat serine/threonine-protein kinase 1 Human genes 0.000 description 1
- 102100040690 Leucine-rich repeat-containing protein 17 Human genes 0.000 description 1
- 102100025357 Lipid-phosphate phosphatase Human genes 0.000 description 1
- 102100022539 Lymphoid-specific helicase Human genes 0.000 description 1
- 102100026753 Lymphokine-activated killer T-cell-originated protein kinase Human genes 0.000 description 1
- 102100034728 Lysosomal-associated transmembrane protein 4A Human genes 0.000 description 1
- 102000001291 MAP Kinase Kinase Kinase Human genes 0.000 description 1
- 102000000380 Matrix Metalloproteinase 1 Human genes 0.000 description 1
- 102100026158 Melanophilin Human genes 0.000 description 1
- 101710158003 Melanophilin Proteins 0.000 description 1
- 108010093175 Member 2 Group A Nuclear Receptor Subfamily 4 Proteins 0.000 description 1
- 102100024262 Membrane-associated tyrosine- and threonine-specific cdc2-inhibitory kinase Human genes 0.000 description 1
- 102100036103 Microfibril-associated glycoprotein 4 Human genes 0.000 description 1
- 101710115937 Microtubule-associated protein tau Proteins 0.000 description 1
- 102100033252 Microtubule-associated serine/threonine-protein kinase 4 Human genes 0.000 description 1
- 108030005453 Mitogen-activated protein kinase kinase kinases Proteins 0.000 description 1
- 102100030144 Mitotic checkpoint serine/threonine-protein kinase BUB1 beta Human genes 0.000 description 1
- 238000000342 Monte Carlo simulation Methods 0.000 description 1
- 102100023094 Musculoskeletal embryonic nuclear protein 1 Human genes 0.000 description 1
- 241001467552 Mycobacterium bovis BCG Species 0.000 description 1
- 102100030710 NAD-dependent protein deacetylase sirtuin-3, mitochondrial Human genes 0.000 description 1
- 102100034388 Netrin-4 Human genes 0.000 description 1
- 102100038813 Neuromedin-U Human genes 0.000 description 1
- 102100030464 Neuron navigator 3 Human genes 0.000 description 1
- 102100038878 Neuropeptide Y receptor type 1 Human genes 0.000 description 1
- 238000000636 Northern blotting Methods 0.000 description 1
- 102100027586 Nuclear pore complex protein Nup88 Human genes 0.000 description 1
- 102100024057 Nuclear pore glycoprotein p62 Human genes 0.000 description 1
- 102100022676 Nuclear receptor subfamily 4 group A member 2 Human genes 0.000 description 1
- 108091005461 Nucleic proteins Proteins 0.000 description 1
- 108010038807 Oligopeptides Proteins 0.000 description 1
- 102000015636 Oligopeptides Human genes 0.000 description 1
- 101000921214 Oryza sativa subsp. japonica Protein EARLY HEADING DATE 2 Proteins 0.000 description 1
- 101800002327 Osteoinductive factor Proteins 0.000 description 1
- 102100039792 Oxidized purine nucleoside triphosphate hydrolase Human genes 0.000 description 1
- 102000004316 Oxidoreductases Human genes 0.000 description 1
- 108090000854 Oxidoreductases Proteins 0.000 description 1
- 102100029879 PCNA-associated factor Human genes 0.000 description 1
- 102100036870 PHD finger protein 19 Human genes 0.000 description 1
- 102100038993 Pachytene checkpoint protein 2 homolog Human genes 0.000 description 1
- 102000035195 Peptidases Human genes 0.000 description 1
- 108091005804 Peptidases Proteins 0.000 description 1
- 108010067902 Peptide Library Proteins 0.000 description 1
- 108091093037 Peptide nucleic acid Proteins 0.000 description 1
- 102100021768 Phosphoserine aminotransferase Human genes 0.000 description 1
- 102100030828 Phytanoyl-CoA dioxygenase domain-containing protein 1 Human genes 0.000 description 1
- 102100026183 Placenta-specific protein 9 Human genes 0.000 description 1
- 108700039194 Plasma membrane ascorbate-dependent reductase CYBRD1 Proteins 0.000 description 1
- 108010000598 Polycomb Repressive Complex 1 Proteins 0.000 description 1
- 102100023417 Probable G-protein coupled receptor 19 Human genes 0.000 description 1
- 102100024447 Prostaglandin E2 receptor EP3 subtype Human genes 0.000 description 1
- 102100025198 Protein DBF4 homolog A Human genes 0.000 description 1
- 102100034519 Protein FAM72D Human genes 0.000 description 1
- 102100035447 Protein FAM83D Human genes 0.000 description 1
- 102000001253 Protein Kinase Human genes 0.000 description 1
- 102000002727 Protein Tyrosine Phosphatase Human genes 0.000 description 1
- 102100024517 Protein cornichon homolog 4 Human genes 0.000 description 1
- 102100028506 Protein phosphatase 1 regulatory subunit 3C Human genes 0.000 description 1
- 108050001955 Protein regulator of cytokinesis 1 Proteins 0.000 description 1
- 102000001195 RAD51 Human genes 0.000 description 1
- 102100031535 RAD51-associated protein 1 Human genes 0.000 description 1
- 101710182832 RAD51-associated protein 1 Proteins 0.000 description 1
- 238000002123 RNA extraction Methods 0.000 description 1
- 102100039689 RNA-binding motif, single-stranded-interacting protein 3 Human genes 0.000 description 1
- 101710189540 RNA-binding protein Nova-1 Proteins 0.000 description 1
- 102100037414 Rac GTPase-activating protein 1 Human genes 0.000 description 1
- 101710196218 Rac GTPase-activating protein 1 Proteins 0.000 description 1
- 108010068097 Rad51 Recombinase Proteins 0.000 description 1
- 101710100963 Receptor tyrosine-protein kinase erbB-4 Proteins 0.000 description 1
- 102100028645 Receptor-type tyrosine-protein phosphatase T Human genes 0.000 description 1
- 108020004511 Recombinant DNA Proteins 0.000 description 1
- 101710205286 Replication origin-binding protein Proteins 0.000 description 1
- 102100038452 Retinoic acid-induced protein 2 Human genes 0.000 description 1
- 102000002278 Ribosomal Proteins Human genes 0.000 description 1
- 108010000605 Ribosomal Proteins Proteins 0.000 description 1
- 108091006207 SLC-Transporter Proteins 0.000 description 1
- 102000037054 SLC-Transporter Human genes 0.000 description 1
- 108091006232 SLC7A5 Proteins 0.000 description 1
- 101100010298 Schizosaccharomyces pombe (strain 972 / ATCC 24843) pol2 gene Proteins 0.000 description 1
- 108050003978 Semaphorin Proteins 0.000 description 1
- 102000014105 Semaphorin Human genes 0.000 description 1
- 102100028030 Serine/threonine-protein kinase 32B Human genes 0.000 description 1
- 102100031081 Serine/threonine-protein kinase Chk1 Human genes 0.000 description 1
- 102100037703 Serine/threonine-protein kinase Nek2 Human genes 0.000 description 1
- 102100027040 Sister chromatid cohesion protein DCC1 Human genes 0.000 description 1
- 102100027190 Sodium channel protein type 7 subunit alpha Human genes 0.000 description 1
- 102100027181 Sodium channel subunit beta-4 Human genes 0.000 description 1
- 102100033929 Sodium-dependent noradrenaline transporter Human genes 0.000 description 1
- 102100021915 Sperm-associated antigen 5 Human genes 0.000 description 1
- 101710142154 Stanniocalcin-2 Proteins 0.000 description 1
- 102100029291 Steroid receptor-associated and regulated protein Human genes 0.000 description 1
- 238000000692 Student's t-test Methods 0.000 description 1
- 102100032891 Superoxide dismutase [Mn], mitochondrial Human genes 0.000 description 1
- 102100020923 Suppressor APC domain-containing protein 2 Human genes 0.000 description 1
- 208000002220 Supravalvular aortic stenosis Diseases 0.000 description 1
- 102100028853 Sushi domain-containing protein 3 Human genes 0.000 description 1
- 101710137500 T7 RNA polymerase Proteins 0.000 description 1
- 102100039309 Thrombospondin type-1 domain-containing protein 4 Human genes 0.000 description 1
- IQFYYKKMVGJFEH-XLPZGREQSA-N Thymidine Chemical compound O=C1NC(=O)C(C)=CN1[C@@H]1O[C@H](CO)[C@@H](O)C1 IQFYYKKMVGJFEH-XLPZGREQSA-N 0.000 description 1
- 102100038618 Thymidylate synthase Human genes 0.000 description 1
- 102100031555 Transcription factor E2F8 Human genes 0.000 description 1
- 102100027048 Transforming acidic coiled-coil-containing protein 3 Human genes 0.000 description 1
- 108010078814 Tumor Suppressor Protein p53 Proteins 0.000 description 1
- 102100024934 Tumor protein p63-regulated gene 1 protein Human genes 0.000 description 1
- 108090000848 Ubiquitin Proteins 0.000 description 1
- 102000044159 Ubiquitin Human genes 0.000 description 1
- 102100037256 Ubiquitin-conjugating enzyme E2 C Human genes 0.000 description 1
- 102100028718 Ubiquitin-conjugating enzyme E2 S Human genes 0.000 description 1
- 102100030065 Uncharacterized protein C1orf21 Human genes 0.000 description 1
- 108010053752 Voltage-Gated Sodium Channels Proteins 0.000 description 1
- 102000016913 Voltage-Gated Sodium Channels Human genes 0.000 description 1
- 102100032575 Voltage-dependent L-type calcium channel subunit alpha-1D Human genes 0.000 description 1
- 102100029469 WD repeat and HMG-box DNA-binding protein 1 Human genes 0.000 description 1
- 206010049644 Williams syndrome Diseases 0.000 description 1
- 201000001305 Williams-Beuren syndrome Diseases 0.000 description 1
- 102100039102 ZW10 interactor Human genes 0.000 description 1
- 102100028460 Zinc finger CCHC domain-containing protein 24 Human genes 0.000 description 1
- 102100040314 Zinc finger and BTB domain-containing protein 16 Human genes 0.000 description 1
- 102100036642 Zinc finger protein 385B Human genes 0.000 description 1
- 101710185372 Zinc finger protein 385B Proteins 0.000 description 1
- 208000021841 acute erythroid leukemia Diseases 0.000 description 1
- 239000000654 additive Substances 0.000 description 1
- 230000000996 additive effect Effects 0.000 description 1
- 239000011543 agarose gel Substances 0.000 description 1
- 238000011256 aggressive treatment Methods 0.000 description 1
- 239000000556 agonist Substances 0.000 description 1
- 230000004075 alteration Effects 0.000 description 1
- 230000003322 aneuploid effect Effects 0.000 description 1
- 208000036878 aneuploidy Diseases 0.000 description 1
- 230000033115 angiogenesis Effects 0.000 description 1
- 239000005557 antagonist Substances 0.000 description 1
- 230000002424 anti-apoptotic effect Effects 0.000 description 1
- 229940046836 anti-estrogen Drugs 0.000 description 1
- 230000001833 anti-estrogenic effect Effects 0.000 description 1
- 230000002924 anti-infective effect Effects 0.000 description 1
- 230000000798 anti-retroviral effect Effects 0.000 description 1
- 239000003816 antisense DNA Substances 0.000 description 1
- 230000001640 apoptogenic effect Effects 0.000 description 1
- 230000004009 axon guidance Effects 0.000 description 1
- 229960000190 bacillus calmette–guérin vaccine Drugs 0.000 description 1
- 108700041737 bcl-2 Genes Proteins 0.000 description 1
- 150000001556 benzimidazoles Chemical class 0.000 description 1
- 230000004071 biological effect Effects 0.000 description 1
- 230000033228 biological regulation Effects 0.000 description 1
- 239000000090 biomarker Substances 0.000 description 1
- 210000004369 blood Anatomy 0.000 description 1
- 239000008280 blood Substances 0.000 description 1
- 210000001124 body fluid Anatomy 0.000 description 1
- 210000001185 bone marrow Anatomy 0.000 description 1
- AIYUHDOJVYHVIT-UHFFFAOYSA-M caesium chloride Chemical compound [Cl-].[Cs+] AIYUHDOJVYHVIT-UHFFFAOYSA-M 0.000 description 1
- 230000024683 calcium ion homeostasis Effects 0.000 description 1
- 238000004364 calculation method Methods 0.000 description 1
- 230000023852 carbohydrate metabolic process Effects 0.000 description 1
- 235000021256 carbohydrate metabolism Nutrition 0.000 description 1
- 235000011089 carbon dioxide Nutrition 0.000 description 1
- 108700021031 cdc Genes Proteins 0.000 description 1
- 230000034303 cell budding Effects 0.000 description 1
- 230000033366 cell cycle process Effects 0.000 description 1
- 230000006369 cell cycle progression Effects 0.000 description 1
- 230000033077 cellular process Effects 0.000 description 1
- 230000007960 cellular response to stress Effects 0.000 description 1
- 238000005119 centrifugation Methods 0.000 description 1
- 239000003153 chemical reaction reagent Substances 0.000 description 1
- 238000002512 chemotherapy Methods 0.000 description 1
- 239000013611 chromosomal DNA Substances 0.000 description 1
- 230000002759 chromosomal effect Effects 0.000 description 1
- 230000004186 co-expression Effects 0.000 description 1
- 230000000052 comparative effect Effects 0.000 description 1
- 238000013093 comparative effectiveness research Methods 0.000 description 1
- 230000000295 complement effect Effects 0.000 description 1
- 239000002131 composite material Substances 0.000 description 1
- 238000007796 conventional method Methods 0.000 description 1
- 210000000172 cytosol Anatomy 0.000 description 1
- 230000003013 cytotoxicity Effects 0.000 description 1
- 231100000135 cytotoxicity Toxicity 0.000 description 1
- 238000013523 data management Methods 0.000 description 1
- 230000003247 decreasing effect Effects 0.000 description 1
- 230000007547 defect Effects 0.000 description 1
- 230000002950 deficient Effects 0.000 description 1
- 238000012217 deletion Methods 0.000 description 1
- 230000037430 deletion Effects 0.000 description 1
- 238000007876 drug discovery Methods 0.000 description 1
- 238000012912 drug discovery process Methods 0.000 description 1
- 230000000857 drug effect Effects 0.000 description 1
- 238000007877 drug screening Methods 0.000 description 1
- 230000008406 drug-drug interaction Effects 0.000 description 1
- 208000028715 ductal breast carcinoma in situ Diseases 0.000 description 1
- 230000002900 effect on cell Effects 0.000 description 1
- 229920002549 elastin Polymers 0.000 description 1
- 230000013020 embryo development Effects 0.000 description 1
- 238000009261 endocrine therapy Methods 0.000 description 1
- 229940034984 endocrine therapy antineoplastic and immunomodulating agent Drugs 0.000 description 1
- 229940088598 enzyme Drugs 0.000 description 1
- YQGOJNYOYNNSMM-UHFFFAOYSA-N eosin Chemical compound [Na+].OC(=O)C1=CC=CC=C1C1=C2C=C(Br)C(=O)C(Br)=C2OC2=C(Br)C(O)=C(Br)C=C21 YQGOJNYOYNNSMM-UHFFFAOYSA-N 0.000 description 1
- 239000000328 estrogen antagonist Substances 0.000 description 1
- 238000011156 evaluation Methods 0.000 description 1
- 230000007717 exclusion Effects 0.000 description 1
- 230000001747 exhibiting effect Effects 0.000 description 1
- 238000002474 experimental method Methods 0.000 description 1
- 238000000855 fermentation Methods 0.000 description 1
- 230000004151 fermentation Effects 0.000 description 1
- 238000000684 flow cytometry Methods 0.000 description 1
- 239000012634 fragment Substances 0.000 description 1
- 238000011223 gene expression profiling Methods 0.000 description 1
- 230000004547 gene signature Effects 0.000 description 1
- 230000037442 genomic alteration Effects 0.000 description 1
- 150000004676 glycans Chemical class 0.000 description 1
- 230000036541 health Effects 0.000 description 1
- 238000007417 hierarchical cluster analysis Methods 0.000 description 1
- 238000013537 high throughput screening Methods 0.000 description 1
- 238000001794 hormone therapy Methods 0.000 description 1
- 206010020718 hyperplasia Diseases 0.000 description 1
- 230000002390 hyperplastic effect Effects 0.000 description 1
- 230000028993 immune response Effects 0.000 description 1
- 210000000987 immune system Anatomy 0.000 description 1
- 230000036039 immunity Effects 0.000 description 1
- 230000000984 immunochemical effect Effects 0.000 description 1
- 238000003365 immunocytochemistry Methods 0.000 description 1
- 239000012535 impurity Substances 0.000 description 1
- 201000004933 in situ carcinoma Diseases 0.000 description 1
- 238000007901 in situ hybridization Methods 0.000 description 1
- 238000010348 incorporation Methods 0.000 description 1
- 239000000411 inducer Substances 0.000 description 1
- 102000006495 integrins Human genes 0.000 description 1
- 108010044426 integrins Proteins 0.000 description 1
- 229940079322 interferon Drugs 0.000 description 1
- 208000024312 invasive carcinoma Diseases 0.000 description 1
- 229910052742 iron Inorganic materials 0.000 description 1
- 238000002955 isolation Methods 0.000 description 1
- 238000002898 library design Methods 0.000 description 1
- 230000004904 long-term response Effects 0.000 description 1
- 239000012139 lysis buffer Substances 0.000 description 1
- 230000002132 lysosomal effect Effects 0.000 description 1
- 238000012423 maintenance Methods 0.000 description 1
- 238000004519 manufacturing process Methods 0.000 description 1
- 230000009401 metastasis Effects 0.000 description 1
- 238000012775 microarray technology Methods 0.000 description 1
- 238000007431 microscopic evaluation Methods 0.000 description 1
- 102000021160 microtubule binding proteins Human genes 0.000 description 1
- 108091011150 microtubule binding proteins Proteins 0.000 description 1
- 238000010369 molecular cloning Methods 0.000 description 1
- 238000012544 monitoring process Methods 0.000 description 1
- 230000004899 motility Effects 0.000 description 1
- 229930014626 natural product Natural products 0.000 description 1
- 230000034724 negative regulation of cellular component movement Effects 0.000 description 1
- 108010021512 neuromedin U Proteins 0.000 description 1
- 238000007474 nonparametric Mann- Whitney U test Methods 0.000 description 1
- 108020004017 nuclear receptors Proteins 0.000 description 1
- 239000002777 nucleoside Substances 0.000 description 1
- 150000003833 nucleoside derivatives Chemical class 0.000 description 1
- 239000002773 nucleotide Substances 0.000 description 1
- 125000003729 nucleotide group Chemical group 0.000 description 1
- 210000004940 nucleus Anatomy 0.000 description 1
- 238000005457 optimization Methods 0.000 description 1
- 239000012188 paraffin wax Substances 0.000 description 1
- 230000001575 pathological effect Effects 0.000 description 1
- 230000000737 periodic effect Effects 0.000 description 1
- 229920001282 polysaccharide Polymers 0.000 description 1
- 239000005017 polysaccharide Substances 0.000 description 1
- 231100000683 possible toxicity Toxicity 0.000 description 1
- 230000002980 postoperative effect Effects 0.000 description 1
- 238000002360 preparation method Methods 0.000 description 1
- 238000002731 protein assay Methods 0.000 description 1
- 108060006633 protein kinase Proteins 0.000 description 1
- 230000009145 protein modification Effects 0.000 description 1
- 230000009822 protein phosphorylation Effects 0.000 description 1
- 108020000494 protein-tyrosine phosphatase Proteins 0.000 description 1
- 230000017854 proteolysis Effects 0.000 description 1
- 230000002797 proteolythic effect Effects 0.000 description 1
- 229940024999 proteolytic enzymes for treatment of wounds and ulcers Drugs 0.000 description 1
- 238000003908 quality control method Methods 0.000 description 1
- 238000011084 recovery Methods 0.000 description 1
- 230000008439 repair process Effects 0.000 description 1
- 230000010076 replication Effects 0.000 description 1
- 238000012552 review Methods 0.000 description 1
- 238000005096 rolling process Methods 0.000 description 1
- 210000003296 saliva Anatomy 0.000 description 1
- 230000021317 sensory perception Effects 0.000 description 1
- 230000013627 sensory perception of chemical stimulus Effects 0.000 description 1
- 230000008786 sensory perception of smell Effects 0.000 description 1
- 230000012488 skeletal system development Effects 0.000 description 1
- 241000894007 species Species 0.000 description 1
- 239000007858 starting material Substances 0.000 description 1
- 210000000130 stem cell Anatomy 0.000 description 1
- 238000003860 storage Methods 0.000 description 1
- 238000006467 substitution reaction Methods 0.000 description 1
- 208000014794 superficial urinary bladder carcinoma Diseases 0.000 description 1
- 239000006228 supernatant Substances 0.000 description 1
- 239000013589 supplement Substances 0.000 description 1
- 210000004243 sweat Anatomy 0.000 description 1
- 230000009885 systemic effect Effects 0.000 description 1
- 238000012353 t test Methods 0.000 description 1
- 210000001138 tear Anatomy 0.000 description 1
- 238000013518 transcription Methods 0.000 description 1
- 230000035897 transcription Effects 0.000 description 1
- 230000014616 translation Effects 0.000 description 1
- 238000009424 underpinning Methods 0.000 description 1
- 230000002485 urinary effect Effects 0.000 description 1
- 210000002700 urine Anatomy 0.000 description 1
- 230000035899 viability Effects 0.000 description 1
- 230000000007 visual effect Effects 0.000 description 1
- 238000001262 western blot Methods 0.000 description 1
Images





Classifications
-
- C—CHEMISTRY; METALLURGY
- C12—BIOCHEMISTRY; BEER; SPIRITS; WINE; VINEGAR; MICROBIOLOGY; ENZYMOLOGY; MUTATION OR GENETIC ENGINEERING
- C12Q—MEASURING OR TESTING PROCESSES INVOLVING ENZYMES, NUCLEIC ACIDS OR MICROORGANISMS; COMPOSITIONS OR TEST PAPERS THEREFOR; PROCESSES OF PREPARING SUCH COMPOSITIONS; CONDITION-RESPONSIVE CONTROL IN MICROBIOLOGICAL OR ENZYMOLOGICAL PROCESSES
- C12Q1/00—Measuring or testing processes involving enzymes, nucleic acids or microorganisms; Compositions therefor; Processes of preparing such compositions
- C12Q1/68—Measuring or testing processes involving enzymes, nucleic acids or microorganisms; Compositions therefor; Processes of preparing such compositions involving nucleic acids
- C12Q1/6876—Nucleic acid products used in the analysis of nucleic acids, e.g. primers or probes
- C12Q1/6883—Nucleic acid products used in the analysis of nucleic acids, e.g. primers or probes for diseases caused by alterations of genetic material
- C12Q1/6886—Nucleic acid products used in the analysis of nucleic acids, e.g. primers or probes for diseases caused by alterations of genetic material for cancer
-
- A—HUMAN NECESSITIES
- A61—MEDICAL OR VETERINARY SCIENCE; HYGIENE
- A61P—SPECIFIC THERAPEUTIC ACTIVITY OF CHEMICAL COMPOUNDS OR MEDICINAL PREPARATIONS
- A61P35/00—Antineoplastic agents
-
- C—CHEMISTRY; METALLURGY
- C12—BIOCHEMISTRY; BEER; SPIRITS; WINE; VINEGAR; MICROBIOLOGY; ENZYMOLOGY; MUTATION OR GENETIC ENGINEERING
- C12Q—MEASURING OR TESTING PROCESSES INVOLVING ENZYMES, NUCLEIC ACIDS OR MICROORGANISMS; COMPOSITIONS OR TEST PAPERS THEREFOR; PROCESSES OF PREPARING SUCH COMPOSITIONS; CONDITION-RESPONSIVE CONTROL IN MICROBIOLOGICAL OR ENZYMOLOGICAL PROCESSES
- C12Q2600/00—Oligonucleotides characterized by their use
- C12Q2600/106—Pharmacogenomics, i.e. genetic variability in individual responses to drugs and drug metabolism
-
- C—CHEMISTRY; METALLURGY
- C12—BIOCHEMISTRY; BEER; SPIRITS; WINE; VINEGAR; MICROBIOLOGY; ENZYMOLOGY; MUTATION OR GENETIC ENGINEERING
- C12Q—MEASURING OR TESTING PROCESSES INVOLVING ENZYMES, NUCLEIC ACIDS OR MICROORGANISMS; COMPOSITIONS OR TEST PAPERS THEREFOR; PROCESSES OF PREPARING SUCH COMPOSITIONS; CONDITION-RESPONSIVE CONTROL IN MICROBIOLOGICAL OR ENZYMOLOGICAL PROCESSES
- C12Q2600/00—Oligonucleotides characterized by their use
- C12Q2600/112—Disease subtyping, staging or classification
-
- C—CHEMISTRY; METALLURGY
- C12—BIOCHEMISTRY; BEER; SPIRITS; WINE; VINEGAR; MICROBIOLOGY; ENZYMOLOGY; MUTATION OR GENETIC ENGINEERING
- C12Q—MEASURING OR TESTING PROCESSES INVOLVING ENZYMES, NUCLEIC ACIDS OR MICROORGANISMS; COMPOSITIONS OR TEST PAPERS THEREFOR; PROCESSES OF PREPARING SUCH COMPOSITIONS; CONDITION-RESPONSIVE CONTROL IN MICROBIOLOGICAL OR ENZYMOLOGICAL PROCESSES
- C12Q2600/00—Oligonucleotides characterized by their use
- C12Q2600/118—Prognosis of disease development
-
- C—CHEMISTRY; METALLURGY
- C12—BIOCHEMISTRY; BEER; SPIRITS; WINE; VINEGAR; MICROBIOLOGY; ENZYMOLOGY; MUTATION OR GENETIC ENGINEERING
- C12Q—MEASURING OR TESTING PROCESSES INVOLVING ENZYMES, NUCLEIC ACIDS OR MICROORGANISMS; COMPOSITIONS OR TEST PAPERS THEREFOR; PROCESSES OF PREPARING SUCH COMPOSITIONS; CONDITION-RESPONSIVE CONTROL IN MICROBIOLOGICAL OR ENZYMOLOGICAL PROCESSES
- C12Q2600/00—Oligonucleotides characterized by their use
- C12Q2600/136—Screening for pharmacological compounds
-
- Y—GENERAL TAGGING OF NEW TECHNOLOGICAL DEVELOPMENTS; GENERAL TAGGING OF CROSS-SECTIONAL TECHNOLOGIES SPANNING OVER SEVERAL SECTIONS OF THE IPC; TECHNICAL SUBJECTS COVERED BY FORMER USPC CROSS-REFERENCE ART COLLECTIONS [XRACs] AND DIGESTS
- Y02—TECHNOLOGIES OR APPLICATIONS FOR MITIGATION OR ADAPTATION AGAINST CLIMATE CHANGE
- Y02A—TECHNOLOGIES FOR ADAPTATION TO CLIMATE CHANGE
- Y02A90/00—Technologies having an indirect contribution to adaptation to climate change
- Y02A90/10—Information and communication technologies [ICT] supporting adaptation to climate change, e.g. for weather forecasting or climate simulation
Definitions
- the present invention relates to the fields of medicine, cell biology, molecular biology and genetics. More particularly, the invention relates to a method of assigning a grade to a breast tumour which reflects its aggressiveness.
- the effective treatment of cancer depends, to a large extent, on the accuracy with which malignant tissue can be subtyped according to clinicopathological features that reflect disease aggressiveness.
- histologic grade is an important parameter for classifying tumours into morphological subtypes informative of patient risk. Grading seeks to integrate measurements of cellular differentiation and replicative potential into a composite score that quantifies the aggressive behaviour of the tumour.
- the most studied and widely used method of breast tumour grading is the Elston-Ellis modified Scarff, Bloom, Richardson grading system, also known as the Nottingham grading system (NGS) (5, 6, Haybittle et al, 1982).
- NGS Nottingham grading system
- the NGS is based on a phenotypic scoring procedure that involves the microscopic evaluation of morphologic and cytologic features of tumour cells including degree of tubule formation, nuclear pleomorphism and mitotic count (6).
- the sum of these scores stratifies breast tumours into Grade I (G1) (well-differentiated, slow-growing), Grade II (G2) (moderately differentiated), and Grade III (G3) (poorly-differentiated, highly-proliferative) malignancies.
- a gene expression signature comprising one or more of a set of 232 genes, represented by 264 probesets (e.g., Affymetrix probesets), is capable of discriminating between high and low grade tumours.
- 264 probesets e.g., Affymetrix probesets
- Such a gene expression signature may be used to provide an objective and clinically valuable measure of tumour grade.
- tumours of low and high grade may reflect independent pathobiological entities rather than a continuum of cancer progression.
- a method of assigning a grade to a breast tumour, which grade is indicative of the aggressiveness of the tumour comprising detecting the expression of a gene selected from the genes set out in Table D1 (SWS Classifier 0).
- a method of classifying a histological Grade 2 tumour into a low aggressiveness tumour or a high aggressiveness tumour comprising assigning a grade to the histological Grade 2 tumour according to the 1 st aspect of the invention.
- a method of predicting a survival rate for an individual with a histological Grade 2 breast tumour comprising assigning a grade to the breast tumour by a method according to any preceding aspect of the invention.
- a method of prognosis of an individual with a breast tumour comprising assigning a grade to the breast tumour by a method as described,
- a method of diagnosis of aggressive breast cancer in an individual comprising assigning a grade indicative of high aggressiveness to a breast tumour of the individual by a method as described.
- the present invention in a 6 th aspect, provides a method of choosing a therapy for an individual with breast cancer, the method comprising assigning a grade to the breast tumour by a method as described, and choosing an appropriate therapy based on the aggressiveness of the breast tumour.
- a method of treatment of an individual with breast cancer comprising assigning a grade to the breast tumour by a method as described, and administering an appropriate therapy to the individual based on the aggressiveness of the breast tumour.
- an 8 th aspect of the present invention we provide a method of determining the likelihood of success of a particular therapy on an individual with a breast tumour, the method comprising comparing the therapy with the therapy determined by a such a method.
- a method of assigning a breast tumour patient into a prognostic group comprising applying the Nottingham Prognostic Index to a breast tumour, in which the histologic grade score of the breast tumour is replaced by a grade obtained by a method as described.
- a method of assigning a breast tumour patient into a prognostic group comprising deriving a score which is the sum of the following: (a) (0.2 x tumour size in cm); (b) tumour grade in which the tumour grade is assigned by a method as described; and (c) lymph node stage; in which the tumour size and the lymph node stage are determined according to the Nottingham Prognostic Index, in which a patient with a score of 2.4 or less is categorised to a EPG (excellent prognostic group), a patient with a score of less than 3.4 is categorised to a GPG (good prognostic group), a patient with a score of between 3.4 and 5.4 is categorised to a MPG (moderate prognostic group), a patient with a score of greater than 5.4 is categorised to a PPG (poor prognostic group).
- a method of determining whether a breast tumour is a metastatic breast tumour comprising assigning a grade to the breast tumour by a method as described.
- a method of identifying a molecule capable of treating or preventing breast cancer comprising: (a) grading a breast tumour; (b) exposing the breast tumour to a candidate molecule; and (c) detecting a change in tumour grade; in which the grade or change thereof, or both, is assigned by a method as described.
- a method of treatment of an individual suffering from breast cancer comprising modulating the expression of a gene set out in Table D1 (SWS Classifier 0).
- a method of determining the proliferative state of a cell comprising detecting the expression of a gene selected from the genes set out in Table D1 (SWS Classifier 0), in which: (a) a high level of expression of a gene which is annotated "3" in Column 7 ("Grade with Higher Expression”) indicates a highly proliferative cell; (b) a high level of expression of a gene which is annotated "1” in Column 7 (“Grade with Higher Expression”) indicates a non-proliferating cell or a slow-growing cell; (c) a low level of expression of a gene which is annotated "3" in Column 8 (“Grade with Lower Expression”) indicates a highly proliferative cell; and (d) a low level of expression of a gene which is annotated "1” in Column 8 (“Grade with Lower Expression”) indicates a non-proliferating cell or a slow-growing cell.
- SWS Classifier 0 Table D1
- a combination comprising the genes set out in Table D1 (SWS Classifier 0).
- a combination comprising the probesets set out in Table D1 (SWS Classifier 0).
- a combination comprising the genes set out in the above aspects of the invention.
- a combination comprising the probesets set out in the above aspects of the invention.
- a 21 st aspect of the present invention we provide a combination according to any of the above aspects of the invention in the form of an array.
- a combination according to the above aspects of the invention in the form of a microarray we provide.
- kits comprising such a combination, array or microarray, together with instructions for use in a method as described.
- a 23 rd aspect of the present invention use of such a combination, array or a microarray or kit in a method as described.
- the method may comprise a method of assigning a grade to a breast tumour as described.
- a computer implemented method of assigning a grade to a breast tumour comprising processing expression data for one or more genes set out in Table D1 (SWS Classifier 0) and obtaining a grade indicative of aggressiveness of the breast tumour.
- a program storage device readable by a machine, tangibly embodying a program of instructions executable by the machine to perform method of assigning a grade to a breast tumour, the method comprising: processing expression data for one or more genes set out in Table D1 (SWS Classifier 0); and obtaining a grade indicative of aggressiveness of the breast tumour.
- genes whose expression is indicative of breast tumour aggressiveness. Accordingly, we provide for methods of grading breast tumours, and therefore assigning a measure of their aggressiveness, by detecting the level of expression of one or more of these genes.
- the genes are provided in a number of gene sets, or classifiers.
- any one or more of a small set of 264 gene probesets which we term the "SWS Classifier 0".
- This classifier represents 232 genes.
- the expression of all of the 264 gene probesets are detected.
- the expression of all the 232 genes represented by such probesets may be detected.
- genes comprised in this classifier are set out in Table D1 in the section "SWS Classifier 0" below, in Table S1 in Example 20, as well as in Appendix A1.
- This and the other tables D2, D3, D4 and D5 (see below) contain the GenBank ID and the Gene Symbol of the gene, as well as the "Affi ID", or the "Affymetrix ID” number of a probe.
- Affymetrix probe set IDs and their corresponding oligonucleotide sequences, as well as the GenBank mRNA sequences they are designed from, can be accessed on the world wide web at the ADAPT website (http://bioinformatics.picr.man.ac.uk/adapt/ProbeToGene.adapt) hosted by the Paterson Institute for Cancer Research.
- our method comprises determining the expression level of at least one of the genes of the 264 gene probesets (for example, at least one of the 232 genes) in the classifier which we term the "SWS Classifier 0". More than one, for example, a plurality of the genes of such a set may also be detected.
- the 264 gene probesets of the SWS Classifier 0 gene set are set out in Table D1 below.
- the expression level of more than one gene is detected.
- the expression level of 5 or more genes may be detected.
- the expression level of a plurality of genes may therefore be determined.
- the expression level of all 264 gene probesets (for example, the expression level of all 232 genes) may be detected, though it will be clear that this does not need to be so, and a smaller subset may be detected.
- our method may comprise determining the expression level of at least one, a plurality, or all of the genes of an 5 gene set which we term the "SWS Classifier 1".
- the 5 genes of the SWS Classifier 1 gene set are set out in Table D2 below.
- our method may comprise determining the expression level of at least one, a plurality, or all of the genes of an 17 gene set which we term the "SWS Classifier 2".
- the 17 genes of the SWS Classifier 2 gene set are set out in Table D3 below.
- our method may comprise determining the expression level of at least one, a plurality, or all of the genes of an 7 gene set which we term the "SWS Classifier 3".
- the 7 genes of the SWS Classifier 3 gene set are set out in Table D4 below.
- our method may comprise determining the expression level of at least one, a plurality, or all of the genes of an 7 gene set which we term the "SWS Classifier 4".
- the 7 genes of the SWS Classifier 4 gene set are set out in Table D5 below.
- the methods comprise detection of the expression level of all of the genes in the gene set of interest. For example, all 5 genes in the "SWS Classifier 1" are detected, all 17 genes in the “SWS Classifier 2" are detected, all 7 genes in the “SWS Classifier 3” are detected and all 7 genes of the SWS Classifier 4 gene set are detected in these embodiments.
- each of Tables D2, D3, D4 and D5 provide indications of the grades to be assigned to the tumour depending on the level of expression of the relevant gene which is detected (in Columns 7 and 8 respectively).
- the tables also contain columns showing the grades associated with high and low levels of expression of a particular gene, in Columns 7 and 8 of Table D1 for example.
- the gene Barren homolog ( Drosophila ) is annotated to the effect that the "Grade with Higher Expression” is 3, while the “Grade with Lower Expression” is 1.
- our method provides that the tumour has a grade of 3 if a high level of expression of Barren homolog ( Drosophila ) is detected in or from the tumour. If a low level of this gene is detected in or from the tumour, then a grade of 1 may be assigned to that tumour.
- Detection of gene expression may suitably be done by any means as known in the art, and as described in further detail below.
- any of the methods described here may comprise computer implemented methods of assigning a grade to a breast tumour.
- a method may comprise processing expression data for one or more genes set out in Table D1 (SWS 0 Classifier) and obtaining a grade indicative of aggressiveness of the breast tumour.
- the methods described here are suitably capable of classifying a breast tumour to an accuracy of at least 85%, at least 90% accuracy, or at least 95% accuracy, with reference to the grade obtained by conventional means, such as for example grading of the breast tumour by histological grading.
- the methods may be capable of classifying tumours with grades corresponding to histological Grade 1 and histological Grade 3 tumours with an accuracy of 70% or above, 80% or above, or 90% or above.
- a "cut-off" level of expression by which the expression of a gene in or from a tumour may be judged in order to establish whether the expression is at a "high” level, or at a “low” level.
- the cut-off level is set out in Column 9 of Tables D1, D2, D3, D4 and D5.
- our methods include assigning a grade based on whether the level of expression falls below or exceeds the cut-off.
- the cut-off values are determined as the natural log transform normalised signal intensity measurement for Affymetrix arrays.
- the cut-off values may be determined as a global mean normalisation with a scaling factor of 500.
- the cut-off level of expression for the gene Barren homolog is 5.9167 units (see above and formula (1), Microarray Method). Where a given tumour contains a level of expression of this gene that exceeds this level, then it is determined to be a "high" level of expression. A grade of 3 may then be assigned to that tumour. On the other hand, if the expression of the Barren homologue falls below this cut-off level, then the expression is judged to be a "low” level of expression. A grade of 1 may be assigned to the tumour in this event.
- a method which comprises detecting a high level of expression of a gene in SWS Classifier 0 and assigning the grade set out in Column 7 of Table D1 to the breast tumour.
- the method may comprise, or optionally further comprise detecting a low level of expression of the gene and assigning the grade set out in Column 8 of Table D1 to the breast tumour.
- a high level of expression may be detected if the expression level of the gene is above the expression level set out in Column 9 of Table D1, and a low level of expression is detected if the expression level of the gene is below that level.
- RNAse protection RNAse protection
- Northern blotting Western blotting
- the gene expression level may be determined at the transcript level, or at the protein level, or both.
- the detection may be manual, or it may be automated. It is envisaged that any one or a combination of these methods may be employed in the methods and compositions described here.
- the detection of expression of a plurality of genes is suitably detected in the form of an expression profile of the plurality of genes, by conventional means known in the art.
- the detection is by means of microarray hybridisation.
- a sample of a tumour may be taken from a patient and processed for detection of gene expression levels.
- Gene expression levels may be detected in the form of nucleic acid or protein levels or both, for example.
- Analysis of nucleic acid expression levels may be suitably performed by amplification techniques, such as polymerase chain reaction (PCR), rolling circle amplification, etc.
- Detection of expression levels is suitably performed by detecting RNA levels. This can be performed by means known in the art, for example, real time polymerase chain reaction (RT-PCR) or RNAse protection, etc.
- RT-PCR real time polymerase chain reaction
- RNAse protection etc.
- sets of one or more primers or primer pairs which are capable of amplifying any one or more of the genes in the classifiers disclosed herein. Specifically, we provide for a set of primer pairs capable of amplifying all of the genes in the SWS Classifier 0, SWS Classifier 1, SWS Classifier 2, SWS Classifier 3 or SWS Classifier 4 sets.
- RNA expression levels may be detected by hybridisation to a microchip or array, for example, a microchip or array comprising the genes or probesets corresponding to the specific classifier of interest, as described in the Examples.
- the gene expression data or profile is derived from microarray hybridisation to for example an Affymetrix microarray.
- Detection of protein levels may be performed by for example, immunoassays including ELISA or sandwich immunoassays using antibodies against the protein or proteins of interest (for example as described in US6664114 .
- the detection may be performed by use of a "dip stick" which comprises impregnated antibodies against polypeptides of interest, such as described in US2004014094 .
- the grade may be assigned by any suitable method. For example, it may be assigned applying a class prediction algorithm comprising a nearest shrunken centroid method ( Tibshirani, et al., 2002, Proc Natl Acad Sci U S A. 99(10): 6567-6572 ) to the expression data of the plurality of genes.
- the class prediction algorithm may suitably comprise Statistically Weighted Syndromes (SWS) or Prediction Analysis of Microarrays (PAM).
- the grade of the tumour may be assigned by applying a class prediction algorithm comprising one or more of the steps set out here.
- a set of predictor parameters i.e., probesets
- the potentially predictive parameters i.e. signal intensity values of micro-array
- the recoding may be done in such a way as to maximize an informativity measure of discrimination ability of the parameter and minimize its instability to the discrimination object (i.e. patients) belonging to distinct classes (i.e. G1 and G3).
- the method is applied to grade breast tumours which are traditionally graded as Grade 2 by conventional means, such as by histological grading as known in the art.
- Our method is capable of distinguishing the aggressiveness of tumours within the group of tumours in Grade 2 (which were hitherto thought to be homogenous) into Grade 1 like tumours (i.e., more aggressive) and Grade 3 like tumours (i.e., less aggressive). This is described in detail in the Examples.
- Such a method comprises assigning a grade to the histological Grade 2 tumour according to any of the methods described above.
- the expression of any one or more genes, for example, all the genes, in any of the SWS Classifiers described here may be detected and a grade of 1 or 3 assigned using Columns 7, 8 or 9 individually or in combination, as described above.
- Such a tumour which has been reassigned will suitably have one or more characteristics or features of the reassigned grade.
- the characteristics or features may include one or more histological or morphological features, susceptibility to treatment, rate of growth or proliferation, degree of differentiation, aggressiveness, etc.
- the characteristic or feature may comprise aggressiveness.
- a histological Grade 2 breast tumour which has been assigned a low aggressiveness grade by the gene expression detection methods described here may suitably have at least one feature of a histological Grade 1 breast tumour.
- a breast tumour assigned a high aggressiveness grade may have at least one feature of a histological Grade 3 breast tumour.
- Such a feature may comprise degree of differentiation (e.g., well-differentiated, moderately differentiated or poorly-differentiated).
- the feature may comprise rate of growth (e.g., slow-growing, fast-growing).
- the feature may comprise rate of proliferation (e.g., slow-proliferation, highly-proliferative).
- the feature may comprise likelihood of tumour recurrence post-surgery.
- the feature may comprise survival rate.
- the feature may comprise likelihood of tumour recurrence post-surgery and survival rate.
- the feature may comprise a disease free survival rate.
- the feature may comprise susceptibility to treatment.
- grading methods described here enables the classification of the histological Grade 2 tumour into a Grade 1 tumour or a Grade 3 tumour, so as to allow the clinician to treat the tumour accordingly in view of its aggressiveness, prognosis, etc.
- Such regrading using our methods is suitably capable of classifying histological Grade 2 tumours into Grade 1 like and/ or Grade 3 like tumours with an accuracy of 70% or above, 80% or above, or 90% or above.
- the histological grading may be performed by any means known in the art.
- the breast tissue or tumour may be graded by the Nottingham Grading System (NGS) or the Elston-Ellis Modified Scarff, Bloom, Richardson Grading System, both methods being well known in the art.
- NGS Nottingham Grading System
- Elston-Ellis Modified Scarff Bloom, Richardson Grading System
- the information obtained from the regrading may be used to predict any of the parameters which may be useful to the clinician.
- the parameter may include, for example, likelihood of tumour metastasis, prognosis of the patient, survival rate, possibility of recovery and recurrence, etc, depending on the grade of the tumour which has been reassigned to the histological Grade 2 tumour.
- a method of predicting a survival rate for an individual with a histological Grade 2 breast tumour comprising assigning a grade to the breast tumour using gene expression data as described.
- a low aggressiveness grade may suitably indicate a high probability of survival and a high aggressiveness grade may suitably indicate a low probability of survival.
- a method of prognosis of an individual with a breast tumour comprising assigning a grade to the breast tumour by a method as described, and a method of diagnosis of aggressive breast cancer in an individual, the method comprising assigning a grade indicative of high aggressiveness to a breast tumour of the individual by a method as described.
- the methods of gene expression analysis may be employed for determining the proliferative state of a cell.
- a method may comprise detecting the expression of a gene selected from the genes set out in Table D1 (SWS Classifier 0). Where a high level of expression of a gene which is annotated "3" in Column 7 is detected, this may indicate a highly proliferative cell. Similarly, where a high level of expression of a gene which is annotated "1" in Column 7 is detected, a non-proliferating cell or a slow-growing cell may be indicated.
- the SWS Classifier 0 contains 264 probesets which represent 232 genes. It will be clear therefore that the invention encompasses detection of expression level of one or more genes, and/or one or more probesets within the relevant classifiers, or any combination of this.
- the information obtained by the regarding may also be used by the clinician to recommend a suitable treatment, in line with the grade of the tumour which has been reassigned.
- a tumour which has been reassigned to Grade 1 may require less aggressive treatment than a tumour which has been reassigned to Grade 3, for example.
- a method of choosing a therapy for an individual with breast cancer comprising assigning a grade to the breast tumour by a method as described herein, and choosing an appropriate therapy based on the aggressiveness of the breast tumour.
- the method may be employed for the treatment of an individual with breast cancer, by assigning a grade to the breast tumour and administering an appropriate therapy to the individual based on the aggressiveness of the breast tumour.
- a method of treatment of an individual suffering from breast cancer comprising modulating the expression of a gene set out in Table D1 (SWS Classifier 0), Table D2 (SWS 1 Classifier), Table D3 (SWS Classifier 2), Table D4 (SWS Classifier 3) and/or Table D5 (SWS Classifier 4).
- diagnosis and treatment methods may suitably be combined with other methods of assessing the aggressiveness of the tumour, the patient's health and susceptibility to treatment, etc.
- diagnosis or choice of therapy may be determined by further assessing the size of the tumour, or the lymph node stage or both, optionally together or in combination with other risk factors
- the choice of therapy may be determined by assessing the Nottingham Prognostic Index (NPI).
- NPI Nottingham Prognostic Index
- the NPI is described in detail in Haybittle, et al., 1982.
- the method is suitable for assigning a breast tumour patient into a prognostic group.
- Such a combined method comprises deriving a score which is the sum of the following: (a) (0.2 x tumour size in cm); (b) tumour grade in which the tumour grade is assigned by a method according to any of the gene expression detection methods described herein; and (c) lymph node stage; in which the tumour size and the lymph node stage are determined according to the Nottingham Prognostic Index, in which a patient with a score of 2.4 or less is categorised to a EPG (excellent prognostic group), a patient with a score of less than 3.4 is categorised to a GPG (good prognostic group), a patient with a score of between 3.4 and 5.4 is categorised to a MPG (moderate prognostic group), a patient with a score of greater than 5.4 is categorised to a PPG (poor prognostic group).
- a method of assigning a breast tumour patient into a prognostic group may comprise applying the Nottingham Prognostic Index to a breast tumour, but modified such that the histologic grade score of the breast tumour is replaced by a grade obtained by a gene expression detection method as described in this document.
- ER oestrogen receptor
- PR progesterone receptor
- the choice of therapy may be determined by further assessing the oestrogen receptor (ER) status of the breast tumour.
- Such combinations may comprise mixtures of genes or corresponding probes, such as in a form which is suitable for detection of expression.
- the combination may be provided in the form of DNA in solution.
- a microarray or chip which comprises any combination of genes or probes, in the form of cDNA, genomic DNA, or RNA, within the classifiers.
- the microarray or chip comprises all the genes or probes in SWS Classifier 0, SWS Classifier 1, SWS Classifier 2, SWS Classifier 3 or SWS Classifier 4.
- the genes may be synthesised or obtained by means known in the art, and attached on the microarray or chip by conventional means, as known in the art.
- Such microarrays or chips are useful in monitoring gene expression of any one or more of the genes comprised therein, and may be used for tumour grading or detection as described here.
- probe set consisting of a probe or probes having Affymetrix ID numbers as set out in Column 6 of Table D1, Table D2, Table D3, Table D4 or Table D5.
- an array such as a microarray, comprising the probesets set out in Table D1 (SWS Classifier 0).
- an array such as a microarray comprising the genes or probesets set out in Table D2 (SWS 1 Classifier), an array such as a microarray comprising the genes or probesets set out in Table D3 (SWS Classifier 2), an array such as a microarray comprising the genes or probesets set out in Table D4 (SWS3 Classifier), and an array such as a microarray comprising the genes or probesets set out in Table D5 (SWS Classifier 4).
- the probes or probe sets are suitably synthesised or made by means known in the art, for example by oligonucleotide synthesis, and may be attached to a microarray for easier carriage and storage. They may be used in a method of assigning a grade to a breast tumour as described herein.
- SWS Statistically Weighted Syndromes
- PAM Prediction Analysis of Microarrays
- the methods and compositions described here may be used for identifying molecules capable of treating or preventing breast cancer, which may be used as drugs for cancer treatment.
- Such a method comprises: (a) grading a breast tumour as described using gene expression data; (b) exposing the breast tumour to a candidate molecule; and (c) detecting a change in tumour grade.
- the change in tumour grade is suitably determined by grading a breast tumour as described using gene expression data before and after exposure of the breast tumour to a candidate molecule.
- We provide molecule identified by such a method for example for use in breast cancer treatment.
- Assessment of the activity of candidate pharmaceutical compounds generally involves combining the breast cancer cells with the candidate compound, determining any change in the tumour grade, as determined by the gene expression detection methods described herein of the cells that is attributable to the compound (compared with untreated cells or cells treated with an inert compound), and then correlating the effect of the compound with the observed change.
- the screening may be done, for example, either because the compound is designed to have a pharmacological effect on certain cell types such as tumour cells, or because a compound designed to have effects elsewhere may have unintended side effects.
- Two or more drugs can be tested in combination (by combining with the cells either simultaneously or sequentially), to detect possible drug-drug interaction effects.
- compounds are screened initially for potential toxicity ( Castell et al., pp. 375-410 in "In vitro Methods in Pharmaceutical Research," Academic Press, 1997 ). Cytotoxicity can be determined in the first instance by the effect on cell viability, survival, morphology, and expression or release of certain markers, receptors or enzymes. Effects of a drug on chromosomal DNA can be determined by measuring DNA synthesis or repair.
- Candidate molecules subjected to the assay and which are found to be of interest may be isolated and further studied. Methods of isolation of molecules of interest will depend on the type of molecule employed, whether it is in the form of a library, how many candidate molecules are being tested at any one time, whether a batch procedure is being followed, etc.
- the candidate molecules may be provided in the form of a library. In an embodiment, more than one candidate molecule is screened simultaneously.
- a library of candidate molecules may be generated, for example, a small molecule library, a polypeptide library, a nucleic acid library, a library of compounds (such as a combinatorial library), a library of antisense molecules such as antisense DNA or antisense RNA, an antibody library etc, by means known in the art.
- libraries are suitable for high-throughput screening.
- Tumour cells may be exposed to individual members of the library, and the effect on tumour grade, if any, cell determined.
- Array technology may be employed for this purpose.
- the cells may be spatially separated, for example, in wells of a microtitre plate.
- a small molecule library is employed.
- a small molecule we refer to a molecule whose molecular weight may be less than about 50 kDa. In particular embodiments, a small molecule has a molecular weight may be less than about 30 kDa, such as less than about 15 kDa, or less than 10 kDa or so.
- Libraries of such small molecules, here referred to as "small molecule libraries” may contain polypeptides, small peptides, for example, peptides of 20 amino acids or fewer, for example, 15, 10 or 5 amino acids, simple compounds, etc.
- a combinatorial library as described in further detail below, may be screened for candidate modulators of tumour function.
- libraries of candidate molecules may suitably be in the form of combinatorial libraries (also known as combinatorial chemical libraries).
- a "combinatorial library”, as the term is used in this document, is a collection of multiple species of chemical compounds that consist of randomly selected subunits. Combinatorial libraries may be screened for molecules which are capable of changing the choice by a stem cell between the pathways of self-renewal and differentiation.
- combinatorial libraries of chemical compounds are currently available, including libraries active against proteolytic and non-proteolytic enzymes, libraries of agonists and antagonists of G-protein coupled receptors (GPCRs), libraries active against non-GPCR targets (e.g., integrins, ion channels, domain interactions, nuclear receptors, and transcription factors) and libraries of whole-cell oncology and anti-infective targets, among others.
- GPCRs G-protein coupled receptors
- non-GPCR targets e.g., integrins, ion channels, domain interactions, nuclear receptors, and transcription factors
- libraries of whole-cell oncology and anti-infective targets among others.
- Soluble random combinatorial libraries may be synthesized using a simple principle for the generation of equimolar mixtures of peptides which was first described by Furka ( Furka, A. et al., 1988, Xth International Symposium on Medicinal Chemistry, Budapest 1988 ; Furka, A. et al., 1988, 14th International Congress of Biochemistry, Prague 1988 ; Furka, A. et al., 1991, Int. J. Peptide Protein Res. 37:487-493 ). The construction of soluble libraries for iterative screening has also been described ( Houghten, R. A. et al.1991, Nature 354:84-86 ). K. S. Lam disclosed the novel and unexpectedly powerful technique of using insoluble random combinatorial libraries.
- Lam synthesized random combinatorial libraries on solid phase supports so that each support had a test compound of uniform molecular structure, and screened the libraries without prior removal of the test compounds from the support by solid phase binding protocols ( Lam, K. S. et al., 1991, Nature 354:82-84 ).
- a library of candidate molecules may be a synthetic combinatorial library (e.g., a combinatorial chemical library), a cellular extract, a bodily fluid (e.g., urine, blood, tears, sweat, or saliva), or other mixture of synthetic or natural products (e.g., a library of small molecules or a fermentation mixture).
- a synthetic combinatorial library e.g., a combinatorial chemical library
- a cellular extract e.g., a cellular extract
- a bodily fluid e.g., urine, blood, tears, sweat, or saliva
- other mixture of synthetic or natural products e.g., a library of small molecules or a fermentation mixture.
- a library of molecules may include, for example, amino acids, oligopeptides, polypeptides, proteins, or fragments of peptides or proteins; nucleic acids (e.g., antisense; DNA; RNA; or peptide nucleic acids, PNA); aptamers; or carbohydrates or polysaccharides.
- Each member of the library can be singular or can be a part of a mixture (e.g., a compressed library).
- the library may,contain purified compounds or can be "dirty" (i.e., containing a significant quantity of impurities).
- Diversity files contain a large number of compounds (e.g., 1000 or more small molecules) representative of many classes of compounds that could potentially result in nonspecific detection in an assay. Diversity files are commercially available or can also be assembled from individual compounds commercially available from the vendors listed above.
- the breast tumour is surgically resected, processed, and snap frozen.
- a frozen portion of the tumour is processed for total RNA extraction using the Qiagen RNeasy kit (Qiagen, Valencia, CA). Briefly, frozen tumours are cut into minute pieces, and pieces totalling ⁇ 50-100 milligrams (mg) are homogenized for 40 seconds in RNeasy Lysis Buffer (RLT). Proteinase K is added, and the samples are incubated for 10 minutes at 55 degrees C, followed by centrifugation and the addition of ethanol. After transferring the supernatant into RNeasy columns, DNase is added. Collected RNA is then assessed for quality using an Agilent 2100 bioanalyzer (Agilent Technologies, Rockville, MD) or by agarose gel. The RNA is stored at minus -70 degrees C.
- Labeled cRNA target is generated for microarray hybridization essentially according to the Affymetrix protocol (Affymetrix, Santa Clara, CA). Briefly, approximately 5 micrograms ( ⁇ g) of total RNA are reversed transcribed into first-strand cDNA using a T7-linked oligo-dT primer, followed by second strand synthesis. A T7 RNA polymerase is then used to linearly amplify antisense RNA. This "cRNA" is biotinylated and chemically fragmented at 95°C. Ten ⁇ g of the fragmented, biotinylated cRNA is hybridized at 45°C for 16 hours to an Affymetrix high-density oligonucleotide GenChip array.
- Affymetrix protocol Affymetrix, Santa Clara, CA.
- microarray-derived normalized numerical expression values corresponding to the genetic grade signature genes are used as input for the SWS algorithm.
- RNA purification and microarray analysis methodologies above reflect only our "preffered methods", and that other variants exist that could be used in conjunction with our Process for Predicting Patient Outcome...
- the starting material could be formalin-fixed paraffin-embedded tumour material instead of fresh frozen material, or the RNA might be extracted using a Cesium Chloride Gradient method, or the RNA could be analyzed by NimbleGen Microarrays that include DNA probes corresponding to our genes of interest.
- a microarray may not be necessary at all to determine the expression levels of our signature genes, but rather their expression could be quantitatively measured by PCR-based techniques such as real time-PCR.
- Table D1 SWS Classifiers 0: 264 Probesets. Order UGID(build #177) UnigeneName Gene Symbol Genbank Acc Affi ID Grade with Higher Expression Grade with Lower Expression Cut-Off Chi-2 Instability indices 1 Hs.528654 Hypothetical protein FLJ11029 FLJ11029 BG165011 B.228273_at 3 1 7.7063 95.973 0.011 2 acc_NM_00 3158.1 NM_003158 A.208079_s_at 3 1 6.6526 95.599 0.002 3 Hs.308045 Barren homolog (Drosophila) BRRN1 D38553 A.212949_at 3 1 5.9167 92.640 0.006 4 Hs.35962 CDNA clone IMAGE:4452583, partial cds BG492359 B.226936_at 3 1 7.5619 92.601 0.003 5 Hs.184339 Maternal embryonic leucine zipper kinas
- Colum 9 shows the cut off (Optimal Variance Cut-off) expressed as the natural log transform normalised signal intensity measurement for Affymetrix arrays (global mean normalisation with a scaling factor of 500).
- SWS Classifier 1 6 Probe Sets (5 Genes) No UGID (build #183) Unigene Name Gene Symbol Genbank Acc Affi ID Grade with Higher Expression Grade with Lower Expression Cut-off 1 Hs.528654 Hypothetical protein FLJ11029 FLJ11029 BG165011 B.228273_at 3 1 7.706303 2 acc_NM_0031 58.1 Serine/threonine kinase 6.
- transcript 1 STK6 NM_003158 A.208079_s_at 3 1 6.652593 3 Hs.35962
- Maternal embryonic leucine zipper kinase MELK NM_014791 A.204825_at 3 1 7.107259 6 Hs.250822 Serine/threonine kinase 6, transcript 2 STK6 NM_003600 A.204092_s_at 3 1 6.726571
- Colum 9 shows the cut off (Optimal Variance Cut-off) expressed as the natural log transform normalised signal intensity measurement for Affymetrix arrays (global mean normalisation with a scaling factor of 500).
- Colum 9 shows the cut off (Optimal Variance Cut-off) expressed as the natural log transform normalised signal intensity measurement for Affymetrix arrays (global mean normalisation with a scaling factor of 500).
- SWS Classifier 3 7 Probe Sets (7 Genes) Or der UGID(build #183) Unigene Name Gene Symbol Genbank Acc Affi ID Grade with Higher Expression Grade with Lower Expression Cut-off 1 Hs.9329 TPX2, microtubule-associated protein homolog (Xenopus laevis) TPX2 AF098158 A.210052_s_at 3 1 8.7748 2 Hs.344037 Protein regulator of cytokinesis 1 PRC1 NM_003981 A.218009_s_at 3 1 8.2222 3 Hs.292511 Neuro-oncological ventral antigen 1 NOVA1 NM_002515 A.205794_s_at 1 3 6.7387 4 Hs.155223 Stanniocalcin 2 STC2 AI435828 A.203438_at 1 3 8.0766 5 Hs.437351 Cold inducible RNA binding protein CIRBP AL565767 B.225191_at 1 3 8.2308 6 Hs.243
- Colum 9 shows the cut off (Optimal Variance Cut-off) expressed as the natural log transform normalised signal intensity measurement for Affymetrix arrays (global mean normalisation with a scaling factor of 500).
- Colum 9 shows the cut off (Optimal Variance Cut-off) expressed as the natural log transform normalised signal intensity measurement for Affymetrix arrays (global mean normalisation with a scaling factor of 500).
- Example 1 Materials and Methods: Patients and Tumour Specimens
- the Uppsala cohort originally comprised of 315 women representing 65% of all breast cancers resected in Uppsala County, Sweden from January 1, 1987 to December 31, 1989. Information pertaining to patient therapies, clinical follow up, and sample processing are described elsewhere (41).
- tumour sections are prepared from the original paraffin blocks, stained with eosin, and graded in a blinded fashion by H.N. according to the Nottingham grading system (6, Haybittle et al., 1982) as follows:
- Scores are then summed, and tumour samples with scores ranging from 3-5 are classified as Grade I; 6-7 as Grade II; and 8-9 as Grade III.
- ER Estrogen Receptor
- PgR Progesterone Receptor Protein levels of Estrogen Receptor (ER) and Progesterone Receptor (PgR) are assessed by immunoassay (monoclonal 6F11 anti-ER and monoclonal NCL-PGR, respectively, Novocastra Laboratories Ltd, Newcastle upon Tyne, UK) and deemed positive if >0.1 fmol/ug DNA.
- VEGF was measured in tumour cytosol by a quantitative immunoassay kit (Quantikine-human VEGF; R&D Systems, Minneapolis, MN, USA) as described (42).
- S-phase fraction was determined by flow cytometry and defined as high if >7% in diploid tumours, or >12% in aneuploid tumours.
- TP53 mutational status was determined by cDNA sequencing as previously described (41).
- the Uppsala tumour samples ar approved for microarray profiling by the ethical committee at the Karolinska Institute, Sweden.
- the Singapore samples are derived from patients that were operated on at the National University Hospital (Singapore) from February 1, 2000 through January 31, 2002.
- the Singapore tumour samples are approved for microarray profiling by the Singapore National University Hospital ethics board.
- RNA integrity After exclusions based on tissue availability, RNA integrity, clinical annotation and microarray quality control, expression profiles of 249, 147, and 98 tumours from the Uppsala, Sweden and Singapore cohorts, respectively, were deemed suitable for further analysis.
- RNA processing and microarray hybridizations are carried out essentially as described (44).
- Microarray data processing all microarray data are processed as previously described (44).
- GO analysis is facilitated by PANTHER software (https://panther.appliedbiosystems.com/) (46).
- Selected gene lists are statistically compared (Mann-Whitney) with a reference list (ie, NCBI Build 35) comprised of all genes represented on the microarray to identify significantly over- and under-represented GO terms.
- the Kaplan Meier estimate is used to compute survival curves, and the p-value of the likelihood-ratio test is used to assess the statistical significance of the resultant hazard ratios. For standardization, events occurring beyond 10 years are censored. All cases of contralateral disease are censored.
- Disease-free survival (DFS) is defined as the time interval from surgery until the first recurrence or last follow-up.
- Multivariate analysis by Cox proportional hazard regression including a stepwise model selection procedure based on the Akaike information criterion, and all survival statistics are performed in the R survival package. Remaining predictors in the Cox models are assessed by Likelihood-ratio test p-values.
- Tumour size is defined as the longest diameter of the resected tumour.
- LN stage is 1, if lymph node negative, 2, if 3 or fewer nodes involved, and 3, if >3 nodes involved (47).
- a LN stage score of 2 is assigned if 1 or more nodes are involved, and a score of 3 is assigned if nodal involvement showed evidence of periglandular growth.
- grade scores (1,2 or 3) are replaced by genetic grade predictions (1 or 3).
- a training set consisting of samples of known classes (eg, histologic Grade I (G1) and histologic Grade III (G3) tumours) is used to select the variables (ie, gene expression measurements; probesets or predictors ), that allow the most accurate discrimination (or prediction) of the samples in the training set.
- G1 histologic Grade I
- G3 histologic Grade III
- the SWS algorithm is trained on the optimal set of variables, it is then applied to an independent exam set (ie, a new set of samples not used in training) to validate it's prediction accuracy. More details are given below.
- the SWS method uses the training set S ⁇ 0 (comprised of G1 and G3 tumour samples) to evaluate statistically the weight of the graduated "informative" variables (predictors), and all possible pairs of these predictors.
- each patient includes n (potential) prognostic variables X 1 ,..., X n (signals from probe sets of the U133A and U133B chips) and information about class to which a patient belongs.
- the predictors might be able to discriminate G1 and G3 tumours with minimum "a posteriori probability”.
- Reliability of the SWS class prediction function is based on the standard "leave-one-out procedure" and on an additional exam of the class prediction ability on one or more independent sample populations (ie, patient cohorts).
- the G2 tumour samples of the Uppsala cohort and two other cohorts have been used as exam datasets to test the SWS class prediction function.
- the SWS algorithm is based on calculating the a posteriori probabilities of the tumours belonging to one of two classes using a weighted voting scheme involving the sets of so called "syndromes".
- a syndrome is the sub-region of prognostic variable space.
- one class of samples for instance, G3 tumours
- another class for instance, G1s
- the inverse relationship should be observed.
- one-dimensional and two-dimensional sub-regions are used.
- One-dimensional syndrome for the variable X i is defined as the set of points in variable space for which inequalities b i ′ ⁇ X i > b i " are satisfied.
- Two-dimensional syndrome for variables X i' and X i" is defined as a set of points in variable space for which inequalities b i ′ ⁇ X i ′ > b i ′ " and b i " ′ ⁇ X i " > b i " " are satisfied.
- the syndromes are constructed at the initial stage of training using the optimal partitioning (OP) algorithm described below.
- SWS training algorithm is based on three major steps:
- the OP method is used for constructing the optimal syndromes for each class (G1 and G3) using the training set S ⁇ 0 .
- the OP is based on the optimal partitioning of some potential prognostic variable X i range that allows the best separation of the samples belonging to different classes.
- the chi-2 functional is used (Kuznetsov et al, 1998). The optimal partitions are searched inside observed variable domain that contain partitions with cut-off values not greater than a fixed threshold (defined below). The partition with the maximal value of the chi-2 functional is considered optimal for the given variable.
- R o , R 1 ,..., R m be optimal partitions of variable X i ranges that is calculated by training set S ⁇ 0 , S ⁇ 1 ,..., S ⁇ m , where S ⁇ k is the training set without description of the k th sample.
- b 1 k , ... , b r ⁇ 1 k be boundary points of optimal partition R k found by training set S ⁇ k ;
- D i is the variance of variable X i .
- the OP can be used at the initial stage of training for reducing the dimension of the prognostic variables set.
- Selection of the optimal set of prognostic variables depends on a sufficiently high partition value determined by the Chi-2 function.
- the additional criterion of selection of prognostic variables is the instability index ⁇ ( S ⁇ 0 , K j ,r ) .
- the variable is used if value ⁇ ( S ⁇ 0 ,K j ,r ) is less than threshold ⁇ 0 , defined a priori by the user.
- the partition of the given variable is instable ( ⁇ ( S ⁇ 0 , K j ,r ) ⁇ ⁇ 0 )
- the variable is removed from the final optimal set of prognostic variables.
- the optimal set of prognostic variables is defined if both selection criteria are fulfilled.
- Q ⁇ j 0 denote the set of constructed syndromes for class K j .
- x * denote the point of parametric space.
- the estimate of fraction v i j variance has the second term 1 m i 1 ⁇ v 0 j v 0 j , which is used to avoid a value equal to zero in cases when the given syndrome is associated only with objects of one class from the training set.
- Example 9 Derivation of a Classifier Comprising 264 Probe Sets (SWS Classifier 0)
- SWS optimal partitioning OP
- Appendix 1A Details are shown in Appendix 1A, Appendix 2, Appendix 3 and Appendix 4.
- Example 10 A Posteriori Probability for SWS Classifier 0 (264 Probe Sets) G1 and G3 Estimated by SWS Classifier 2
- a posterior probability for G1 and G3 was also estimated by SWS Classifier 2 for each tumour sample by the classical leave-one-out cross-validation procedure.
- SWS Classifier 1 We derived a classifier comprising 6 gene probe sets (5 genes) which we term the "SWS Classifier 1". 4.4% for class G1; and 5.5% for class G3 CERs were obtained with the SWS Classifier 1. See Figure 1 and Table D2 in section "SWS Classifier 1" of the Description.
- Appendix 5A, Appendix 5B and Appendix 5C show detailed information about selected gene probe sets, optimal partition boundaries, true classes, posterior probabilities and clinical significance of the SWS Classifier 1 predictor (estimated by patient survival analysis).
- SWS for the G1-G3 comparisons, maximal prediction accuracies are obtained with 18 probe sets (17 genes).
- This 18 probe set was used as the "SWS Classifier 2". See Table D3 in section "SWS Classifier 2" of the Description. This classifier includes all five genes represented by SWS Classifier 1.
- Appendix 6A, Appendix 6B and Appendix 6C show detailed information about selected gene probe sets, optimal partition boundaries, true classes, posterior probabilities and clinical significance of the SWS Classifier 2 (estimated by patient survival analysis).
- both the SWS Classifier 2 and PAM correctly classify ⁇ 96% (65/68) of the G1s and ⁇ 95% (52/55) of the G3s (by leave one-out method).
- the smaller number of probes sets required by SWS Classifier 1 (6 probe sets) compared to PAM (18 probe sets, data not presented) may reflect the ability of SWS to use more diverse interaction and/or co-expression patterns during variable selection.
- the posterior probability (Pr) is an estimate of the likelihood that a sample from the exam group of tumours belongs to one class (termed “G1-like”) or the other (ie, "G3-like”). Both 18 probesets SWS and PAM classifiers scored the vast majority of G1 and G3 tumours with high probabilities of class membership.
- tumours of the Uppsala cohort showed >75% probability of belonging to either the G1-like or G3-like class, indicating a highly discriminant statistical basis for the class prediction function of the SWS classifier 1 for the G2 class.
- SWS classifier 1 the best 6 probe sets from the 264 probe sets, and randomly selected two non-overlapping subsets (each of 40 probe sets) from the remaining 258 probe sets and applied the SWS algorithm to each subset.
- SWS classifier 3 (6-probe sets; Table D4 in section “SWS Classifier 3" of the Description and Appendix 7A) and SWS classifier 4 (7-probe sets; Table D5 in section “SWS Classifier 4" of the Description and Appendix 8A).
- Tables D4 and D5 are organized as Table D3.
- each of three SWS classifiers provide similar high accuracy of classification in G1-G3 comparisons (Tables D3-D5).
- SWS also provided high and reproducible levels of separation of G2a and G2b sub-groups for different cohorts and highly significant differences in G2a-G2b comparison based on survival analysis (Tables D3-D5).
- the genetic grade signature remained significantly associated with outcome in the different therapeutic contexts independent of the classical predictors, and is superior to both LN status and tumour size in all four treatment subgroups with the exception of systemic therapy where only tumour size is more significant.
- Hierarchical cluster analysis using this set of genes shows a striking separation of the G2 population into two primary tumour profiles highly resembling the G1 and G3 profiles and that separate well into the G2a and G2b classes. Indeed, all but 11 of these 264 gene probesets are also differentially expressed (at p ⁇ 0.05, Wilcoxon rank-sum test) between the G2a and G2b tumours.
- Table E4 displays a selected set of significantly enriched GO categories which includes cell cycle, inhibition of apoptosis, cell motility and stress response, suggesting an imbalance of these cellular processes between the G2a- and G2b-type tumour cells.
- Table E4. Gene ontology analysis of differentially expressed genes.
- Table S2 shows the complete list of GO categories and their p values. Table S2. Comprehensive table of significant gene ontology terms identified in the different tumour group comparisons.
- G2a vs. G2b tumours Biological Process NCBI REFLIST (23481) expected ratio observed ratio P value Cell cycle 853 7.08 50 5.69E-28 Mitosis 287 2.38 22 6.78E-15 Cell proliferation and differentiation 751 6.24 32 4.21E-14 Cell cycle control 390 3.24 23 3.50E-13 Chromosome segregation 102 0.85 10 2.00E-08 Cell structure 624 5.18 17 2.16E-05 Protein targeting and localization 225 1.87 10 2.27E-05 Cell structure and motility 1021 8.48 22 4.73E-05 DNA metabolism 305 2.53 11 5.82E-05 Oncogenesis 600 4.98 14 5.52E-04 DNA replication 89 0.74 5 9.62E-04 Protein phosphorylation 592 4.92 13 1.49E-03 Meiosis 68 0.56 4 2.65E-03 Inhibition of apoptosis
- NCBI REFLIST (23481) expected ratio observed ratio P value Cell cycle control 390 0.35 6 9.19E-07 Cell cycle 853 0.76 7 6.19E-06 Chromatin packag ing and remodeling 196 0.18 2 1.32E-02 Oncogenesis 600 0.54 3 1.57E-02 Nucleoside, nucleotide and nucleic acid metabolism 3372 3.02 7 2.31E-02 Mitosis 287 0.26 2 2.69E-02 Calcium ion homeostasis 32 0.03 1 2.82E-02 Developmental processes 2150 1.92 5 3.77E-02 mRNA transcription regulation 1553 1.39 4 4.63E-02 Molecular Function NCBI REFLIST (23481) expected ratio observed ratio P value Kinase activator 54 0.05 2 1.08E-03 Histone 99 0.09 2 3.54E-03 Kinase modulator 126 0.11 2 5.65E-03 Select regulatory molecule 979 0.88 4 1.02E-02 Nucleic acid binding 3014 2.7 7 1.29E-
- Protein levels of the proliferation marker Ki67 are also found to be significantly different between the G2a and G2b tumours (p ⁇ 0.0001; Figure 5B ).
- Example 20 The Grade Signature is More Than a Proliferative Marker
- the genetic and clinicopathological evidence suggests that the genetic grade signature reflects, among other properties, the proliferative capacity of tumour cells. That proliferation rate is positively correlated with poor outcome in breast cancer (23) could explain the prognostic capacity of the genetic grade signature.
- FOS and FOSB central components of the AP-1 transcription factor complex
- genes involved in cell cycle progression such as CCNE2, MAD2L1, ASK and ECT2 are expressed at higher levels in the G2a tumours.
- the G3 tumours showed higher expression of cell cycle genes such as CDC20, BRRN1 and TTK as well as proliferative genes with oncogenic potential including MYBL2, ECT2 and CCNE1 when compared to the G2b tumours, while the anti-apoptotic gene, BCL2, is expressed at higher levels in the G2b tumours.
- G2a tumours showed significant increases in tumour size (K), lymph node positivity (L), cellular mitoses (A), tubule formation (J) and Ki67 levels (B) compared to histologic G1 tumours
- the G3 population showed significant increases in tumour size (K), vascular growth (D), mitoses (A), tubule formation (J), cyclin E1 (F) and ER negative status (G) when compared to the G2b tumours.
- NPI The Nottingham Prognostic Index
- SWS and PAM small gene subsets capable of classifying histologic Grade I and Grade III tumours with high accuracy.
- the smallest gene signature (SWS) comprised of a mere 5 genes (6 probesets), partitioned the large majority of G2 tumours into two highly distinguishable subclasses with G1-like and G3-like properties (G2a and G2b, respectively).
- G2a and G2b tumours molecularly similar to those of histologic G1 and G3, respectively, but the disease-free survival curves of G2a and G2b patients are also highly resemblant of those of G1 and G3 patients.
- these observations are confirmed in a large independent breast cancer cohort.
- the prognostic value of the genetic grade signature we compared its performance to other major indicators of outcome in multivariate Cox regression models.
- the classifier In G2 tumours, not only did the classifier remain an independent predictor of disease recurrence, but it is consistently a more powerful predictor than lymph node status and tumour size, underscoring its value as a new prognostic indicator.
- the genetic grade signature When incorporated into the Nottingham Prognostic,Index (Haybittle et al., 1982), the genetic grade signature improved risk stratification for 25% of patients (compared to the classic NPI) and more than doubled the fraction of lymph node negative patients that should be classified into the excellent prognostic group and thus spared adjuvant treatment.
Landscapes
- Chemical & Material Sciences (AREA)
- Health & Medical Sciences (AREA)
- Life Sciences & Earth Sciences (AREA)
- Organic Chemistry (AREA)
- Proteomics, Peptides & Aminoacids (AREA)
- Pathology (AREA)
- Immunology (AREA)
- Zoology (AREA)
- Wood Science & Technology (AREA)
- Engineering & Computer Science (AREA)
- Analytical Chemistry (AREA)
- Genetics & Genomics (AREA)
- General Health & Medical Sciences (AREA)
- Microbiology (AREA)
- Biotechnology (AREA)
- Oncology (AREA)
- General Engineering & Computer Science (AREA)
- Bioinformatics & Cheminformatics (AREA)
- Biochemistry (AREA)
- Molecular Biology (AREA)
- Physics & Mathematics (AREA)
- Biophysics (AREA)
- Hospice & Palliative Care (AREA)
- Animal Behavior & Ethology (AREA)
- Nuclear Medicine, Radiotherapy & Molecular Imaging (AREA)
- Chemical Kinetics & Catalysis (AREA)
- Medicinal Chemistry (AREA)
- Pharmacology & Pharmacy (AREA)
- Public Health (AREA)
- Veterinary Medicine (AREA)
- General Chemical & Material Sciences (AREA)
- Measuring Or Testing Involving Enzymes Or Micro-Organisms (AREA)
- Apparatus Associated With Microorganisms And Enzymes (AREA)
Abstract
Description
- This application claims priority from Singapore Patent Application No
200607354-8 US provisional application serial number 60/862,519 filed October 23rd, 2007 - The foregoing applications, and each document cited or referenced in each of the present and foregoing applications, including during the prosecution of each of the foregoing applications ("application and article cited documents"), and any manufacturer's instructions or catalogues for any products cited or mentioned in each of the foregoing applications and articles and in any of the application and article cited documents, are hereby incorporated herein by reference. Furthermore, all documents cited in this text, and all documents cited or reference in documents cited in this text, and any manufacturer's instructions or catalogues for any products cited or mentioned in this text or in any document hereby incorporated into this text, are hereby incorporated herein by reference. Documents incorporated by reference into this text or any teachings therein may be used in the practice of this invention. Documents incorporated by reference into this text are not admitted to be prior art.
- The present invention relates to the fields of medicine, cell biology, molecular biology and genetics. More particularly, the invention relates to a method of assigning a grade to a breast tumour which reflects its aggressiveness.
- The effective treatment of cancer depends, to a large extent, on the accuracy with which malignant tissue can be subtyped according to clinicopathological features that reflect disease aggressiveness.
- Some clinical subtypes, despite phenotypic homogeneity, are associated with substantial clinical heterogeneity (e.g., refractory response to treatment) confounding their clinical meaning. Recent studies using DNA microarray technology suggest that such clinical heterogeneity may be resolvable at the molecular level (1-4). Indeed, some have demonstrated that gene expression signatures underlying specific biological properties of cancer cells may be superior indicators of clinical subtypes with robust prognostic value (1, 2). Thus, global analysis of gene expression has the potential to uncover molecular determinants of clinical heterogeneity providing a more objective and biologically-rational approach to cancer subtyping.
- Accordingly, there is a need in the art for gene markers which are diagnostic or reflective of tumourigenicity.
- In breast cancer, histologic grade is an important parameter for classifying tumours into morphological subtypes informative of patient risk. Grading seeks to integrate measurements of cellular differentiation and replicative potential into a composite score that quantifies the aggressive behaviour of the tumour.
- The most studied and widely used method of breast tumour grading is the Elston-Ellis modified Scarff, Bloom, Richardson grading system, also known as the Nottingham grading system (NGS) (5, 6, Haybittle et al, 1982). The NGS is based on a phenotypic scoring procedure that involves the microscopic evaluation of morphologic and cytologic features of tumour cells including degree of tubule formation, nuclear pleomorphism and mitotic count (6). The sum of these scores stratifies breast tumours into Grade I (G1) (well-differentiated, slow-growing), Grade II (G2) (moderately differentiated), and Grade III (G3) (poorly-differentiated, highly-proliferative) malignancies.
- Multivariate analyses in large patient cohorts have consistently demonstrated that the histologic grade of invasive breast cancer is a powerful prognostic indicator of disease recurrence and patient death independent of lymph node status and tumour size (6-9). Untreated patients with G1 disease have a ∼95% five-year survival rate, whereas those with G2 and G3 malignancies have survival rates at 5 years of ∼75% and ∼50%, respectively.
- However, the value of histologic grade in patient prognosis has been questioned by reports of substantial inter-observer variability among pathologists (10-13) leading to debate over the role that grade should play in therapeutic planning (14, 15). Furthermore, where the prognostic significance of G1 and G3 disease is of more obvious clinical relevance, it is less clear what the prognostic value is of the more heterogeneous, moderately differentiated Grade II tumours, which comprise approximately 50% of all breast cancer cases (9, 15, 16).
- There is therefore a need for methods which are capable of discriminating between heterogenous tumour grades, particularly Grade II breast tumours.
- We have now demonstrated that a gene expression signature comprising one or more of a set of 232 genes, represented by 264 probesets (e.g., Affymetrix probesets), is capable of discriminating between high and low grade tumours. Such a gene expression signature may be used to provide an objective and clinically valuable measure of tumour grade.
- We further describe a novel strategy of clinical class discovery that combines gene discovery and class prediction algorithms with patient survival analysis, and between-group statistical analyses of conventional clinical markers and gene ontologies represented by differentially expressed genes.
- Our findings show that the genetic reclassification of histologic grade reveals new clinical subtypes of invasive breast cancer and can improve therapeutic planning for patients with moderately differentiated tumours.
- Furthermore, our results support the view that tumours of low and high grade, as defined genetically, may reflect independent pathobiological entities rather than a continuum of cancer progression.
- According to a 1st aspect of the present invention, we provide a method of assigning a grade to a breast tumour, which grade is indicative of the aggressiveness of the tumour, the method comprising detecting the expression of a gene selected from the genes set out in Table D1 (SWS Classifier 0).
- There is provided, according to a 2nd aspect of the present invention, a method of classifying a
histological Grade 2 tumour into a low aggressiveness tumour or a high aggressiveness tumour, the method comprising assigning a grade to thehistological Grade 2 tumour according to the 1st aspect of the invention. - We provide, according to a 3rd aspect of the present invention, a method of predicting a survival rate for an individual with a
histological Grade 2 breast tumour, the method comprising assigning a grade to the breast tumour by a method according to any preceding aspect of the invention. - As a 4th aspect of the present invention, there is provided a method of prognosis of an individual with a breast tumour, the method comprising assigning a grade to the breast tumour by a method as described,
- We provide, according to a 5th aspect of the present invention, a method of diagnosis of aggressive breast cancer in an individual, the method comprising assigning a grade indicative of high aggressiveness to a breast tumour of the individual by a method as described.
- The present invention, in a 6th aspect, provides a method of choosing a therapy for an individual with breast cancer, the method comprising assigning a grade to the breast tumour by a method as described, and choosing an appropriate therapy based on the aggressiveness of the breast tumour.
- In a 7th aspect of the present invention, there is provided a method of treatment of an individual with breast cancer, the method comprising assigning a grade to the breast tumour by a method as described, and administering an appropriate therapy to the individual based on the aggressiveness of the breast tumour.
- According to an 8th aspect of the present invention, we provide a method of determining the likelihood of success of a particular therapy on an individual with a breast tumour, the method comprising comparing the therapy with the therapy determined by a such a method.
- We provide, according to a 9th aspect of the invention, a method of assigning a breast tumour patient into a prognostic group, the method comprising applying the Nottingham Prognostic Index to a breast tumour, in which the histologic grade score of the breast tumour is replaced by a grade obtained by a method as described.
- There is provided, in accordance with a 10th aspect of the present invention, a method of assigning a breast tumour patient into a prognostic group, the method comprising deriving a score which is the sum of the following: (a) (0.2 x tumour size in cm); (b) tumour grade in which the tumour grade is assigned by a method as described; and (c) lymph node stage; in which the tumour size and the lymph node stage are determined according to the Nottingham Prognostic Index, in which a patient with a score of 2.4 or less is categorised to a EPG (excellent prognostic group), a patient with a score of less than 3.4 is categorised to a GPG (good prognostic group), a patient with a score of between 3.4 and 5.4 is categorised to a MPG (moderate prognostic group), a patient with a score of greater than 5.4 is categorised to a PPG (poor prognostic group).
- As an 11th aspect of the invention, we provide a method of determining whether a breast tumour is a metastatic breast tumour, the method comprising assigning a grade to the breast tumour by a method as described.
- We provide, according to a 12th aspect of the invention, a method of identifying a molecule capable of treating or preventing breast cancer, the method comprising: (a) grading a breast tumour; (b) exposing the breast tumour to a candidate molecule; and (c) detecting a change in tumour grade; in which the grade or change thereof, or both, is assigned by a method as described.
- According to a 13th aspect of the present invention, we provide a molecule identified by such a method.
- There is provided, according to a 14th aspect of the present invention, use of such a molecule in a method of treatment or prevention of cancer in an individual.
- We provide, according to a 15th aspect of the present invention, a method of treatment of an individual suffering from breast cancer, the method comprising modulating the expression of a gene set out in Table D1 (SWS Classifier 0).
- According to a 16th aspect of the present invention, we provide a method of determining the proliferative state of a cell, the method comprising detecting the expression of a gene selected from the genes set out in Table D1 (SWS Classifier 0), in which: (a) a high level of expression of a gene which is annotated "3" in Column 7 ("Grade with Higher Expression") indicates a highly proliferative cell; (b) a high level of expression of a gene which is annotated "1" in Column 7 ("Grade with Higher Expression") indicates a non-proliferating cell or a slow-growing cell; (c) a low level of expression of a gene which is annotated "3" in Column 8 ("Grade with Lower Expression") indicates a highly proliferative cell; and (d) a low level of expression of a gene which is annotated "1" in Column 8 ("Grade with Lower Expression") indicates a non-proliferating cell or a slow-growing cell.
- According to a 17th aspect of the present invention, we provide a combination comprising the genes set out in Table D1 (SWS Classifier 0). We provide, according to an 18th aspect of the present invention, a combination comprising the probesets set out in Table D1 (SWS Classifier 0). According to a 19th aspect of the present invention, we provide a combination comprising the genes set out in the above aspects of the invention. As an 20th aspect of the invention, we provide a combination comprising the probesets set out in the above aspects of the invention. According to a 21st aspect of the present invention, we provide a combination according to any of the above aspects of the invention in the form of an array. According to a 21st aspect of the present invention, we provide a combination according to the above aspects of the invention in the form of a microarray.
- There is provided, according to a 22nd aspect of the present invention, a kit comprising such a combination, array or microarray, together with instructions for use in a method as described. We provide, according to a 23rd aspect of the present invention, use of such a combination, array or a microarray or kit in a method as described.
- The method may comprise a method of assigning a grade to a breast tumour as described.
- As a 24th aspect of the present invention, there is provided a computer implemented method of assigning a grade to a breast tumour, the method comprising processing expression data for one or more genes set out in Table D1 (SWS Classifier 0) and obtaining a grade indicative of aggressiveness of the breast tumour.
- We provide, according to a 25th aspect of the present invention, a program storage device readable by a machine, tangibly embodying a program of instructions executable by the machine to perform method of assigning a grade to a breast tumour, the method comprising: processing expression data for one or more genes set out in Table D1 (SWS Classifier 0); and obtaining a grade indicative of aggressiveness of the breast tumour.
- The practice of the present invention will employ, unless otherwise indicated, conventional techniques of chemistry, molecular biology, microbiology, recombinant DNA and immunology, which are within the capabilities of a person of ordinary skill in the art. Such techniques are explained in the literature. See, for example, J. Sambrook, E. F. Fritsch, and T. Maniatis, 1989, Molecular Cloning: A Laboratory Manual, Second Edition, Books 1-3, Cold Spring Harbor Laboratory Press; Ausubel, F. M. et al. (1995 and periodic supplements; Current Protocols in Molecular Biology, ch. 9, 13, and 16, John Wiley & Sons, New York, N.Y.); B. Roe, J. Crabtree, and A. Kahn, 1996, DNA Isolation and Sequencing: Essential Techniques, John Wiley & Sons; J. M. Polak and James O'D. McGee, 1990, In Situ Hybridization: Principle and Practice; Oxford University Press; M. J. Gait (Editor), 1984, Oligonucleotide Synthesis: A Practical Approach, Irl Press; D. M. J. Lilley and J. E. Dahlberg, 1992, Methods of Enzymology: DNA Structure Part A: Synthesis and Physical Analysis of DNA Methods in Enzymology, Academic Press; Using Antibodies : A Laboratory Manual: Portable Protocol NO. I by Edward Harlow, David Lane, Ed Harlow (1999, Cold Spring Harbor Laboratory Press, ISBN 0-87969-544-7); Antibodies : A Laboratory Manual by Ed Harlow (Editor), David Lane (Editor) (1988, Cold Spring Harbor Laboratory Press, ISBN 0-87969-314-2), 1855, Lars-Inge Larsson "Immunocytochemistry: Theory and Practice", CRC Press inc., Baca Raton, Florida, 1988, ISBN 0-8493-6078-1, John D. Pound (ed); "Immunochemical Protocols, vol 80", in the series: "Methods in Molecular Biology", Humana Press, Totowa, New Jersey, 1998, ISBN 0-89603-493-3, Handbook of Drug Screening, edited by Ramakrishna Seethala, Prabhavathi B. Fernandes (2001, New York, NY, Marcel Dekker, ISBN 0-8247-0562-9); Lab Ref: A Handbook of Recipes, Reagents, and Other Reference Tools for Use at the Bench, Edited Jane Roskams and Linda Rodgers, 2002, Cold Spring Harbor Laboratory, ISBN 0-87969-630-3; and The Merck Manual of Diagnosis and Therapy (17th Edition, Beers, M. H., and Berkow, R, Eds, ISBN: 0911910107, John Wiley & Sons). Each of these general texts is herein incorporated by reference.
-
-
Figure 1 . Schema of discovery and validation of the genetic G2a and G2b breast cancer groups. SWS: Statistically Weighted Syndromes method; PAM: Prediction Analysis for Microarray method; CER: Class Error Rate Function; p.s. probe set:G1:Grade 1; G3:Grade 2;G3:Grade 3; G2a:Grade 2a; G2b:Grade 2b; GO: gene ontology. -
Figure 2 . Probability (Pr) scores from the SWS classifier. Pr scores (0-1) generated by the class prediction algorithm are shown on the y-axes. Number of tumours per classification exercise is shown on the x-axis. Green indicatesGrade 1 tumours; red denotesGrade 3 tumours. -
Figure 3 . Survival differences between G2a and G2b genetic grade subtypes. Kaplan-Meier survival curves for G2a and G2b subtypes are shown superimposed on survival curves ofhistologic grades -
Figure 4 . Expression profiles of the top 264 grade (G1-G3) associated gene probesets. Gene probesets (rows) and tumours (columns) were hierarchically clustered by average linkage (Pearson correlation), then tumours were grouped according to grade while maintaining original cluster order within groups. Red reflects above mean expression, green denotes below mean expression, and black indicates mean expression. The degree of color saturation reflects the magnitude of expression relative to the mean. -
Figure 5 . Statistical analysis of clinicopathological markers. Measurements (or percentages of binary measurements) of clinicopathological variables assessed at the time of surgery were compared between different tumour subgroups: G1 vs. G2a, G2a vs. G2b, and G2b vs. G3. P-values are noted below subgroup designations. Average scores (or percentages) within each subgroup are shown as vertical bars with standard deviations. -
Figure 6 . Stratification of patient risk by classic NPI and ggNPI. (A) Kaplan-Meier survival curves are shown for the classic NPI categories: Good Prognostic Group (GPG); Moderate Prognostic Group (MPG); Poor Prognostic Group (PPG). (B) Kaplan-Meier survival curves are shown for risk groups determined by the classic NPI (black curves) and the NPI calculated with genetic grade assignments (ggNPI; colored curves). (C) Kaplan-Meier survival curves are shown for patients reclassified by ggNPI (colored curves indicate that reclassified patients have survival curves similar to the good, moderate and poor prognostic groups of the classic NPI (black curves)). (D) The disease-specific survival curves of node negative, untreated patients classified into the Excellent Prognostic Group (EPG) by classic NPI (black curve) or ggNPI (green curve) are compared. -
Figure 7 . Stratification of patient risk by classic NPI and ggNPI. Kaplan-Meier survival curves are shown for risk groups determined by the classic NPI (A) and the NPI calculated with genetic grade predictions (ggNPI) (B). Survival curves of patients reassigned to new risk groups by the ggNPI are shown (C). The disease-specific survival curve of the EPG patients (by classic NPI) is compared to that of patients identified as EPG exclusively by the ggNPI (D). Classic NPI curves from (A) are shown superimposed on (B-D). - We have identified a number of genes whose expression is indicative of breast tumour aggressiveness. Accordingly, we provide for methods of grading breast tumours, and therefore assigning a measure of their aggressiveness, by detecting the level of expression of one or more of these genes. The genes are provided in a number of gene sets, or classifiers.
- In a general aspect, we provide for the detection of any one or more of a small set of 264 gene probesets, which we term the "
SWS Classifier 0". This classifier represents 232 genes. In some embodiments, the expression of all of the 264 gene probesets are detected. For example, the expression of all the 232 genes represented by such probesets may be detected. - The genes comprised in this classifier are set out in Table D1 in the section "
SWS Classifier 0" below, in Table S1 in Example 20, as well as in Appendix A1. This and the other tables D2, D3, D4 and D5 (see below) contain the GenBank ID and the Gene Symbol of the gene, as well as the "Affi ID", or the "Affymetrix ID" number of a probe. Affymetrix probe set IDs and their corresponding oligonucleotide sequences, as well as the GenBank mRNA sequences they are designed from, can be accessed on the world wide web at the ADAPT website
(http://bioinformatics.picr.man.ac.uk/adapt/ProbeToGene.adapt) hosted by the Paterson Institute for Cancer Research. - In such an embodiment, therefore, our method comprises determining the expression level of at least one of the genes of the 264 gene probesets (for example, at least one of the 232 genes) in the classifier which we term the "
SWS Classifier 0". More than one, for example, a plurality of the genes of such a set may also be detected. The 264 gene probesets of theSWS Classifier 0 gene set are set out in Table D1 below. - In some embodiments, the expression level of more than one gene is detected. For example, the expression level of 5 or more genes may be detected. The expression level of a plurality of genes may therefore be determined. In some embodiments, the expression level of all 264 gene probesets (for example, the expression level of all 232 genes) may be detected, though it will be clear that this does not need to be so, and a smaller subset may be detected.
- We therefore provide for the detection of one or more, a plurality or all, of subsets comprising 17 genes and several subsets of 5-17 genes from the 264 gene probesets.
- Thus, alternatively, or in addition, our method may comprise determining the expression level of at least one, a plurality, or all of the genes of an 5 gene set which we term the "
SWS Classifier 1". The 5 genes of theSWS Classifier 1 gene set are set out in Table D2 below. - In other embodiments, our method may comprise determining the expression level of at least one, a plurality, or all of the genes of an 17 gene set which we term the "
SWS Classifier 2". The 17 genes of theSWS Classifier 2 gene set are set out in Table D3 below. - In other embodiments, our method may comprise determining the expression level of at least one, a plurality, or all of the genes of an 7 gene set which we term the "
SWS Classifier 3". The 7 genes of theSWS Classifier 3 gene set are set out in Table D4 below. - In other embodiments, our method may comprise determining the expression level of at least one, a plurality, or all of the genes of an 7 gene set which we term the "
SWS Classifier 4". The 7 genes of theSWS Classifier 4 gene set are set out in Table D5 below. - In specific embodiments, the methods comprise detection of the expression level of all of the genes in the gene set of interest. For example, all 5 genes in the "
SWS Classifier 1" are detected, all 17 genes in the "SWS Classifier 2" are detected, all 7 genes in the "SWS Classifier 3" are detected and all 7 genes of theSWS Classifier 4 gene set are detected in these embodiments. - Where the
SWS Classifier 1, theSWS Classifier 2, theSWS Classifier 3 or theSWS Classifier 4 are used, each of Tables D2, D3, D4 and D5 provide indications of the grades to be assigned to the tumour depending on the level of expression of the relevant gene which is detected (inColumns 7 and 8 respectively). - Thus, the tables also contain columns showing the grades associated with high and low levels of expression of a particular gene, in
Columns 7 and 8 of Table D1 for example. Thus, for example, the gene Barren homolog (Drosophila) is annotated to the effect that the "Grade with Higher Expression" is 3, while the "Grade with Lower Expression" is 1. Accordingly, our method provides that the tumour has a grade of 3 if a high level of expression of Barren homolog (Drosophila) is detected in or from the tumour. If a low level of this gene is detected in or from the tumour, then a grade of 1 may be assigned to that tumour. - Detection of gene expression, for example for tumour grading, may suitably be done by any means as known in the art, and as described in further detail below.
- The methods described here for gene expression analysis and tumour grading may be automated, or partially or completely controlled by a controller such as a microcomputer. Thus, any of the methods described here may comprise computer implemented methods of assigning a grade to a breast tumour. For example, such a method may comprise processing expression data for one or more genes set out in Table D1 (
SWS 0 Classifier) and obtaining a grade indicative of aggressiveness of the breast tumour. - The methods described here are suitably capable of classifying a breast tumour to an accuracy of at least 85%, at least 90% accuracy, or at least 95% accuracy, with reference to the grade obtained by conventional means, such as for example grading of the breast tumour by histological grading. For example, the methods may be capable of classifying tumours with grades corresponding to
histological Grade 1 andhistological Grade 3 tumours with an accuracy of 70% or above, 80% or above, or 90% or above. - In a refinement of our methods, we provide for a "cut-off" level of expression, by which the expression of a gene in or from a tumour may be judged in order to establish whether the expression is at a "high" level, or at a "low" level. The cut-off level is set out in
Column 9 of Tables D1, D2, D3, D4 and D5. - Accordingly, in some embodiments, our methods include assigning a grade based on whether the level of expression falls below or exceeds the cut-off. In some embodiments, the cut-off values are determined as the natural log transform normalised signal intensity measurement for Affymetrix arrays. In such embodiments, the cut-off values may be determined as a global mean normalisation with a scaling factor of 500.
- For example, referring back to Table 1, the cut-off level of expression for the gene Barren homolog (Drosophila) is 5.9167 units (see above and formula (1), Microarray Method). Where a given tumour contains a level of expression of this gene that exceeds this level, then it is determined to be a "high" level of expression. A grade of 3 may then be assigned to that tumour. On the other hand, if the expression of the Barren homologue falls below this cut-off level, then the expression is judged to be a "low" level of expression. A grade of 1 may be assigned to the tumour in this event.
- Thus, we provide for a method which comprises detecting a high level of expression of a gene in
SWS Classifier 0 and assigning the grade set out in Column 7 of Table D1 to the breast tumour. The method may comprise, or optionally further comprise detecting a low level of expression of the gene and assigning the grade set out inColumn 8 of Table D1 to the breast tumour. A high level of expression may be detected if the expression level of the gene is above the expression level set out inColumn 9 of Table D1, and a low level of expression is detected if the expression level of the gene is below that level. - There are various methods by which expression levels of a gene may be detected, and these are known in the art. Examples include RT-PCR, RNAse protection, Northern blotting, Western blotting etc. The gene expression level may be determined at the transcript level, or at the protein level, or both. The detection may be manual, or it may be automated. It is envisaged that any one or a combination of these methods may be employed in the methods and compositions described here.
- The detection of expression of a plurality of genes is suitably detected in the form of an expression profile of the plurality of genes, by conventional means known in the art. In some embodiments, the detection is by means of microarray hybridisation.
- For example, a sample of a tumour may be taken from a patient and processed for detection of gene expression levels. Gene expression levels may be detected in the form of nucleic acid or protein levels or both, for example. Analysis of nucleic acid expression levels may be suitably performed by amplification techniques, such as polymerase chain reaction (PCR), rolling circle amplification, etc. Detection of expression levels is suitably performed by detecting RNA levels. This can be performed by means known in the art, for example, real time polymerase chain reaction (RT-PCR) or RNAse protection, etc. For this purpose, we provide for sets of one or more primers or primer pairs which are capable of amplifying any one or more of the genes in the classifiers disclosed herein. Specifically, we provide for a set of primer pairs capable of amplifying all of the genes in the
SWS Classifier 0,SWS Classifier 1,SWS Classifier 2,SWS Classifier 3 orSWS Classifier 4 sets. - Suitably, RNA expression levels may be detected by hybridisation to a microchip or array, for example, a microchip or array comprising the genes or probesets corresponding to the specific classifier of interest, as described in the Examples. In some embodiments, the gene expression data or profile is derived from microarray hybridisation to for example an Affymetrix microarray.
- Detection of protein levels may be performed by for example, immunoassays including ELISA or sandwich immunoassays using antibodies against the protein or proteins of interest (for example as described in
US6664114 . The detection may be performed by use of a "dip stick" which comprises impregnated antibodies against polypeptides of interest, such as described inUS2004014094 . - We provide therefore for sets of one or more antibodies which are capable of binding specifically to any one or more of the proteins encoded by the genes in the classifiers disclosed herein. Specifically, we provide for a set of antibodies capable of amplifying all of the genes in the
SWS Classifier 0,SWS Classifier 1,SWS Classifier 2,SWS Classifier 3 orSWS Classifier 4 sets. - The grade may be assigned by any suitable method. For example, it may be assigned applying a class prediction algorithm comprising a nearest shrunken centroid method (Tibshirani, et al., 2002, Proc Natl Acad Sci U S A. 99(10): 6567-6572) to the expression data of the plurality of genes. The class prediction algorithm may suitably comprise Statistically Weighted Syndromes (SWS) or Prediction Analysis of Microarrays (PAM).
- In some embodiments, the grade of the tumour may be assigned by applying a class prediction algorithm comprising one or more of the steps set out here. First, a set of predictor parameters (i.e., probesets) may be obtained, based on predictors which discriminate the histologic tumours G1 and G3. Next, the potentially predictive parameters (i.e. signal intensity values of micro-array) may be recoded to obtain cut-off values for robust discrete-valued variables. The recoding may be done in such a way as to maximize an informativity measure of discrimination ability of the parameter and minimize its instability to the discrimination object (i.e. patients) belonging to distinct classes (i.e. G1 and G3). Then, statistically robust discrete-valued variables and combinations thereof may be selected for further construction of class prediction algorithm. A sum of the statistically weighted discrete-valued variables and combinations thereof may be obtained based on the Weighted Voting Procedure procedure described in SWS method section. Finally, a predictive outcome (classification) scores of breast cancer subtypes based on the sum for sub-typing (re-classification) histologic G2 tumours may be obtained.
- In suitable embodiments, the method is applied to grade breast tumours which are traditionally graded as
Grade 2 by conventional means, such as by histological grading as known in the art. Our method is capable of distinguishing the aggressiveness of tumours within the group of tumours in Grade 2 (which were hitherto thought to be homogenous) intoGrade 1 like tumours (i.e., more aggressive) andGrade 3 like tumours (i.e., less aggressive). This is described in detail in the Examples. - Accordingly, we provide for a method of classifying a
histological Grade 2 tumour into a low aggressiveness tumour or a high aggressiveness tumour. In other words, we provide a method for reassigning a more precise grading to a tumour which has been graded histologically as aGrade 2 tumour. - Such a method comprises assigning a grade to the
histological Grade 2 tumour according to any of the methods described above. For example, the expression of any one or more genes, for example, all the genes, in any of the SWS Classifiers described here may be detected and a grade of 1 or 3 assigned usingColumns - Such a tumour which has been reassigned will suitably have one or more characteristics or features of the reassigned grade. The characteristics or features may include one or more histological or morphological features, susceptibility to treatment, rate of growth or proliferation, degree of differentiation, aggressiveness, etc. As an example, the characteristic or feature may comprise aggressiveness.
- For example, a
histological Grade 2 breast tumour which has been assigned a low aggressiveness grade by the gene expression detection methods described here may suitably have at least one feature of ahistological Grade 1 breast tumour. Similarly, a breast tumour assigned a high aggressiveness grade may have at least one feature of ahistological Grade 3 breast tumour. - Such a feature may comprise degree of differentiation (e.g., well-differentiated, moderately differentiated or poorly-differentiated). The feature may comprise rate of growth (e.g., slow-growing, fast-growing). The feature may comprise rate of proliferation (e.g., slow-proliferation, highly-proliferative). The feature may comprise likelihood of tumour recurrence post-surgery. The feature may comprise survival rate. The feature may comprise likelihood of tumour recurrence post-surgery and survival rate. The feature may comprise a disease free survival rate. The feature may comprise susceptibility to treatment.
- Accordingly, application of the grading methods described here enables the classification of the
histological Grade 2 tumour into aGrade 1 tumour or aGrade 3 tumour, so as to allow the clinician to treat the tumour accordingly in view of its aggressiveness, prognosis, etc. - Such regrading using our methods is suitably capable of classifying
histological Grade 2 tumours intoGrade 1 like and/ orGrade 3 like tumours with an accuracy of 70% or above, 80% or above, or 90% or above. - The histological grading may be performed by any means known in the art. For example, the breast tissue or tumour may be graded by the Nottingham Grading System (NGS) or the Elston-Ellis Modified Scarff, Bloom, Richardson Grading System, both methods being well known in the art.
- The information obtained from the regrading may be used to predict any of the parameters which may be useful to the clinician. The parameter may include, for example, likelihood of tumour metastasis, prognosis of the patient, survival rate, possibility of recovery and recurrence, etc, depending on the grade of the tumour which has been reassigned to the
histological Grade 2 tumour. We therefore describe a method of determining whether a breast tumour is a metastatic breast tumour, the method comprising assigning a grade to the breast tumour as described using gene expression data. - We describe a method of predicting a survival rate for an individual with a
histological Grade 2 breast tumour, the method comprising assigning a grade to the breast tumour using gene expression data as described. A low aggressiveness grade may suitably indicate a high probability of survival and a high aggressiveness grade may suitably indicate a low probability of survival. We also provide for a method of prognosis of an individual with a breast tumour, the method comprising assigning a grade to the breast tumour by a method as described, and a method of diagnosis of aggressive breast cancer in an individual, the method comprising assigning a grade indicative of high aggressiveness to a breast tumour of the individual by a method as described. - The methods of gene expression analysis may be employed for determining the proliferative state of a cell. For example, such a method may comprise detecting the expression of a gene selected from the genes set out in Table D1 (SWS Classifier 0). Where a high level of expression of a gene which is annotated "3" in Column 7 is detected, this may indicate a highly proliferative cell. Similarly, where a high level of expression of a gene which is annotated "1" in Column 7 is detected, a non-proliferating cell or a slow-growing cell may be indicated. If a low level of expression of a gene which is annotated "3" in
Column 8 is detected, this may indicate a highly proliferative cell and where a low level of expression of a gene which is annotated "1" inColumn 8 is detected, this indicates a non-proliferating cell or a slow-growing cell. - The classifiers are described herein as combinations of probesets, and the skilled person will be aware that more than one probeset can correspond to one gene. Accordingly, the
SWS Classifier 0 contains 264 probesets which represent 232 genes. It will be clear therefore that the invention encompasses detection of expression level of one or more genes, and/or one or more probesets within the relevant classifiers, or any combination of this. - Suitably, the information obtained by the regarding may also be used by the clinician to recommend a suitable treatment, in line with the grade of the tumour which has been reassigned.
- Thus, a tumour which has been reassigned to
Grade 1 may require less aggressive treatment than a tumour which has been reassigned toGrade 3, for example. We therefore describe a method of choosing a therapy for an individual with breast cancer, the method comprising assigning a grade to the breast tumour by a method as described herein, and choosing an appropriate therapy based on the aggressiveness of the breast tumour. In general, the method may be employed for the treatment of an individual with breast cancer, by assigning a grade to the breast tumour and administering an appropriate therapy to the individual based on the aggressiveness of the breast tumour. - In general, we disclose a method of treatment of an individual suffering from breast cancer, the method comprising modulating the expression of a gene set out in Table D1 (SWS Classifier 0), Table D2 (
SWS 1 Classifier), Table D3 (SWS Classifier 2), Table D4 (SWS Classifier 3) and/or Table D5 (SWS Classifier 4). - It will be evident that any of the diagnosis and treatment methods may suitably be combined with other methods of assessing the aggressiveness of the tumour, the patient's health and susceptibility to treatment, etc. For example, the diagnosis or choice of therapy may be determined by further assessing the size of the tumour, or the lymph node stage or both, optionally together or in combination with other risk factors
- Specifically, the choice of therapy may be determined by assessing the Nottingham Prognostic Index (NPI). The NPI is described in detail in Haybittle, et al., 1982. In combination with the grading methods described here, the method is suitable for assigning a breast tumour patient into a prognostic group. Such a combined method comprises deriving a score which is the sum of the following: (a) (0.2 x tumour size in cm); (b) tumour grade in which the tumour grade is assigned by a method according to any of the gene expression detection methods described herein; and (c) lymph node stage; in which the tumour size and the lymph node stage are determined according to the Nottingham Prognostic Index, in which a patient with a score of 2.4 or less is categorised to a EPG (excellent prognostic group), a patient with a score of less than 3.4 is categorised to a GPG (good prognostic group), a patient with a score of between 3.4 and 5.4 is categorised to a MPG (moderate prognostic group), a patient with a score of greater than 5.4 is categorised to a PPG (poor prognostic group).
- Alternatively, or in addition, a method of assigning a breast tumour patient into a prognostic group may comprise applying the Nottingham Prognostic Index to a breast tumour, but modified such that the histologic grade score of the breast tumour is replaced by a grade obtained by a gene expression detection method as described in this document.
- Other factors which may of course be assessed for determining the choice of therapy may include receptor status, such as oestrogen receptor (ER) or progesterone receptor (PR) status, as known in the art. For example, the choice of therapy may be determined by further assessing the oestrogen receptor (ER) status of the breast tumour.
- We further provide for combinations of genes according to the various classifiers disclosed in this document. Such combinations may comprise mixtures of genes or corresponding probes, such as in a form which is suitable for detection of expression. For example, the combination may be provided in the form of DNA in solution.
- In other embodiments, a microarray or chip is provided which comprises any combination of genes or probes, in the form of cDNA, genomic DNA, or RNA, within the classifiers. In some embodiments, the microarray or chip comprises all the genes or probes in
SWS Classifier 0,SWS Classifier 1,SWS Classifier 2,SWS Classifier 3 orSWS Classifier 4. The genes may be synthesised or obtained by means known in the art, and attached on the microarray or chip by conventional means, as known in the art. Such microarrays or chips are useful in monitoring gene expression of any one or more of the genes comprised therein, and may be used for tumour grading or detection as described here. - We further describe a probe set consisting of a probe or probes having Affymetrix ID numbers as set out in
Column 6 of Table D1, Table D2, Table D3, Table D4 or Table D5. Specifically, we describe an array, such as a microarray, comprising the probesets set out in Table D1 (SWS Classifier 0). We also describe an array such as a microarray comprising the genes or probesets set out in Table D2 (SWS 1 Classifier), an array such as a microarray comprising the genes or probesets set out in Table D3 (SWS Classifier 2), an array such as a microarray comprising the genes or probesets set out in Table D4 (SWS3 Classifier), and an array such as a microarray comprising the genes or probesets set out in Table D5 (SWS Classifier 4). - The probes or probe sets are suitably synthesised or made by means known in the art, for example by oligonucleotide synthesis, and may be attached to a microarray for easier carriage and storage. They may be used in a method of assigning a grade to a breast tumour as described herein.
- We describe the use of Statistically Weighted Syndromes (SWS) on gene expression data which may comprise microarray gene expression data. We describe the use of SWS for gene discovery. We further describe such use in combination with Prediction Analysis of Microarrays (PAM). We describe the use of SWS to identify gene sets diagnostic of cancer status, such as breast cancer status or proliferative status.
- The methods and compositions described here may be used for identifying molecules capable of treating or preventing breast cancer, which may be used as drugs for cancer treatment. Such a method comprises: (a) grading a breast tumour as described using gene expression data; (b) exposing the breast tumour to a candidate molecule; and (c) detecting a change in tumour grade. The change in tumour grade is suitably determined by grading a breast tumour as described using gene expression data before and after exposure of the breast tumour to a candidate molecule. We provide molecule identified by such a method, for example for use in breast cancer treatment.
- Particular screening applications relate to the testing of pharmaceutical compounds in drug research. The reader is referred generally to the standard textbook "In vitro Methods in Pharmaceutical Research", Academic Press, 1997, and
U.S. Pat. No. 5,030,015 ). Assessment of the activity of candidate pharmaceutical compounds generally involves combining the breast cancer cells with the candidate compound, determining any change in the tumour grade, as determined by the gene expression detection methods described herein of the cells that is attributable to the compound (compared with untreated cells or cells treated with an inert compound), and then correlating the effect of the compound with the observed change. - The screening may be done, for example, either because the compound is designed to have a pharmacological effect on certain cell types such as tumour cells, or because a compound designed to have effects elsewhere may have unintended side effects. Two or more drugs can be tested in combination (by combining with the cells either simultaneously or sequentially), to detect possible drug-drug interaction effects. In some applications, compounds are screened initially for potential toxicity (Castell et al., pp. 375-410 in "In vitro Methods in Pharmaceutical Research," Academic Press, 1997). Cytotoxicity can be determined in the first instance by the effect on cell viability, survival, morphology, and expression or release of certain markers, receptors or enzymes. Effects of a drug on chromosomal DNA can be determined by measuring DNA synthesis or repair. [3H]thymidine or BrdU incorporation, especially at unscheduled times in the cell cycle, or above the level required for cell replication, is consistent with a drug effect. The reader is referred to A. Vickers (PP 375-410 in "In vitro Methods in Pharmaceutical Research," Academic Press, 1997) for further elaboration.
- Candidate molecules subjected to the assay and which are found to be of interest may be isolated and further studied. Methods of isolation of molecules of interest will depend on the type of molecule employed, whether it is in the form of a library, how many candidate molecules are being tested at any one time, whether a batch procedure is being followed, etc.
- The candidate molecules may be provided in the form of a library. In an embodiment, more than one candidate molecule is screened simultaneously. A library of candidate molecules may be generated, for example, a small molecule library, a polypeptide library, a nucleic acid library, a library of compounds (such as a combinatorial library), a library of antisense molecules such as antisense DNA or antisense RNA, an antibody library etc, by means known in the art. Such libraries are suitable for high-throughput screening. Tumour cells may be exposed to individual members of the library, and the effect on tumour grade, if any, cell determined. Array technology may be employed for this purpose. The cells may be spatially separated, for example, in wells of a microtitre plate.
- In an embodiment, a small molecule library is employed. By a "small molecule", we refer to a molecule whose molecular weight may be less than about 50 kDa. In particular embodiments, a small molecule has a molecular weight may be less than about 30 kDa, such as less than about 15 kDa, or less than 10 kDa or so. Libraries of such small molecules, here referred to as "small molecule libraries" may contain polypeptides, small peptides, for example, peptides of 20 amino acids or fewer, for example, 15, 10 or 5 amino acids, simple compounds, etc.
- Alternatively or in addition, a combinatorial library, as described in further detail below, may be screened for candidate modulators of tumour function.
- Libraries, in particular, libraries of candidate molecules, may suitably be in the form of combinatorial libraries (also known as combinatorial chemical libraries).
- A "combinatorial library", as the term is used in this document, is a collection of multiple species of chemical compounds that consist of randomly selected subunits. Combinatorial libraries may be screened for molecules which are capable of changing the choice by a stem cell between the pathways of self-renewal and differentiation.
- Various combinatorial libraries of chemical compounds are currently available, including libraries active against proteolytic and non-proteolytic enzymes, libraries of agonists and antagonists of G-protein coupled receptors (GPCRs), libraries active against non-GPCR targets (e.g., integrins, ion channels, domain interactions, nuclear receptors, and transcription factors) and libraries of whole-cell oncology and anti-infective targets, among others. A comprehensive review of combinatorial libraries, in particular their construction and uses is provided in Dolle and Nelson (1999), Journal of Combinatorial Chemistry, . Reference is also made to Combinatorial peptide library protocols (edited by Shmuel Cabilly, Totowa, N.J. : Humana Press, c1998. Methods in Molecular Biology ; v. 87). Specific combinatorial libraries and methods for their construction are disclosed in United States Patent
6,168,914 (Campbell, et al ), as well as in Baldwin et al. (1995), "Synthesis of a Small Molecule Library Encoded with Molecular Tags," J. Am. Chem. Soc. 117:5588-5589, and in the references mentioned in those documents. - Further references describing chemical combinatorial libraries, their production and use include those available from the URL http://www.netsci.org/Science/Combichem/, including The Chemical Generation of Molecular Diversity. Michael R. Pavia, Sphinx Pharmaceuticals, A Division of Eli Lilly (Published July, 1995); Combinatorial Chemistry: A Strategy for the Future - MDL Information Systems discusses the role its Project Library plays in managing diversity libraries (Published July, 1995); Solid Support Combinatorial Chemistry in Lead Discovery and SAR Optimization, Adnan M. M. Mjalli and Barry E. Toyonaga, Ontogen Corporation (Published July, 1995); Non-Peptidic Bradykinin Receptor Antagonists From a Structurally Directed Non-Peptide Library. Sarvajit Chakravarty, Babu J. Mavunkel, Robin Andy, Donald J. Kyle*, Scios Nova Inc. (Published July, 1995); Combinatorial Chemistry Library Design using Pharmacophore Diversity Keith Davies and Clive Briant, Chemical Design Ltd. (Published July, 1995); A Database System for Combinatorial Synthesis Experiments - Craig James and David Weininger, Daylight Chemical Information Systems, Inc. (Published July, 1995); An Information Management Architecture for Combinatorial Chemistry, Keith Davies and Catherine White, Chemical Design Ltd. (Published July, 1995); Novel Software Tools for Addressing Chemical Diversity, R. S. Pearlman, Laboratory for Molecular Graphics and Theoretical Modeling, College of Pharmacy, University of Texas (Published June/July, 1996); Opportunities for Computational Chemists Afforded by the New Strategies in Drug Discovery: An Opinion, Yvonne Connolly Martin, Computer Assisted Molecular Design Project, Abbott Laboratories (Published June/July, 1996); Combinatorial Chemistry and Molecular Diversity Course at the University of Louisville: A Description, Arno F. Spatola, Department of Chemistry, University of Louisville (Published June/July, 1996); Chemically Generated Screening Libraries: Present and Future. Michael R. Pavia, Sphinx Pharmaceuticals, A Division of Eli Lilly (Published June/July, 1996); Chemical Strategies For Introducing Carbohydrate Molecular Diversity Into The Drug Discovery Process.. Michael J. Sofia, Transcell Technologies Inc. (Published June/July, 1996); Data Management for Combinatorial Chemistry. Maryjo Zaborowski, Chiron Corporation and Sheila H. DeWitt, Parke-Davis Pharmaceutical Research, Division of Warner-Lambert Company (Published November, 1995); and The Impact of High Throughput Organic Synthesis on R&D in Bio-Based Industries, John P. Devlin (Published March, 1996).
- Techniques in combinatorial chemistry are gaining wide acceptance among modern methods for the generation of new pharmaceutical leads (Gallop, M. A. et al., 1994, J. Med. Chem. 37:1233-1251; Gordon, E. M. et al., 1994, J. Med. Chem. 37:1385-1401.). One combinatorial approach in use is based on a strategy involving the synthesis of libraries containing a different structure on each particle of the solid phase support, interaction of the library with a soluble receptor, identification of the 'bead' which interacts with the macromolecular target, and determination of the structure carried by the identified 'bead' (Lam, K. S. et al., 1991, Nature 354:82-84). An alternative to this approach is the sequential release of defined aliquots of the compounds from the solid support, with subsequent determination of activity in solution, identification of the particle from which the active compound was released, and elucidation of its structure by direct sequencing (Salmon, S. E. et al., 1993, Proc.Natl.Acad.Sci.USA 90:11708-11712), or by reading its code (Kerr, J. M. et al., 1993, J.Am.Chem.Soc. 115:2529-2531; Nikolaiev, V. et al., 1993, Pept. Res. 6:161-170; Ohlmeyer, M. H. J. et al., 1993, Proc.Natl.Acad.Sci.USA 90:10922-10926). '
- Soluble random combinatorial libraries may be synthesized using a simple principle for the generation of equimolar mixtures of peptides which was first described by Furka (Furka, A. et al., 1988, Xth International Symposium on Medicinal Chemistry, Budapest 1988; Furka, A. et al., 1988, 14th International Congress of Biochemistry, Prague 1988; Furka, A. et al., 1991, Int. J. Peptide Protein Res. 37:487-493). The construction of soluble libraries for iterative screening has also been described (Houghten, R. A. et al.1991, Nature 354:84-86). K. S. Lam disclosed the novel and unexpectedly powerful technique of using insoluble random combinatorial libraries. Lam synthesized random combinatorial libraries on solid phase supports, so that each support had a test compound of uniform molecular structure, and screened the libraries without prior removal of the test compounds from the support by solid phase binding protocols (Lam, K. S. et al., 1991, Nature 354:82-84).
- Thus, a library of candidate molecules may be a synthetic combinatorial library (e.g., a combinatorial chemical library), a cellular extract, a bodily fluid (e.g., urine, blood, tears, sweat, or saliva), or other mixture of synthetic or natural products (e.g., a library of small molecules or a fermentation mixture).
- A library of molecules may include, for example, amino acids, oligopeptides, polypeptides, proteins, or fragments of peptides or proteins; nucleic acids (e.g., antisense; DNA; RNA; or peptide nucleic acids, PNA); aptamers; or carbohydrates or polysaccharides. Each member of the library can be singular or can be a part of a mixture (e.g., a compressed library). The library may,contain purified compounds or can be "dirty" (i.e., containing a significant quantity of impurities).
- Commercially available libraries (e.g., from Affymetrix, ArQule, Neose Technologies, Sarco, Ciddco, Oxford Asymmetry, Maybridge, Aldrich, Panlabs, Pharmacopoeia, Sigma, or Tripose) may also be used with the methods described here.
- In addition to libraries as described above, special libraries called diversity files can be used to assess the specificity, reliability, or reproducibility of the new methods. Diversity files contain a large number of compounds (e.g., 1000 or more small molecules) representative of many classes of compounds that could potentially result in nonspecific detection in an assay. Diversity files are commercially available or can also be assembled from individual compounds commercially available from the vendors listed above.
- The breast tumour is surgically resected, processed, and snap frozen. A frozen portion of the tumour is processed for total RNA extraction using the Qiagen RNeasy kit (Qiagen, Valencia, CA). Briefly, frozen tumours are cut into minute pieces, and pieces totalling ∼50-100 milligrams (mg) are homogenized for 40 seconds in RNeasy Lysis Buffer (RLT). Proteinase K is added, and the samples are incubated for 10 minutes at 55 degrees C, followed by centrifugation and the addition of ethanol. After transferring the supernatant into RNeasy columns, DNase is added. Collected RNA is then assessed for quality using an Agilent 2100 bioanalyzer (Agilent Technologies, Rockville, MD) or by agarose gel. The RNA is stored at minus -70 degrees C.
- Labeled cRNA target is generated for microarray hybridization essentially according to the Affymetrix protocol (Affymetrix, Santa Clara, CA). Briefly, approximately 5 micrograms (µg) of total RNA are reversed transcribed into first-strand cDNA using a T7-linked oligo-dT primer, followed by second strand synthesis. A T7 RNA polymerase is then used to linearly amplify antisense RNA. This "cRNA" is biotinylated and chemically fragmented at 95°C. Ten µg of the fragmented, biotinylated cRNA is hybridized at 45°C for 16 hours to an Affymetrix high-density oligonucleotide GenChip array. The array is then washed and stained with streptavidin-phycoerythrin (10 µg/ml). Signal amplification is achieved using a biotinylated anti-streptavidin antibody. The scanned images are inspected for the presence of artifacts. In case of defects, the hybridization procedure is repeated. Expression values and detection calls are computed from raw data following the procedures outlined for the Affymetrix MAS 5.0 analysis software. Global mean normalization of the gene expression by hybridization signals across all arrays is used to control for differences in chip hybridization signal intensity values. To do that for a given array j(j = 1,2,...M), we calculated normalization coefficients kj (j = 1,2,..., n), by the following formula:

- The microarray-derived normalized numerical expression values corresponding to the genetic grade signature genes are used as input for the SWS algorithm.
- The RNA purification and microarray analysis methodologies above reflect only our "preffered methods", and that other variants exist that could be used in conjunction with our Process for Predicting Patient Outcome...For example, the starting material could be formalin-fixed paraffin-embedded tumour material instead of fresh frozen material, or the RNA might be extracted using a Cesium Chloride Gradient method, or the RNA could be analyzed by NimbleGen Microarrays that include DNA probes corresponding to our genes of interest. And it should also be noted that a microarray may not be necessary at all to determine the expression levels of our signature genes, but rather their expression could be quantitatively measured by PCR-based techniques such as real time-PCR.
-
Table D1: SWS Classifiers 0: 264 Probesets. Order UGID(build #177) UnigeneName Gene Symbol Genbank Acc Affi ID Grade with Higher Expression Grade with Lower Expression Cut-Off Chi-2 Instability indices 1 Hs.528654 Hypothetical protein FLJ11029 FLJ11029 BG165011 B.228273_at 3 1 7.7063 95.973 0.011 2 acc_NM_00 3158.1 NM_003158 A.208079_s_at 3 1 6.6526 95.599 0.002 3 Hs.308045 Barren homolog (Drosophila) BRRN1 D38553 A.212949_at 3 1 5.9167 92.640 0.006 4 Hs.35962 CDNA clone IMAGE:4452583, partial cds BG492359 B.226936_at 3 1 7.5619 92.601 0.003 5 Hs.184339 Maternal embryonic leucine zipper kinase MELK NM_014791 A.204825_at 3 1 7.1073 90.110 0.002 6 Hs.250822 Serine/threonine kinase 6 STK6 NM_003600 A.204092_s_at 3 1 6.7266 88.639 0.003 7 Hs.9329 TPX2, microtubule-associated protein homolog (Xenopus laevis) TPX2 AF098158 A.210052_s_at 3 1 7.4051 86.239 0.001 8 Hs.1594 Centromere protein A, 17kDa CENPA NM_001809 A.204962_s_at 3 1 6.344 85.316 0.037 9 Hs.198363 MCM10 minichromosome maintenance deficient 10 (S. cerevisiae) MCM10 AB042719 B.222962_s_at 3 1 6.1328 85.176 0.001 10 Hs.48855 Cell division cycle associated 8 CDCA8 BC001651 A.221520_s_at 3 1 5.2189 85.152 0.018 11 Hs.169840 TTK protein kinase TTK NM_003318 A.204822_at 3 1 6.2397 82.242 0.017 12 Hs.69360 Kinesin family member 2C KIF2C U63743 A.209408_at 3 1 7.3717 82.105 0.006 13 Hs.55028 CDNA clone IMAGE:6043059, partial cds BF111626 B.228559_at 3 1 7.2212 82.105 0.001 14 Hs.511941 Forkhead box M1 FOXM1 NM_021953 A.202580_x_at 3 1 6.5827 81.868 0.001 15 Hs.3104 Kinesin family member 14 KIF14 AW183154 B.236641_at 3 1 6.4175 81.868 0.023 16 Hs.179718 V-myb myeloblastosis viral oncogene homolog (avian)-like 2 MYBL2 NM_002466 A.201710_at 3 1 6.0661 79.208 0.017 17 Hs.93002 Ubiquitin-conjugating enzyme E2C UBE2C NM_007019 A.202954_at 3 1 7.8431 79.208 0.064 18 Hs.344037 Protein regulator of cytokinesis 1 PRC1 NM_003981 A.218009_s_at 3 1 7.3376 79.208 0.003 19 Hs.436187 Thyroid hormone receptor interactor 13 TRIP13 NM_004237 A.204033_at 3 1 7.1768 78.981 0.091 20 Hs.408658 Cyclin E2 CCNE2 NM_004702 A.205034_at 3 1 6.2055 78.603 0.019 21 Hs.30114 Cell division cycle associated 3 CDCA3 BC002551 B.223307_at 3 1 7.8418 78.603 0.084 22 Hs.84113 Cyclin-dependent kinase inhibitor 3 (CDK2-associated dual specificity phosphatase) CDKN3 AF213033 A.209714_s_at 3 1 6.8414 78.554 0.005 23 Hs.279766 Kinesin family member 4A KIF4A NM_012310 A.218355_at 3 1 6.6174 78.212 0.013 24 Hs.104859 Hypothetical protein DKFZp762E1312 DKFZp76 2E1312 NM_018410 A.218726_at 3 1 6.3781 75.507 0.036 25 Hs.444118 MCM6 minichromosome maintenance deficient 6 (MISS homolog, S. pombe) (S. cerevisiae) MCM6 NM_005915 A.201930_at 3 1 7.9353 75.386 0.014 26 acc_NM_01 8123.1 NM_018123 A.219918_s_at 3 1 6.5958 75.386 0.002 27 Hs.287472 BUB1 budding uninhibited by benzimidazoles 1 homolog (yeast) BUB1 AF043294 A.209642_at 3 1 6.0118 74.136 0.058 28 Hs.36708 BUB1 budding uninhibited by benzimidazoles I homolog beta (yeast) BUB1B NM_001211 A.203755_at 3 1 6.68 73.453 0.007 29 Hs.77783 Membrane-associated tyrosine- and threonine-specific cdc2-inhibitory kinase PKMYT1 NM_004203 A.204267_x_at 3 1 6.9229 73.441 0.002 30 Hs.446554 RAD51 homolog (RecA homolog, E. coli) (S. cerevisiae) RAD51 NM_002875 A.205024_s_at 3 1 6.3524 73.441 0.016 31 Hs.82906 CDC20 cell division cycle 20 homolog (S. cerevisiae) CDC20 NM_001255 A.202870_s_at 3 1 7.1291 72.984 0.108 32 Hs.252712 Karyopherin alpha 2 (RAG cohort 1, importin alpha 1) KPNA2 NM_002266 A.201088_at 3 1 8.4964 72.560 0.025 33 Hs.3104 KIF14 NM_014875 A.206364_at 3 1 6.1518 72.560 0.067 34 Hs.103305 Chromobox homolog 2 (Pc class homolog, Drosophila) BE514414 B.226473_at 3 1 7.5588 72.560 0.014 35 Hs.152759 Activator of S phase kinase ASK NM_006716 A.204244_s_at 3 1 5.9825 72.294 0.018 36 acc_AL1388 28 AL138828 B.228069_at 3 1 7.0119 72.294 0.084 37 Hs.226390 Ribonucleotide reductase M2 polypeptide RRM2 NM_001034 A.201890_at 3 1 7.1014 70.961 0.002 38 Hs.445890 HSPC163 protein HSPC163 NM_014184 A.218728_s_at 3 1 7.6481 70.764 0.003 39 Hs.194698 Cyclin B2 CCNB2 NM_004701 A.202705_at 3 1 7.0096 70.698 0.001 40 Hs.234545 Cell division cycle associated 1 CDCA1 AF326731 B.223381_at 3 1 6.4921 70.698 0.008 41 Hs.16244 Sperm associated antigen 5 SPAG5 NM_006461 A.203145_at 3 1 6.4627 70.095 0.001 42 Hs.62180 Anillin, actin binding protein (scraps homolog, Drosophila) ANLN AK023208 B.222608_s_at 3 1 6.9556 69.641 0.013 43 Hs.14559 Chromosome 10 open reading frame 3 C10orf3 NM_018131 A.218542_at 3 1 6.4965 69.335 0.049 44 Hs.122908 DNA replication factor CDT1 AW075105 B.228868_x_at 3 1 7.0543 69.335 0.001 45 Hs.8878 Kinesin family member 11 KIF11 NM_004523 A.204444_at 3 1 6.4655 69.318 0.005 46 Hs.83758 CDC28 protein kinase regulatory subunit 2 CKS2 NM_001827 A.204170_s_at 3 1 7.8353 69.178 0.027 47 Hs.112160 Chromosome 15 open reading frame 20 PIF1 AF108138 B.228252_at 3 1 6.6518 69.178 0.039 48 Hs.79078 MAD2 mitotic arrest deficient-like 1 (yeast) MAD2L1 NM_002358 A.203362_s_at 3 1 6.4606 68.044 0.038 49 Hs.226390 Ribonucleotide reductase M2 polypeptide RRM2 BC001886 A.209773_s_at 3 1 7.2979 67.380 0.135 50 Hs.462306 Ubiquitin-conjugating enzyme E2S UBE2S NM_014501 A.202779_s_at 3 1 6.9165 67.359 0.013 51 Hs.70704 Chromosome 20 open reading frame 129 C20orf12 9 BC001068 B.225687_at 3 1 7.2322 67.359 0.039 52 Hs.294088 GAJ protein GAJ AY028916 B.223700_at 3 1 5.8432 67.299 0.005 53 Hs.381225 Kinetochore protein Spc24 Spc24 AI469788 B.235572_at 3 1 6.7839 67.299 0.002 54 Hs.334562 Cell division cycle 2, G1 to S and G2 to M CDC2 AL524035 A.203213_at 3 1 7.0152 66.861 0.024 55 Hs.109706 Hematological and neurological expressed 1 HN1 NM_016185 A.217755_at 3 1 7.9118 66.771 0.008 56 Hs.23900 Rac GTPase activating protein 1 RACGAP 1 AU153848 A.222077_s_at 3 1 7.1207 66.484 0.042 57 Hs.77695 Discs, large homolog 7 (Drosophila) DLG7 NM_014750 A.203764_at 3 1 6.3122 66.411 0.001 58 Hs.46423 Histone 1, H4c HIST1H4 F NM_003542 A.205967_at 3 1 8.3796 66.411 0.005 59 Hs.20830 Kinesin family member C1 KIFC1 BC000712 A.209680_s_at 3 1 6.9746 66.411 0.042 60 Hs.339665 Similar to Gastric cancer up-regulated-2 AL135396 B.225834_at 3 1 7.2467 66.411 0.020 61 Hs.94292 FLJ23311 protein FLJ23311 NM_024680 A.219996_at 3 1 5.0277 66.340 0.007 62 Hs.73625 Kinesin family member 20A KIF20A NM_005733 A.218755_at 3 1 7.2115 66.267 0.001 63 Hs.315167 Defective in sister chromatid cohesion homolog 1 (S. cerevisiae) MGC552 8 NM_024094 A.219000_s_at 3 1 6.2835 66.267 0.002 64 Hs.85137 Cyclin A2 CCNA2 NM_001237 A.203418_at 3 1 6.194 66.208 0.001 65 Hs.528669 Chromosome condensation protein G HCAP-G NM_022346 A.218662_s_at 3 1 6.0594 66.208 0.013 66 Hs.75573 Centromere protein E, 312kDa CENPE NM_001813 A.205046_at 3 1 5.1972 65.474 0.002 67 acc_BE9661 46 RAD51 associated protein 1 BE966146 A.204146_at 3 1 6.3049 65.318 0.007 68 Hs.334562 Cell division cycle 2, G1 to S and G2 to M CDC2 D88357 A.210559_s_at 3 1 7.0395 64.754 0.001 69 Hs.108106 Ubiquitin-like, containing PHD and RING finger domains, 1 UHRF1 AK025578 B.225655_at 3 1 7.7335 64.754 0.024 70 Hs.1578 Baculoviral IAP repeat-containing 5 (survivin) BIRC5 NM_001168 A.202095_s_at 3 1 . 6.8907 64.566 0.090 71 acc_NM_02 1067.1 NM_021067 A.206102_at 3 1 6.714 64.566 0.013 72 Hs.244723 Cyclin E1 CCNE1 AI671049 A.213523_at 3 1 6.082 64.566 0.001 73 Hs.198363 MCM10 minichromosome maintenance deficient 10 (S. cerevisiae) MCM10 NM_018519 A.220651_s_at 3 1 5.6784 64.175 0.081 74 Hs.155223 Stanniocalcin 2 STC2 AI435828 A.203438_at 1 3 7.5388 63.993 . 0.011 75 Hs.25647 V-fos FBJ murine osteosarcoma viral oncogene homolog FOS BC004490 A.209189_at 1 3 8.9921 63.898 0.162 76 Hs.184601 Solute carrier family 7 (cationic amino acid transporter, y+ system), member 5 SLC7A5 AB018009 A.201195_s_at 3 1 7.4931 63.584 0.011 77 Hs.528669 Chromosome condensation protein G HCAP-G NM_022346 A.218663_at 3 1 5.7831 63.584 0.007 78 Hs.30114 Cell division cycle associated 3 CDCA3 NM_031299 A.221436_s_at 3 1 6.1898 63.584 0.002 79 Hs.296398 Lysosomal associated protein transmembrane 4 beta LAPTM4 B T15777 A.214039_s_at 3 1 9.3209 63.330 0.001 80 Hs.442658 Aurora kinase B AURKB AB011446 A.209464_at 3 1 5.9611 63.256 0.005 .81 Hs.6879 DC13 protein DC13 NM_020188 A.218447_at 3 7.436 63.256 0.028 82 Hs.78913 Chemokine (C-X3-C motif) receptor 1 CX3CR1 U20350 A.205898_at 1 3 6.7764 63.223 0.014 83 Hs.406684 Sodium channel, voltage-gated, type VII, alpha SCN7A AI828648 B.228504_at 1 3 5.8248 63.223 0.004 84 Hs.80976 Antigen identified by monoclonal antibody Ki-67 MKI67 BF001806 A.212022_s_at 3 1 6.7255 62.415 0.125 85 Hs.406639 Hypothetical protein LOC146909 LOC1469 09 AA292789 A.222039_at 3 1 6.4591 62.214 0.018 86 Hs.334562 Cell division cycle 2, G1 to S and G2 to M CDC2 NM_001786 A.203214_x_at 3 1 6.588 61.528 0.002 87 Hs.23960 Cyclin B1 CCNB1 BE407516 A.214710_s_at 3 1 7.1555 60.835 0.014 88 Hs.445098 DEP domain containing 1 SDP35 AK000490 B.222958_s_at 3 1 6.8747 60.835 0.003 89 Hs.58241 Serine/threonine kinase 32B HSA2508 39 NM_018401 A.219686_at 1 3 4.5663 60.376 0.005 90 Hs.5199 HSPC150 protein similar to ubiquitin-conjugating enzyme HSPC150 AB032931 B.223229_at 3 1 7.3947 60.376 0.010 91 acc_T58044 T58044 B.227232_at 1 3 8.5021 60.376 0.003 92 Hs.421337 DEP domain containing 1B XTP1 AK001166 B.226980_at 3 1 5.4977 60.356 0.034 93 Hs.238105 Chromosome 6 open reading frame 115 C6orf115 AF116682 B.223361_at 3 1 8.7555 60.138 0.003 94 Hs.27860 Prostaglandin E receptor 3 (subtype EP3) AW242315 A.213933_at I 3 7.3561 59.754 0.257 95 Hs.292511 Neuro-oncological ventral antigen 1 NOVA1 NM_002515 A.205794_s_at 1 3 6.7682 59.512 0.011 96 Hs.276466 Hypothetical protein FLJ21062 FLJ21062 NM_024788 A.219455_at 1 3 5.5257 59.307 0.003 97 Hs.270845 Kinesin family member 23 KIF23 NM_004856 A.204709_s_at 3 1 5.1731 59.307 0.154 98 Hs.293257 Epithelial cell transforming sequence 2 oncogene ECT2 NM_018098 A.219787_s_at 3 1 6.8052 59.307 0.000 99 Hs.156346 Topoisomerase (DNA) II alpha 170kDa TOP2A NM_001067 A.201292_at 3 1 7.2468 59.071 0.011 100 Hs.31297 Cytochrome b reductase 1 CYBRD1 AL136693 B.222453_at 1 3 9.3991 59.071 0.001 101 Hs.414407 Kinetochore associated 2 KNTC2 NM_006101 A.204162_at 3 1 6.017 58.653 0.076 102 Hs.445098 DEP domain containing 1 SDP35 AI810054 B.235545_at 3 1 6.2495 58.653 0.133 103 Hs.301052 Kinesin family member 18A DKFZP43 4G2226 NM_031217 A.221258_s_at 3 1 5.3649 58.160 0.158 104 Hs.431762 Tetratricopeptide repeat domain 18 LOC1184 91 AW024437 B.229170_s_at 1 3 6.2298 58.160 0.065 105 Hs.24529 CHK1 checkpoint homolog (S. pombe) CHEK1 NM_001274 A.205394_at 3 1 5.6217 58.087 0.017 106 Hs.87507 BRCA1 interacting protein C-terminal helicase 1 BRIP1 BF056791 B.235609_at 3 1 7.1489 58.087 0.011 107 Hs.348920 FSH primary response (LRPR1 homolog, rat) 1 FSHPRH1 BF793446 A.214804_at 3 1 5.0105 57.817 0.057 108 Hs.127797 CDNA FLJ11381 fis, clone HEMBA1000501 AI807356 B.227350_at 3 1 6.8658 57.782 0.014 109 Hs.92458 G protein-coupled receptor 19 GPR19 NM_006143 A.207183_at 3 1 5.2568 57.642 0.002 110 Hs.552 Steroid-5-alpha-reductase, alpha polypeptide 1 (3-oxo-5 alpha-steroid delta 4-dehydrogenase alpha 1) SRD5A1 BC006373 A.211056_s_at 3 1 6.7605 57.642 0.001 111 Hs.435733 Cell division cycle associated 7 CDCA7 AY029179 B.224428_s_at 3 1 7.6746 57.642 0.021 112 Hs.101174 Microtubule-associated protein tau MAPT NM_016835 A.203929_s_at 1 3 7.7914 57.600 0.003 113 Hs.436376 Synaptotagmin binding, cytoplasmic RNA interacting protein SYNCRIP NM_006372 A.217834_s_at 3 1 6.8123 57.600 0.001 114 Hs.122552 G-2 and S-phase expressed 1 GTSE1 NM_016426 A.204315_s_at 3 1 6.4166 57.542 0.036 115 Hs.153704 NIMA (never in mitosis gene a)-related kinase 2 NEK2 NM_002497 A.204641_at 3 1 7.0017 57.542 0.036 116 Hs.208912 Chromosome 22 open reading frame 18 C22orf18 NM_024053 A.218741_at 3 1 6.3488 56.776 0.006 117 Hs.81892 KIAA0101 KIAA010 1 NM_014736 A.202503_s_at 3 1 8.2054 56.644 0.029 118 Hs.279905 Nucleolar and spindle associated protein 1 NUSAP1 NM_016359 A.218039_at 3 1 7.542 56.644 0.006 119 Hs.170915 Hypothetical protein FLJ10948 FLJ10948 NM_018281 A.218552_at 1 3 7.9778 56.041 0.010 120 Hs.144151 Transcribed locus AI668620 B.237339_at 1 3 9.6693 56.041 0.029 121 Hs.433180 DNA replication complex GINS protein PSF2 Pfs2 BC003186 A.221521_s_at 3 1 6.3201 56.036 0.059 122 Hs.47504 Exonuclease 1 EXO1 NM_003686 A.204603_at 3 1 5.927 55.961 0.001 123 Hs.293257 Epithelial cell transforming sequence 2 oncogene ECT2 BG170335 B.234992_x_at 3 1 5.1653 55.559 0.002 124 Hs.385913 Acidic (leucine-rich) nuclear phosphoprotein 32 family, member E ANP32E NM_030920 A.208103_s_at 3 1 6.2989 55.557 0.001 125 Hs.44380 Transcribed locus, weakly similar to NP_60312.1 hypothetical FLJ20489 [Homo sapiens] protein AA938184 B.236312_at 3 1 55.557 0.007 126 Hs.19322 Chromosome 9 open reading frame 140 LOC8995 8 AW250904 B.225777_at 3 1 7.8877 55.205 0.003 127 Hs.188173 Lymphoid nuclear protein related to AF4 AA572675 B.232286_at 1 3 7.169 55.205 0.008 128 Hs.28264 Chromosome 10 open reading frame 56 FLJ90798 AL049949 A.212419_at 1 3 7.6504 55.175 0.017 129 Hs.387057 Hypothetical protein FLJ13710 FLJ13710 AK024132 B.232944_at 1 3 6.1947 55.175 0.034 130 acc_AL0316 58 AL031658 B.232357_at 1 3 5.9761 54.950 0.033 .131 Hs.286049 Phosphoserine aminotransferase 1 PSAT1 BC004863 B.223062_s_at 3 1 . 6.1035 54.930 0.003 132 Hs.19173 Nucleoporin 88kDa AI806781 B.235786_at 1 3 7.2856 54.930 0.037 133 Hs.155223 Stanniocalcin 2 STC2 BC000658 A.203439_s_at 1 3 7.6806 54.822 0.040 134 acc_NM_03 0896.1 NM_030896 A.221275_s_at 1 3 3.9611 54.822 0.002 135 Hs.101174 Microtubule-associated protein tau MAPT AA199717 B.225379_at 1 3 7.8574 54.814 0.021 136 Hs.446680 Retinoic acid induced 2 RAI2 NM_021785 A.219440_at 1 3 6.6594 54.307 0.057 137 Hs.431762 Tetratricopeptide repeat domain 18 LOC1184 91 AW024437 B.229169_at 1 3 5.8266 53.649 0.002 138 acc_NM_00 5196.1 NM_005196 A.207828_s_at 3 1 7.237 53.119 0.007 139 acc_T90295 Arsenic transactivated protein I T90295 B.226661_at 3 1 6.6825 52.825 0.002 140 Hs.42650 ZW10 interactor ZWINT NM_007057 A.204026_s_at 3 1 7.5055 52.716 0.034 141 Hs.6641 KIF5C NM_004522 A.203130_s_at 1 3 7.3214 52.703 0.013 142 Hs.23960 Cyclin B1 CCNB1 N90191 B.228729_at 3 1 6.8018 52.606 0.031 143 Hs.72550 Hyaluronan-mediated motility receptor (RHAMM) HMMR NM_012485 A.207165_at 3 1 6.5885 52.400 0.066 144 Hs.73239 Hypothetical protein FLJI0901 FLJ10901 NM_018265 A.219010_at 3 1 6.9429 52.323 0.020 145 Hs.163533 V-erb-a erythroblastic leukemia viral oncogene homolog 4 (avian) AK024204 B.233498_at 1 3 52.208 0.002 146 Hs.109706 Hematological and neurological expressed 1 HN1 AF060925 B.222396_at 3 1 8.4225 52.166 0.000 147 Hs.165258 Nuclear receptor subfamily 4, group A, member 2 AA523939 B.235739_at 1 3 7.1874 52.022 0.000 148 Hs.20575 Growth arrest-specific 2 like 3 LOC2834 31 31H37811 B.235709_at 3 1 6.7278 51.899 0.010 149 Hs.75678 FBJ murine osteosarcoma viral oncogene homolog B FOSB NM_006732 A.202768_at 1 3 6.1922 51.899 0.059 150 Hs.437351 Cold inducible RNA binding protein CIRBP AL565767 B.225191_at 1 3 8.033 51.899 0.002 151 Hs.57101 MCM2 minichromosome maintenance deficient 2, mitotin (S. cerevisiae) MCM2 NM_004526 A.202107_s_at 3 1 7.861 51.655 0.273 152 Hs.326736 Ankyrin repeat domain 30A NY-BR-1 AF269087 B.223864_at 1 3 9.4144 51.336 0.042 153 Hs.298646 ATPase family, AAA domain containing 2 PRO2000 AI925583 B.222740_at 3 1 6.8416 50.763 0.130 154 Hs.119192 H2A histone family, member Z H2AFZ NM_002106 A.200853_at 3 1 8.5896 50.108 0.008 155 Hs.119960 PHD finger protein 19 PHF19 BE544837 B.227211_at 3 6.3487 50.108 0.084 156 Hs.78619 Gamma-glutamyl hydrolase (conjugase, folylpolygammaglutamyl hydrolase) GGH NM_003878 A.203560_at 3 1 6.7708 49.945 0.006 157 Hs.283532 Uncharacterized bone marrow protein BM039 BM039 NM_018455 A.219555_s_at 3 1 4.1739 49.945 0.134 158 Hs.221941 Cytochrome b reductase 1 AI669804 B.232459_at 1 3 7.1171 49.945 0.015 159 Hs.104019 Transforming, acidic coiled-coil containing protein 3 TACC3 NM_006342 A.218308_at 3 1 6.1303 49.820 0.023 160 acc_AK0022 03.1 AK002203 B.226992_at 1 3 7.9091 49.696 0.037 161 Hs.28625 Transcribed locus AI693516 B.228750_at 1 3 7.1249 49.554 0.055 162 Hs.206868 B-cell CLL/lymphoma 2 AU146384 B.232210_at 1 3 8.0948 49.554 0.002 163 Hs.75528 Dynein, axonemal, light intermediate polypeptide 1 HUMAU ANTIG AW299538 B.227081_at 1 3 7.0851 49.549 0.003 164 acc_AW271 106 AW271106 B.229490_s_at 3 1 6.2222 49.544 0.017 165 Hs.298646 ATPase family, AAA domain containing 2 PRO2000 AI139629 B.235266_at 3 1 6.1913 49.544 0.009 166 Hs.303090 Protein phosphatase 1, regulatory (inhibitor) subunit 3C PPP1R3C N26005 A.204284_at 1 3 7.0275 49.520 0.011 167 Hs.83169 Matrix metalloproteinase 1 (interstitial collagenase) MMP1 NM_002421 A.204475_at 3 1 7.1705 49.410 0.028 168 Hs.441708 Leucine-rich repeat kinase 1 MGC458 66 AI638593 B.230021_at 3 1 6.424 49.410 0.005 169 acc_AV7339 50 AV733950 A.201693_s_at 1 3 7.9061 48.773 0.005 170 Hs.171695 Dual specificity phosphatase 1 DUSP1 NM_004417 A.201041_s_at 1 9.7481 48.672 0.003 171 Hs.87491 Thymidylate synthetase TYMS NM_001071 A.202589_at 3 1 7.8242 48.672 0.041 172 Hs.434886 Cell division cycle associated 5 CDCA5 BE614410 B.224753_at 3 1 4.9821 48.488 0.106 173 Hs.24395 Chemokine (C-X-C motif) ligand 14 CXCL14 NM_004887 A.218002_s_at 1 3 8.2513 48.231 0.003 174 Hs.104741 T-LAK cell-originated protein kinase TOPK NM_018492 A.219148_at 3 1 6.4626 48.155 0.001 175 Hs.272027 F-box protein 5 FBXO5 AK026197 B.234863_x_at 3 1 6.935 48.155 0.037 176 Hs.101174 Microtubule-associated protein tau MAPT J03778 A.206401_s_at I 3 6.4557 48.155 0.021 177 Hs.7888 V-erb-a erythroblastic leukemia viral oncogene homolog 4 (aviar) AW772192 A.214053_at 1 3 48.155 0.029 178 Hs.372254 Lymphoid nuclear protein related to AF4 AI033582 B.244696_at 1 3 7.4158 48.155 0.002 179 Hs.435861 Signal peptide, CUB domain, EGF-like 2 SCUBE2 AI424243 A.219197_s_at 1 3 8.3819 47.983 0.037 180 Hs.385998 WD repeat and HMG-box DNA binding protein 1 WDHD1 AK001538 A.216228_s_at 3 1 4.541 47.687 0.001 181 Hs.306322 Neuron navigator 3 NAV3 NM_014903 A.204823_at 1 3 5.8235 47.678 0.004 182 Hs.21380 CDNA FLJ36725 fis, clone UTERU2012230 AV709727 B.225996_at 1 3 7.5715 47.581 0.038 183 Hs.89497 Lamin B1 LMNB1 NM_005573 A.203276_at 3 1 7.11 47.281 0.004 184 acc_NM_01 7669.1 NM_017669 A.219650_at 3 1 5.0422 47.281 0.004 185 Hs.12532 Chromosome 1 open reading frame 21 Clorf21 NM_030806 A.221272_s_at 1 3 5.6228 47.104 0.066 186 Hs.399966 Calcium channel, voltage-dependent, L type, alpha 1D subunit CACNA1 D BE550599 A.210108_at 1 3 6.2612 46.990 0.063 187 Hs.159264 Clone 23948 mRNA sequence U79293 A.215304_at 1 3 6.9317 46.990 0.066 188 Hs.212787 KIAA0303 protein KIAA030 3 AW971134 A.222348_at 1 3 4.964 46.984 0.002 189 Hs.325650 EH-domain containing 2 EHD2 AI417917 A.221870_at 1 3 6.4774 46.013 0.002 190 Hs.388347 Hypothetical protein LOC143381 AW242720 B.227550_at 1 3 7.657 45.314 0.001 191 Hs.283853 MRNA full length insert cDNA clone EUROIMAGE 980547 AL360204 B.232855_at 1 3 4.6288 45.314 0.006 192 Hs.57301 High mobility group AT-hook 1 HMGA1 NM_002131 A.206074_s_at 3 1 7.6723 44.940 0.001 193 Hs.529285 Solute carrier family 40 (iron-regulated.transporter), member 1 AA588092 B.239723_at 1 3 6.9222 44.838 0.052 194 Hs.252938 Low density lipoprotein-related protein 2 LRP2 R73030 B.230863_at 1 7.4648 44.706 0.003 195 Hs.552 Steroid-5-alpha-reductase, alpha polypeptide 1 (3-oxo-5 alpha-steroid delta 4-dehydrogenase alpha 1) SRD5A1 NM_001047 A.204675_at 3 1 7.1002 44.684 0.000 196 Hs.156346 Topoisomerase (DNA) II alpha 170kDa TOP2A NM_001067 A.201291_s_at 3 1 7.3566 44.552 0.110 197 Hs.413924 Chemokine (C-X-C motif) ligand 10 CXCL10 NM_001565 A.204533_at 3 1 7.9131 44.552 0.070 198 Hs.287466 CDNA FLJ11928 fis, clone HEMBB1000420 AK021990 B.232699_at 1 3 5.8675 44.552 0.002 199 acc_X07868 X07868 A.202409_at 1 3 7.9917 44.537 0.002 200 Hs.101174 Microtubule-associated protein tau MAPT NM_016835 A.203928_x_at 1 3 6.9103 44.537 0.005 201 Hs.334828 Hypothetical protein FLJ10719 FLJ10719 BG478677 A.213008_at 3 1 6.4461 44.494 0.009 202 Hs.326035 Early growth response 1 EGR1 NM_001964 A.201694_s_at 1 3 8.6202 44.199 0.025 203 Hs.122552 G-2 and S-phase expressed 1 GTSE1 BF973178 A.215942_s_at 3 1 5.4688 44.199 0.041 204 Hs.24395 Chemokine (C-X-C motif) ligand 14 CXCL14 AF144103 B.222484_s_at 1 3 9.3366 44.199 0.006 205 Hs.102406 Melanophilin AI810764 B.229150_at 1 3 8.078 44.199 0.031 206 Hs.164018 Leucine zipper protein FKSG14 FKSG14 BC005400 B.222848_at 3 1 6.6517 43.845 0.001 207 Hs.19114 High-mobility group box 3 HMGB3 NM 005342 A.203744_at 3 1 7.5502 43.661 0.007 208 Hs.103982 Chemokine (C-X-C motif) ligand 11 CXCL11 AF002985 A.211122_s_at 3 1 6.1001 43.014 0.003 209 Hs.356349 Transcribed locus ZNF145 AI492388 B.228854_at 1 3 6.8198 43.014 0.001 210 Hs.1657 Estrogen receptor 1 ESR1 NM_000125 A.205225_at 1 3 7.4943 42.966 0.188 211 Hs. 144479 Transcribed locus BF433570 B.237301_at 1 3 6.3171 42.831 0.003 212 acc_BF5080 74 BF508074 B.240465_at 1 3 6.0041 42.720 0.002 213 Hs.326391 Phytanoyl-CoA dioxygenase domain containing 1 PHYHD1 AL545998 B.226846_at 1 3 7.2214 42.425 0.100 214 Hs.338851 FLJ41238 protein FLJ41238 AW629527 B.229764_at 1 3 6.5319 42.334 0.033 215 Hs.65239 Sodium channel, voltage-gated, type IV, beta SCN4B AW026241 B.236359_at I 3 5.5526 42.084 0.106 216 Hs.88417 Sushi domain containing 3 SUSD3 AW966474 B.227182_at 1 3 8.195 41.808 0.015 217 Hs.16530 Chemokine (C-C motif) ligand 18 (pulmonary and activation-regulated) CCL18 Y13710 A.32128_at 3 I 6.2442 41.317 0.004 218 Hs.384944 Superoxide dismutase 2, mitochondrial SOD2 X15132 A.216841_s_at 3 1 6.0027 41.317 0.115 219 Hs.406050 Dynein, axonemal, light intermediate polypeptide 1 DNALI1 NM_003462 A.205186_at 1 3 4.2997 40.911 0.009 220 Hs.458430 N-aretyltransferase I (arylamine N-acetyltransferase) NAT1 NM_000662 A.214440_at 1 3 7.7423 40.775 0.001 221 Hs.437023 Nucleoporin 62kDa ILt4I1 AI859620 B.230966_art 3 1 6.4289 40.567 0.041 222 Hs.279905 Nucleolar and spindle associated protein 1 NUSAP1 NM_018454 A.219978_s_at 3 1 6.3357 40.119 0.011 223 Hs.505337 Claudin 5 (transmembrane protein deleted in velocardiofacial syndrome) CLDN5 NM_003277 A.204482_at 1 3 6.1516 40.053 0.001 224 Hs.44227 Heparanase HPSE NM_006665 A.219403_s_at 3 1 5.2989 40.005 0.253 225 Hs.512555 Collagen, type XIV, alpha 1 (undulin) COL14A1 BF449063 A.212865_s_at 1 3 7.2876 39.981 0.001 226 Hs.511950 Sirtuin (silent mating type information regulation 2 homolog) 3 (S. cerevisiae) SIRT3 AF083108 A.221562_s_at 1 3 5.9645 39.981 0.019 227 Hs.371357 RNA binding motif, single stranded interacting protein AW338699 B.241789_at 1 3 6.3656 39.981 0.009 228 Hs.81131 Guanidinoacetate N-methyltransferase GAMT NM_000156 A.205354_at 1 3 5.9474 39.852 0.005 229 Hs.158992 FL145983 protein AI631850 B.240192_at 1 3 5.2898 39.852 0.344 230 Hs.104624 Aquaporin 9 AQP9 NM_020980 A.205568 at 3 1 4.9519 39.848 0.010 231 Hs.437867 Homo sapiens, clone IMAGE:5759947, mRNA AW970881 A.222314_x_at 1 3 5.2505 39.816 0.042 232 Hs.296049 Microfibrillar-associated protein 4 MFAP4 R72286 A.212713_at 1 3 6.5149 39.749 0.001 233 Hs.109439 Osteoglycin (osteoinductive factor, mimecan) OGN NM_014057 A.218730_s_at 1 3 4.9325 39.749 0.015 234 Hs.29190 Hypothetical protein MGC24047 MGC240 47 AI732488 B.229381_at 1 3 7.2281 39.749 0.069 235 Hs.252418 Elastin (supravalvular aortic stenosis, Williams-Beuren syndrome) ELN AA479278 A.212670_at 1 3 6.8951 39.489 0.149 236 Hs.252938 Low density lipoprotein-related protein 2 LRP2 NM_004525 A.205710_at 1 3 5.9845 39.154 0.003 237 Hs.32405 MRNA; cDNA DKFZp586G0321 (from clone DKFZp586G0321). AL137566 B.228554_at 1 3 7.1124 38.597 0.015 238 Hs.288720 Leucine rich repeat containing 17 LRRC17 NM_005824 A.205381_at 1 3 7.217 38.493 0.279 239 Hs.203963 Helicase, lymphoid-specific HELLS NM_018063 A.220085_at 3 1 5.2886 38.493 0.001 240 Hs.361171 Placenta-specific 9 PLAC9 AW964972 B.227419_x_at 1 3 6.689 38.195 0.000 241 Hs.396595 Flavin containing monooxygenase 5FMO5 AK022172 A.215300_s_at 1 3 4.1433 37.488 0.002 242 Hs.105434 Interferon stimulated gene 20kDa ISG20 NM_002201 A.204698_at 3 1 6.2999 37.448 0.003 243 Hs.460184 MCM4 minichromosome maintenance deficient 4 (S. cerevisiae) MCM4 X74794 A.212141_at 3 1 6.7292 36.577 0.176 244 Hs.169266 Neuropeptide Y receptor Y1 NPY1R NM_000909 A.205440_s_at 1 3 5.8305 36.029 0.011 245 acc_R38110 R39110 B.240112_at 1 3 5.1631 35.441 0.021 246 Hs.63931 Dachshund homolog 1 (Drosophila) DACH AI650353 B.228915_at 1 3 7.6716 35.346 0.319 247 Hs.102541 Netrin 4NTN4 AF278532 B.223315_at 1 3 8.2693 35.233 0.132 248 Hs.418367 Neuromedin U NMU NM_006681 A.206023_at 3 1 5.1017 34.589 0.035 249 Hs.232127 MRNA; cDNA DKFZp547P042 (from clone DKFZp547P042). AL512727 A.215014_at 1 3 4.8334 34.570 0.035 250 Hs.212088 Epoxide hydrolase 2, cytoplasmic EPHX2 AF233336 A.209368_at 1 3 6.4031 34.531 0.154 251 Hs.439760 Cytochrome P450, family 4, subfamily X, polypeptide 1 CYP4X1 AA557324 B.227702_at 1 3 8.5972 34.531 0.015 252 acc_BF5134 68 BF513468 B.241505_at 1 3 7.1517 34.140 0.001 253 Hs.413078 Nudix (nucleoside diphosphate linked moiety X)-type motif 1 NUDT1 NM_002452 A.204766_s_at 3 1 5.6705 33.955 0.069 254 acc_AI49237 6 AI492376 B.231195_at 3 1 5.1967 33.602 0.029 255 acc_AW512 787 AW512787 AW512787 B.238481_at 1 3 8.5117 33.572 0.005 256 Hs.74369 Integrin, alpha 7 ITGA7 AK022548 A.216331_at 1 3 5.1535 33.290 0.003 257 Hs.63931 Dachshund homolog 1 (Drosophila) DACH NM_004392 A.205472_s_at 1 3 3.9246 33.177 0.002 258 Hs.225952 Protein tyrosine phosphatase, receptor type, T PTPRT NM_007050 A.205948_at 1 3 6.7634 32.152 0.190 259 acc_BF7937 01 Musculoskeletal, embryonic nuclear protein 1 BF793701 B.226856_at 1 3 5.5626 31.816 0.002 260 Hs.283417 Transcribed locus AI826437 B.229975_at 1 3 6.381 31.307 0.009 261 Hs.21948 Zinc finger protein 533 H15261 B.243929_at 1 3 4.7165 30.259 0.144 262 Hs.31297 Cytochrome b reductase 1 CYBRD1 NM_024843 A.217889_s_at 1 3 5.6427 27.628 0.056 263 Hs.180142 Calmodulin-like 5 CALML5 NM_017422 A.220414_at 3 1 5.994 27.417 0.009 264 Hs.176588 Cytochrome P450, family 4, subfamily Z, polypeptide 1 CYP4Z1 AV700083 B.237395_at 1 3 8.7505 24.383 0.400 - For any particular gene, where the value of the cell in column 7 "Grade with Higher Expression" is 3, the value of the cell in
column 8 "Grade with Lower Expression" is 1, and where the value of cell "Grade with Higher Expression" is 1, the value of column "Grade with Lower Expression" is 3.Colum 9 shows the cut off (Optimal Variance Cut-off) expressed as the natural log transform normalised signal intensity measurement for Affymetrix arrays (global mean normalisation with a scaling factor of 500). -
Table D2. SWS Classifier 1: 6 Probe Sets (5 Genes) No UGID (build #183) Unigene Name Gene Symbol Genbank Acc Affi ID Grade with Higher Expression Grade with Lower Expression Cut- off 1 Hs.528654 Hypothetical protein FLJ11029 FLJ11029 BG165011 B.228273_at 3 1 7.706303 2 acc_NM_0031 58.1 Serine/ threonine kinase 6.transcript 1STK6 NM_003158 A.208079_s_at 3 1 6.652593 3 Hs.35962 CDNA clone IMAGE:4452583, partial cds BG492359 B.226936_at 3 1 7.561905 4 Hs.308045 Barren homolog (Drosophila) BRRN1 D38553 A.212949_at 3 1 5.916703 5 Hs.184339 Maternal embryonic leucine zipper kinase MELK NM_014791 A.204825_at 3 1 7.107259 6 Hs.250822 Serine/ threonine kinase 6,transcript 2STK6 NM_003600 A.204092_s_at 3 1 6.726571 - For any particular gene, where the value of the cell in column 7 "Grade with Higher Expression" is 3, the value of the cell in
column 8 "Grade with Lower Expression" is 1, and where the value of cell "Grade with Higher Expression" is 1, the value of column "Grade with Lower Expression" is 3.Colum 9 shows the cut off (Optimal Variance Cut-off) expressed as the natural log transform normalised signal intensity measurement for Affymetrix arrays (global mean normalisation with a scaling factor of 500). -
Table D3. SWS Classifier 2: 18 Probe Sets (17 Genes) No UGID (build #183) UnigeneName Gene Symbol GenbankAcc Affi ID Grade with Higher Expression Grade with Lower Expression Cut-off 1 Hs.184339 Maternal embryonic leucine zipper kinase MELK NM_014791 A.204825_at 3 1 5.437105 2 Hs.308045 Barren homolog (Drosophila) BRRN1 D38553 A.212949_at 3 1 5.504552 3 Hs.9329 TPX2, microtubule-associated protein homolog (Xenopus laevis) TPX2 AF098158 A.210052_s_at 3 1 5.872187 4 Hs.486401 CDNA clone IMAGE:4452583, partial cds BG492359 B.226936_at 3 1 7.569926 5 Hs.75573 Centromere protein E, 312kDa CENPE NM_001813 A.205046_at 3 1 6.943423 6 Hs.528654 Hypothetical protein FLJ11029 FLJ11029 BG165011 B.228273_at 3 1 7.711138 7 acc_NM_0031 58 NM_003158 A.208079_s_at 3 1 6.571034 8 Hs.524571 Cell division cycle associated 8 CDCA8 BC001651 A.221520_s_at 3 1 6.894196 9 Hs.239 Forkhead box M1 FOXM1 NM_021953 A.202580_x_at 3 1 5.211513 - 10 Hs.179718 V-myb myeloblastosis viral oncogene homolog (avian)-like 2 MYBL2 NM_002466 A.201710_at 3 1 6.269081 11 Hs.169840 TTK protein kinase TTK NM_003318 A.204822_at 3 1 8.230804 12 Hs.75678 FBJ murine osteosarcoma viral oncogene homolog B FOSB NM_006732 A.202768_at 1 3 8.761579 13 Hs.25647 V-fos FBJ murine osteosarcoma viral oncogene homolog FOS BC004490 A.209189_at 1 3 7.085984 14 Hs.524216 Cell division cycle associated 3 CDCA3 NM_031299 A.221436_s_at 3 1 6.29283 15 Hs.381225 Kinetochore protein Spc24 Spc24 AI469788 B.235572_at 3 1 6.340503 16 Hs.62180 Anillin, actin binding protein (scraps homolog, Drosophila) ANLN AK023208 B.222608_s_at 3 1 6.84578 17 Hs.434886 Cell division cycle associated 5 CDCA5 BE614410 B.224753_at 3 1 5.290668 18 Hs.523468 Signal peptide, CUB domain, EGF-like 2 SCUBE2 AI424243 A.219197_s_at 3 1 5.792164 - For any particular gene, where the value of the cell in column 7 "Grade with Higher Expression" is 3, the value of the cell in
column 8 "Grade with Lower Expression" is 1, and where the value of cell "Grade with Higher Expression" is 1, the value of column "Grade with Lower Expression" is 3.Colum 9 shows the cut off (Optimal Variance Cut-off) expressed as the natural log transform normalised signal intensity measurement for Affymetrix arrays (global mean normalisation with a scaling factor of 500). -
Table D4. SWS Classifier 3: 7 Probe Sets (7 Genes) Or der UGID(build #183) Unigene Name Gene Symbol Genbank Acc Affi ID Grade with Higher Expression Grade with Lower Expression Cut- off 1 Hs.9329 TPX2, microtubule-associated protein homolog (Xenopus laevis) TPX2 AF098158 A.210052_s_at 3 1 8.7748 2 Hs.344037 Protein regulator of cytokinesis 1PRC1 NM_003981 A.218009_s_at 3 1 8.2222 3 Hs.292511 Neuro-oncological ventral antigen 1NOVA1 NM_002515 A.205794_s_at 1 3 6.7387 4 Hs.155223 Stanniocalcin 2STC2 AI435828 A.203438_at 1 3 8.0766 5 Hs.437351 Cold inducible RNA binding protein CIRBP AL565767 B.225191_at 1 3 8.2308 6 Hs.24395 Chemokine (C-X-C motif) ligand 14CXCL14 NM_004887 A.218002_s_at 1 3 7.086 7 Hs.435861 Signal peptide, CUB domain, EGF-like 2 SCUBE2 AI424243 A.219197_s_at 1 3 7.2545 - For any particular gene, where the value of the cell in column 7 "Grade with Higher Expression" is 3, the value of the cell in
column 8 "Grade with Lower Expression" is 1, and where the value of cell "Grade with Higher Expression" is 1, the value of column "Grade with Lower Expression" is 3.Colum 9 shows the cut off (Optimal Variance Cut-off) expressed as the natural log transform normalised signal intensity measurement for Affymetrix arrays (global mean normalisation with a scaling factor of 500). -
Table D5. SWS Classifier 4: 7 Probe Sets (7 Genes) Or der UGID(build #183) Unigene Name Gene Symbol GenbankAcc Affi ID Grade with Higher Expression Grade with Lower Expression Cut- off 1 Hs.48855 cell division cycle associated 8 CDCA8 BC001651 A.221520_s_at 3 1 5.5046 2 Hs.75573 centromere protein E, 312kDa CENPE NM_001813 A.205046_at 3 1 5.2115 3 Hs.552 steroid-5-alpha-reductase, alpha polypeptide 1 (3-oxo-5 alpha-steroid delta 4-dehydrogenase alpha 1) SRD5A1 BC006373 A.211056_s_at 3 1 6.9192 4 Hs.101174 microtubule-associated protein tau MAPT NM_016835 A.203929_s_at 1 3 4.8246 5 Hs.164018 leucine zipper protein FKSG14 FKSG14 BC005400 B.222848_at 3 1 6.1846 6 acc_R38110 N.A. R38110 R38110 B.240112_at 1 3 6.2557 7 Hs.325650 EH-domain containing 2 EHD2 AI417917 A.221870_at 1 3 7.6677 - For any particular gene, where the value of the cell in column 7 "Grade with Higher Expression" is 3, the value of the cell in
column 8 "Grade with Lower Expression" is 1, and where the value of cell "Grade with Higher Expression" is 1, the value of column "Grade with Lower Expression" is 3.Colum 9 shows the cut off (Optimal Variance Cut-off) expressed as the natural log transform normalised signal intensity measurement for Affymetrix arrays (global mean normalisation with a scaling factor of 500). - Clinical characteristics of patient and tumour samples of the Uppsala, Stockholm and Singapore cohorts are summarized in Table E1.
Table E1. Distribution of patients and tumour characteristics Name of cohorts Uppsala Stockholm Singapore n=254 n=147 n=98 Patients, by grade G1 G2 G3 G1 G2 G3 G1 G2 G3 n=68 n=126 n=55 n=28 n=58 n=61 n=11 n=40 n=47 Age, median yrs 62 63 62 55 58 52 59 52 50 <55 years, % 26 25 44 50 41 56 37 60 68 Tumour size, cm 1.8 2.2 2.9 1.9 2.5 2.0 3.4 2.8 3.1 Nodes, positive, % 15 35 55 33 50 32 36 40 51 ER negative tumours, % 3 9 38 0 7 33 0 28 53 Follow up, median yrs 11 9 6 8 7 7 - - - All recurrences, % 26 39 50 7 24 36 - - - Endocrine therapy, % 18 37 36 75 62 49 - - - Chemotherapy, % 4 6 22 4 5 13 - - - Combine therapy, % 2 3 0 11 16 10 - - - No systemic therapy, % 77 54 45 11 17 28 - All cohorts are of unselected populations, and in each case, the original tumour material was collected at the time of surgery and freshly frozen on dry ice or in liquid nitrogen and stored under liquid nitrogen or at -70°C.
- The Uppsala cohort originally comprised of 315 women representing 65% of all breast cancers resected in Uppsala County, Sweden from January 1, 1987 to December 31, 1989. Information pertaining to patient therapies, clinical follow up, and sample processing are described elsewhere (41).
- For histological grading, new tumour sections are prepared from the original paraffin blocks, stained with eosin, and graded in a blinded fashion by H.N. according to the Nottingham grading system (6, Haybittle et al., 1982) as follows:
- Tubule Formation: 3=poor, if < 10% of the tumour showed definite tubule formation, 2=moderate, if ≥10% but ≤75%, and 1=well, if >75%.
- Mitotic Index: 1=low, if <10 mitoses, 2=medium, if 10-18 mitoses, and 3=high, if >18 mitoses (per 10 high-power fields). The field diameter was 0.57 mm.
- Nuclear Grade: 1=low, if there was little variation in the size and shape of the nuclei, 2=medium for moderate variation, and 3=high for marked variation and large size.
- Scores are then summed, and tumour samples with scores ranging from 3-5 are classified as Grade I; 6-7 as Grade II; and 8-9 as Grade III.
- Protein levels of Estrogen Receptor (ER) and Progesterone Receptor (PgR) are assessed by immunoassay (monoclonal 6F11 anti-ER and monoclonal NCL-PGR, respectively, Novocastra Laboratories Ltd, Newcastle upon Tyne, UK) and deemed positive if >0.1 fmol/ug DNA. VEGF was measured in tumour cytosol by a quantitative immunoassay kit (Quantikine-human VEGF; R&D Systems, Minneapolis, MN, USA) as described (42). Protein levels of Ki-67 are analyzed using anti-Ki67 antibody (MIB-1) by the grid-graticula method with cut-offs: low=2, medium >2 and <6, high=6. Cyclin E was measured using the antibody HE12 (Santa Cruz Inc., USA) with cutoffs: low=0-4%, medium=5-49%, and high=50-100% stained tumour cells (43).
- S-phase fraction was determined by flow cytometry and defined as high if >7% in diploid tumours, or >12% in aneuploid tumours. TP53 mutational status was determined by cDNA sequencing as previously described (41). The Uppsala tumour samples ar approved for microarray profiling by the ethical committee at the Karolinska Institute, Stockholm, Sweden.
- The Stockholm samples are derived from breast cancer patients that were operated on at the Karolinska Hospital from January 1, 1994 through December 31, 1996 and identified in the Stockholm-Gotland breast cancer registry.
- Information on patient age, tumour size, number of metastatic axillary lymph nodes, hormonal receptor status, distant metastases, site and date of relapse, initial therapy, and date and cause of death are obtained from patient records filed with the Stockholm-Gotland registry.
- Tumour sections are classified using the Nottingham grading system (Haybittle et al., 1982). The Stockholm tumour samples are approved for microarray profiling by the ethical committee at the Karolinska Hospital, Stockholm, Sweden.
- The Singapore samples are derived from patients that were operated on at the National University Hospital (Singapore) from February 1, 2000 through January 31, 2002.
- Information on patient age, tumour size, number of metastatic lymph nodes and hormonal receptor status are obtained from hospital records.
- Tumour sections are graded in a blinded fashion according to the Nottingham grading system (Haybittle et al., 1982) as applied to the Uppsala and Stockholm cohorts, with the following exception: Mitotic Index: 1=low, if <8 mitoses, 2=medium, if 9-16 mitoses, and 3=high, if >16 mitoses (per 10 high-power fields). The field diameter is 0.55 mm. The Singapore tumour samples are approved for microarray profiling by the Singapore National University Hospital ethics board.
- After exclusions based on tissue availability, RNA integrity, clinical annotation and microarray quality control, expression profiles of 249, 147, and 98 tumours from the Uppsala, Stockholm and Singapore cohorts, respectively, were deemed suitable for further analysis.
- All tumour samples are profiled on the Affymetrix U133A and B genechips. Microarray analysis of the Uppsala and Singapore samples was carried out at the Genome Institute of Singapore (44). The Stockholm samples are analyzed by microarray at Bristol-Myers Squibb, Princeton, New Jersey, USA. RNA processing and microarray hybridizations are carried out essentially as described (44).
- Microarray data processing: all microarray data are processed as previously described (44).
- GO analysis is facilitated by PANTHER software (https://panther.appliedbiosystems.com/) (46). Selected gene lists are statistically compared (Mann-Whitney) with a reference list (ie, NCBI Build 35) comprised of all genes represented on the microarray to identify significantly over- and under-represented GO terms.
- The Kaplan Meier estimate is used to compute survival curves, and the p-value of the likelihood-ratio test is used to assess the statistical significance of the resultant hazard ratios. For standardization, events occurring beyond 10 years are censored. All cases of contralateral disease are censored. Disease-free survival (DFS) is defined as the time interval from surgery until the first recurrence or last follow-up.
- Multivariate analysis by Cox proportional hazard regression, including a stepwise model selection procedure based on the Akaike information criterion, and all survival statistics are performed in the R survival package. Remaining predictors in the Cox models are assessed by Likelihood-ratio test p-values.
- NPI scores (Haybittle et al., 1982) are calculated according to the following formula:

- Tumour size is defined as the longest diameter of the resected tumour. LN stage is 1, if lymph node negative, 2, if 3 or fewer nodes involved, and 3, if >3 nodes involved (47). As the number of cancerous lymph nodes are not available for the Uppsala cohort, a LN stage score of 2 is assigned if 1 or more nodes are involved, and a score of 3 is assigned if nodal involvement showed evidence of periglandular growth. For ggNPI calculations, grade scores (1,2 or 3) are replaced by genetic grade predictions (1 or 3).
- NPI scores <3.4 = GPG (good prognostic group); scores of 3.4 to 5.4 = MPG (moderate prognostic group); scores >5.4 = PPG (poor prognostic group). Scores of 2.4 or less = EPG (excellent prognostic group).
- For inter-group comparisons using the clinicopathological measurements, non-parametric Mann-Whitney U-test statistics are used for continuous variables and one-sided Fisher's exact test used for categorical variables. This work is facilitated by the Statistica-6 and StatXact-6 software packages.
- In simplified terms, the algorithm of genetic re-classification of
Grade 2 tumour, based on SWS approach can be described as follows. - A training set consisting of samples of known classes (eg, histologic Grade I (G1) and histologic Grade III (G3) tumours) is used to select the variables (ie, gene expression measurements; probesets or predictors), that allow the most accurate discrimination (or prediction) of the samples in the training set. Once the SWS algorithm is trained on the optimal set of variables, it is then applied to an independent exam set (ie, a new set of samples not used in training) to validate it's prediction accuracy. More details are given below.
- Briefly, for constructing the class prediction function, the SWS method uses the training set S̃ 0 (comprised of G1 and G3 tumour samples) to evaluate statistically the weight of the graduated "informative" variables (predictors), and all possible pairs of these predictors. The predictors are automatically selected by SWS from n (n=44,500) probe sets (which represents the gene expression measurements) on U133A and U133B Affymetrix Genechips.
- The description of each patient includes n (potential) prognostic variables X 1,...,Xn (signals from probe sets of the U133A and U133B chips) and information about class to which a patient belongs. In particular, the predictors might be able to discriminate G1 and G3 tumours with minimum "a posteriori probability". Reliability of the SWS class prediction function is based on the standard "leave-one-out procedure" and on an additional exam of the class prediction ability on one or more independent sample populations (ie, patient cohorts). In this application of SWS, the G2 tumour samples of the Uppsala cohort and two other cohorts (NUH and Stockholm cohorts; see Methods) have been used as exam datasets to test the SWS class prediction function.
- Let us consider the available n-dimension domain of the variables (the probesets) X 1,...,Xn as prognostic variable space. The SWS algorithm is based on calculating the a posteriori probabilities of the tumours belonging to one of two classes using a weighted voting scheme involving the sets of so called "syndromes". A syndrome is the sub-region of prognostic variable space. For a syndrome to be useful in the algorithm, within the syndrome, one class of samples (for instance, G3 tumours) must be significantly highly represented than another class (for instance, G1s), and in other sub-region(s) the inverse relationship should be observed. In the present version of the SWS method, one-dimensional and two-dimensional sub-regions (syndromes) are used.
- Let b' i and b" i denote the boundaries of the sub-region for the variable Xi (the i-th probe set);


- SWS training algorithm is based on three major steps:
- 1) optimal recoding (partitioning) of the given covariates (signal intensity values) to obtain discrete-valued variables with low and high gradation;
- 2) selection of the most informative and robust of these discrete-valued variables and their paired combinations (termed syndromes) that together best characterize the classes of interest;
- 3) tallying the statistically weighted votes of these syndromes to allow us to compute the value of the outcome prediction function.
- The OP method is used for constructing the optimal syndromes for each class (G1 and G3) using the training set S̃ 0. The OP is based on the optimal partitioning of some potential prognostic variable Xi range that allows the best separation of the samples belonging to different classes. To evaluate the separating ability of partition R (see below) in the training set S̃ 0 the chi-2 functional is used (Kuznetsov et al, 1998). The optimal partitions are searched inside observed variable domain that contain partitions with cut-off values not greater than a fixed threshold (defined below). The partition with the maximal value of the chi-2 functional is considered optimal for the given variable.
- Another important characteristic that allows evaluation the prognostic ability of partitioning model for specific variables is the index of boundary instability. Let Ro, R 1,..., Rm be optimal partitions of variable Xi ranges that is calculated by training set S̃ 0,S̃ 1,...,S̃m , where S̃k is the training set without description of the kth sample. Let Kj denote the different classes (j=1,2). Let


- The OP can be used at the initial stage of training for reducing the dimension of the prognostic variables set. Selection of the optimal set of prognostic variables depends on a sufficiently high partition value determined by the Chi-2 function. The additional criterion of selection of prognostic variables is the instability index κ(S̃ 0,Kj,r). The variable is used if value κ(S̃ 0 ,Kj,r) is less than threshold κ 0, defined a priori by the user. When the partition of the given variable is instable (κ(S̃ 0,Kj,r)< κ 0), the variable is removed from the final optimal set of prognostic variables. Finally, the optimal set of prognostic variables is defined if both selection criteria are fulfilled.
- Let


 equal to zero in cases when the given syndrome is associated only with objects of one class from the training set.
- The results of testing applied and simulated tasks have demonstrated that formula (1) gives too low of estimates of conditional probabilities for classes that are of smaller fraction in the training set. So the additional correction of estimates in (1) has been implemented. The final estimates of conditional probability at point x* are calculated as


- Our methodology is based on the schema presented in
Figure 1 . - Beginning with the Uppsala dataset comprised of 68 G1 and 55 G3 tumours, we used SWS optimal partitioning (OP) at the initial stage of training to reduce the dimension of the prognostic variables set. SWS rank orders the set of probes according to specific algorithmic criteria for assessing differential expression between classes.
- Based on this two-criteria (chi-2 and instability index) selection algorithm, we used SWS chi-2 values bigger than 24.38 (at p-value less then 0.00001); in combination with low boundary instability index criteria (κ 0 <0.1 for 90% of the selected informative variables and κ 0 <0.4 for 10% of the other informative variables). Visual presentation on scatchard plot (log κ 0, chi-2) distribution of probesets, these two cut-off values discriminated the relatively small and compact group of probesets. We observed that this group of probesets provide a local minima on the Class Error Rate (CER) function and provide an optimal selection of 264 probesets classifier of G1 and G3. Using these 264 probe sets, the both SWS and PAM methods provide a small misclassification error (4.5% for G1, and 5.5% for G3, respectively) when the leave-one-out cross-validation procedure is used. We also used the U-test with critical value p=0.05 (with Bonferroni correction) and all 264 probesets follow this cut-off value.
- Based on our selection criteria, we selected a classifier comprising 264 probe sets, which we term the "
SWS Classifier 0". See Table D1 in section "SWS Classifier 0" of the Description as well asAppendix 1. - Details are shown in Appendix 1A,
Appendix 2,Appendix 3 andAppendix 4. - A posterior probability for G1 and G3 was also estimated by
SWS Classifier 2 for each tumour sample by the classical leave-one-out cross-validation procedure. - We estimated the class error rate based on the misclassification error rate plot (Tibshirani et al, 2002) and found that for the 264 selected probe sets, CER consists of 5% for G1, and 6% for G3, respectively. Similar discrimination was obtained with SWS methods (see above).
- Based on consistency between SWS and U-tests and PAM CER validation of the selection procedure, we further considered the classification results using the 264 variables. In two-group comparisons, high CER were observed in the G1-G2 and G2-G3 predictions (data not shown), while G1-G3 classification accuracy was high (<5% errors). Complementary to SWS classification method, the PAM method confirms that G2 tumours are not molecularly distinct from either low or high grade tumours, possibly owing to substantial molecular heterogeneity within the G2 class.
- To extract the smallest possible classifier from the 264 variables, we varied the initial parameters of the SWS algorithm to minimize the number of predictors in training set providing the maximum correlation coefficient between posteriori probabilities and true class indicators (specifically, 1 was the indicator of G1 tumours, and 3 was the indicator of G3 tumours in the G1-G3 comparison). The predictive power of the predictor set was estimated using standard leave-one-out procedure and counting the numbers of errors of class predictions.
- We derived a classifier comprising 6 gene probe sets (5 genes) which we term the "
SWS Classifier 1". 4.4% for class G1; and 5.5% for class G3 CERs were obtained with theSWS Classifier 1. SeeFigure 1 and Table D2 in section "SWS Classifier 1" of the Description. - Appendix 5A, Appendix 5B and Appendix 5C show detailed information about selected gene probe sets, optimal partition boundaries, true classes, posterior probabilities and clinical significance of the
SWS Classifier 1 predictor (estimated by patient survival analysis). - By SWS, for the G1-G3 comparisons, maximal prediction accuracies are obtained with 18 probe sets (17 genes). We refer to this 18 probe set as the "
SWS Classifier 2". See Table D3 in section "SWS Classifier 2" of the Description. This classifier includes all five genes represented bySWS Classifier 1. - Appendix 6A, Appendix 6B and Appendix 6C show detailed information about selected gene probe sets, optimal partition boundaries, true classes, posterior probabilities and clinical significance of the SWS Classifier 2 (estimated by patient survival analysis).
- With the 18 probe sets, both the
SWS Classifier 2 and PAM correctly classify ∼96% (65/68) of the G1s and ∼95% (52/55) of the G3s (by leave one-out method). - The smaller number of probes sets required by SWS Classifier 1 (6 probe sets) compared to PAM (18 probe sets, data not presented) may reflect the ability of SWS to use more diverse interaction and/or co-expression patterns during variable selection.
- The posterior probability (Pr) is an estimate of the likelihood that a sample from the exam group of tumours belongs to one class (termed "G1-like") or the other (ie, "G3-like"). Both 18 probesets SWS and PAM classifiers scored the vast majority of G1 and G3 tumours with high probabilities of class membership.
- Due to the highly informative and stable nature of each gene (represented by Affymetrix probe-sets) of the 264 predictor set we hypothesized that there are many small alternative gene sub-sets that could be used to classify tumours with high accuracy (and therefore classify patients according to outcome with high prognostic significance). For example, high Pr scores for the class assignments of G1 and G3 by SWS classifier 1 (6 probesets, as shown in Table D2 in section "
SWS classifier 1" of the Description and Appendix 5A) and SWS class assignments of G1-like and G3-like classes within G2 class were observed. - Notably, 95% of the tumours of the Uppsala cohort showed >75% probability of belonging to either the G1-like or G3-like class, indicating a highly discriminant statistical basis for the class prediction function of the
SWS classifier 1 for the G2 class. - To find other classifiers, we excluded the best 6 probe sets (SWS classifier 1) from the 264 probe sets, and randomly selected two non-overlapping subsets (each of 40 probe sets) from the remaining 258 probe sets and applied the SWS algorithm to each subset.
- In this way, we selected two additional classifiers: SWS classifier 3 (6-probe sets; Table D4 in section "
SWS Classifier 3" of the Description and Appendix 7A) and SWS classifier 4 (7-probe sets; Table D5 in section "SWS Classifier 4" of the Description and Appendix 8A). - Tables D4 and D5 are organized as Table D3. For Uppsala, Stockholm and Singapore cohorts, each of three SWS classifiers provide similar high accuracy of classification in G1-G3 comparisons (Tables D3-D5). SWS also provided high and reproducible levels of separation of G2a and G2b sub-groups for different cohorts and highly significant differences in G2a-G2b comparison based on survival analysis (Tables D3-D5).
- These tables show the values of parameters of SWS algorithm for selected classifies, predicted individual probabilities of belonging to the given class, and gene annotation, clinical significance etc.
- Thus, we could consider the 264 probe sets as a general genetic classifier of the G2a (G1-like) and G2b (G3-like) tumour types.
- We next applied our grade classifiers directly to the 126 G2 tumours of the Uppsala cohort to ask if these genetic determinants of low and high grade might resolve moderately differentiated G2 tumours into separable classes. Using SWS for the 264 predictor set, we observed that the G2 tumours could be separated into G1-like (n=83) and G3-like (n=43) classes with few tumours exhibiting intermediate Pr scores (Appendix 2).
- The probabilities of the SWS class assignments are shown in
Figure 2B (Figure 2 , Panel B) and more detailed information inAppendix 2. - We found 96% of the G2 tumours were assigned by the SWS classifier (and 94% by the PAM classifier, data not shown) to either the G1-like or G3-like classes with >75% probability, indicating that almost all G2 tumours can be molecularly well separated into distinct low- and high-grade-like classes (henceforth referred to as "G2a" and "G2b" genetic grades) (Appendix 2).
- We validated the separation ability of G1a and G2b based on individual predictors and showed that all of them are statistically significant by U-test and t-test (Appendix 3).
- Clinical validation (survival analysis) of G2a and G2b tumour subtypes based on the predictor set (or genetic classifier), showed a highly significant difference between survival curves of the G1a and G2b patients (Appendix 4).
- To determine if the genetic grade classification correlates with patient outcome, we compared the disease-free survival (DFS) of patients with histologic G2 tumours classified as G2a or G2b by the SWS algorithm. (Due to space limitations and high concordance between the SWS and PAM classifiers, only data for the SWS classifier are presented hereafter.)
- The Kaplan-Meier survival curves for these patients are shown in
Figure 3 (green and red curves) superimposed on the survival curves of histologic G1, G2 and G3 patients (black curves) for comparison. Patients with G2a tumours showed a significantly better disease-free survival than those with G2b disease, regardless of therapeutic background (p=0.001;Figure 3A ). - This finding is consistent in specific therapeutic contexts including untreated patients (
Figure 3B ), systemic therapy (Figure 3C ), and hormone therapy only (Figure 3D ) with survival differences significant at p=0.019, p=0.10 and p=0.022, respectively. These findings demonstrate a robust prognostic power of the genetic grade classifier in moderately differentiated tumours independent of therapeutic effects. - For external validation, we directly applied the SWS classifier to two large independent cohorts of primary breast cancer cases that are also graded according to the NGS guidelines and profiled on the Affymetrix platform (albeit at different times and in different laboratories). The results of the grade classifications are shown in
Figure 2 . - In both the Stockholm and Singapore cohorts, the G1 tumours are correctly classified with high accuracies similar to that observed in the training set: 96% (27/28) for Stockholm and 91% (10/11) for Singapore (
Figure 2C and Figure 2E ). However, both cohorts showed less accuracy in classifying the G3 tumours: 75% (46/61) for Stockholm and 72% (34/47) for Singapore. Despite this, the classifier remained capable of dividing the vast majority of the tumour samples into G1-like and G3-like classes with high Pr scores, and this remained true for the G2 tumours of both the Stockholm and Singapore cohorts (Figure 2D and Figure 2F ). - As clinical histories are available on the Stockholm patients, we tested the prognostic performance of the classifier on this new G2 population of which 79% (46/58) of tumours are classified as G2a and 21% (12/58) are classified as G2b. Though this set is considerably smaller than the Uppsala G2 set, similar survival associations are observed.
- As
Figure 3E and Figure 3F show, patients with the G2a subtype are significantly less likely to relapse than those with tumours of the G2b subtype, indicating that the prognostic performance of the genetic grade classifier is reproducible in a second, independent population of G2 patients. - To assess the prognostic novelty of the classifier, we used multivariate Cox regression models to compare its performance to that of other conventional prognostic indicators assessed in the Uppsala cohort including lymph node status, tumour size, patient age, and estrogen (ER) and progesterone (PgR) receptor status. See Table E3 below.
Table E3. The genetic grade signature is a strong independent indicator of disease-free survival in a multivariate analysis with conventional risk factors. All patients Untreated patients Systemic therapy-treated patients ER+, Tamoxifen-treated patients Variables p-value Hazard ratio (95% CI) p-value Hazard ratio (95% CI) p-value Hazard ratio (95% CI) p-value Hazard ratio (95% CI) genetic grade signature 0.001 1.50-5.09 0.046 1.02-7.77 0.038 1.49-8.01 0.009 1.39-9.99 LN status 0.031 0.27-0.94 0.700 0.01-23.53 0.091 0.13-1.16 0.096 0.11-1.20 Tumour size 0.054 0.99-1.07 0.950 0.91-1.10 0.016 1.01-1.11 0.250 0.97-1.09 Age 0.500 0.97-1.06 0.820 0.96-1.03 0.440 0.96-1.02 0.450 0.94-1.02 ER status 0.061 0.46-1.06 0.640 0.15-3.18 0.110 0.01-1.55 - - PgR status 0.300 0.57-6.10 - - 0.270 0.56-7.76 0.990 0.10-9.50 - As Table E3 shows, the genetic grade signature remained significantly associated with outcome in the different therapeutic contexts independent of the classical predictors, and is superior to both LN status and tumour size in all four treatment subgroups with the exception of systemic therapy where only tumour size is more significant.
- This finding is further substantiated by a robust model selection approach (the Akaike Information Criterion) whereby the genetic grade classifier remained more significant than LN status and tumour size in all therapeutic subgroups (data not shown). These results demonstrate a powerful and additive contribution of the genetic grade classifier to patient prognosis.
- The prognostic performance of the classifier suggests that G2a and G2b genetic grades may in fact represent distinct pathological entities previously unrecognized. We investigated this possibility by several approaches.
- First we examined the histopathological composition of the G2a and G2b tumours and found that the predominant histologic subtypes - ductal, lobular and tubular - are equally distributed within the two classes and therefore not correlated with genetic grade (data not shown). Next, we analyzed the expression levels of the selected 264 probesets (i.e., representing ∼232 genes) as the maximum number of probesets capable of recapitulating a high G1/G3 classification accuracy (see Methods). These genes represent the top most significantly differentially expressed genes between G1 and G3 tumours after correcting for false discovery (see Table D1 above).
- As shown in
Figure 4 , hierarchical cluster analysis using this set of genes shows a striking separation of the G2 population into two primary tumour profiles highly resembling the G1 and G3 profiles and that separate well into the G2a and G2b classes. Indeed, all but 11 of these 264 gene probesets are also differentially expressed (at p<0.05, Wilcoxon rank-sum test) between the G2a and G2b tumours. - This finding shows that extensive molecular heterogeneity exists within the G2 tumour population, and this heterogeneity is robustly defined by the major determinants of G1 and G3 cancer. It also demonstrates that a much larger and pervasive transcriptional program underlies the genetic grade predictions of the SWS signature - despite its composition of a mere 5 genes. Furthermore, statistical analysis of the gene ontology (GO) terms associated with the G2a-G2b differentially expressed genes revealed the significant enrichment of numerous biological processes and molecular functions.
- Table E4 displays a selected set of significantly enriched GO categories which includes cell cycle, inhibition of apoptosis, cell motility and stress response, suggesting an imbalance of these cellular processes between the G2a- and G2b-type tumour cells.
Table E4. Gene ontology analysis of differentially expressed genes. Selected terms are shown with corresponding p-values that reflect significance of term enrichment Biological Process G1 vs G2a G2a vs G2b G2b vs G3 Cell cycle 6.2E-06 5.7E-28 2.5E-06 Chromatin packaging and remodeling 1.3E-02 2.5E-02 Mitosis 2.7E-02 6.8E-15 1.1E-03 Inhibition of apoptosis 4.4E-03 4.9E-03 Oncogenesis 1.6E-02 5.5E-04 5.5E-03 Cell motility 3.6E-02 4.4E-02 Stress response 5.0E-03 Molecular Function Kinase activator 1.1E-03 7.2E-06 Histone 3.5E-03 5.0E-02 Nucleic acid binding 1.3E-02 Microtubule family cytoskeletal protein 7.6E-07 4.2E-04 Chemokine 7.5E-03 Non-receptor serine/threonine protein kinase 7.8E-04 Extracellular matrix linker protein 1.9E-02 Pathway Insulin/IGF pathway-MAPKK/MAPK cascade 4.9E-02 Apoptosis signaling pathway 4.9E-02 Ubiquitin proteasome pathway 3.0E-02 - Table S2 below shows the complete list of GO categories and their p values.
Table S2. Comprehensive table of significant gene ontology terms identified in the different tumour group comparisons. G2a vs. G2b tumours Biological Process NCBI REFLIST (23481) expected ratio observed ratio P value Cell cycle 853 7.08 50 5.69E-28 Mitosis 287 2.38 22 6.78E-15 Cell proliferation and differentiation 751 6.24 32 4.21E-14 Cell cycle control 390 3.24 23 3.50E-13 Chromosome segregation 102 0.85 10 2.00E-08 Cell structure 624 5.18 17 2.16E-05 Protein targeting and localization 225 1.87 10 2.27E-05 Cell structure and motility 1021 8.48 22 4.73E-05 DNA metabolism 305 2.53 11 5.82E-05 Oncogenesis 600 4.98 14 5.52E-04 DNA replication 89 0.74 5 9.62E-04 Protein phosphorylation 592 4.92 13 1.49E-03 Meiosis 68 0.56 4 2.65E-03 Inhibition of apoptosis 127 1.05 5 4.43E-03 Stress response 187 1.55 6 5.03E-03 Biological process unclassified 9457 78.54 61 5.89E-03 Protein biosynthesis 598 4.97 0 6.54E-03 Carbohydrate metabolism 512 4.25 0 1.36E-02 Cytokinesis 116 0.96 4 1.65E-02 Protein modification 1013 8.41 15 2.27E-02 Chromatin packaging and remodeling 196 1.63 5 2.47E-02 Sensory perception 642 5.33 1 2.91E-02 Cytokine/chemokine mediated immunity 83 0.69 3 3.26E-02 Other cell cycle process 4 0.03 1 3.27E-02 Proteolysis 813 6.75 2 3.35E-02 Chemosensory perception 399 3.31 0 3.54E-02 Cell motility 291 2.42 6 3.57E-02 Apoptosis 459 3.81 8 3.91E-02 DNA recombination 38 0.32 2 4.03E-02 Olfaction 364 3.02 0 4.75E-02 Molecular Function NCBI REFLIST (23481) expected ratio observed ratio P value Microtubule binding motor protein 74 0.61 10 9.86E-10 Microtubule family cytoskeletal protein 233 1.93 12 7.63E-07 Kinase activator 54 0.45 6 7.21E-06 Kinase modulator 126 1.05 8 1.27E-05 Replication origin binding protein 19 0.16 4 2.21E-05 Non-receptor serine/threonine protein kinase 289 2.4 9 7.79E-04 Protein kinase 526 4.37 12 1.64E-03 Voltage-gated sodium channel 14 0.12 2 6.23E-03 Cytoskeletal protein 824 6.84 14 9.42E-03 Kinase 692 5.75 12 1.36E-02 Extracellular matrix linker protein 25 0.21 2 1.87E-02 Ribosomal protein 431 3.58 0 2.70E-02 KRAB box transcription factor 640 5.31 1 2.95E-02 DNA strand-pairing protein 6 0.05 1 4.86E-02 Histone 99 0.82 3 5.03E-02 Pathway NCBI REFLIST (23481) expected ratio observed ratio P value Cell cycle 22 0.18 3 8.75E-04 Ubiquitin proteasome pathway 80 0.66 3 2.97E-02 DNA replication 43 0.36 2 5.03E-02 G1 vs. G2a tumours Biological Process NCBI REFLIST (23481) expected ratio observed ratio P value Cell cycle control 390 0.35 6 9.19E-07 Cell cycle 853 0.76 7 6.19E-06 Chromatin packag ing and remodeling 196 0.18 2 1.32E-02 Oncogenesis 600 0.54 3 1.57E-02 Nucleoside, nucleotide and nucleic acid metabolism 3372 3.02 7 2.31E-02 Mitosis 287 0.26 2 2.69E-02 Calcium ion homeostasis 32 0.03 1 2.82E-02 Developmental processes 2150 1.92 5 3.77E-02 mRNA transcription regulation 1553 1.39 4 4.63E-02 Molecular Function NCBI REFLIST (23481) expected ratio observed ratio P value Kinase activator 54 0.05 2 1.08E-03 Histone 99 0.09 2 3.54E-03 Kinase modulator 126 0.11 2 5.65E-03 Select regulatory molecule 979 0.88 4 1.02E-02 Nucleic acid binding 3014 2.7 7 1.29E-02 Nuclear hormone receptor 48 0.04 1 4.21E-02 Other transcription factor 387 0.35 2 4.64E-02 Pathway NCBI REFLIST (23481) expected ratio observed ratio P value Axon guidance mediated by semaphorins 50 0.04 1 4.38E-02 Insulin/IGF pathway-mitogen activated protein kinase kinase/MAP kinase cascade 56 0.05 1 4.89E-02 G2b vs. G3 tumours Biological Process NCBI REFLIST (23481) expected ratio observed ratio P value Cell cycle 853 2.29 12 2.50E-06 Cell proliferation and differentiation 751 2.01 10 3.03E-05 Cell cycle control 390 1.05 7 8.55E-05 Mitosis 287 0.77 5 1.06E-03 Chromosome segregation 102 0.27 3 2.68E-03 Inhibition of apoptosis 127 0.34 3 4.93E-03 Oncogenesis 600 1.61 6 5.45E-03 Apoptosis 459 1.23 5 7.85E-03 Meiosis 68 0.18 2 1.46E-02 Chromatin packaging and remodeling 196 0.53 3 1.59E-02 Protein targeting and localization 225 0.6 3 2.28E-02 Developmental processes 2150 5.77 11 2.69E-02 Oncogene 98 0.26 2 2.88E-02 Skeletal development 108 0.29 2 3.43E-02 Determination of dorsal/ventral axis 14 0.04 1 3.69E-02 Cytokinesis 116 0.31 2 3.91E-02 Cell motility 291 0.78 3 4.36E-02 Embryogenesis 131 0.35 2 4.86E-02 Molecular Function NCBI REFLIST (23481) expected ratio observed ratio P value Microtubule family cytoskeletal protein 233 0.63 5 4.19E-04 Chromatin/chromatin-binding protein 132 0.35 3 5.49E-03 Chemokine 48 0.13 2 7.51E-03 Non-motor microtubule binding protein 52 0.14 2 8.76E-03 Microtubule binding motor protein 74 0.2 2 1.71E-02 Other transcription factor 387 1.04 4 2.04E-02 Cytoskeletal protein 824 2.21 6 2.31E-02 Reductase 108 0.29 2 3.43E-02 Pathway NCBI REFLIST (23481) expected ratio observed ratio P value Apoptosis signaling pathway 131 0.35 2 4.86E-02 - To extend our analysis beyond the transcript level, we investigated the differences between G2a and G2b tumours using conventional clinicopathological markers.
- Of the three histologic grading criteria, both mitotic count and nuclear pleomorphism are found to significantly vary between the G2a and G2b tumours (p=0.007 and p=0.05;
Figure 5A and Figure 5I ). Protein levels of the proliferation marker Ki67 are also found to be significantly different between the G2a and G2b tumours (p<0.0001;Figure 5B ). - These findings, together with those of the gene ontology analysis, suggest that the genetic grade classifier may largely mirror cell proliferation and thus reflect the replicative potential of the breast tumour cells. However, proliferation is not the only oncogenic factor found to be associated with genetic grade. In the G2b tumours, protein levels of VEGF (
Figure 5C ), a major inducer of angiogenesis, and the degree of vascular growth (Figure 5D ) are both found to be significantly higher compared to the G2a samples (p=0.015 and p=0.002, respectively) suggesting that a difference in angiogenic potential also distinguishes the two genetic grade classes. - Further analysis of bio-markers revealed yet more oncogenic differences. P53 mutations are found in only 6% of the G2a tumours, whereas 44% of the G2b tumours are p53 mutants (p<0.0001;
Figure 5E ) consistent with their higher replicative potential, and likely conferring a further survival advantage to these tumours via decreased apoptotic potential. We also observed higher levels of cyclin E1 protein (p=0.04;Figure 5F ) in the G2b tumours which, in addition to contributing to enhanced proliferation (20), may also confer greater genomic instability (21, 22). - Finally, we observed a significant difference in hormonal status between the G2a and G2b tumours, with an increasing fraction of ER negative (7% versus 19%; p=0.06) and PgR negative (8.5% versus 23%; p=0.02) tumours in the G2b class, indicating differences in hormome sensitivity and dependence.
- Taken together, these results show that multiple tumourigenic properties measured at the RNA, DNA, protein, and cellular levels can subdivide the G2a and G2b tumour subtypes - a finding that may explain, in part, the different patient survival outcomes observed between these two genetic classes.
- The genetic and clinicopathological evidence suggests that the genetic grade signature reflects, among other properties, the proliferative capacity of tumour cells. That proliferation rate is positively correlated with poor outcome in breast cancer (23) could explain the prognostic capacity of the genetic grade signature.
- To further investigate this possibility, we analyzed the major proliferation markers, Ki67, S-phase fraction and mitotic index, together with the genetic grade signature, for survival correlations in Cox regression models (Table S3).
Table S3. Multivariate analysis of proliferation markers and the genetic grade signature for disease-free survival correlations among patients with Grade II tumours. Uppsala G2 patients Variables p-value Hazard ratio (95% CI) Genetic grade signature 0.0075 1.28-4.88 Ki67 0.9300 0.92-1.08 S-phase fraction 0.9200 0.50-1.86 Mitotic index 0.6900 0.56-2.40 - Multivariate analysis showed that the genetic grade signature remained a significant independent predictor of recurrence (p=0.0075) in the presence of these proliferation markers, suggesting that the prognostic power of the grade signature derives from more than just and association with cell proliferation.
- In the survival analysis (
Figure 3 ), we observed no significant survival differences between patients with G1 and G2a tumours, nor those with G3 and G2b tumours. This observation, together with the transcriptional analysis inFigure 4 , suggests that the G2a and G2b classes may be clinically and molecularly indistinguishable from histologic G1 and G3 tumours, respectively. - To address this, we further analyzed the expression patterns of the 264 grade-associated probesets described in
Figure 4 . We discovered 14 genes and 57 genes significantly differentially expressed (p<0.01, Mann-Whitney U-test) between the G1 and G2a tumours and G3 and G2b tumours, respectively. - Notably, FOS and FOSB, central components of the AP-1 transcription factor complex, are expressed at higher levels in the G1 tumours, while genes involved in cell cycle progression such as CCNE2, MAD2L1, ASK and ECT2 are expressed at higher levels in the G2a tumours. In a similar fashion, the G3 tumours showed higher expression of cell cycle genes such as CDC20, BRRN1 and TTK as well as proliferative genes with oncogenic potential including MYBL2, ECT2 and CCNE1 when compared to the G2b tumours, while the anti-apoptotic gene, BCL2, is expressed at higher levels in the G2b tumours.
- GO analysis of these differentially expressed genes indicated larger biological differences. In the G1-G2a comparison, the differentially expressed genes pointed to differences primarily in cell cycle-related processes and oncogenesis, while differences between the G2a and G3 tumours included cell cycle-related processes, inhibition of apoptosis, oncogenesis and cell motility (Table E4, Table S2).
- Statistical analysis of conventional clinicopathological markers revealed further distinctions in the G1-G2a and the G2b-G3 tumour comparisons. As shown in
Figure 5 , G2a tumours showed significant increases in tumour size (K), lymph node positivity (L), cellular mitoses (A), tubule formation (J) and Ki67 levels (B) compared to histologic G1 tumours, and the G3 population showed significant increases in tumour size (K), vascular growth (D), mitoses (A), tubule formation (J), cyclin E1 (F) and ER negative status (G) when compared to the G2b tumours. - Taken together, these data indicate that the G2a and G2b populations, though highly similar to G1 and G3 tumours in terms of survival and transcriptional configuration, remain separable at multiple molecular and clinicopathological levels.
- The prognostic performance of the genetic grade signature in the G2 population suggests that the molecular "misclassifications" in the G1-G3 comparisons might correlate with survival differences. Of the 68 Uppsala and 28 Stockholm G1 tumours, too few are classified as G3-like (ie, 4 in total) for a reliable Kaplan-Meier estimate.
- However, among the 55 Uppsala and 61 Stockholm G3 tumours, a total of 18 are classified as G1-like. Kaplan-Meier analysis could not confirm a significant disease-free-survival advantage for these patients, though a trend is observed (
Figure 7A ). Interestingly, scaling of the SWS probability (Pr) score to a threshold of Pr>0.8 (for G1-like) resulted in the selection of 12 G1-like G3 tumours associated with only two relapse events (one being a local recurrence only), thus having a survival curve moderately different from that of the remaining G3 population (p=0.077;Figure 7A ). - This finding suggests that the prognostic significance of the classifier may extend also to the poorly differentiated G3 tumours, and that scaling based on the classifier Pr score may allow the fine tuning of prognostic sensitivity and/or specificity, depending on the clinical application.
- The Nottingham Prognostic Index (NPI) is a widely accepted method of stratifying patients into prognostic groups (good (GPG), moderate (MPG) and poor (PPG)) based on lymph node stage, tumour size, and histologic grade (24). It is described in detail in Haybittle et al., 1982. We investigated whether incorporating genetic grade into the NPI could improve patient stratification. A simplified substitution method was explored.
- For all tumours of the Uppsala and Stockholm cohorts for which NPI scores and survival information could be obtained (n=382), histologic grade (1, 2 or 3) is replaced by the genetic grade prediction (1 or 3) and new NPI (ie, ggNPI) scores are computed (see Methods). The survival of patients stratified into risk groups is then compared between classic NPI and ggNPI.
- Though the survival curves of the NPI and ggNPI prognostic groups are comparable (
Figure 6A and Figure 6B ), the ggNPI reclassified 96 patients into different prognostic groups (ie, 46 into GPG, 36 into MPG, and 13 into PPG). The survival curves of these reclassified patients are highly similar to the GPG, MPG and PPG of the classic NPI (Figure 6C ) indicating that reclassification by genetic grade improves prognosis of patient risk. - Practical guidelines that use the NPI in therapeutic decision making often recognize an excellent prognostic group (EPG) comprised of patients with NPI scores </= 2.4 (25, 26). Untreated patients in this group with lymph node negative disease have a 95% 10-year survival probability - equivalent to that of an age-matched female population without breast cancer (26). Thus, patients in this group are routinely not recommended for post-operative adjuvant therapy (25-27).
- We compared the NPI and ggNPI stratifications on a subset of 161 lymph-node-negative patients who received no adjuvant systemic therapy. Forty-three and 87 patients are classified into the EPG by the classic NPI and ggNPI, respectively. Of the 43 patients classified into the EPG by the classic NPI, only one was considered different by the ggNPI; whereas, of those classified as needing adjuvant therapy by the classic NPI (ie, scores >2.4), 45 are reclassified by the ggNPI into the EPG.
- When examined for outcome, the survival curves of the 43 and 87 EPG patients by NPI and ggNPI, respectively, are statistically indistinguishable, both showing ∼94% survival at 10 years (
Figure 6D ). - Thus, twice as many patients could be accurately classified into the EPG by the ggNPI, suggesting that the use of genetic grade can improve prediction of which patients should be spared systemic adjuvant therapy.
- The clinical subtyping of cancer directly impacts disease management. Subtypes indicative of tumour recurrence or drug resistance indicate the need for more aggressive or specific therapeutic strategies, while those that suggest less aggressive disease may specify milder therapeutic options. While clinical subtyping has historically been based primarily on the phenotypic properties of cancer, comprehensive genomic and transcriptomic analyses are beginning to reveal robust genotypic determinants of tumour subtype. In this context, we have studied the transcriptomes of primary invasive breast cancers using expression microarray technology to elucidate the genetic underpinnings of histologic grade, and to use this information to resolve the clinical heterogeneity associated with histologic grade.
- Using two different supervised learning algorithms, SWS and PAM, we identified small gene subsets capable of classifying histologic Grade I and Grade III tumours with high accuracy. The smallest gene signature (SWS), comprised of a mere 5 genes (6 probesets), partitioned the large majority of G2 tumours into two highly distinguishable subclasses with G1-like and G3-like properties (G2a and G2b, respectively). Not only are the G2a and G2b tumours molecularly similar to those of histologic G1 and G3, respectively, but the disease-free survival curves of G2a and G2b patients are also highly resemblant of those of G1 and G3 patients. Moreover, these observations are confirmed in a large independent breast cancer cohort. Further analysis revealed that extensive genetic differences between the G2a and G2b classes are accompanied by a host of biological and tumourigenic differences know to separate low and high grade cancer (28) including proliferation rate (mitotic index, Ki67), angiogenic potential (VEGF, vascular growth), p53 mutational status, and estrogen and progesterone dependence, to name a few. Together, these findings demonstrate that the genetic grade signature recognizes and delineates two novel grade-related clinical subtypes among moderately differentiated G2 tumours.
- Ma et. al. (2003) were the first to report a histologic grade signature capable of distinguishing low and high grade breast tumours. Using 12K cDNA microarrays to analyse material from 10 G1, 11G2 and 10 G3 microdissected tumours, they identified from a list of 1,940 variably expressed, well-measured genes (the top 200 differentially expressed between G1 and G3 tumours (p<0.01 after false discovery correction) (29). Using these genes to cluster their graded tumours, they observed that the majority of G2 tumours possessed a hybrid signature intermediate to that of G1 and G3 with few exceptions (see
Figure 3 in Ma et. al., PNAS, 2003). Notably, this finding is in contrast with our discovery that the majority of G2 tumours do not display hybrid signatures (Figure 4 ; profiles of the top 264 gene probesets), but rather possess clear G1-like or G3-like gene features. According to our SWS classifiers, only a small percentage (6%) of theGrade 2 tumours has intermediate grade measurements (i.e. Pr score <0.75 for G1-like and G3-like). - To address this discrepancy, we cross-compared their list of 200 grade-associated genes to our list of 232 and observed a significant overlap of 35 genes (p<1.0x10⁻⁷; Monte Carlo simulation) including 2 of our 5 SWS signature genes, MELK and STK6. However, this overlap, despite its significance, represents only a small percentage of either gene list. That the two lists are mostly dissimilar in composition, and that the Ma et. al. study included both invasive (IDC) and noninvasive (DCIS) tumours could explain, to some degree, the variable results observed. Nevertheless, our finding that G2 tumours are predominantly G1-like or G3-like is clinically substantiated by the significant and reproducible survival differences observed between the G2a and G2b classes. It is also possible that differences in sample size (we have much larger number of patients than in Ma etc work), sample preparation, sample size, RNA purification, data normalization could have contributed to the variable results.
- To better understand the prognostic value of the genetic grade signature, we compared its performance to other major indicators of outcome in multivariate Cox regression models. In G2 tumours, not only did the classifier remain an independent predictor of disease recurrence, but it is consistently a more powerful predictor than lymph node status and tumour size, underscoring its value as a new prognostic indicator. When incorporated into the Nottingham Prognostic,Index (Haybittle et al., 1982), the genetic grade signature improved risk stratification for 25% of patients (compared to the classic NPI) and more than doubled the fraction of lymph node negative patients that should be classified into the excellent prognostic group and thus spared adjuvant treatment.
- Breast cancer is thought to progress from a hyperplastic state, to a noninvasive malignant form (carcinoma in situ), to invasive carcinoma and, ultimately, to metastatic disease (30-32). Both the noninvasive and invasive forms can be stratified according to histologic grade. Whether grade is a continuum through which breast cancer progresses, or whether it is merely the endpoint of distinct genetic pathways has been debated (33-38). Studies comparing primary tumours to their subsequent metastases have supported the grade progression model, particularly when multiple metachronous recurrences are analyzed (38, 39). However, comparative genomic studies have identified reproducible chromosomal alterations that distinguish low and high grade disease including a 16q deletion unique to G1 carcinomas (36, 37, 40). These studies argue against the progression model and point to genetic origins of histologic grade. In our study of 494 invasive primary tumours, 94% could be molecularly classified with high probability of being G1-like or G3-like, while only 6% showed intermediate Pr scores (ie, <0.75 for G1-like or G3-like). Notably, we observed these same percentages in the G2 population of 224 tumours. These findings support the genetic pathways model of grade origin, as they suggest that the large majority of breast cancers fundamentally exist in one of two predominant forms marked by the molecular and clinical essence of low or high grade. Whether these forms correlate with the grade-specific genomic alterations previously reported (36, 37, 40) remains to be elucidated.
- It should also be noted that although a small percentage (∼6%) of the tumours in our study had intermediate genetic grade measurements (ie, analogous to the hybrid signature observed in Ma et. al. (2003)), too few were discovered to determine the clinical relevance of this intermediate genotype. Furthermore, it is unclear whether these intermediates arise as homogeneous cells that truly borderline low and high grade, or rather represent heterogeneous tumours comprised of distinct low and high grade cell types, such as that observed in tubular mixed carcinoma (38). Alternatively, that we observed the same percentage of intermediacy in tumour classification of all grades and across cohorts, suggests that this class represent a baseline level of uncertainty owing the technical noise.
- In conclusion, our results show that the genetic essence of histologic grade can be distilled down to the expression patterns of a mere 5 genes with powerful prognostic implications, particularly in the Grade II setting and in the context of the NPI. The results indicate that G2 invasive breast cancer, at least in genetic terms, does not exist as a significant clinical entity. Indeed, our genetic grade signature dichotomized G2 tumours into two biologically and clinically distinct subtypes that could further be distinguished from G1 and G3 populations. Thus histologic grading, together with measurements of genetic grade, provide a rational basis for the refinement of the G2 subtype into subgrades "2a" and "2b" with immediate clinical ramifications.
- Furthermore, our finding that the genetic grade signature could further resolve outcome prediction in G3 tumours, and in a manner dependent on Pr score thresholding, suggests that the genetic grade classifier, viewed as a scalable continuous variable, may have robust prognostic benefit in the diagnosis of all breast tumours. How to optimally weight the genetic grade measurement in combination with other risk factors for greatest prognostic return is a clinical challenge that must next be addressed.
-
- 1. Alizadeh, A.A., Eisen, M.B., Davis, R.E., Ma, C., Lossos, I.S., Rosenwald, A., Boldrick, J.C., Sabet, H., Tran, T., Yu, X., et al. 2000. Distinct types of diffuse large B-cell lymphoma identified by gene expression profiling. Nature 403:503-511.
- 2. Sorlie, T., Perou, C.M., Tibshirani, R., Aas, T., Geisler, S., Johnsen, H., Hastie, T., Eisen, M.B., van de Rijn, M., Jeffrey, S.S., et al. 2001. Gene expression patterns of breast carcinomas distinguish tumour subclasses with clinical implications. Proc Natl Acad Sci U S A 98:10869-10874.
- 3. van't Veer, L.J., Dai, H., van de Vijver, M.J., He, Y.D., Hart, A.A., Mao, M., Peterse, H.L., van der Kooy, K., Marton, M.J., Witteveen, A.T., et al. 2002. Gene expression profiling predicts clinical outcome of breast cancer. Nature 415:530-536.
- 4. Bullinger, L., Dohner, K., Bair, E., Frohling, S., Schlenk, R.F., Tibshirani, R., Dohner, H., and Pollack, J.R. 2004. Use of gene-expression profiling to identify prognostic subclasses in adult acute myeloid leukemia. N Engl J Med 350:1605-1616.
- 5. Bloom, H.J., and Richardson, W.W. 1957. Histological grading and prognosis in breast cancer; a study of 1409 cases of which 359 have been followed for 15 years. Br J Cancer 11:359-377.
- 6. Elston, C.W., and Ellis, I.O. 1991. Pathological prognostic factors in breast cancer. I. The value of histological grade in breast cancer: experience from a large study with long-term follow-up. Histopathology 19:403-410.
- 7. Schumacher, M., Schmoor, C., Sauerbrei, W., Schauer, A., Ummenhofer, L., Gatzemeier, W., and Rauschecker, H. 1993. The prognostic effect of histological tumour grade in node-negative breast cancer patients. Breast Cancer Res Treat 25:235-245.
- 8. Roberti, N.E. 1997. The role of histologic grading in the prognosis of patients with carcinoma of the breast: is this a neglected opportunity? Cancer 80:1708-1716.
- 9. Lundin, J., Lundin, M., Holli, K., Kataja, V., Elomaa, L., Pylkkanen, L., Turpeenniemi-Hujanen, T., and Joensuu, H. 2001. Omission of histologic grading from clinical decision making may result in overuse of adjuvant therapies in breast cancer: results from a nationwide study. J Clin Oncol 19:28-36.
- 10. Harvey, J.M., de Klerk, N.H., and Sterrett, G.F. 1992. Histological grading in breast cancer: interobserver agreement, and relation to other prognostic factors including ploidy. Pathology 24:63-68.
- 11. Frierson, H.F., Jr., Wolber, R.A., Berean, K.W., Franquemont, D.W., Gaffey, M.J., Boyd, J.C., and Wilbur, D.C. 1995. Interobserver reproducibility of the Nottingham modification of the Bloom and Richardson histologic grading scheme for infiltrating ductal carcinoma. Am J Clin Pathol 103:195-198.
- 12. Robbins, P., Pinder, S., de Klerk, N., Dawkins, H., Harvey, J., Sterrett, G., Ellis, I., and Elston, C. 1995. Histological grading of breast carcinomas: a study of interobserver agreement. Hum Pathol 26:873-879.
- 13. Dalton, L.W., Pinder, S.E., Elston, C.E., Ellis, I.O., Page, D.L., Dupont, W.D., and Blamey, R.W. 2000. Histologic grading of breast cancer: linkage of patient outcome with level of pathologist agreement. Mod Pathol 13:730-735.
- 14. Younes, M., and Laucirica, R. 1997. Lack of prognostic significance of histological grade in node-negative invasive breast carcinoma. Clin Cancer Res 3:601-604.
- 15. Hayes, D.F., Isaacs, C., and Stearns, V. 2001. Prognostic factors in breast cancer: current and new predictors of metastasis. J Mammary Gland Biol Neoplasia 6:375-392.
- 16. Trudeau, M.E., Pritchard, K.I., Chapman, J.A., Hanna, W.M., Kahn, H.J., Murray, D., Sawka, C.A., Mobbs, B.G., Andrulis, I., McCready, D.R., et al. 2005. Prognostic factors affecting the natural history of node-negative breast cancer. Breast Cancer Res Treat 89:35-45.
- 17. Tibshirani, R., Hastie, T., Narasimhan, B., and Chu, G. 2002. Diagnosis of multiple cancer types by shrunken centroids of gene expression. Proc Natl Acad Sci U S A 99:6567-6572.
- 18. Kuznetsov, V.A., Ivshina, A.V., Sen'ko, O.V., Kuznetsova, A.V. 1996. Syndrome approach for computer recognition of fuzzy systems and its application to immunological diagnostics and prognosis of human cancer. Math. Comput. Modeling 23:92-112.
- 19. Jackson, A.M., Ivshina, A.V., Senko, O., Kuznetsova, A., Sundan, A., O'Donnell, M.A., Clinton, S., Alexandroff, A.B., Selby, P.J., James, K., et al. 1998. Prognosis of intravesical bacillus Calmette-Guerin therapy for superficial bladder cancer by immunological urinary measurements: statistically weighted syndrome analysis. J Urol 159:1054-1063.
- 20. Lukas, J., Herzinger, T., Hansen, K., Moroni, M.C., Resnitzky, D., Helin, K., Reed, S.I., and Bartek, J. 1997. Cyclin E-induced S phase without activation of the pRb/E2F pathway. Genes Dev 11:1479-1492.
- 21. Spruck, C.H., Won, K.A., and Reed, S.I. 1999. Deregulated cyclin E induces chromosome instability. Nature 401:297-300.
- 22. Minella, A.C., Swanger, J., Bryant, E., Welcker, M., Hwang, H., and Clurman, B.E. 2002. p53 and p21 form an inducible barrier that protects cells against cyclin E-cdk2 deregulation. Curr Biol 12:1817-1827.
- 23. van Diest, P.J., van der Wall, E., and Baak, J.P. 2004. Prognostic value of proliferation in invasive breast cancer: a review. J Clin Pathol 57:675-681.
- 24. Haybittle, J.L., Blamey, R.W., Elston, C.W., Johnson, J., Doyle, P.J., Campbell, F.C., Nicholson, R.I., and Griffiths, K. 1982. A prognostic index in primary breast cancer. Br J Cancer 45:361-366.
- 25. Blamey, R.W. 1996. The design and clinical use of the Nottingham Prognostic Index in breast cancer. Breast 5:156-157.
- 26. Stotter, A. 1999. A prognostic table to guide practitioners advising patients on adjuvant systemic therapy in early breast cancer. Eur J Surg Oncol 25:341-343.
- 27. Feldman, M., Stanford, R., Catcheside, A., and Stotter, A. 2002. The use of a prognostic table to aid decision making on adjuvant therapy for women with early breast cancer. Eur J Surg Oncol 28:615-619.
- 28. Lacroix, M., Toillon, R.A., and Leclercq, G. 2004. Stable 'portrait' of breast tumours during progression: data from biology, pathology and genetics. Endocr Relat Cancer 11:497-522.
- 29. Ma, X.J., Salunga, R., Tuggle, J.T., Gaudet, J., Enright, E., McQuary, P., Payette, T., Pistone, M., Stecker, K., Zhang, B.M., et al. 2003. Gene expression profiles of human breast cancer progression. Proc Natl Acad Sci U S A 100:5974-5979.
- 30. Lakhani, S.R. 1999. The transition from hyperplasia to invasive carcinoma of the breast. J Pathol 187:272-278.
- 31. Shackney, S.E., and Silverman, J.F. 2003. Molecular evolutionary patterns in breast cancer. Adv Anat Pathol 10:278-290.
- 32. Simpson, P.T., Reis-Filho, J.S., Gale, T., and Lakhani, S.R. 2005. Molecular evolution of breast cancer. J Pathol 205:248-254.
- 33. Tubiana, M., and Koscielny, S. 1991. Natural history of human breast cancer: recent data and clinical implications. Breast Cancer Res Treat 18:125-140.
- 34. Tabar, L., Fagerberg, G., Chen, H.H., Duffy, S.W., and Gad, A. 1996. Tumour development, histology and grade of breast cancers: prognosis and progression. Int J Cancer 66:413-419.
- 35. Millis, R.R., Barnes, D.M., Lampejo, O.T., Egan, M.K., and Smith, P. 1998. Tumour grade does not change between primary and recurrent mammary carcinoma. Eur J Cancer 34:548-553.
- 36. Roylance, R., Gorman, P., Harris, W., Liebmann, R., Barnes, D., Hanby, A., and Sheer, D. 1999. Comparative genomic hybridization of breast tumours stratified by histological grade reveals new insights into the biological progression of breast cancer. Cancer Res 59:1433-1436.
- 37. Buerger, H., Otterbach, F., Simon, R., Schafer, K.L., Poremba, C., Diallo, R., Brinkschmidt, C., Dockhorn-Dworniczak, B., and Boecker, W. 1999. Different genetic pathways in the evolution of invasive breast cancer are associated with distinct morphological subtypes. J Pathol 189:521-526.
- 38. Cserni, G. 2002. Tumour histological grade may progress between primary and recurrent invasive mammary carcinoma. J Clin Pathol 55:293-297.
- 39. Hitchcock, A., Ellis, I.O., Robertson, J.F., Gilmour, A., Bell, J., Elston, C.W., and Blamey, R.W. 1989. An observation of DNA ploidy, histological grade, and immunoreactivity for tumour-related antigens in primary and metastatic breast carcinoma. J Pathol 159:129-134.
- 40. Buerger, H., Mommers, E.C., Littmann, R., Simon, R., Diallo, R., Poremba, C., Dockhorn-Dworniczak, B., van Diest, P.J., and Boecker, W. 2001. Ductal invasive G2 and G3 carcinomas of the breast are the end stages of at least two different lines of genetic evolution. J Pathol 194:165-170.
- 41. Bergh, J., Norberg, T., Sjogren, S., Lindgren, A., and Holmberg, L. 1995. Complete sequencing of the p53 gene provides prognostic information in breast cancer patients, particularly in relation to adjuvant systemic therapy and radiotherapy. Nat Med 1:1029-1034.
- 42. Linderholm, B.K., Lindahl, T., Holmberg, L., Klaar, S., Lennerstrand, J., Henriksson, R., and Bergh, J. 2001. The expression of vascular endothelial growth factor correlates with mutant p53 and poor prognosis in human breast cancer. Cancer Res 61:2256-2260.
- 43. Lindahl, T., Landberg, G., Ahlgren, J., Nordgren, H., Norberg, T., Klaar, S., Holmberg, L., and Bergh, J. 2004. Overexpression of cyclin E protein is associated with specific mutation types in the p53 gene and poor survival in human breast cancer. Carcinogenesis 25:375-380.
- 44. Miller, L.D., Smeds, J., George, J., Vega, V.B., Vergara, L., Ploner, A., Pawitan, Y., Hall, P., Klaar, S., Liu, E.T., et al. 2005. An expression signature for p53 status in human breast cancer predicts mutation status, transcriptional effects, and patient survival. Proc Natl Acad Sci USA.
- 45. Kuznetsov, V.A., Knott, G.D., Ivshina, A.V. 1998. Artificial immune system based on syndromes-response approach: Theory and their application to recognition of the patterns of immune response and prognosis of therapy outcome. In Proc. of IEEE Intern. Conf. on Systems, Man, and Cybernetics. San Diego, CA, USA. 3804-3809.
- 46. Mi, H., Lazareva-Ulitsky, B., Loo, R., Kejariwal, A., Vandergriff, J., Rabkin, S., Guo, N., Muruganujan, A., Doremieux, O., Campbell, M.J., et al. 2005. The PANTHER database of protein families, subfamilies, functions and pathways. Nucleic Acids Res 33:D284-288.
- 47. 1996. Randomized trial of two versus five years of adjuvant tamoxifen for postmenopausal early stage breast cancer. Swedish Breast Cancer Cooperative Group. J Natl Cancer Inst 88:1543-1549.
- Sotiriou, T., Perou, C.M., Tibshirani, R., Aas, T., Geisler, S., Johnsen, H., Hastie, T., Eisen, M.B., van de Rijn, M., Jeffrey, S.S., et al. 2001. Gene expression patterns of breast carcinomas distinguish tumour subclasses with clinical implications. Proc Natl Acad Sci U S A 98:10869-10874.
- van't Veer, L.J., Dai, H., van de Vijver, M.J., He, Y.D., Hart, A.A., Mao, M., Peterse, H.L., van der Kooy, K., Marton, M.J., Witteveen, A.T., et al. 2002. Gene expression profiling predicts clinical outcome of breast cancer. Nature 415:530-536.
- Ma, X.J., Salunga, R., Tuggle, J.T., Gaudet, J., Enright, E., McQuary, P., Payette, T., Pistone, M., Stecker, K., Zhang, B.M., et al. 2003. Gene expression profiles of human breast cancer progression. Proc Natl Acad Sci U S A 100:5974-5979.
- Miller, L.D., Smeds, J., George, J., Vega, V.B., Vergara, L., Ploner, A., Pawitan, Y., Hall, P., Klaar, S., Liu, E.T., et al. 2005. An expression signature for p53 status in human breast cancer predicts mutation status, transcriptional effects, and patient survival. Proc Natl Acad Sci U S A.
- Kuznetsov, V.A., Ivshina, A.V., Sen'ko, O.V., Kuznetsova, A.V. 1996. Syndrome approach for computer recognition of fuzzy systems and its application to immunological diagnostics and prognosis of human cancer. Math. Comput. Modeling 23:92-112.
- Kuznetsov, V.A., Knott, G.D., Ivshina, A.V. 1998. Artificial immune system based on syndromes-response approach: Theory and their application to recognition of the patterns of immune response and prognosis of therapy outcome. In Proc. of IEEE Intern. Conf. on Systems, Man, and Cybernetics. San Diego, CA, USA. 3804-3809.
- Jackson, A.M., Ivshina, A.V., Senko, O., Kuznetsova, A., Sundan, A., O'Donnell, M.A., Clinton, S., Alexandroff, A.B., Selby, P.J., James, K., Kuznetsov,V.A. 1998. Prognosis of intravesical bacillus Calmette-Guerin therapy for superficial bladder cancer by immunological urinary measurements: statistically weighted syndrome analysis. J Urol 159:1054-1063.
- Mueller, B.U. , Zeichner, S.L. , Kuznetsov, V.A., Heath-Chiozzi,M., Pizzo P.A., and Dimitrov, D.S. Individual prognoses of long-term responses to antiretroviral treatment based on virological, immunological and pharmacological parameters measured during the first week under therapy. AIDS, 13, 1998, pp. f191-f196.
- Tibshirani, R., Hastie, T., Narasimhan, B., and Chu, G. 2002. Diagnosis of multiple cancer types by shrunken centroids of gene expression. Proc Natl Acad Sci U S A 99:6567-6572.
- Haybittle JL, Blamey RW, Elston CW, Johnson J, Doyle PJ, Campbell FC, Nicholson RI, Griffiths K. et al. A prognostic index in primary breast cancer. Br J Cancer 1982; 45 (3):361-6
- Each of the applications and patents mentioned in this document, and each document cited or referenced in each of the above applications and patents, including during the prosecution of each of the applications and patents ("application cited documents") and any manufacturer's instructions or catalogues for any products cited or mentioned in each of the applications and patents and in any of the application cited documents, are hereby incorporated herein by reference. Furthermore, all documents cited in this text, and all documents cited or referenced in documents cited in this text, and any manufacturer's instructions or catalogues for any products cited or mentioned in this text, are hereby incorporated herein by reference.
- Various modifications and variations of the described methods and system of the invention will be apparent to those skilled in the art without departing from the scope and spirit of the invention. Although the invention has been described in connection with specific preferred embodiments, it should be understood that the invention as claimed should not be unduly limited to such specific embodiments and that many modifications and additions thereto may be made within the scope of the invention. Indeed, various modifications of the described modes for carrying out the invention which are obvious to those skilled in molecular biology or related fields are intended to be within the scope of the claims. Furthermore, various combinations of the features of the following dependent claims can be made with the features of the independent claims without departing from the scope of the present invention.


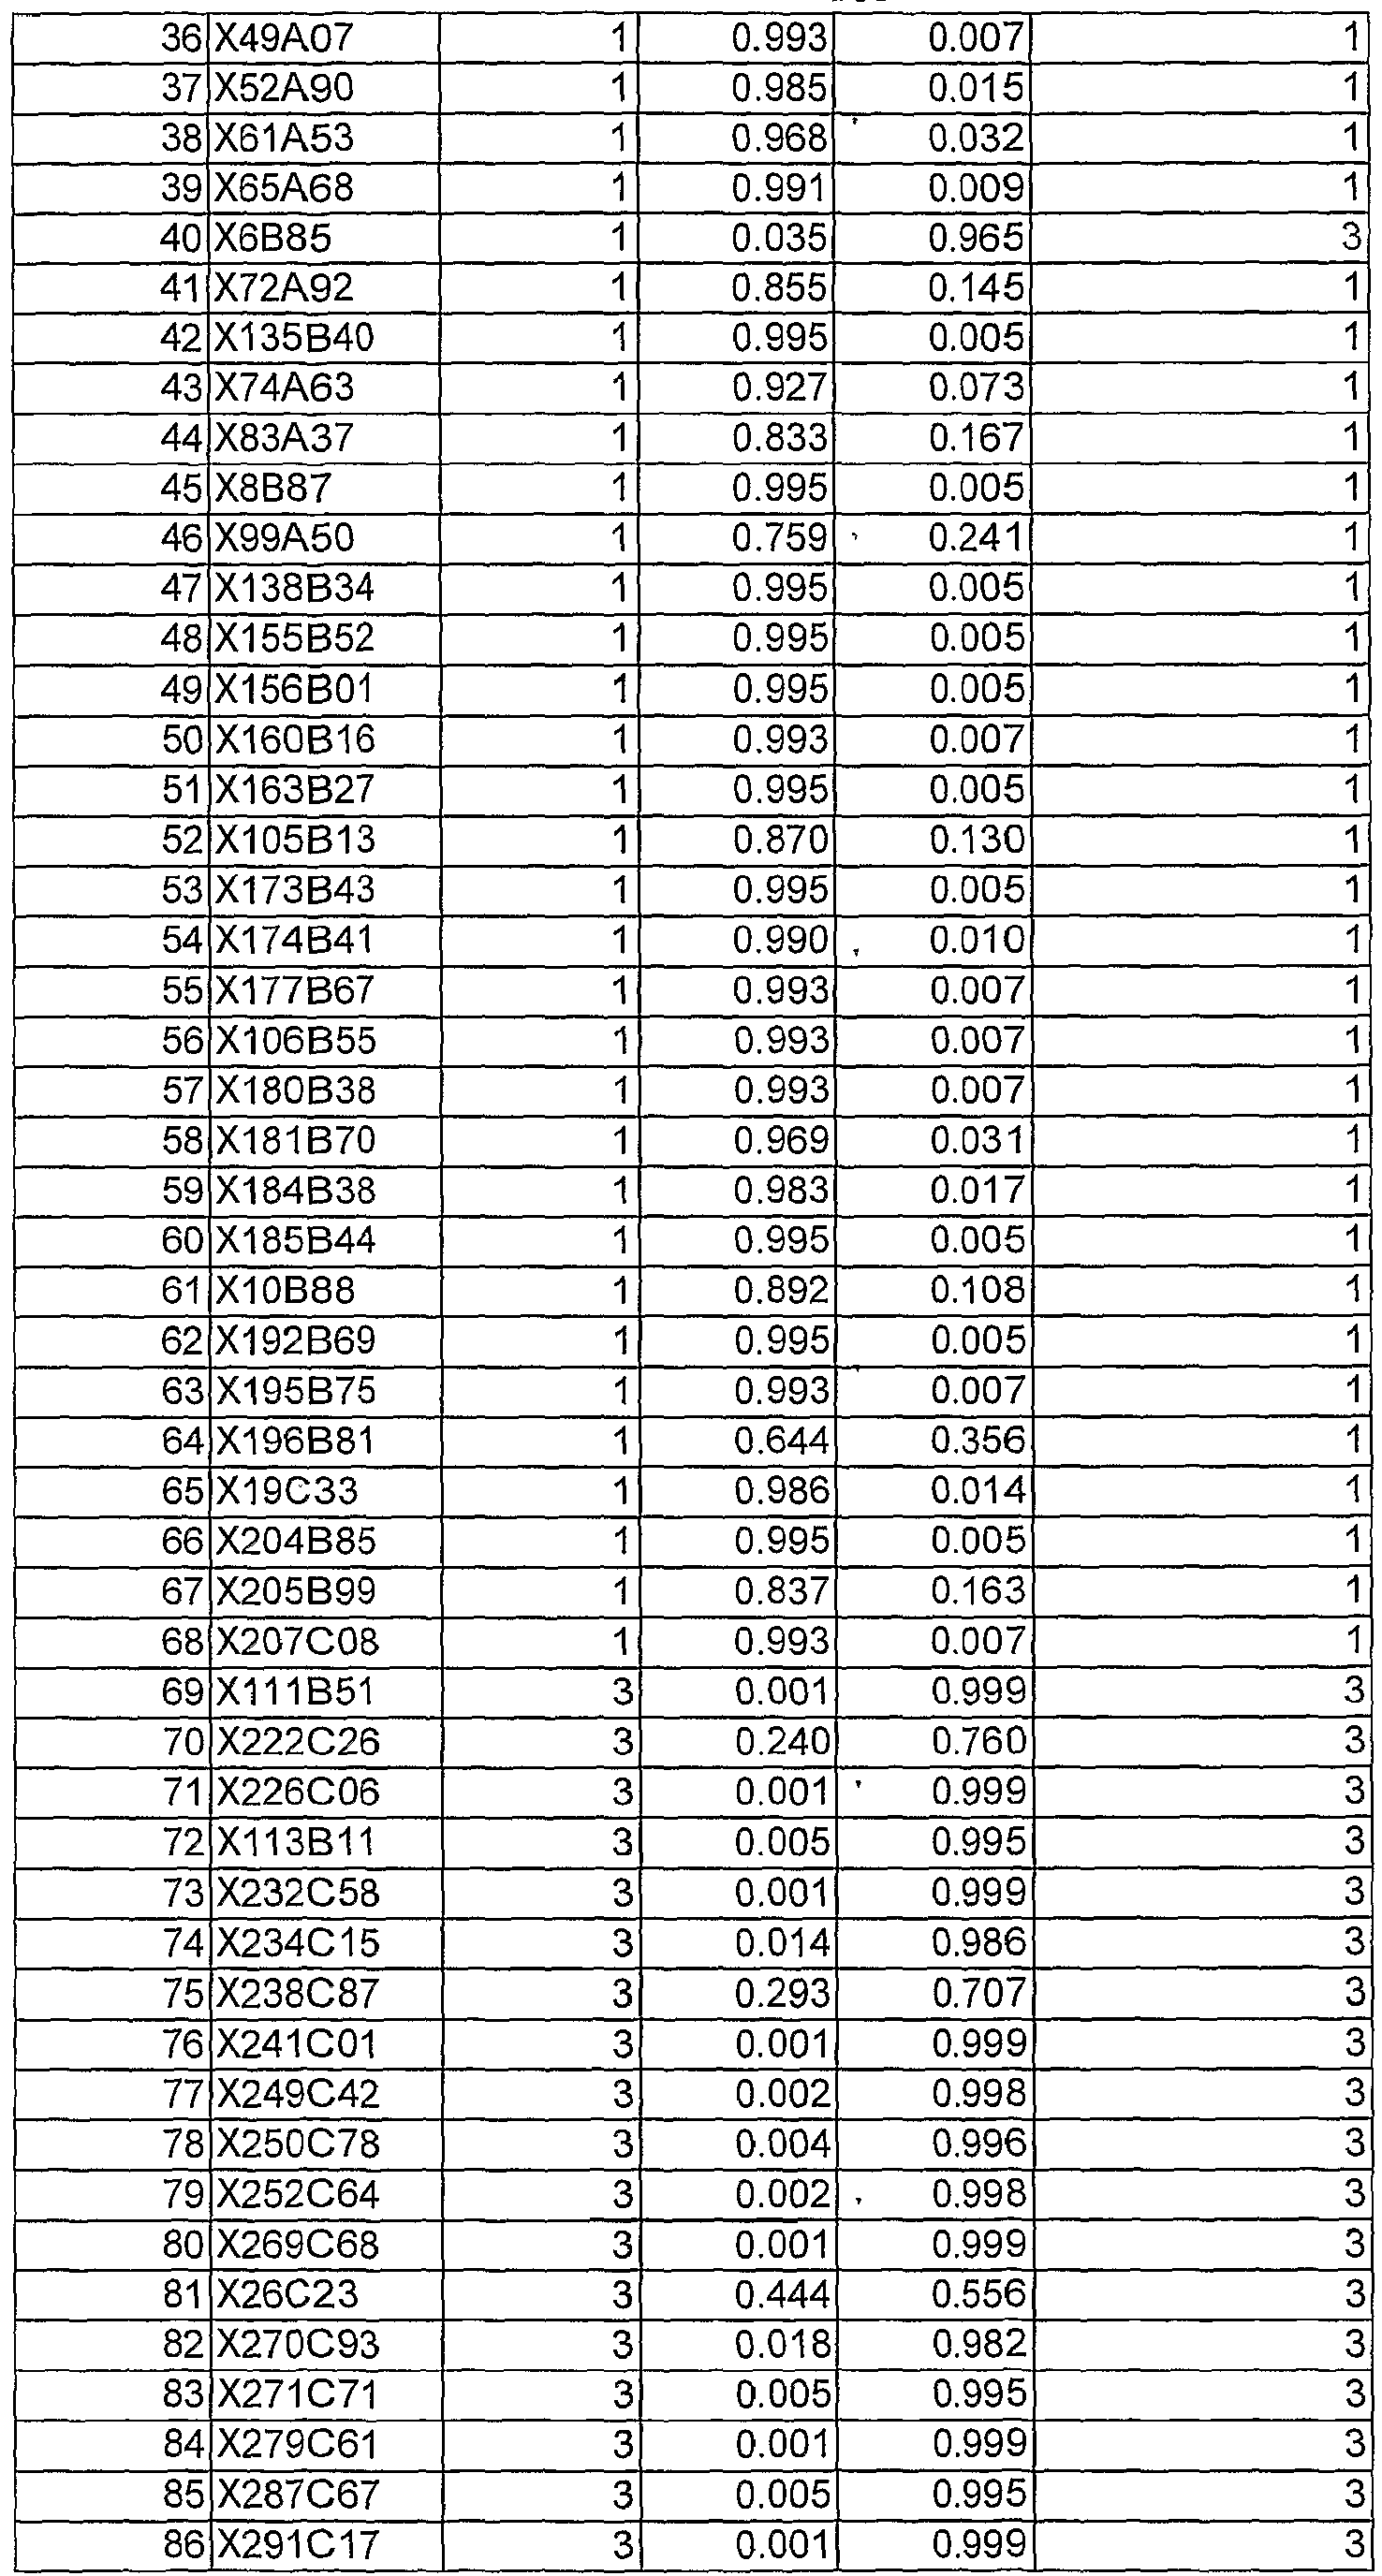


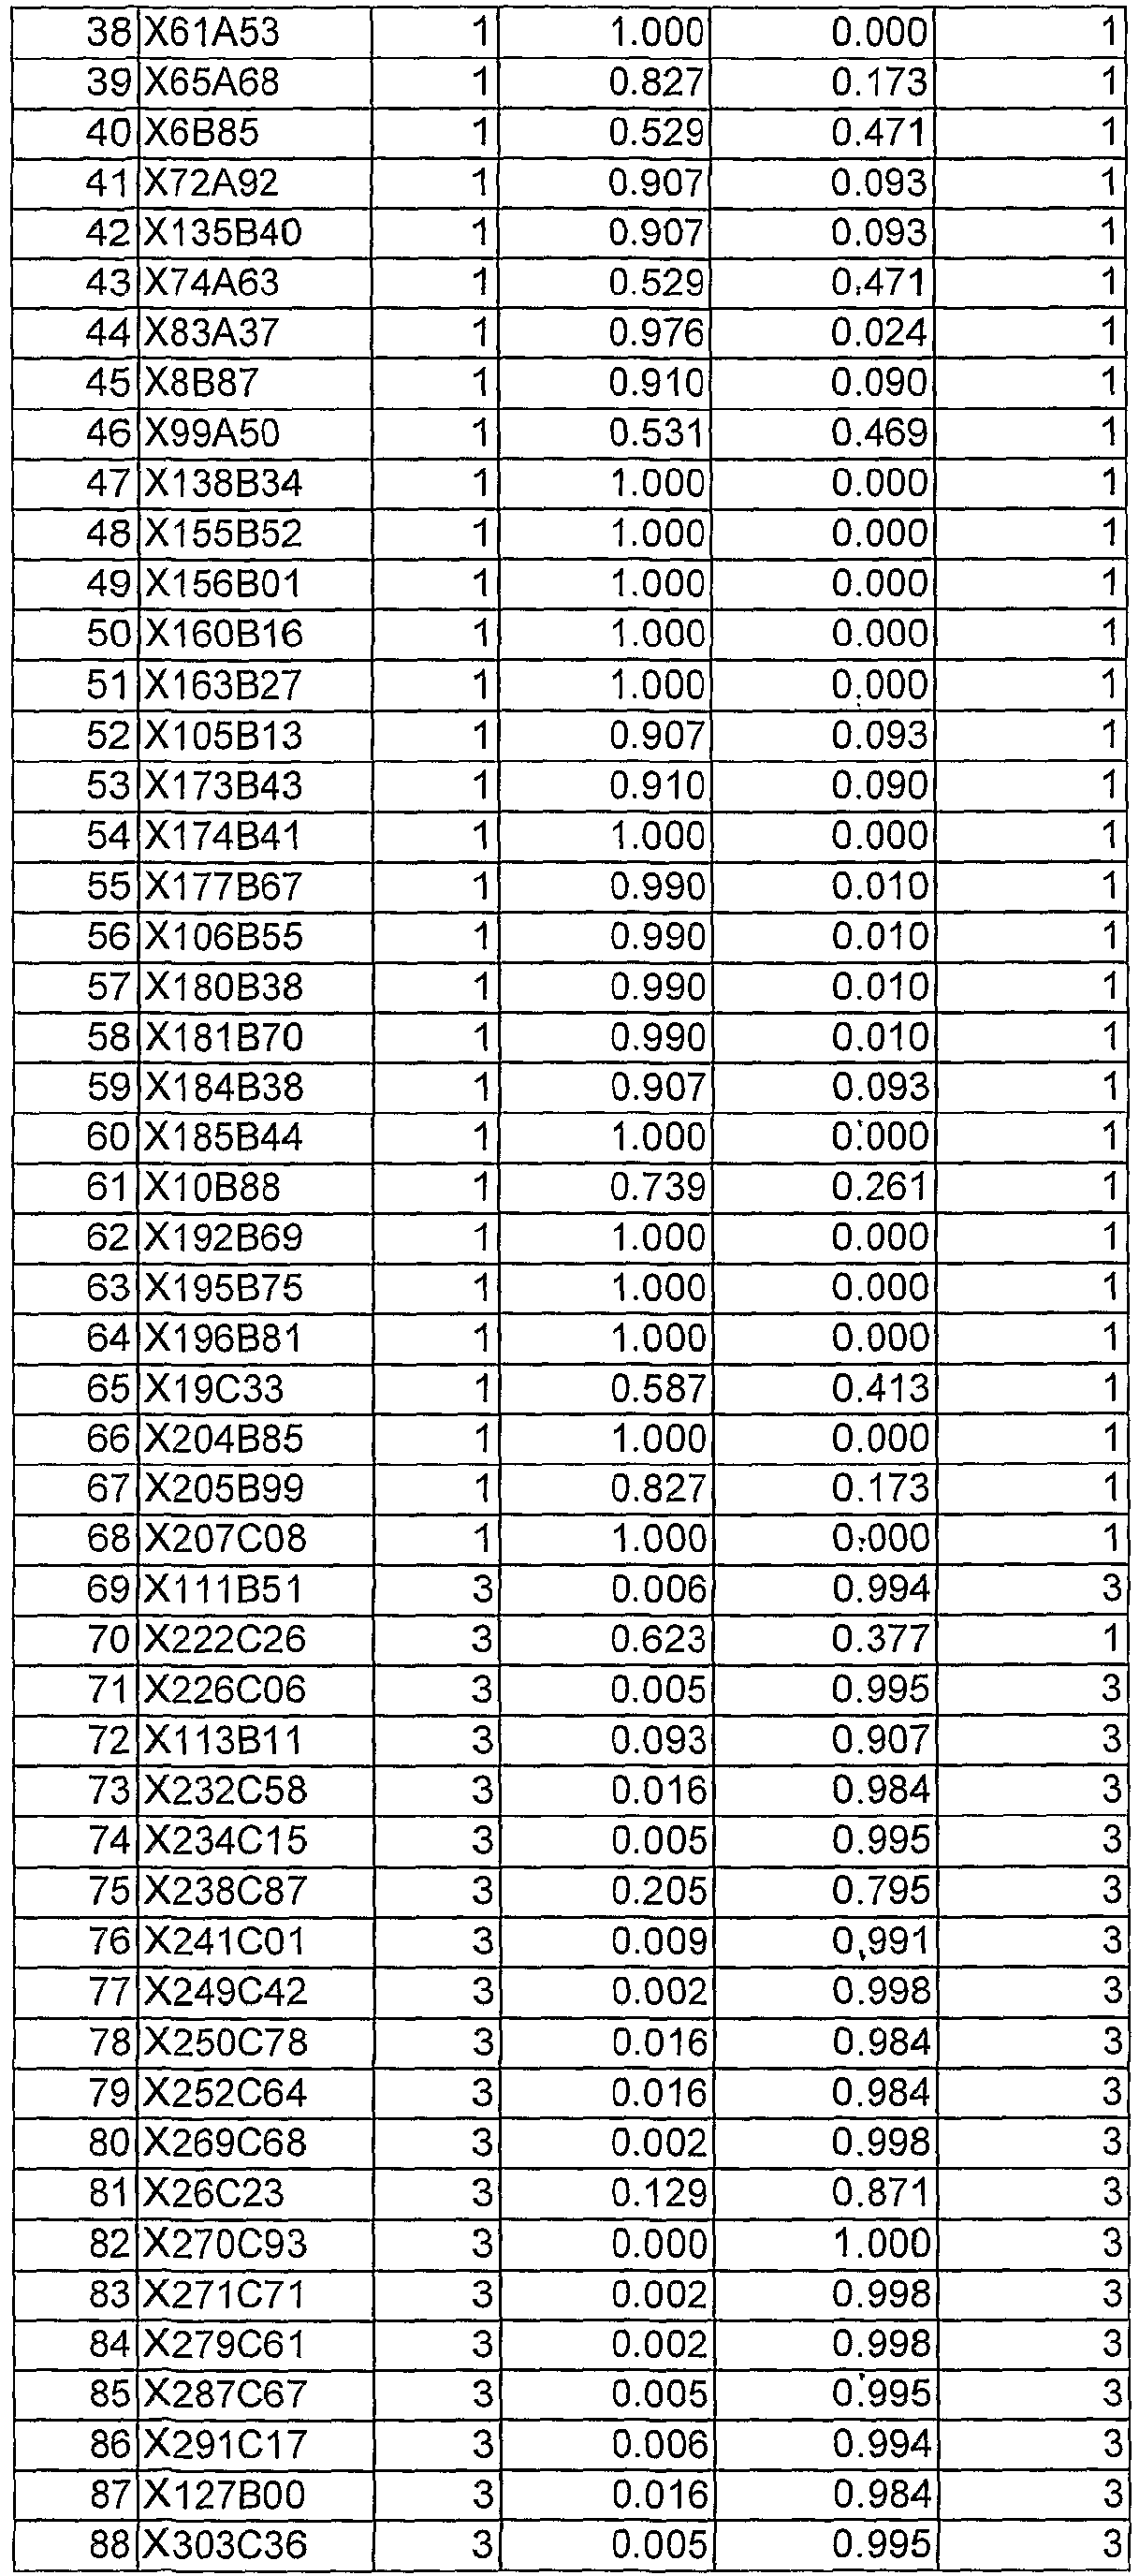
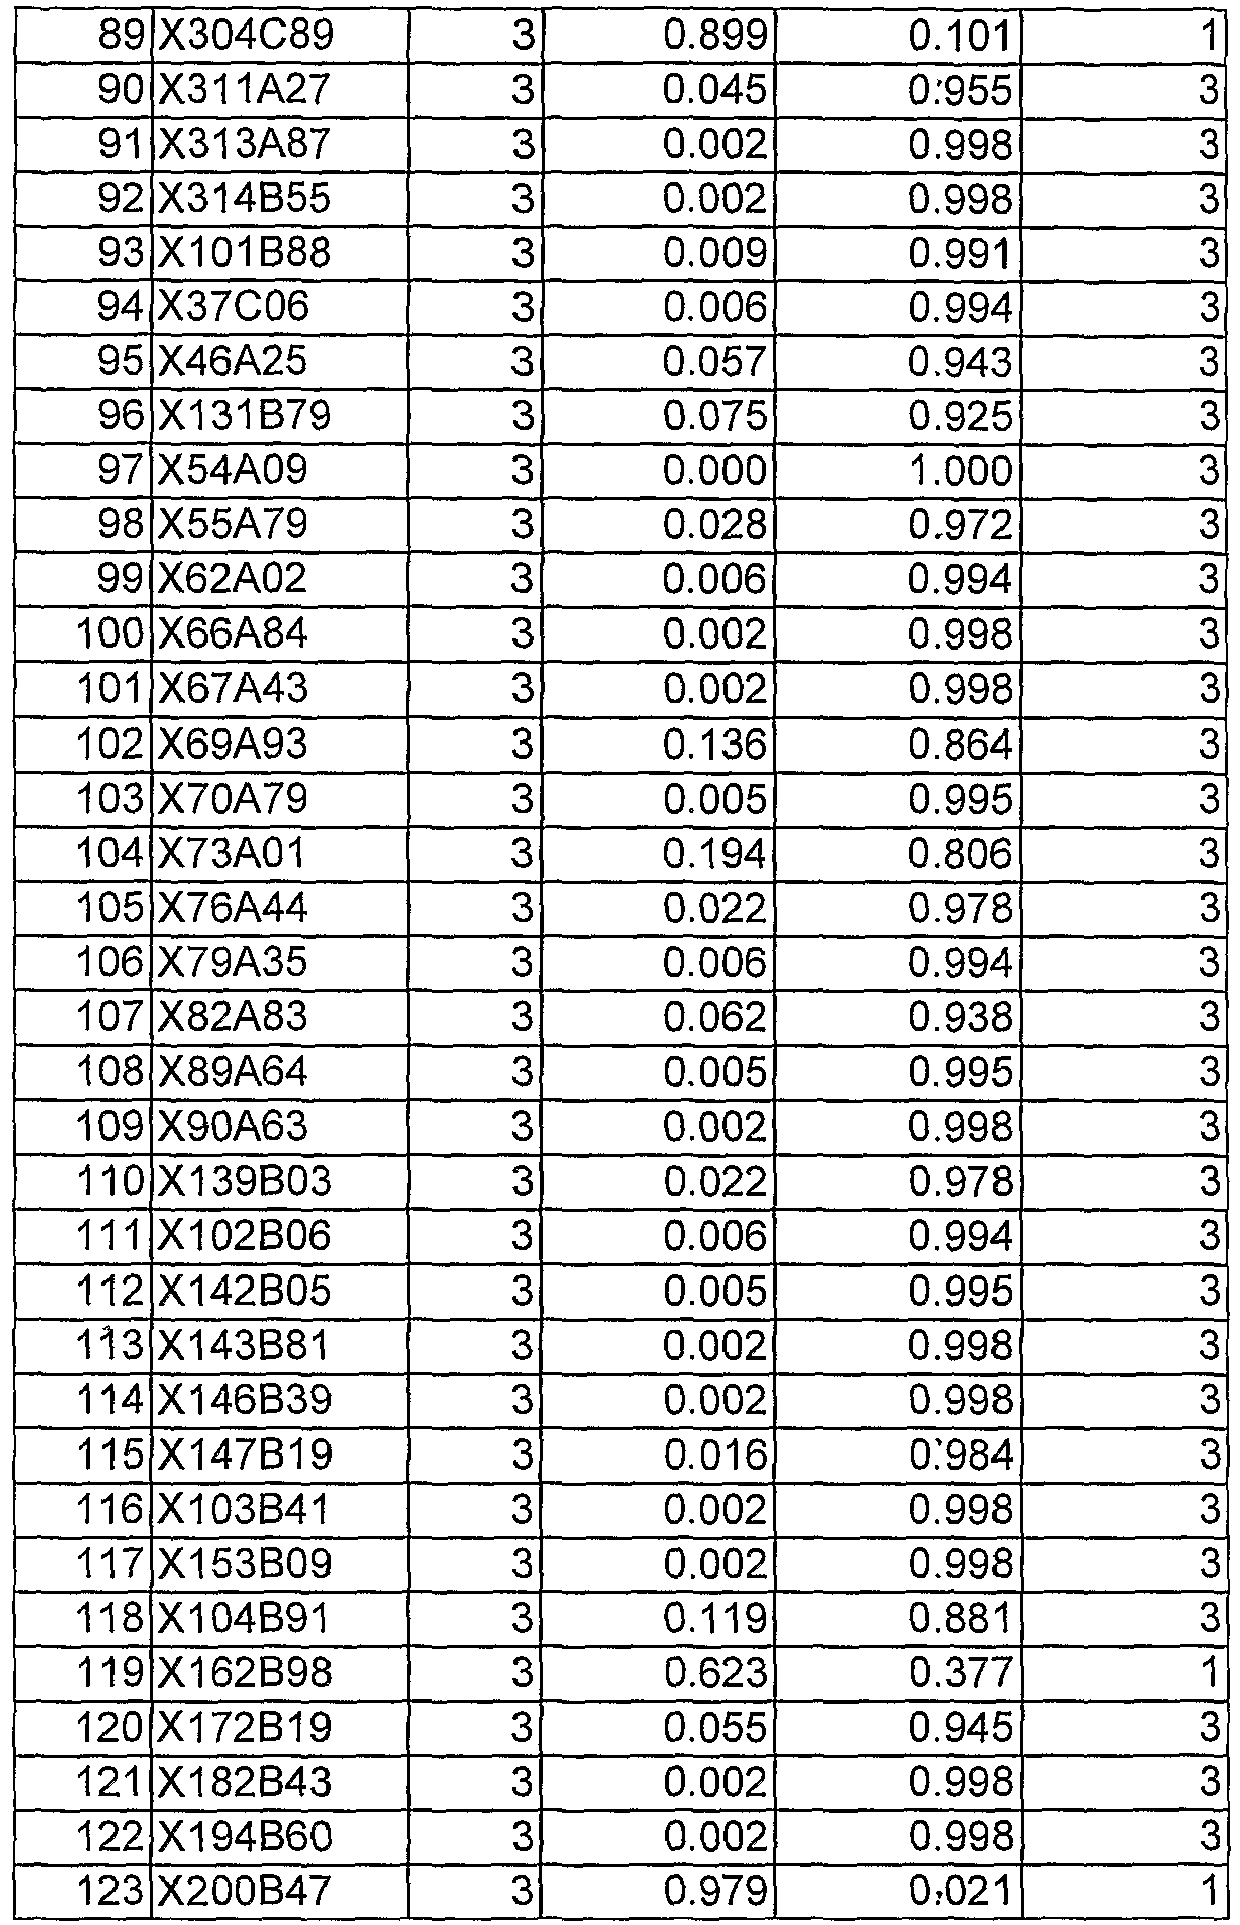
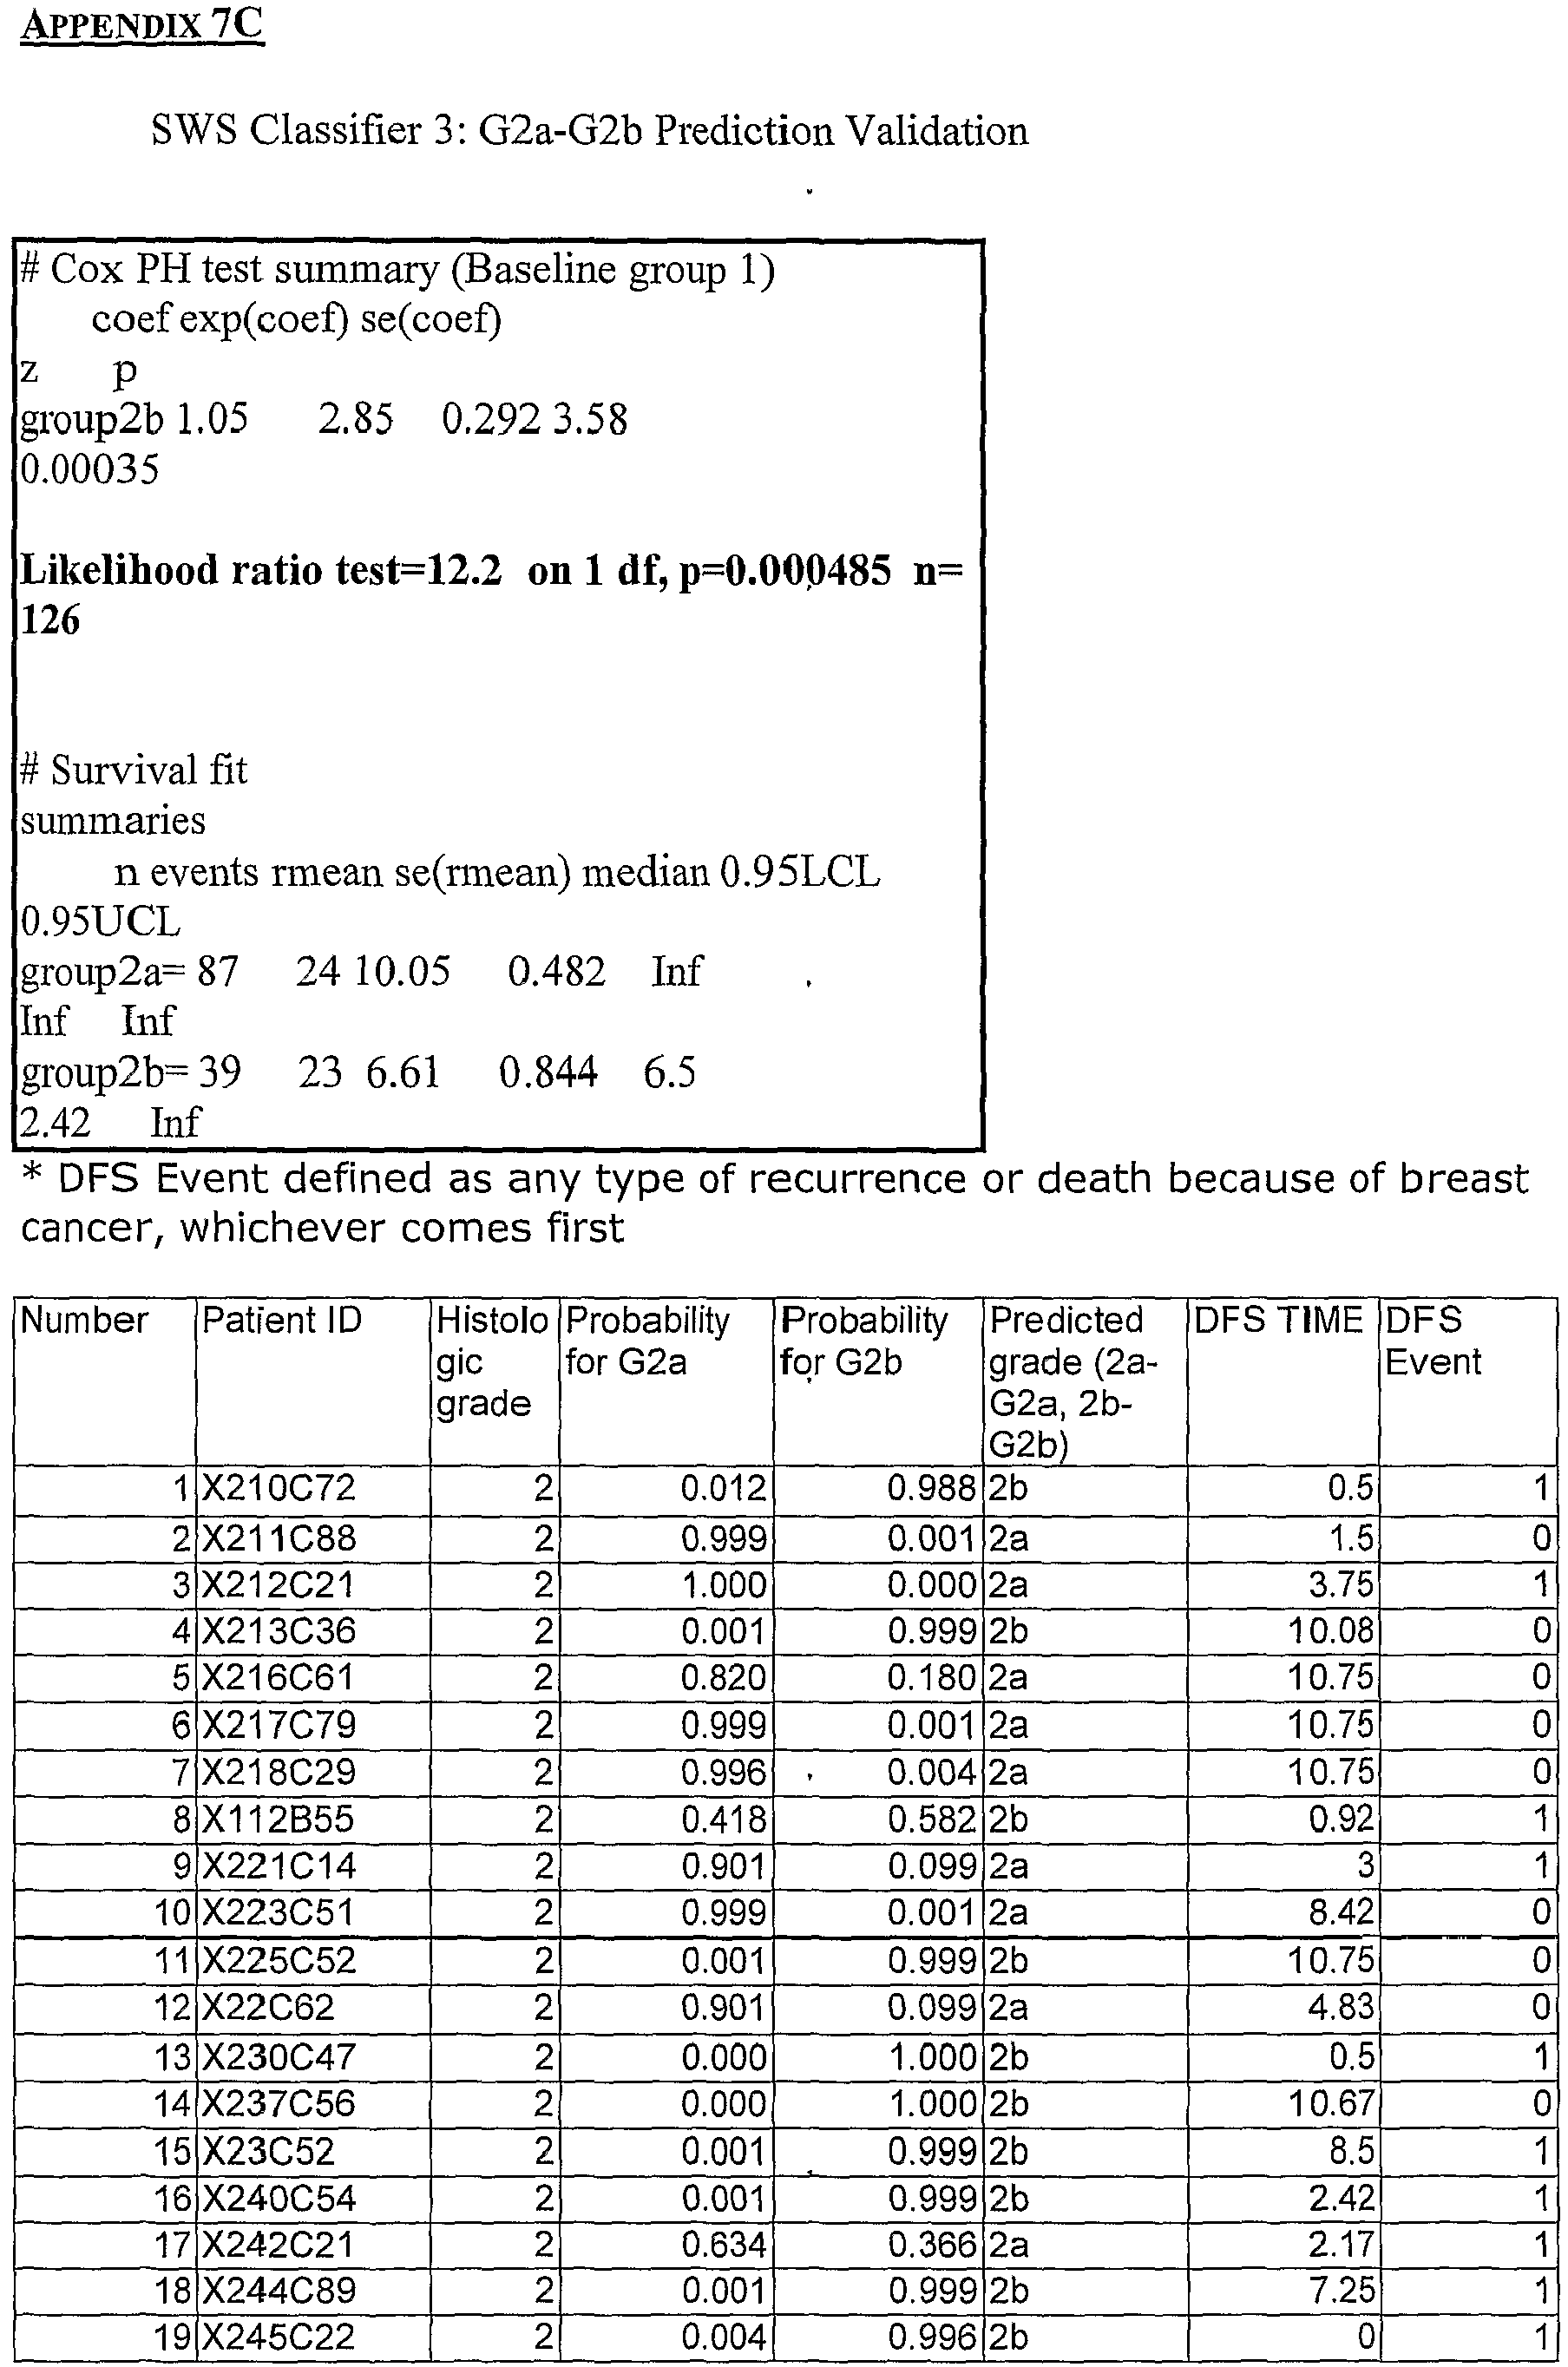


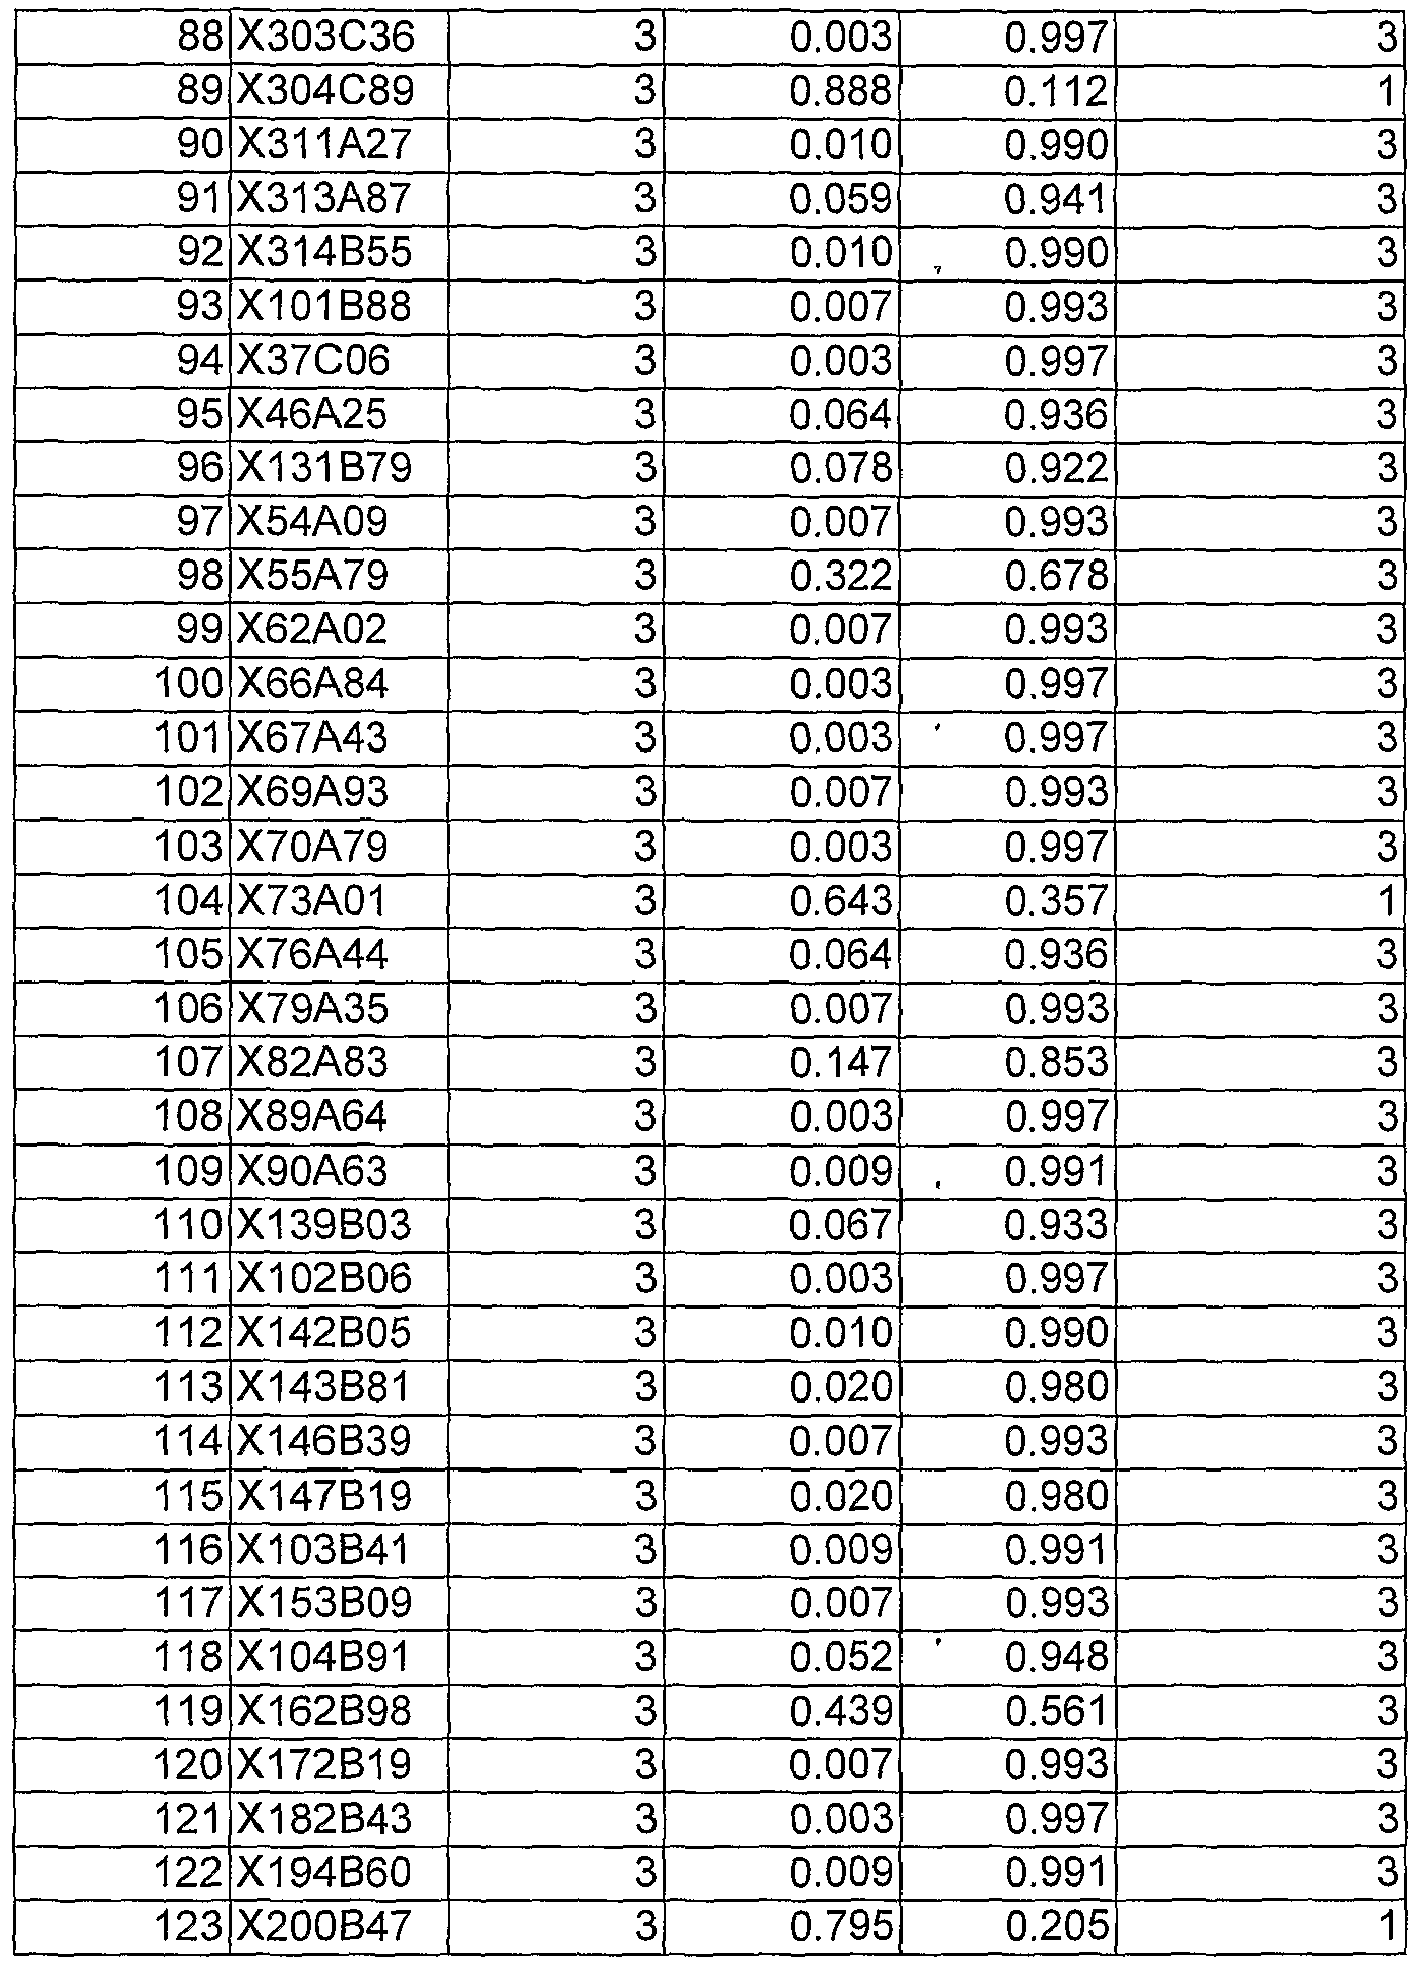


- Further aspects and embodiments of the invention are now set out in the following numbered Paragraphs; it is to be understood that the invention encompasses these aspects:
-
Paragraph 1. A method of assigning a grade to a breast tumour, which grade is indicative of the aggressiveness of the tumour, the method comprising detecting the expression of a gene selected from the genes set out in Table D1 (SWS Classifier 0). -
Paragraph 2. A method according toParagraph 1, in which the method comprises detecting a high level of expression of the gene and assigning the grade set out in Column 7 ("Grade with Higher Expression") of Table D1 to the breast tumour or detecting a low level of expression of the gene and assigning the grade set out in Column 8 ("Grade with Lower Expression") of Table D1 to the breast tumour. -
Paragraph 3. A method according toParagraph -
Paragraph 4. A method according toParagraph -
Paragraph 5. A method according to any preceding paragraph, in which the gene expression data or profile is derived from microarray hybridisation such as hybridisation to an Affymetrix microarray, or by real time polymerase chain reaction (RT-PCR). -
Paragraph 6. A method according to any preceding paragraph, in which the expression level of the gene or genes is detected using microarray analysis with a probe set consisting of a probe or probes having Affymetrix ID numbers as set out in Column 6 ("Affi ID") of Table D1. - Paragraph 7. A method according to any preceding paragraph, in which the method is capable of classifying a breast tumour to an accuracy of at least 85%, at least 90% accuracy, or at least 95% accuracy, with reference to the grade obtained of the breast tumour by histological grading.
-
Paragraph 8. A method according to any preceding paragraph, in which the expression level of 5 or more genes is detected. -
Paragraph 9. A method according toParagraph 8, in which the 5 or more genes comprises the genes set out in Table D2 (SWS Classifier 1), viz: Barren homolog (Drosophila) (BRRN1, GenBank Accession No. D38553); Hypothetical protein FLJ11029 (FLJ11029, GenBank Accession No. BG165011); cDNA clone IMAGE:4452583, partial cds (GenBank Accession No. BG492359); Serine/threonine-protein kinase 6 (STK6); and Maternal embryonic leucine zipper kinase (MELK, GenBank Accession No. NM_014791). -
Paragraph 10. Amethod according Paragraph - Paragraph 11. A method according to
Paragraph 8, in which the 5 or more genes comprises the genes set out in Table D4 (SWS Classifier 3), viz: TPX2, microtubule-associated protein homolog (Xenopus laevis) (TPX2, GenBank Accession No. AF098158), Protein regulator of cytokinesis 1 (PRC1, GenBank Accession No. NM_003981), Neuro-oncological ventral antigen 1 (NOVA1, GenBank Accession No. NMU_002515), Stanniocalcin 2 (STC2, GenBank Accession No. AI435828), Cold inducible RNA binding protein (CIRBP, GenBank Accession No. AL565767), Chemokine (C-X-C motif) ligand 14 (CXCL14, GenBank Accession No. NM_004887), Signal peptide, CUB domain, EGF-like 2 (SCUBE2, GenBank Accession No. AI424243). -
Paragraph 12. Amethod according Paragraph 8 or 11, in which the expression level of the genes is detected using microarray analysis with a probe set consisting of probes having Affymetrix ID numbers as set out in Column 6 ("Affi ID") of Table D4 (SWS Classifier 3), viz: A.210052_s_at, A.218009_s_at, A.205794_s_at, A.203438_at, B.225191_at, A.218002_s_at, A.219197_s_at. - Paragraph 13. A method according to
Paragraph 8, in which the 5 or more genes comprises the genes set out in Table D5 (SWS Classifier 4), viz: cell division cycle associated 8 (CDCA8, GenBank Accession No. BC001651), centromere protein E, 312kDa (CENPE, GenBank Accession No. NM_001813), steroid-5-alpha-reductase, alpha polypeptide 1 (3-oxo-5 alpha-steroid delta 4-dehydrogenase alpha 1) (SRD5A1, GenBank Accession No. BC006373), microtubule-associated protein tau (MAPT, GenBank Accession No. NM_016835), leucine zipper protein (FKSG14, GenBank Accession No. FKSG14), BC005400 (GenBank Accession No. R38110), EH-domain containing 2 (EHD2, GenBank Accession No. AI417917). -
Paragraph 14. Amethod according Paragraph 8 or 13, in which the expression level of the genes is detected using microarray analysis with a probe set consisting of probes having Affymetrix ID numbers as set out in Column 6 ("Affi ID") of Table D5 (SWS Classifier 4), viz: A.221520_s_at, A.205046_at, A.211056_s_at, A.203929_s_at, B.222848_at, B.240112_at, A.221870_at. -
Paragraph 15. A method according to any ofParagraphs 1 to 7, in which the expression level of 17 or more genes in Table D1 is detected. - Paragraph 16. A method according to
Paragraph 15, in which the 17 or more genes comprises the genes set out in Table D3 (SWS Classifier 2), viz: Barren homolog (Drosophila) (BRRN1, GenBank Accession No. D38553); Cell division cycle associated 8 (CDCA8, GenBank Accession No. BC001651); V-myb myeloblastosis viral oncogene homolog (avian)-like 2 (MYBL2, GenBank Accession No. NM_002466); Hypothetical protein FLJ11029 (FLJ11029, GenBank Accession No. BG165011); FBJ murine osteosarcoma viral oncogene homolog B (FOSB, GenBank Accession No. NM_006732); CDNA clone IMAGE:4452583, partial cds (GenBank Accession No. BG492359); Serine/threonine-protein kinase 6 (STK6, GenBank Accession No. BC027464); Anillin, actin binding protein (scraps homolog, Drosophila) (ANLN, GenBank Accession No. AK023208); Centromere protein E, 312kDa (CENPE, GenBank Accession No. NM_001813); TTK protein kinase (TTK, GenBank Accession No. NM_003318); Signal peptide, CUB domain, EGF-like 2 (SCUBE2, GenBank Accession No. AI424243); V-fos FBJ murine osteosarcoma viral oncogene homolog (FOS, GenBank Accession No. BC004490); TPX2, microtubule-associated protein homolog (Xenopus laevis) (TPX2, GenBank Accession No. AF098158); Kinetochore protein Spc24 (Spc24, GenBank Accession No. AI469788); Forkhead box M1 (FOXM1, GenBank Accession No. NM_021953); Maternal embryonic leucine zipper kinase (MELK, GenBank Accession No. NM_014791); Cell division cycle associated 5 (CDCA5, GenBank Accession No. BE614410); and Cell division cycle associated 3 (CDCA3, GenBank Accession No. NM_031299). - Paragraph 17. A
method according Paragraph 15 or 16, in which the expression level of the genes is detected using microarray analysis with a probe set consisting of probes having Affymetrix ID numbers as set out in Column 6 ("Affi ID") of Table D3, viz: A.212949_at; A.221520_s_at; A.201710_at; B.228273_at; A.202768_at; B.226936_at; A.208079_s_at; B.222608_s_at; A.205046_at; A.204822_at; A.219197_s_at; A.209189_at; A.210052_s_at; B.235572_at; A.202580_x_at; A.204825_at; B.224753_at; and A.221436_s_at. -
Paragraph 18. A method according to any ofParagraphs 8 to 17, in which the method comprises detecting a high level of expression of the gene, and assigning the grade set out in Column 7 ("Grade with Higher Expression") of Table D2 (SWS Classifier 1), Table D3 (SWS Classifier 2), Table D4 (SWS Classifier 3) or Table D5 (SWS Classifier 4) to the breast tumour. -
Paragraph 19. A method according to any ofParagraphs 8 to 17, in which the method comprises detecting a low level of expression of the gene, and assigning the grade set out in Column 8 ("Grade with Lower Expression") of Table D2 (SWS Classifier 1), Table D3 (SWS Classifier 2), Table D4 (SWS Classifier 3) or Table D5 (SWS Classifier 4) to the breast tumour. -
Paragraph 20. A method according to any ofParagraphs 8 to 18, in which a high level of expression is detected if the expression level of the gene is above the expression level set out in Column 9 ("Cut-Off") of Table D2 (SWS Classifier 1), Table D3 (SWS Classifier 2), Table D4 (SWS Classifier 3) or Table D5 (SWS Classifier 4), and a low level of expression is detected if the expression level of the gene is below that level. -
Paragraph 21. A method according to any preceding paragraph, in which the expression level of all of the genes in Table D1 is detected. - Paragraph 22. A method according to any preceding paragraph, in which the grade is assigned by applying a class prediction algorithm comprising a nearest shrunken centroid method (Tibshirani, et al., 2002, Proc Natl Acad Sci USA. 99(10): 6567-6572) to the expression data of the plurality of genes.
- Paragraph 23. A method according to Paragraph 22, in which the class prediction algorithm comprises Prediction Analysis of Microarrays (PAM).
- Paragraph 24. A method according to any preceding paragraph, in which the grade is assigned by applying a class prediction algorithm comprising the steps of: (a) obtaining a set of predictor parameters; (b) re-coding the parameters to obtain discrete-valued variables; (c) selecting statistically robust discrete-valued variables and combinations thereof; (d) obtaining a sum of the statistically weighted discrete-valued variables and combinations thereof; and (e) obtaining a predictive outcome of breast cancer subtype based on the sum.
-
Paragraph 25. A method according to any preceding paragraph, in which the grade is assigned by applying a class prediction algorithm comprising Statistically Weighted Syndromes (SWS) to the gene expression data. - Paragraph 26. A method according to any preceding paragraph, in which the breast tumour comprises a
histological Grade 2 breast tumour. -
Paragraph 27. A method of classifying ahistological Grade 2 tumour into a low aggressiveness tumour or a high aggressiveness tumour, the method comprising assigning a grade to thehistological Grade 2 tumour according to any preceding paragraph. -
Paragraph 28. A method according toParagraph 27, in which ahistological Grade 2 breast tumour assigned a low aggressiveness grade has at least one feature of ahistological Grade 1 breast tumour. - Paragraph 29. A method according to
Paragraph 27, in which a breast tumour assigned a high aggressiveness grade has at least one feature of ahistological Grade 3 breast tumour. -
Paragraph 30. A method according toParagraph 28 or 29, in which the feature comprises likelihood of tumour recurrence post-surgery or survival rate, such as disease free survival rate. - Paragraph 31. A method according to
Paragraph 28 or 29, in which the feature comprises susceptibility to treatment. - Paragraph 32. A method according to any preceding paragraph, in which the method is capable of classifying
histological Grade 1 andhistological Grade 3 tumours with an accuracy of 70% or above, 80% or above, or 90% or above. - Paragraph 33. A method of predicting a survival rate for an individual with a
histological Grade 2 breast tumour, the method comprising assigning a grade to the breast tumour by a method according to any preceding paragraph. - Paragraph 34. A method according to Paragraph 33, in which a low aggressiveness grade indicates a high probability of survival and a high aggressiveness grade indicates a low probability of survival.
-
Paragraph 35. A method of prognosis of an individual with a breast tumour, the method comprising assigning a grade to the breast tumour by a method according to any ofParagraphs 1 to 32. - Paragraph 36. A method of diagnosis of aggressive breast cancer in an individual, the method comprising assigning a grade indicative of high aggressiveness to a breast tumour of the individual by a method according to
Paragraphs 1 to 32. - Paragraph 37. A method of choosing a therapy for an individual with breast cancer, the method comprising assigning a grade to the breast tumour by a method according to any of
Paragraphs 1 to 32, and choosing an appropriate therapy based on the aggressiveness of the breast tumour. -
Paragraph 38. A method of treatment of an individual with breast cancer, the method comprising assigning a grade to the breast tumour by a method according to any ofParagraphs 1 to 32, and administering an appropriate therapy to the individual based on the aggressiveness of the breast tumour. - Paragraph 39. A method according to
Paragraph 36, 37 or 38, in which the diagnosis or choice of therapy is determined by further assessing the size of the tumour, or the lymph node stage or both, optionally together or in combination with other risk factors. -
Paragraph 40. A method according to any of Paragraphs 36 to 39, in which the choice of therapy is determined by assessing the Nottingham Prognostic Index (Haybittle, et al., 1982). -
Paragraph 41. A method according to any of Paragraphs 36 to 40, in which the choice of therapy is determined by further assessing the oestrogen receptor (ER) status of the breast tumour. - Paragraph 42. A method according to any preceding paragraph, in which the histological grading comprises the Nottingham Grading System (NGS) or the Elston-Ellis Modified Scarff, Bloom, Richardson Grading System.
-
Paragraph 43. A method of determining the likelihood of success of a particular therapy on an individual with a breast tumour, the method comprising comparing the therapy with the therapy determined by a method according to Paragraph 37. - Paragraph 44. A method of assigning a breast tumour patient into a prognostic group, the method comprising applying the Nottingham Prognostic Index to a breast tumour, in which the histologic grade score of the breast tumour is replaced by a grade obtained by a method according to any of
Paragraphs 2 to 32. -
Paragraph 45. A method of assigning a breast tumour patient into a prognostic group, the method comprising deriving a score which is the sum of the following: (a) (0.2 x tumour size in cm); (b) tumour grade in which the tumour grade is assigned by a method according to any ofParagraphs 2 to 32; and (c) lymph node stage; in which the tumour size and the lymph node stage are determined according to the Nottingham Prognostic Index, in which a patient with a score of 2.4 or less is categorised to a EPG (excellent prognostic group), a patient with a score of less than 3.4 is categorised to a GPG (good prognostic group), a patient with a score of between 3.4 and 5.4 is categorised to a MPG (moderate prognostic group), a patient with a score of greater than 5.4 is categorised to a PPG (poor prognostic group). - Paragraph 46. A method of determining whether a breast tumour is a metastatic breast tumour, the method comprising assigning a grade to the breast tumour by a method according to any of
Paragraphs 1 to 32. - Paragraph 47. A method of identifying a molecule capable of treating or preventing breast cancer, the method comprising: (a) grading a breast tumour; (b) exposing the breast tumour to a candidate molecule; and (c) detecting a change in tumour grade; in which the grade or change thereof, or both, is assigned by a method according to any of
Paragraphs 1 to 32. -
Paragraph 48. A molecule identified by a method according to Paragraph 47. - Paragraph 49. Use of a molecule according to
Paragraph 48 in a method of treatment or prevention of cancer in an individual. -
Paragraph 50. A method of treatment or prevention of breast cancer in an individual, the method comprising modulating the expression of a gene set out in Table D1 (SWS Classifier 0). - Paragraph 51. A method of determining the proliferative state of a cell, the method comprising detecting the expression of a gene selected from the genes set out in Table D1 (SWS Classifier 0), in which: (a) a high level of expression of a gene which is annotated "3" in Column 7 ("Grade with Higher Expression") indicates a highly proliferative cell; (b) a high level of expression of a gene which is annotated "1" in Column 7 ("Grade with Higher Expression") indicates a non-proliferating cell or a slow-growing cell; (c) a low level of expression of a gene which is annotated "3" in Column 8 ("Grade with Lower Expression") indicates a highly proliferative cell; and (d) a low level of expression of a gene which is annotated "1" in Column 8 ("Grade with Lower Expression") indicates a non-proliferating cell or a slow-growing cell.
- Paragraph 52. A method according to Paragraph 51, which comprises the features of any of
Paragraphs 5 to 32. - Paragraph 53. A combination comprising the genes set out in Table D1 (SWS Classifier 0).
- Paragraph 54. A combination comprising the probesets set out in Table D1 (SWS Classifier 0).
- Paragraph 55. A combination comprising the genes set out in
Paragraph 9, 11, 13 or 16. - Paragraph 56. A combination comprising the probesets set out in
Paragraph - Paragraph 57. A combination according to any of Paragraphs 53, 54, 55 or 56 in the form of an array.
- Paragraph 58. A combination according to any of Paragraphs 53, 54, 55 or 56 in the form of a microarray.
- Paragraph 59. A kit comprising a combination, array or microarray according to any of Paragraphs 53 to 58, together with instructions for use in a method according to any of
Paragraphs 1 to 47 and 50 to 52. -
Paragraph 60. Use of a combination, array or a microarray according to any of Paragraphs 53 to 58 or a kit according to Paragraph 59 in a method according to any ofParagraphs 1 to 47 and 50 to 52. - Paragraph 61. Use according to
Paragraph 60, in which the method comprises a method of assigning a grade to a breast tumour according to any ofParagraphs 1 to 32. - Paragraph 62. A computer implemented method of assigning a grade to a breast tumour, the method comprising processing expression data for one or more genes set out in Table D1 (SWS Classifier 0) and obtaining a grade indicative of aggressiveness of the breast tumour.
- Paragraph 63. A program storage device readable by a machine, tangibly embodying a program of instructions executable by the machine to perform method of assigning a grade to a breast tumour, the method comprising: processing expression data for one or more genes set out in Table D1 (SWS Classifier 0); and obtaining a grade indicative of aggressiveness of the breast tumour.
Claims (13)
- An in vitro method of assigning a grade to a breast tumour corresponding to histological Grade 1 or Grade 3, which grade is indicative of the aggressiveness of the tumour, the method comprising detecting the expression of (a) BRRN1, GenBank Accession Number D38553; (b) MELK, GenBank Accession Number NM_014791; (c) cDNA clone IMAGE 4452583, GenBank Accession Number BG492359; or (d) STK6, GenBank Accession Number NM_003158 or NM_003600.
- An in vitro method according to Claim 1, in which the method comprises detecting a high level of expression of the gene, preferably above (a) 5.9167 for BRRN1, GenBank Accession Number D38553; (b) 7.1073 for MELK, GenBank Accession Number NM_014791; (c) 7.5619 for cDNA clone IMAGE 4452583, GenBank Accession Number BG492359; or (d) 6.7266 for STK6, GenBank Accession Number NM_003158 or NM_003600, and assigning the survival chances associated with histological Grade 3 to the breast tumour or detecting a low level of expression of the gene, preferably below (a) 5.9167 for BRRN1, GenBank Accession Number D38553; (b) 7.1073 for MELK, GenBank Accession Number NM_014791; (c) 7.5619 for cDNA clone IMAGE 4452583, GenBank Accession Number BG492359; or (d) 6.7266 for STK6, GenBank Accession Number NM_003158 or NM_003600, and assigning the survival chances associated with histological Grade 1 to the breast tumour, in which the level of gene expression is measured as the natural log transform norrmalised signal intensity measurement for Affymetrix arrays, preferably, global mean normalisation with scaling factor of 500, and in which the breast tumour is preferably a histological Grade 2 breast tumour.
- An in vitro method according to Claim 1 or 2, in which the expression of a plurality of genes is detected, preferably all the genes set out in Table D1 (SWS Classifier 0), preferably in the form of an expression profile of the plurality of genes, in which the expression profile is preferably derived from microarray hybridisation, preferably hybridisation to an Affymetrix microarray preferably comprising a probe set consisting of a probe or probes having Affymetrix ID numbers as set out in Column 6 ("Affi ID") of Table D1, or by real time polymerase chain reaction (RT-PCR).
- An in vitro method according to Claim 1, 2 or 3, in which the expression level of 5 or more genes is detected, in which the 5 or more genes preferably comprises the genes set out in Table D2 (SWS Classifier 1), or in which the expression level of the genes is preferably detected using microarray analysis with a probe set consisting of probes having Affymetrix ID numbers as set out in Column 6 ("Affi ID") of Table D2 (SWS Classifier 1).
- An in vitro method according to Claim 4, in which the method comprises:(a) detecting a high level of expression of the gene if the expression level of the gene is above the expression level set out in Column 9 ("Cut-Off") of Table D2 (SWS Classifier 1) and assigning the grade set out in Column 7 ("Grade with Higher Expression") of Table D2 (SWS Classifier 1) to the breast tumour; or(b) detecting a low level of expression of the gene if the expression level of the gene is below the expression level set out in Column 9 ("Cut-Off") of Table D2 (SWS Classifier 1) and assigning the grade set out in Column 8 ("Grade with Lower Expression") of Table D2 (SWS Classifier 1) to the breast tumour;in which the level of gene expression is measured as the natural log transform norrmalised signal intensity measurement for Affymetrix arrays, preferably, global mean normalisation with scaling factor of 500.
- An in vitro method according to any preceding claim, in which the expression level of 17 or more genes in Table D1 or all the genes in Table D1 is detected, in which the genes preferably comprise the genes set out in Table D3 (SWS Classifier 2), or in which the expression level of the genes is preferably detected using microarray analysis with a probe set consisting of probes having Affymetrix ID numbers as set out in Column 6 ("Affi ID") of Table D3.
- An in vitro method according to Claim 6, in which the method comprises:(a) detecting a high level of expression of the gene if the expression level of the gene is above the expression level set out in Column 9 ("Cut-Off") of Table D3 (SWS Classifier 2) and assigning the grade set out in Column 7 ("Grade with Higher Expression") of Table D3 (SWS Classifier 2) to the breast tumour; or(b) detecting a low level of expression of the gene if the expression level of the gene is below the expression level set out in Column 9 ("Cut-Off") of Table D3 (SWS Classifier 2), and assigning the grade set out in Column 8 ("Grade with Lower Expression") of Table D3 (SWS Classifier 2) to the breast tumour;in which the level of gene expression is measured as the natural log transform norrmalised signal intensity measurement for Affymetrix arrays, preferably, global mean normalisation with scaling factor of 500.
- An in vitro method according to any of Claims 3 to 7, in which the grade is assigned by applying:(a) a class prediction algorithm comprising a nearest shrunken centroid method to the expression data of the plurality of genes;(b) a class prediction algorithm comprising Prediction Analysis of Microarrays (PAM) to the expression data of the plurality of genes;(c) a class prediction algorithm comprising the steps of:(i) obtaining a set of predictor parameters;(ii) re-coding the parameters to obtain discrete-valued variables;(iii) selecting statistically robust discrete-valued variables and combinations thereof;(iv) obtaining a sum of the statistically weighted discrete-valued variables and combinations thereof; and(v) obtaining a predictive outcome of breast cancer subtype based on the sum; or(c) a class prediction algorithm comprising Statistically Weighted Syndromes (SWS) to the gene expression data.
- An in vitro method of classifying a histological Grade 2 breast tumour into a low aggressiveness tumour or a high aggressiveness tumour, the method comprising assigning the grade to the histological Grade 2 breast tumour corresponding to histological Grade 1 or Grade 3 according to any preceding claim, in which the histological Grade 2 breast tumour that is assigned the low aggressiveness grade has preferably at least one feature of a histological Grade 1 breast tumour, and/or in which the breast tumour that is assigned the high aggressiveness grade has preferably at least one feature of a histological Grade 3 breast tumour, preferably in which the feature comprises any one or more of: (a) likelihood of tumour recurrence post-surgery or survival rate, preferably disease free survival rate; and (b) susceptibility to treatment.
- An in vitro method according to any preceding claim, in which the method is capable of classifying a breast tumour preferably a histological Grade 1 and histological Grade 3 tumour to an accuracy of at least 85%, at least 90% accuracy, or at least 95% accuracy, with reference to the grade obtained of the breast tumour by histological grading.
- An in vitro method according to any preceding claim, in which the histological grading comprises the Nottingham Grading System (NGS) or the Elston-Ellis Modified Scarff, Bloom, Richardson Grading System.
- A computer implemented in vitro method of assigning a grade indicative of aggressiveness to a breast tumour, the method comprising processing expression data for (a) BRRN1, GenBank Accession Number D38553; (b) MELK, GenBank Accession Number NM_014791; (c) cDNA clone IMAGE 4452583, GenBank Accession Number BG492359; or (d) STK6, GenBank Accession Number NM_003158 or NM_003600, detecting a high level of expression of the gene, preferably above (a) 5.9167 for BRRN1, GenBank Accession Number D38553; (b) 7.1073 for MELK, GenBank Accession Number NM_014791; (c) 7.5619 for cDNA clone IMAGE 4452583, GenBank Accession Number BG492359; or (d) 6.7266 for STK6, GenBank Accession Number NM_003158 or NM_003600, and assigning the survival chances associated with histological Grade 3 to the breast tumour or detecting a low level of expression of the gene, preferably below (a) 5.9167 for BRRN1, GenBank Accession Number D38553; (b) 7.1073 for MELK, GenBank Accession Number NM_014791; (c) 7.5619 for cDNA clone IMAGE 4452583, GenBank Accession Number BG492359; or (d) 6.7266 for STK6, GenBank Accession Number NM_003158 or NM_003600, and assigning the survival chances associated with histological Grade 1 to the breast tumour, in which the level of gene expression is measured as the natural log transform norrmalised signal intensity measurement for Affymetrix arrays, preferably, global mean normalisation with scaling factor of 500.
- A program storage device readable by a machine, tangibly embodying a program of instructions executable by the machine to perform method of assigning a grade indicative of aggressiveness to a breast tumour, the method comprising: processing expression data for (a) BRRN1, GenBank Accession Number D38553; (b) MELK, GenBank Accession Number NM_014791; (c) cDNA clone IMAGE 4452583, GenBank Accession Number BG492359; or (d) STK6, GenBank Accession Number NM_003158 or NM_003600; and obtaining a grade indicative of aggressiveness of the breast tumour, detecting a high level of expression of the gene, preferably above (a) 5.9167 for BRRN1, GenBank Accession Number D38553; (b) 7.1073 for MELK, GenBank Accession Number NM_014791; (c) 7.5619 for cDNA clone IMAGE 4452583, GenBank Accession Number BG492359; or (d) 6.7266 for STK6, GenBank Accession Number NM_003158 or NM_003600, and assigning the survival chances associated with histological Grade 3 to the breast tumour or detecting a low level of expression of the gene, preferably below (a) 5.9167 for BRRN1, GenBank Accession Number D38553; (b) 7.1073 for MELK, GenBank Accession Number NM_014791; (c) 7.5619 for cDNA clone IMAGE 4452583, GenBank Accession Number BG492359; or (d) 6.7266 for STK6, GenBank Accession Number NM_003158 or NM_003600, and assigning the survival chances associated with histological Grade 1 to the breast tumour, in which the level of gene expression is measured as the natural log transform norrmalised signal intensity measurement for Affymetrix arrays, preferably, global mean normalisation with scaling factor of 500.
Applications Claiming Priority (3)
| Application Number | Priority Date | Filing Date | Title |
|---|---|---|---|
| SG200607354-8A SG142186A1 (en) | 2006-10-20 | 2006-10-20 | Breast tumour grading |
| US86251906P | 2006-10-23 | 2006-10-23 | |
| EP07835512.0A EP2082060B1 (en) | 2006-10-20 | 2007-10-19 | Breast tumour grading |
Related Parent Applications (1)
| Application Number | Title | Priority Date | Filing Date |
|---|---|---|---|
| EP07835512.0A Division EP2082060B1 (en) | 2006-10-20 | 2007-10-19 | Breast tumour grading |
Publications (1)
| Publication Number | Publication Date |
|---|---|
| EP3301192A1 true EP3301192A1 (en) | 2018-04-04 |
Family
ID=39426731
Family Applications (2)
| Application Number | Title | Priority Date | Filing Date |
|---|---|---|---|
| EP07835512.0A Not-in-force EP2082060B1 (en) | 2006-10-20 | 2007-10-19 | Breast tumour grading |
| EP17199243.1A Withdrawn EP3301192A1 (en) | 2006-10-20 | 2007-10-19 | Breast tumour grading |
Family Applications Before (1)
| Application Number | Title | Priority Date | Filing Date |
|---|---|---|---|
| EP07835512.0A Not-in-force EP2082060B1 (en) | 2006-10-20 | 2007-10-19 | Breast tumour grading |
Country Status (4)
| Country | Link |
|---|---|
| US (2) | US20110020317A1 (en) |
| EP (2) | EP2082060B1 (en) |
| SG (1) | SG142186A1 (en) |
| WO (1) | WO2008048193A2 (en) |
Families Citing this family (19)
| Publication number | Priority date | Publication date | Assignee | Title |
|---|---|---|---|---|
| SG142186A1 (en) * | 2006-10-20 | 2008-05-28 | Agency Science Tech & Res | Breast tumour grading |
| EP2161577A1 (en) * | 2008-09-01 | 2010-03-10 | Atlas Antibodies AB | ANLN protein |
| AU2009306260B2 (en) * | 2008-10-20 | 2015-12-24 | Valipharma | Methods and uses involving genetic aberrations of NAV3 and aberrant expression of multiple genes |
| GB0821787D0 (en) * | 2008-12-01 | 2009-01-07 | Univ Ulster | A genomic-based method of stratifying breast cancer patients |
| CA2753971C (en) | 2009-01-28 | 2018-10-02 | Steven Buechler | Accelerated progression relapse test |
| GB201009798D0 (en) | 2010-06-11 | 2010-07-21 | Immunovia Ab | Method,array and use thereof |
| GB201206323D0 (en) * | 2012-04-10 | 2012-05-23 | Immunovia Ab | Methods and arrays for use in the same |
| US9575115B2 (en) | 2012-10-11 | 2017-02-21 | Globalfoundries Inc. | Methodology of grading reliability and performance of chips across wafer |
| CN103923212A (en) * | 2014-03-31 | 2014-07-16 | 天津市应世博科技发展有限公司 | EHD2 antibody and application of EHD2 antibody to preparation of immunohistochemical detection reagent for breast cancer |
| CN104945506A (en) * | 2014-03-31 | 2015-09-30 | 天津市应世博科技发展有限公司 | Immunohistochemical reagent for mammary cancer diagnosis and prognosis judgment |
| CN104945496B (en) * | 2014-03-31 | 2019-05-03 | 天津市应世博科技发展有限公司 | A kind of polypeptide and its application in the preparation and purification antibody special to EHD2 |
| CN104946734A (en) * | 2014-03-31 | 2015-09-30 | 天津市应世博科技发展有限公司 | Application of gene EHD2 in preparation of breast cancer immunohistochemical diagnosis reagent |
| KR20170007181A (en) | 2015-07-10 | 2017-01-18 | 3스캔 인크. | Spatial multiplexing of histological stains |
| WO2017061953A1 (en) * | 2015-10-05 | 2017-04-13 | Agency For Science, Technology And Research | Invasive ductal carcinoma aggressiveness classification |
| US10487365B2 (en) | 2016-09-20 | 2019-11-26 | The United States Of America, As Represented By The Secretary, Department Of Health And Human Services | Methods for detecting expression of lnc-FANCI-2 in cervical cells |
| RU2659676C1 (en) * | 2017-12-13 | 2018-07-03 | Федеральное государственное автономное образовательное учреждение высшего образования "Национальный исследовательский Томский государственный университет" (ТГУ, НИ ТГУ) | Method for predicting five-year nonmetastatic survival in breast cancer patients based on the expression of the ykl-39 and ccl18 protein genes |
| RU2682879C1 (en) * | 2018-03-19 | 2019-03-22 | Федеральное государственное бюджетное научное учреждение "Томский национальный исследовательский медицинский центр" Российской академии наук ("Томский НИМЦ") | Method for predicting non-metastatic survival in patients with breast cancer on the basis of expression of somatic-stem transition genes in residual tumor after pre-operative treatment |
| CN113355418B (en) * | 2021-06-15 | 2022-11-08 | 上海长征医院 | Gene for typing osteosarcoma and evaluating prognosis of osteosarcoma and application thereof |
| CN115131628B (en) * | 2022-07-01 | 2025-09-09 | 泰安市中心医院 | Mammary gland image classification method and device based on parting auxiliary information |
Citations (8)
| Publication number | Priority date | Publication date | Assignee | Title |
|---|---|---|---|---|
| US5030015A (en) | 1986-11-19 | 1991-07-09 | Rolls-Royce Plc | Fluid bearings |
| US6168914B1 (en) | 1997-12-19 | 2001-01-02 | Glaxo Wellcome Inc. | System and method for solid-phase parallel synthesis of a combinatorial collection of compounds |
| US6664114B1 (en) | 1992-08-03 | 2003-12-16 | Sapidyne Instruments, Inc. | Solid phase assay for detection of ligands |
| US20040014094A1 (en) | 2000-10-14 | 2004-01-22 | Helen Lee | Dipstick assay |
| WO2005001138A2 (en) * | 2003-06-18 | 2005-01-06 | Arcturus Bioscience, Inc. | Breast cancer survival and recurrence |
| US20050079518A1 (en) * | 2003-06-24 | 2005-04-14 | Baker Joffre B. | Prediction of likelihood of cancer recurrence |
| WO2006052731A2 (en) * | 2004-11-05 | 2006-05-18 | Genomic Health, Inc. | Molecular indicators of breast cancer prognosis and prediction of treatment response |
| WO2008048193A2 (en) * | 2006-10-20 | 2008-04-24 | Agency For Science, Technology And Research | Breast tumour grading |
Family Cites Families (4)
| Publication number | Priority date | Publication date | Assignee | Title |
|---|---|---|---|---|
| US20040002067A1 (en) * | 2001-12-21 | 2004-01-01 | Erlander Mark G. | Breast cancer progression signatures |
| WO2005019258A2 (en) * | 2003-08-11 | 2005-03-03 | Genentech, Inc. | Compositions and methods for the treatment of immune related diseases |
| JP2008515398A (en) * | 2004-09-30 | 2008-05-15 | バイエル・ヘルスケア・アクチェンゲゼルシャフト | Methods and kits for predicting successful treatment and non-recurrent survival in cancer therapy |
| WO2007095186A2 (en) * | 2006-02-14 | 2007-08-23 | Dana-Farber Cancer Institute, Inc. | Compositions, kits, and methods for identification, assessment, prevention, and therapy of cancer |
-
2006
- 2006-10-20 SG SG200607354-8A patent/SG142186A1/en unknown
-
2007
- 2007-10-19 EP EP07835512.0A patent/EP2082060B1/en not_active Not-in-force
- 2007-10-19 WO PCT/SG2007/000357 patent/WO2008048193A2/en not_active Ceased
- 2007-10-19 US US12/446,195 patent/US20110020317A1/en not_active Abandoned
- 2007-10-19 EP EP17199243.1A patent/EP3301192A1/en not_active Withdrawn
-
2013
- 2013-07-30 US US13/954,050 patent/US20140162254A1/en not_active Abandoned
Patent Citations (8)
| Publication number | Priority date | Publication date | Assignee | Title |
|---|---|---|---|---|
| US5030015A (en) | 1986-11-19 | 1991-07-09 | Rolls-Royce Plc | Fluid bearings |
| US6664114B1 (en) | 1992-08-03 | 2003-12-16 | Sapidyne Instruments, Inc. | Solid phase assay for detection of ligands |
| US6168914B1 (en) | 1997-12-19 | 2001-01-02 | Glaxo Wellcome Inc. | System and method for solid-phase parallel synthesis of a combinatorial collection of compounds |
| US20040014094A1 (en) | 2000-10-14 | 2004-01-22 | Helen Lee | Dipstick assay |
| WO2005001138A2 (en) * | 2003-06-18 | 2005-01-06 | Arcturus Bioscience, Inc. | Breast cancer survival and recurrence |
| US20050079518A1 (en) * | 2003-06-24 | 2005-04-14 | Baker Joffre B. | Prediction of likelihood of cancer recurrence |
| WO2006052731A2 (en) * | 2004-11-05 | 2006-05-18 | Genomic Health, Inc. | Molecular indicators of breast cancer prognosis and prediction of treatment response |
| WO2008048193A2 (en) * | 2006-10-20 | 2008-04-24 | Agency For Science, Technology And Research | Breast tumour grading |
Non-Patent Citations (134)
| Title |
|---|
| "Antibodies : A Laboratory Manual", 1988, COLD SPRING HARBOR LABORATORY PRESS, pages: 1855 |
| "Combinatorial Chemistry: A Strategy for the Future", MDL INFORMATION SYSTEMS DISCUSSES THE ROLE ITS PROJECT LIBRARY PLAYS IN MANAGING DIVERSITY LIBRARIES, July 1995 (1995-07-01) |
| "Current Protocols in Molecular Biology", JOHN WILEY & SONS |
| "GenBank", Database accession no. AF098158 |
| "GenBank", Database accession no. AI417917 |
| "GenBank", Database accession no. AI424243 |
| "GenBank", Database accession no. AI435828 |
| "GenBank", Database accession no. AI469788 |
| "GenBank", Database accession no. AK023208 |
| "GenBank", Database accession no. AL565767 |
| "GenBank", Database accession no. BC001651 |
| "GenBank", Database accession no. BC004490 |
| "GenBank", Database accession no. BC006373 |
| "GenBank", Database accession no. BC027464 |
| "GenBank", Database accession no. BE614410 |
| "GenBank", Database accession no. BG165011 |
| "GenBank", Database accession no. BG492359 |
| "GenBank", Database accession no. D38553 |
| "GenBank", Database accession no. FKSG14 |
| "GenBank", Database accession no. NM_001813 |
| "GenBank", Database accession no. NM_002466 |
| "GenBank", Database accession no. NM_002515 |
| "GenBank", Database accession no. NM_003318 |
| "GenBank", Database accession no. NM_003981 |
| "GenBank", Database accession no. NM_004887 |
| "GenBank", Database accession no. NM_006732 |
| "GenBank", Database accession no. NM_014791 |
| "GenBank", Database accession no. NM_016835 |
| "GenBank", Database accession no. NM_021953 |
| "GenBank", Database accession no. NM_031299 |
| "GenBank", Database accession no. R38110 |
| "Handbook of Drug Screening", 2001, MARCEL DEKKER |
| "In vitro Methods in Pharmaceutical Research", 1997, ACADEMIC PRESS |
| "Lab Ref: A Handbook of Recipes, Reagents, and Other Reference Tools for Use at the Bench", 2002, COLD SPRING HARBOR LABORATORY |
| "Methods in Molecular Biology", vol. 80, 1998, HUMANA PRESS, article "Immunochemical Protocols" |
| "Methods in Molecular Biology", vol. 87, 1998, HUMANA PRESS |
| "Oligonucleotide Synthesis: A Practical Approach", 1984, IRL PRESS |
| "The Merck Manual of Diagnosis and Therapy", JOHN WILEY & SONS |
| 1996: "Randomized trial of two versus five years of adjuvant tamoxifen for postmenopausal early stage breast cancer. Swedish Breast Cancer Cooperative Group", J NATL CANCER INST, vol. 88, pages 1543 - 1549 |
| A. VICKERS: "In vitro Methods in Pharmaceutical Research", 1997, ACADEMIC PRESS, pages: 375 - 410 |
| ADNAN M. M. MJALLI; BARRY E. TOYONAGA: "Solid Support Combinatorial Chemistry in Lead Discovery and SAR Optimization", July 1995, ONTOGEN CORPORATION |
| ALIZADEH, A.A.; EISEN, M.B.; DAVIS, R.E.; MA, C.; LOSSOS, I.S.; ROSENWALD, A.; BOLDRICK, J.C.; SABET, H.; TRAN, T.; YU, X. ET AL.: "Distinct types of diffuse large B-cell lymphoma identified by gene expression profiling", NATURE, vol. 403, 2000, pages 503 - 511, XP008127002, DOI: doi:10.1038/35000501 |
| ARNO F. SPATOLA: "Department of Chemistry", June 1996, UNIVERSITY OF LOUISVILLE, article "Combinatorial Chemistry and Molecular Diversity Course at the University of Louisville: A Description" |
| B. ROE; J. CRABTREE; A. KAHN: "DNA Isolation and Sequencing: Essential Techniques", 1996, JOHN WILEY & SONS |
| BALDWIN ET AL.: "Synthesis of a Small Molecule Library Encoded with Molecular Tags", J. AM. CHEM. SOC., vol. 117, 1995, pages 5588 - 5589, XP000652265, DOI: doi:10.1021/ja00125a022 |
| BERGH, J.; NORBERG, T.; SJOGREN, S.; LINDGREN, A.; HOLMBERG, L.: "Complete sequencing of the p53 gene provides prognostic information in breast cancer patients, particularly in relation to adjuvant systemic therapy and radiotherapy", NAT MED, vol. 1, 1995, pages 1029 - 1034 |
| BLARNEY, R.W.: "The design and clinical use of the Nottingham Prognostic Index in breast cancer", BREAST, vol. 5, 1996, pages 156 - 157 |
| BLOOM, H.J.; RICHARDSON, W.W.: "Histological grading and prognosis in breast cancer; a study of 1409 cases of which 359 have been followed for 15 years", BR J CANCER, vol. 11, 1957, pages 359 - 377, XP055150023 |
| BUERGER, H.; MOMMERS, E.C.; LITTMANN, R.; SIMON, R.; DIALLO, R.; POREMBA, C.; DOCKHORN-DWORNICZAK, B.; VAN DIEST, P.J.; BOECKER, W: "Ductal invasive G2 and G3 carcinomas of the breast are the end stages of at least two different lines of genetic evolution", J PATHOL, vol. 194, 2001, pages 165 - 170 |
| BUERGER, H.; OTTERBACH, F.; SIMON, R.; SCHAFER, K.L.; POREMBA, C.; DIALLO, R.; BRINKSCHMIDT, C.; DOCKHORN-DWORNICZAK, B.; BOECKER,: "Different genetic pathways in the evolution of invasive breast cancer are associated with distinct morphological subtypes", J PATHOL, vol. 189, 1999, pages 521 - 526 |
| BULLINGER, L.; DOHNER, K.; BAIR, E.; FROHLING, S.; SCHLENK, R.F.; TIBSHIRANI, R.; DOHNER, H.; POLLACK, J.R.: "Use of gene-expression profiling to identify prognostic subclasses in adult acute myeloid leukemia", N ENGL J MED, vol. 350, 2004, pages 1605 - 1616 |
| CASTELL ET AL.: "In vitro Methods in Pharmaceutical Research", 1997, ACADEMIC PRESS, pages: 375 - 410 |
| CRAIG JAMES; DAVID WEININGER: "A Database System for Combinatorial Synthesis Experiments", July 1995, DAYLIGHT CHEMICAL INFORMATION SYSTEMS, INC. |
| CSERNI, G.: "Tumour histological grade may progress between primary and recurrent invasive mammary carcinoma", J CLIN PATHOL, vol. 55, 2002, pages 293 - 297 |
| D. M. J. LILLEY; J. E. DAHLBERG: "Methods in Enzymology", 1992, ACADEMIC PRESS, article "Methods of Enzymology: DNA Structure Part A: Synthesis and Physical Analysis of DNA" |
| DALTON, L.W.; PINDER, S.E.; ELSTON, C.E.; ELLIS, I.O.; PAGE, D.L.; DUPONT, W.D.; BLARNEY, R.W.: "Histologic grading of breast cancer: linkage of patient outcome with level of pathologist agreement", MOD PATHOL, vol. 13, 2000, pages 730 - 735 |
| DOLLE; NELSON, JOURNAL OF COMBINATORIAL CHEMISTRY, vol. 1, no. 4, 1999, pages 235 - 282 |
| EDWARD HARLOW; DAVID LANE: "Using Antibodies : A Laboratory Manual: Portable Protocol NO. I", 1999, COLD SPRING HARBOR LABORATORY PRESS |
| ELSTON, C.W.; ELLIS, I.O.: "Pathological prognostic factors in breast cancer. I. The value of histological grade in breast cancer: experience from a large study with, long-term follow-up", HISTOPATHOLOGY, vol. 19, 1991, pages 403 - 410, XP055123761, DOI: doi:10.1111/j.1365-2559.1991.tb00229.x |
| FELDMAN, M.; STANFORD, R.; CATCHESIDE, A.; STOTTER, A.: "The use of a prognostic table to aid decision making on adjuvant therapy for women with early breast cancer", EUR J SURG ONCOL, vol. 28, 2002, pages 615 - 619 |
| FRIERSON, H.F., JR.; WOLBER, R.A.; BEREAN, K.W.; FRANQUEMONT, D.W.; GAFFEY, M.J.; BOYD, J.C.; WILBUR, D.C.: "Interobserver reproducibility of the Nottingham modification of the Bloom and Richardson histologic grading scheme for infiltrating ductal carcinoma", AM J CLIN PATHOL, vol. 103, 1995, pages 195 - 198 |
| FURKA, A. ET AL., 14TH INTERNATIONAL CONGRESS OF BIOCHEMISTRY, 1988 |
| FURKA, A. ET AL., INT. J. PEPTIDE PROTEIN RES., vol. 37, 1991, pages 487 - 493 |
| FURKA, A. ET AL., XTH INTERNATIONAL SYMPOSIUM ON MEDICINAL CHEMISTRY, 1988 |
| GALLOP, M. A. ET AL., J. MED. CHEM., vol. 37, 1994, pages 1233 - 1251 |
| GORDON, E. M. ET AL., J. MED. CHEM., vol. 37, 1994, pages 1385 - 1401 |
| HARVEY, J.M.; DE KLERK, N.H.; STERRETT, G.F.: "Histological grading in breast cancer: interobserver agreement, and relation to other prognostic factors including ploidy", PATHOLOGY, vol. 24, 1992, pages 63 - 68 |
| HAYBITTLE JL; BLARNEY RW; ELSTON CW; JOHNSON J; DOYLE PJ; CAMPBELL FC; NICHOLSON RI; GRIFFITHS K ET AL.: "A prognostic index in primary breast cancer", BR J CANCER, vol. 45, no. 3, 1982, pages 361 - 6 |
| HAYBITTLE, J.L.; BLARNEY, R.W.; ELSTON, C.W.; JOHNSON, J.; DOYLE, P.J.; CAMPBELL, F.C.; NICHOLSON, R.I.; GRIFFITHS, K.: "A prognostic index in primary breast cancer", BR J CANCER, vol. 45, 1982, pages 361 - 366 |
| HAYES, D.F.; ISAACS, C.; STEARNS, V.: "Prognostic factors in breast cancer: current and new predictors of metastasis", J MAMMARY GLAND BIOL NEOPLASIA, vol. 6, 2001, pages 375 - 392, XP008075721, DOI: doi:10.1023/A:1014778713034 |
| HITCHCOCK, A.; ELLIS, I.O.; ROBERTSON, J.F.; GILMOUR, A.; BELL, J.; ELSTON, C.W.; BLARNEY, R.W.: "An observation of DNA ploidy, histological grade, and immunoreactivity for tumour-related antigens in primary and metastatic breast carcinoma", J PATHOL, vol. 159, 1989, pages 129 - 134 |
| HOUGHTEN, R. A. ET AL., NATURE, vol. 354, 1991, pages 84 - 86 |
| J. M. POLAK; JAMES O'D. MCGEE: "In Situ Hybridization: Principles and Practice", 1990, OXFORD UNIVERSITY PRESS |
| J. SAMBROOK; E. F. FRITSCH; T. MANIATIS: "Molecular Cloning: A Laboratory Manual", vol. 1-3, 1989, COLD SPRING HARBOR LABORATORY PRESS |
| JACKSON, A.M.; IVSHINA, A.V.; SENKO, 0.; KUZNETSOVA, A.; SUNDAN, A.; O'DOMIELL, M.A.; CLINTON, S.; ALEXANDROFF, A.B.; SELBY, P.J.;: "Prognosis of intravesical bacillus Calmette-Guerin therapy for superficial bladder cancer by immunological urinary measurements: statistically weighted syndrome analysis", J UROL, vol. 159, 1998, pages 1054 - 1063 |
| JACKSON, A.M.; IVSHINA, A.V.; SENKO, O.; KUZNETSOVA, A.; SUNDAN, A.; O'DONNELL, M.A.; CLINTON, S.; ALEXANDROFF, A.B.; SELBY, P.J.;: "Prognosis of intravesical bacillus Calmette-Guerin therapy for superficial bladder cancer by immunological urinary measurements: statistically weighted syndrome analysis", J UROL, vol. 159, 1998, pages 1054 - 1063 |
| JOHN P. DEVLIN, THE IMPACT OF HIGH THROUGHPUT ORGANIC SYNTHESIS ON R&D IN BIO-BASED INDUSTRIES, March 1996 (1996-03-01) |
| KEITH DAVIES; CATHERINE WHITE: "An Information Management Architecture for Combinatorial Chemistry", July 1995, CHEMICAL DESIGN LTD. |
| KEITH DAVIES; CLIVE BRIANT: "Combinatorial Chemistry Library Design using Pharmacophore Diversity", July 1995, CHEMICAL DESIGN LTD. |
| KERR, J. M. ET AL., J.AM.CHEM.SOC., vol. 115, 1993, pages 2529 - 2531 |
| KUZNETSOV, V.A.; IVSHINA, A.V.; SEN'KO, O.V.; KUZNETSOVA, A.V.: "Syndrome approach for computer recognition of fuzzy systems and its application to immunological diagnostics and prognosis of human cancer", MATH. COMPUT. MODELING, vol. 23, 1996, pages 92 - 112 |
| KUZNETSOV, V.A.; KNOTT, G.D.; IVSHINA, A.V.: "Artificial immune system based on syndromes-response approach: Theory and their application to recognition of the patterns of immune response and prognosis of therapy outcome", IN PROC. OF IEEE INTERN. CONF. ON SYSTEMS, MAN, AND CYBERNETICS. SAN DIEGO, CA, USA, 1998, pages 3804 - 3809 |
| KUZNETSOV, V.A.; KNOTT, G.D.; IVSHINA, A.V.: "Artificial immune system based on syndromes-response approach: Theory and their application to recognition of the patterns of immune response and prognosis of therapy outcome", PROC. OF IEEE INTERN. CONF. ON SYSTEMS, MAN, AND CYBERNETICS, 1998, pages 3804 - 3809 |
| LACROIX, M.; TOILLON, R.A.; LECLERCQ, G.: "Stable 'portrait' of breast tumours during progression: data from biology, pathology and genetics", ENDOCR RELAT CANCER, vol. 11, 2004, pages 497 - 522 |
| LAKHANI, S.R.: "The transition from hyperplasia to invasive carcinoma of the breast", J PATHOL, vol. 187, 1999, pages 272 - 278 |
| LAM, K. S. ET AL., NATURE, vol. 354, 1991, pages 82 - 84 |
| LARS-INGE LARSSON: "Immunocytochemistry: Theory and Practice", 1988, CRC PRESS INC. |
| LINDAHL, T.; LANDBERG, G.; AHLGREN, J.; NORDGREN, H.; NORBERG, T.; KLAAR, S.; HOLMBERG, L.; BERGH, J.: "Overexpression of cyclin E protein is associated with specific mutation types in the p53 gene and poor survival in human breast cancer", CARCINOGENESIS, vol. 25, 2004, pages 375 - 380 |
| LINDERHOLM, B.K.; LINDAHL, T.; HOLMBERG, L.; KLAAR, S.; LENNERSTRAND, J.; HENRIKSSON, R.; BERGH, J.: "The expression of vascular endothelial growth factor correlates with mutant p53 and poor prognosis in human breast cancer", CANCER RES, vol. 61, 2001, pages 2256 - 2260 |
| LUKAS, J.; HERZINGER, T.; HANSEN, K.; MORONI, M.C.; RESNITZKY, D.; HELIN, K.; REED, S.I.; BARTEK, J.: "Cyclin E-induced S phase without activation of the pRb/E2F pathway", GENES DEV, vol. 11, 1997, pages 1479 - 1492 |
| LUNDIN, J.; LUNDIN, M.; HOLLI, K.; KATAJA, V.; ELOMAA, L.; PYLKKANEN, L.; TURPEENNIEMI-HUJANEN, T.; JOENSUU, H.: "Omission of histologic grading from clinical decision making may result in overuse of adjuvant therapies in breast cancer: results from a nationwide study", J CLIN ONCOL, vol. 19, 2001, pages 28 - 36 |
| MA X-J ET AL: "GENE EXPRESSION SIGNATURES ASSOCIATED WITH CLINICAL OUTCOME IN BREAST CANCER VIA LASER CAPTURE MICRODISSECTION", BREAST CANCER RESEARCH AND TREATMENT, NIJHOFF, BOSTON, US, vol. 82, no. SUPPL 1, 2003, pages S15, XP009035626, ISSN: 0167-6806 * |
| MA, PNAS, 2003 |
| MA, X.J.; SALUNGA, R.; TUGGLE, J.T.; GAUDET, J.; ENRIGHT, E.; MCQUARY, P.; PAYETTE, T.; PISTONE, M.; STECKER, K.; ZHANG, B.M. ET A: "Gene expression profiles of human breast cancer progression", PROC NATL ACAD SCI U S A, vol. 100, 2003, pages 5974 - 5979 |
| MA, X.J.; SALUNGA, R.; TUGGLE, J.T.; GAUDET, J.; ENRIGHT, E.; MCQUARY, P.; PAYETTE, T.; PISTONE, M.; STECKER, K.; ZHANG, B.M. ET A: "Gene expression profiles of human breast cancer progression", PROC NATL ACAD SCI USA, vol. 100, 2003, pages 5974 - 5979 |
| MARYJO ZABOROWSKI: "Data Management for Combinatorial Chemistry", CHIRON CORPORATION |
| MI, H.; LAZAREVA-ULITSKY, B.; LOO, R.; KEJARIWAL, A.; VANDERGRIFF, J.; RABKIN, S.; GUO, N.; MURUGANUJAN, A.; DOREMIEUX, O.; CAMPBE: "The-PANTHER database of protein families, subfamilies, functions and pathways", NUCLEIC ACIDS RES, vol. 33, 2005, pages D284 - 288 |
| MICHAEL J. SOFIA: "Chemical Strategies For Introducing Carbohydrate Molecular Diversity Into The Drug Discovery Process.", June 1996, TRANSCELL TECHNOLOGIES INC. |
| MICHAEL R. PAVIA: "Chemically Generated Screening Libraries: Present and Future", SPHINX PHARMACEUTICALS, A DIVISION OF ELI LILLY, June 1996 (1996-06-01) |
| MICHAEL R. PAVIA; SPHINX PHARMACEUTICALS, A DIVISION OF ELI LILLY, July 1995 (1995-07-01) |
| MILLER, L.D.; SMEDS, J.; GEORGE, J.; VEGA, V.B.; VERGARA, L.; PLONER, A.; PAWITAN, Y.; HALL, P.; KLAAR, S.; LIU, E.T. ET AL.: "An expression signature for p53 status in human breast cancer predicts mutation status, transcriptional effects, and patient survival", PROC NATL ACAD SCI U S A., 2005 |
| MILLER, L.D.; SMEDS, J.; GEORGE, J.; VEGA, V.B.; VERGARA, L.; PLONER, A.; PAWITAN, Y.; HALL, P.; KLAAR, S.; LIU, E.T. ET AL.: "An expression signature for p53 status in human breast cancer predicts mutation status, transcriptional effects, and patient survival", PROC NATL ACAD SCI USA., 2005 |
| MILLIS, R.R.; BARNES, D.M.; LAMPEJO, O.T.; EGAN, M.K.; SMITH, P.: "Tumour grade does not change between primary and recurrent mammary carcinoma", EUR J CANCER, vol. 34, 1998, pages 548 - 553, XP004284847, DOI: doi:10.1016/S0959-8049(97)10072-7 |
| MINELLA, A.C.; SWANGER, J.; BRYANT, E.; WELCKER, M.; HWANG, H.; CLURMAN, B.E.: "form an inducible barrier that protects cells against cyclin E-cdk2 deregulation", CURR BIOL, vol. 12, 2002, pages 1817 - 1827 |
| MUELLER, B.U.; ZEICHNER, S.L.; KUZNETSOV, V.A.; HEATH-CHIOZZI,M.; PIZZO P.A.; DIMITROV, D.S.: "Individual prognoses of long-term responses to antiretroviral treatment based on virological, immunological and pharmacological parameters measured during the first week under therapy", AIDS, vol. 13, 1998, pages f191 - f196 |
| NIKOLAIEV, V. ET AL., PEPT. RES., vol. 6, 1993, pages 161 - 170 |
| OHLMEYER, M. H. J. ET AL., PROC.NATL.ACAD.SCI.USA, vol. 90, 1993, pages 10922 - 10926 |
| R. S. PEARLMAN: "Laboratory for Molecular Graphics and Theoretical Modeling", June 1996, COLLEGE OF PHARMACY, UNIVERSITY OF TEXAS, article "Novel Software Tools for Addressing Chemical Diversity" |
| ROBBINS, P.; PINDER, S.; DE KLERK, N.; DAWKINS, H.; HARVEY, J.; STERRETT, G.; ELLIS, I.; ELSTON, C.: "Histological grading of breast carcinomas: a study of interobserver agreement", HUM PATHOL, vol. 26, 1995, pages 873 - 879 |
| ROBERTI, N.E.: "The role of histologic grading in the prognosis of patients with carcinoma of the breast: is this a neglected opportunity?", CANCER, vol. 80, 1997, pages 1708 - 1716 |
| ROYLANCE, R.; GORMAN, P.; HARRIS, W.; LIEBMANN, R.; BARNES, D.; HANBY, A.; SHEER, D.: "Comparative genomic hybridization of breast tumours stratified by histological grade reveals new insights into the biological progression of breast cancer", CANCER RES, vol. 59, 1999, pages 1433 - 1436 |
| SALMON, S. E. ET AL., PROC.NATL.ACAD.SCI.USA, vol. 90, 1993, pages 11708 - 11712 |
| SARVAJIT CHAKRAVARTY; BABU J. MAVUNKEL; ROBIN ANDY; DONALD J. KYLE: "Non-Peptidic Bradykinin Receptor Antagonists From a Structurally Directed Non-Peptide Library", July 1995, SCIOS NOVA INC. |
| SCHUMACHER, M.; SCHMOOR, C.; SAUERBREI, W.; SCHAUER, A.; UMMENHOFER, L.; GATZEMEIER, W.; RAUSCHECKER, H.: "The prognostic effect of histological tumour grade in node-negative breast cancer patients", BREAST CANCER RES TREAT, vol. 25, 1993, pages 235 - 245 |
| SHACKNEY, S.E.; SILVERMAN, J.F: "Molecular evolutionary patterns in breast cancer", ADV ANAT PATHOL, vol. 10, 2003, pages 278 - 290 |
| SHEILA H. DEWITT: "Parke-Davis Pharmaceutical Research", November 1995, DIVISION OF WARNER-LAMBERT COMPANY |
| SIMPSON, P.T.; REIS-FILHO, J.S.; GALE, T.; LAKHANI, S.R.: "Molecular evolution of breast cancer", J PATHOL, vol. 205, 2005, pages 248 - 254 |
| SORLIE T ET AL: "Gene expression patterns of breast carcinomas distinguish tumor subclasses with clinical implications", PROCEEDINGS OF THE NATIONAL ACADEMY OF SCIENCES OF USA, NATIONAL ACADEMY OF SCIENCE, WASHINGTON, DC, US, vol. 98, no. 19, 11 September 2001 (2001-09-11), pages 10869 - 10874, XP002215483, ISSN: 0027-8424 * |
| SORLIE, T.; PEROU, C.M.; TIBSHIRANI, R.; AAS, T.; GEISLER, S.; JOHNSEN, H.; HASTIE, T.; EISEN, M.B.; VAN DE RIJN, M.; JEFFREY, S.S: "Gene expression patterns of breast carcinomas distinguish tumour subclasses with clinical implications", PROC NATL ACAD SCI U S A, vol. 98, 2001, pages 10869 - 10874, XP002215483, DOI: doi:10.1073/pnas.191367098 |
| SOTIRIOU, T.; PEROU, C.M.; TIBSHIRANI, R.; AAS, T.; GEISLER, S.; JOHNSEN, H.; HASTIE, T.; EISEN, M.B.; VAN DE RIJN, M.; JEFFREY, S: "Gene expression patterns of breast carcinomas distinguish tumour subclasses with clinical implications", PROC NATL ACAD SCI USA, vol. 98, 2001, pages 10869 - 10874, XP002215483, DOI: doi:10.1073/pnas.191367098 |
| SPRUCK, C.H.; WON, K.A.; REED, S.I.: "Deregulated cyclin E induces chromosome instability", NATURE, vol. 401, 1999, pages 297 - 300 |
| STOTTER, A.: "A prognostic table to guide practitioners advising patients on adjuvant systemic therapy in early breast cancer", EUR J SURG ONCOL, vol. 25, 1999, pages 341 - 343 |
| TABAR, L.; FAGERBERG, G.; CHEN, H.H.; DUFFY, S.W.; GAD, A.: "Tumour development, histology and grade of breast cancers: prognosis and progression", INT J CANCER, vol. 66, 1996, pages 413 - 419 |
| TIBSHIRANI ET AL., PROC NATL ACAD SCI USA, vol. 99, no. 10, 2002, pages 6567 - 6572 |
| TIBSHIRANI ET AL., PROC NATL ACAD SCI USA., vol. 99, no. 10, 2002, pages 6567 - 6572 |
| TIBSHIRANI, R.; HASTIE, T.; NARASIMHAN, B.; CHU, G.: "Diagnosis of multiple cancer types by shrunken centroids of gene expression", PROC NATL ACAD SCI U S A, vol. 99, 2002, pages 6567 - 6572, XP002988576, DOI: doi:10.1073/pnas.082099299 |
| TIBSHIRANI, R.; HASTIE, T.; NARASIMHAN, B.; CHU, G.: "Diagnosis of multiple cancer types by shrunken centroids of gene expression", PROC NATL ACAD SCI USA, vol. 99, 2002, pages 6567 - 6572, XP002988576, DOI: doi:10.1073/pnas.082099299 |
| TRUDEAU, M.E.; PRITCHARD, K.I.; CHAPMAN, J.A.; HANNA, W.M.; KAHN, H.J.; MURRAY, D.; SAWKA, C.A.; MOBBS, B.G.; ANDRULIS, 1.; MCCREA: "Prognostic factors affecting the natural history of node-negative breast cancer", BREAST CANCER RES TREAT, vol. 89, 2005, pages 35 - 45, XP019274702 |
| TUBIANA, M.; KOSCIELNY, S.: "Natural history of human breast cancer: recent data and clinical implications", BREAST CANCER RES TREAT, vol. 18, 1991, pages 125 - 140 |
| VAN DIEST, P.J.; VAN DER I WALL, E.; BAAK, J.P.: "Prognostic value of proliferation in invasive breast cancer: a review", J CLIN PATHOL, vol. 57, 2004, pages 675 - 681 |
| VAN'T VEER, L.J.; DAI, H.; VAN DE VIJV'ER, M.J.; HE, Y.D.; HART, A.A.; MAO, M.; PETERSE, H.L.; VAN DER KOOY, K.; MARTON, M.J.; WIT: "Gene expression profiling predicts clinical outcome of breast cancer", NATURE, vol. 415, 2002, pages 530 - 536, XP008138701, DOI: doi:10.1038/415530a |
| VAN'T VEER, L.J.; DAI, H.; VAN DE VIJVER, M.J.; HE, Y.D.; HART, A.A.; MAO, M.; PETERSE, H.L.; VAN DER KOOY, K.; MARTON, M.J.; WITT: "Gene expression profiling predicts clinical outcome of breast cancer", NATURE, vol. 415, 2002, pages 530 - 536, XP008138701, DOI: doi:10.1038/415530a |
| YOUNES, M.; LAUCIRICA, R.: "Lack of prognostic significance of histological grade in node-negative invasive breast carcinoma", CLIN CANCER RES, vol. 3, 1997, pages 601 - 604 |
| YVONNE CONNOLLY MARTIN: "Computer Assisted Molecular Design Project", June 1996, ABBOTT LABORATORIES, article "Opportunities for Computational Chemists Afforded by the New Strategies in Drug Discovery: An Opinion" |
Also Published As
| Publication number | Publication date |
|---|---|
| SG142186A1 (en) | 2008-05-28 |
| US20140162254A1 (en) | 2014-06-12 |
| WO2008048193A3 (en) | 2009-11-26 |
| WO2008048193A2 (en) | 2008-04-24 |
| EP2082060A2 (en) | 2009-07-29 |
| US20110020317A1 (en) | 2011-01-27 |
| EP2082060B1 (en) | 2017-11-01 |
Similar Documents
| Publication | Publication Date | Title |
|---|---|---|
| EP2082060B1 (en) | Breast tumour grading | |
| US8682593B2 (en) | Methods, systems, and compositions for classification, prognosis, and diagnosis of cancers | |
| Boer et al. | Identification and classification of differentially expressed genes in renal cell carcinoma by expression profiling on a global human 31,500-element cDNA array | |
| Ivshina et al. | Genetic reclassification of histologic grade delineates new clinical subtypes of breast cancer | |
| US20120071346A1 (en) | Gene-based algorithmic cancer prognosis | |
| US10422005B2 (en) | Methods for treating colorectal cancer using prognostic genetic markers | |
| US8019552B2 (en) | Classification of breast cancer patients using a combination of clinical criteria and informative genesets | |
| US7943306B2 (en) | Gene expression signature for prediction of human cancer progression | |
| AU2015230677A1 (en) | Determining cancer agressiveness, prognosis and responsiveness to treatment | |
| US20080182246A1 (en) | Methods of predicting distant metastasis of lymph node-negative primary breast cancer using biological pathway gene expression analysis | |
| Romualdi et al. | Pattern recognition in gene expression profiling using DNA array: a comparative study of different statistical methods applied to cancer classification | |
| CA2608643A1 (en) | Gene-based algorithmic cancer prognosis | |
| EP2406728B1 (en) | A method for identification, prediction and prognosis of cancer aggressiveness | |
| EP2342354B1 (en) | Molecular classifier for evaluating the risk of metastasic relapse in breast cancer | |
| CN109072481A (en) | The gene expression characteristics of remaining risk after early-stage breast cancer endocrine therapy | |
| US20160222458A1 (en) | Gene Expression Profile Breast Tumour Grading | |
| WO2013079188A1 (en) | Methods for the diagnosis, the determination of the grade of a solid tumor and the prognosis of a subject suffering from cancer | |
| US20220228218A1 (en) | Clinical and Molecular Prognostic Markers for Liver Transplantation | |
| Class et al. | Patent application title: BREAST TUMOUR GRADING Inventors: Lance D. Miller (Singapore, SG) Vladimir Kuznetsov (Singapore, SG) Anna Ivshina (Singapore, SG) Assignees: Agency For Science, Technology and Research | |
| CN101965190A (en) | Laser microdissection and microarray analysis of breast tumors reveal estrogen receptor related genes and pathways | |
| WO2023081190A1 (en) | Epithelial-mesenchymal transition-based gene expression signature for kidney cancer | |
| WO2017061953A1 (en) | Invasive ductal carcinoma aggressiveness classification | |
| Han et al. | Prostate Epithelial Genes Define Docetaxel-Sensitive Prostate Cancer Molecular Subtype | |
| Gong et al. | Identification and validation of an m1A-score model to predict outcomes and immunomodulation in lung squamous cell carcinoma by integrated analysis of single-cell and bulk RNA sequencing | |
| Moinfar | Is “Basal-like” Carcinoma of the Breast a Distinct Clinicopathologic Entity? A Critical Review with Cautionary Notes |
Legal Events
| Date | Code | Title | Description |
|---|---|---|---|
| PUAI | Public reference made under article 153(3) epc to a published international application that has entered the european phase |
Free format text: ORIGINAL CODE: 0009012 |
|
| STAA | Information on the status of an ep patent application or granted ep patent |
Free format text: STATUS: THE APPLICATION HAS BEEN PUBLISHED |
|
| AC | Divisional application: reference to earlier application |
Ref document number: 2082060 Country of ref document: EP Kind code of ref document: P |
|
| AK | Designated contracting states |
Kind code of ref document: A1 Designated state(s): AT BE BG CH CY CZ DE DK EE ES FI FR GB GR HU IE IS IT LI LT LU LV MC MT NL PL PT RO SE SI SK TR |
|
| STAA | Information on the status of an ep patent application or granted ep patent |
Free format text: STATUS: REQUEST FOR EXAMINATION WAS MADE |
|
| 17P | Request for examination filed |
Effective date: 20181003 |
|
| RBV | Designated contracting states (corrected) |
Designated state(s): AT BE BG CH CY CZ DE DK EE ES FI FR GB GR HU IE IS IT LI LT LU LV MC MT NL PL PT RO SE SI SK TR |
|
| RIN1 | Information on inventor provided before grant (corrected) |
Inventor name: KUZNETSOV, VLADIMIR Inventor name: IVSHINA, ANNA Inventor name: MILLER, LANCE D. |
|
| STAA | Information on the status of an ep patent application or granted ep patent |
Free format text: STATUS: EXAMINATION IS IN PROGRESS |
|
| 17Q | First examination report despatched |
Effective date: 20181204 |
|
| STAA | Information on the status of an ep patent application or granted ep patent |
Free format text: STATUS: THE APPLICATION IS DEEMED TO BE WITHDRAWN |
|
| 18D | Application deemed to be withdrawn |
Effective date: 20190615 |