EP3295204B1 - Systems and methods for calibrated multi-spectral magnetic resonance imaging - Google Patents
Systems and methods for calibrated multi-spectral magnetic resonance imaging Download PDFInfo
- Publication number
- EP3295204B1 EP3295204B1 EP16797010.2A EP16797010A EP3295204B1 EP 3295204 B1 EP3295204 B1 EP 3295204B1 EP 16797010 A EP16797010 A EP 16797010A EP 3295204 B1 EP3295204 B1 EP 3295204B1
- Authority
- EP
- European Patent Office
- Prior art keywords
- frequency
- computer system
- spectral
- recited
- data
- Prior art date
- Legal status (The legal status is an assumption and is not a legal conclusion. Google has not performed a legal analysis and makes no representation as to the accuracy of the status listed.)
- Active
Links
Images


Classifications
-
- G—PHYSICS
- G01—MEASURING; TESTING
- G01R—MEASURING ELECTRIC VARIABLES; MEASURING MAGNETIC VARIABLES
- G01R33/00—Arrangements or instruments for measuring magnetic variables
- G01R33/20—Arrangements or instruments for measuring magnetic variables involving magnetic resonance
- G01R33/44—Arrangements or instruments for measuring magnetic variables involving magnetic resonance using nuclear magnetic resonance [NMR]
- G01R33/48—NMR imaging systems
- G01R33/54—Signal processing systems, e.g. using pulse sequences ; Generation or control of pulse sequences; Operator console
- G01R33/543—Control of the operation of the MR system, e.g. setting of acquisition parameters prior to or during MR data acquisition, dynamic shimming, use of one or more scout images for scan plane prescription
-
- A—HUMAN NECESSITIES
- A61—MEDICAL OR VETERINARY SCIENCE; HYGIENE
- A61B—DIAGNOSIS; SURGERY; IDENTIFICATION
- A61B5/00—Measuring for diagnostic purposes; Identification of persons
- A61B5/0033—Features or image-related aspects of imaging apparatus, e.g. for MRI, optical tomography or impedance tomography apparatus; Arrangements of imaging apparatus in a room
- A61B5/0037—Performing a preliminary scan, e.g. a prescan for identifying a region of interest
-
- A—HUMAN NECESSITIES
- A61—MEDICAL OR VETERINARY SCIENCE; HYGIENE
- A61B—DIAGNOSIS; SURGERY; IDENTIFICATION
- A61B5/00—Measuring for diagnostic purposes; Identification of persons
- A61B5/05—Detecting, measuring or recording for diagnosis by means of electric currents or magnetic fields; Measuring using microwaves or radio waves
- A61B5/055—Detecting, measuring or recording for diagnosis by means of electric currents or magnetic fields; Measuring using microwaves or radio waves involving electronic [EMR] or nuclear [NMR] magnetic resonance, e.g. magnetic resonance imaging
-
- G—PHYSICS
- G01—MEASURING; TESTING
- G01R—MEASURING ELECTRIC VARIABLES; MEASURING MAGNETIC VARIABLES
- G01R33/00—Arrangements or instruments for measuring magnetic variables
- G01R33/20—Arrangements or instruments for measuring magnetic variables involving magnetic resonance
- G01R33/24—Arrangements or instruments for measuring magnetic variables involving magnetic resonance for measuring direction or magnitude of magnetic fields or magnetic flux
- G01R33/243—Spatial mapping of the polarizing magnetic field
-
- G—PHYSICS
- G01—MEASURING; TESTING
- G01R—MEASURING ELECTRIC VARIABLES; MEASURING MAGNETIC VARIABLES
- G01R33/00—Arrangements or instruments for measuring magnetic variables
- G01R33/20—Arrangements or instruments for measuring magnetic variables involving magnetic resonance
- G01R33/44—Arrangements or instruments for measuring magnetic variables involving magnetic resonance using nuclear magnetic resonance [NMR]
- G01R33/48—NMR imaging systems
- G01R33/54—Signal processing systems, e.g. using pulse sequences ; Generation or control of pulse sequences; Operator console
- G01R33/56—Image enhancement or correction, e.g. subtraction or averaging techniques, e.g. improvement of signal-to-noise ratio and resolution
- G01R33/565—Correction of image distortions, e.g. due to magnetic field inhomogeneities
- G01R33/56536—Correction of image distortions, e.g. due to magnetic field inhomogeneities due to magnetic susceptibility variations
-
- G—PHYSICS
- G01—MEASURING; TESTING
- G01R—MEASURING ELECTRIC VARIABLES; MEASURING MAGNETIC VARIABLES
- G01R33/00—Arrangements or instruments for measuring magnetic variables
- G01R33/20—Arrangements or instruments for measuring magnetic variables involving magnetic resonance
- G01R33/44—Arrangements or instruments for measuring magnetic variables involving magnetic resonance using nuclear magnetic resonance [NMR]
- G01R33/48—NMR imaging systems
- G01R33/54—Signal processing systems, e.g. using pulse sequences ; Generation or control of pulse sequences; Operator console
- G01R33/56—Image enhancement or correction, e.g. subtraction or averaging techniques, e.g. improvement of signal-to-noise ratio and resolution
- G01R33/565—Correction of image distortions, e.g. due to magnetic field inhomogeneities
- G01R33/56563—Correction of image distortions, e.g. due to magnetic field inhomogeneities caused by a distortion of the main magnetic field B0, e.g. temporal variation of the magnitude or spatial inhomogeneity of B0
-
- G—PHYSICS
- G01—MEASURING; TESTING
- G01R—MEASURING ELECTRIC VARIABLES; MEASURING MAGNETIC VARIABLES
- G01R33/00—Arrangements or instruments for measuring magnetic variables
- G01R33/20—Arrangements or instruments for measuring magnetic variables involving magnetic resonance
- G01R33/44—Arrangements or instruments for measuring magnetic variables involving magnetic resonance using nuclear magnetic resonance [NMR]
- G01R33/48—NMR imaging systems
- G01R33/58—Calibration of imaging systems, e.g. using test probes, Phantoms; Calibration objects or fiducial markers such as active or passive RF coils surrounding an MR active material
- G01R33/583—Calibration of signal excitation or detection systems, e.g. for optimal RF excitation power or frequency
-
- G—PHYSICS
- G01—MEASURING; TESTING
- G01V—GEOPHYSICS; GRAVITATIONAL MEASUREMENTS; DETECTING MASSES OR OBJECTS; TAGS
- G01V13/00—Manufacturing, calibrating, cleaning, or repairing instruments or devices covered by groups G01V1/00 – G01V11/00
-
- G—PHYSICS
- G01—MEASURING; TESTING
- G01V—GEOPHYSICS; GRAVITATIONAL MEASUREMENTS; DETECTING MASSES OR OBJECTS; TAGS
- G01V3/00—Electric or magnetic prospecting or detecting; Measuring magnetic field characteristics of the earth, e.g. declination, deviation
- G01V3/14—Electric or magnetic prospecting or detecting; Measuring magnetic field characteristics of the earth, e.g. declination, deviation operating with electron or nuclear magnetic resonance
Definitions
- the field of the invention is systems and methods for magnetic resonance imaging ("MRI"). More particularly, the invention relates to systems and methods for MRI near metallic implants or devices.
- MRI magnetic resonance imaging
- MRI soft-tissue contrast can add substantial diagnostic value when assessing the tissue envelope around metallic implants.
- FDA U.S. Food and Drug Association
- 3D-MSI Three-Dimensional Multi-Spectral Imaging
- MAVRIC Multi-Acquisition Variable-Resonance Image Combination
- FSE 3D fast spin echo
- MAVRIC and other 3D-MSI techniques are designed to address "worst-case-scenario" imaging problems. These techniques acquire sections around the metal implant at discrete Larmor frequency offsets that account for the field perturbations. The sections are then combined to generate an image of the tissue surrounding the metal implant. Typically, such techniques may use at least twenty different sections, referred to as “spectral bins” or “frequency bins” to create a single image. Capturing these bins can sometimes take as long as ten minutes. A patient must remain still during the duration of the acquisition, which, as the acquisition becomes longer, can lead to blurred images resulting from patient movement.
- the present invention overcomes the aforementioned drawbacks by providing methods for improved three-dimensional multi-spectral imaging (“MSI”) using magnetic resonance imaging (“MRI”).
- MSI three-dimensional multi-spectral imaging
- MRI magnetic resonance imaging
- the 3D-MSI acquisition is improved using a calibration "pre-scan” where information from the calibration scan can be used to optimize the scanning and data collection of the 3D-MSI acquisition.
- MRI magnetic resonance imaging
- MSI multi-spectral imaging
- Described here are systems and methods for performing a calibration "pre-scan" prior to acquiring data using a multi-spectral imaging (“MSI") acquisition, such that information from the calibration scan can be used to optimize the scanning and data collection during the remainder of the MSI scan. As a result, scan times and motion artifacts are reduced. In addition, image resolution can be increased, thereby improving image quality.
- the MSI acquisition can be a MAVRIC acquisition.
- the methods described here are advantageous not only for 3D-MSI acquisitions, but also for 2D-MSI acquisitions and, thus, can be implemented for both 2D and 3D acquisitions.
- the calibration scan acquires information about the range and location of off-resonant spins, and can aid in optimizing the efficiency of MRI scanning when metallic implants are a factor.
- the calibration data contains data acquired at a number of different resonance frequency offsets.
- the calibration data acquired with this initial "pre-scan," or calibration scan can be used to automatically determine off-resonance frequency ranges.
- the method rapidly collects a 3D-MSI dataset and then analyzes the spectral information of that data in order to guide the MR acquisitions for the rest of the 3D-MSI scan.
- the number of spectral bins can be reduced, with a consequent reduction in scan time, without loss in image quality.
- the number of spectral bins can be reduced from 24 bins to as few as 3-5 bins.
- the method described here provides additional benefits, including artifact reduction and workflow improvement. For instance, low-artifact imaging can be improved near indwelling metallic implants or other metallic devices. Workflow can also be improved because current metal artifact reduction technologies are "blind" to the type of implant presented, but there can be a significant difference between the artifacts generated by different implants. Currently, imaging sequences are designed for a worst-case scenario and perform the maximum amount of artifact correction. With the methods described here, however, the 3D-MSI scan can be tailored to the particular implant (e.g., by using the minimum number of spectral bins for a particular implant), thereby increasing efficiency of the scan.
- the method includes collecting a calibration dataset and then analyzing the spectral information in that calibration dataset to guide the remainder of the 3D-MSI acquisition.
- the method thus includes acquiring calibration data, as indicated at step 102.
- the calibration data can be acquired as a low-resolution, non-selective 3D-MSI dataset.
- the calibration data can be acquired using a rapid MAVRIC acquisition.
- the calibration data can be acquired using a selective MAVRIC acquisition, such as a MAVRIC SL acquisition.
- MAVRIC SL selective MAVRIC acquisition
- a linear B 0 trend can be removed in the slab-selective dimension before additional processing is performed.
- the calibration data can also be acquired using a two-dimensional acquisition when a 2D-MSI scan is planned,
- a field map or off-resonance map, is computed, as indicated at step 104.
- the field map contains information about off-resonance effects in the field-of-view imaged by the calibration data.
- these off-resonance effects can be caused by metallic objects, such as implants or devices, that may be present in the subject being imaged.
- Calibration images can also be reconstructed from the calibration data at this point.
- the method proceeds by computing or otherwise providing the optimal settings (e.g., receiver bandwidth, number of averages) for a non-3D-MSI acquisition, as indicated at step 108.
- the optimal settings e.g., receiver bandwidth, number of averages
- Non-3D-MSI data is then acquired from the subject, as indicated at step 110, from which images of the subject can be reconstructed, as indicated at step 112.
- the method proceeds by determining the spectral range to be used for a 3D-MSI acquisition, as indicated at step 114. This spectral range is determined based on the field map generated from the calibration data.
- the spectral range can be determined based on a cumulative distribution function ("CDF") computed from the field map.
- CDF cumulative distribution function
- FIG. 2 a flowchart is illustrated at setting forth the steps of an example method for determining a spectral range based on a CDF that is computed from the field map.
- This method begins by computing a CDF from the estimated field map, as indicated at step 202.
- the CDF can be computed by estimating a probability density function (“PDF”) from the field map, and then computing the integral of the PDF.
- PDF probability density function
- the PDF can be estimated as the histogram of the distribution of frequencies in the field map.
- magnitude and frequency map masks are generated and used in the process of determining the spectral range.
- a magnitude mask is generated, as indicated at step 206.
- a frequency map is generated, as indicated at step 208.
- the magnitude mask can be computed from a high intensity mask and a low intensity mask that are generated based on the CDF and the calibration images reconstructed from the calibration data, as will be described below.
- the dynamic range of magnitude images reconstructed from the calibration data is generally dominated by high intensity signal from fat tissues.
- high signal intensities from the fat tissues subtle streak artifacts can also be present in these magnitude images.
- These high signal intensities can be removed from the calibration images to provide for the later generated frequency map to be calculated accurately.
- the high intensity mask can be generated as follows. The intensities that retain ninety percent of the signal intensities are used to normalize the magnitude image. Signal intensities in this normalized image that are greater than or equal to one are then set to have zero values.
- the CDF can optionally be recomputed based on this normalized image to adjust the high intensity mask. For instance, the high intensity mask can be updated based on the recomputed CDF by setting intensities greater than ninety-nice percent to have zero values.
- the magnitude mask can be generated.
- the magnitude mask can be created by setting all non-zero intensities in the high intensity and low intensity signal masks to one, while all other values remain zero.
- a frequency map is generated at step 208, as mentioned above.
- the frequency map can be computed using the magnitude images from the individual spectral bins of the image reconstructed from the calibration data.
- the frequency map is then masked using the magnitude mask, as indicated at step 210.
- a histogram is computed, as indicated at step 212.
- a frequency cutoff that defines the spectral range is then calculated, as indicated at step 214.
- a forward and backward CDF are first computed from the histogram, The forward CDF is computed by integrating from the low frequencies to the high frequencies, and the backward CDF is computed by integrating from the high frequencies to the low frequencies.
- a frequency cutoff is then computed for each of the forward and backward CDF.
- the frequency cutoff can be selected as the cutoff value that retains ninety-nine percent of the frequencies in the map, The frequency cutoff value that has the larger absolute value can be chosen as the final frequency cutoff value.
- frequency cutoff values can then be used to compute the number (e.g., the minimum number) of spectral bins to be used for a 3D-MSI acquisition,
- the spectral range can be determined by computing the residual signal volume beyond a spectral cutoff.
- FIG. 3 illustrates a flowchart setting forth the steps of an example method of such an approach for determining the spectral range.
- an acceptable signal loss threshold is first selected, as indicated at step 302. This acceptable signal loss threshold value describes an acceptable level of missing volumetric tolerance around the metallic implant or device interface.
- a histogram is then computed from the estimated field map, as indicated at step 304.
- a symmetric number of voxels on either side of the histogram distribution summing to the volumetric tolerance defined by the selected signal loss threshold is then determined, as indicated at step 306.
- the range of frequencies between the frequency bin values for these two histogram bins is then computed and used to determine the spectral range, as indicated at step 308.
- These two frequency bin values define a cutoff frequency that demarcates the spectral range that can be used for 3D-MSI acquisitions.
- the signal energy or power in each spectral bin could be analyzed and used to determine the spectral range.
- the limits on that bin can also be determined.
- the number of spectral bins in the spectral range is set, as indicated at step 116.
- the spectral bins are associated with the frequencies at which spins are to be excited (i.e., the frequencies at which RF is transmitted) and at which data are to be collected (i.e., the frequencies at which the RF receiver will detect signals).
- the number of spectral bins can be calculated as, round 2 ⁇ ⁇ cutoff + 1 where f cutoff is the frequency cutoff defined by the determined spectral range.
- 3D-MSI data is then acquired at the selected spectral bins, as indicated at step 118.
- the 3D-MSI data are acquired using a MAVRIC acquisition technique. From the 3D-MSI data, images for each spectral bin are reconstructed, as indicated at step 120, and a composite image can be generated by combining the 3D-MSI images for each spectral bin, as indicated at step 122.
- a user interface can be updated to depict regions of valid saturation pulse placement.
- a 3D-MSI calibration scan has thus be described.
- These 3D-resolved MSI calibration images have a number of potential uses. For instance, through adaptive modulation of the acquired spectral bins, substantial acquisition efficiency can be gained in MAVRIC, MAVRIC SL, or other 3D-MSI scans where fewer bins are needed. This time savings can be substantial for smaller implants or for implants made of lower susceptibility metals such as titanium screws or oxidized zirconium joint replacements.
- the accuracy of the off-resonance range distribution determination is limited by the resolution of the calibration maps; however, it is contemplated that this spatial inaccuracy will not have significant impact on computing the numbers of spectral bins that contain clinically relevant amounts of signal.
- the calibration scheme described here is also applicable for other 3D-MSI techniques, including the SEMAC technique.
- the calibrated spatial off-resonance distribution could be utilized to optimize the number of slice encodes applied to each slice.
- the off-resonance distribution can be used to inform hexagonal sampling SEMAC methods.
- the MRI system 400 includes an operator workstation 402 that may include a display 404, one or more input devices 406 (e.g., a keyboard, a mouse), and a processor 408.
- the processor 408 may include a commercially available programmable machine running a commercially available operating system.
- the operator workstation 402 provides an operator interface that facilitates entering scan parameters into the MRI system 400.
- the operator workstation 402 may be coupled to different servers, including, for example, a pulse sequence server 410, a data acquisition server 412, a data processing server 414, and a data store server 416.
- the operator workstation 402 and the servers 410, 412, 414, and 416 may be connected via a communication system 440, which may include wired or wireless network connections.
- the pulse sequence server 410 functions in response to instructions provided by the operator workstation 402 to operate a gradient system 418 and a radiofrequency ("RF") system 420.
- Gradient waveforms for performing a prescribed scan are produced and applied to the gradient system 418, which then excites gradient coils in a gradient coil assembly 422 to produce the magnetic field gradients G x , G y , and G z that are used for spatially encoding magnetic resonance signals.
- the gradient coil assembly 422 forms part of a magnet assembly 424 that includes a polarizing magnet 426 and a whole-body RF coil 428.
- RF waveforms are applied by the RF system 420 to the RF coil 428, or a separate local coil to perform the prescribed magnetic resonance pulse sequence.
- Responsive magnetic resonance signals detected by the RF coil 428, or a separate local coil are received by the RF system 420.
- the responsive magnetic resonance signals may be amplified, demodulated, filtered, and digitized under direction of commands produced by the pulse sequence server 410.
- the RF system 420 includes an RF transmitter for producing a wide variety of RF pulses used in MRI pulse sequences.
- the RF transmitter is responsive to the prescribed scan and direction from the pulse sequence server 410 to produce RF pulses of the desired frequency, phase, and pulse amplitude waveform.
- the generated RF pulses may be applied to the whole-body RF coil 428 or to one or more local coils or coil arrays.
- the RF system 420 also includes one or more RF receiver channels.
- An RF receiver channel includes an RF preamplifier that amplifies the magnetic resonance signal received by the coil 428 to which it is connected, and a detector that detects and digitizes the I and Q quadrature components of the received magnetic resonance signal.
- the pulse sequence server 410 may receive patient data from a physiological acquisition controller 430.
- the physiological acquisition controller 430 may receive signals from a number of different sensors connected to the patient, including electrocardiograph ("ECG”) signals from electrodes, or respiratory signals from a respiratory bellows or other respiratory monitoring devices. These signals may be used by the pulse sequence server 410 to synchronize, or "gate,” the performance of the scan with the subject's heart beat or respiration.
- ECG electrocardiograph
- the pulse sequence server 410 may also connect to a scan room interface circuit 432 that receives signals from various sensors associated with the condition of the patient and the magnet system. Through the scan room interface circuit 432, a patient positioning system 434 can receive commands to move the patient to desired positions during the scan.
- the digitized magnetic resonance signal samples produced by the RF system 420 are received by the data acquisition server 412.
- the data acquisition server 412 operates in response to instructions downloaded from the operator workstation 402 to receive the real-time magnetic resonance data and provide buffer storage, so that data is not lost by data overrun. In some scans, the data acquisition server 412 passes the acquired magnetic resonance data to the data processing server 414. In scans that require information derived from acquired magnetic resonance data to control the further performance of the scan, the data acquisition server 412 may be programmed to produce such information and convey it to the pulse sequence server 410. For example, during pre-scans, magnetic resonance data may be acquired and used to calibrate the pulse sequence performed by the pulse sequence server 410.
- navigator signals may be acquired and used to adjust the operating parameters of the RF system 420 or the gradient system 418, or to control the view order in which k-space is sampled.
- the data acquisition server 412 may also process magnetic resonance signals used to detect the arrival of a contrast agent in a magnetic resonance angiography ("MRA") scan.
- MRA magnetic resonance angiography
- the data acquisition server 412 may acquire magnetic resonance data and processes it in real-time to produce information that is used to control the scan,
- the data processing server 414 receives magnetic resonance data from the data acquisition server 412 and processes the magnetic resonance data in accordance with instructions provided by the operator workstation 402. Such processing may include, for example, reconstructing two-dimensional or three-dimensional images by performing a Fourier transformation of raw k-space data, performing other image reconstruction algorithms (e.g., iterative or backprojection reconstruction algorithms), applying filters to raw k-space data or to reconstructed images, generating functional magnetic resonance images, or calculating motion or flow images.
- image reconstruction algorithms e.g., iterative or backprojection reconstruction algorithms
- images reconstructed by the data processing server 414 are conveyed back to the operator workstation 402 for storage.
- Real-time images may be stored in a data base memory cache, from which they may be output to operator display 402 or a display 436.
- Batch mode images or selected real time images may be stored in a host database on disc storage 438.
- the data processing server 414 may notify the data store server 416 on the operator workstation 402.
- the operator workstation 402 may be used by an operator to archive the images, produce films, or send the images via a network to other facilities,
- the MRI system 400 may also include one or more networked workstations 442.
- a networked workstation 442 may include a display 444, one or more input devices 446 (e.g., a keyboard, a mouse), and a processor 448.
- the networked workstation 442 may be located within the same facility as the operator workstation 402. or in a different facility, such as a different healthcare institution or clinic.
- the networked workstation 442 may gain remote access to the data processing server 414 or data store server 416 via the communication system 440. Accordingly, multiple networked workstations 442 may have access to the data processing server 414 and the data store server 416. In this manner, magnetic resonance data, reconstructed images, or other data may be exchanged between the data processing server 414 or the data store server 416 and the networked workstations 442, such that the data or images may be remotely processed by a networked workstation 442.
Landscapes
- Physics & Mathematics (AREA)
- Health & Medical Sciences (AREA)
- Life Sciences & Earth Sciences (AREA)
- Engineering & Computer Science (AREA)
- General Physics & Mathematics (AREA)
- Nuclear Medicine, Radiotherapy & Molecular Imaging (AREA)
- High Energy & Nuclear Physics (AREA)
- Radiology & Medical Imaging (AREA)
- Condensed Matter Physics & Semiconductors (AREA)
- General Health & Medical Sciences (AREA)
- Signal Processing (AREA)
- Animal Behavior & Ethology (AREA)
- Pathology (AREA)
- Surgery (AREA)
- Medical Informatics (AREA)
- Heart & Thoracic Surgery (AREA)
- Public Health (AREA)
- Veterinary Medicine (AREA)
- Biophysics (AREA)
- Molecular Biology (AREA)
- Geophysics (AREA)
- General Life Sciences & Earth Sciences (AREA)
- Biomedical Technology (AREA)
- Remote Sensing (AREA)
- Geology (AREA)
- Environmental & Geological Engineering (AREA)
- Manufacturing & Machinery (AREA)
- Magnetic Resonance Imaging Apparatus (AREA)
Description
- The field of the invention is systems and methods for magnetic resonance imaging ("MRI"). More particularly, the invention relates to systems and methods for MRI near metallic implants or devices.
- MRI soft-tissue contrast can add substantial diagnostic value when assessing the tissue envelope around metallic implants. For example, the U.S. Food and Drug Association ("FDA") issued a recommendation for using MRI in imaging assessments of recently recalled total hip replacements. Despite this inherent utility, magnetic susceptibility artifacts generated by implants have historically limited MRI's practical clinical application in assessments of instrumented joints. In response to this clinical need, Three-Dimensional Multi-Spectral Imaging ("3D-MSI") technology was developed by the MRI research community to reduce susceptibility artifacts due to implanted devices.
- One 3D-MSI technology is known as MAVRIC (Multi-Acquisition Variable-Resonance Image Combination). MAVRIC uses 3D fast spin echo ("FSE") pulse sequences specifically designed to minimize metallic artifacts around metallic prostheses.
- In order to the address the substantial magnetic susceptibilities of large metallic implants such as hip implants, MAVRIC and other 3D-MSI techniques are designed to address "worst-case-scenario" imaging problems. These techniques acquire sections around the metal implant at discrete Larmor frequency offsets that account for the field perturbations. The sections are then combined to generate an image of the tissue surrounding the metal implant. Typically, such techniques may use at least twenty different sections, referred to as "spectral bins" or "frequency bins" to create a single image. Capturing these bins can sometimes take as long as ten minutes. A patient must remain still during the duration of the acquisition, which, as the acquisition becomes longer, can lead to blurred images resulting from patient movement.
- There remains a need for a 3D-MSI technique that requires less scan time and, thus, reduces the risk for image blurring from subject motion. Methods for reducing the imaging time in MSI-techniques are e.g. disclosed in Smith MR et al.: Accelerating sequences in the presence of metal by exploiting the spatial distribution of off-resonance: Magnetic Resonance in Medicine, Vol. 72, No. 6, pages 1658-1667, 15 January 201 and
US 2014/043023 A1,13 February 2014 . Such a method would also have the benefit of increased patient comfort because of the reduced duration of time the patient is required to be in the MRI scanner. - The present invention overcomes the aforementioned drawbacks by providing methods for improved three-dimensional multi-spectral imaging ("MSI") using magnetic resonance imaging ("MRI"). In general, the 3D-MSI acquisition is improved using a calibration "pre-scan" where information from the calibration scan can be used to optimize the scanning and data collection of the 3D-MSI acquisition.
- It is an aspect of the invention to provide a computer-implemented method for determining magnetic resonance imaging ("MRI") scan parameters for a multi-spectral imaging ("MSI") scan as defined in claim 1.
- It is another aspect of the invention to provide a method for producing an image of a subject as defined in claim 2.
- The foregoing and other aspects and advantages of the invention will appear from the following description. In the description, reference is made to the accompanying drawings that form a part hereof, and in which there is shown by way of illustration a preferred embodiment of the invention. Such embodiment does not necessarily represent the full scope of the invention, however, and reference is made therefore to the claims which define the scope of the invention.
-
-
FIG. 1 is a flowchart setting forth the steps of an example method for calibrating a 3D-MSI acquisition; -
FIG. 2 is a flowchart setting forth the steps of an example method for determining a spectral range based on a cumulative distribution function computed from a field map; -
FIG. 3 is a flowchart setting forth the steps of an example method for determining a spectral range based on residual signal volume beyond a spectral cutoff; and -
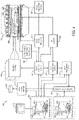
FIG. 4 is a block diagram of an example of a magnetic resonance imaging ("MRI") system. - Described here are systems and methods for performing a calibration "pre-scan" prior to acquiring data using a multi-spectral imaging ("MSI") acquisition, such that information from the calibration scan can be used to optimize the scanning and data collection during the remainder of the MSI scan. As a result, scan times and motion artifacts are reduced. In addition, image resolution can be increased, thereby improving image quality. As one example, the MSI acquisition can be a MAVRIC acquisition. The methods described here are advantageous not only for 3D-MSI acquisitions, but also for 2D-MSI acquisitions and, thus, can be implemented for both 2D and 3D acquisitions.
- In general, the calibration scan acquires information about the range and location of off-resonant spins, and can aid in optimizing the efficiency of MRI scanning when metallic implants are a factor. For example, the calibration data contains data acquired at a number of different resonance frequency offsets. The calibration data acquired with this initial "pre-scan," or calibration scan, can be used to automatically determine off-resonance frequency ranges. As one example, the method rapidly collects a 3D-MSI dataset and then analyzes the spectral information of that data in order to guide the MR acquisitions for the rest of the 3D-MSI scan. As a result, the number of spectral bins can be reduced, with a consequent reduction in scan time, without loss in image quality. For example, the number of spectral bins can be reduced from 24 bins to as few as 3-5 bins.
- The method described here provides additional benefits, including artifact reduction and workflow improvement. For instance, low-artifact imaging can be improved near indwelling metallic implants or other metallic devices. Workflow can also be improved because current metal artifact reduction technologies are "blind" to the type of implant presented, but there can be a significant difference between the artifacts generated by different implants. Currently, imaging sequences are designed for a worst-case scenario and perform the maximum amount of artifact correction. With the methods described here, however, the 3D-MSI scan can be tailored to the particular implant (e.g., by using the minimum number of spectral bins for a particular implant), thereby increasing efficiency of the scan.
- As an example, many existing 3D-MSI techniques are hard-coded for a worst-case scenario, such as the metallic implant or device being composed of stainless steel or cobalt-chromium. In many instances, however, implants and devices are composed of other materials that require less artifact reduction. The methods described here can guide what type of, and how much, artifact correction to provide.
- Referring now to
FIG. 1 , a flowchart is illustrated as setting forth the steps of an example method for calibrating a 3D-MSI acquisition. In general, the method includes collecting a calibration dataset and then analyzing the spectral information in that calibration dataset to guide the remainder of the 3D-MSI acquisition. - The method thus includes acquiring calibration data, as indicated at
step 102. In general, the calibration data can be acquired as a low-resolution, non-selective 3D-MSI dataset. As one example, the calibration data can be acquired using a rapid MAVRIC acquisition. As another example, the calibration data can be acquired using a selective MAVRIC acquisition, such as a MAVRIC SL acquisition. When using MAVRIC SL, or similar selective acquisition techniques, a linear B0 trend can be removed in the slab-selective dimension before additional processing is performed. In some examples, the calibration data can also be acquired using a two-dimensional acquisition when a 2D-MSI scan is planned, - Based on the calibration data, a field map, or off-resonance map, is computed, as indicated at
step 104. The field map contains information about off-resonance effects in the field-of-view imaged by the calibration data. As one example, these off-resonance effects can be caused by metallic objects, such as implants or devices, that may be present in the subject being imaged. Calibration images can also be reconstructed from the calibration data at this point. - A determination is then made at
decision block 106 whether 3D-MSI artifact reduction is needed based on the type of metallic implant or device present in the subject. This determination can be based, at least in part, on analysis of the field map. As an example, if there is not a significant amount of resonance frequency offset in the field map, then it may be determined that artifact reduction is not necessary. - If it is determined that artifact reduction is unnecessary, then the method proceeds by computing or otherwise providing the optimal settings (e.g., receiver bandwidth, number of averages) for a non-3D-MSI acquisition, as indicated at
step 108. Non-3D-MSI data is then acquired from the subject, as indicated atstep 110, from which images of the subject can be reconstructed, as indicated atstep 112. - If, however, analysis of the field map determines that artifact reduction using 3D-MSI techniques is necessary, or otherwise desirable, then the method proceeds by determining the spectral range to be used for a 3D-MSI acquisition, as indicated at
step 114. This spectral range is determined based on the field map generated from the calibration data. - As one example, the spectral range can be determined based on a cumulative distribution function ("CDF") computed from the field map. Referring now to
FIG. 2 , a flowchart is illustrated at setting forth the steps of an example method for determining a spectral range based on a CDF that is computed from the field map. This method begins by computing a CDF from the estimated field map, as indicated atstep 202. In general, the CDF can be computed by estimating a probability density function ("PDF") from the field map, and then computing the integral of the PDF. As one example, the PDF can be estimated as the histogram of the distribution of frequencies in the field map. - As generally indicated at
process block 204, as one example magnitude and frequency map masks are generated and used in the process of determining the spectral range. First, a magnitude mask is generated, as indicated atstep 206. Then, using the magnitude mask, a frequency map is generated, as indicated at step 208. As one example, the magnitude mask can be computed from a high intensity mask and a low intensity mask that are generated based on the CDF and the calibration images reconstructed from the calibration data, as will be described below. - The dynamic range of magnitude images reconstructed from the calibration data is generally dominated by high intensity signal from fat tissues. In addition to the high signal intensities from the fat tissues, subtle streak artifacts can also be present in these magnitude images. These high signal intensities can be removed from the calibration images to provide for the later generated frequency map to be calculated accurately.
- As one non-limiting example, the high intensity mask can be generated as follows. The intensities that retain ninety percent of the signal intensities are used to normalize the magnitude image. Signal intensities in this normalized image that are greater than or equal to one are then set to have zero values. The CDF can optionally be recomputed based on this normalized image to adjust the high intensity mask. For instance, the high intensity mask can be updated based on the recomputed CDF by setting intensities greater than ninety-nice percent to have zero values.
- Extremely low signal intensities in the magnitude image lead to high frequency streaks in the later generated frequency map, Thus, to reduce biases in the frequency map, these low signal intensities can be removed from the calibration images. As one non-limiting example of creating a low intensity mask, normalized intensities that are lower than three percent can be set to zero.
- Based on the high intensity and low intensity masks, the magnitude mask can be generated. For example, the magnitude mask can be created by setting all non-zero intensities in the high intensity and low intensity signal masks to one, while all other values remain zero.
- Using the magnitude mask, a frequency map is generated at step 208, as mentioned above. As one example, the frequency map can be computed using the magnitude images from the individual spectral bins of the image reconstructed from the calibration data. The frequency map is then masked using the magnitude mask, as indicated at
step 210. From the masked frequency map, a histogram is computed, as indicated atstep 212. - A frequency cutoff that defines the spectral range is then calculated, as indicated at
step 214. As one example, to account for an asymmetric histogram, a forward and backward CDF are first computed from the histogram, The forward CDF is computed by integrating from the low frequencies to the high frequencies, and the backward CDF is computed by integrating from the high frequencies to the low frequencies. A frequency cutoff is then computed for each of the forward and backward CDF. As one example, the frequency cutoff can be selected as the cutoff value that retains ninety-nine percent of the frequencies in the map, The frequency cutoff value that has the larger absolute value can be chosen as the final frequency cutoff value. In most instances, the final frequency cutoff value retains the sign of the selected cutoff value and the absolute value is just used as a check to select the final frequency cutoff value. As will be described below in more detail, frequency cutoff values can then be used to compute the number (e.g., the minimum number) of spectral bins to be used for a 3D-MSI acquisition, - Referring now to
FIG. 3 , as another example, the spectral range can be determined by computing the residual signal volume beyond a spectral cutoff.FIG. 3 illustrates a flowchart setting forth the steps of an example method of such an approach for determining the spectral range. - In this method, an acceptable signal loss threshold is first selected, as indicated at
step 302. This acceptable signal loss threshold value describes an acceptable level of missing volumetric tolerance around the metallic implant or device interface. A histogram is then computed from the estimated field map, as indicated atstep 304. - A symmetric number of voxels on either side of the histogram distribution summing to the volumetric tolerance defined by the selected signal loss threshold is then determined, as indicated at
step 306. the range of frequencies between the frequency bin values for these two histogram bins is then computed and used to determine the spectral range, as indicated atstep 308. These two frequency bin values define a cutoff frequency that demarcates the spectral range that can be used for 3D-MSI acquisitions. - It should be appreciated that additional methods for determining the desired spectral range beyond the two methods described above can also be implemented. For example, the signal energy or power in each spectral bin could be analyzed and used to determine the spectral range. When the energy or power drops below a pre-defined threshold in a given spectral bin, the limits on that bin can also be determined.
- Referring again to
FIG. 1 , after the spectral range is determined, the number of spectral bins in the spectral range is set, as indicated atstep 116. The spectral bins are associated with the frequencies at which spins are to be excited (i.e., the frequencies at which RF is transmitted) and at which data are to be collected (i.e., the frequencies at which the RF receiver will detect signals). As one example, the number of spectral bins can be calculated as,
where fcutoff is the frequency cutoff defined by the determined spectral range. 3D-MSI data is then acquired at the selected spectral bins, as indicated atstep 118. As one example, the 3D-MSI data are acquired using a MAVRIC acquisition technique, From the 3D-MSI data, images for each spectral bin are reconstructed, as indicated atstep 120, and a composite image can be generated by combining the 3D-MSI images for each spectral bin, as indicated at step 122. - Optionally, before the 3D-MSI data are acquired, a determination can be made whether spatial saturation pulses can be used for imaging the metallic implant or device. In this configuration, a user interface can be updated to depict regions of valid saturation pulse placement.
- A 3D-MSI calibration scan has thus be described. These 3D-resolved MSI calibration images have a number of potential uses. For instance, through adaptive modulation of the acquired spectral bins, substantial acquisition efficiency can be gained in MAVRIC, MAVRIC SL, or other 3D-MSI scans where fewer bins are needed. This time savings can be substantial for smaller implants or for implants made of lower susceptibility metals such as titanium screws or oxidized zirconium joint replacements.
- In general, the accuracy of the off-resonance range distribution determination is limited by the resolution of the calibration maps; however, it is contemplated that this spatial inaccuracy will not have significant impact on computing the numbers of spectral bins that contain clinically relevant amounts of signal.
- Although reference is made to MAVRIC acquisitions above, the calibration scheme described here is also applicable for other 3D-MSI techniques, including the SEMAC technique. For example, the calibrated spatial off-resonance distribution could be utilized to optimize the number of slice encodes applied to each slice. In addition, the off-resonance distribution can be used to inform hexagonal sampling SEMAC methods.
- Referring particularly now to
FIG. 4 , an example of a magnetic resonance imaging ("MRI")system 400 that can implement the methods described here is illustrated. TheMRI system 400 includes anoperator workstation 402 that may include adisplay 404, one or more input devices 406 (e.g., a keyboard, a mouse), and a processor 408. The processor 408 may include a commercially available programmable machine running a commercially available operating system. Theoperator workstation 402 provides an operator interface that facilitates entering scan parameters into theMRI system 400. Theoperator workstation 402 may be coupled to different servers, including, for example, apulse sequence server 410, adata acquisition server 412, adata processing server 414, and adata store server 416. Theoperator workstation 402 and theservers communication system 440, which may include wired or wireless network connections. - The
pulse sequence server 410 functions in response to instructions provided by theoperator workstation 402 to operate agradient system 418 and a radiofrequency ("RF")system 420. Gradient waveforms for performing a prescribed scan are produced and applied to thegradient system 418, which then excites gradient coils in a gradient coil assembly 422 to produce the magnetic field gradients Gx, Gy, and Gz that are used for spatially encoding magnetic resonance signals. The gradient coil assembly 422 forms part of amagnet assembly 424 that includes a polarizing magnet 426 and a whole-body RF coil 428. - RF waveforms are applied by the
RF system 420 to theRF coil 428, or a separate local coil to perform the prescribed magnetic resonance pulse sequence. - Responsive magnetic resonance signals detected by the
RF coil 428, or a separate local coil, are received by theRF system 420. The responsive magnetic resonance signals may be amplified, demodulated, filtered, and digitized under direction of commands produced by thepulse sequence server 410. TheRF system 420 includes an RF transmitter for producing a wide variety of RF pulses used in MRI pulse sequences. The RF transmitter is responsive to the prescribed scan and direction from thepulse sequence server 410 to produce RF pulses of the desired frequency, phase, and pulse amplitude waveform. The generated RF pulses may be applied to the whole-body RF coil 428 or to one or more local coils or coil arrays. - The
RF system 420 also includes one or more RF receiver channels. An RF receiver channel includes an RF preamplifier that amplifies the magnetic resonance signal received by thecoil 428 to which it is connected, and a detector that detects and digitizes the I and Q quadrature components of the received magnetic resonance signal. The magnitude of the received magnetic resonance signal may, therefore, be determined at a sampled point by the square root of the sum of the squares of the I and Q components:
and the phase of the received magnetic resonance signal may also be determined according to the following relationship:
- The
pulse sequence server 410 may receive patient data from aphysiological acquisition controller 430. By way of example, thephysiological acquisition controller 430 may receive signals from a number of different sensors connected to the patient, including electrocardiograph ("ECG") signals from electrodes, or respiratory signals from a respiratory bellows or other respiratory monitoring devices. These signals may be used by thepulse sequence server 410 to synchronize, or "gate," the performance of the scan with the subject's heart beat or respiration. - The
pulse sequence server 410 may also connect to a scanroom interface circuit 432 that receives signals from various sensors associated with the condition of the patient and the magnet system. Through the scanroom interface circuit 432, apatient positioning system 434 can receive commands to move the patient to desired positions during the scan. - The digitized magnetic resonance signal samples produced by the
RF system 420 are received by thedata acquisition server 412. Thedata acquisition server 412 operates in response to instructions downloaded from theoperator workstation 402 to receive the real-time magnetic resonance data and provide buffer storage, so that data is not lost by data overrun. In some scans, thedata acquisition server 412 passes the acquired magnetic resonance data to thedata processing server 414. In scans that require information derived from acquired magnetic resonance data to control the further performance of the scan, thedata acquisition server 412 may be programmed to produce such information and convey it to thepulse sequence server 410. For example, during pre-scans, magnetic resonance data may be acquired and used to calibrate the pulse sequence performed by thepulse sequence server 410. As another example, navigator signals may be acquired and used to adjust the operating parameters of theRF system 420 or thegradient system 418, or to control the view order in which k-space is sampled. In still another example, thedata acquisition server 412 may also process magnetic resonance signals used to detect the arrival of a contrast agent in a magnetic resonance angiography ("MRA") scan. For example, thedata acquisition server 412 may acquire magnetic resonance data and processes it in real-time to produce information that is used to control the scan, - The
data processing server 414 receives magnetic resonance data from thedata acquisition server 412 and processes the magnetic resonance data in accordance with instructions provided by theoperator workstation 402. Such processing may include, for example, reconstructing two-dimensional or three-dimensional images by performing a Fourier transformation of raw k-space data, performing other image reconstruction algorithms (e.g., iterative or backprojection reconstruction algorithms), applying filters to raw k-space data or to reconstructed images, generating functional magnetic resonance images, or calculating motion or flow images. - images reconstructed by the
data processing server 414 are conveyed back to theoperator workstation 402 for storage. Real-time images may be stored in a data base memory cache, from which they may be output tooperator display 402 or adisplay 436. Batch mode images or selected real time images may be stored in a host database ondisc storage 438. When such images have been reconstructed and transferred to storage, thedata processing server 414 may notify thedata store server 416 on theoperator workstation 402. Theoperator workstation 402 may be used by an operator to archive the images, produce films, or send the images via a network to other facilities, - The
MRI system 400 may also include one or morenetworked workstations 442. For example, anetworked workstation 442 may include a display 444, one or more input devices 446 (e.g., a keyboard, a mouse), and aprocessor 448. Thenetworked workstation 442 may be located within the same facility as theoperator workstation 402. or in a different facility, such as a different healthcare institution or clinic. - The
networked workstation 442 may gain remote access to thedata processing server 414 ordata store server 416 via thecommunication system 440. Accordingly, multiplenetworked workstations 442 may have access to thedata processing server 414 and thedata store server 416. In this manner, magnetic resonance data, reconstructed images, or other data may be exchanged between thedata processing server 414 or thedata store server 416 and thenetworked workstations 442, such that the data or images may be remotely processed by anetworked workstation 442. - The present invention has been described in terms of one or more preferred embodiments, and it should be appreciated that many equivalents, alternatives, variations, and modifications, aside from those expressly stated, are possible and within the scope of the invention, as defined by the appended claims.
Claims (17)
- A computer-implemented method for determining magnetic resonance imaging ("MRI") scan parameters for a multi-spectral imaging ("MSI") scan, the steps of the method comprising:(a) providing to a computer system, calibration data acquired with an MRI system from a field -of-view of a subject, wherein the calibration data contains a plurality of different data sets each acquired at a different resonance frequency offset, the data sets corresponding to a plurality of spectral bins, each spectral bin corresponding to a section acquired at a different discrete resonance frequency offset;(b) computing with the computer system, a field map from the calibration data, the field map containing information about off-resonance effects in the field-of-view;(c) determining with the computer system, a spectral range from the computed field map, wherein the spectral range is tailored to the frequency offset distribution within the field of view, and wherein the spectral range defines a range of off-resonance frequency values to be used in the MSI scan of said subject;(d) setting with the computer system, a number of spectral bins based on the determined spectral range; and(e) generating with the computer system, scan parameters based on the number of spectral bins and the determined spectral range, the scan parameters defining the spectral bins at which spins are to be excited and data are to be acquired with an MRI system performing the MSI scan of said subject.
- A method for producing an image of a subject using a magnetic resonance imaging (MRI) system which comprises a computer system which is configured to carry out the method of claim 1 the steps of the method comprising:(a) acquiring calibration data from a field of view of the subject using the MRI system, wherein the calibration data contains a plurality of different data sets each acquired at a different resonance frequency offset, the data sets corresponding to a plurality of spectral bins, each spectral bin corresponding to a section acquired at a different discrete resonance frequency offset;(b) computing with the computer system, a field map from the calibration data, the field map containing information about off-resonance effects in the field-of-view;(c) determining with the computer system, a spectral range from the field map, wherein the spectral range is tailored to the frequency offset distribution within the field of view, and wherein the spectral range defines a range of off-resonance frequency values to be used in an MSI scan of the subject;(d) setting with the computer system, a number of spectral bins based on the determined spectral range;(e) acquiring data from the subject by performing the MSI scan using the MRI system, the data being acquired at the number of spectral bins set by the computer system and with the scan parameters generated with the computer system according to the method of claim 1(f) reconstructing with the computer system, an image of the subject for each spectral bin from the acquired data; and(g) producing with the computer system, a desired image of the subject by combining the images reconstructed in step (f).
- The method as recited in claim 1, wherein step (a) includes acquiring the calibration data with the MRI system.
- The method as recited in claim 1 or 2, wherein the calibration data provided in step (a) have a lower spatial resolution than the data to be acquired with the MRI system.
- The method as recited in claim 1 or 2, wherein step (c) includes generating a frequency map from the field map using the computer system; calculating with the computer system, a frequency cutoff value from a frequency map; and using the frequency cutoff value to determine the spectral range, wherein the computer system calculates the frequency cutoff value by:computing a histogram from the frequency map;calculating a forward cumulative distribution function (CDF) by integrating the histogram from low frequencies to high frequencies;calculating a backward CDF by integrating the histogram from high frequencies to low frequencies;determining a first frequency cutoff value using the forward CDF to identify a frequency value that retains a selected amount of signal intensities in the frequency map;determining a second frequency cutoff value using the backward CDF to identify a frequency value that retains the selected amount of signal intensities in the frequency map; andselecting the frequency cutoff value based on a value of the first frequency cutoff value and a value of the second frequency cutoff value.
- The method as recited in claim 5, wherein the frequency cutoff value is selected as a signed value of the one of the first frequency cutoff value and second frequency cutoff value having a greater absolute value.
- The method as recited in claim 5, wherein the computer system computes a magnitude mask from the calibration data and masks the frequency map with the magnitude mask before calculating the frequency cutoff value.
- The method as recited in claim 7, wherein the magnitude mask includes a high-intensity mask that masks high signal intensities and a low-intensity mask that masks low signal intensities.
- The method as recited in claim 5, wherein the computer system generates the frequency map from magnitude images reconstructed from the calibration data.
- The method as recited in claim 1 or 2, wherein the subject comprises a metallic object within the field of view and wherein step (c) includes calculating with the computer system, a frequency cutoff value based on a signal loss threshold that defines an acceptable level of signal loss in a volume around the metallic object.
- The method as recited in claim 10, wherein the computer system calculates the frequency cutoff by:computing a histogram from the field map;determining a symmetric number of voxels on either side of the histogram that sum to a volumetric tolerance defined by the signal loss threshold; andcomputing the frequency cutoff value based on the determined symmetric number of voxels.
- The method as recited in claim 5 or 10, wherein step (d) includes setting the number of spectral bins as an integer closest to 2 · (fcutoff +1), wherein fcutoff is the frequency cutoff value.
- The method as recited in claim 1 or 2, wherein the off-resonance effects in the field-of-view are caused by a metallic object in the field-of-view, and wherein the metallic object is at least one of a metallic implant or a metallic device.
- The method as recited in claim 1 or 2, wherein the calibration data are three-dimensional calibration data.
- The method as recited in claim 14, wherein the MSI scan is a three-dimensional MSI scan.
- The method as recited in claim 1 or 2, wherein the calibration data are two-dimensional calibration data.
- The method as recited in claim 16, wherein the MSI scan is a two-dimensional MSI scan.
Applications Claiming Priority (2)
| Application Number | Priority Date | Filing Date | Title |
|---|---|---|---|
| US201562162001P | 2015-05-15 | 2015-05-15 | |
| PCT/US2016/032383 WO2016187014A1 (en) | 2015-05-15 | 2016-05-13 | Systems and methods for calibrated multi-spectral magnetic resonance imaging |
Publications (3)
| Publication Number | Publication Date |
|---|---|
| EP3295204A1 EP3295204A1 (en) | 2018-03-21 |
| EP3295204A4 EP3295204A4 (en) | 2019-01-30 |
| EP3295204B1 true EP3295204B1 (en) | 2022-11-02 |
Family
ID=57320294
Family Applications (1)
| Application Number | Title | Priority Date | Filing Date |
|---|---|---|---|
| EP16797010.2A Active EP3295204B1 (en) | 2015-05-15 | 2016-05-13 | Systems and methods for calibrated multi-spectral magnetic resonance imaging |
Country Status (3)
| Country | Link |
|---|---|
| US (1) | US10718838B2 (en) |
| EP (1) | EP3295204B1 (en) |
| WO (1) | WO2016187014A1 (en) |
Families Citing this family (7)
| Publication number | Priority date | Publication date | Assignee | Title |
|---|---|---|---|---|
| US10638949B2 (en) * | 2016-04-22 | 2020-05-05 | New York Society For The Ruptured And Crippled Maintaining The Hospital For Special Surgery | System and apparatus for assessing metallosis using magnetic resonance imaging |
| US10884091B2 (en) | 2016-05-05 | 2021-01-05 | The Medical College Of Wisconsin, Inc. | Voxelwise spectral profile modeling for use in multispectral magnetic resonance imaging |
| CN112336332B (en) * | 2019-08-09 | 2024-11-29 | 通用电气精准医疗有限责任公司 | Magnetic resonance imaging scanning method and magnetic resonance imaging system |
| DE112022001182T5 (en) * | 2021-02-25 | 2023-12-21 | National University Corporation Kumamoto University | IMAGE PROCESSING METHOD, PROGRAM AND IMAGE PROCESSING DEVICE |
| DE102022207316A1 (en) * | 2022-07-18 | 2024-01-18 | Siemens Healthcare Gmbh | Computer-implemented method for evaluating an image generation process in magnetic resonance imaging, magnetic resonance device, computer program and electronically readable data carrier |
| EP4325236B1 (en) | 2022-08-17 | 2025-07-23 | Siemens Healthineers AG | A method for carrying out a magnetic resonance imaging examination of an anatomic region of a subject |
| EP4528304A1 (en) * | 2023-09-25 | 2025-03-26 | Siemens Healthineers AG | Dental magnetic resonance imaging in the presence of metallic materials |
Family Cites Families (23)
| Publication number | Priority date | Publication date | Assignee | Title |
|---|---|---|---|---|
| US7187169B2 (en) * | 2004-11-03 | 2007-03-06 | The Regents Of The University Of California | NMR and MRI apparatus and method |
| US7831075B2 (en) * | 2005-10-20 | 2010-11-09 | Case Western Reserve University | Imaging system |
| US7511492B2 (en) | 2006-02-21 | 2009-03-31 | Beth Israel Deaconess Medical Center, Inc. | Magnetic resonance imaging and radio frequency impedance mapping methods and apparatus |
| US8421459B2 (en) * | 2008-01-18 | 2013-04-16 | General Electric Company | System and method for reducing blurring artifacts in multi-spectral MR imaging near metal |
| US7928729B2 (en) * | 2008-08-07 | 2011-04-19 | The Board Of Trustees Of The Leland Stanford Junior University | Distortion-free magnetic resonance imaging near metallic implants |
| EP2523604B1 (en) * | 2010-01-13 | 2016-03-30 | FEI Company | A computed tomography imaging process and system |
| US8731261B2 (en) | 2010-02-23 | 2014-05-20 | Loma Linda University | Method of analyzing a medical image |
| US8482279B2 (en) * | 2010-03-31 | 2013-07-09 | General Electric Company | System and method of parallel imaging for magnetic resonance imaging near metallic implants |
| US8422756B2 (en) | 2010-04-27 | 2013-04-16 | Magnetic Resonance Innovations, Inc. | Method of generating nuclear magnetic resonance images using susceptibility weighted imaging and susceptibility mapping (SWIM) |
| JP2011230491A (en) * | 2010-04-30 | 2011-11-17 | Canon Inc | Image processing apparatus, image processing method, printing system, and program |
| CN103238082B (en) | 2010-12-02 | 2015-07-15 | 皇家飞利浦电子股份有限公司 | MR Imaging Using Multipoint Dixon Technique and Low Resolution Calibration |
| EP2500742A1 (en) * | 2011-03-17 | 2012-09-19 | Koninklijke Philips Electronics N.V. | Restriction of the imaging region for MRI in an inhomogeneous magnetic field |
| JP5931406B2 (en) * | 2011-11-09 | 2016-06-08 | 株式会社東芝 | Magnetic resonance imaging system |
| US9678190B2 (en) * | 2012-04-06 | 2017-06-13 | General Electric Company | System and method for generating MR phase contrast images near metal |
| US8868153B2 (en) * | 2012-04-19 | 2014-10-21 | General Electric Company | Image correction using multichannel blind deconvolution with homomorphic filtering |
| US9316711B2 (en) * | 2012-08-07 | 2016-04-19 | Wisconsin Alumni Research Foundation | System and method for accelerated magnetic resonance imaging using spectral sensitivity |
| US10649053B2 (en) | 2012-11-02 | 2020-05-12 | The Regents Of The University Of California | Cardiac late gadolinium enhancement MRI for patients with implanted cardiac devices |
| US9008399B2 (en) * | 2013-01-28 | 2015-04-14 | Wisconsin Alumni Research Foundation | System and method for joint reconstruction of spatial and spectral imaging data |
| US9269127B2 (en) * | 2013-01-31 | 2016-02-23 | Ohio State Innovation Foundation | De-noising of real-time dynamic magnetic resonance images by the combined application of karhunen-loeve transform (KLT) and wavelet filtering |
| US8995738B2 (en) | 2013-02-18 | 2015-03-31 | Wisconsin Alumni Research Foundation | System and method for magnetic resonance imaging parametric mapping using confidence maps |
| DE102014206917B3 (en) * | 2014-04-10 | 2015-09-03 | Siemens Aktiengesellschaft | Reduction of artifacts in MR images due to susceptibility jumps by replacing raw data from measurements with additional dephasing of the spins |
| US10061007B2 (en) * | 2014-06-27 | 2018-08-28 | General Electric Company | Method, apparatus, and article for frequency-overlapped 3-D multispectral magnetic resonance images |
| US10369385B2 (en) * | 2015-04-14 | 2019-08-06 | The Board Of Trustees Of The Leland Stanford Junior University | Quantitative MRI measurements near metal objects |
-
2016
- 2016-05-13 EP EP16797010.2A patent/EP3295204B1/en active Active
- 2016-05-13 US US15/573,945 patent/US10718838B2/en active Active
- 2016-05-13 WO PCT/US2016/032383 patent/WO2016187014A1/en not_active Ceased
Also Published As
| Publication number | Publication date |
|---|---|
| EP3295204A4 (en) | 2019-01-30 |
| US10718838B2 (en) | 2020-07-21 |
| WO2016187014A1 (en) | 2016-11-24 |
| US20180292491A1 (en) | 2018-10-11 |
| EP3295204A1 (en) | 2018-03-21 |
Similar Documents
| Publication | Publication Date | Title |
|---|---|---|
| US10718838B2 (en) | Systems and methods for calibrated multi-spectral magnetic resonance imaging | |
| US8655038B2 (en) | Method and assembly for correcting a relaxation map for medical imaging applications | |
| US9271661B2 (en) | Method for free-breathing magnetic resonance imaging using iterative image-based respiratory motion correction | |
| EP3295200B1 (en) | Systems and methods for diffusion-weighted multi-spectral magnetic resonance imaging | |
| US8975892B2 (en) | Method of optimizing magnetic resonance image contrast with MRI relaxation time scanning parameters correlated to age of a subject | |
| EP3131458B1 (en) | System and software module of improved multiple-phase dynamic contrast-enhanced magnetic resonance imaging | |
| CN105143906B (en) | The anti-MR imagings of metal | |
| US10884091B2 (en) | Voxelwise spectral profile modeling for use in multispectral magnetic resonance imaging | |
| CN101647698B (en) | Magnetic resonance method and apparatus for generating a perfusion image | |
| US9041395B2 (en) | MRI method of calculating and generating spatially-tailored parallel radio frequency saturation fields | |
| US10908248B2 (en) | Systems and methods for slice dithered enhanced resolution simultaneous multislice magnetic resonance imaging | |
| EP3542175A1 (en) | System and method for proton density mapping and receiver bias correction using magnetic resonance fingerprinting (mrf) | |
| US10362961B2 (en) | System and method for neutral contrast magnetic resonance imaging of calcifications | |
| EP4339879A1 (en) | Anatomy masking for mri | |
| US10401459B2 (en) | Systems and methods for imaging vascular calcifications with magnetic resonance imaging | |
| WO2015164701A1 (en) | Systems and methods for fast multi-contrast magnetic resonance imaging | |
| US10545209B2 (en) | System and method for acquiring both T2*-weighted and T1-weighted data in a single acquisition using a single dose of contrast agent | |
| US10420484B2 (en) | System and method for magnetic resonance imaging with an adaptive gating window having constant gating efficiency | |
| US20250283963A1 (en) | Multi-Spectral Susceptibility-Weighted Magnetic Resonance Imaging | |
| US20250341600A1 (en) | Multispectral magnetic resonance imaging enhancement using spectral acquisition redundancy | |
| US11497412B2 (en) | Combined oxygen utilization, strain, and anatomic imaging with magnetic resonance imaging |
Legal Events
| Date | Code | Title | Description |
|---|---|---|---|
| STAA | Information on the status of an ep patent application or granted ep patent |
Free format text: STATUS: THE INTERNATIONAL PUBLICATION HAS BEEN MADE |
|
| PUAI | Public reference made under article 153(3) epc to a published international application that has entered the european phase |
Free format text: ORIGINAL CODE: 0009012 |
|
| STAA | Information on the status of an ep patent application or granted ep patent |
Free format text: STATUS: REQUEST FOR EXAMINATION WAS MADE |
|
| 17P | Request for examination filed |
Effective date: 20171215 |
|
| AK | Designated contracting states |
Kind code of ref document: A1 Designated state(s): AL AT BE BG CH CY CZ DE DK EE ES FI FR GB GR HR HU IE IS IT LI LT LU LV MC MK MT NL NO PL PT RO RS SE SI SK SM TR |
|
| AX | Request for extension of the european patent |
Extension state: BA ME |
|
| DAV | Request for validation of the european patent (deleted) | ||
| DAX | Request for extension of the european patent (deleted) | ||
| A4 | Supplementary search report drawn up and despatched |
Effective date: 20190107 |
|
| RIC1 | Information provided on ipc code assigned before grant |
Ipc: A61B 5/055 20060101ALI20181221BHEP Ipc: G01R 33/56 20060101ALI20181221BHEP Ipc: G01R 33/54 20060101ALI20181221BHEP Ipc: G01R 33/24 20060101ALI20181221BHEP Ipc: G01R 33/565 20060101AFI20181221BHEP Ipc: G01R 33/44 20060101ALI20181221BHEP Ipc: G01V 13/00 20060101ALI20181221BHEP Ipc: G01R 33/20 20060101ALI20181221BHEP Ipc: G01V 3/14 20060101ALI20181221BHEP Ipc: A61B 5/00 20060101ALI20181221BHEP Ipc: G01R 33/58 20060101ALI20181221BHEP |
|
| GRAP | Despatch of communication of intention to grant a patent |
Free format text: ORIGINAL CODE: EPIDOSNIGR1 |
|
| STAA | Information on the status of an ep patent application or granted ep patent |
Free format text: STATUS: GRANT OF PATENT IS INTENDED |
|
| INTG | Intention to grant announced |
Effective date: 20220523 |
|
| GRAS | Grant fee paid |
Free format text: ORIGINAL CODE: EPIDOSNIGR3 |
|
| GRAA | (expected) grant |
Free format text: ORIGINAL CODE: 0009210 |
|
| STAA | Information on the status of an ep patent application or granted ep patent |
Free format text: STATUS: THE PATENT HAS BEEN GRANTED |
|
| AK | Designated contracting states |
Kind code of ref document: B1 Designated state(s): AL AT BE BG CH CY CZ DE DK EE ES FI FR GB GR HR HU IE IS IT LI LT LU LV MC MK MT NL NO PL PT RO RS SE SI SK SM TR |
|
| REG | Reference to a national code |
Ref country code: GB Ref legal event code: FG4D |
|
| REG | Reference to a national code |
Ref country code: CH Ref legal event code: EP Ref country code: AT Ref legal event code: REF Ref document number: 1529132 Country of ref document: AT Kind code of ref document: T Effective date: 20221115 |
|
| REG | Reference to a national code |
Ref country code: DE Ref legal event code: R096 Ref document number: 602016076080 Country of ref document: DE |
|
| REG | Reference to a national code |
Ref country code: IE Ref legal event code: FG4D |
|
| REG | Reference to a national code |
Ref country code: NL Ref legal event code: FP |
|
| REG | Reference to a national code |
Ref country code: LT Ref legal event code: MG9D |
|
| REG | Reference to a national code |
Ref country code: AT Ref legal event code: MK05 Ref document number: 1529132 Country of ref document: AT Kind code of ref document: T Effective date: 20221102 |
|
| PG25 | Lapsed in a contracting state [announced via postgrant information from national office to epo] |
Ref country code: SE Free format text: LAPSE BECAUSE OF FAILURE TO SUBMIT A TRANSLATION OF THE DESCRIPTION OR TO PAY THE FEE WITHIN THE PRESCRIBED TIME-LIMIT Effective date: 20221102 Ref country code: PT Free format text: LAPSE BECAUSE OF FAILURE TO SUBMIT A TRANSLATION OF THE DESCRIPTION OR TO PAY THE FEE WITHIN THE PRESCRIBED TIME-LIMIT Effective date: 20230302 Ref country code: NO Free format text: LAPSE BECAUSE OF FAILURE TO SUBMIT A TRANSLATION OF THE DESCRIPTION OR TO PAY THE FEE WITHIN THE PRESCRIBED TIME-LIMIT Effective date: 20230202 Ref country code: LT Free format text: LAPSE BECAUSE OF FAILURE TO SUBMIT A TRANSLATION OF THE DESCRIPTION OR TO PAY THE FEE WITHIN THE PRESCRIBED TIME-LIMIT Effective date: 20221102 Ref country code: FI Free format text: LAPSE BECAUSE OF FAILURE TO SUBMIT A TRANSLATION OF THE DESCRIPTION OR TO PAY THE FEE WITHIN THE PRESCRIBED TIME-LIMIT Effective date: 20221102 Ref country code: ES Free format text: LAPSE BECAUSE OF FAILURE TO SUBMIT A TRANSLATION OF THE DESCRIPTION OR TO PAY THE FEE WITHIN THE PRESCRIBED TIME-LIMIT Effective date: 20221102 Ref country code: AT Free format text: LAPSE BECAUSE OF FAILURE TO SUBMIT A TRANSLATION OF THE DESCRIPTION OR TO PAY THE FEE WITHIN THE PRESCRIBED TIME-LIMIT Effective date: 20221102 |
|
| PG25 | Lapsed in a contracting state [announced via postgrant information from national office to epo] |
Ref country code: RS Free format text: LAPSE BECAUSE OF FAILURE TO SUBMIT A TRANSLATION OF THE DESCRIPTION OR TO PAY THE FEE WITHIN THE PRESCRIBED TIME-LIMIT Effective date: 20221102 Ref country code: PL Free format text: LAPSE BECAUSE OF FAILURE TO SUBMIT A TRANSLATION OF THE DESCRIPTION OR TO PAY THE FEE WITHIN THE PRESCRIBED TIME-LIMIT Effective date: 20221102 Ref country code: LV Free format text: LAPSE BECAUSE OF FAILURE TO SUBMIT A TRANSLATION OF THE DESCRIPTION OR TO PAY THE FEE WITHIN THE PRESCRIBED TIME-LIMIT Effective date: 20221102 Ref country code: IS Free format text: LAPSE BECAUSE OF FAILURE TO SUBMIT A TRANSLATION OF THE DESCRIPTION OR TO PAY THE FEE WITHIN THE PRESCRIBED TIME-LIMIT Effective date: 20230302 Ref country code: HR Free format text: LAPSE BECAUSE OF FAILURE TO SUBMIT A TRANSLATION OF THE DESCRIPTION OR TO PAY THE FEE WITHIN THE PRESCRIBED TIME-LIMIT Effective date: 20221102 Ref country code: GR Free format text: LAPSE BECAUSE OF FAILURE TO SUBMIT A TRANSLATION OF THE DESCRIPTION OR TO PAY THE FEE WITHIN THE PRESCRIBED TIME-LIMIT Effective date: 20230203 |
|
| P01 | Opt-out of the competence of the unified patent court (upc) registered |
Effective date: 20230528 |
|
| PG25 | Lapsed in a contracting state [announced via postgrant information from national office to epo] |
Ref country code: SM Free format text: LAPSE BECAUSE OF FAILURE TO SUBMIT A TRANSLATION OF THE DESCRIPTION OR TO PAY THE FEE WITHIN THE PRESCRIBED TIME-LIMIT Effective date: 20221102 Ref country code: RO Free format text: LAPSE BECAUSE OF FAILURE TO SUBMIT A TRANSLATION OF THE DESCRIPTION OR TO PAY THE FEE WITHIN THE PRESCRIBED TIME-LIMIT Effective date: 20221102 Ref country code: EE Free format text: LAPSE BECAUSE OF FAILURE TO SUBMIT A TRANSLATION OF THE DESCRIPTION OR TO PAY THE FEE WITHIN THE PRESCRIBED TIME-LIMIT Effective date: 20221102 Ref country code: DK Free format text: LAPSE BECAUSE OF FAILURE TO SUBMIT A TRANSLATION OF THE DESCRIPTION OR TO PAY THE FEE WITHIN THE PRESCRIBED TIME-LIMIT Effective date: 20221102 Ref country code: CZ Free format text: LAPSE BECAUSE OF FAILURE TO SUBMIT A TRANSLATION OF THE DESCRIPTION OR TO PAY THE FEE WITHIN THE PRESCRIBED TIME-LIMIT Effective date: 20221102 |
|
| REG | Reference to a national code |
Ref country code: DE Ref legal event code: R097 Ref document number: 602016076080 Country of ref document: DE |
|
| PG25 | Lapsed in a contracting state [announced via postgrant information from national office to epo] |
Ref country code: SK Free format text: LAPSE BECAUSE OF FAILURE TO SUBMIT A TRANSLATION OF THE DESCRIPTION OR TO PAY THE FEE WITHIN THE PRESCRIBED TIME-LIMIT Effective date: 20221102 Ref country code: AL Free format text: LAPSE BECAUSE OF FAILURE TO SUBMIT A TRANSLATION OF THE DESCRIPTION OR TO PAY THE FEE WITHIN THE PRESCRIBED TIME-LIMIT Effective date: 20221102 |
|
| PLBE | No opposition filed within time limit |
Free format text: ORIGINAL CODE: 0009261 |
|
| STAA | Information on the status of an ep patent application or granted ep patent |
Free format text: STATUS: NO OPPOSITION FILED WITHIN TIME LIMIT |
|
| 26N | No opposition filed |
Effective date: 20230803 |
|
| PG25 | Lapsed in a contracting state [announced via postgrant information from national office to epo] |
Ref country code: SI Free format text: LAPSE BECAUSE OF FAILURE TO SUBMIT A TRANSLATION OF THE DESCRIPTION OR TO PAY THE FEE WITHIN THE PRESCRIBED TIME-LIMIT Effective date: 20221102 |
|
| REG | Reference to a national code |
Ref country code: CH Ref legal event code: PL |
|
| PG25 | Lapsed in a contracting state [announced via postgrant information from national office to epo] |
Ref country code: MC Free format text: LAPSE BECAUSE OF FAILURE TO SUBMIT A TRANSLATION OF THE DESCRIPTION OR TO PAY THE FEE WITHIN THE PRESCRIBED TIME-LIMIT Effective date: 20221102 |
|
| REG | Reference to a national code |
Ref country code: BE Ref legal event code: MM Effective date: 20230531 |
|
| PG25 | Lapsed in a contracting state [announced via postgrant information from national office to epo] |
Ref country code: MC Free format text: LAPSE BECAUSE OF FAILURE TO SUBMIT A TRANSLATION OF THE DESCRIPTION OR TO PAY THE FEE WITHIN THE PRESCRIBED TIME-LIMIT Effective date: 20221102 Ref country code: LU Free format text: LAPSE BECAUSE OF NON-PAYMENT OF DUE FEES Effective date: 20230513 Ref country code: LI Free format text: LAPSE BECAUSE OF NON-PAYMENT OF DUE FEES Effective date: 20230531 Ref country code: CH Free format text: LAPSE BECAUSE OF NON-PAYMENT OF DUE FEES Effective date: 20230531 |
|
| REG | Reference to a national code |
Ref country code: IE Ref legal event code: MM4A |
|
| PG25 | Lapsed in a contracting state [announced via postgrant information from national office to epo] |
Ref country code: IE Free format text: LAPSE BECAUSE OF NON-PAYMENT OF DUE FEES Effective date: 20230513 |
|
| PG25 | Lapsed in a contracting state [announced via postgrant information from national office to epo] |
Ref country code: IE Free format text: LAPSE BECAUSE OF NON-PAYMENT OF DUE FEES Effective date: 20230513 |
|
| PG25 | Lapsed in a contracting state [announced via postgrant information from national office to epo] |
Ref country code: IT Free format text: LAPSE BECAUSE OF FAILURE TO SUBMIT A TRANSLATION OF THE DESCRIPTION OR TO PAY THE FEE WITHIN THE PRESCRIBED TIME-LIMIT Effective date: 20221102 Ref country code: FR Free format text: LAPSE BECAUSE OF NON-PAYMENT OF DUE FEES Effective date: 20230531 Ref country code: BE Free format text: LAPSE BECAUSE OF NON-PAYMENT OF DUE FEES Effective date: 20230531 |
|
| PG25 | Lapsed in a contracting state [announced via postgrant information from national office to epo] |
Ref country code: BG Free format text: LAPSE BECAUSE OF FAILURE TO SUBMIT A TRANSLATION OF THE DESCRIPTION OR TO PAY THE FEE WITHIN THE PRESCRIBED TIME-LIMIT Effective date: 20221102 |
|
| PG25 | Lapsed in a contracting state [announced via postgrant information from national office to epo] |
Ref country code: BG Free format text: LAPSE BECAUSE OF FAILURE TO SUBMIT A TRANSLATION OF THE DESCRIPTION OR TO PAY THE FEE WITHIN THE PRESCRIBED TIME-LIMIT Effective date: 20221102 |
|
| PG25 | Lapsed in a contracting state [announced via postgrant information from national office to epo] |
Ref country code: CY Free format text: LAPSE BECAUSE OF FAILURE TO SUBMIT A TRANSLATION OF THE DESCRIPTION OR TO PAY THE FEE WITHIN THE PRESCRIBED TIME-LIMIT; INVALID AB INITIO Effective date: 20160513 |
|
| PG25 | Lapsed in a contracting state [announced via postgrant information from national office to epo] |
Ref country code: HU Free format text: LAPSE BECAUSE OF FAILURE TO SUBMIT A TRANSLATION OF THE DESCRIPTION OR TO PAY THE FEE WITHIN THE PRESCRIBED TIME-LIMIT; INVALID AB INITIO Effective date: 20160513 |
|
| PG25 | Lapsed in a contracting state [announced via postgrant information from national office to epo] |
Ref country code: TR Free format text: LAPSE BECAUSE OF FAILURE TO SUBMIT A TRANSLATION OF THE DESCRIPTION OR TO PAY THE FEE WITHIN THE PRESCRIBED TIME-LIMIT Effective date: 20221102 |
|
| PGFP | Annual fee paid to national office [announced via postgrant information from national office to epo] |
Ref country code: NL Payment date: 20260514 Year of fee payment: 11 |
|
| PGFP | Annual fee paid to national office [announced via postgrant information from national office to epo] |
Ref country code: GB Payment date: 20260511 Year of fee payment: 11 |
|
| PGFP | Annual fee paid to national office [announced via postgrant information from national office to epo] |
Ref country code: DE Payment date: 20260506 Year of fee payment: 11 |