EP3285252B1 - Technique for color profiling of a display device - Google Patents
Technique for color profiling of a display device Download PDFInfo
- Publication number
- EP3285252B1 EP3285252B1 EP16001812.3A EP16001812A EP3285252B1 EP 3285252 B1 EP3285252 B1 EP 3285252B1 EP 16001812 A EP16001812 A EP 16001812A EP 3285252 B1 EP3285252 B1 EP 3285252B1
- Authority
- EP
- European Patent Office
- Prior art keywords
- color values
- display device
- color
- physical
- digital
- Prior art date
- Legal status (The legal status is an assumption and is not a legal conclusion. Google has not performed a legal analysis and makes no representation as to the accuracy of the status listed.)
- Active
Links
Images


Classifications
-
- G—PHYSICS
- G09—EDUCATION; CRYPTOGRAPHY; DISPLAY; ADVERTISING; SEALS
- G09G—ARRANGEMENTS OR CIRCUITS FOR CONTROL OF INDICATING DEVICES USING STATIC MEANS TO PRESENT VARIABLE INFORMATION
- G09G5/00—Control arrangements or circuits for visual indicators common to cathode-ray tube indicators and other visual indicators
- G09G5/02—Control arrangements or circuits for visual indicators common to cathode-ray tube indicators and other visual indicators characterised by the way in which colour is displayed
-
- G—PHYSICS
- G09—EDUCATION; CRYPTOGRAPHY; DISPLAY; ADVERTISING; SEALS
- G09G—ARRANGEMENTS OR CIRCUITS FOR CONTROL OF INDICATING DEVICES USING STATIC MEANS TO PRESENT VARIABLE INFORMATION
- G09G3/00—Control arrangements or circuits, of interest only in connection with visual indicators other than cathode-ray tubes
- G09G3/20—Control arrangements or circuits, of interest only in connection with visual indicators other than cathode-ray tubes for presentation of an assembly of a number of characters, e.g. a page, by composing the assembly by combination of individual elements arranged in a matrix no fixed position being assigned to or needed to be assigned to the individual characters or partial characters
- G09G3/34—Control arrangements or circuits, of interest only in connection with visual indicators other than cathode-ray tubes for presentation of an assembly of a number of characters, e.g. a page, by composing the assembly by combination of individual elements arranged in a matrix no fixed position being assigned to or needed to be assigned to the individual characters or partial characters by control of light from an independent source
- G09G3/36—Control arrangements or circuits, of interest only in connection with visual indicators other than cathode-ray tubes for presentation of an assembly of a number of characters, e.g. a page, by composing the assembly by combination of individual elements arranged in a matrix no fixed position being assigned to or needed to be assigned to the individual characters or partial characters by control of light from an independent source using liquid crystals
- G09G3/3607—Control arrangements or circuits, of interest only in connection with visual indicators other than cathode-ray tubes for presentation of an assembly of a number of characters, e.g. a page, by composing the assembly by combination of individual elements arranged in a matrix no fixed position being assigned to or needed to be assigned to the individual characters or partial characters by control of light from an independent source using liquid crystals for displaying colours or for displaying grey scales with a specific pixel layout, e.g. using sub-pixels
-
- G—PHYSICS
- G09—EDUCATION; CRYPTOGRAPHY; DISPLAY; ADVERTISING; SEALS
- G09G—ARRANGEMENTS OR CIRCUITS FOR CONTROL OF INDICATING DEVICES USING STATIC MEANS TO PRESENT VARIABLE INFORMATION
- G09G3/00—Control arrangements or circuits, of interest only in connection with visual indicators other than cathode-ray tubes
- G09G3/20—Control arrangements or circuits, of interest only in connection with visual indicators other than cathode-ray tubes for presentation of an assembly of a number of characters, e.g. a page, by composing the assembly by combination of individual elements arranged in a matrix no fixed position being assigned to or needed to be assigned to the individual characters or partial characters
- G09G3/2003—Display of colours
-
- G—PHYSICS
- G09—EDUCATION; CRYPTOGRAPHY; DISPLAY; ADVERTISING; SEALS
- G09G—ARRANGEMENTS OR CIRCUITS FOR CONTROL OF INDICATING DEVICES USING STATIC MEANS TO PRESENT VARIABLE INFORMATION
- G09G5/00—Control arrangements or circuits for visual indicators common to cathode-ray tube indicators and other visual indicators
- G09G5/02—Control arrangements or circuits for visual indicators common to cathode-ray tube indicators and other visual indicators characterised by the way in which colour is displayed
- G09G5/06—Control arrangements or circuits for visual indicators common to cathode-ray tube indicators and other visual indicators characterised by the way in which colour is displayed using colour palettes, e.g. look-up tables
-
- G—PHYSICS
- G09—EDUCATION; CRYPTOGRAPHY; DISPLAY; ADVERTISING; SEALS
- G09G—ARRANGEMENTS OR CIRCUITS FOR CONTROL OF INDICATING DEVICES USING STATIC MEANS TO PRESENT VARIABLE INFORMATION
- G09G2320/00—Control of display operating conditions
- G09G2320/02—Improving the quality of display appearance
- G09G2320/0242—Compensation of deficiencies in the appearance of colours
-
- G—PHYSICS
- G09—EDUCATION; CRYPTOGRAPHY; DISPLAY; ADVERTISING; SEALS
- G09G—ARRANGEMENTS OR CIRCUITS FOR CONTROL OF INDICATING DEVICES USING STATIC MEANS TO PRESENT VARIABLE INFORMATION
- G09G2320/00—Control of display operating conditions
- G09G2320/06—Adjustment of display parameters
- G09G2320/0666—Adjustment of display parameters for control of colour parameters, e.g. colour temperature
-
- G—PHYSICS
- G09—EDUCATION; CRYPTOGRAPHY; DISPLAY; ADVERTISING; SEALS
- G09G—ARRANGEMENTS OR CIRCUITS FOR CONTROL OF INDICATING DEVICES USING STATIC MEANS TO PRESENT VARIABLE INFORMATION
- G09G2320/00—Control of display operating conditions
- G09G2320/06—Adjustment of display parameters
- G09G2320/0686—Adjustment of display parameters with two or more screen areas displaying information with different brightness or colours
-
- G—PHYSICS
- G09—EDUCATION; CRYPTOGRAPHY; DISPLAY; ADVERTISING; SEALS
- G09G—ARRANGEMENTS OR CIRCUITS FOR CONTROL OF INDICATING DEVICES USING STATIC MEANS TO PRESENT VARIABLE INFORMATION
- G09G2320/00—Control of display operating conditions
- G09G2320/06—Adjustment of display parameters
- G09G2320/0693—Calibration of display systems
-
- G—PHYSICS
- G09—EDUCATION; CRYPTOGRAPHY; DISPLAY; ADVERTISING; SEALS
- G09G—ARRANGEMENTS OR CIRCUITS FOR CONTROL OF INDICATING DEVICES USING STATIC MEANS TO PRESENT VARIABLE INFORMATION
- G09G2330/00—Aspects of power supply; Aspects of display protection and defect management
- G09G2330/12—Test circuits or failure detection circuits included in a display system, as permanent part thereof
-
- G—PHYSICS
- G09—EDUCATION; CRYPTOGRAPHY; DISPLAY; ADVERTISING; SEALS
- G09G—ARRANGEMENTS OR CIRCUITS FOR CONTROL OF INDICATING DEVICES USING STATIC MEANS TO PRESENT VARIABLE INFORMATION
- G09G2340/00—Aspects of display data processing
- G09G2340/06—Colour space transformation
-
- G—PHYSICS
- G09—EDUCATION; CRYPTOGRAPHY; DISPLAY; ADVERTISING; SEALS
- G09G—ARRANGEMENTS OR CIRCUITS FOR CONTROL OF INDICATING DEVICES USING STATIC MEANS TO PRESENT VARIABLE INFORMATION
- G09G2360/00—Aspects of the architecture of display systems
- G09G2360/04—Display device controller operating with a plurality of display units
-
- G—PHYSICS
- G09—EDUCATION; CRYPTOGRAPHY; DISPLAY; ADVERTISING; SEALS
- G09G—ARRANGEMENTS OR CIRCUITS FOR CONTROL OF INDICATING DEVICES USING STATIC MEANS TO PRESENT VARIABLE INFORMATION
- G09G2360/00—Aspects of the architecture of display systems
- G09G2360/14—Detecting light within display terminals, e.g. using a single or a plurality of photosensors
- G09G2360/145—Detecting light within display terminals, e.g. using a single or a plurality of photosensors the light originating from the display screen
-
- G—PHYSICS
- G09—EDUCATION; CRYPTOGRAPHY; DISPLAY; ADVERTISING; SEALS
- G09G—ARRANGEMENTS OR CIRCUITS FOR CONTROL OF INDICATING DEVICES USING STATIC MEANS TO PRESENT VARIABLE INFORMATION
- G09G2360/00—Aspects of the architecture of display systems
- G09G2360/16—Calculation or use of calculated indices related to luminance levels in display data
-
- G—PHYSICS
- G09—EDUCATION; CRYPTOGRAPHY; DISPLAY; ADVERTISING; SEALS
- G09G—ARRANGEMENTS OR CIRCUITS FOR CONTROL OF INDICATING DEVICES USING STATIC MEANS TO PRESENT VARIABLE INFORMATION
- G09G2380/00—Specific applications
- G09G2380/10—Automotive applications
Definitions
- the present disclosure generally relates to color profiling of a display device.
- the present disclosure relates to color profiling of a display device in order to generate color profile data for the display device.
- the technique may be embodied in one or more of methods, computer program products, and devices.
- LCD liquid crystal display
- a display device In order to guarantee a matching color representation on a plurality of display devices, as well as in order to generally guarantee that a desired physical color is displayed on a particular display device, it is known to perform color profiling on a display device.
- color profiling a plurality of digital color values is applied to the display device and the associated physical color values output by the display device are measured, e.g., by means of a Tristimulus colorimeter.
- a data set (color profile data) representative of the mapping between input digital color values and output physical color values is then stored in a memory of the display device, for example, in the form of an ICC profile that may comprise a matrix and/or a lookup table (LUT). This information can later be used in order to apply an appropriate input digital color value for generating a desired output physical color value.
- the profiling of the display devices of a production line is either very time-consuming or not sufficiently accurate.
- US2010/0220237A1 discloses a system and method for color-correcting displays with different color gamuts, which involves mastering source picture content to provide mastered color corrected picture content for display on reference type display having a reference color gamut, and further includes generating metadata for a subsequent inverse color gamut mapping that color transforms the mastered color corrected picture content for display on non-reference type displays having a non-reference color gamut.
- a method for color profiling of a display device is presented. The method is as described in independent claim 1.
- the display device may comprise at least one of an LCD display device, an OLED display device, a CRT display device, etc.
- the input color space may be, e.g., an RGB color space, an HSV color space, or an HSL color space.
- the plurality of digital color values may correspond to digital color values which lead to displaying of physical color values in an edge region of a color gamut of the respective display device, represented in the x-y-plane of the CIE1931 color space (CIE-xyY or CIE-Yxy).
- the edge region of the color gamut may be defined as a region having a distance smaller than a predefined threshold value from an outer edge of the color gamut of the display device.
- the meaning of the expression “mapping” according to this disclosure may be understood such that a plurality of input digital color values are each unambiguously associated with a respective output physical color value of the respective display device.
- the color profile data may comprise at least one of a conversion matrix, a file, a lookup table (LUT), and an ICC profile.
- the full input color space may, for example, be represented by the full RGB color space including values for R, G, and B, each in an interval of [0, 1] ([0 %, 100 %]) or each in an interval of [0, 255] (for 24-bit color representation).
- the full input color space may, for example, be represented by the full HSV color space including values for H in an interval of [0°, 360°) and values for S and V, each an interval of [0, 1].
- the full input color space may, for example, be represented by the full HSL color space including values for H in an interval of [0°, 360°) and values for S and L, each an interval of [0, 1]. It is known to the skilled person, that color values can be unambiguously transformed between RGB, HSV, and HSL representation. For example, there exists a clear transformation rule between RGB color space and HSV color space.
- the core mapping may be represented by a color profile and/or by color profile data.
- the core mapping may be read from a memory of a device carrying out the method.
- the core mapping may be represented by a lookup table (LUT) or a transformation matrix.
- the low saturation region may consist of (or may represent) digital color values which lead to displaying of physical color values in a core region of a color gamut of the respective display device, represented in the x-y-plane of the xyY color space (CIE-xyY).
- the core region of the color gamut may be defined as a region having a distance larger than a predefined threshold value from an outer edge of the color gamut of the display device.
- the core region of the color gamut may be defined as a region having a distance smaller than a predefined threshold value from a white point of the color gamut of the display device.
- the low saturation region comprises at least an area larger than zero of low saturation digital color values that are not comprised by the high saturation region.
- the low saturation region and the high saturation region may be mutually exclusive, such that every possible digital color value either belongs to the low saturation region or the high saturation region.
- digital color values having a saturation value up to a particular threshold value may belong to the low saturation region and digital color values above the particular threshold value may belong to the high saturation region.
- the method may further comprise performing the steps of applying, measuring, and generating for each of a plurality of display devices of a set of display devices.
- the set of display devices may correspond to a batch of a production line of display devices.
- the set of display devices may also be a subset of a batch of a production line or may include display devices of different batches.
- the method may further comprise applying a plurality of digital color values to a reference display device, wherein the digital color values are located in the low saturation region of the input color space, measuring a plurality of physical color values output by the reference display device, the physical color values being associated with the applied digital color values, and determining, based on the measured physical color values of the reference display device, the core mapping of digital color values of the low saturation region of the input color space to physical color values output by the reference display device.
- the reference display device may be a display device of the set of display devices.
- the reference display device may be arbitrarily chosen from set display devices.
- the reference display device may be a display device of the same batch of display devices as the display device.
- the reference display device may be a display device of another batch of display devices than the display device.
- the digital color values applied to the reference display device may be chosen such that, within a predefined low saturation region, every RGB color is applied to the reference display, i.e., (100,100,100), (100,100,101), (100,100,102), etc.
- the digital color values applied to the reference display device may have a predefined spacing between each other (with regard to an input color space), such that only a predefined subset of color values within the low saturation region are applied to the reference display device, e.g., (100,100,100), (100,100,110), (100,100,120), etc.
- a number of the digital color values applied to the display device may be smaller than a number of the digital color values applied to the reference display device.
- the number of digital color values applied to the display device may be three or 6.
- the number of digital color values applied to the reference display device may be larger than 100 or larger than 1000.
- Measuring a plurality of physical color values output by the display device may comprise outputting and measuring at least two of the plurality of physical colors simultaneously by using different areas of the display device.
- measuring a plurality of physical color values output by the reference display device may comprise outputting and measuring at least two of the plurality of physical color values simultaneously by using different areas of the reference display device.
- the different areas of the display device and/or the different areas of the reference display device may be represented as "color patches" at different areas of a display area of the respective display device/reference display device.
- the different areas may each be represented by a plurality of pixels of the display device and/or reference display device.
- one colorimeter Tristimulus colorimeter
- an equivalent measurement system may be used for measuring a respective physical color value.
- the measurement system may be capable of measuring multiple color values at once (like a camera system with a software product, that will calculate the physical color values from the photographed color patches).
- the high saturation region may be defined as consisting of digital color values having a saturation value above a first saturation threshold value.
- the low saturation region may be defined as consisting of digital color values having a saturation value below a second saturation threshold value.
- the first threshold value and the second threshold value may be either the same saturation value or different situation values.
- the saturation value may be represented as a saturation value in the HSV color space or in the HSL color space.
- the saturation value may be derived from RGB color space representation by using known transformation algorithms.
- the high saturation region may be defined as consisting of digital color values, wherein each of the R-value, the G-value, and the B-value of the respective digital color value is below a first RGB threshold value.
- the low saturation region may be defined as consisting of digital color values, wherein each of the R-value, the G-value, and the B-value of the respective digital color value is above a second RGB threshold value.
- the first RGB threshold value and the second RGB threshold value may either be the same value or may be different values.
- the first RGB threshold value and the second RGB threshold value may both be 30 (in 24-bit color representation).
- the plurality of digital color values located in the high saturation region of the input color space may comprise at least one digital color value having a value of maximum saturation.
- Such digital color values having a value of maximum saturation may correspond, e.g., to one of the basic colors in RGB representation, i.e. one of (255,0,0) (red), (0,255,0) (green), and (0,0,255) (blue).
- the value of maximum saturation may correspond, e.g., to a saturation value (S) of 1 in the HSV or in the HSL color space.
- the method may further comprise storing the color profile data in a memory of the display device.
- the color profile data may be stored, e.g., in form of an ICC profile.
- the ICC profile may include a matrix and/or a lookup table (LUT).
- the set of display devices may consist of display devices of the same model and manufacturer.
- the set of display devices may consist of display devices of the same batch of a production line.
- the core mapping may comprise a first conversion matrix and the color profile data may comprise a second conversion matrix.
- the first conversion matrix may be a 3x3 matrix for converting an RGB color value (a vector having 3 dimensions) into a xyY color value (a vector having 3 dimensions).
- the color profile data may be represented by the second conversion matrix.
- the second conversion matrix may comprise a multiplication of a transformation matrix with the first conversion matrix.
- the transformation matrix may comprise a rotation matrix and/or a matrix for affine transformation.
- the second conversion matrix may comprise a rotation matrix.
- the rotation matrix may define a rotation within the x-y-plane of the xyY color space.
- the display device may be configured to be used in a motor vehicle.
- the display device may be used as instrument display behind a steering wheel of the motor vehicle, as navigation display in a center console of the motor vehicle, and/or as display device for a tablet computer configured to be used in the motor vehicle.
- a computer program product comprises program code portions for performing the method and method steps presented herein when the computer program product is executed by one or more processors.
- a device for color profiling of a display device is presented.
- the device is configured as per the device of independent apparatus claim 14.
- the device of the third aspect may further be configured to perform any of the methods and method steps presented herein.
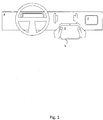
- Fig. 1 shows a situation, in which a plurality of display devices 2 are visible to a user.
- the example of Fig. 1 shows the cockpit of a car, in which two of the display devices 2 are fixed to the dashboard 4 of the car. Further one of the display devices 2 is a display device of a mobile tablet computer 6, wherein the tablet computer 6 may be used for controlling certain functionalities of the car or for watching media content, such as pictures or video.
- the situation depicted in Fig. 1 exemplarily illustrates the necessity of color management. By using color management, it can be guaranteed that correct digital color input values are input into the various display devices 2 such that one and the same physical color (or almost one and the same physical color) is displayed (i.e., output) by the various display devices 2.
- a video simultaneously displayed on the display device 2 of the mobile tablet computer 6 and on one of the fixed display devices 2 should be displayed in the same or in almost the same physical colors on both display devices 2.
- UI elements user interface elements
- icons or visual indicators should be displayed on all display devices 2 in the same or almost the same physical color values.
- the individual display devices 2 need to be profiled in advance. In other words, it is necessary to know or at least to have an estimate, to which physical color value a respective input digital color value is "mapped" by the respective display device 2.
- the result of such a profiling may be stored in the form of a color profile (e.g., an ICC profile), e.g., on a memory of the respective display device 2.
- a color profile e.g., an ICC profile
- Several formats for such a color profile are commonly known, e.g., a 3x3 matrix can be used, which transforms a three-dimensional RGB vector to a three-dimensional xyY vector.
- a 3x3 matrix can be used, which transforms a three-dimensional RGB vector to a three-dimensional xyY vector.
- RGB color space and the xyY color space several other suitable color spaces may be used.
- RGB color space an HSV or HSL color space might be used.
- xyY color space a CIELab, CIEL*a*b*, or any other suitable color space might be used.
- the color profile can also be represented by a lookup table (LUT), wherein the table maps individual input digital color values to associated output physical color values.
- this information can be used in order to display a desired physical color value.
- Fig. 2 shows a flow chart of a method for color profiling of a display device in accordance with the present disclosure.
- a plurality of digital color values is applied to a display device, wherein the digital color values are located in a high saturation region of an input color space.
- the display device is a display device to be profiled and may correspond to one of the display devices 2 shown in figure 1 .
- a plurality of physical color values output by the display device are measured.
- the physical color values are associated with the applied digital color values.
- color profile data is generated for the display device by determining a mapping of digital color values of the full input color space to physical color values output by the display device, based on the measured physical color values and based on a core mapping.
- the core mapping is a mapping of digital color values of a low saturation region of the input color space to physical color values output by a reference display device, for example from the same production batch, and the low saturation region comprises low saturation digital color values that are not comprised by the high saturation region.
- a device 20 is described, which may be used for carrying out the above-described method of Fig. 2.
- Fig. 3 shows a block diagram of a device 20 for color profiling of a display device in accordance with the present disclosure.
- the device 20 comprises a memory 22 and a processor 24, wherein the memory 22 and the processor 24 are logically connected such that the processor 24 is configured to perform a method based on instructions stored in the memory 22.
- the memory 22 may comprise a volatile and/or a non-volatile memory and may comprise, e.g., one or more of an HDD, SDD, RAM, ROM, magnetic storage device, solid state storage device, and optical storage device.
- the processor 24 may comprise, e.g., one single CPU or a plurality of processors configured to perform the method according to the instructions stored on the memory 22.
- the memory 22 and the processor 24 are not necessarily physically located on one and the same device but may be distributed over a plurality of devices and logically connected by respective data interfaces. Further, the device 20 for color profiling of a display device may be realized by a cloud computing device.
- the core mapping is a mapping of digital color values of a low saturation region of the input color space to physical color values output by a reference display device and the low saturation region comprises low saturation digital color values that are not comprised by the high saturation region.
- the device 20 comprises a digital color output interface 26.
- digital color values can be applied to the display devices, for example by using a cable and a suitable connector.
- a cable for example a VGA, DVI, or HDMI connector or any other suitable connector may be used.
- the device 20 comprises a measurement interface 28.
- a colorimeter e.g., a Tristimulus colorimeter
- the device 20 further comprises a color profile output interface 30, via which the generated color profile data can be output to the respective display device, such that the color profile data can be stored in a memory of the display device.
- the color profile output interface 30 may also comprise an interface, via which the generated color profile data may be transmitted to a centralized database (e.g., a database available via the Internet), from where it can be read or downloaded if desired.
- Fig. 4 shows two different color gamuts 40 and 42, wherein each of the gamuts 40 and 42 belongs to a respective display device.
- the representation of Fig. 4 shows the x-y-plane of a xyY color space.
- Fig. 4 shows the CIE 1931 chromaticity diagram, wherein the gamut of all visible chromaticities is indicated by a tongue-shaped figure 44.
- different display devices are able to display a subset of chromaticity values, wherein this subset is referred to as "gamut" or "color gamut" of the corresponding display device.
- the color gamuts 40 and 42 may also be represented in the Lab color space (CIELAB), in which an L* value represents the lightness of a color and a* and b* values represent the chromaticity of a certain color.
- CIELAB Lab color space
- L* represents the lightness of a color
- a* and b* values represent the chromaticity of a certain color.
- the representation of Fig. 4 is in the a*-b* plane of the color space.
- Another example for a color space that may be used is the CIE 1976 (L*,u*,v*) color space (CIELUV). Between these color spaces, clear conversion rules exist, such that a skilled person can easily convert physical color values from one color space into another color space.
- different display devices may be physically able to display different ranges of colors (the so-called color gamuts 40, 42) in a chromaticity plane (e.g., x-y-plane) of a considered color space.
- the physical colors that may be displayed by a particular display device may be limited by the quality and the amount of used pixel colors for generating a color impression of the respective display device.
- the resulting color gamut may be triangular (for a particular luminance value) as indicated by the color gamuts 40 and 42, respectively, in Fig. 4 .
- all colors, i.e., all chromaticity values inside the respective shape of the color gamut 40, 42 are physically displayable by the respective display device.
- the color gamut of a considered display device strongly depends on a quality of the display device and/or on the used technique (amount of pixel colors, LCD/CRT/OLED, etc.). However, also within one and the same batch of a production line of display devices, there will be slight variations between the gamuts 40, 42 of the display devices. Therefore, in most cases, it cannot be assumed that all display devices of one batch of a production line of display devices (a "set of display devices" according to the present disclosure) have the same gamut. However, as shown in Fig. 4 , it can be assumed that the display devices of one batch (i.e., the display devices of a set of display devices) are all able to display colors within a particular core gamut 46.
- this core gamut 46 is included in the gamuts 40, 42 of all display devices of the set of display devices, it is not necessary to perform detailed profiling of physical color values within this core gamut 46 for every display device of the set of display devices. According to the technique described herein, it is rather sufficient to measure the core gamut 46 only once for a set of display devices.
- the information regarding the core gamut 46 can also be gathered from a database, in which this information is stored as a core gamut for a particular type of display device.
- a measured core gamut of an earlier batch of the production line may be used.
- the physical color values of the core gamut 46 correspond to color values having a low saturation. These physical color values are located close to a white point (WP). In contrast to these physical color values having a low saturation, the physical color values of the edge regions of the gamuts 40 and 42 correspond to color values having a high saturation.
- WP white point
- the physical color values of the core gamut 46 correspond to input digital color values having a low saturation value.
- the physical color values of the edge regions of the color gamuts 40 and 42 correspond to input digital color values having a high saturation value.
- the input digital color values having a low saturation value may correspond to (R,G,B) values, wherein each of an R-value, a G-value, and a B-value of the respective (R,G,B) value is above a predetermined RGB threshold value (such as 30, in 24-bit color representation).
- a predetermined RGB threshold value such as 30, in 24-bit color representation
- the saturation value of the input digital color values may, e.g., be derived from the corresponding digital color value in HSV or HSL representation, wherein the S-value corresponds to a saturation value.
- This S-value is generally in a range between 0 and 1, i.e., in a range between 0 % and 100 %.
- a saturation value S can be assigned to each digital color value, also in case the digital color value is represented, e.g., in RGB color space.
- the core gamut 46 may therefore results from input digital color values having a saturation value S below a predefined threshold saturation value.
- the edge region of the gamuts 40 and 42 may result from input digital color values having a saturation value S above a predefined threshold saturation value.
- the core gamut 46 is measured by using a reference display device.
- This reference display device may be a display device (e.g., arbitrarily chosen) of the batch of display devices to be profiled.
- the information regarding the core gamut 46 may be derived from a database.
- the information regarding the core gamut 46 corresponds to a core mapping, wherein each of a plurality of input digital color values of a low saturation region of an input color space is mapped to a corresponding output physical color value within the core gamut 46.
- the core mapping is determined by applying a plurality of input digital color values (e.g., more than 100, more than 1000, or more than 10,000) to the reference display device, measuring the respective output physical color values, and, based on the measured physical color values, generating a data structure (e.g., a matrix or a lookup table) describing a mapping between input digital color values and output physical color values.
- the input digital color values used for this measurement of the core gamut 46 are digital color values of a low saturation region of an input color space.
- a plurality of predefined input digital color values of a high saturation region of the input color space are applied to a first display device to be measured. These predefined input digital color values cause the first display device to display the physical color values 48 indicated as black stars in the diagram of Fig. 4 .
- fully saturated color values of the input color space may be used.
- the input digital color values of the high saturation region may comprise the three RGB values (0,0,255), (0,255,0), and (255,0,0). Additionally or alternatively, the input digital color values of the high saturation region may comprise the three RGB values (0,255,255), (255,0,255), and (255,255,0).
- the corresponding output physical color values are measured by using a suitable measurement device (e.g., a Tristimulus colorimeter).
- a gamut 40 can be determined for the first display device.
- a mapping between the full input color space and respective output physical color values may be determined.
- color profile data is generated, e.g., in form of a matrix or a lookup table (LUT).
- LUT lookup table
- color profile data for a second display device can be generated, wherein the corresponding gamut 42 of the second display device is indicated by dashed lines in Fig. 4 . Further, the physical color values 50 resulting from the application of input digital color values in the high saturation region, for the second display device, are indicated as dashed stars in the diagram of Fig. 4 .
- a plurality of display devices of a set of display devices can be profiled significantly faster than in the case that every display device is individually fully profiled.
- a core mapping for a low saturation region needs only to be profiled once (by using a reference display device, which may be taken from the set of display devices) and only a limited number of high saturation color values needs to be measured for the individual display devices of the set of display devices.
- FIG. 5 , 6a, and 6b an exemplary embodiment of generating color profile data according to the present disclosure is described.
- the example shown in Figs. 5 , 6a, and 6b bases on the principle described above with reference to Fig. 4 . Therefore, the description of Fig. 4 above also applies to the example of Figs. 5 , 6a, and 6b .
- Fig. 5 shows a representation of physical color values in the x-y-plane, similar to the representation of Fig. 4 .
- a core gamut 46 is shown, the corners of which correspond to the digital input color values of (0,0,240), (0,240,0), and (240,0,0) (in RGB color space). Further, also a position of a white point (WP) in the physical color space (the x-y-plane) is determined by measuring a physical color value corresponding to the digital color value (255,255,255).
- WP white point
- a color gamut 40 is indicated by dashed lines for a display device to be measured.
- the position and shape of the color gamut 40 has been determined by measuring the input color values (0,0,255), (0,255,0), and (255,0,0).
- the shape of the color gamut 40 is rotated by an angle ⁇ with regard to the core gamut 46.
- Fig. 6a a mathematical operation is shown, describing how color profile data for the entire input color space is determined for the display device with regard to the situation shown in Fig. 5 .
- the upper part of Fig. 6a shows color profile data in the form of a core matrix 60.
- the core matrix 60 represents a core mapping of inputs digital color values in the RGB color space (as (R,G,B) vector 62) to output physical color values in the xyY color space (as (x,y,Y) vector 64).
- the core matrix 60 is a 3x3 matrix comprising nine entries a 11 to a 33 .
- the angle ⁇ can be determined.
- the position of the white point is known from the core mapping and has the coordinates x WP and y WP in the x-y-plane.
- the core gamut 46 is rotated by the angle ⁇ around the white point WP.
- the conversion matrix 66 is shown as three individual matrices, these matrices can be multiplied resulting in one 3x3 conversion matrix.
- a multiplication of the matrices 66 and 60 corresponds to a final conversion matrix 70 for the profiled display device.
- a final conversion matrix 70 is shown in the left part of Fig. 6b .
- This final conversion matrix 70 may be represented as one conversion matrix having nine entries b 11 to b 33 by performing a matrix multiplication of the matrices 66 and 60.
- the color profile data for the display device is represented by a multiplication of the conversion matrix 66 with the core matrix 60.
- a lookup table (LUT) 72 may be generated based on the core mapping and based on the measured physical color values of the display device to be profiled.
- the lookup table 72 may be generated by solving the equation shown in the lower part of Fig. 6a for a plurality of predefined (R,G,B) vectors or for a plurality of predefined (x',y',Y') vectors.
- Fig. 6b shows two examples of color profile data according to the present disclosure.
- a conversion matrix 70 and in the right part, a lookup table 72.
- This color profile data may be stored in a memory of the display device as color profile data in the form of a matrix 70 and/or in the form of a lookup table (LUT) 72. Further, the color profile data may be stored in a database, which is, e.g., available via the Internet.
- Fig. 7 shows how a plurality of physical color values may be simultaneously measured for a display device 2. Therefore, a plurality of measurement devices 60 is provided, each of the measurements devices 60 measuring a physical color value in a predefined area of the display device 2. In these predefined areas, different colors are shown, e.g., in the form of color patches as indicated in Fig. 7 . In other words, different digital input color values are simultaneously applied to different areas of the display device 2. The resulting physical color values are measured by a plurality of measurements devices 60. This method can be applied both for profiling of the reference display and for profiling of the display devices to be profiled. By using the technique shown in Fig. 7 , a total time for profiling a display device can be drastically reduced.
Landscapes
- Engineering & Computer Science (AREA)
- Physics & Mathematics (AREA)
- Computer Hardware Design (AREA)
- General Physics & Mathematics (AREA)
- Theoretical Computer Science (AREA)
- Chemical & Material Sciences (AREA)
- Crystallography & Structural Chemistry (AREA)
- Image Processing (AREA)
- Color Image Communication Systems (AREA)
Description
- The present disclosure generally relates to color profiling of a display device. In particular, the present disclosure relates to color profiling of a display device in order to generate color profile data for the display device. The technique may be embodied in one or more of methods, computer program products, and devices.
- The importance of display devices (e.g., liquid crystal display (LCD) devices) in modern life is still increasing. There are several situations, in which a user might be surrounded by not just one display device. For example, such a situation might occur within a motor vehicle (e.g., a car), where the user can simultaneously observe a plurality of display devices (e.g., located behind the steering wheel, located in a center console, and/or provided as tablet computer).
- In order to guarantee a matching color representation on a plurality of display devices, as well as in order to generally guarantee that a desired physical color is displayed on a particular display device, it is known to perform color profiling on a display device. During color profiling, a plurality of digital color values is applied to the display device and the associated physical color values output by the display device are measured, e.g., by means of a Tristimulus colorimeter. A data set (color profile data) representative of the mapping between input digital color values and output physical color values is then stored in a memory of the display device, for example, in the form of an ICC profile that may comprise a matrix and/or a lookup table (LUT). This information can later be used in order to apply an appropriate input digital color value for generating a desired output physical color value.
- However, in order to obtain the necessary information for generating the color profile (e.g., at the end of a production process), in known techniques, a large number of physical color values needs to be measured for every profiled display device. As a rule of thumb, the more colors are measured the more precise a model for the gamut mapping can be. Because the profiling of the display devices is commonly carried out as part of a production process of the display devices, a time-consuming and complex profiling process slows down the performance of the entire production process.
- Therefore, with common profiling methods, the profiling of the display devices of a production line is either very time-consuming or not sufficiently accurate.
-
US2010/0220237A1 discloses a system and method for color-correcting displays with different color gamuts, which involves mastering source picture content to provide mastered color corrected picture content for display on reference type display having a reference color gamut, and further includes generating metadata for a subsequent inverse color gamut mapping that color transforms the mastered color corrected picture content for display on non-reference type displays having a non-reference color gamut. - In view of the above, there is a need for a technique for color profiling of a display device, wherein the technique avoids one or more of the drawbacks discussed above or other related problems.
- The above object is achieved by the claimed subject-matter according to the independent claims.
- According to a first aspect, a method for color profiling of a display device is presented. The method is as described in
independent claim 1. - The display device may comprise at least one of an LCD display device, an OLED display device, a CRT display device, etc. The input color space may be, e.g., an RGB color space, an HSV color space, or an HSL color space. The plurality of digital color values may correspond to digital color values which lead to displaying of physical color values in an edge region of a color gamut of the respective display device, represented in the x-y-plane of the CIE1931 color space (CIE-xyY or CIE-Yxy). The edge region of the color gamut may be defined as a region having a distance smaller than a predefined threshold value from an outer edge of the color gamut of the display device. The plurality of physical color values may be measured by means of a Tristimulus colorimeter or any other suitable color measurement device. The physical color values may be represented as color values in the xyY color space. More precisely, the physical color values may be represented as color values in the x-y-plane of the xyY color space. Further, for describing the measured physical color values, any other suitable color space may be used, such as the CIE 1931 XYZ color space, the CIELab color space, or any other appropriate color space.
- The meaning of the expression "mapping" according to this disclosure may be understood such that a plurality of input digital color values are each unambiguously associated with a respective output physical color value of the respective display device. For this purpose, the color profile data may comprise at least one of a conversion matrix, a file, a lookup table (LUT), and an ICC profile. The full input color space may, for example, be represented by the full RGB color space including values for R, G, and B, each in an interval of [0, 1] ([0 %, 100 %]) or each in an interval of [0, 255] (for 24-bit color representation). In addition or alternatively, the full input color space may, for example, be represented by the full HSV color space including values for H in an interval of [0°, 360°) and values for S and V, each an interval of [0, 1]. In addition or alternatively, the full input color space may, for example, be represented by the full HSL color space including values for H in an interval of [0°, 360°) and values for S and L, each an interval of [0, 1]. It is known to the skilled person, that color values can be unambiguously transformed between RGB, HSV, and HSL representation. For example, there exists a clear transformation rule between RGB color space and HSV color space.
- The core mapping may be represented by a color profile and/or by color profile data. The core mapping may be read from a memory of a device carrying out the method. For example, the core mapping may be represented by a lookup table (LUT) or a transformation matrix. The low saturation region may consist of (or may represent) digital color values which lead to displaying of physical color values in a core region of a color gamut of the respective display device, represented in the x-y-plane of the xyY color space (CIE-xyY). The core region of the color gamut may be defined as a region having a distance larger than a predefined threshold value from an outer edge of the color gamut of the display device. Alternatively, the core region of the color gamut may be defined as a region having a distance smaller than a predefined threshold value from a white point of the color gamut of the display device.
- The low saturation region comprises at least an area larger than zero of low saturation digital color values that are not comprised by the high saturation region. For example, the low saturation region and the high saturation region may be mutually exclusive, such that every possible digital color value either belongs to the low saturation region or the high saturation region. For example, digital color values having a saturation value up to a particular threshold value may belong to the low saturation region and digital color values above the particular threshold value may belong to the high saturation region. However, there may also be an overlap region of the low saturation region and the high saturation region.
- The method may further comprise performing the steps of applying, measuring, and generating for each of a plurality of display devices of a set of display devices.
- The set of display devices may correspond to a batch of a production line of display devices. The set of display devices may also be a subset of a batch of a production line or may include display devices of different batches.
- The method may further comprise applying a plurality of digital color values to a reference display device, wherein the digital color values are located in the low saturation region of the input color space, measuring a plurality of physical color values output by the reference display device, the physical color values being associated with the applied digital color values, and determining, based on the measured physical color values of the reference display device, the core mapping of digital color values of the low saturation region of the input color space to physical color values output by the reference display device.
- The reference display device may be a display device of the set of display devices. For example, the reference display device may be arbitrarily chosen from set display devices. The reference display device may be a display device of the same batch of display devices as the display device. Alternatively, the reference display device may be a display device of another batch of display devices than the display device. The digital color values applied to the reference display device may be chosen such that, within a predefined low saturation region, every RGB color is applied to the reference display, i.e., (100,100,100), (100,100,101), (100,100,102), etc. Alternatively, the digital color values applied to the reference display device may have a predefined spacing between each other (with regard to an input color space), such that only a predefined subset of color values within the low saturation region are applied to the reference display device, e.g., (100,100,100), (100,100,110), (100,100,120), etc.
- A number of the digital color values applied to the display device may be smaller than a number of the digital color values applied to the reference display device.
- For example, the number of digital color values applied to the display device may be three or 6. The number of digital color values applied to the reference display device may be larger than 100 or larger than 1000.
- Measuring a plurality of physical color values output by the display device may comprise outputting and measuring at least two of the plurality of physical colors simultaneously by using different areas of the display device.
- Similarly, measuring a plurality of physical color values output by the reference display device may comprise outputting and measuring at least two of the plurality of physical color values simultaneously by using different areas of the reference display device.
- The different areas of the display device and/or the different areas of the reference display device may be represented as "color patches" at different areas of a display area of the respective display device/reference display device. The different areas may each be represented by a plurality of pixels of the display device and/or reference display device. For each of the different areas, one colorimeter (Tristimulus colorimeter) may be used for measuring a respective physical color value. Additionally or alternatively, an equivalent measurement system may be used. The measurement system may be capable of measuring multiple color values at once (like a camera system with a software product, that will calculate the physical color values from the photographed color patches).
- The high saturation region may be defined as consisting of digital color values having a saturation value above a first saturation threshold value.
- The low saturation region may be defined as consisting of digital color values having a saturation value below a second saturation threshold value.
- The first threshold value and the second threshold value may be either the same saturation value or different situation values. In any case, the saturation value may be represented as a saturation value in the HSV color space or in the HSL color space. However, the saturation value may be derived from RGB color space representation by using known transformation algorithms.
- In case the input color space is the RGB color space using (R,G,B) vectors, the high saturation region may be defined as consisting of digital color values, wherein each of the R-value, the G-value, and the B-value of the respective digital color value is below a first RGB threshold value.
- Further, the low saturation region may be defined as consisting of digital color values, wherein each of the R-value, the G-value, and the B-value of the respective digital color value is above a second RGB threshold value.
- The first RGB threshold value and the second RGB threshold value may either be the same value or may be different values. For example, the first RGB threshold value and the second RGB threshold value may both be 30 (in 24-bit color representation).
- The plurality of digital color values located in the high saturation region of the input color space may comprise at least one digital color value having a value of maximum saturation.
- Such digital color values having a value of maximum saturation may correspond, e.g., to one of the basic colors in RGB representation, i.e. one of (255,0,0) (red), (0,255,0) (green), and (0,0,255) (blue). For example, all three of the aforementioned basic colors in RGB representation may be applied to the display device (successively or simultaneously). The value of maximum saturation may correspond, e.g., to a saturation value (S) of 1 in the HSV or in the HSL color space.
- The method may further comprise storing the color profile data in a memory of the display device. The color profile data may be stored, e.g., in form of an ICC profile. The ICC profile may include a matrix and/or a lookup table (LUT).
- The set of display devices may consist of display devices of the same model and manufacturer.
- The set of display devices may consist of display devices of the same batch of a production line.
- The core mapping may comprise a first conversion matrix and the color profile data may comprise a second conversion matrix.
- The first conversion matrix may be a 3x3 matrix for converting an RGB color value (a vector having 3 dimensions) into a xyY color value (a vector having 3 dimensions). The color profile data may be represented by the second conversion matrix. The second conversion matrix may comprise a multiplication of a transformation matrix with the first conversion matrix. The transformation matrix may comprise a rotation matrix and/or a matrix for affine transformation.
- The second conversion matrix may comprise a rotation matrix. The rotation matrix may define a rotation within the x-y-plane of the xyY color space.
- The display device may be configured to be used in a motor vehicle. For example, the display device may be used as instrument display behind a steering wheel of the motor vehicle, as navigation display in a center console of the motor vehicle, and/or as display device for a tablet computer configured to be used in the motor vehicle.
- According to a second aspect, a computer program product is presented. The computer program product comprises program code portions for performing the method and method steps presented herein when the computer program product is executed by one or more processors.
- The one or more processors may be located on an individual network node or may be comprised by a distributed computing system. The computer program product may be stored on a computer-readable recording medium such as a semiconductor memory, DVD-ROM, CD-ROM, and so on. The computer program product may also be provided for download via a communication connection.
- According to a third aspect, a device for color profiling of a display device is presented. The device is configured as per the device of
independent apparatus claim 14. - The device of the third aspect may further be configured to perform any of the methods and method steps presented herein.
- The details described above with regard to the first aspect may also apply to the second and/or third aspect.
- Embodiments of the technique presented herein are described below with reference to the accompanying drawings, in which:
- Fig. 1
- shows a schematic representation of a situation with regard to a motor vehicle, wherein a plurality of display devices is visible to a user;
- Fig. 2
- shows a schematic representation of a method for color profiling of a display device according to the present disclosure;
- Fig. 3
- shows a schematic representation of a device for color profiling of a display device according to the present disclosure;
- Fig. 4
- shows the gamuts of two different display devices of one batch and a core gamut;
- Fig. 5
- shows an example of a core gamut and a full gamut of a display device and a corresponding rotation angle;
- Fig. 6a
- shows an example of generating color profile data by using matrices;
- Fig. 6b
- shows two examples of color profile data (a matrix and a lookup table) according to the present disclosure; and
- Fig. 7
- shows a way of simultaneously measuring a plurality of physical color values of a display device.
-
Fig. 1 shows a situation, in which a plurality ofdisplay devices 2 are visible to a user. The example ofFig. 1 shows the cockpit of a car, in which two of thedisplay devices 2 are fixed to thedashboard 4 of the car. Further one of thedisplay devices 2 is a display device of amobile tablet computer 6, wherein thetablet computer 6 may be used for controlling certain functionalities of the car or for watching media content, such as pictures or video. The situation depicted inFig. 1 exemplarily illustrates the necessity of color management. By using color management, it can be guaranteed that correct digital color input values are input into thevarious display devices 2 such that one and the same physical color (or almost one and the same physical color) is displayed (i.e., output) by thevarious display devices 2. For example, by using color management, a video simultaneously displayed on thedisplay device 2 of themobile tablet computer 6 and on one of the fixeddisplay devices 2 should be displayed in the same or in almost the same physical colors on bothdisplay devices 2. As another example, UI elements (user interface elements), such as icons or visual indicators should be displayed on alldisplay devices 2 in the same or almost the same physical color values. - In order to carry out such a color management, the
individual display devices 2 need to be profiled in advance. In other words, it is necessary to know or at least to have an estimate, to which physical color value a respective input digital color value is "mapped" by therespective display device 2. The result of such a profiling may be stored in the form of a color profile (e.g., an ICC profile), e.g., on a memory of therespective display device 2. Several formats for such a color profile are commonly known, e.g., a 3x3 matrix can be used, which transforms a three-dimensional RGB vector to a three-dimensional xyY vector. Instead of the RGB color space and the xyY color space, several other suitable color spaces may be used. Between these color spaces, unambiguous transformation rules are known. For example, instead of the RGB color space, an HSV or HSL color space might be used. Further, instead of the xyY color space, a CIELab, CIEL*a*b*, or any other suitable color space might be used. Instead of a matrix, the color profile can also be represented by a lookup table (LUT), wherein the table maps individual input digital color values to associated output physical color values. - Once the correspondence between input digital color values and output physical color values for a respective display device is known, this information (the color profile data) can be used in order to display a desired physical color value.
- It should be appreciated, that there are several situations, besides the one shown in
Fig. 1 , in which it is desirable to use color management, e.g., in order to achieve a uniform color impression between a plurality ofdisplay devices 2. For example, in photo retouching or in graphic design, it is crucial that a used display device displays the "correct" colors. -
Fig. 2 shows a flow chart of a method for color profiling of a display device in accordance with the present disclosure. - In a
first step 10, a plurality of digital color values is applied to a display device, wherein the digital color values are located in a high saturation region of an input color space. The display device is a display device to be profiled and may correspond to one of thedisplay devices 2 shown infigure 1 . - In a
second step 12, a plurality of physical color values output by the display device are measured. The physical color values are associated with the applied digital color values. - In a
third step 14, color profile data is generated for the display device by determining a mapping of digital color values of the full input color space to physical color values output by the display device, based on the measured physical color values and based on a core mapping. - The core mapping is a mapping of digital color values of a low saturation region of the input color space to physical color values output by a reference display device, for example from the same production batch, and the low saturation region comprises low saturation digital color values that are not comprised by the high saturation region.
- In the following, with reference to
Fig. 3 , adevice 20 is described, which may be used for carrying out the above-described method ofFig. 2. Fig. 3 shows a block diagram of adevice 20 for color profiling of a display device in accordance with the present disclosure. Thedevice 20 comprises amemory 22 and aprocessor 24, wherein thememory 22 and theprocessor 24 are logically connected such that theprocessor 24 is configured to perform a method based on instructions stored in thememory 22. Thememory 22 may comprise a volatile and/or a non-volatile memory and may comprise, e.g., one or more of an HDD, SDD, RAM, ROM, magnetic storage device, solid state storage device, and optical storage device. Theprocessor 24 may comprise, e.g., one single CPU or a plurality of processors configured to perform the method according to the instructions stored on thememory 22. Thememory 22 and theprocessor 24 are not necessarily physically located on one and the same device but may be distributed over a plurality of devices and logically connected by respective data interfaces. Further, thedevice 20 for color profiling of a display device may be realized by a cloud computing device. - On the
memory 22, instructions are stored, which when carried out instruct theprocessor 24 to perform the following steps: - applying a plurality of digital color values to the display device, wherein the digital color values are located in a high saturation region of an input color space;
- measuring a plurality of physical color values output by the display device, the physical color values being associated with the applied digital color values; and
- generating color profile data for the display device by determining a mapping of digital color values of the full input color space to physical color values output by the display device, based on the measured physical color values and based on a core mapping.
- The core mapping is a mapping of digital color values of a low saturation region of the input color space to physical color values output by a reference display device and the low saturation region comprises low saturation digital color values that are not comprised by the high saturation region.
- In order to apply the digital color values to one or more display devices, the
device 20 comprises a digitalcolor output interface 26. Via the digitalcolor output interface 26, digital color values can be applied to the display devices, for example by using a cable and a suitable connector. As connector, for example a VGA, DVI, or HDMI connector or any other suitable connector may be used. - In order to measure the physical color values, the
device 20 comprises ameasurement interface 28. A colorimeter (e.g., a Tristimulus colorimeter) may be used for measuring the physical color values and for providing these values to thedevice 20 via themeasurement interface 28. - The
device 20 further comprises a colorprofile output interface 30, via which the generated color profile data can be output to the respective display device, such that the color profile data can be stored in a memory of the display device. However, the colorprofile output interface 30 may also comprise an interface, via which the generated color profile data may be transmitted to a centralized database (e.g., a database available via the Internet), from where it can be read or downloaded if desired. -
Fig. 4 shows twodifferent color gamuts gamuts Fig. 4 shows the x-y-plane of a xyY color space. In other words,Fig. 4 shows the CIE 1931 chromaticity diagram, wherein the gamut of all visible chromaticities is indicated by a tongue-shaped figure 44. Within this tongue-shaped figure 44, different display devices are able to display a subset of chromaticity values, wherein this subset is referred to as "gamut" or "color gamut" of the corresponding display device. - The person skilled in the art will appreciate that there are several possibilities of color representation in different color spaces. For example, the
color gamuts Fig. 4 is in the a*-b* plane of the color space. Another example for a color space that may be used is the CIE 1976 (L*,u*,v*) color space (CIELUV). Between these color spaces, clear conversion rules exist, such that a skilled person can easily convert physical color values from one color space into another color space. - As shown in
Fig. 4 , different display devices may be physically able to display different ranges of colors (the so-calledcolor gamuts 40, 42) in a chromaticity plane (e.g., x-y-plane) of a considered color space. The physical colors that may be displayed by a particular display device may be limited by the quality and the amount of used pixel colors for generating a color impression of the respective display device. For example, in case the considered display device has pixels for displaying red, green, and blue color, respectively, the resulting color gamut may be triangular (for a particular luminance value) as indicated by thecolor gamuts Fig. 4 . In that case, all colors, i.e., all chromaticity values inside the respective shape of thecolor gamut - The color gamut of a considered display device strongly depends on a quality of the display device and/or on the used technique (amount of pixel colors, LCD/CRT/OLED, etc.). However, also within one and the same batch of a production line of display devices, there will be slight variations between the
gamuts Fig. 4 , it can be assumed that the display devices of one batch (i.e., the display devices of a set of display devices) are all able to display colors within aparticular core gamut 46. - Since this
core gamut 46 is included in thegamuts core gamut 46 for every display device of the set of display devices. According to the technique described herein, it is rather sufficient to measure thecore gamut 46 only once for a set of display devices. Alternatively, the information regarding thecore gamut 46 can also be gathered from a database, in which this information is stored as a core gamut for a particular type of display device. Alternatively, a measured core gamut of an earlier batch of the production line may be used. - However, as shown in
Fig. 4 , edge regions of theindividual gamuts - The physical color values of the
core gamut 46 correspond to color values having a low saturation. These physical color values are located close to a white point (WP). In contrast to these physical color values having a low saturation, the physical color values of the edge regions of thegamuts - Therefore, the physical color values of the
core gamut 46 correspond to input digital color values having a low saturation value. The physical color values of the edge regions of thecolor gamuts - For example, the input digital color values having a low saturation value may correspond to (R,G,B) values, wherein each of an R-value, a G-value, and a B-value of the respective (R,G,B) value is above a predetermined RGB threshold value (such as 30, in 24-bit color representation).
- Further, the saturation value of the input digital color values may, e.g., be derived from the corresponding digital color value in HSV or HSL representation, wherein the S-value corresponds to a saturation value. This S-value is generally in a range between 0 and 1, i.e., in a range between 0 % and 100 %. For example between the RGB representation of a digital color value and an HSV or HSL representation of the same digital color value, there exist unambiguous transformation rules, which are known to the skilled person. Therefore, a saturation value S can be assigned to each digital color value, also in case the digital color value is represented, e.g., in RGB color space.
- The
core gamut 46 may therefore results from input digital color values having a saturation value S below a predefined threshold saturation value. Similarly, the edge region of thegamuts - According to an embodiment of the present disclosure, firstly, the
core gamut 46 is measured by using a reference display device. This reference display device may be a display device (e.g., arbitrarily chosen) of the batch of display devices to be profiled. Alternatively, the information regarding thecore gamut 46 may be derived from a database. The information regarding thecore gamut 46 corresponds to a core mapping, wherein each of a plurality of input digital color values of a low saturation region of an input color space is mapped to a corresponding output physical color value within thecore gamut 46. - When the
core gamut 46 is measured, the core mapping is determined by applying a plurality of input digital color values (e.g., more than 100, more than 1000, or more than 10,000) to the reference display device, measuring the respective output physical color values, and, based on the measured physical color values, generating a data structure (e.g., a matrix or a lookup table) describing a mapping between input digital color values and output physical color values. The input digital color values used for this measurement of thecore gamut 46 are digital color values of a low saturation region of an input color space. - Secondly, a plurality of predefined input digital color values of a high saturation region of the input color space are applied to a first display device to be measured. These predefined input digital color values cause the first display device to display the physical color values 48 indicated as black stars in the diagram of
Fig. 4 . For example, fully saturated color values of the input color space may be used. For example, the input digital color values of the high saturation region may comprise the three RGB values (0,0,255), (0,255,0), and (255,0,0). Additionally or alternatively, the input digital color values of the high saturation region may comprise the three RGB values (0,255,255), (255,0,255), and (255,255,0). In some embodiments, the predefined input digital color values are selected such that they fulfil a predefined rule, such as R+G=255 B=0, B+G=255 R=0, and/or R+B=255 G=0. The corresponding output physical color values are measured by using a suitable measurement device (e.g., a Tristimulus colorimeter). - Based on the results of this measurement of the high saturation region and based on the information regarding the
core gamut 46 in the low saturation region, agamut 40 can be determined for the first display device. In other words, a mapping between the full input color space and respective output physical color values may be determined. Based on this mapping, color profile data is generated, e.g., in form of a matrix or a lookup table (LUT). One possibility of determining the color profile data will be presented below with reference toFigs. 5 ,6a, and 6b . - Similar to the measurement of the first display device, color profile data for a second display device can be generated, wherein the corresponding
gamut 42 of the second display device is indicated by dashed lines inFig. 4 . Further, the physical color values 50 resulting from the application of input digital color values in the high saturation region, for the second display device, are indicated as dashed stars in the diagram ofFig. 4 . - By using the method described above, a plurality of display devices of a set of display devices (e.g., a batch of a production line) can be profiled significantly faster than in the case that every display device is individually fully profiled. A core mapping for a low saturation region needs only to be profiled once (by using a reference display device, which may be taken from the set of display devices) and only a limited number of high saturation color values needs to be measured for the individual display devices of the set of display devices.
- With reference to
Figs. 5 ,6a, and 6b , an exemplary embodiment of generating color profile data according to the present disclosure is described. The example shown inFigs. 5 ,6a, and 6b bases on the principle described above with reference toFig. 4 . Therefore, the description ofFig. 4 above also applies to the example ofFigs. 5 ,6a, and 6b . -
Fig. 5 shows a representation of physical color values in the x-y-plane, similar to the representation ofFig. 4 . Acore gamut 46 is shown, the corners of which correspond to the digital input color values of (0,0,240), (0,240,0), and (240,0,0) (in RGB color space). Further, also a position of a white point (WP) in the physical color space (the x-y-plane) is determined by measuring a physical color value corresponding to the digital color value (255,255,255). - A
color gamut 40 is indicated by dashed lines for a display device to be measured. For example, the position and shape of thecolor gamut 40 has been determined by measuring the input color values (0,0,255), (0,255,0), and (255,0,0). As can be seen inFig. 5 , the shape of thecolor gamut 40 is rotated by an angle δ with regard to thecore gamut 46. - In
Fig. 6a , a mathematical operation is shown, describing how color profile data for the entire input color space is determined for the display device with regard to the situation shown inFig. 5 . The upper part ofFig. 6a shows color profile data in the form of acore matrix 60. In other words, thecore matrix 60 represents a core mapping of inputs digital color values in the RGB color space (as (R,G,B) vector 62) to output physical color values in the xyY color space (as (x,y,Y) vector 64). Thecore matrix 60 is a 3x3 matrix comprising nine entries a11 to a33. - By comparing the shape of the
core gamut 46 with the corner points of thegamut 40 of the display device to be measured, the angle δ can be determined. The position of the white point is known from the core mapping and has the coordinates xWP and yWP in the x-y-plane. As shown in the lower part ofFig. 6a , by multiplying thecore matrix 60 with a conversion matrix M(δ) 66, thecore gamut 46 is rotated by the angle δ around the white point WP. For the sake of clarity, the conversion matrix 66 is shown as three individual matrices, these matrices can be multiplied resulting in one 3x3 conversion matrix. - Further, a multiplication of the
matrices 66 and 60 corresponds to afinal conversion matrix 70 for the profiled display device. Such afinal conversion matrix 70 is shown in the left part ofFig. 6b . Thisfinal conversion matrix 70 may be represented as one conversion matrix having nine entries b11 to b33 by performing a matrix multiplication of thematrices 66 and 60. In other words, the color profile data for the display device is represented by a multiplication of the conversion matrix 66 with thecore matrix 60. By using the color profile data (represented by the final conversion matrix 70), for every input (R,G,B) value, a corresponding physical color value (x',y',Y') can be derived, as shown in the left part ofFig. 6b . - As an alternative to the
final conversion matrix 70, also a lookup table (LUT) 72 may be generated based on the core mapping and based on the measured physical color values of the display device to be profiled. In the above example described with reference toFig. 6a , the lookup table 72 may be generated by solving the equation shown in the lower part ofFig. 6a for a plurality of predefined (R,G,B) vectors or for a plurality of predefined (x',y',Y') vectors. - Thus,
Fig. 6b shows two examples of color profile data according to the present disclosure. In the left part, aconversion matrix 70 and in the right part, a lookup table 72. - This color profile data may be stored in a memory of the display device as color profile data in the form of a
matrix 70 and/or in the form of a lookup table (LUT) 72. Further, the color profile data may be stored in a database, which is, e.g., available via the Internet. -
Fig. 7 shows how a plurality of physical color values may be simultaneously measured for adisplay device 2. Therefore, a plurality ofmeasurement devices 60 is provided, each of themeasurements devices 60 measuring a physical color value in a predefined area of thedisplay device 2. In these predefined areas, different colors are shown, e.g., in the form of color patches as indicated inFig. 7 . In other words, different digital input color values are simultaneously applied to different areas of thedisplay device 2. The resulting physical color values are measured by a plurality ofmeasurements devices 60. This method can be applied both for profiling of the reference display and for profiling of the display devices to be profiled. By using the technique shown inFig. 7 , a total time for profiling a display device can be drastically reduced.
Claims (14)
- A method for color profiling of a display device (2), comprising:applying a plurality of digital color values to a reference display device, wherein the digital color values are located in a low saturation region of an input color space;measuring a plurality of physical color values output by the reference display device, the physical color values being associated with the applied digital color values;determining, based on the measured physical color values of the reference display device, a core mapping (60) of digital color values of the low saturation region of the input color space to physical color values output by the reference display device;applying (10) a plurality of digital color values to a display device (2), wherein the digital color values are located in a high saturation region of the input color space;measuring (12) a plurality of physical color values (48, 50) output by the display device (2), the physical color values (48, 50) being associated with the applied digital color values; andgenerating (14) color profile data for the display device by determining a mapping of digital color values of the full input color space to physical color values output by the display device, based on the measured physical color values and based on the core mapping (60),wherein the low saturation region comprises low saturation digital color values that are not comprised by the high saturation region.
- The method of claim 1, further comprising:
performing the steps of applying (10), measuring (12), and generating (14) for each of a plurality of display devices (2) of a set of display devices in order to perform color profiling of each of the plurality of display devices (2). - The method of claim 1 or 2, wherein
a number of the digital color values applied to the display device (2) is smaller than a number of the digital color values applied to the reference display device. - The method of any of claims 1 to 3, wherein
measuring a plurality of physical color values output by the display device (2) comprises outputting and measuring at least two of the plurality of physical color values simultaneously by using different areas of the display device (2). - The method of any of claims 1 to 4, wherein
the high saturation region is defined as consisting of digital color values having a saturation value above a first saturation threshold value. - The method of any of claims 1 to 5, wherein
the low saturation region is defined as consisting of digital color values having a saturation value below a second saturation threshold value. - The method of any of claims 1 to 6, wherein
the plurality of digital color values located in the high saturation region of the input color space comprises at least one digital color value having a value of maximum saturation. - The method of any of claims 1 to 7, further comprising:
storing the color profile data in a memory of the display device (2). - The method of any of claims 2 to 8, wherein the set of display devices consists of display devices of the same model and manufacturer.
- The method of any of claims 2 to 9, wherein the set of display devices consist of display devices of the same batch of a production line.
- The method of any of claims 1 to 10, wherein the core mapping comprises a first conversion matrix (60) for mapping input digital color values to output physical color values and wherein the color profile data comprises a second conversion matrix (70) mapping input digital color values to output physical color values.
- The method of claim 11, wherein the second conversion matrix (70) comprises a rotation matrix.
- A computer program product comprising program code portions for performing the steps of any of claims 1 to 12 when the computer program product is executed by one or more processors.
- A device (20) for color profiling of a display device (2), the device (20) being configured for:applying a plurality of digital color values to a reference display device, wherein the digital color values are located in a low saturation region of an input color space;measuring a plurality of physical color values output by the reference display device, the physical color values being associated with the applied digital color values;determining, based on the measured physical color values of the reference display device, a core mapping (60) of digital color values of the low saturation region of the input color space to physical color values output by the reference display device;applying a plurality of digital color values to a display device (2), wherein the digital color values are located in a high saturation region of the input color space;measuring a plurality of physical color values (48, 50) output by the display device, the physical color values (48, 50) being associated with the applied digital color values; andgenerating color profile data for the display device by determining a mapping of digital color values of the full input color space to physical color values output by the display device, based on the measured physical color values and based on the core mapping (60),wherein the low saturation region comprises low saturation digital color values that are not comprised by the high saturation region.
Priority Applications (4)
| Application Number | Priority Date | Filing Date | Title |
|---|---|---|---|
| EP16001812.3A EP3285252B1 (en) | 2016-08-17 | 2016-08-17 | Technique for color profiling of a display device |
| TW106125485A TWI640976B (en) | 2016-08-17 | 2017-07-28 | Technique for color profiling of a display device |
| KR1020170103474A KR101967416B1 (en) | 2016-08-17 | 2017-08-16 | Technique for color profiling of a display device |
| CN201710708160.5A CN107767825B (en) | 2016-08-17 | 2017-08-17 | Method, apparatus, and computer-readable storage medium for color configuration of display apparatus |
Applications Claiming Priority (1)
| Application Number | Priority Date | Filing Date | Title |
|---|---|---|---|
| EP16001812.3A EP3285252B1 (en) | 2016-08-17 | 2016-08-17 | Technique for color profiling of a display device |
Publications (2)
| Publication Number | Publication Date |
|---|---|
| EP3285252A1 EP3285252A1 (en) | 2018-02-21 |
| EP3285252B1 true EP3285252B1 (en) | 2020-02-12 |
Family
ID=56883470
Family Applications (1)
| Application Number | Title | Priority Date | Filing Date |
|---|---|---|---|
| EP16001812.3A Active EP3285252B1 (en) | 2016-08-17 | 2016-08-17 | Technique for color profiling of a display device |
Country Status (4)
| Country | Link |
|---|---|
| EP (1) | EP3285252B1 (en) |
| KR (1) | KR101967416B1 (en) |
| CN (1) | CN107767825B (en) |
| TW (1) | TWI640976B (en) |
Families Citing this family (5)
| Publication number | Priority date | Publication date | Assignee | Title |
|---|---|---|---|---|
| CN111291543B (en) * | 2018-11-21 | 2023-08-25 | 北京国双科技有限公司 | Data display method and device, storage medium and processor |
| JP7187381B2 (en) * | 2019-05-07 | 2022-12-12 | 日本化薬株式会社 | liquid crystal display |
| CN110782834B (en) * | 2019-08-27 | 2021-01-22 | 昆山国显光电有限公司 | Display compensation method, device, display panel and system |
| DE102019216415B4 (en) * | 2019-10-24 | 2022-02-24 | Volkswagen Aktiengesellschaft | Method and device for controlling interior lighting for a vehicle |
| CN119915381B (en) * | 2025-03-20 | 2025-06-13 | 深圳市德兰明海新能源股份有限公司 | Color detection method and device |
Family Cites Families (18)
| Publication number | Priority date | Publication date | Assignee | Title |
|---|---|---|---|---|
| JP3681961B2 (en) * | 2000-07-03 | 2005-08-10 | 三菱電機株式会社 | Display unit, display adjustment device, and display device |
| US8120812B2 (en) * | 2003-08-14 | 2012-02-21 | Xerox Corporation | System and method for obtaining color consistency for a color print job across multiple output devices |
| CN1951101A (en) * | 2004-05-11 | 2007-04-18 | 皇家飞利浦电子股份有限公司 | Method for processing color image data |
| KR100754203B1 (en) * | 2006-02-03 | 2007-09-03 | 삼성전자주식회사 | Method and device for generating color profile, computer-readable recording medium recording program |
| KR101303874B1 (en) * | 2006-02-10 | 2013-09-04 | 삼성전자주식회사 | Apparatus and method for gamut mapping |
| US7592996B2 (en) * | 2006-06-02 | 2009-09-22 | Samsung Electronics Co., Ltd. | Multiprimary color display with dynamic gamut mapping |
| EP2076898B1 (en) * | 2006-10-12 | 2018-12-19 | TP Vision Holding B.V. | A color mapping method |
| EP2135439B1 (en) * | 2007-04-03 | 2018-03-28 | Thomson Licensing DTV | Methods and systems for displays with chromatic correction with differing chromatic ranges |
| US7777760B2 (en) * | 2007-06-29 | 2010-08-17 | Apple Inc. | Display color correcting system |
| EP2180461A1 (en) * | 2008-10-23 | 2010-04-28 | TPO Displays Corp. | Method of color gamut mapping of color input values of input image pixels of an input image to RGBW output values for an RGBW display, display module, display controller and apparatus using such method |
| PT2389670T (en) * | 2009-01-21 | 2018-12-17 | Guangdong Oppo Mobile Telecommunications Corp Ltd | Apparatus and methods for color displays |
| US8384733B2 (en) * | 2009-04-30 | 2013-02-26 | Hewlett-Packard Development Company, L.P. | System and method for adjusting display input values |
| CN102985906B (en) * | 2010-07-16 | 2015-12-02 | 惠普发展公司,有限责任合伙企业 | Color based on color profile adjustment display device exports |
| US8902246B2 (en) * | 2010-12-22 | 2014-12-02 | Apple Inc. | Color correction for wide gamut systems |
| US20130135335A1 (en) * | 2011-11-30 | 2013-05-30 | Qualcomm Mems Technologies, Inc. | Methods and apparatus for interpolating colors |
| JP5887980B2 (en) * | 2012-02-15 | 2016-03-16 | 株式会社リコー | Color management system |
| JP6288943B2 (en) * | 2013-05-20 | 2018-03-07 | 三星ディスプレイ株式會社Samsung Display Co.,Ltd. | Video display device |
| TWI490849B (en) * | 2013-12-23 | 2015-07-01 | Au Optronics Corp | Method for controlling display |
-
2016
- 2016-08-17 EP EP16001812.3A patent/EP3285252B1/en active Active
-
2017
- 2017-07-28 TW TW106125485A patent/TWI640976B/en active
- 2017-08-16 KR KR1020170103474A patent/KR101967416B1/en active Active
- 2017-08-17 CN CN201710708160.5A patent/CN107767825B/en active Active
Non-Patent Citations (1)
| Title |
|---|
| None * |
Also Published As
| Publication number | Publication date |
|---|---|
| TWI640976B (en) | 2018-11-11 |
| CN107767825B (en) | 2020-09-25 |
| KR101967416B1 (en) | 2019-04-10 |
| EP3285252A1 (en) | 2018-02-21 |
| KR20180020107A (en) | 2018-02-27 |
| TW201807699A (en) | 2018-03-01 |
| CN107767825A (en) | 2018-03-06 |
Similar Documents
| Publication | Publication Date | Title |
|---|---|---|
| US9659388B1 (en) | White point calibration and gamut mapping for a display | |
| CN111429827B (en) | Display screen color calibration method and device, electronic equipment and readable storage medium | |
| US8289344B2 (en) | Methods and apparatus for color uniformity | |
| KR101967416B1 (en) | Technique for color profiling of a display device | |
| KR20190055289A (en) | Method of converting color gamut and display device employing the same | |
| EP3262630B1 (en) | Steady color presentation manager | |
| US10424269B2 (en) | Flexible addressing for a three dimensional (3-D) look up table (LUT) used for gamut mapping | |
| EP3961551B1 (en) | Gamut conversion method and apparatus, and medium | |
| US9626775B1 (en) | White point calibration and gamut mapping for a display | |
| US20200036867A1 (en) | Color gamut mapping method and color gamut mapping device | |
| CN102985906B (en) | Color based on color profile adjustment display device exports | |
| CN117746808B (en) | Display calibration methods, display panel calibration systems, and display devices. | |
| CN108717839A (en) | A kind of conversion method of RGB to RGBW, device and storage medium | |
| WO2024000465A1 (en) | Method and apparatus for generating color mapping table, method and apparatus for correcting color mapping table, and medium and device | |
| US20240242319A1 (en) | Perceptually accurate image rendering | |
| US12620134B2 (en) | Generating color correction model including color space conversion, through an interpolation algorithm according to color data of reference sampling points | |
| US10354614B2 (en) | Technique for color management for a set of display devices | |
| CN113920927B (en) | Display method, display panel and electronic equipment | |
| US9491453B2 (en) | Measurement position determination apparatus, image display system, and non-transitory computer readable medium | |
| CN119418629B (en) | Color correction method, device, equipment and medium | |
| CN107492365B (en) | Method and device for obtaining color gamut mapping fitting function | |
| JP5664758B1 (en) | Color conversion apparatus and program | |
| CN119252208A (en) | Display screen calibration method and electronic device | |
| EP2871634A1 (en) | Color improvement of selected part of an image |
Legal Events
| Date | Code | Title | Description |
|---|---|---|---|
| PUAI | Public reference made under article 153(3) epc to a published international application that has entered the european phase |
Free format text: ORIGINAL CODE: 0009012 |
|
| STAA | Information on the status of an ep patent application or granted ep patent |
Free format text: STATUS: REQUEST FOR EXAMINATION WAS MADE |
|
| 17P | Request for examination filed |
Effective date: 20170424 |
|
| AK | Designated contracting states |
Kind code of ref document: A1 Designated state(s): AL AT BE BG CH CY CZ DE DK EE ES FI FR GB GR HR HU IE IS IT LI LT LU LV MC MK MT NL NO PL PT RO RS SE SI SK SM TR |
|
| AX | Request for extension of the european patent |
Extension state: BA ME |
|
| GRAP | Despatch of communication of intention to grant a patent |
Free format text: ORIGINAL CODE: EPIDOSNIGR1 |
|
| STAA | Information on the status of an ep patent application or granted ep patent |
Free format text: STATUS: GRANT OF PATENT IS INTENDED |
|
| INTG | Intention to grant announced |
Effective date: 20190906 |
|
| GRAS | Grant fee paid |
Free format text: ORIGINAL CODE: EPIDOSNIGR3 |
|
| GRAA | (expected) grant |
Free format text: ORIGINAL CODE: 0009210 |
|
| STAA | Information on the status of an ep patent application or granted ep patent |
Free format text: STATUS: THE PATENT HAS BEEN GRANTED |
|
| AK | Designated contracting states |
Kind code of ref document: B1 Designated state(s): AL AT BE BG CH CY CZ DE DK EE ES FI FR GB GR HR HU IE IS IT LI LT LU LV MC MK MT NL NO PL PT RO RS SE SI SK SM TR |
|
| REG | Reference to a national code |
Ref country code: GB Ref legal event code: FG4D |
|
| REG | Reference to a national code |
Ref country code: CH Ref legal event code: EP |
|
| REG | Reference to a national code |
Ref country code: AT Ref legal event code: REF Ref document number: 1233163 Country of ref document: AT Kind code of ref document: T Effective date: 20200215 |
|
| REG | Reference to a national code |
Ref country code: IE Ref legal event code: FG4D |
|
| REG | Reference to a national code |
Ref country code: DE Ref legal event code: R096 Ref document number: 602016029333 Country of ref document: DE |
|
| PG25 | Lapsed in a contracting state [announced via postgrant information from national office to epo] |
Ref country code: RS Free format text: LAPSE BECAUSE OF FAILURE TO SUBMIT A TRANSLATION OF THE DESCRIPTION OR TO PAY THE FEE WITHIN THE PRESCRIBED TIME-LIMIT Effective date: 20200212 Ref country code: NO Free format text: LAPSE BECAUSE OF FAILURE TO SUBMIT A TRANSLATION OF THE DESCRIPTION OR TO PAY THE FEE WITHIN THE PRESCRIBED TIME-LIMIT Effective date: 20200512 Ref country code: FI Free format text: LAPSE BECAUSE OF FAILURE TO SUBMIT A TRANSLATION OF THE DESCRIPTION OR TO PAY THE FEE WITHIN THE PRESCRIBED TIME-LIMIT Effective date: 20200212 |
|
| REG | Reference to a national code |
Ref country code: LT Ref legal event code: MG4D |
|
| REG | Reference to a national code |
Ref country code: NL Ref legal event code: MP Effective date: 20200212 |
|
| PG25 | Lapsed in a contracting state [announced via postgrant information from national office to epo] |
Ref country code: SE Free format text: LAPSE BECAUSE OF FAILURE TO SUBMIT A TRANSLATION OF THE DESCRIPTION OR TO PAY THE FEE WITHIN THE PRESCRIBED TIME-LIMIT Effective date: 20200212 Ref country code: LV Free format text: LAPSE BECAUSE OF FAILURE TO SUBMIT A TRANSLATION OF THE DESCRIPTION OR TO PAY THE FEE WITHIN THE PRESCRIBED TIME-LIMIT Effective date: 20200212 Ref country code: HR Free format text: LAPSE BECAUSE OF FAILURE TO SUBMIT A TRANSLATION OF THE DESCRIPTION OR TO PAY THE FEE WITHIN THE PRESCRIBED TIME-LIMIT Effective date: 20200212 Ref country code: BG Free format text: LAPSE BECAUSE OF FAILURE TO SUBMIT A TRANSLATION OF THE DESCRIPTION OR TO PAY THE FEE WITHIN THE PRESCRIBED TIME-LIMIT Effective date: 20200512 Ref country code: IS Free format text: LAPSE BECAUSE OF FAILURE TO SUBMIT A TRANSLATION OF THE DESCRIPTION OR TO PAY THE FEE WITHIN THE PRESCRIBED TIME-LIMIT Effective date: 20200612 Ref country code: GR Free format text: LAPSE BECAUSE OF FAILURE TO SUBMIT A TRANSLATION OF THE DESCRIPTION OR TO PAY THE FEE WITHIN THE PRESCRIBED TIME-LIMIT Effective date: 20200513 |
|
| PG25 | Lapsed in a contracting state [announced via postgrant information from national office to epo] |
Ref country code: NL Free format text: LAPSE BECAUSE OF FAILURE TO SUBMIT A TRANSLATION OF THE DESCRIPTION OR TO PAY THE FEE WITHIN THE PRESCRIBED TIME-LIMIT Effective date: 20200212 |
|
| PG25 | Lapsed in a contracting state [announced via postgrant information from national office to epo] |
Ref country code: RO Free format text: LAPSE BECAUSE OF FAILURE TO SUBMIT A TRANSLATION OF THE DESCRIPTION OR TO PAY THE FEE WITHIN THE PRESCRIBED TIME-LIMIT Effective date: 20200212 Ref country code: CZ Free format text: LAPSE BECAUSE OF FAILURE TO SUBMIT A TRANSLATION OF THE DESCRIPTION OR TO PAY THE FEE WITHIN THE PRESCRIBED TIME-LIMIT Effective date: 20200212 Ref country code: SK Free format text: LAPSE BECAUSE OF FAILURE TO SUBMIT A TRANSLATION OF THE DESCRIPTION OR TO PAY THE FEE WITHIN THE PRESCRIBED TIME-LIMIT Effective date: 20200212 Ref country code: PT Free format text: LAPSE BECAUSE OF FAILURE TO SUBMIT A TRANSLATION OF THE DESCRIPTION OR TO PAY THE FEE WITHIN THE PRESCRIBED TIME-LIMIT Effective date: 20200705 Ref country code: ES Free format text: LAPSE BECAUSE OF FAILURE TO SUBMIT A TRANSLATION OF THE DESCRIPTION OR TO PAY THE FEE WITHIN THE PRESCRIBED TIME-LIMIT Effective date: 20200212 Ref country code: DK Free format text: LAPSE BECAUSE OF FAILURE TO SUBMIT A TRANSLATION OF THE DESCRIPTION OR TO PAY THE FEE WITHIN THE PRESCRIBED TIME-LIMIT Effective date: 20200212 Ref country code: LT Free format text: LAPSE BECAUSE OF FAILURE TO SUBMIT A TRANSLATION OF THE DESCRIPTION OR TO PAY THE FEE WITHIN THE PRESCRIBED TIME-LIMIT Effective date: 20200212 Ref country code: SM Free format text: LAPSE BECAUSE OF FAILURE TO SUBMIT A TRANSLATION OF THE DESCRIPTION OR TO PAY THE FEE WITHIN THE PRESCRIBED TIME-LIMIT Effective date: 20200212 Ref country code: EE Free format text: LAPSE BECAUSE OF FAILURE TO SUBMIT A TRANSLATION OF THE DESCRIPTION OR TO PAY THE FEE WITHIN THE PRESCRIBED TIME-LIMIT Effective date: 20200212 |
|
| REG | Reference to a national code |
Ref country code: DE Ref legal event code: R097 Ref document number: 602016029333 Country of ref document: DE |
|
| REG | Reference to a national code |
Ref country code: AT Ref legal event code: MK05 Ref document number: 1233163 Country of ref document: AT Kind code of ref document: T Effective date: 20200212 |
|
| PLBE | No opposition filed within time limit |
Free format text: ORIGINAL CODE: 0009261 |
|
| STAA | Information on the status of an ep patent application or granted ep patent |
Free format text: STATUS: NO OPPOSITION FILED WITHIN TIME LIMIT |
|
| 26N | No opposition filed |
Effective date: 20201113 |
|
| PG25 | Lapsed in a contracting state [announced via postgrant information from national office to epo] |
Ref country code: AT Free format text: LAPSE BECAUSE OF FAILURE TO SUBMIT A TRANSLATION OF THE DESCRIPTION OR TO PAY THE FEE WITHIN THE PRESCRIBED TIME-LIMIT Effective date: 20200212 Ref country code: IT Free format text: LAPSE BECAUSE OF FAILURE TO SUBMIT A TRANSLATION OF THE DESCRIPTION OR TO PAY THE FEE WITHIN THE PRESCRIBED TIME-LIMIT Effective date: 20200212 |
|
| PG25 | Lapsed in a contracting state [announced via postgrant information from national office to epo] |
Ref country code: PL Free format text: LAPSE BECAUSE OF FAILURE TO SUBMIT A TRANSLATION OF THE DESCRIPTION OR TO PAY THE FEE WITHIN THE PRESCRIBED TIME-LIMIT Effective date: 20200212 Ref country code: SI Free format text: LAPSE BECAUSE OF FAILURE TO SUBMIT A TRANSLATION OF THE DESCRIPTION OR TO PAY THE FEE WITHIN THE PRESCRIBED TIME-LIMIT Effective date: 20200212 |
|
| PG25 | Lapsed in a contracting state [announced via postgrant information from national office to epo] |
Ref country code: MC Free format text: LAPSE BECAUSE OF FAILURE TO SUBMIT A TRANSLATION OF THE DESCRIPTION OR TO PAY THE FEE WITHIN THE PRESCRIBED TIME-LIMIT Effective date: 20200212 |
|
| REG | Reference to a national code |
Ref country code: CH Ref legal event code: PL |
|
| PG25 | Lapsed in a contracting state [announced via postgrant information from national office to epo] |
Ref country code: CH Free format text: LAPSE BECAUSE OF NON-PAYMENT OF DUE FEES Effective date: 20200831 Ref country code: LU Free format text: LAPSE BECAUSE OF NON-PAYMENT OF DUE FEES Effective date: 20200817 Ref country code: LI Free format text: LAPSE BECAUSE OF NON-PAYMENT OF DUE FEES Effective date: 20200831 |
|
| REG | Reference to a national code |
Ref country code: BE Ref legal event code: MM Effective date: 20200831 |
|
| PG25 | Lapsed in a contracting state [announced via postgrant information from national office to epo] |
Ref country code: BE Free format text: LAPSE BECAUSE OF NON-PAYMENT OF DUE FEES Effective date: 20200831 Ref country code: IE Free format text: LAPSE BECAUSE OF NON-PAYMENT OF DUE FEES Effective date: 20200817 |
|
| PG25 | Lapsed in a contracting state [announced via postgrant information from national office to epo] |
Ref country code: TR Free format text: LAPSE BECAUSE OF FAILURE TO SUBMIT A TRANSLATION OF THE DESCRIPTION OR TO PAY THE FEE WITHIN THE PRESCRIBED TIME-LIMIT Effective date: 20200212 Ref country code: MT Free format text: LAPSE BECAUSE OF FAILURE TO SUBMIT A TRANSLATION OF THE DESCRIPTION OR TO PAY THE FEE WITHIN THE PRESCRIBED TIME-LIMIT Effective date: 20200212 Ref country code: CY Free format text: LAPSE BECAUSE OF FAILURE TO SUBMIT A TRANSLATION OF THE DESCRIPTION OR TO PAY THE FEE WITHIN THE PRESCRIBED TIME-LIMIT Effective date: 20200212 |
|
| PG25 | Lapsed in a contracting state [announced via postgrant information from national office to epo] |
Ref country code: MK Free format text: LAPSE BECAUSE OF FAILURE TO SUBMIT A TRANSLATION OF THE DESCRIPTION OR TO PAY THE FEE WITHIN THE PRESCRIBED TIME-LIMIT Effective date: 20200212 Ref country code: AL Free format text: LAPSE BECAUSE OF FAILURE TO SUBMIT A TRANSLATION OF THE DESCRIPTION OR TO PAY THE FEE WITHIN THE PRESCRIBED TIME-LIMIT Effective date: 20200212 |
|
| P01 | Opt-out of the competence of the unified patent court (upc) registered |
Effective date: 20231010 |
|
| PGFP | Annual fee paid to national office [announced via postgrant information from national office to epo] |
Ref country code: DE Payment date: 20250819 Year of fee payment: 10 |
|
| PGFP | Annual fee paid to national office [announced via postgrant information from national office to epo] |
Ref country code: GB Payment date: 20250822 Year of fee payment: 10 |
|
| PGFP | Annual fee paid to national office [announced via postgrant information from national office to epo] |
Ref country code: FR Payment date: 20250821 Year of fee payment: 10 |