EP3264093A1 - Method for diagnosing diseases through oligomer analysis of abnormally aggregated proteins - Google Patents
Method for diagnosing diseases through oligomer analysis of abnormally aggregated proteins Download PDFInfo
- Publication number
- EP3264093A1 EP3264093A1 EP16883939.7A EP16883939A EP3264093A1 EP 3264093 A1 EP3264093 A1 EP 3264093A1 EP 16883939 A EP16883939 A EP 16883939A EP 3264093 A1 EP3264093 A1 EP 3264093A1
- Authority
- EP
- European Patent Office
- Prior art keywords
- body fluid
- dilution
- fluid sample
- oligomer
- change
- Prior art date
- Legal status (The legal status is an assumption and is not a legal conclusion. Google has not performed a legal analysis and makes no representation as to the accuracy of the status listed.)
- Granted
Links
Images



Classifications
-
- G—PHYSICS
- G01—MEASURING; TESTING
- G01N—INVESTIGATING OR ANALYSING MATERIALS BY DETERMINING THEIR CHEMICAL OR PHYSICAL PROPERTIES
- G01N33/00—Investigating or analysing materials by specific methods not covered by groups G01N1/00 - G01N31/00
- G01N33/48—Biological material, e.g. blood, urine; Haemocytometers
- G01N33/50—Chemical analysis of biological material, e.g. blood, urine; Testing involving biospecific ligand binding methods; Immunological testing
- G01N33/68—Chemical analysis of biological material, e.g. blood, urine; Testing involving biospecific ligand binding methods; Immunological testing involving proteins, peptides or amino acids
- G01N33/6893—Chemical analysis of biological material, e.g. blood, urine; Testing involving biospecific ligand binding methods; Immunological testing involving proteins, peptides or amino acids related to diseases not provided for elsewhere
- G01N33/6896—Neurological disorders, e.g. Alzheimer's disease
-
- G—PHYSICS
- G01—MEASURING; TESTING
- G01N—INVESTIGATING OR ANALYSING MATERIALS BY DETERMINING THEIR CHEMICAL OR PHYSICAL PROPERTIES
- G01N27/00—Investigating or analysing materials by the use of electric, electrochemical, or magnetic means
- G01N27/02—Investigating or analysing materials by the use of electric, electrochemical, or magnetic means by investigating impedance
-
- G—PHYSICS
- G01—MEASURING; TESTING
- G01N—INVESTIGATING OR ANALYSING MATERIALS BY DETERMINING THEIR CHEMICAL OR PHYSICAL PROPERTIES
- G01N2333/00—Assays involving biological materials from specific organisms or of a specific nature
- G01N2333/435—Assays involving biological materials from specific organisms or of a specific nature from animals; from humans
- G01N2333/46—Assays involving biological materials from specific organisms or of a specific nature from animals; from humans from vertebrates
- G01N2333/47—Assays involving proteins of known structure or function as defined in the subgroups
-
- G—PHYSICS
- G01—MEASURING; TESTING
- G01N—INVESTIGATING OR ANALYSING MATERIALS BY DETERMINING THEIR CHEMICAL OR PHYSICAL PROPERTIES
- G01N2333/00—Assays involving biological materials from specific organisms or of a specific nature
- G01N2333/435—Assays involving biological materials from specific organisms or of a specific nature from animals; from humans
- G01N2333/46—Assays involving biological materials from specific organisms or of a specific nature from animals; from humans from vertebrates
- G01N2333/47—Assays involving proteins of known structure or function as defined in the subgroups
- G01N2333/4701—Details
- G01N2333/4709—Amyloid plaque core protein
-
- G—PHYSICS
- G01—MEASURING; TESTING
- G01N—INVESTIGATING OR ANALYSING MATERIALS BY DETERMINING THEIR CHEMICAL OR PHYSICAL PROPERTIES
- G01N27/00—Investigating or analysing materials by the use of electric, electrochemical, or magnetic means
- G01N27/02—Investigating or analysing materials by the use of electric, electrochemical, or magnetic means by investigating impedance
- G01N27/026—Dielectric impedance spectroscopy
-
- G—PHYSICS
- G01—MEASURING; TESTING
- G01N—INVESTIGATING OR ANALYSING MATERIALS BY DETERMINING THEIR CHEMICAL OR PHYSICAL PROPERTIES
- G01N2800/00—Detection or diagnosis of diseases
- G01N2800/28—Neurological disorders
Definitions
- the present invention relates to an analysis method for the aggregated protein content in a body fluid. More particularly, the present invention related to a method for diagnosing a disease using an analysis of oligomer in an abnormal aggregated protein that involves measuring a concentration change of a protein in a body fluid like blood according to a dilution ratio and detecting a slope to estimate a proportion of the monomer and oligomer of the protein and thereby to make a diagnosis of normal or abnormal protein aggregation or the associated diseases with accuracy.
- Neuronal dysfunctions and impairments are caused by toxic aggregation-prone proteins, and they are characteristic to many neurological disorders, which include, for example, amyotrophic lateral sclerosis, Alzheimer's disease, Parkinson's disease, prion disease, polyglutamine expansion diseases, spinocerebellar ataxia, spinal/spinobulbar muscular atrophy, spongiform encephalopathy, tauopathy, Huntington's disease, dystonia, and so forth.
- the proteins coding the toxic aggregation-prone proteins causing the diseases and the genes coding the proteins have been identified.
- the normal metabolizing enzymes recirculate the proteins participating in the permanent circulation of synthesis and decomposition.
- misfolded proteins accumulate and decompose in an abnormal manner.
- Such misfolded proteins are known to incur the formation of inclusion bodies and plaques of neurons that may indicate a damage of the neurons. It is therefore important to understand cellular mechanisms and to identify molecular means essential in reducing, inhibiting and improving the misfolded proteins.
- reasonable and effective therapeutic methods for those diseases can be exploited from the understanding of the effects of protein misfolding and aggregation on the survival of neurons.
- Korean Patent No. 100595495 (registered on June 23, 2006 ) discloses a diagnosis kit of Alzheimer's patient against normal persons that uses a secondary antibody-marker conjugate and a chromogenic substrate solution for the marker to participate in the antigen-antibody reaction of a specific amyloid ⁇ .
- Korean Patent No. 1173677 (registered on July 7, 2012 ) suggests a pharmaceutical composition for preventing or treating a disease associated with amyloid ⁇ accumulation, which composition contains EPPS(N-2-hydroxyethyl)piperazine-N'-(3-propanesulfonate)) represented by a specific chemical formula as an active component.
- the conventional methods use a biosensor to detect the impedance or protein concentration of blood necessary for a diagnosis and compares the impedance or protein concentration of blood with a reference value of a normal person to diagnose normal or abnormal protein aggregation or the associated diseases.
- the measurements (numerical values) of the protein concentration or impedance of blood are not enough to clarify the difference between a normal person and a patient, so it is impossible to tell a patient from a normal person or to make a diagnosis with accuracy. Namely, the measurements (numerical values) of the protein concentration or impedance of blood do not have a clear distinction between a normal person and a patient enough to definitely tell the patient from the normal person, resulting in reducing the accuracy and reliability of the diagnosis.
- a method for predicting a possibility of disease using an analysis of oligomer of an abnormal aggregated protein that includes: (1) preparing a body fluid sample including at least one of blood, blood plasma, blood serum, saliva, urine, tear, and mucus; (2) making a dilution of the body fluid sample; (3) using a biosensor to measure and detect an aggregated protein in the diluted body fluid sample; (4) analyzing a signal change of the biosensor caused by the dilution of the aggregated protein to determine a slope according to the dilution from the measurements; and (5) analyzing a proportion of the oligomer from the slope according to the dilution to make a diagnosis.
- the method of diagnosing a disease using an analysis of oligomer of an abnormal aggregated protein uses a electricity/optics-based biosensor to measure the concentration of an aggregated protein in a body fluid like blood and detects the relative proportions of the monomer and oligomer in terms of a slope according to the concentration change, thereby diagnosing normal or abnormal protein aggregation and the associated diseases with accuracy.
- the neuronal exosome analysis method of determining the protein content using exosome extracted from the blood plasma as well as the blood plasma is additionally used to make the better distinction of the slope according to the relative proportions of the monomer and oligomer, thereby diagnosing normal or abnormal protein aggregation and the associated diseases with more accuracy and enhancing the reliability of the diagnosis.
- FIG. 1 is a block diagram showing the construction of an impedance biosensor used in the embodiment of the present invention.
- the impedance biosensor may be comprised of an electrochemical impedance spectroscopy (EIS) sensor array (a) and a bead EIS (BEIS) platform (b).
- EIS electrochemical impedance spectroscopy
- BEIS bead EIS
- a working/counter electrode is formed of Pt/Ti metal and a microwell is made of an SU-8 electrode.
- the working/counter electrode may form an array of 10*10 or 20*20 or more electrodes.
- the microwell is to focus the electric field on the surface of magnetic beads arranged between the working/counter electrodes.
- the BEIS platform (b) has a plurality of BEIS sensor arrays to form a PDMS microfluidic channel (optional), and a permanent magnet or an electromagnet arranged on the back surface of the BEIS platform (b).
- the size of biomolecules and the quantity of electric charge affect the output of the sensor.
- the biosensor as used herein may include an optical enzyme linked immunoassay (ELISA) analytical sensor, a surface plasmon resonance (SPR) analytical sensor, and other electricity-based biosensors (e.g., FET sensors, electrochemical sensors, etc.), and so on.
- ELISA optical enzyme linked immunoassay
- SPR surface plasmon resonance
- other electricity-based biosensors e.g., FET sensors, electrochemical sensors, etc.
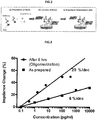
- FIG. 2 is an illustration explaining a method of measuring the impedance of amyloid ⁇ using the biosensor platform of FIG. 1
- FIG. 3 is a graph showing an impedance change according to the impedance measurements of amyloid ⁇ in FIG. 2 .
- a first antibody 1E11, amyloid ⁇ (A ⁇ ) and magnetic beads are incubated for a predetermined time (e.g., 45 minutes) and washed with a buffer solution in order to minimize the occurrence of unspecific reactions, in step (a).
- the solution containing the magnetic beads are made to flow on an electrode, which is then placed into a microwell formed on a substrate using a magnet, in step (b).
- a measurement is performed to detect the electrochemical impedance incurred due to the amyloid ⁇ (A ⁇ ) participating in a reaction with the antibody and stuck to the surface of the beads.
- the impedance value is reduced to the relative percentage in comparison with a reference value that is the impedance value of beads not reactive to the sample. This can minimize the error by the impedance change specific to the device.
- the sample may be a body fluid including at least one of blood, blood plasma, blood serum, saliva, urine, tear, and mucus.
- the measurement may also be performed to detect the impedance of the beads reactive to at least one of Tau, alpha-synuclein, PrPsc, and Huntingtin, in addition to the impedance of the beads reactive to amyloid ⁇ .
- a diagnosis is performed by measuring and graphing a change of at least one of the proportion, concentration, level, detected amount, and impedance of the monomer and the oligomer specific to a patient and a normal person, to distinguish the patient from the normal person by the oligomer-to-monomer numerical difference or the monomer-to-oligomer numerical difference.
- a description will be given as to a measurement example in which a detection is made for the impedance of beads reactive to amyloid ⁇ in a prepared blood sample.
- the oligomeric amyloid ⁇ has a great increase in the slope change of the electrochemical impedance.
- the monomeric amyloid ⁇ has a different slope from the oligomeric amyloid ⁇ in the measurement of impedance change as a function of the concentration. More specifically, the slope of the monomeric amyloid ⁇ is 6 %/dec, while that of the oligomeric amyloid ⁇ (A ⁇ ) is 20 %/dec.
- the oligomeric amyloid ⁇ (A ⁇ ) displays the higher slope in the concentration change than the monomeric amyloid ⁇ .
- the impedance change is in proportion to the size of biomolecules.
- the slope in the output impedance over the concentration increases with an elapse of time. Further, the amount of the accumulating oligomeric amyloid ⁇ (A ⁇ ) is in correspondence to the time.
- FIG. 4 is an illustration of a diagnosis method using the slope in the concentration change of amyloid ⁇ (A ⁇ ) detected by the method of FIG. 2 .
- the measurements at point Z1 and Z2 indicate the absolute amount (e.g., the total concentration) of the accumulating amyloid ⁇ (A ⁇ ) in the body fluid samples from first and second examinees NC and AC, respectively.
- the measurements as given herein are merely experimental numerals, so the absolute amount may greatly vary depending on the physical characteristics.
- Both the body fluid samples of the first and second examinees NC and AD contain a mix of monomeric amyloid ⁇ and oligomeric amyloid ⁇ . Yet, the sample of the second examinee AD has the higher content of oligomeric amyloid ⁇ . Accordingly, with an increase in the oligomeric amyloid ⁇ proportion in the sample, the second examinee has a higher slope in the concentration change.
- the numeric values of the monomer and the oligomer specific to a patient and a normal person can be expressed in terms of a slope.
- the diagnosis can be accomplished to distinguish the patient from the normal person by the oligomer-to-monomer numerical difference or the monomer-to-oligomer numerical difference.
- FIG. 5 is a graph showing the impedance measurement results for amyloid ⁇ in blood plasma of FIG. 2 .
- the electrochemical impedance measurements of the beads in the blood plasma do not provide a definite numerical distinction between the first and second examinees NC and AD.
- the minimum numerical difference between the first and second examinees NC and AD is the only one obtainable from the measurements.
- the physical differences or abilities of the first and second examinees NC and AD make the difference in the electrochemical impedance, causing the risk of misinterpretation in the diagnosis.
- the reference value is hard to determine, which disables the definite distinction between the first and second examinees NC and AD.
- FIG. 6 is an illustration explaining a method of detecting a slope according to the concentration change of amyloid B using the biosensor platform of FIG. 1 .
- step (a) antibody-bound magnetic beads is incubated for a predetermined time (e.g., 45 minutes), in step (a).
- the magnetic beads with an antibody and the sample of an abnormal person (patient) in need of diagnosis are allowed to react with each other for about one hour, in step (b).
- the sample of the patient is diluted by 1/5 of concentration each time to prepare four to five test samples (e.g., 1, 1/5, 1/25, 1/125, and 1/625 in concentration), which method is desirable in the aspect of the experimental results.
- step (c) the patient's sample beads are placed in the microwell region of an EIS sensor and measured in regards to the concentration of amyloid ⁇ , in step (c).
- the procedures of the steps (b) and (c) are repeated as often as the number of the patient's samples prepared in the step (a) to perform measurement and detection.
- FIG. 7 is a graph showing a slope in impedance measurements according to the concentration change as a result of the detection of a slope according to the concentration change of amyloid ⁇ in FIG. 6 .
- FIG. 8 is a graph showing the detection results of the concentration of amyloid ⁇ in blood plasma of FIG. 6 as a function of the slope of impedance over the concentration change.
- the detection of the slope according to the concentration change of amyloid ⁇ shows a little slope difference between the whole blood samples of the first and second examinees NC and AD.
- the whole blood sample of the second examinee AD is separable and distinguishable to some extent, yet the existence of overlapped intervals makes it hard to distinguish the samples of the first and second examinees NC and AD.
- the slope difference can be used to distinguish the sample of the first examinee NC from that of the second examinee AD.
- FIG. 9 presents graphs showing the impedance measurements of amyloid ⁇ extracted from neuronal exosome in blood plasma and the impedance change as a function of the slope change of the impedance.
- the beads reactive to the amyloid ⁇ in the neuronal exosome extracted from blood plasma are used to measure the impedance, and the slope change of the impedance measurements is detected. Plotting the slope change offers the clearer numerical distinction between the first and second examinees NC and AD.
- the numerical distinction for the neuronal disease is made more definite according to the neuronal exosome analysis method.
- the method of detecting the slope according to the change of concentration, level, detected amount, and impedance of amyloid ⁇ More specifically, the change of at least one of the numerical value, concentration, detected amount, and impedance of the monomer and the oligomer specific to a patient and a normal person is expressed in terms of a slope to distinguish the patient from the normal person by the oligomer-to-monomer numerical difference or the monomer-to-oligomer numerical difference, thereby making it possible to predict the possibility of a disease.
- the threshold point is about 10 % in the impedance detection method, and there may be an overlapping interval of some points. But, the method of detecting a slope change according to the change of impedance measurements can make the clearer numerical distinction between the first and second examinees NC and AD without an overlapping interval.
- FIG. 10 is a graph showing the detection results as a function of the slope change of amyloid ⁇ extracted from neuronal exosome in blood plasma using an RIPA buffer.
- the lysis of amyloid ⁇ using an RIPA buffer makes the clearer numerical distinction between the first and second examinees NC and AD than the neuronal exosome analysis method that includes measuring impedance of amyloid ⁇ extracted from blood plasma, detecting a slope according to the change of at least one of the numerical value, concentration, detected amount, and impedance of the monomer and the oligomer, and plotting the slope change.
- a graph plotting a slope according to the numerical values of the monomer and the oligomer for the first and second examinees NC and AD can provide the clearer numerical distinction between the first and second examinees NC and AD.
- the threshold point is about 13 to 14 %/dec.
- Using an RIPA buffer offers a measurement margin of about 10 % and makes the numerical distinction more clearly.
- the present invention describes a method of diagnosing a disease by a relative proportion of monomer and oligomer as well as a method of analyzing a relative proportion of oligomer in proteins.
- the disease to be diagnosed by the relative proportion of monomer and oligomer is amyloidogenic disease, that is, a disease characterized by a different proportion of the monomer or the oligomer in the patient, it may be caused by aggregation of monomer into oligomer.
- FIG. 11 presents graphs showing the detection results of impedance and slope change of amyloid ⁇ in blood plasma and the detection results of the slope change of impedance as a function of the impedance and concentration change of amyloid ⁇ extracted from neuronal exosome in blood plasma.
- the impedance measurement using amyloid ⁇ in the state of the whole blood makes the least numerical distinction between the first and second examinees NC and AD even with its numerical concentration graph.
- the impedance measurement using amyloid ⁇ extracted from the neuronal exosome of blood plasma makes the better numerical distinction between the first and second examinees NC and AD than that using amyloid ⁇ in the state of the blood plasma.
- the use of a graph based on the slope according to the numerical values of the monomer and the oligomer makes the better numerical distinction between the first and second examinees NC and AD.
- a graph of the slope according to the numerical values of the monomer and the oligomer extracted from the blood plasma can be used to make the best numerical distinction between the first and second examinees NC and AD.
- the method of diagnosing a disease using an analysis of oligomer of an abnormal aggregated protein includes using a biosensor to measure the impedance of blood plasma and detecting a slope according to the numerical value of the monomer and the oligomer to diagnose normal or abnormal protein aggregation and the associated diseases with more accuracy.
- the neuronal exosome analysis method using an exosome in blood plasma as well as the blood plasma to determine the protein content is additionally used to make the better distinction of the slope according to the numerical values of the monomer and the oligomer, thereby diagnosing normal or abnormal protein aggregation and the associated diseases with more accuracy and enhancing the reliability of the diagnosis.
Landscapes
- Health & Medical Sciences (AREA)
- Life Sciences & Earth Sciences (AREA)
- Engineering & Computer Science (AREA)
- Chemical & Material Sciences (AREA)
- Immunology (AREA)
- Biomedical Technology (AREA)
- Hematology (AREA)
- Urology & Nephrology (AREA)
- Molecular Biology (AREA)
- Analytical Chemistry (AREA)
- General Health & Medical Sciences (AREA)
- Pathology (AREA)
- Physics & Mathematics (AREA)
- General Physics & Mathematics (AREA)
- Biochemistry (AREA)
- Microbiology (AREA)
- Biotechnology (AREA)
- Cell Biology (AREA)
- Food Science & Technology (AREA)
- Medicinal Chemistry (AREA)
- Neurosurgery (AREA)
- Neurology (AREA)
- Proteomics, Peptides & Aminoacids (AREA)
- Chemical Kinetics & Catalysis (AREA)
- Electrochemistry (AREA)
- Investigating Or Analysing Biological Materials (AREA)
- Investigating Or Analyzing Materials By The Use Of Electric Means (AREA)
Abstract
Description
- The present invention relates to an analysis method for the aggregated protein content in a body fluid. More particularly, the present invention related to a method for diagnosing a disease using an analysis of oligomer in an abnormal aggregated protein that involves measuring a concentration change of a protein in a body fluid like blood according to a dilution ratio and detecting a slope to estimate a proportion of the monomer and oligomer of the protein and thereby to make a diagnosis of normal or abnormal protein aggregation or the associated diseases with accuracy.
- Neuronal dysfunctions and impairments are caused by toxic aggregation-prone proteins, and they are characteristic to many neurological disorders, which include, for example, amyotrophic lateral sclerosis, Alzheimer's disease, Parkinson's disease, prion disease, polyglutamine expansion diseases, spinocerebellar ataxia, spinal/spinobulbar muscular atrophy, spongiform encephalopathy, tauopathy, Huntington's disease, dystonia, and so forth.
- The proteins coding the toxic aggregation-prone proteins causing the diseases and the genes coding the proteins have been identified. The normal metabolizing enzymes recirculate the proteins participating in the permanent circulation of synthesis and decomposition. In the mutation of genes, misfolded proteins accumulate and decompose in an abnormal manner. Such misfolded proteins are known to incur the formation of inclusion bodies and plaques of neurons that may indicate a damage of the neurons. It is therefore important to understand cellular mechanisms and to identify molecular means essential in reducing, inhibiting and improving the misfolded proteins. In addition, reasonable and effective therapeutic methods for those diseases can be exploited from the understanding of the effects of protein misfolding and aggregation on the survival of neurons.
- Korean Patent No.
100595495 (registered on June 23, 2006 - Korean Patent No.
1173677 (registered on July 7, 2012 - As illustrated in the patent documents of the prior art, the conventional methods use a biosensor to detect the impedance or protein concentration of blood necessary for a diagnosis and compares the impedance or protein concentration of blood with a reference value of a normal person to diagnose normal or abnormal protein aggregation or the associated diseases.
- But, the measurements (numerical values) of the protein concentration or impedance of blood are not enough to clarify the difference between a normal person and a patient, so it is impossible to tell a patient from a normal person or to make a diagnosis with accuracy. Namely, the measurements (numerical values) of the protein concentration or impedance of blood do not have a clear distinction between a normal person and a patient enough to definitely tell the patient from the normal person, resulting in reducing the accuracy and reliability of the diagnosis.
-
- (Patent Document 1)
Korean Patent No.100595495 (registered on June 23, 2006 - (Patent Document 2)
Korean Patent No.1173677 (registered on July 7, 2012 - For solving the problems with the prior art, it is an object of the present invention to provide a method for diagnosing a disease using an analysis of oligomer of abnormal aggregated proteins using a biosensor based on electricity (impedance and current) and optics that involves using a biosensor to detect a slope of sensor signals obtained by making a dilution of an aggregated protein used as a bio-marker of a body fluid like blood in multiple steps and extracting a monomer proportion and an oligomer proportion of the protein to diagnose normal or abnormal protein aggregation and the associated diseases with accuracy.
- To achieve the object of the present invention, there is provided a method for predicting a possibility of disease using an analysis of oligomer of an abnormal aggregated protein that includes: (1) preparing a body fluid sample including at least one of blood, blood plasma, blood serum, saliva, urine, tear, and mucus; (2) making a dilution of the body fluid sample; (3) using a biosensor to measure and detect an aggregated protein in the diluted body fluid sample; (4) analyzing a signal change of the biosensor caused by the dilution of the aggregated protein to determine a slope according to the dilution from the measurements; and (5) analyzing a proportion of the oligomer from the slope according to the dilution to make a diagnosis.
- The method of diagnosing a disease using an analysis of oligomer of an abnormal aggregated protein according to the present invention uses a electricity/optics-based biosensor to measure the concentration of an aggregated protein in a body fluid like blood and detects the relative proportions of the monomer and oligomer in terms of a slope according to the concentration change, thereby diagnosing normal or abnormal protein aggregation and the associated diseases with accuracy.
- In addition, the neuronal exosome analysis method of determining the protein content using exosome extracted from the blood plasma as well as the blood plasma is additionally used to make the better distinction of the slope according to the relative proportions of the monomer and oligomer, thereby diagnosing normal or abnormal protein aggregation and the associated diseases with more accuracy and enhancing the reliability of the diagnosis.
-
-
FIG. 1 is a block diagram showing the construction of an impedance biosensor used in the embodiment of the present invention. -
FIG. 2 is an illustration explaining a method of measuring the impedance of amyloid β using the biosensor platform ofFIG. 1 . -
FIG. 3 is a graph showing the impedance change according to the measurement results of amyloid β ofFIG. 2 . -
FIG. 4 is an illustration of a diagnosis method using the impedance change of amyloid β detected by the method ofFIG. 2 . -
FIG. 5 is a graph showing the impedance measurements for amyloid β in blood plasma ofFIG. 2 . -
FIG. 6 is an illustration explaining a method of detecting a slope according to the concentration change of amyloid β using the biosensor platform ofFIG. 1 . -
FIG. 7 is a graph showing a slope in impedance measurements according to the concentration change as a result of the detection of a slope according to the concentration change of amyloid β inFIG. 6 . -
FIG. 8 is a graph showing the detection results of the concentration of amyloid β in blood plasma ofFIG. 6 as a function of the slope of impedance according to the concentration change. -
FIG. 9 presents graphs showing the impedance measurements of amyloid β extracted from neuronal exosome in blood plasma and the impedance detection results according to the slope of the impedance measurements. -
FIG. 10 is a graph showing the detection results according to the slope change of amyloid β extracted from neuronal exosome in blood plasma using an RIPA buffer. -
FIG. 11 presents graphs showing the detection results of impedance and slope change of amyloid β in blood plasma and the detection results of the slope change of impedance as a function of the impedance and concentration change of amyloid β extracted from neuronal exosome in blood plasma. - Hereinafter, a detailed description will be given as to the embodiment of the present invention with reference to the accompanying drawings.
-
FIG. 1 is a block diagram showing the construction of an impedance biosensor used in the embodiment of the present invention. - Referring to
FIG. 1 , the impedance biosensor may be comprised of an electrochemical impedance spectroscopy (EIS) sensor array (a) and a bead EIS (BEIS) platform (b). In the EIS sensor array (a), a working/counter electrode is formed of Pt/Ti metal and a microwell is made of an SU-8 electrode. - The working/counter electrode may form an array of 10*10 or 20*20 or more electrodes. Here, the microwell is to focus the electric field on the surface of magnetic beads arranged between the working/counter electrodes.
- The BEIS platform (b) has a plurality of BEIS sensor arrays to form a PDMS microfluidic channel (optional), and a permanent magnet or an electromagnet arranged on the back surface of the BEIS platform (b). The size of biomolecules and the quantity of electric charge affect the output of the sensor.
- Besides, the biosensor as used herein may include an optical enzyme linked immunoassay (ELISA) analytical sensor, a surface plasmon resonance (SPR) analytical sensor, and other electricity-based biosensors (e.g., FET sensors, electrochemical sensors, etc.), and so on.
-
FIG. 2 is an illustration explaining a method of measuring the impedance of amyloid β using the biosensor platform ofFIG. 1 , andFIG. 3 is a graph showing an impedance change according to the impedance measurements of amyloid β inFIG. 2 . - Reference will be made to
FIG. 2 to describe a method of measuring the impedance of amyloid β. Firstly, a first antibody 1E11, amyloid β (Aβ) and magnetic beads are incubated for a predetermined time (e.g., 45 minutes) and washed with a buffer solution in order to minimize the occurrence of unspecific reactions, in step (a). - The solution containing the magnetic beads are made to flow on an electrode, which is then placed into a microwell formed on a substrate using a magnet, in step (b). A measurement is performed to detect the electrochemical impedance incurred due to the amyloid β (Aβ) participating in a reaction with the antibody and stuck to the surface of the beads. At this point, the impedance value is reduced to the relative percentage in comparison with a reference value that is the impedance value of beads not reactive to the sample. This can minimize the error by the impedance change specific to the device.
- In the impedance measurement of amyloid β, the sample may be a body fluid including at least one of blood, blood plasma, blood serum, saliva, urine, tear, and mucus. The measurement may also be performed to detect the impedance of the beads reactive to at least one of Tau, alpha-synuclein, PrPsc, and Huntingtin, in addition to the impedance of the beads reactive to amyloid β.
- In other words, a diagnosis is performed by measuring and graphing a change of at least one of the proportion, concentration, level, detected amount, and impedance of the monomer and the oligomer specific to a patient and a normal person, to distinguish the patient from the normal person by the oligomer-to-monomer numerical difference or the monomer-to-oligomer numerical difference. For convenience of explanation, a description will be given as to a measurement example in which a detection is made for the impedance of beads reactive to amyloid β in a prepared blood sample.
- As can be seen from
FIG. 3 , the oligomeric amyloid β has a great increase in the slope change of the electrochemical impedance. Referring to the graph, the monomeric amyloid β has a different slope from the oligomeric amyloid β in the measurement of impedance change as a function of the concentration. More specifically, the slope of the monomeric amyloid β is 6 %/dec, while that of the oligomeric amyloid β (Aβ) is 20 %/dec. The oligomeric amyloid β (Aβ) displays the higher slope in the concentration change than the monomeric amyloid β. The impedance change is in proportion to the size of biomolecules. When the monomeric amyloid β (Aβ) having a fixed concentration of 100 pg/ml is oligomerized, the slope in the output impedance over the concentration increases with an elapse of time. Further, the amount of the accumulating oligomeric amyloid β (Aβ) is in correspondence to the time. -
FIG. 4 is an illustration of a diagnosis method using the slope in the concentration change of amyloid β (Aβ) detected by the method ofFIG. 2 . - Referring to
FIG. 4 , the measurements at point Z1 and Z2 indicate the absolute amount (e.g., the total concentration) of the accumulating amyloid β (Aβ) in the body fluid samples from first and second examinees NC and AC, respectively. The measurements as given herein are merely experimental numerals, so the absolute amount may greatly vary depending on the physical characteristics. - Both the body fluid samples of the first and second examinees NC and AD contain a mix of monomeric amyloid β and oligomeric amyloid β. Yet, the sample of the second examinee AD has the higher content of oligomeric amyloid β. Accordingly, with an increase in the oligomeric amyloid β proportion in the sample, the second examinee has a higher slope in the concentration change.
- The slope in the concentration change of amyloid β for the first or second examinee NC or AD according to the measurement at point Z1 or Z2 can be determined by the following Equation 1:


- Namely, the numeric values of the monomer and the oligomer specific to a patient and a normal person can be expressed in terms of a slope. The diagnosis can be accomplished to distinguish the patient from the normal person by the oligomer-to-monomer numerical difference or the monomer-to-oligomer numerical difference.
-
FIG. 5 is a graph showing the impedance measurement results for amyloid β in blood plasma ofFIG. 2 . - As shown in
FIG. 5 , the electrochemical impedance measurements of the beads in the blood plasma do not provide a definite numerical distinction between the first and second examinees NC and AD. The minimum numerical difference between the first and second examinees NC and AD is the only one obtainable from the measurements. The physical differences or abilities of the first and second examinees NC and AD make the difference in the electrochemical impedance, causing the risk of misinterpretation in the diagnosis. Further, the reference value is hard to determine, which disables the definite distinction between the first and second examinees NC and AD. -
FIG. 6 is an illustration explaining a method of detecting a slope according to the concentration change of amyloid B using the biosensor platform ofFIG. 1 . - Reference will be made to
FIG. 6 to describe a method of detecting the concentration of amyloid β. Firstly, antibody-bound magnetic beads is incubated for a predetermined time (e.g., 45 minutes), in step (a). - The magnetic beads with an antibody and the sample of an abnormal person (patient) in need of diagnosis are allowed to react with each other for about one hour, in step (b). At this point, the sample of the patient is diluted by 1/5 of concentration each time to prepare four to five test samples (e.g., 1, 1/5, 1/25, 1/125, and 1/625 in concentration), which method is desirable in the aspect of the experimental results.
- Subsequently, the patient's sample beads are placed in the microwell region of an EIS sensor and measured in regards to the concentration of amyloid β, in step (c). The procedures of the steps (b) and (c) are repeated as often as the number of the patient's samples prepared in the step (a) to perform measurement and detection.
-
FIG. 7 is a graph showing a slope in impedance measurements according to the concentration change as a result of the detection of a slope according to the concentration change of amyloid β inFIG. 6 .FIG. 8 is a graph showing the detection results of the concentration of amyloid β in blood plasma ofFIG. 6 as a function of the slope of impedance over the concentration change. - Referring to
FIGS. 7 and 8 , the detection of the slope according to the concentration change of amyloid β shows a little slope difference between the whole blood samples of the first and second examinees NC and AD. The whole blood sample of the second examinee AD is separable and distinguishable to some extent, yet the existence of overlapped intervals makes it hard to distinguish the samples of the first and second examinees NC and AD. However, the slope difference can be used to distinguish the sample of the first examinee NC from that of the second examinee AD. -
FIG. 9 presents graphs showing the impedance measurements of amyloid β extracted from neuronal exosome in blood plasma and the impedance change as a function of the slope change of the impedance. - As shown in
FIG. 9 , the beads reactive to the amyloid β in the neuronal exosome extracted from blood plasma are used to measure the impedance, and the slope change of the impedance measurements is detected. Plotting the slope change offers the clearer numerical distinction between the first and second examinees NC and AD. - Particularly, the numerical distinction for the neuronal disease is made more definite according to the neuronal exosome analysis method.
- Such a distinguishing effect is attained more greatly by the method of detecting the slope according to the change of concentration, level, detected amount, and impedance of amyloid β. More specifically, the change of at least one of the numerical value, concentration, detected amount, and impedance of the monomer and the oligomer specific to a patient and a normal person is expressed in terms of a slope to distinguish the patient from the normal person by the oligomer-to-monomer numerical difference or the monomer-to-oligomer numerical difference, thereby making it possible to predict the possibility of a disease. In this regard, the threshold point is about 10 % in the impedance detection method, and there may be an overlapping interval of some points. But, the method of detecting a slope change according to the change of impedance measurements can make the clearer numerical distinction between the first and second examinees NC and AD without an overlapping interval.
-
FIG. 10 is a graph showing the detection results as a function of the slope change of amyloid β extracted from neuronal exosome in blood plasma using an RIPA buffer. - The lysis of amyloid β using an RIPA buffer, as shown in
FIG. 10 , makes the clearer numerical distinction between the first and second examinees NC and AD than the neuronal exosome analysis method that includes measuring impedance of amyloid β extracted from blood plasma, detecting a slope according to the change of at least one of the numerical value, concentration, detected amount, and impedance of the monomer and the oligomer, and plotting the slope change. In other words, a graph plotting a slope according to the numerical values of the monomer and the oligomer for the first and second examinees NC and AD can provide the clearer numerical distinction between the first and second examinees NC and AD. - In both the impedance detection method and the lysis method using an RIPA buffer, the threshold point is about 13 to 14 %/dec. Using an RIPA buffer offers a measurement margin of about 10 % and makes the numerical distinction more clearly.
- As described above, the present invention describes a method of diagnosing a disease by a relative proportion of monomer and oligomer as well as a method of analyzing a relative proportion of oligomer in proteins. In this regard, when the disease to be diagnosed by the relative proportion of monomer and oligomer is amyloidogenic disease, that is, a disease characterized by a different proportion of the monomer or the oligomer in the patient, it may be caused by aggregation of monomer into oligomer.
-
FIG. 11 presents graphs showing the detection results of impedance and slope change of amyloid β in blood plasma and the detection results of the slope change of impedance as a function of the impedance and concentration change of amyloid β extracted from neuronal exosome in blood plasma. - As shown in
FIG. 11 , the impedance measurement using amyloid β in the state of the whole blood makes the least numerical distinction between the first and second examinees NC and AD even with its numerical concentration graph. - In contrast, the impedance measurement using amyloid β extracted from the neuronal exosome of blood plasma makes the better numerical distinction between the first and second examinees NC and AD than that using amyloid β in the state of the blood plasma. Further, the use of a graph based on the slope according to the numerical values of the monomer and the oligomer makes the better numerical distinction between the first and second examinees NC and AD. In particular, a graph of the slope according to the numerical values of the monomer and the oligomer extracted from the blood plasma can be used to make the best numerical distinction between the first and second examinees NC and AD.
- As described above, the method of diagnosing a disease using an analysis of oligomer of an abnormal aggregated protein includes using a biosensor to measure the impedance of blood plasma and detecting a slope according to the numerical value of the monomer and the oligomer to diagnose normal or abnormal protein aggregation and the associated diseases with more accuracy.
- In addition, the neuronal exosome analysis method using an exosome in blood plasma as well as the blood plasma to determine the protein content is additionally used to make the better distinction of the slope according to the numerical values of the monomer and the oligomer, thereby diagnosing normal or abnormal protein aggregation and the associated diseases with more accuracy and enhancing the reliability of the diagnosis.
- Although the exemplary embodiments of the present invention have been described, it is understood that various changes and modifications can be made by one ordinary skilled in the art within the spirit and scope of the present invention as hereinafter claimed.
Claims (9)
- A method for predicting a possibility of disease using an analysis of oligomer of an abnormal aggregated protein, the method comprising:(1) preparing a body fluid sample;(2) making a dilution of the body fluid sample;(3) using a biosensor to measure and detect an aggregated protein in the diluted body fluid sample;(4) analyzing a signal change of the biosensor according to the dilution of the aggregated protein to determine a slope according to the dilution from the measurements; and(5) analyzing a proportion of the oligomer from the slope according to the dilution to make a diagnosis,wherein the aggregated protein is amyloid β.
- The method as claimed in claim 1, wherein the body fluid sample is a sample of a body fluid comprising at least one selected from the group consisting of blood, blood plasma, blood serum, saliva, urine, tear, and mucus.
- The method as claimed in claim 1, wherein the step (2) of making a dilution of the body fluid sample comprises mixing the body fluid sample with another reagent or a buffer solution at a predetermined ratio to make a dilution of the body fluid sample one or more times in succession.
- The method as claimed in claim 1, wherein the step (3) of using a biosensor to measure and detect an aggregated protein in the diluted body fluid sample comprises measuring a change of at least one selected from the group consisting of numerical value, concentration, quantity, and level of the aggregated protein in the diluted body fluid sample,
wherein when measuring at least one of the numerical value, concentration, quantity, and level of the aggregated protein, a change of amyloid β as the aggregated protein is measured to represent the numerical value, concentration, quantity, and level of the body fluid sample. - The method as claimed in claim 1, wherein the step (4) of analyzing a signal change of the biosensor according to the dilution of the aggregated protein to determine a slope according to the dilution from the measurements comprises making a dilution or concentration of the body fluid sample containing a mix of detected monomer and oligomer and reducing a change of at least one of the numerical value, concentration, quantity, and level according to the concentration change to a slope.
- The method as claimed in claim 1, wherein the step (1) of preparing a body fluid sample further comprises: extracting exosome from the body fluid or isolating neuronal exosome from the extracted exosome through a neuronal exosome analysis method to prepare a sample for analysis, or performing a lysis of the exosome.
- The method as claimed in claim 1, wherein the step (4) of analyzing a signal change of the biosensor according to the dilution of the aggregated protein to determine a slope according to the dilution from the measurements includes:using an aggregated protein of the body fluid sample or an aggregated protein extracted from neuronal exosome of the body fluid sample to measure the signal change;determining a slope according to a proportion of the monomer or the oligomer using the following Equations 1 and 2; andplotting a graph according to the difference between a change of the oligomer with respect to the monomer and a change of the monomer with respect to the oligomer,
 wherein y is the signal of the sensor; ρ is the proportion of oligomer in the total amyloid β

- The method as claimed in claim 1, wherein the step (3) of using a biosensor to measure and detect an aggregated protein in the diluted body fluid sample includes:(a) incubating an antibody-bound magnetic bead for a predetermined time;(b) causing the antibody-bound magnetic bead to react with an abnormal person's sample for a predetermined time;(c) positioning the patient's sample bead in a microwell region of the biosensor to measure the concentration of amyloid B and repeating the steps (b) and (c) as often as the number of the patient's samples prepared in the step (a) to perform measurement and detection.
- The method as claimed in claim 1, wherein the biosensor comprises at least one sensor selected from the group consisting of an electrochemical impedance spectrometry (EIS) sensor array, a bead-based EIS sensor, an enzyme linked immunoassay (ELISA), a surface plasmon resonance (SPR)-based analytical sensor, and an FET type biosensor.
Applications Claiming Priority (2)
| Application Number | Priority Date | Filing Date | Title |
|---|---|---|---|
| KR1020160001018A KR101807285B1 (en) | 2016-01-05 | 2016-01-05 | Method for the diagnosys of the disease revealed by abnormal aggregated proteins using analysis of oligomeric proteins |
| PCT/KR2016/005278 WO2017119553A1 (en) | 2016-01-05 | 2016-05-18 | Method for diagnosing diseases through oligomer analysis of abnormally aggregated proteins |
Publications (3)
| Publication Number | Publication Date |
|---|---|
| EP3264093A1 true EP3264093A1 (en) | 2018-01-03 |
| EP3264093A4 EP3264093A4 (en) | 2018-10-17 |
| EP3264093B1 EP3264093B1 (en) | 2019-09-04 |
Family
ID=59273714
Family Applications (1)
| Application Number | Title | Priority Date | Filing Date |
|---|---|---|---|
| EP16883939.7A Active EP3264093B1 (en) | 2016-01-05 | 2016-05-18 | Method for diagnosing diseases through oligomer analysis of abnormally aggregated proteins |
Country Status (4)
| Country | Link |
|---|---|
| US (1) | US10585105B2 (en) |
| EP (1) | EP3264093B1 (en) |
| KR (1) | KR101807285B1 (en) |
| WO (1) | WO2017119553A1 (en) |
Cited By (1)
| Publication number | Priority date | Publication date | Assignee | Title |
|---|---|---|---|---|
| GR1010708B (en) * | 2022-06-01 | 2024-06-19 | Επιτροπη Ερευνων Ιονιου Πανεπιστημιου, | Bio-chemical and digital bio-chip platform for the diagnosis of parkinson's disease |
Families Citing this family (6)
| Publication number | Priority date | Publication date | Assignee | Title |
|---|---|---|---|---|
| US20200400687A1 (en) * | 2017-12-19 | 2020-12-24 | Chase Therapeutics Corporation | Methods for developing pharmaceuticals for treating neurodegenerative conditions |
| KR102075558B1 (en) * | 2018-03-07 | 2020-02-10 | 광운대학교 산학협력단 | Alzheimer's Disease Analysis Chip for Screening Based on Oligomer/Monomer and Analysis Method using The Same |
| CN109406772A (en) * | 2018-10-31 | 2019-03-01 | 郑州大学 | The method of chemiluminescent enzyme-linked immunosorbent immune detection DNMT1 based on Magnetic Isolation |
| KR102258048B1 (en) * | 2019-05-30 | 2021-05-31 | 주식회사 캔티스 | Method for detecting amyloid beta oligomer |
| KR102286211B1 (en) * | 2019-05-31 | 2021-08-06 | 한국과학기술연구원 | Method of detecting antigen using magnetic support based bio-sensor |
| CN114858892A (en) * | 2022-06-21 | 2022-08-05 | 济南大学 | A kind of beta-amyloid oligomer detection method |
Family Cites Families (4)
| Publication number | Priority date | Publication date | Assignee | Title |
|---|---|---|---|---|
| DE10141237A1 (en) | 2001-08-23 | 2003-03-13 | Wacker Chemie Gmbh | Crosslinkable compositions based on organosilicon compounds |
| EP1523499A2 (en) * | 2002-07-24 | 2005-04-20 | Innogenetics N.V. | Fragments of beta-amyloid as targets for vaccination against alzheimer disease |
| US20110166035A1 (en) | 2009-11-24 | 2011-07-07 | Probiodrug Ag | Novel diagnostic method |
| KR101173677B1 (en) | 2009-12-11 | 2012-08-13 | 한국과학기술연구원 | Pharmaceutical composition for preventing or treating diseases associated with beta amyloid accumulation containing EPPS as an active ingredient |
-
2016
- 2016-01-05 KR KR1020160001018A patent/KR101807285B1/en active Active
- 2016-05-18 US US15/565,503 patent/US10585105B2/en active Active
- 2016-05-18 WO PCT/KR2016/005278 patent/WO2017119553A1/en not_active Ceased
- 2016-05-18 EP EP16883939.7A patent/EP3264093B1/en active Active
Cited By (1)
| Publication number | Priority date | Publication date | Assignee | Title |
|---|---|---|---|---|
| GR1010708B (en) * | 2022-06-01 | 2024-06-19 | Επιτροπη Ερευνων Ιονιου Πανεπιστημιου, | Bio-chemical and digital bio-chip platform for the diagnosis of parkinson's disease |
Also Published As
| Publication number | Publication date |
|---|---|
| EP3264093B1 (en) | 2019-09-04 |
| WO2017119553A1 (en) | 2017-07-13 |
| US20180080946A1 (en) | 2018-03-22 |
| US10585105B2 (en) | 2020-03-10 |
| EP3264093A4 (en) | 2018-10-17 |
| KR101807285B1 (en) | 2017-12-08 |
| KR20170081957A (en) | 2017-07-13 |
Similar Documents
| Publication | Publication Date | Title |
|---|---|---|
| EP3264093B1 (en) | Method for diagnosing diseases through oligomer analysis of abnormally aggregated proteins | |
| Qu et al. | Blood biomarkers for the diagnosis of amnestic mild cognitive impairment and Alzheimer’s disease: A systematic review and meta-analysis | |
| Ganesalingam et al. | Combination of neurofilament heavy chain and complement C3 as CSF biomarkers for ALS | |
| Lau et al. | Non-invasive screening for Alzheimer’s disease by sensing salivary sugar using Drosophila cells expressing gustatory receptor (Gr5a) immobilized on an extended gate ion-sensitive field-effect transistor (EG-ISFET) biosensor | |
| Murphy et al. | Cytochrome c oxidase-intermediate fibres: importance in understanding the pathogenesis and treatment of mitochondrial myopathy | |
| Reale et al. | Saliva, an easily accessible fluid as diagnostic tool and potent stem cell source for Alzheimer’s Disease: Present and future applications | |
| Mammana et al. | Improving protocols for α-synuclein seed amplification assays: analysis of preanalytical and analytical variables and identification of candidate parameters for seed quantification | |
| Zou et al. | Synchronous screening of multiplexed biomarkers of Alzheimer's disease by a length-encoded aerolysin nanopore-integrated triple-helix molecular switch | |
| EP2786155B1 (en) | Biomarker-based methods and biochips for aiding the diagnosis of stroke | |
| Khetani et al. | μDrop: multi-analyte portable electrochemical-sensing device for blood-based detection of cleaved tau and neuron filament light in traumatic brain injury patients | |
| Ruiz-Arenas et al. | A summary of worldwide national activities in chronic kidney disease (CKD) testing | |
| EP3514245A1 (en) | Method for aiding differential diagnosis of stroke | |
| CN105308455B (en) | Methods and compositions for diagnosing preeclampsia | |
| Li et al. | Cerebrospinal fluid ubiquitin C-terminal hydrolase as a novel marker of neuronal damage after epileptic seizure | |
| WO2007134028A2 (en) | Biomarkers for depression and methods using the same | |
| Mullins et al. | Enzyme-linked immunoassay for plasma-free metanephrines in the biochemical diagnosis of phaeochromocytoma in adults is not ideal. | |
| Arévalo et al. | Early and differential autoimmune diseases diagnosis by interrogating specific autoantibody signatures with multiplexed electrochemical bioplatforms | |
| Aoki et al. | Urine protein quantification in human urine on boron-doped diamond electrodes based on the electrochemical reaction of Coomassie brilliant blue | |
| Zecca et al. | Comparative evaluation of two immunoassays for cerebrospinal fluid β-Amyloid1–42 measurement | |
| WO2013010170A1 (en) | Process for detection of alzheimer's disease from a serum sample | |
| May et al. | Use of whole blood for analysis of disease-associated biomarkers | |
| Chao et al. | Towards proteome standards: the use of absolute quantitation in high-throughput biomarker discovery | |
| CN106680411B (en) | One kind being used for the kit and its detection method of detecting system lupus erythematosus (SLE) | |
| Munshi et al. | Gluten Detection in Foods | |
| Schmidt et al. | Procalcitonin as a postmortem sepsis marker. A comparison of the validity of results obtained from blood serum, aqueous humour and cerebrospinal fluid |
Legal Events
| Date | Code | Title | Description |
|---|---|---|---|
| STAA | Information on the status of an ep patent application or granted ep patent |
Free format text: STATUS: THE INTERNATIONAL PUBLICATION HAS BEEN MADE |
|
| PUAI | Public reference made under article 153(3) epc to a published international application that has entered the european phase |
Free format text: ORIGINAL CODE: 0009012 |
|
| STAA | Information on the status of an ep patent application or granted ep patent |
Free format text: STATUS: REQUEST FOR EXAMINATION WAS MADE |
|
| 17P | Request for examination filed |
Effective date: 20170926 |
|
| AK | Designated contracting states |
Kind code of ref document: A1 Designated state(s): AL AT BE BG CH CY CZ DE DK EE ES FI FR GB GR HR HU IE IS IT LI LT LU LV MC MK MT NL NO PL PT RO RS SE SI SK SM TR |
|
| AX | Request for extension of the european patent |
Extension state: BA ME |
|
| RIN1 | Information on inventor provided before grant (corrected) |
Inventor name: JI, JAE-HOON Inventor name: KIM, SANGYUN Inventor name: KIM, TAE SONG Inventor name: KIM, YOUNGSOO Inventor name: SHIN, KYEONG-SIK Inventor name: KANG, JI YOON |
|
| A4 | Supplementary search report drawn up and despatched |
Effective date: 20180917 |
|
| RIC1 | Information provided on ipc code assigned before grant |
Ipc: G01N 33/68 20060101AFI20180911BHEP Ipc: G01N 27/02 20060101ALI20180911BHEP Ipc: G01N 21/552 20140101ALI20180911BHEP |
|
| DAV | Request for validation of the european patent (deleted) | ||
| DAX | Request for extension of the european patent (deleted) | ||
| RIC1 | Information provided on ipc code assigned before grant |
Ipc: G01N 27/02 20060101ALI20190404BHEP Ipc: G01N 33/68 20060101AFI20190404BHEP |
|
| GRAP | Despatch of communication of intention to grant a patent |
Free format text: ORIGINAL CODE: EPIDOSNIGR1 |
|
| STAA | Information on the status of an ep patent application or granted ep patent |
Free format text: STATUS: GRANT OF PATENT IS INTENDED |
|
| INTG | Intention to grant announced |
Effective date: 20190523 |
|
| GRAS | Grant fee paid |
Free format text: ORIGINAL CODE: EPIDOSNIGR3 |
|
| GRAA | (expected) grant |
Free format text: ORIGINAL CODE: 0009210 |
|
| STAA | Information on the status of an ep patent application or granted ep patent |
Free format text: STATUS: THE PATENT HAS BEEN GRANTED |
|
| AK | Designated contracting states |
Kind code of ref document: B1 Designated state(s): AL AT BE BG CH CY CZ DE DK EE ES FI FR GB GR HR HU IE IS IT LI LT LU LV MC MK MT NL NO PL PT RO RS SE SI SK SM TR |
|
| REG | Reference to a national code |
Ref country code: GB Ref legal event code: FG4D |
|
| REG | Reference to a national code |
Ref country code: CH Ref legal event code: EP |
|
| REG | Reference to a national code |
Ref country code: AT Ref legal event code: REF Ref document number: 1176094 Country of ref document: AT Kind code of ref document: T Effective date: 20190915 |
|
| REG | Reference to a national code |
Ref country code: DE Ref legal event code: R096 Ref document number: 602016020197 Country of ref document: DE |
|
| REG | Reference to a national code |
Ref country code: IE Ref legal event code: FG4D |
|
| REG | Reference to a national code |
Ref country code: NL Ref legal event code: MP Effective date: 20190904 |
|
| REG | Reference to a national code |
Ref country code: LT Ref legal event code: MG4D |
|
| PG25 | Lapsed in a contracting state [announced via postgrant information from national office to epo] |
Ref country code: NO Free format text: LAPSE BECAUSE OF FAILURE TO SUBMIT A TRANSLATION OF THE DESCRIPTION OR TO PAY THE FEE WITHIN THE PRESCRIBED TIME-LIMIT Effective date: 20191204 Ref country code: HR Free format text: LAPSE BECAUSE OF FAILURE TO SUBMIT A TRANSLATION OF THE DESCRIPTION OR TO PAY THE FEE WITHIN THE PRESCRIBED TIME-LIMIT Effective date: 20190904 Ref country code: LT Free format text: LAPSE BECAUSE OF FAILURE TO SUBMIT A TRANSLATION OF THE DESCRIPTION OR TO PAY THE FEE WITHIN THE PRESCRIBED TIME-LIMIT Effective date: 20190904 Ref country code: BG Free format text: LAPSE BECAUSE OF FAILURE TO SUBMIT A TRANSLATION OF THE DESCRIPTION OR TO PAY THE FEE WITHIN THE PRESCRIBED TIME-LIMIT Effective date: 20191204 Ref country code: FI Free format text: LAPSE BECAUSE OF FAILURE TO SUBMIT A TRANSLATION OF THE DESCRIPTION OR TO PAY THE FEE WITHIN THE PRESCRIBED TIME-LIMIT Effective date: 20190904 Ref country code: SE Free format text: LAPSE BECAUSE OF FAILURE TO SUBMIT A TRANSLATION OF THE DESCRIPTION OR TO PAY THE FEE WITHIN THE PRESCRIBED TIME-LIMIT Effective date: 20190904 |
|
| PG25 | Lapsed in a contracting state [announced via postgrant information from national office to epo] |
Ref country code: GR Free format text: LAPSE BECAUSE OF FAILURE TO SUBMIT A TRANSLATION OF THE DESCRIPTION OR TO PAY THE FEE WITHIN THE PRESCRIBED TIME-LIMIT Effective date: 20191205 Ref country code: LV Free format text: LAPSE BECAUSE OF FAILURE TO SUBMIT A TRANSLATION OF THE DESCRIPTION OR TO PAY THE FEE WITHIN THE PRESCRIBED TIME-LIMIT Effective date: 20190904 Ref country code: AL Free format text: LAPSE BECAUSE OF FAILURE TO SUBMIT A TRANSLATION OF THE DESCRIPTION OR TO PAY THE FEE WITHIN THE PRESCRIBED TIME-LIMIT Effective date: 20190904 Ref country code: ES Free format text: LAPSE BECAUSE OF FAILURE TO SUBMIT A TRANSLATION OF THE DESCRIPTION OR TO PAY THE FEE WITHIN THE PRESCRIBED TIME-LIMIT Effective date: 20190904 Ref country code: RS Free format text: LAPSE BECAUSE OF FAILURE TO SUBMIT A TRANSLATION OF THE DESCRIPTION OR TO PAY THE FEE WITHIN THE PRESCRIBED TIME-LIMIT Effective date: 20190904 |
|
| REG | Reference to a national code |
Ref country code: AT Ref legal event code: MK05 Ref document number: 1176094 Country of ref document: AT Kind code of ref document: T Effective date: 20190904 |
|
| PG25 | Lapsed in a contracting state [announced via postgrant information from national office to epo] |
Ref country code: AT Free format text: LAPSE BECAUSE OF FAILURE TO SUBMIT A TRANSLATION OF THE DESCRIPTION OR TO PAY THE FEE WITHIN THE PRESCRIBED TIME-LIMIT Effective date: 20190904 Ref country code: IT Free format text: LAPSE BECAUSE OF FAILURE TO SUBMIT A TRANSLATION OF THE DESCRIPTION OR TO PAY THE FEE WITHIN THE PRESCRIBED TIME-LIMIT Effective date: 20190904 Ref country code: EE Free format text: LAPSE BECAUSE OF FAILURE TO SUBMIT A TRANSLATION OF THE DESCRIPTION OR TO PAY THE FEE WITHIN THE PRESCRIBED TIME-LIMIT Effective date: 20190904 Ref country code: NL Free format text: LAPSE BECAUSE OF FAILURE TO SUBMIT A TRANSLATION OF THE DESCRIPTION OR TO PAY THE FEE WITHIN THE PRESCRIBED TIME-LIMIT Effective date: 20190904 Ref country code: RO Free format text: LAPSE BECAUSE OF FAILURE TO SUBMIT A TRANSLATION OF THE DESCRIPTION OR TO PAY THE FEE WITHIN THE PRESCRIBED TIME-LIMIT Effective date: 20190904 Ref country code: PL Free format text: LAPSE BECAUSE OF FAILURE TO SUBMIT A TRANSLATION OF THE DESCRIPTION OR TO PAY THE FEE WITHIN THE PRESCRIBED TIME-LIMIT Effective date: 20190904 Ref country code: PT Free format text: LAPSE BECAUSE OF FAILURE TO SUBMIT A TRANSLATION OF THE DESCRIPTION OR TO PAY THE FEE WITHIN THE PRESCRIBED TIME-LIMIT Effective date: 20200106 |
|
| PG25 | Lapsed in a contracting state [announced via postgrant information from national office to epo] |
Ref country code: IS Free format text: LAPSE BECAUSE OF FAILURE TO SUBMIT A TRANSLATION OF THE DESCRIPTION OR TO PAY THE FEE WITHIN THE PRESCRIBED TIME-LIMIT Effective date: 20200224 Ref country code: SK Free format text: LAPSE BECAUSE OF FAILURE TO SUBMIT A TRANSLATION OF THE DESCRIPTION OR TO PAY THE FEE WITHIN THE PRESCRIBED TIME-LIMIT Effective date: 20190904 Ref country code: CZ Free format text: LAPSE BECAUSE OF FAILURE TO SUBMIT A TRANSLATION OF THE DESCRIPTION OR TO PAY THE FEE WITHIN THE PRESCRIBED TIME-LIMIT Effective date: 20190904 Ref country code: SM Free format text: LAPSE BECAUSE OF FAILURE TO SUBMIT A TRANSLATION OF THE DESCRIPTION OR TO PAY THE FEE WITHIN THE PRESCRIBED TIME-LIMIT Effective date: 20190904 |
|
| REG | Reference to a national code |
Ref country code: DE Ref legal event code: R097 Ref document number: 602016020197 Country of ref document: DE |
|
| PLBE | No opposition filed within time limit |
Free format text: ORIGINAL CODE: 0009261 |
|
| STAA | Information on the status of an ep patent application or granted ep patent |
Free format text: STATUS: NO OPPOSITION FILED WITHIN TIME LIMIT |
|
| PG2D | Information on lapse in contracting state deleted |
Ref country code: IS |
|
| PG25 | Lapsed in a contracting state [announced via postgrant information from national office to epo] |
Ref country code: DK Free format text: LAPSE BECAUSE OF FAILURE TO SUBMIT A TRANSLATION OF THE DESCRIPTION OR TO PAY THE FEE WITHIN THE PRESCRIBED TIME-LIMIT Effective date: 20190904 Ref country code: IS Free format text: LAPSE BECAUSE OF FAILURE TO SUBMIT A TRANSLATION OF THE DESCRIPTION OR TO PAY THE FEE WITHIN THE PRESCRIBED TIME-LIMIT Effective date: 20200105 |
|
| 26N | No opposition filed |
Effective date: 20200605 |
|
| PG25 | Lapsed in a contracting state [announced via postgrant information from national office to epo] |
Ref country code: SI Free format text: LAPSE BECAUSE OF FAILURE TO SUBMIT A TRANSLATION OF THE DESCRIPTION OR TO PAY THE FEE WITHIN THE PRESCRIBED TIME-LIMIT Effective date: 20190904 |
|
| REG | Reference to a national code |
Ref country code: DE Ref legal event code: R082 Ref document number: 602016020197 Country of ref document: DE Representative=s name: VENNER SHIPLEY GERMANY LLP, DE Ref country code: DE Ref legal event code: R082 Ref document number: 602016020197 Country of ref document: DE Representative=s name: VENNER SHIPLEY LLP, DE |
|
| PG25 | Lapsed in a contracting state [announced via postgrant information from national office to epo] |
Ref country code: LI Free format text: LAPSE BECAUSE OF NON-PAYMENT OF DUE FEES Effective date: 20200531 Ref country code: CH Free format text: LAPSE BECAUSE OF NON-PAYMENT OF DUE FEES Effective date: 20200531 Ref country code: MC Free format text: LAPSE BECAUSE OF FAILURE TO SUBMIT A TRANSLATION OF THE DESCRIPTION OR TO PAY THE FEE WITHIN THE PRESCRIBED TIME-LIMIT Effective date: 20190904 |
|
| REG | Reference to a national code |
Ref country code: BE Ref legal event code: MM Effective date: 20200531 |
|
| PG25 | Lapsed in a contracting state [announced via postgrant information from national office to epo] |
Ref country code: LU Free format text: LAPSE BECAUSE OF NON-PAYMENT OF DUE FEES Effective date: 20200518 |
|
| PG25 | Lapsed in a contracting state [announced via postgrant information from national office to epo] |
Ref country code: IE Free format text: LAPSE BECAUSE OF NON-PAYMENT OF DUE FEES Effective date: 20200518 |
|
| PG25 | Lapsed in a contracting state [announced via postgrant information from national office to epo] |
Ref country code: BE Free format text: LAPSE BECAUSE OF NON-PAYMENT OF DUE FEES Effective date: 20200531 |
|
| PG25 | Lapsed in a contracting state [announced via postgrant information from national office to epo] |
Ref country code: TR Free format text: LAPSE BECAUSE OF FAILURE TO SUBMIT A TRANSLATION OF THE DESCRIPTION OR TO PAY THE FEE WITHIN THE PRESCRIBED TIME-LIMIT Effective date: 20190904 Ref country code: MT Free format text: LAPSE BECAUSE OF FAILURE TO SUBMIT A TRANSLATION OF THE DESCRIPTION OR TO PAY THE FEE WITHIN THE PRESCRIBED TIME-LIMIT Effective date: 20190904 Ref country code: CY Free format text: LAPSE BECAUSE OF FAILURE TO SUBMIT A TRANSLATION OF THE DESCRIPTION OR TO PAY THE FEE WITHIN THE PRESCRIBED TIME-LIMIT Effective date: 20190904 |
|
| PG25 | Lapsed in a contracting state [announced via postgrant information from national office to epo] |
Ref country code: MK Free format text: LAPSE BECAUSE OF FAILURE TO SUBMIT A TRANSLATION OF THE DESCRIPTION OR TO PAY THE FEE WITHIN THE PRESCRIBED TIME-LIMIT Effective date: 20190904 |
|
| PGFP | Annual fee paid to national office [announced via postgrant information from national office to epo] |
Ref country code: FR Payment date: 20230420 Year of fee payment: 8 Ref country code: DE Payment date: 20230420 Year of fee payment: 8 |
|
| PGFP | Annual fee paid to national office [announced via postgrant information from national office to epo] |
Ref country code: GB Payment date: 20230420 Year of fee payment: 8 |
|
| REG | Reference to a national code |
Ref country code: DE Ref legal event code: R119 Ref document number: 602016020197 Country of ref document: DE |
|
| GBPC | Gb: european patent ceased through non-payment of renewal fee |
Effective date: 20240518 |
|
| PG25 | Lapsed in a contracting state [announced via postgrant information from national office to epo] |
Ref country code: DE Free format text: LAPSE BECAUSE OF NON-PAYMENT OF DUE FEES Effective date: 20241203 |
|
| PG25 | Lapsed in a contracting state [announced via postgrant information from national office to epo] |
Ref country code: FR Free format text: LAPSE BECAUSE OF NON-PAYMENT OF DUE FEES Effective date: 20240531 |
|
| PG25 | Lapsed in a contracting state [announced via postgrant information from national office to epo] |
Ref country code: GB Free format text: LAPSE BECAUSE OF NON-PAYMENT OF DUE FEES Effective date: 20240518 |