EP3255894A1 - Quality-of-experience optimization system, quality-of-experience optimization device, recommendation request device, quality-of-experience optimization method, recommendation request method and program - Google Patents
Quality-of-experience optimization system, quality-of-experience optimization device, recommendation request device, quality-of-experience optimization method, recommendation request method and program Download PDFInfo
- Publication number
- EP3255894A1 EP3255894A1 EP15881232.1A EP15881232A EP3255894A1 EP 3255894 A1 EP3255894 A1 EP 3255894A1 EP 15881232 A EP15881232 A EP 15881232A EP 3255894 A1 EP3255894 A1 EP 3255894A1
- Authority
- EP
- European Patent Office
- Prior art keywords
- qoe
- recommend
- quality
- average
- function
- Prior art date
- Legal status (The legal status is an assumption and is not a legal conclusion. Google has not performed a legal analysis and makes no representation as to the accuracy of the status listed.)
- Granted
Links
Images



















Classifications
-
- H—ELECTRICITY
- H04—ELECTRIC COMMUNICATION TECHNIQUE
- H04L—TRANSMISSION OF DIGITAL INFORMATION, e.g. TELEGRAPHIC COMMUNICATION
- H04L65/00—Network arrangements, protocols or services for supporting real-time applications in data packet communication
- H04L65/80—Responding to QoS
-
- H—ELECTRICITY
- H04—ELECTRIC COMMUNICATION TECHNIQUE
- H04N—PICTORIAL COMMUNICATION, e.g. TELEVISION
- H04N21/00—Selective content distribution, e.g. interactive television or video on demand [VOD]
- H04N21/40—Client devices specifically adapted for the reception of or interaction with content, e.g. set-top-box [STB]; Operations thereof
- H04N21/45—Management operations performed by the client for facilitating the reception of or the interaction with the content or administrating data related to the end-user or to the client device itself, e.g. learning user preferences for recommending movies, resolving scheduling conflicts
- H04N21/462—Content or additional data management e.g. creating a master electronic programme guide from data received from the Internet and a Head-end or controlling the complexity of a video stream by scaling the resolution or bit-rate based on the client capabilities
- H04N21/4621—Controlling the complexity of the content stream or additional data, e.g. lowering the resolution or bit-rate of the video stream for a mobile client with a small screen
-
- G—PHYSICS
- G06—COMPUTING OR CALCULATING; COUNTING
- G06F—ELECTRIC DIGITAL DATA PROCESSING
- G06F13/00—Interconnection of, or transfer of information or other signals between, memories, input/output devices or central processing units
-
- H—ELECTRICITY
- H04—ELECTRIC COMMUNICATION TECHNIQUE
- H04L—TRANSMISSION OF DIGITAL INFORMATION, e.g. TELEGRAPHIC COMMUNICATION
- H04L65/00—Network arrangements, protocols or services for supporting real-time applications in data packet communication
- H04L65/60—Network streaming of media packets
- H04L65/61—Network streaming of media packets for supporting one-way streaming services, e.g. Internet radio
- H04L65/612—Network streaming of media packets for supporting one-way streaming services, e.g. Internet radio for unicast
-
- H—ELECTRICITY
- H04—ELECTRIC COMMUNICATION TECHNIQUE
- H04N—PICTORIAL COMMUNICATION, e.g. TELEVISION
- H04N21/00—Selective content distribution, e.g. interactive television or video on demand [VOD]
- H04N21/20—Servers specifically adapted for the distribution of content, e.g. VOD servers; Operations thereof
- H04N21/25—Management operations performed by the server for facilitating the content distribution or administrating data related to end-users or client devices, e.g. end-user or client device authentication, learning user preferences for recommending movies
- H04N21/266—Channel or content management, e.g. generation and management of keys and entitlement messages in a conditional access system, merging a VOD unicast channel into a multicast channel
- H04N21/2662—Controlling the complexity of the video stream, e.g. by scaling the resolution or bitrate of the video stream based on the client capabilities
-
- H—ELECTRICITY
- H04—ELECTRIC COMMUNICATION TECHNIQUE
- H04N—PICTORIAL COMMUNICATION, e.g. TELEVISION
- H04N21/00—Selective content distribution, e.g. interactive television or video on demand [VOD]
- H04N21/40—Client devices specifically adapted for the reception of or interaction with content, e.g. set-top-box [STB]; Operations thereof
- H04N21/43—Processing of content or additional data, e.g. demultiplexing additional data from a digital video stream; Elementary client operations, e.g. monitoring of home network or synchronising decoder's clock; Client middleware
- H04N21/442—Monitoring of processes or resources, e.g. detecting the failure of a recording device, monitoring the downstream bandwidth, the number of times a movie has been viewed, the storage space available from the internal hard disk
- H04N21/44209—Monitoring of downstream path of the transmission network originating from a server, e.g. bandwidth variations of a wireless network
-
- H—ELECTRICITY
- H04—ELECTRIC COMMUNICATION TECHNIQUE
- H04N—PICTORIAL COMMUNICATION, e.g. TELEVISION
- H04N21/00—Selective content distribution, e.g. interactive television or video on demand [VOD]
- H04N21/40—Client devices specifically adapted for the reception of or interaction with content, e.g. set-top-box [STB]; Operations thereof
- H04N21/47—End-user applications
- H04N21/472—End-user interface for requesting content, additional data or services; End-user interface for interacting with content, e.g. for content reservation or setting reminders, for requesting event notification, for manipulating displayed content
-
- H—ELECTRICITY
- H04—ELECTRIC COMMUNICATION TECHNIQUE
- H04N—PICTORIAL COMMUNICATION, e.g. TELEVISION
- H04N21/00—Selective content distribution, e.g. interactive television or video on demand [VOD]
- H04N21/60—Network structure or processes for video distribution between server and client or between remote clients; Control signalling between clients, server and network components; Transmission of management data between server and client, e.g. sending from server to client commands for recording incoming content stream; Communication details between server and client
- H04N21/63—Control signaling related to video distribution between client, server and network components; Network processes for video distribution between server and clients or between remote clients, e.g. transmitting basic layer and enhancement layers over different transmission paths, setting up a peer-to-peer communication via Internet between remote STB's; Communication protocols; Addressing
- H04N21/637—Control signals issued by the client directed to the server or network components
- H04N21/6377—Control signals issued by the client directed to the server or network components directed to server
- H04N21/6379—Control signals issued by the client directed to the server or network components directed to server directed to encoder, e.g. for requesting a lower encoding rate
Definitions
- the present invention relates to a quality-of-service optimization technique for optimizing quality that a user experiences (QoE: Quality of Experience) in content distribution services.
- QoE Quality of Experience
- a method is being considered in which, an interface for setting a distribution rate which has an effect on QoE in the user side is prepared, so that the user sets a distribution rate considering the user's communication environment and the like.
- three patterns of qualities of high/medium/low and the like are prepared for distribution rates.
- video distribution services such as YouTube (registered trade mark)
- there is an interface by which image quality can be selected (refer to non-patent document 1).
- an available band of a user is estimated in some form, so that content is delivered by a bit rate according to the available band.
- This method is classified to some schemes with respect to the scheme for estimating the available band.
- the available band is estimated from a past communication history and the like.
- estimation is performed by utilizing some tendency on the available band.
- estimation of the available band is performed by using stationarity of time series (refer to non-patent document 3).
- the active type estimation scheme short communication is performed before distribution, so that the available band is estimated based on communication performance at that time.
- a packet group called a packet train, that sequentially becomes large is transmitted before communication, and the available band is estimated based on a change amount of delay to arrival (refer to non-patent document 4).
- the speed of the communication itself is measured, so that the distribution rate is changed in real time in accordance with the communication speed at that time.
- This scheme is mainly applied to video distribution in which the distribution rate can be changed in the middle.
- content is divided into files of a short time unit called a chunk type, network quality (NW quality) and the like is measured between a server and a client for each chunk, and a distribution rate of a chunk that the terminal receives next is determined based on the measurement result, so that the content is distributed. Accordingly, by storing content in a playback buffer of a user terminal and reproducing the content, high quality content distribution becomes available even in a low rate (refer to non-patent documents 5, 6)
- a distribution rate can be set according to the distribution side equipment amount.
- rate control depending on a communication environment for each user is not performed, there is a problem in that a (rebuffering) event occurs in which content video distribution is performed with an excessive rate with respect to the communication environment, or an event occurs in which content distribution is performed with a too small rate.
- the present invention is conceived in view of such problems, and an object of the present invention is to provide a technique to make it possible to store information related to NW quality / QoE for each content distribution, estimate a distribution method for optimizing QoE based on the information, and perform recommendation.
- a quality-of-experience optimization system of the disclosed technique is a quality-of-experience optimization system configured to optimize quality (QoE: Quality of Experience) that a user experiences in a content distribution service, including:
- a quality-of-experience optimization apparatus of the disclosed technique is a quality-of-experience optimization apparatus configured to optimize quality (QoE: Quality of Experience) that a user experiences in a content distribution service, including:
- a recommend request apparatus of the disclosed technique is a recommend request apparatus for optimizing QoE in a content distribution service, including:
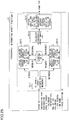
- Fig. 1 is a diagram showing system outline of a quality-of-experience optimization system according to an embodiment of the present invention.
- the quality-of-experience optimization system is formed by two apparatuses which are a "recommend request apparatus 40" configured to request a parameter for performing optimum distribution and a "quality-of-experience optimization apparatus 1" configured to estimate QoE from various distribution parameters and to recommend an optimum parameter, in a video distribution system (to be referred to as OTT(Over-The-Top) hereinafter) of a content distributor.
- OTT Over-The-Top
- the recommend request apparatus 40 includes a parameter output unit 41 configured to output, to the quality-of-experience optimization apparatus 1, a distribution parameter candidate for content distribution in order to request a distribution parameter, as a recommend value, for optimizing QoE, and a recommend value reception unit 42 configured to receive the recommend value from the quality-of-experience optimization apparatus 1.
- the quality-of-experience optimization apparatus 1 includes two functions which are a "estimation/recommend function (estimation value ⁇ recommend value calculation unit 10)" and a “data storage function (setting value update unit 20)", and provides the following services to the OTT via an IP network.
- Each of the recommend request apparatus 40 and the quality-of-experience optimization apparatus 1 is provided with a CPU which is a computer, a storage device, an input/output device, and a communication device, so that the CPU controls operation of each device according to the program stored in the storage device to execute various types of functions. Also, as to each of the recommend request apparatus 40 and the quality-of-experience optimization apparatus 1, each unit (each function) may be a hardware circuit (integrated circuit and the like).
- a request of the video is transmitted to a video distribution system.
- the user transmits user attribute information (example: use place, network use form and terminal information) via an application or a browser.
- the video distribution system that received a viewing request of the video transmits, to the quality-of-experience optimization apparatus 1, a coding condition (which includes a distribution rate, a resolution, a frame rate and the like, wherein these may be referred to as distribution parameter candidates) for each of a plurality of image qualities prepared in the video distribution system with respect to the user attribute information and the corresponding video, to inquire about an optimum coding condition.
- a coding condition which includes a distribution rate, a resolution, a frame rate and the like, wherein these may be referred to as distribution parameter candidates
- the quality-of-experience optimization apparatus 1 calculates a coding condition by which QoE becomes the largest by using a technique described in detail in the following, and returns the coding condition to the video distribution system as a response.
- the video distribution system performs video distribution to the user using the received condition. After viewing the video, the user enters viewing log information (throughput information, network information and the like) as an actual result into the quality-of-experience optimization system.
- viewing log information throughput information, network information and the like
- the newest network quality information continues to be updated, so that highly accurate estimation can be performed.
- Fig. 2 is a diagram showing a functional configuration of the quality-of-experience optimization apparatus 1 in the quality-of-experience optimization system.
- the quality-of-experience optimization apparatus 1 is formed by three of the estimation value ⁇ recommend value calculation unit 10, the setting value update unit 20, and the parameter input and output unit 30.
- the estimation value ⁇ recommend value calculation unit 10 calculates and outputs various kinds of estimation values and recommend values for optimizing QoE based on data from the OTT input via the recommend request apparatus 40 and the IP network, and the viewing log, throughput table, various constant values and the like stored in the storage unit 24 of the setting value update unit 20.
- the setting value update unit 20 performs information update of the viewing log and the throughput table based on data from the OTT. Also, the setting value update unit 20 updates the setting value of the quality-of-experience optimization apparatus 1 based on input data from a system administrator of the OTT and the quality-of-experience optimization apparatus 1.
- the parameter input and output unit 30 receives a recommend request from the recommend request apparatus 40 via the IP network and the like, receives a distribution parameter, and transmits a recommend value calculated by the estimation value ⁇ recommend value calculation unit 10.
- the estimation value ⁇ recommend value calculation unit 10 is formed by six functional blocks which are a throughput estimation function 11, a playback stop state estimation function 12, a QoE estimation function 13, a resolution ⁇ frame rate recommend function 14, an initial coding parameter recommend function 15 and a real-time coding parameter recommend function 16.
- the setting value update unit 20 is formed by three blocks which are a throughput table information update function 21, a viewing log update function 22, and a setting value reference function 23, and by a storage unit 24.
- the parameter input and output unit 30 receives and transmits data of an IP packet via an OTT interface with the OTT via the IP network.
- the setting value reference function 23 of the setting value update unit 20 inputs a command or data via an administrator interface (CUI; Character User Interface) between the setting value reference function 23 and the input and output apparatus 25 of the system administrator of the quality-of-experience optimization apparatus 1, and outputs data.
- CCI Configuration User Interface
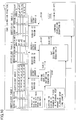
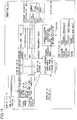
- Fig. 3 is a diagram for explaining an outline of main functions in the quality-of-experience optimization apparatus 1.
- Fig. 4 is a diagram showing a process flow of the quality-of-experience optimization apparatus 1.
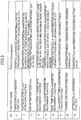
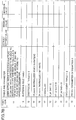
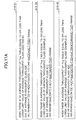
- Fig. 5A is a diagram for explaining an example of the definition of input/output data in the OTT interface of the quality-of-experience optimization apparatus 1.
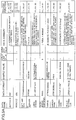
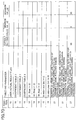
- Fig. 5B is a diagram for explaining definition of input/output data in the OTT interface of the quality-of-experience optimization apparatus 1.
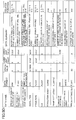
- Fig. 5C is a diagram for explaining definition of input/output data in the OTT interface of the quality-of-experience optimization apparatus 1.
- Fig. 5D is a diagram for explaining definition of input/output data in the OTT interface of the quality-of-experience optimization apparatus 1.
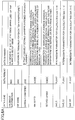
- Fig. 5E is a diagram for explaining definition of input/output data in the OTT interface of the quality-of-experience optimization apparatus 1.
- input data "service ID” from the OTT indicates that it is an ID assigned for each distribution service by the OTT, and is input to each function 11 ⁇ 16 of the estimation value ⁇ recommend value calculation unit 10 and the viewing log update function 22 of the setting value update unit 20 (I11 ⁇ I16,I22).
- “throughput average average” indicates an average value [kbps] of a measured throughput average that is calculated by the throughput estimation function 11 of the estimation value ⁇ recommend value calculation unit 10 and is output to the parameter input and output unit 30 (o11).
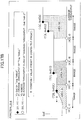
- Figs. 6A and 6B are diagrams for explaining definitions of other data used in each function of the quality-of-experience optimization apparatus 1.
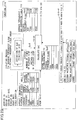
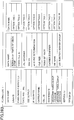
- Fig. 7A is a diagram showing an example of a list of tables and parameters stored in the storage unit 24 to be referred/updated in each function of the quality-of-experience optimization apparatus 1.
- Fig. 7B is a diagram showing an example of a list of tables and parameters stored in the storage unit 24 to be referred/updated in each function of the quality-of-experience optimization apparatus 1.
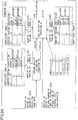
- Fig. 7C is a diagram showing an example of a list of tables and parameters stored in the storage unit 24 to be referred/updated in each function of the quality-of-experience optimization apparatus 1.
- Fig. 7D is a diagram showing an example of a list of tables and parameters stored in the storage unit 24 to be referred/updated in each function of the quality-of-experience optimization apparatus 1.
- Fig. 7E is a diagram showing an example of a list of tables and parameters stored in the storage unit 24 to be referred/updated in each function of the quality-of-experience optimization apparatus 1.
- the column of [function] shows codes of functions for referring to/updating corresponding tables and parameters by associating the codes and the tables and parameters.
- the "(day of week, time) - calendar information conversion table T1" in Fig. 7A is referred to by the throughput estimation function 11 of the estimation value ⁇ recommend value calculation unit 10.
- the "resolution table T8" in Fig. 7C is referred to by the resolution ⁇ frame rate recommend function 14 of the estimation value ⁇ recommend value calculation unit 10.
- the "Viewing log R" in Fig. 7E is updated by the viewing log update function 22 of the setting value update unit 20.
- the throughput estimation function 11 is a function for calculating information related to a throughput from input information of the OTT.
- the throughput estimation function 11 For each content distribution request of a user of a content distribution service, the throughput estimation function 11 inputs various pieces of input data (service ID, design ID, date and time, the following parameters are optional (use server, distribution server group, user ID, fixed/mobile identifier, server speed control, [IP address or carrier name], [cell ID or coordinate], wi-fi use determination)) via the OTT interface ( Fig. 2 ) of the parameter input and output unit 30 from the OTT through the IP network, and calculates and outputs information on throughput [throughput average average, throughput average deviation, throughput deviation average, user actual result average average, user actual result average deviation, user actual result deviation average].
- the playback stop state estimation function 12 is a function for calculating information related to playback stop from input information of the OTT and information related to the throughput.
- the playback stop state estimation function 12 receives various pieces of input data (service ID, design ID, coding bit rate, average throughput, throughput deviation, video duration, following parameters are optional (playback start threshold, playback restart threshold, playback stop threshold)) via the OTT interface ( Fig. 2 ) of the parameter input and output unit 30 through the IP network from the OTT, and calculates and outputs an average number of times of playback stop and average playback stop time by using coefficients (coefficient tables 4 and 5) stored in the storage unit 24 for the internal system beforehand.
- coefficients coefficient tables 4 and 5
- the QoE estimation function 13 is a function for calculating QoE from information related to coding.
- the QoE estimation function 13 For each content distribution request of a user of a content distribution service, the QoE estimation function 13 receives various pieces of input data (service ID, design ID, coding bit rate, resolution, frame rate, following parameters are optional (number of times of playback stop, array of playback stop time length)) via the OTT interface ( Fig. 2 ) of the parameter input and output unit 30 through the IP network from the OTT, and calculates and outputs QoE.
- service ID service ID, design ID, coding bit rate, resolution, frame rate, following parameters are optional (number of times of playback stop, array of playback stop time length)
- the resolution ⁇ frame rate recommend function 14 is a function for calculating a resolution and a frame rate by which QoE becomes the largest from the coding bit rate.
- the resolution ⁇ frame rate recommend function 14 is executed each time when designing/redesigning (encoding etc.) of the content distribution service is performed, and the resolution ⁇ frame rate recommend function 14 receives various pieces of input data (service ID, design ID, coding bit rate, following parameters are optional (number of times of playback stop, array of playback stop time length, resolution array, frame rate array)) via the OTT interface ( Fig. 2 ) of the parameter input and output unit 30 through the IP network from the OTT, and calculates and outputs a resolution, a frame rate and QoE.
- the initial coding parameter recommend function 15 is a function for calculating a coding parameter by which average QoE of the whole users (whole average QoE) becomes the largest.
- the initial coding parameter recommend function 15 is executed each time when designing/redesigning (encoding etc.) of a content distribution service is performed, and the initial coding parameter recommend function 15 receives various pieces of input data (service ID, design ID, number of encodes, following parameter is optional (coding bit rate array)) via the OTT interface ( Fig. 2 ) of the parameter input and output unit 30 through the IP network from the OTT, and calculates and outputs a whole average QoE and a coding parameter table T12.
- the real-time coding parameter recommend function 16 is a function for calculating information related to coding parameters from input information of the OTT.
- the real-time coding parameter recommend function 16 receives various pieces of input data (service ID, design ID, date and time, following parameters are optional (use server, distribution server group, user ID, fixed/mobile identifier, server speed control, [IP address or carrier name], [cell ID or coordinate], wi-fi use determination, OTT coding parameter table, video duration, playback start threshold, playback restart threshold, playback stop threshold)) via the OTT interface ( Fig. 2 ) of the parameter input and output unit 30 through the IP network from the OTT, and calculates a resolution, a frame Rate, a coding bit rate, and a QoE, a local average QoE, and outputs inputs and outputs as a log.
- the local average QoE corresponds to an average QoE of all users in the same network environment as the user who is the target of recommendation.
- the throughput table information update function 21 is a function for updating throughput tables ("(calendar information, base station ID) - speed conversion table T4", "(calendar information, NW name) - speed conversion table T5" or "(calendar information, use server) - speed conversion table T6").
- the update cycle is based on the time of system operation, and, for example, by being automatically launched about once in 1 ⁇ 5 minutes, the throughput table information update function 21 updates the update target table based on update target designation information (calendar information, use server, NW name) of input information from the OTT.
- update target designation information (calendar information, use server, NW name) of input information from the OTT.
- the viewing log update function 22 is a function for newly creating/updating a viewing log R.
- the viewing log update function 22 When there is input data (user ID, fixed/mobile identifier, date and time, use server, distribution server group, IP address, carrier name, cell ID, coordinates, measured throughput average, measured throughput deviation, service ID, design ID, number of times of video stop, video file ID, use browser, use OS, wi-fi use judgment, file size, video bit rate, carrier identifier, NW name, option tags 1 ⁇ 10) as input information of the OTT, the viewing log update function 22 performs new addition or update to the viewing log R stored in the storage unit 24.
- the setting value reference function 23 is a function for referring to and updating setting values ( Fig. 7A ⁇ Fig. 7E ) of the tables/parameters/coefficients (constants) and the like stored in the storage unit 24. Based on input data from the OTT and command data from a system administrator of the quality-of-experience optimization apparatus 1, the setting value reference function 23 updates the setting values used in each function of the quality-of-experience optimization apparatus 1.
- the CPU controls operation of each unit according to commands described in a program which governs each function stored in the storage device, and software and hardware operate by cooperating with each other, so that the throughput estimation function 11, the playback stop state estimation function 12, the QoE estimation function 13, the resolution ⁇ frame rate recommend function 14, the initial coding parameter recommend function 15, the real-time coding parameter recommend function 16, the throughput table information update function 21, the viewing log update function 22, and the setting value reference function 23, as described in the after-mentioned operation description, are realized.
- each of the throughput estimation function 11, the playback stop state estimation function 12, the QoE estimation function 13, the resolution ⁇ frame rate recommend function 14, the initial coding parameter recommend function 15, the real-time coding parameter recommend function 16, the throughput table information update function 21, the viewing log update function 22, and the setting value reference function 23 can be realized as a hardware circuit incorporating the processing.
- the technique used by the throughput estimation function 11 in the present embodiment is a technique for estimating a current throughput from past viewing logs (throughput actual result values) of a user's network environment.
- Fig. 8A and Fig. 8B are diagrams for explaining processing executed by the throughput estimation function 11 of the quality-of-experience optimization apparatus 1.
- Fig. 8A mainly shows a procedure of processing
- Fig. 8B shows an example of tables used in the procedure.
- a day-of-week label is acquired from the input year/month/day and time, and conversion to calendar information according to the corresponding day-of-week label and time is performed in accordance with the (day of week, time) - calendar information conversion table T1 (step S11).
- the throughput estimation function 11 can select the day-of-week label that matches the year/month/day by matching with calendar information and the like.
- the day-of-week label from the year/month/day when the year/month/day is a holiday, a label indicating a holiday is selected, and in other cases, a label indicating a day of week (Sunday to Saturday) is selected.
- service ID service ID
- design ID date and time (year/month/day, time)
- optional parameters use server, distribution server group, user ID, fixed/mobile identifier, server speed control).
- IP address As input data of fixed only, there is an IP address (or carrier name). As for input data of mobile only, there are wi-fi use determination data, and carrier name and cell ID (or coordinates or both) as data when wi-fi use determination is false, and IP address as data when wi-fi use determination is true. It is acceptable even if unnecessary information is included in the input data because it is input to the viewing log update function 22.
- step S112 On the basis of the input data, it is determined whether the user's terminal is a fixed terminal or a wi-fi use terminal or a mobile terminal (mobile) not using wi-fi (step S112).
- the IP address of the user terminal is converted into a NW name according to the IP address-ISP conversion table T2 (step S113a).
- the carrier name corresponding to the user terminal is converted into a carrier identifier according to the carrier name-carrier identifier conversion table T3, and a cell ID is given (step S113b).
- the content of the viewing log R corresponding to the input data stored in the storage unit 24 is updated by the viewing log update function 22 of the setting value update unit 20 (step S114).
- a NW speed (throughput average average/ average deviation / deviation average) is acquired according to the (calendar information, base station ID) - speed conversion table T4 or the (calendar information, NW name) - speed conversion table T 5 (step S115).
- step S116 it is determined whether or not a use server has been input as input data.
- the use server When the use server has been input, it is determined whether or not server speed control information has been input as input data, and when the server speed control information has been input, the value of the server speed control information is set as a throughput average average of the server and the throughput average deviation and deviation average are set to "0".
- the throughput average average, the throughput average deviation, and the throughput deviation average of the use server are set according to the (calendar information, use server) - speed conversion table T6 (step S117).
- the throughput average average of the NW acquired in step S115 and the throughput average average of the use server obtained in step S117 are compared, so that the smaller one of the throughput average averages, and the throughput average deviation and the throughput deviation average corresponding to the smaller one are made to be output targets (step S118).
- the throughput average average, the throughput average deviation and the throughput deviation average of the NW obtained in step S115 are made to be output targets (step S119).
- the user terminal is a fixed terminal or a wi-fi use terminal
- the viewing log R stored in the storage unit 24 when there are logs, the number of which is equal to or greater than the calculation number of past logs (11_limit), whose elapsed time is within the past log search period (11_time), having measured throughput average and measured throughput deviation, and having the same (user ID, distribution server group, NW name, calendar information), throughput calculation is performed for the latest calculation number (11_limit) of the user's viewing logs.
- an average value of the measured throughput averages is calculated as a user actual result average average
- a deviation of the measured throughput averages is calculated as a user actual result average deviation
- an average value of the measured throughput deviations is calculated as a user actual result deviation average.
- the user terminal is a mobile terminal not using wi-fi and there are coordinates as the input data
- the viewing log R stored in the storage unit 24 when there are logs, the number of which is equal to or greater than the calculation number of past logs (11_limit), whose elapsed time is within the past log search period (11_time), having measured throughput average and measured throughput deviation, and having the same (user ID, carrier identifier, calendar information, distance within search distance (11_dist) of past log), throughput calculation similar to the before-mentioned one is performed for the latest calculation number (11_limit) of the user's viewing logs.
- the user terminal is a mobile terminal (mobile) not using wi-fi and there are not coordinates as the input data
- the viewing log R stored in the storage unit 24 when there are logs, the number of which is equal to or greater than the calculation number of past logs (11_limit), whose elapsed time is within the past log search period (11_time), having measured throughput average and measured throughput deviation, and having the same (user ID, distribution server group, cell ID information (base station ID), calendar information), throughput calculation similar to the before-mentioned one is performed for the latest calculation number (11_limit) of the user's viewing logs.
- the value obtained by the above calculation is set as the user actual result. However, according to the calculation flag of the user actual result (11_use_user_result), depending on a calculation target user, this process (S120) is skipped so that throughput average average / average deviation / deviation average of the user actual result is not output.
- the throughput average average, the throughput average deviation, the throughput deviation average estimated by step S118 or S119 and made to be as output targets, and the user actual result average average, the user actual result average deviation, and the user actual result deviation average calculated in S120 are output to the OTT.
- the viewing log update function 22 is executed even when other information is insufficient.
- the playback stop state estimation technique in the playback stop state estimation function 12 of the present embodiment is a technique to estimate the number of times of playback stop / playback stop time from a throughput average / deviation, a coding bit rate, a video length (duration), a playback start threshold / playback stop threshold / playback restart threshold that are output values of a throughput estimation technique.
- a terminal has a buffer for accumulating received data, and operations of playback start, stop, and restart are determined according to the remaining amount of the buffer.
- a throughput average/deviation a coding bit rate, a video length (duration), a playback start threshold / a playback stop threshold / a playback restart threshold are input, so that the number of times of playback stop and the playback stop time are obtained.
- a throughput average/deviation a coding bit rate, a video length (duration), a playback start threshold / a playback stop threshold / a playback restart threshold are input, so that the number of times of playback stop and the playback stop time are obtained.
- Fig. 9 is a diagram for explaining processing executed by the playback stop state estimation function 12 of the quality-of-experience optimization apparatus 1.
- SC is the average number of times of playback stop
- SL is the average playback stop time
- T is an average throughput
- T_std is a throughput deviation
- BR is a coding bit rate
- DR is a video duration
- IT is a playback start threshold.
- RT is a playback restart threshold
- ST is a playback stop threshold
- e1 ⁇ e8 are constants
- f1 ⁇ f6 are constants
- DR_norm is a normalized video duration
- BR_norm is a normalized bit rate
- EU is an estimation unit.
- the playback start threshold IT, the playback restart threshold RT, and the playback stop threshold ST are obtained from the playback threshold table T7 based on the service ID and the design ID.
- coefficients e1 ⁇ e8 and coefficients f1 ⁇ f6 are not input, coefficients e1 ⁇ e8 of the equation 5 are acquired from the coefficient table 4 based on the service ID and the design ID, and coefficients f1 ⁇ f6 of the equation 6 are obtained from the coefficient table 5.
- DR_norm, BR_norm, estimate_unit, IT_dr, RT_dr, and ST_dr are not input, the DR_norm, BR_norm, estimate_unit, IT_dr, RT_dr, ST_dr are acquired from the config file F1.
- the average number of times of playback stop SC is estimated, and from the input information, the average playback stop time SL is estimated using the equation 6.
- the QoE estimation technique of the present embodiment is a technique for estimating QoE from a coding bit rate, a resolution, and a frame rate.
- a relationship between QoE and various coding bit rates / resolutions / frame rates is obtained by subjective evaluation experiment and the like, and the relationship is expressed as a model equation.
- QoE can be calculated by inputting a coding bit rate, a resolution, and a frame rate to the model equation.
- QoE can be calculated also in consideration of the number of times of playback stop and the playback stop time length. Note that each equation used in the present embodiment is an example, and other equations may be used.
- Fig. 10 is a diagram for explaining processing executed by the QoE estimation function 13 of the quality-of-experience optimization apparatus 1.
- the coefficient array 1 is acquired from the coefficient table 1 based on the service ID and the design ID, and QoE_C (intermediate parameter) is calculated according to the following equation 1 (coding quality estimation) (step S131).
- bitrate is an coding bit rate
- RS is a resolution
- FR is a frame rate
- a 1 ⁇ a 5 , b 1 ⁇ b 4 are constants.
- Min (A, B) is a function that returns a smaller value of A and B
- n is the number of times of playback stop
- RL i is a time length of i-th occurred playback stop.
- c 1 , c 2 are constants.
- the coefficient array 3 is acquired from the coefficient table 3, and based on the QoE_CR calculated by the coefficient array 3 and the equation 2 and the input data, QoE is calculated according to the following equation 3 (terminal correction), and is output to the OTT as an estimated QoE (step S133).
- QoE 1 ⁇ r ⁇ d 1 log QoE _ CR + d 2 + r ⁇ d 3 ⁇ QoE _ CR + d 4
- r is 1 when there is a playback stop, is 0 when there is no playback stop, and d 1 ⁇ d i are constants.
- Fig. 11 is a diagram for explaining processing executed by the resolution ⁇ frame rate recommend function 14 of the quality-of-experience optimization apparatus 1.
- the QoE estimation process by the QoE estimation function 13 is repeatedly executed (step S142) for all pairs of resolutions and frame rates included in the input resolution array and frame rate array, so that a resolution and a frame rate by which the QoE becomes the largest, and the QoE are output.
- a frame rate array corresponding to the service ID and the design ID is acquired from the frame rate table T9.
- Fig. 12 is a diagram for explaining processing executed by the initial coding parameter recommend function 15 of the quality-of-experience optimization apparatus 1.
- Fig. 13 is a diagram for explaining processing executed by the function 15 - 1, that is a function included in the initial coding parameter recommend function 15 ( Fig. 12 ), and that outputs a whole QoE and a coding parameter table T12 from a coding bit rate array and average throughput distribution.
- Fig. 14 is a diagram for explaining processing executed by the function 15 - 2, that is a function included in the initial coding parameter recommend function 15 ( Fig. 12 ), for outputting an average throughput distribution table T11.
- Fig. 15 is a diagram for explaining processing executed by the function 15 - 3, that is a function included in the function 15 - 1 ( Fig. 13 ) for outputting the whole QoE and the coding parameter table T12 from the coding bit rate array and the average throughput distribution of the initial coding parameter recommend function 15, and that converts the coding parameter table T12 to an average throughput-QoE table T13.
- the initial coding parameter recommend function 15 of Fig. 12 receives various pieces of input data (service ID, design ID, number of encodings, following parameter is optional (encoding bit rate array)) via the parameter input and output unit 30 from the content distribution server of the OTT, an array of the size of the input number of encodings is created for all combinations of all coding bit rates included in the input coding bit rate array, and is output as a coding bit rate array list L1 (step S151).
- a coding bit rate array corresponding to the input service ID and design ID is acquired from the coding bit rate table T10.
- an average throughput distribution table T11 is acquired (step S152) by a function 15 - 2 ( Fig. 14 ) which outputs the after-mentioned average throughput distribution table T11 (step S152).
- step S152 the input service ID and design ID, and the average throughput distribution table T11 acquired in step S152 are input, so that the whole average QoE is calculated by the after-mentioned function 15-1 ( Fig. 13 ) for all coding bit rate arrays included in the coding bit rate array list L1 output in step S151, and a coding parameter table T12 is output (step S153, step S154). That is, the whole average QoE and the coding parameter table T12 are obtained for each coding bit rate array included in the coding bit rate array list L1.
- step S153 the whole average QoE and the coding parameter table T12 by which the whole average QoE becomes the largest output in step S153 are output to the OTT (step S154).
- the function 15 - 1 for outputting the whole QoE and the coding parameter table T12 from the coding bit rate array and the average throughput distribution in Fig. 13 first, calculates a QoE, a resolution, and a frame rate in accordance with the resolution ⁇ frame rate recommend function 14 (see Fig. 11 ), for all coding bit rates included in the coding bit rate array input from step S154 ( Fig. 12 ), and generates the coding parameter table T12 associating the QoE, the resolution, and the frame rate for each coding bit rate array (steps S15 - 11, S15 - 12).
- the after-mentioned function 15 - 3 converts the coding parameter table T12 to the average throughput-QoE table T13 (step S15 - 13), and calculates the whole average QoE according to the following equation 4 based on the converted average throughput-QoE table T13 and the average throughput distribution table T11 acquired in step S152 ( Fig. 12 ) (step S15 - 14).
- step S15-11 the whole average QoE calculated in step S15-14 are output to step S154 in Fig. 12 .
- the function 15 - 2 for outputting the average throughput distribution table T11 in Fig. 14 selects, from the viewing log R stored in the storage unit 24, according to the input service ID and design ID, measured throughput averages corresponding to logs of date and time which is within the analysis period set in the config file F 2 and up to the current date and time, and extracts the average throughput array (Step S15-21).
- the function 15 - 2 generates an average throughput distribution table T11 from the average throughput array extracted from the viewing log R based on the minimum value MIN, the maximum value MAX, and the width RANGE of the throughput class set in the config file F 3, and outputs it to step S15-14 of the function 15-1 ( Fig. 13 ) (step S15-22).
- step S15-14 of the function 15-1 Fig. 13
- the function 15 - 3 for converting the coding parameter table T12 to the average throughput-QoE table T13 in Fig. 15 converts all coding bit rates of the coding parameter table T12 generated in step S15 - 11 of the function 15 - 1 ( Fig. 13 ) to average throughput to generate a Tmp table T14 (step S15 - 31).
- the target coding bit rate of the coding parameter table T12 is equal to or greater than the coding bit rate class lower limit value set in the config file F4 and less than the coding bit rate class upper limit value
- a corresponding offset value of the config file F4 is added to the coding bit rate, and the encoding bit rate is converted into the average throughput.
- the coding bit rate is directly converted to the average throughput.
- the average throughput-QoE table T13 is initialized based on the minimum value MIN, the maximum value MAX, and the width RANGE of the throughput class set in the config file F3 (step S15 - 32).
- 500 means from MIN to MIN + RANGE
- 1000 means from MIN + RANGE to MIN + RANGE*2.
- a resolution, a frame rate, and a QoE corresponding to each average throughput class of the initialized throughput-QoE table T13 are set.
- a resolution and a frame rate of the existing average throughput are set in the average throughput-QoE table T13.
- a resolution and a frame rate of the smallest average throughput are set in the average throughput-QoE table T13.
- the method of calculating QoE in this case is described in detail later in the after-mentioned function 15 - 5 (see Figs. 17 and 18 ).
- Figs. 16A and 16B are diagrams for explaining the QoE calculation function 15 - 4, in the conversion function 15 - 3 for converting the coding parameter table T12 to the average throughput-QoE table T13, when the average throughput not exceeding the upper limit value of the average throughput class does not exist in the Tmp table T 14 (T ⁇ T_min).
- Figs. 17A and 17B are diagrams for explaining the QoE calculation function 15 - 5, in the conversion function 15 - 3 converting from the coding parameter table T12 to the average throughput-QoE table T13, when the average throughput of the Tmp table T14 exists in the range of the average throughput class.
- FIG. 17B an area S1 and RANGE are shown.
- Figs. 18A and 18B are diagrams for explaining the QoE calculation function 15 - 5 when the average throughput of the Tmp table T14 exists in the range of the average throughput class, in the conversion function 15 - 3 converting the coding parameter table T 12 to the average throughput-QoE table T13.
- the coding parameter table T12 and the whole average QoE obtained by which the whole average QoE obtained by the initial coding parameter recommend function 15 becomes the largest are output to the OTT.
- Fig. 19 is a diagram for explaining processing executed by the real-time coding parameter recommend function 16 of the quality-of-experience optimization apparatus 1.
- Fig. 20 is a diagram for explaining processing executed by the function 16 - 1 that is a function included in the real-time coding parameter recommend function 16 ( Fig. 19 ), and that generates an average throughput probability density table.
- Fig. 21 is a diagram for explaining processing executed by the function 16 - 2 that is a function included in the real-time coding parameter recommend function 16 ( Fig. 19 ) and that calculates a local average QoE and a QoE.
- Fig. 22 is a diagram for explaining processing executed by the function 16 - 3 that is a function included in the function 16 - 2 ( Fig. 21 ) for calculating the local average QoE and QoE of the real-time coding parameter recommend function 16, and that creates the average throughput-playback stop state table T17.
- Fig. 23 is a diagram for explaining processing executed by the function 16 - 3 that is a function included in the function 16 - 2 ( Fig. 21 ) for calculating the local average QoE and QoE of the real-time coding parameter recommend function 16, and that creates the average throughput-QoE table.
- Fig. 24 is a diagram for explaining processing executed by the QoE estimation function 16 - 5 that is a function included in the function 16 - 4 ( Fig. 23 ) for creating the average throughput-QoE table T 18 of the real-time coding parameter recommend function 16.
- the real-time coding parameter recommend function 16 of Fig. 19 receives various pieces of input data (service ID, design ID, date and time, the following are optional parameters (use server, distribution server group, user ID, fixed / mobile identifier, server speed control, [IP Address or carrier name], [cell ID or coordinate], wi- Fi use judgment, OTT coding parameter table, video duration, playback start threshold, playback restart threshold, playback stop threshold)) via the parameter input and output unit 30 from the content distribution server of the OTT, throughput average average, throughput average deviation, throughput deviation average, user actual result average average, user actual result average deviation, and user actual result deviation average estimated by the throughput estimation function 11 (see Fig. 8 ) are output.
- the creation function 16 - 1 ( Fig. 20 ) of the average throughput probability table which will be described later, creates the average throughput probability table T15 and outputs it to the after-described function 16 - 2 ( Fig. 21 ) for calculating the local average QoE and QoE (Step S161).
- the calculation function 16 - 2 of the local average QoE and QoE receives the throughput deviation average, the user actual deviation average output from the throughput estimation function 11, the input service ID, the setting ID, the video duration, the playback start threshold, the playback restart threshold, the playback stop threshold, and the average throughput probability table T15 output from the function 16 - 1 ( Fig. 20 ) for creating the average throughput probability table, the calculation function 16 - 2 calculates the local average QoE for all combinations of coding bit rate, resolution, and frame rate in the input OTT coding parameter table (step S162).
- the coding parameter array list is acquired from the coding parameter set table T16, and the set of the coding bit rate, resolution and frame rate is input to the calculation function 16-2 of the local average QoE and the QoE (Step S163).
- the resolution, the frame rate, the coding bit rate, and the local average QoE by which the local average QoE calculated by the calculation function 16 - 2 of the local average QoE and the QoE becomes the largest are output to the OTT. Also, the resolution, the frame rate, and the coding bit rate are input to the QoE estimation function 13 ( Fig. 10 ) (step S163).
- the function 16 - 1 for generating an average throughput probability density table in Fig. 20 initializes the average throughput probability table T15 based on the minimum value MIN, the maximum value MAX, and the width RANGE of the throughput class set in the config file F3 (step S16 - 11).
- the average throughput class in the average throughput probability table T15 is a value that increases from the minimum value MIN by the width RANGE.
- the user actual result flag set in the config file F5 and the throughput average average, user actual result average average, throughput average deviation, user actual result average deviation estimated by the throughput estimation function 11 (see Fig. 8 ) are input, and the probability of each row of the average throughput probability table T 15 is calculated based on the following equation 7 so as to output the average throughput probability table T15 to the calculation function 16 - 2 ( Fig. 21 ) of the local average QoE and QoE (step S16 -12).
- P is a probability
- m is a throughput average average or a user actual result average average.
- S is a throughput average deviation variance or a user actual result average deviation.
- the after-mentioned function 16 -3 for creating an average throughput-playback stop state table T17 creates an average throughput-playback stop state table T17 (step S16 - 21).
- the input service ID, the design ID, the coding bit rate, the resolution, the frame rate, the video duration, and the average throughput-playback stop state table T17 created by the function 16 - 3 ( Fig. 22 ) are input, so that an average throughput-QoE conversion table T18 is created (step S16 - 22) by the after-mentioned function 16 - 4 ( Fig. 23 ) for creating the average throughput-QoE table.
- the average throughput probability table T15 created by the average throughput probability density table generation function 16 - 1 ( Fig. 20 ), and the average throughput-QoE conversion table T18 created by the average throughput-QoE table creation function 16 - 4 are input, so that the local average QoE is calculated based on the following equation 8, and it is output to the process of step S163 in Fig. 19 (step S16 - 23).
- LAQoE ⁇ n ⁇ MTC P D n ⁇ Qo E n
- LAQoE is the local average QoE
- PDn is the probability of the average throughput class n in the average throughput probability table T15.
- QoEn is the QoE of the average throughput class n in the average throughput-QoE conversion table T18.
- MTC [] is the average throughput class sequence of the average throughput-probability table.
- the average throughput - the playback stop state table T17 is initialized (step S16 - 31).
- a value (average throughput class + RANGE/2) obtained by adding one half of RANGE to the corresponding average throughput class is set as an average throughput, and the average number of times of playback stop SC and the average playback stop time SL are calculated by the playback stop state estimation function 12 (see step S121 of Fig. 9 ) (step S 16 - 32).
- the average throughput-playback stop state table T17 thus created is output to the average throughput-QoE table creation function 16 - 4 ( Fig. 23 ).
- the function 16 - 4 for creating the average throughput-QoE table in Fig. 23 initializes the average throughput-QoE conversion table T18 based on the minimum value MIN, the maximum value MAX, and the width RANGE of the throughput class set in the config file F3 (steps S16 - 41).
- the average number of times of playback stop and the average playback stop time in all average throughput classes in the average throughput-playback stop state table T17 created by the creation function 16-2 of the average throughput-playback stop state table are sequentially input, so that each corresponding QoE is calculated by the after-mentioned QoE estimation function 16 - 5, and the QoE is assigned as a QoE of the corresponding average throughput class in the average throughput-QoE conversion table T18 (step S16 - 42).
- the average throughput-QoE conversion table T18 thus created is output to step S16 - 23 of the local average QoE and QoE calculation function 16 - 2 ( Fig. 21 ).
- the QoE estimation function 16 - 5 in Fig. 24 receives the input service ID, design ID, average number of time of playback stop SC, average playback stop time SL, video duration duration, constants H1, H2, H3, duration_min, duration_max set by the config file F6, coefficient array 6 (g1, g2) and coefficient array 7 (h1, h2) acquired from the coefficient tables 6, and 7 corresponding to the service ID and the design ID, and calculates QoE on the basis of the following equation 9 (step S16 - 51).
- Min (A, B) in the above equation is a function that returns a smaller value among A and B.
- SC is an average number of times of playback stop
- SL is an average playback stop time
- g 1 , g 2 , h 1 , h 2 are constants
- duration is a video duration
- duration_min, duration_max, H 1 ⁇ H 3 are constants defined in the config file.
- the intermediate parameter QoE_C 2 used in the equation 9 is calculated based on the equation 10 below which receives the input service ID, design ID, coding bit rate Bitrate, resolution RS, frame rate FR, and the coefficient array 8 (i1 ⁇ i7) acquired from the coefficient table 8 corresponding to the service ID and the design ID (step S16 - 52).
- Bitrate is a coding bit rate
- RS is a resolution
- FR is a frame rate
- i 1 ⁇ i 7 are constants.
- the equation 9 and the equation 10 are also model equations obtained by experiments and the like as described before.
- QoE QoE_C2
- QoE_C2 is calculated by inputting a coding bit rate, a resolution, and a frame rate
- a QoE is calculated further taking into account the number of times of playback stop and the playback stop time.
- Fig. 25 is a diagram for explaining processing executed by the throughput table information update function 21 of the quality-of-experience optimization apparatus 1.
- update target designation information any one of calendar information, use server, NW name, and base station ID
- update target designation information any one of calendar information, use server, NW name, and base station ID
- the logs of the (calendar information, use server) - speed conversion table T6 including the measured throughput average are updated using the latest logs of the number of (21_log) acquired from the viewing log R stored in the storage unit 24 (Step S212).
- the logs of the (calendar information, NW name) - speed conversion table T5 (or (calendar information, base station ID) - speed conversion table T4) including the measured throughput average are updated using the latest logs of the number of (21_log) acquired from the viewing log R stored in the storage unit 24 (Step S213).
- step S214 With respect to the throughput average average, the throughput average deviation, and the throughput deviation average calculated in step S214, the target rows of the corresponding speed conversion table T4 / T5 / T6 are updated (step S215).
- the throughput table information update function 21 is executed for a combination in which logs, containing the information of the measured throughput average, the number of which is equal to or greater than the number (21_threshold) which is a calculation condition from the previous update, are accumulated in the viewing log R.
- the (calendar information, base station ID)-speed conversion table T4 the (calendar information, NW name) - speed conversion table T5, the (calendar information, use server) - speed conversion table T6 are always updated to the latest state, so that calculation of each function in the estimation value ⁇ recommend value calculation unit 10 can be executed.
- Figs. 26A and 26B are diagrams for explaining processing executed by the viewing log update function 22 of the quality-of-experience optimization apparatus 1.
- Fig 26A shows a procedure of the process and
- Fig.26B shows the viewing log.
- the (day of week, time)- calendar information table T1 is referred to, and calendar information corresponding to the date and time is added, when an IP address is included, the IP address-IP conversion table T2 is referred to, and the carrier name corresponding to the IP address is added, when a carrier name is included, the carrier name-carrier identifier conversion table T3 is referred to, and a carrier identifier corresponding to the carrier name is added (step S 222).
- step S224 when the record having the same combination of the input (date and time, user ID, service ID, design ID) exists in the viewing log R, content of a column input as an option of the combination is updated for the record having the combination of the input (date and time, user ID, service ID, design ID) (step S224).
- a recommend request and various distribution parameters for optimizing the QoE of the content distribution service are input from the recommend request apparatus 40 of the OTT to the quality-of-experience optimization apparatus 1 via the parameter input and output unit 30.
- the throughput estimation function 11 estimates a throughput average average, throughput average deviation and the like on the basis of the input distribution parameter (including coding bit rate, resolution, frame rate) and various setting values (including coefficient arrays) stored in the storage unit 24 according to the distribution parameter and input data from the system administrator.
- the real-time coding parameter recommend function 16 calculates coding parameters (including resolution and frame rate corresponding to each coding bit rate) by which the local average QoE becomes the largest, and outputs the coding parameters as recommendation values to the content distribution system OTT via the parameter input output unit 30.
- the QoE estimation function 13 estimates a QoE on the basis of the input distribution parameter (including coding bit rate, resolution, frame rate) and various setting values (including coefficient arrays) stored in the storage unit 24 according to the distribution parameter and input data from the system administrator. Then, the resolution ⁇ frame rate recommend function 14 calculates a resolution and a frame rate by which estimated QoE becomes the largest, the initial coding parameter recommend function 15 calculates coding parameters (including a resolution and a frame rate for each coding bit rate) by which an average QoE of the whole of content distribution target users becomes the largest, so that these parameters are output to the content distribution system OTT via the parameter input and output unit 30.
- the input distribution parameter including coding bit rate, resolution, frame rate
- various setting values including coefficient arrays
- a distribution parameter such as a distribution rate and the like of the content distribution service can be set according to the coding parameter, obtained as the recommend value, by which the local average QoE or the average QoE of the whole of the content distribution target users becomes the largest. Therefore, it becomes possible to select a content distribution method that maximizes QoE of the user, and quality improvement effect can be expected such as not causing rebuffering with fixed distribution rate.
- various setting values (including various tables Tn, various coefficients (constants)) stored in the storage unit 24 are updated by the setting value update unit 20 based on distribution parameters newly input via the parameter input and output unit 30 and input data from a system administrator.
- the QoE it is possible to estimate the QoE, to calculate a resolution and a frame rate by which the QoE becomes the largest, and to calculate coding parameters by which the whole average QoE becomes the largest, by always updating the setting values to new state.
- the problems presented in (1) to (3) of the "problem to be solved by the invention” can be solved. Specifically, it becomes possible to select a content distribution method that maximizes QoE of the user, and quality improvement effect can be expected such as not causing rebuffering with fixed distribution rate.
- Each of methods of processing by the quality-of-experience optimization system described in each of the above embodiments can be stored in a medium of an external recording device, such as a memory card (ROM card, RAM card, etc.), a magnetic disk (floppy (registered trademark) disk, hard disk etc.), an optical disk (CD-ROM, DVD etc.), and a semiconductor memory, and can be distributed, as a program that can be executed by a computer, in which the methods of processing include each method of the recommend request processing accompanied by output of the distribution parameter from the OTT by the recommend request apparatus 40 of Fig. 1 , the reception processing of the estimation value / recommend value from the quality-of-experience optimization apparatus 1, the processing of the throughput estimation function 11 shown in Fig.
- an external recording device such as a memory card (ROM card, RAM card, etc.), a magnetic disk (floppy (registered trademark) disk, hard disk etc.), an optical disk (CD-ROM, DVD etc.), and a semiconductor memory
- the methods of processing include each method of the recommend request processing
- a computer control device: CPU
- CPU CPU
- a computer reads the program stored in the medium of the external storage device into a storage device, and operation is controlled by the read program, so that the recommend request function, the estimation value ⁇ recommend value calculation function, and the setting value update function described in each embodiment are realized, and processing the same as that of the before-mentioned methods can be realized.
- Data of the program for realizing each of the methods can be transmitted on a NW as a form of program code.
- An electronic device downloads the data of the program from a computer device connected to this NW to store the data of the program in a storage device, so that the before-mentioned recommend request function, the estimation value ⁇ recommend value calculation function, and the setting value update function can be also realized.
- each embodiment includes inventions at various stages, and various inventions can be extracted by appropriately combining a plurality of disclosed constituent components.
- a configuration in which these constituent components are deleted or combined can be extracted as an invention.
Landscapes
- Engineering & Computer Science (AREA)
- Multimedia (AREA)
- Signal Processing (AREA)
- Databases & Information Systems (AREA)
- Computer Networks & Wireless Communication (AREA)
- Theoretical Computer Science (AREA)
- Physics & Mathematics (AREA)
- General Engineering & Computer Science (AREA)
- General Physics & Mathematics (AREA)
- Human Computer Interaction (AREA)
- Two-Way Televisions, Distribution Of Moving Picture Or The Like (AREA)
- Information Transfer Between Computers (AREA)
- Data Exchanges In Wide-Area Networks (AREA)
Abstract
Description
- The present invention relates to a quality-of-service optimization technique for optimizing quality that a user experiences (QoE: Quality of Experience) in content distribution services.
- Conventionally, as to content distribution methods, following three approaches have been adopted especially for video distribution.
- A method is being considered in which, an interface for setting a distribution rate which has an effect on QoE in the user side is prepared, so that the user sets a distribution rate considering the user's communication environment and the like. In many cases, three patterns of qualities of high/medium/low and the like are prepared for distribution rates. Currently, in video distribution services such as YouTube (registered trade mark), there is an interface by which image quality can be selected (refer to non-patent document 1).
- In this method, content distribution of quality of low rate is performed in a time zone in which the number of users of the content distribution service is large, and content distribution of higher quality of medium/high rate is performed in a time zone in which the number of users of a content distribution service is small. Accordingly, even in a congested time, it becomes possible to provide services by a quality that can minimally satisfy service users. Also, it becomes possible to provide a high quality service depending on the number of users and premium payment. Currently, in the nico nico video (registered trade mark), a measure is carried out to lower the distribution rate in a congested time for free members (refer to non-patent document 2).
- In this method, an available band of a user is estimated in some form, so that content is delivered by a bit rate according to the available band. This method is classified to some schemes with respect to the scheme for estimating the available band.
- In the passive type estimation scheme, the available band is estimated from a past communication history and the like.
- In this scheme, estimation is performed by utilizing some tendency on the available band. For example, estimation of the available band is performed by using stationarity of time series (refer to non-patent document 3).
- In the active type estimation scheme, short communication is performed before distribution, so that the available band is estimated based on communication performance at that time. For example, a packet group, called a packet train, that sequentially becomes large is transmitted before communication, and the available band is estimated based on a change amount of delay to arrival (refer to non-patent document 4).
- In the feedback scheme, in the middle of distribution, the speed of the communication itself is measured, so that the distribution rate is changed in real time in accordance with the communication speed at that time. This scheme is mainly applied to video distribution in which the distribution rate can be changed in the middle. In video distribution that incorporates this scheme, content is divided into files of a short time unit called a chunk type, network quality (NW quality) and the like is measured between a server and a client for each chunk, and a distribution rate of a chunk that the terminal receives next is determined based on the measurement result, so that the content is distributed. Accordingly, by storing content in a playback buffer of a user terminal and reproducing the content, high quality content distribution becomes available even in a low rate (refer to non-patent
documents 5, 6) -
- [NON PATENT DOCUMENT 1] "YouTube>help>image quality", [online], YouTube, [December 2, 2014 search], the Internet URL:https://support.google.com/youtube/answer/91449? hl=ja
- [NON PATENT DOCUMENT 2] "niconico >help>what is economy mode", [online], niconico video, [December 2, 2014 search], the Internet < URL:http://faq.nicovideo.jp/EokpControl?&tid=11483&e vent=FE0006>
- [NON PATENT DOCUMENT 3] Rich Wolski, Neil T. Spring, and Jim Hayes. "1999. The network weather service: a distributed resource performance forecasting service for metacomputing." Future Genera. Comput. Syst. 15, 5-6 (October 1999), p.757-768.
- [NON PATENT DOCUMENT 4] Ooshiba et.al. "Short time avalable band estimation echeme for ensuring qulity of real time comunicaiton", IPSJ Journal, 53(2), 698-711, 2012-2.
- [NON PATENT DOCUMENT 5] Hiromoto et.al. "Dynamic coding rate control metrhod suitable for high speed mobile communicaiton network in media streaming", IPSJ Journal, 50(10), p.2532-2542, 2009-10-1.
- [NON PATENT DOCUMENT 6] Sakazawa et.al. "A study on dynamic control of coding rate for tcp video streaming", IEICE Technical Report, IE, image enginiearing, 102(469), p.19-24, 2002-11-15.
- In the conventional existing methods, there are following problems. In the following, a problem is indicated for each scheme.
- In the scheme in which a user selects a distribution rate, there is an advantage that can set a video distribution rate matching user's preferences, however, there are problems in that quality of experience is deteriorated due to rebuffering that occurs by selecting a distribution rate higher than the actual communication environment, and that it is difficult for the user to set a proper distribution rate according to the communication environment when the user performs viewing in an environment, other than the user's home, such as a visiting place.
- In the method in which the content distributor side selects a distribution rate, a distribution rate can be set according to the distribution side equipment amount. However, since rate control depending on a communication environment for each user is not performed, there is a problem in that a (rebuffering) event occurs in which content video distribution is performed with an excessive rate with respect to the communication environment, or an event occurs in which content distribution is performed with a too small rate.
- Since the passive type estimation scheme requires sufficient past communication histories of end-to-end, it was difficult to prepare sufficient data so far.
- In the active type estimation scheme, there is a problem in that content distribution takes much time since the time for measuring the available band before communication is additionally required. The waiting time to communication start largely affects quality of experience in web based applications.
- In the distribution scheme, occurrence frequency of rebuffering which accompanies playback stop becomes low. However, since the distribution rate (resolution) fluctuates during video viewing, it is confirmed by subject evaluation that the viewer's QoE is not high. Also, since the distribution rate is set for the purpose of reducing rebuffering, the distribution rate is excessively lowered, causing QoE to be lower than when rebuffering occurs.
- The present invention is conceived in view of such problems, and an object of the present invention is to provide a technique to make it possible to store information related to NW quality / QoE for each content distribution, estimate a distribution method for optimizing QoE based on the information, and perform recommendation.
- A quality-of-experience optimization system of the disclosed technique is a quality-of-experience optimization system configured to optimize quality (QoE: Quality of Experience) that a user experiences in a content distribution service, including:
- a recommend request apparatus configured to output a distribution parameter candidate of content distribution for optimizing QoE of content distribution, and to receive a distribution parameter for optimizing the QoE as a recommend value; and
- a quality-of-experience optimization apparatus configured to estimate QoE from the distribution parameter candidate received from the recommend request apparatus, and to calculate a distribution parameter for optimizing the QoE as a recommend value to output the recommend value.
- A quality-of-experience optimization apparatus of the disclosed technique is a quality-of-experience optimization apparatus configured to optimize quality (QoE: Quality of Experience) that a user experiences in a content distribution service, including:
- a parameter input output unit configured to input a distribution parameter candidate for content distribution, and to output a recommend value for optimizing QoE; and
- an estimation value·recommend value calculation unit configured to estimate QoE based on the distribution parameter candidate input by the parameter input output unit, and to calculate a distribution parameter for optimizing the QoE as the recommend value.
- A recommend request apparatus of the disclosed technique is a recommend request apparatus for optimizing QoE in a content distribution service, including:
- a distribution parameter output unit configured to output a distribution parameter candidate for content distribution, to a quality-of-experience optimization apparatus, in order to request a distribution parameter for optimizing QoE as a recommend value; and
- a recommend value reception unit configured to receive the recommend value from the quality-of-experience optimization apparatus.
- According to the disclosed technique, there is provided a technique to make it possible to estimate a distribution method for optimizing QoE based on information related to NW quality / QoE for each content distribution, and perform recommendation.
-
-
Fig. 1 is a diagram showing system outline of a quality-of-experience optimization system according to an embodiment of the present invention; -
Fig. 2 is a diagram showing a functional configuration of the quality-of-experience optimization apparatus 1 in the quality-of-experience optimization system; -
Fig. 3 is a diagram for explaining outline of main functions of the quality-of-experience optimization apparatus 1 in the quality-of-experience optimization system; -
Fig. 4 is a diagram showing a process flow of the quality-of-experience optimization apparatus 1; -
Fig. 5A is a diagram for explaining an example of definition of input / output data in the OTT interface of the quality-of-experience optimization apparatus 1; -
Fig. 5B is a diagram for explaining an example of definition of input / output data in the OTT interface of the quality-of-experience optimization apparatus 1; -
Fig. 5C is a diagram for explaining an example of definition of input / output data in the OTT interface of the quality-of-experience optimization apparatus 1; -
Fig. 5D is a a diagram for explaining an example of definition of input / output data in the OTT interface of the quality-of-experience optimization apparatus 1; -
Fig. 5E is a a diagram for explaining an example of definition of input / output data in the OTT interface of the quality-of-experience optimization apparatus 1; -
Fig. 6A is a diagram for explaining an example of definition of other data used in each function of the quality-of-experience optimization apparatus 1; -
Fig. 6B is a diagram for explaining an example of definition of other data used in each function of the quality-of-experience optimization apparatus 1; -
Fig. 7A is a diagram showing an example of a list of tables and parameters stored in the storage unit 24 to be referred / updated in each function of the quality-of-experience optimization apparatus 1; -
Fig. 7B is a diagram showing an example of a list of tables and parameters stored in the storage unit 24 to be referred / updated in each function of the quality-of-experience optimization apparatus 1; -
Fig. 7C is a diagram showing an example of a list of tables and parameters stored in the storage unit 24 to be referred / updated in each function of the quality-of-experience optimization apparatus 1; -
Fig. 7D is a diagram showing an example of a list of tables and parameters stored in the storage unit 24 to be referred / updated in each function of the quality-of-experience optimization apparatus 1; -
Fig. 7E is a diagram showing an example of a list of tables and parameters stored in the storage unit 24 to be referred / updated in each function of the quality-of-experience optimization apparatus 1; -
Fig. 8A is a diagram for explaining processing executed by thethroughput estimation function 11 of the quality-of-experience optimization apparatus 1; -
Fig. 8B is a diagram for explaining processing executed by thethroughput estimation function 11 of the quality-of-experience optimization apparatus 1; -
Fig. 9 is a diagram for explaining processing executed by the playback stopstate estimation function 12 of the quality-of-experience optimization apparatus 1; -
Fig. 10 is a diagram for explaining processing executed by theQoE estimation function 13 of the quality-of-experience optimization apparatus 1; -
Fig. 11 is a diagram for explaining processing executed by the resolution · frame rate recommendfunction 14 of the quality-of-experience optimization apparatus 1; -
Fig. 12 is a diagram for explaining processing executed by the initial coding parameter recommendfunction 15 of the quality-of-experience optimization apparatus 1; -
Fig. 13 is a diagram for explaining processing executed by the function 15 - 1, that is a function included in the initial coding parameter recommend function 15 (Fig. 12 ), and that outputs the whole QoE and the coding parameter table T12 from a coding bit rate array and average throughput distribution; -
Fig. 14 is a diagram for explaining processing executed by the function 15 - 2, that is a function included in the initial coding parameter recommend function 15 (Fig. 12 ), outputting an average throughput distribution table T11; -
Fig. 15 is a diagram for explaining processing executed by the function 15 - 3, that is a function included in the function 15 - 1 (Fig. 13 ) for outputting the whole QoE and the coding parameter table T12 from the coding bit rate array and the average throughput distribution of the initial coding parameter recommendfunction 15, and that converts the coding parameter table T12 to the average throughput-QoE table T13; -
Fig. 16A is a diagram for explaining the QoE calculation function 15 - 4, in the conversion function 15 - 3 for converting the coding parameter table T12 to the average throughput-QoE table T13, when the average throughput not exceeding the upper limit value of the average throughput class does not exist in the Tmp table T 14 (T <T_min); -
Fig. 16B is a diagram for explaining the QoE calculation function 15 - 4, in the conversion function 15 - 3 for converting the coding parameter table T12 to the average throughput-QoE table T13, when the average throughput not exceeding the upper limit value of the average throughput class does not exist in the Tmp table T 14 (T <T_min); -
Fig. 17A is a diagram for explaining the QoE calculation function 15 - 5, in the conversion function 15 - 3 converting from the coding parameter table T12 to the average throughput-QoE table T13, when the average throughput of the Tmp table T14 exists in the range of the average throughput class; -
Fig. 17B is a diagram for explaining the QoE calculation function 15 - 5, in the conversion function 15 - 3 converting from the coding parameter table T12 to the average throughput-QoE table T13, when the average throughput of the Tmp table T14 exists in the range of the average throughput class; -
Fig. 18A is a diagram for explaining the QoE calculation function 15 - 5 when the average throughput of the Tmp table T14 exists in the range of the average throughput class, in the conversion function 15 - 3 converting the codingparameter table T 12 to the average throughput-QoE table T13; -
Fig. 18B is a diagram for explaining the QoE calculation function 15 - 5 when the average throughput of the Tmp table T14 exists in the range of the average throughput class, in the conversion function 15 - 3 converting the codingparameter table T 12 to the average throughput-QoE table T13; -
Fig. 19 is a diagram for explaining processing executed by the real-time coding parameter recommendfunction 16 of the quality-of-experience optimization apparatus 1; -
Fig. 20 is a diagram for explaining processing executed by the function 16 - 1 that is a function included in 16 (Fig. 19 ), and that generates an average throughput probability density table; -
Fig. 21 is a diagram for explaining processing executed by the function 16 - 2 that is a function included in the real-time coding parameter recommend function 16 (Fig. 19 ) and that calculates local average QoE and QoE; -
Fig. 22 is a diagram for explaining processing executed by the function 16 - 3 that is a function included in the function 16 - 2 (Fig. 21 ) for calculating the local average QoE and QoE of the real-time coding parameter recommendfunction 16, and that creates the average throughput-playback stop state table T17; -
Fig. 23 is a diagram for explaining processing executed by the function 16 - 3 that is a function included in the function 16 - 2 (Fig. 21 ) for calculating the local average QoE and QoE of the real-time coding parameter recommendfunction 16, and that creates the average throughput-QoE table; -
Fig. 24 is a diagram for explaining processing executed by the QoE estimation function 16 - 5 that is a function included in a function 16 - 4 (Fig. 23 ) for creating the average throughput-QoE table T 18 of the real-time coding parameter recommendfunction 16; -
Fig. 25 is a diagram for explaining processing executed by the throughput tableinformation update function 21 of the quality-of-experience optimization apparatus 1; -
Fig. 26A is a diagram for explaining processing executed by the viewinglog update function 22 of the quality-of-experience optimization apparatus 1; -
Fig. 26B is a diagram for explaining processing executed by the viewinglog update function 22 of the quality-of-experience optimization apparatus 1. - In the following, an embodiment of the present invention is described with reference to figures.
-
Fig. 1 is a diagram showing system outline of a quality-of-experience optimization system according to an embodiment of the present invention. - The quality-of-experience optimization system is formed by two apparatuses which are a "recommend
request apparatus 40" configured to request a parameter for performing optimum distribution and a "quality-of-experience optimization apparatus 1" configured to estimate QoE from various distribution parameters and to recommend an optimum parameter, in a video distribution system (to be referred to as OTT(Over-The-Top) hereinafter) of a content distributor. - The
recommend request apparatus 40 includes aparameter output unit 41 configured to output, to the quality-of-experience optimization apparatus 1, a distribution parameter candidate for content distribution in order to request a distribution parameter, as a recommend value, for optimizing QoE, and a recommendvalue reception unit 42 configured to receive the recommend value from the quality-of-experience optimization apparatus 1. - The quality-of-
experience optimization apparatus 1 includes two functions which are a "estimation/recommend function (estimation value · recommend value calculation unit 10)" and a "data storage function (setting value update unit 20)", and provides the following services to the OTT via an IP network. - (1) Visualization of NW quality/QoE for each content distribution
- (2) Recommendation of a distribution method to optimize QoE. There are two types of recommendations which are recommendation performed for each content distribution and recommendation performed at design time (periodically).
- (3) Storing of information related to NW quality/QoE.
- Each of the
recommend request apparatus 40 and the quality-of-experience optimization apparatus 1 is provided with a CPU which is a computer, a storage device, an input/output device, and a communication device, so that the CPU controls operation of each device according to the program stored in the storage device to execute various types of functions. Also, as to each of therecommend request apparatus 40 and the quality-of-experience optimization apparatus 1, each unit (each function) may be a hardware circuit (integrated circuit and the like). - As a concrete example of operation of the quality-of-experience optimization system, there is the following operation as an example.
- When a user watches a video, a request of the video is transmitted to a video distribution system. At that time, the user transmits user attribute information (example: use place, network use form and terminal information) via an application or a browser.
- The video distribution system that received a viewing request of the video transmits, to the quality-of-
experience optimization apparatus 1, a coding condition (which includes a distribution rate, a resolution, a frame rate and the like, wherein these may be referred to as distribution parameter candidates) for each of a plurality of image qualities prepared in the video distribution system with respect to the user attribute information and the corresponding video, to inquire about an optimum coding condition. - With respect to the received request, the quality-of-
experience optimization apparatus 1 calculates a coding condition by which QoE becomes the largest by using a technique described in detail in the following, and returns the coding condition to the video distribution system as a response. - The video distribution system performs video distribution to the user using the received condition. After viewing the video, the user enters viewing log information (throughput information, network information and the like) as an actual result into the quality-of-experience optimization system.
- Accordingly, the newest network quality information continues to be updated, so that highly accurate estimation can be performed.
-
Fig. 2 is a diagram showing a functional configuration of the quality-of-experience optimization apparatus 1 in the quality-of-experience optimization system. - The quality-of-
experience optimization apparatus 1 is formed by three of the estimation value·recommendvalue calculation unit 10, the settingvalue update unit 20, and the parameter input andoutput unit 30. - The estimation value·recommend
value calculation unit 10 calculates and outputs various kinds of estimation values and recommend values for optimizing QoE based on data from the OTT input via therecommend request apparatus 40 and the IP network, and the viewing log, throughput table, various constant values and the like stored in the storage unit 24 of the settingvalue update unit 20. The settingvalue update unit 20 performs information update of the viewing log and the throughput table based on data from the OTT. Also, the settingvalue update unit 20 updates the setting value of the quality-of-experience optimization apparatus 1 based on input data from a system administrator of the OTT and the quality-of-experience optimization apparatus 1. The parameter input andoutput unit 30 receives a recommend request from therecommend request apparatus 40 via the IP network and the like, receives a distribution parameter, and transmits a recommend value calculated by the estimation value·recommendvalue calculation unit 10. - The estimation value·recommend
value calculation unit 10 is formed by six functional blocks which are athroughput estimation function 11, a playback stopstate estimation function 12, aQoE estimation function 13, a resolution·frame rate recommendfunction 14, an initial coding parameter recommendfunction 15 and a real-time coding parameter recommendfunction 16. - The setting
value update unit 20 is formed by three blocks which are a throughput tableinformation update function 21, a viewinglog update function 22, and a settingvalue reference function 23, and by a storage unit 24. - The parameter input and
output unit 30 receives and transmits data of an IP packet via an OTT interface with the OTT via the IP network. - The setting
value reference function 23 of the settingvalue update unit 20 inputs a command or data via an administrator interface (CUI; Character User Interface) between the settingvalue reference function 23 and the input andoutput apparatus 25 of the system administrator of the quality-of-experience optimization apparatus 1, and outputs data. -
Fig. 3 is a diagram for explaining an outline of main functions in the quality-of-experience optimization apparatus 1. -
Fig. 4 is a diagram showing a process flow of the quality-of-experience optimization apparatus 1. -
Fig. 5A is a diagram for explaining an example of the definition of input/output data in the OTT interface of the quality-of-experience optimization apparatus 1. -
Fig. 5B is a diagram for explaining definition of input/output data in the OTT interface of the quality-of-experience optimization apparatus 1. -
Fig. 5C is a diagram for explaining definition of input/output data in the OTT interface of the quality-of-experience optimization apparatus 1. -
Fig. 5D is a diagram for explaining definition of input/output data in the OTT interface of the quality-of-experience optimization apparatus 1. -
Fig. 5E is a diagram for explaining definition of input/output data in the OTT interface of the quality-of-experience optimization apparatus 1. - In the definitions of the input/output data in
Figs. 5A to 5E , with respect to each of the input/output data "service ID"... "Average playback stop time", "number of times of playback stop" ... "distribution server group", [data name],[data format], [sample value], [lower limit value,] [upper limit value], [data summary], [related function] are defined. In the [related function], to which function and from which function the corresponding input/output data is input and output between the OTT and the quality-of-experience optimization apparatus 1 is indicated, as for input data, as "Imn" which is a combination of "I" indicating input and a code mn of a function of an input destination, and as for output data, as "Omn" which is a combination of "O" indicating output and a code mn of a function of an output source. - For example, input data "service ID" from the OTT indicates that it is an ID assigned for each distribution service by the OTT, and is input to each
function 11∼16 of the estimation value· recommendvalue calculation unit 10 and the viewinglog update function 22 of the setting value update unit 20 (I11∼I16,I22). Also, "throughput average average" indicates an average value [kbps] of a measured throughput average that is calculated by thethroughput estimation function 11 of the estimation value·recommendvalue calculation unit 10 and is output to the parameter input and output unit 30 (o11). - For the above [data format], "BOOL" is "0" or "1", "
SI 32" is a signed 32 bit integer, "UI 32" is an unsigned 32 bit integer, "FLOAT" is a floating point (32 bit), "XXX[N]" is an array of data format of XXX of array size N, "STRING" is a character string. - Also, as to the above [upper limit value] and [lower limit value], if a value exceeds upper and lower limit values of parameters, it is treated as an error, and for "-", the upper limit value and the lower limit value are not set. "CONF" indicates that the upper limit value and lower limit value are set from a config file.
- Also, "( )" is an optional parameter. Also, [playback start threshold]>=[playback stop threshold], and [playback restart threshold]> [playback stop threshold] hold true.
-
Figs. 6A and6B are diagrams for explaining definitions of other data used in each function of the quality-of-experience optimization apparatus 1. - In the definitions of other data in
Figs. 6A and6B , [data name], [data format], and [data summary] are defined for each piece of data "calendar information" ... "number of views". -
Fig. 7A is a diagram showing an example of a list of tables and parameters stored in the storage unit 24 to be referred/updated in each function of the quality-of-experience optimization apparatus 1. -
Fig. 7B is a diagram showing an example of a list of tables and parameters stored in the storage unit 24 to be referred/updated in each function of the quality-of-experience optimization apparatus 1. -
Fig. 7C is a diagram showing an example of a list of tables and parameters stored in the storage unit 24 to be referred/updated in each function of the quality-of-experience optimization apparatus 1. -
Fig. 7D is a diagram showing an example of a list of tables and parameters stored in the storage unit 24 to be referred/updated in each function of the quality-of-experience optimization apparatus 1. -
Fig. 7E is a diagram showing an example of a list of tables and parameters stored in the storage unit 24 to be referred/updated in each function of the quality-of-experience optimization apparatus 1. - Regarding the list of tables and parameters in
Figs. 7A to 7E , the column of [function] shows codes of functions for referring to/updating corresponding tables and parameters by associating the codes and the tables and parameters. - For example, the "(day of week, time) - calendar information conversion table T1" in
Fig. 7A is referred to by thethroughput estimation function 11 of the estimation value·recommendvalue calculation unit 10. Also, the "resolution table T8" inFig. 7C is referred to by the resolution· frame rate recommendfunction 14 of the estimation value·recommendvalue calculation unit 10. Also, the "Viewing log R" inFig. 7E is updated by the viewinglog update function 22 of the settingvalue update unit 20. - Here, in each of the
functions 11 to 16 in the estimation value·recommendvalue calculation unit 10 of the quality-of-experience optimization apparatus 1 having the above configuration and each of thefunctions value update unit 20, an outline of processing executed based on various data, tables, and parameters shown inFig 5A ∼ Fig. 7E is described. - The
throughput estimation function 11 is a function for calculating information related to a throughput from input information of the OTT. - For each content distribution request of a user of a content distribution service, the
throughput estimation function 11 inputs various pieces of input data (service ID, design ID, date and time, the following parameters are optional (use server, distribution server group, user ID, fixed/mobile identifier, server speed control, [IP address or carrier name], [cell ID or coordinate], wi-fi use determination)) via the OTT interface (Fig. 2 ) of the parameter input andoutput unit 30 from the OTT through the IP network, and calculates and outputs information on throughput [throughput average average, throughput average deviation, throughput deviation average, user actual result average average, user actual result average deviation, user actual result deviation average]. - Details of processing by the
throughput estimation function 11 are described with reference to after-mentionedFigs. 8A and8B . - The playback stop
state estimation function 12 is a function for calculating information related to playback stop from input information of the OTT and information related to the throughput. - For each content distribution request of a user of a content distribution service, the playback stop
state estimation function 12 receives various pieces of input data (service ID, design ID, coding bit rate, average throughput, throughput deviation, video duration, following parameters are optional (playback start threshold, playback restart threshold, playback stop threshold)) via the OTT interface (Fig. 2 ) of the parameter input andoutput unit 30 through the IP network from the OTT, and calculates and outputs an average number of times of playback stop and average playback stop time by using coefficients (coefficient tables 4 and 5) stored in the storage unit 24 for the internal system beforehand. - Details of processing by the playback stop
state estimation function 12 are described with reference to after-mentionedFig. 9 , andequations - The
QoE estimation function 13 is a function for calculating QoE from information related to coding. - For each content distribution request of a user of a content distribution service, the
QoE estimation function 13 receives various pieces of input data (service ID, design ID, coding bit rate, resolution, frame rate, following parameters are optional (number of times of playback stop, array of playback stop time length)) via the OTT interface (Fig. 2 ) of the parameter input andoutput unit 30 through the IP network from the OTT, and calculates and outputs QoE. - Details of processing by the
QoE estimation function 13 are described with reference to after-mentionedFig. 10 , andequations - The resolution·frame rate recommend
function 14 is a function for calculating a resolution and a frame rate by which QoE becomes the largest from the coding bit rate. - The resolution·frame rate recommend
function 14 is executed each time when designing/redesigning (encoding etc.) of the content distribution service is performed, and the resolution·frame rate recommendfunction 14 receives various pieces of input data (service ID, design ID, coding bit rate, following parameters are optional (number of times of playback stop, array of playback stop time length, resolution array, frame rate array)) via the OTT interface (Fig. 2 ) of the parameter input andoutput unit 30 through the IP network from the OTT, and calculates and outputs a resolution, a frame rate and QoE. - Details of processing by the resolution· frame rate recommend
function 14 are described with reference to after-mentionedFig. 11 . - The initial coding parameter recommend
function 15 is a function for calculating a coding parameter by which average QoE of the whole users (whole average QoE) becomes the largest. - The initial coding parameter recommend
function 15 is executed each time when designing/redesigning (encoding etc.) of a content distribution service is performed, and the initial coding parameter recommendfunction 15 receives various pieces of input data (service ID, design ID, number of encodes, following parameter is optional (coding bit rate array)) via the OTT interface (Fig. 2 ) of the parameter input andoutput unit 30 through the IP network from the OTT, and calculates and outputs a whole average QoE and a coding parameter table T12. - Details of processing by the initial coding parameter recommend
function 15 are described with reference to after-mentionedFigs. 12∼18 , and theequation 4. - The real-time coding parameter recommend
function 16 is a function for calculating information related to coding parameters from input information of the OTT. - For each content distribution request of a user of a content distribution service, the real-time coding parameter recommend
function 16 receives various pieces of input data (service ID, design ID, date and time, following parameters are optional (use server, distribution server group, user ID, fixed/mobile identifier, server speed control, [IP address or carrier name], [cell ID or coordinate], wi-fi use determination, OTT coding parameter table, video duration, playback start threshold, playback restart threshold, playback stop threshold)) via the OTT interface (Fig. 2 ) of the parameter input andoutput unit 30 through the IP network from the OTT, and calculates a resolution, a frame Rate, a coding bit rate, and a QoE, a local average QoE, and outputs inputs and outputs as a log. Note that the local average QoE corresponds to an average QoE of all users in the same network environment as the user who is the target of recommendation. - Details of processing by the real-time coding parameter recommend
function 16 are described with reference to after-mentionedFigs. 19∼24 , andequations 7∼10. - The throughput table
information update function 21 is a function for updating throughput tables ("(calendar information, base station ID) - speed conversion table T4", "(calendar information, NW name) - speed conversion table T5" or "(calendar information, use server) - speed conversion table T6"). - The update cycle is based on the time of system operation, and, for example, by being automatically launched about once in 1 ∼ 5 minutes, the throughput table
information update function 21 updates the update target table based on update target designation information (calendar information, use server, NW name) of input information from the OTT. - Details of processing by the throughput table
information update function 21 are described with reference to after-mentionedFig. 25 . - The viewing
log update function 22 is a function for newly creating/updating a viewing log R. - When there is input data (user ID, fixed/mobile identifier, date and time, use server, distribution server group, IP address, carrier name, cell ID, coordinates, measured throughput average, measured throughput deviation, service ID, design ID, number of times of video stop, video file ID, use browser, use OS, wi-fi use judgment, file size, video bit rate, carrier identifier, NW name, option tags 1 ∼ 10) as input information of the OTT, the viewing
log update function 22 performs new addition or update to the viewing log R stored in the storage unit 24. - Details of processing by the viewing
log update function 22 are described with reference to after-mentionedFig. 26 . - The setting
value reference function 23 is a function for referring to and updating setting values (Fig. 7A ∼ Fig. 7E ) of the tables/parameters/coefficients (constants) and the like stored in the storage unit 24. Based on input data from the OTT and command data from a system administrator of the quality-of-experience optimization apparatus 1, the settingvalue reference function 23 updates the setting values used in each function of the quality-of-experience optimization apparatus 1. - In the quality-of-
experience optimization apparatus 1 configured as described above, the CPU controls operation of each unit according to commands described in a program which governs each function stored in the storage device, and software and hardware operate by cooperating with each other, so that thethroughput estimation function 11, the playback stopstate estimation function 12, theQoE estimation function 13, the resolution·frame rate recommendfunction 14, the initial coding parameter recommendfunction 15, the real-time coding parameter recommendfunction 16, the throughput tableinformation update function 21, the viewinglog update function 22, and the settingvalue reference function 23, as described in the after-mentioned operation description, are realized. Also, as described before, each of thethroughput estimation function 11, the playback stopstate estimation function 12, theQoE estimation function 13, the resolution·frame rate recommendfunction 14, the initial coding parameter recommendfunction 15, the real-time coding parameter recommendfunction 16, the throughput tableinformation update function 21, the viewinglog update function 22, and the settingvalue reference function 23 can be realized as a hardware circuit incorporating the processing. - Next, detailed operation of processing executed in each function of the quality-of-
experience optimization apparatus 1 having the above configuration is described. - The technique used by the
throughput estimation function 11 in the present embodiment is a technique for estimating a current throughput from past viewing logs (throughput actual result values) of a user's network environment. - Because communication traffic depends on user's behavior, it shows steady variation with respect to day of week and time. Therefore, the same degree of congestion is obtained on the same network in the same time zone of the same weekday/holiday, and the throughput becomes the same degree. Therefore, in the present technology, use network information and time zone information are input, so that an average/deviation of throughputs is calculated by referring to a viewing log database of a use base station/ISP. Detailed processing is described below.
-
Fig. 8A andFig. 8B are diagrams for explaining processing executed by thethroughput estimation function 11 of the quality-of-experience optimization apparatus 1.Fig. 8A mainly shows a procedure of processing, andFig. 8B shows an example of tables used in the procedure. - For each content distribution request of a user of a content distribution service, when various pieces of input data are input from the content distribution server of the OTT via the parameter input and
output unit 30, first, a day-of-week label is acquired from the input year/month/day and time, and conversion to calendar information according to the corresponding day-of-week label and time is performed in accordance with the (day of week, time) - calendar information conversion table T1 (step S11). - As for the selection of the day-of-week label from the year/month/day, the
throughput estimation function 11 can select the day-of-week label that matches the year/month/day by matching with calendar information and the like. As for the selection of the day-of-week label from the year/month/day, when the year/month/day is a holiday, a label indicating a holiday is selected, and in other cases, a label indicating a day of week (Sunday to Saturday) is selected. - Also, there are following pieces of input data as data common to mobile and fixed: service ID, design ID, date and time (year/month/day, time), optional parameters (use server, distribution server group, user ID, fixed/mobile identifier, server speed control).
- As input data of fixed only, there is an IP address (or carrier name). As for input data of mobile only, there are wi-fi use determination data, and carrier name and cell ID (or coordinates or both) as data when wi-fi use determination is false, and IP address as data when wi-fi use determination is true. It is acceptable even if unnecessary information is included in the input data because it is input to the viewing
log update function 22. - Next, on the basis of the input data, it is determined whether the user's terminal is a fixed terminal or a wi-fi use terminal or a mobile terminal (mobile) not using wi-fi (step S112).
- When it is determined that the user's terminal is a fixed terminal or a wi-fi use terminal, the IP address of the user terminal is converted into a NW name according to the IP address-ISP conversion table T2 (step S113a).
- When it is determined that the user's terminal is a mobile terminal not using wi-fi, the carrier name corresponding to the user terminal is converted into a carrier identifier according to the carrier name-carrier identifier conversion table T3, and a cell ID is given (step S113b).
- Here, the content of the viewing log R corresponding to the input data stored in the storage unit 24 is updated by the viewing
log update function 22 of the setting value update unit 20 (step S114). - Then, a NW speed (throughput average average/ average deviation / deviation average) is acquired according to the (calendar information, base station ID) - speed conversion table T4 or the (calendar information, NW name) - speed conversion table T 5 (step S115).
- Here, it is determined whether or not a use server has been input as input data (step S116).
- When the use server has been input, it is determined whether or not server speed control information has been input as input data, and when the server speed control information has been input, the value of the server speed control information is set as a throughput average average of the server and the throughput average deviation and deviation average are set to "0". When the server speed control information has not been input, the throughput average average, the throughput average deviation, and the throughput deviation average of the use server are set according to the (calendar information, use server) - speed conversion table T6 (step S117).
- The throughput average average of the NW acquired in step S115 and the throughput average average of the use server obtained in step S117 are compared, so that the smaller one of the throughput average averages, and the throughput average deviation and the throughput deviation average corresponding to the smaller one are made to be output targets (step S118).
- When the use server has not been input, the throughput average average, the throughput average deviation and the throughput deviation average of the NW obtained in step S115 are made to be output targets (step S119).
- Then, in the next process step S120, throughput average average / throughput average deviation / throughput deviation average of the user actual result are calculated.
- In the case where the user terminal is a fixed terminal or a wi-fi use terminal, in the viewing log R stored in the storage unit 24, when there are logs, the number of which is equal to or greater than the calculation number of past logs (11_limit), whose elapsed time is within the past log search period (11_time), having measured throughput average and measured throughput deviation, and having the same (user ID, distribution server group, NW name, calendar information), throughput calculation is performed for the latest calculation number (11_limit) of the user's viewing logs.
- In this throughput calculation, an average value of the measured throughput averages is calculated as a user actual result average average, a deviation of the measured throughput averages is calculated as a user actual result average deviation, and an average value of the measured throughput deviations is calculated as a user actual result deviation average.
- In the case where the user terminal is a mobile terminal not using wi-fi and there are coordinates as the input data, in the viewing log R stored in the storage unit 24, when there are logs, the number of which is equal to or greater than the calculation number of past logs (11_limit), whose elapsed time is within the past log search period (11_time), having measured throughput average and measured throughput deviation, and having the same (user ID, carrier identifier, calendar information, distance within search distance (11_dist) of past log), throughput calculation similar to the before-mentioned one is performed for the latest calculation number (11_limit) of the user's viewing logs.
- In the case where the user terminal is a mobile terminal (mobile) not using wi-fi and there are not coordinates as the input data, in the viewing log R stored in the storage unit 24, when there are logs, the number of which is equal to or greater than the calculation number of past logs (11_limit), whose elapsed time is within the past log search period (11_time), having measured throughput average and measured throughput deviation, and having the same (user ID, distribution server group, cell ID information (base station ID), calendar information), throughput calculation similar to the before-mentioned one is performed for the latest calculation number (11_limit) of the user's viewing logs.
- The value obtained by the above calculation is set as the user actual result. However, according to the calculation flag of the user actual result (11_use_user_result), depending on a calculation target user, this process (S120) is skipped so that throughput average average / average deviation / deviation average of the user actual result is not output.
- In this manner, the throughput average average, the throughput average deviation, the throughput deviation average estimated by step S118 or S119 and made to be as output targets, and the user actual result average average, the user actual result average deviation, and the user actual result deviation average calculated in S120 are output to the OTT.
- In the
throughput estimation function 11, when there is not a part of input information, the following actions are taken. - Date and time: return error code.
- User ID: proceed regarding that the viewing log search function to be No.
- Fixed / mobile identifier: treated as fixed.
- There is no IP address even though fixed: return error code.
- There is no wi-fi use determination even though mobile: return an error code.
- Although wi-fi use determination is true in mobile, there is no IP address: return error code.
- Although wi-fi use determination is false in mobile, there is no carrier name: return error code.
- Although wi-fi use determination is false in mobile, there is neither coordinate nor cell ID: return error code.
- When all of essential input parameters (date / time, user ID, service ID, design ID) of the viewing
log update function 22 are present, the viewinglog update function 22 is executed even when other information is insufficient. - Further, in the
throughput estimation function 11, when the calculation result does not satisfy a reference value, the following actions are taken. - When any value cannot be acquired during mobile speed calculation: return error code.
- When user actual result average deviation cannot be acquired: not add user actual result average average, user actual result average deviation, user actual result deviation average.
- Further, in the
throughput estimation function 11, when there is no entry in tables, the following actions are taken. - (day of week, time) - calendar information conversion table T1: return error code.
- IP address - ISP conversion table T2 and carrier name - carrier identifier conversion table T3: return error code, and notify the administrator of the value not found by searching.
- (calendar information, NW name) - speed conversion table T5: return error code.
- (calendar information, use server) - speed conversion table T6: return error code.
- (Playback stop state estimation function 12)
- The playback stop state estimation technique in the playback stop
state estimation function 12 of the present embodiment is a technique to estimate the number of times of playback stop / playback stop time from a throughput average / deviation, a coding bit rate, a video length (duration), a playback start threshold / playback stop threshold / playback restart threshold that are output values of a throughput estimation technique. Regarding the mechanism of playback stop, for example, in progressive download type video distribution, a terminal has a buffer for accumulating received data, and operations of playback start, stop, and restart are determined according to the remaining amount of the buffer. For example, when the buffer amount decreases to the playback stop threshold value, playback stops, and when the buffer amount reaches the playback restart threshold value in the stop state, playback is restarted. In the present technique, by executing simulation and the like, a model equation for estimating a playback stop state is constructed, and playback stop state estimation is performed using the model equation. - In the model equation shown below as equations, a throughput average/deviation, a coding bit rate, a video length (duration), a playback start threshold / a playback stop threshold / a playback restart threshold are input, so that the number of times of playback stop and the playback stop time are obtained. Note that each equation used in the present embodiment is an example, and other equations may be used.
-
Fig. 9 is a diagram for explaining processing executed by the playback stopstate estimation function 12 of the quality-of-experience optimization apparatus 1. - For each content distribution request of a user of a content distribution service, when various pieces of data (service ID, design ID, coding bit rate, average throughput, throughput deviation, video duration, following parameters are optional (playback start threshold, playback restart threshold, playback stop threshold, coefficients e1∼e8, coefficients f1∼f6, DR_norm (normalized video duration), BR_norm (normalized bit rate), estimate_unit, IT_dr, RT_dr, ST_dr)) are input via the parameter input and
output unit 30 from the content distribution server of the OTT, an average number of times of playback stop SC and an average playback stop time SL are estimated according to thefollowing equation 5,equation 6, andequation 5·6, and they are output to the OTT (step S121).
EQUATION 5


EQUATION 6


- In the above equations, SC is the average number of times of playback stop, SL is the average playback stop time, T is an average throughput, T_std is a throughput deviation, BR is a coding bit rate, DR is a video duration, and IT is a playback start threshold. Also, RT is a playback restart threshold, ST is a playback stop threshold, e1∼e8 are constants, f1∼f6 are constants, DR_norm is a normalized video duration, BR_norm is a normalized bit rate, and EU is an estimation unit.
- When the playback start / restart / stop threshold are not input in step S121, the playback start threshold IT, the playback restart threshold RT, and the playback stop threshold ST are obtained from the playback threshold table T7 based on the service ID and the design ID.
- When coefficients e1∼e8 and coefficients f1∼f6 are not input, coefficients e1∼e8 of the
equation 5 are acquired from the coefficient table 4 based on the service ID and the design ID, and coefficients f1∼f6 of theequation 6 are obtained from the coefficient table 5. - Also, when DR_norm, BR_norm, estimate_unit, IT_dr, RT_dr, and ST_dr are not input, the DR_norm, BR_norm, estimate_unit, IT_dr, RT_dr, ST_dr are acquired from the config file F1.
- Then, from the input information, using the
formula 5, the average number of times of playback stop SC is estimated, and from the input information, the average playback stop time SL is estimated using theequation 6. - When the output value of the above equation is an exception value, it is treated as an error.
- The QoE estimation technique of the present embodiment is a technique for estimating QoE from a coding bit rate, a resolution, and a frame rate. In the present technique, for example, a relationship between QoE and various coding bit rates / resolutions / frame rates is obtained by subjective evaluation experiment and the like, and the relationship is expressed as a model equation. As a concrete example is shown by the following equations (model equation), QoE can be calculated by inputting a coding bit rate, a resolution, and a frame rate to the model equation. Also, as shown in the
equation 2 and the like, QoE can be calculated also in consideration of the number of times of playback stop and the playback stop time length. Note that each equation used in the present embodiment is an example, and other equations may be used. -
Fig. 10 is a diagram for explaining processing executed by theQoE estimation function 13 of the quality-of-experience optimization apparatus 1. - For each content distribution request of a user of a content distribution service, when various pieces of input data (service ID, design ID, coding bit rate, resolution, frame Rate, following parameters are optional (number of times of playback stop, array of playback stop time length)) are input via the parameter input and
output unit 30 from the content distribution server of the OTT, first, thecoefficient array 1 is acquired from the coefficient table 1 based on the service ID and the design ID, and QoE_C (intermediate parameter) is calculated according to the following equation 1 (coding quality estimation) (step S131).
EQUATION 1


- In the above equation, bitrate is an coding bit rate, RS is a resolution, FR is a frame rate, and a1∼a5, b1∼b4 are constants.
- If the playback stop time length array is not input when the number of times of playback stop is equal to or greater than 1, it is processed as an error.
- Next, based on the service ID and the design ID, the
coefficient array 2 is acquired from the coefficient table 2, and based on thecoefficient array 2 and the QoE_C calculated by theequation 1 and the input data, QoE_CR (intermediate parameter) is calculated according to the following equation 2 (QoE estimation) (step S132).
EQUATION 2

- In the above equation, Min (A, B) is a function that returns a smaller value of A and B, n is the number of times of playback stop, and RLi is a time length of i-th occurred playback stop. c1, c2 are constants.
- Here, when the number of times of playback stop is "0", or when there is no input of the number of times of playback stop and the playback stop time length array, n = 0 (DR = 0) is used as for the
equation 2. - Next, based on the service ID and the design ID, the
coefficient array 3 is acquired from the coefficient table 3, and based on the QoE_CR calculated by thecoefficient array 3 and theequation 2 and the input data, QoE is calculated according to the following equation 3 (terminal correction), and is output to the OTT as an estimated QoE (step S133).
- In the above equation, r is 1 when there is a playback stop, is 0 when there is no playback stop, and d1∼di are constants.
- Here, when there is no input of the number of times of playback stop and the playback stop time length array, r = 0 is set with respect to the
equation 3. - It is also possible to have a function of turning the
above equation 3 OFF (QoE=QoE_CR) by setting of a config file. -
Fig. 11 is a diagram for explaining processing executed by the resolution·frame rate recommendfunction 14 of the quality-of-experience optimization apparatus 1. - For each content distribution request of a user of a content distribution service, when various pieces of input data (service ID, design ID, coding bit rate, the following parameters are optional (number of times of playback stop, playback stop time length, resolution array, frame rate array)) are input via the parameter input and
output unit 30 from the content distribution server of the OTT, a resolution, a frame rate, and a QoE to be recommended are calculated and output to the OTT (step S141). - Here, the QoE estimation process by the QoE estimation function 13 (see
Fig. 10 ) is repeatedly executed (step S142) for all pairs of resolutions and frame rates included in the input resolution array and frame rate array, so that a resolution and a frame rate by which the QoE becomes the largest, and the QoE are output. - When there is no resolution array as the input data, a resolution array corresponding to the service ID and the design ID is acquired from the resolution table T8.
- Also, when there is no frame rate array as the input data, a frame rate array corresponding to the service ID and the design ID is acquired from the frame rate table T9.
-
Fig. 12 is a diagram for explaining processing executed by the initial coding parameter recommendfunction 15 of the quality-of-experience optimization apparatus 1. -
Fig. 13 is a diagram for explaining processing executed by the function 15 - 1, that is a function included in the initial coding parameter recommend function 15 (Fig. 12 ), and that outputs a whole QoE and a coding parameter table T12 from a coding bit rate array and average throughput distribution. -
Fig. 14 is a diagram for explaining processing executed by the function 15 - 2, that is a function included in the initial coding parameter recommend function 15 (Fig. 12 ), for outputting an average throughput distribution table T11. -
Fig. 15 is a diagram for explaining processing executed by the function 15 - 3, that is a function included in the function 15 - 1 (Fig. 13 ) for outputting the whole QoE and the coding parameter table T12 from the coding bit rate array and the average throughput distribution of the initial coding parameter recommendfunction 15, and that converts the coding parameter table T12 to an average throughput-QoE table T13. - Each time when designing/redesigning (encoding etc.) of the content distribution service is preformed, when the initial coding parameter recommend
function 15 ofFig. 12 receives various pieces of input data (service ID, design ID, number of encodings, following parameter is optional (encoding bit rate array)) via the parameter input andoutput unit 30 from the content distribution server of the OTT, an array of the size of the input number of encodings is created for all combinations of all coding bit rates included in the input coding bit rate array, and is output as a coding bit rate array list L1 (step S151). - When there is no coding bit rate array as the input data, a coding bit rate array corresponding to the input service ID and design ID is acquired from the coding bit rate table T10.
- In addition, based on the input service ID and design ID, an average throughput distribution table T11 is acquired (step S152) by a function 15 - 2 (
Fig. 14 ) which outputs the after-mentioned average throughput distribution table T11 (step S152). - Then, the input service ID and design ID, and the average throughput distribution table T11 acquired in step S152 are input, so that the whole average QoE is calculated by the after-mentioned function 15-1 (
Fig. 13 ) for all coding bit rate arrays included in the coding bit rate array list L1 output in step S151, and a coding parameter table T12 is output (step S153, step S154). That is, the whole average QoE and the coding parameter table T12 are obtained for each coding bit rate array included in the coding bit rate array list L1. - Then, the whole average QoE and the coding parameter table T12 by which the whole average QoE becomes the largest output in step S153 are output to the OTT (step S154).
- The function 15 - 1 for outputting the whole QoE and the coding parameter table T12 from the coding bit rate array and the average throughput distribution in
Fig. 13 , first, calculates a QoE, a resolution, and a frame rate in accordance with the resolution·frame rate recommend function 14 (seeFig. 11 ), for all coding bit rates included in the coding bit rate array input from step S154 (Fig. 12 ), and generates the coding parameter table T12 associating the QoE, the resolution, and the frame rate for each coding bit rate array (steps S15 - 11, S15 - 12). - Then, the after-mentioned function 15 - 3 (
Fig. 15 ) converts the coding parameter table T12 to the average throughput-QoE table T13 (step S15 - 13), and calculates the whole average QoE according to thefollowing equation 4 based on the converted average throughput-QoE table T13 and the average throughput distribution table T11 acquired in step S152 (Fig. 12 ) (step S15 - 14).
- Then, the coding parameter table T12 generated in step S15-11 and the whole average QoE calculated in step S15-14 are output to step S154 in
Fig. 12 . - The function 15 - 2 for outputting the average throughput distribution table T11 in
Fig. 14 selects, from the viewing log R stored in the storage unit 24, according to the input service ID and design ID, measured throughput averages corresponding to logs of date and time which is within the analysis period set in theconfig file F 2 and up to the current date and time, and extracts the average throughput array (Step S15-21). - Then, the function 15 - 2 generates an average throughput distribution table T11 from the average throughput array extracted from the viewing log R based on the minimum value MIN, the maximum value MAX, and the width RANGE of the throughput class set in the
config file F 3, and outputs it to step S15-14 of the function 15-1 (Fig. 13 ) (step S15-22). Note that when (MAX - MIN)% RANGE! = 0 in the config file F3, themaximum MAX 2 at which (MAX 2 - MIN)% RANGE! == 0 &&MAX 2 <MAX holds true is treated as the maximum value. - The function 15 - 3 for converting the coding parameter table T12 to the average throughput-QoE table T13 in
Fig. 15 converts all coding bit rates of the coding parameter table T12 generated in step S15 - 11 of the function 15 - 1 (Fig. 13 ) to average throughput to generate a Tmp table T14 (step S15 - 31). - In this step, when the target coding bit rate of the coding parameter table T12 is equal to or greater than the coding bit rate class lower limit value set in the config file F4 and less than the coding bit rate class upper limit value, a corresponding offset value of the config file F4 is added to the coding bit rate, and the encoding bit rate is converted into the average throughput. In other cases, the coding bit rate is directly converted to the average throughput.
- In addition, the average throughput-QoE table T13 is initialized based on the minimum value MIN, the maximum value MAX, and the width RANGE of the throughput class set in the config file F3 (step S15 - 32). In the example of the average throughput-QoE table T13 shown in
Fig. 15 , 500 means from MIN to MIN + RANGE, and 1000 means from MIN + RANGE to MIN + RANGE*2. - Then, in the next process step S15-33, a resolution, a frame rate, and a QoE corresponding to each average throughput class of the initialized throughput-QoE table T13 are set.
- If an average throughput equal to or less than the upper limit value of the average throughput class (1000 in the case of 500-1000) does not exist in the Tmp table T14, a resolution and a frame rate of the smallest average throughput in the Tmp table T14 are set in the average throughput-QoE table T13. Note that the method of calculating QoE in this case is described in detail later in the function 15 - 4 (see
Fig. 16 ). - When the average throughput of the Tmp table T14 does not exist in the range of the average throughput class, a resolution, a frame rate, and a QoE of an average throughput that is smaller than the average throughput class and that is the maximum are set in the average throughput-QoE table T13.
- When the average throughput of the Tmp table T14 exists in the range of the average throughput class, a resolution and a frame rate of the existing average throughput are set in the average throughput-QoE table T13. Here, when there are a plurality of average throughputs of the
Tmp table T 14 within the range of the average throughput class, a resolution and a frame rate of the smallest average throughput are set in the average throughput-QoE table T13. The method of calculating QoE in this case is described in detail later in the after-mentioned function 15 - 5 (seeFigs. 17 and18 ). -
Figs. 16A and16B are diagrams for explaining the QoE calculation function 15 - 4, in the conversion function 15 - 3 for converting the coding parameter table T12 to the average throughput-QoE table T13, when the average throughput not exceeding the upper limit value of the average throughput class does not exist in the Tmp table T 14 (T <T_min). - As shown in
Fig. 16A , when the upper limit value T_up of the average throughput class of the average throughput-QoE table T13 is smaller than a value obtained by subtracting a preset constant B from the minimum value T_min of the average throughputs of the Tmp table T14 (Case 1), QoE (T) at the average throughput class T of the average throughput-QoE table T13 is QoE(T) = S1 / RANGE = 1. This calculation is illustrated asCase 1 inFig. 16B . - As shown in
Fig. 16A , when the average throughput class T of the average throughput-QoE table T 13 is equal to or larger than the value obtained by subtracting the preset constant B from the minimum throughput T_min of the Tmp table T 13 (Case 2), QoE (T) for the average throughput class T is

- This calculation is illustrated as
Case 2 inFig. 16B . - As shown in
Fig. 16A , in the case (Case 3) different from (Case 1), (Case 2), the QoE (T) at the average throughput class T is

- This calculation is illustrated as
Case 3 inFig. 16B . -
Figs. 17A and17B are diagrams for explaining the QoE calculation function 15 - 5, in the conversion function 15 - 3 converting from the coding parameter table T12 to the average throughput-QoE table T13, when the average throughput of the Tmp table T14 exists in the range of the average throughput class. - As shown in
Fig. 17A , when the average throughput of the Tmp table T14 equal to or less than the lower limit value of the average throughput class does not exist (A [0] <T [0] -B), the QoE of the average throughput class A [0] is,

- Regarding the above calculation, in
Fig. 17B , an area S1 and RANGE are shown. - When there is an average throughput of the Tmp table T14 equal to or less than the lower limit value of the average throughput class (example 1), the QoE of the average throughput class A [1] becomes


- Regarding the above calculation, an area S2 and RANGE are shown in
Fig. 17B . - When there is an average throughput of the Tmp table T14 equal to or less than the lower limit value of the average throughput class (example 2), the QoE of the average throughput class A[3] becomes


- Regarding the above calculation, an area S3 and RANGE are shown in
Fig. 17B . - When there are N average throughputs in the Tmp table T14 within the range of the average throughput class, with respect to the underlined term shown in
Fig. 17A , that is, in the case of QoE of average throughput class A [0] (step S15-51), the number of QoE [0]*(A[1]-T[0]) becomes N,
in the case of QoE of average throughput class A [1] (step S15-52), the number of QoE[1]*(A[2]-T[1]) becomes N,
in the case of QoE of average throughput class A [3] (step S15-53),the number of QoE[2]*(T[3]-T[2])+QoE[3]*(A[3]+RANGE-T[3]) becomes N. -
Figs. 18A and18B are diagrams for explaining the QoE calculation function 15 - 5 when the average throughput of the Tmp table T14 exists in the range of the average throughput class, in the conversion function 15 - 3 converting the codingparameter table T 12 to the average throughput-QoE table T13. - As shown in
Fig. 18A , when there is no average throughput of the Tmp table T14 equal to or less than the lower limit value of the average throughput class (A[0]>T[0]-B), QoE of the average throughput class A [0] becomes

- The area S1 and RANGE in the above calculation are shown in
Fig. 18B . - When there are N average throughputs in the Tmp table T14 within the range of the average throughput class, with respect to the underlined term shown in
Fig. 18A , that is, the number of QoE[0]*(A[1]-T[0]) becomes N. - As a result, the coding parameter table T12 and the whole average QoE obtained by which the whole average QoE obtained by the initial coding parameter recommend
function 15 becomes the largest are output to the OTT. -
Fig. 19 is a diagram for explaining processing executed by the real-time coding parameter recommendfunction 16 of the quality-of-experience optimization apparatus 1. -
Fig. 20 is a diagram for explaining processing executed by the function 16 - 1 that is a function included in the real-time coding parameter recommend function 16 (Fig. 19 ), and that generates an average throughput probability density table. -
Fig. 21 is a diagram for explaining processing executed by the function 16 - 2 that is a function included in the real-time coding parameter recommend function 16 (Fig. 19 ) and that calculates a local average QoE and a QoE. -
Fig. 22 is a diagram for explaining processing executed by the function 16 - 3 that is a function included in the function 16 - 2 (Fig. 21 ) for calculating the local average QoE and QoE of the real-time coding parameter recommendfunction 16, and that creates the average throughput-playback stop state table T17. -
Fig. 23 is a diagram for explaining processing executed by the function 16 - 3 that is a function included in the function 16 - 2 (Fig. 21 ) for calculating the local average QoE and QoE of the real-time coding parameter recommendfunction 16, and that creates the average throughput-QoE table. -
Fig. 24 is a diagram for explaining processing executed by the QoE estimation function 16 - 5 that is a function included in the function 16 - 4 (Fig. 23 ) for creating the average throughput-QoE table T 18 of the real-time coding parameter recommendfunction 16. - For each content distribution request of a user of a content distribution service, when the real-time coding parameter recommend
function 16 ofFig. 19 receives various pieces of input data (service ID, design ID, date and time, the following are optional parameters (use server, distribution server group, user ID, fixed / mobile identifier, server speed control, [IP Address or carrier name], [cell ID or coordinate], wi- Fi use judgment, OTT coding parameter table, video duration, playback start threshold, playback restart threshold, playback stop threshold)) via the parameter input andoutput unit 30 from the content distribution server of the OTT, throughput average average, throughput average deviation, throughput deviation average, user actual result average average, user actual result average deviation, and user actual result deviation average estimated by the throughput estimation function 11 (seeFig. 8 ) are output. - Then, based on the throughput average average, the user actual result average average, the throughput average deviation, and the user actual result average deviation output from the
throughput estimation function 11, the creation function 16 - 1 (Fig. 20 ) of the average throughput probability table, which will be described later, creates the average throughput probability table T15 and outputs it to the after-described function 16 - 2 (Fig. 21 ) for calculating the local average QoE and QoE (Step S161). - Further, when the calculation function 16 - 2 of the local average QoE and QoE receives the throughput deviation average, the user actual deviation average output from the
throughput estimation function 11, the input service ID, the setting ID, the video duration, the playback start threshold, the playback restart threshold, the playback stop threshold, and the average throughput probability table T15 output from the function 16 - 1 (Fig. 20 ) for creating the average throughput probability table, the calculation function 16 - 2 calculates the local average QoE for all combinations of coding bit rate, resolution, and frame rate in the input OTT coding parameter table (step S162). - When the OTT coding parameter table is not input, the coding parameter array list is acquired from the coding parameter set table T16, and the set of the coding bit rate, resolution and frame rate is input to the calculation function 16-2 of the local average QoE and the QoE (Step S163).
- Then, the resolution, the frame rate, the coding bit rate, and the local average QoE by which the local average QoE calculated by the calculation function 16 - 2 of the local average QoE and the QoE becomes the largest are output to the OTT. Also, the resolution, the frame rate, and the coding bit rate are input to the QoE estimation function 13 (
Fig. 10 ) (step S163). - The function 16 - 1 for generating an average throughput probability density table in
Fig. 20 initializes the average throughput probability table T15 based on the minimum value MIN, the maximum value MAX, and the width RANGE of the throughput class set in the config file F3 (step S16 - 11). The average throughput class in the average throughput probability table T15 is a value that increases from the minimum value MIN by the width RANGE. - Then, the user actual result flag set in the config file F5, and the throughput average average, user actual result average average, throughput average deviation, user actual result average deviation estimated by the throughput estimation function 11 (see
Fig. 8 ) are input, and the probability of each row of the average throughputprobability table T 15 is calculated based on thefollowing equation 7 so as to output the average throughput probability table T15 to the calculation function 16 - 2 (Fig. 21 ) of the local average QoE and QoE (step S16 -12).
EQUATION 7
WHEN s≠0


- In the
equation 7, P is a probability, m is a throughput average average or a user actual result average average. S is a throughput average deviation variance or a user actual result average deviation. T_median is an average value (= average throughput class + RANGE/2) of the upper limit value and the lower limit value of the average throughput class, and RANGE is a value obtained from the config file F3. - In the
equation 7, when the user actual result flag is off "0", the throughput average average is set to m. When the user actual result flag is on "1", the user actual average average is m, but when the user actual average average is not input, the throughput average average is m. - Further, in the
equation 7, when the user actual result flag is off "0", the throughput average deviation is set as s. When the user actual result flag is on "1", the user actual average deviation is set as s, but if the user actual result average deviation is not input, the throughput average deviation is set as s. - Note that, If m = 0 or m < the smallest value, it is treated as an error.
- In the function 16 - 2 for calculating the local average QoE and QoE in
Fig. 21 , based on the input service ID, design ID, video duration, playback start threshold, playback restart threshold, playback stop threshold, and coding bit rate, the after-mentioned function 16 -3 (Fig. 22 ) for creating an average throughput-playback stop state table T17 creates an average throughput-playback stop state table T17 (step S16 - 21). - Then, the input service ID, the design ID, the coding bit rate, the resolution, the frame rate, the video duration, and the average throughput-playback stop state table T17 created by the function 16 - 3 (
Fig. 22 ) are input, so that an average throughput-QoE conversion table T18 is created (step S16 - 22) by the after-mentioned function 16 - 4 (Fig. 23 ) for creating the average throughput-QoE table. - Then, the average throughput probability table T15 created by the average throughput probability density table generation function 16 - 1 (
Fig. 20 ), and the average throughput-QoE conversion table T18 created by the average throughput-QoE table creation function 16 - 4 are input, so that the local average QoE is calculated based on thefollowing equation 8, and it is output to the process of step S163 inFig. 19 (step S16 - 23).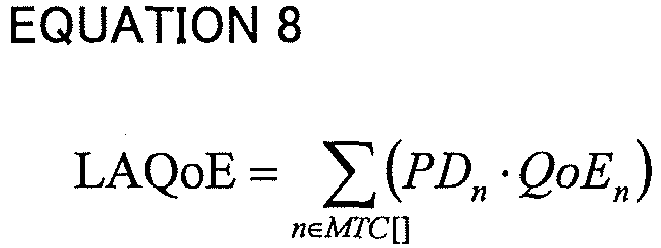
- In the
equation 8 above, LAQoE is the local average QoE, PDn is the probability of the average throughput class n in the average throughput probability table T15. QoEn is the QoE of the average throughput class n in the average throughput-QoE conversion table T18. MTC [] is the average throughput class sequence of the average throughput-probability table. - In the function 16 - 3 for creating the average throughput-playback stop state table T17 in
Fig. 22 , based on the minimum value MIN, the maximum value MAX, and the width RANGE of the throughput class set in the config file F3, the average throughput - the playback stop state table T17 is initialized (step S16 - 31). - Then, for each row of the average throughput - the playback stop state table T17, a value (average throughput class + RANGE/2) obtained by adding one half of RANGE to the corresponding average throughput class is set as an average throughput, and the average number of times of playback stop SC and the average playback stop time SL are calculated by the playback stop state estimation function 12 (see step S121 of
Fig. 9 ) (step S 16 - 32). The average throughput-playback stop state table T17 thus created is output to the average throughput-QoE table creation function 16 - 4 (Fig. 23 ). - The function 16 - 4 for creating the average throughput-QoE table in
Fig. 23 initializes the average throughput-QoE conversion table T18 based on the minimum value MIN, the maximum value MAX, and the width RANGE of the throughput class set in the config file F3 (steps S16 - 41). - Then, the average number of times of playback stop and the average playback stop time in all average throughput classes in the average throughput-playback stop state table T17 created by the creation function 16-2 of the average throughput-playback stop state table (see
Fig. 22 ) are sequentially input, so that each corresponding QoE is calculated by the after-mentioned QoE estimation function 16 - 5, and the QoE is assigned as a QoE of the corresponding average throughput class in the average throughput-QoE conversion table T18 (step S16 - 42). The average throughput-QoE conversion table T18 thus created is output to step S16 - 23 of the local average QoE and QoE calculation function 16 - 2 (Fig. 21 ). - The QoE estimation function 16 - 5 in
Fig. 24 receives the input service ID, design ID, average number of time of playback stop SC, average playback stop time SL, video duration duration, constants H1, H2, H3, duration_min, duration_max set by the config file F6, coefficient array 6 (g1, g2) and coefficient array 7 (h1, h2) acquired from the coefficient tables 6, and 7 corresponding to the service ID and the design ID, and calculates QoE on the basis of the following equation 9 (step S16 - 51).
EQUATION 9



- Min (A, B) in the above equation is a function that returns a smaller value among A and B. SC is an average number of times of playback stop, and SL is an average playback stop time, and g1, g2, h1, h2 are constants, duration is a video duration, and duration_min, duration_max, H1∼H3 are constants defined in the config file.
- Note that the
intermediate parameter QoE_C 2 used in theequation 9 is calculated based on theequation 10 below which receives the input service ID, design ID, coding bit rate Bitrate, resolution RS, frame rate FR, and the coefficient array 8 (i1∼i7) acquired from the coefficient table 8 corresponding to the service ID and the design ID (step S16 - 52).
EQUATION 10


- In the above equation, Bitrate is a coding bit rate, RS is a resolution, FR is a frame rate, i1∼i7 are constants.
- The
equation 9 and theequation 10 are also model equations obtained by experiments and the like as described before. In theequation 10, QoE (QoE_C2) is calculated by inputting a coding bit rate, a resolution, and a frame rate, and in theequation 9, a QoE is calculated further taking into account the number of times of playback stop and the playback stop time. - As a result, the resolution, the frame rate, and the coding bit rate, by which the local average QoE obtained by the real-time coding parameter recommend
function 16 becomes the largest, and the local average QoE are output to the OTT. -
Fig. 25 is a diagram for explaining processing executed by the throughput tableinformation update function 21 of the quality-of-experience optimization apparatus 1. - For example, based on automatic start of about once every 1 to 5 minutes, when update target designation information (any one of calendar information, use server, NW name, and base station ID) is input from among various pieces of input data input from the content distribution server of the OTT via the parameter input and
output unit 30, whether the input data of update target is the use server, NW name or base station ID is determined (step S211). - When it is determined that the input data of update target is the calendar information and the use server, according to the calendar information and the utilization server, the logs of the (calendar information, use server) - speed conversion table T6 including the measured throughput average are updated using the latest logs of the number of (21_log) acquired from the viewing log R stored in the storage unit 24 (Step S212).
- When it is determined that the input data of update target is the calendar information and the NW name or is the calendar information and the base station ID, according to the calendar information and the NW name (or base station ID), the logs of the (calendar information, NW name) - speed conversion table T5 (or (calendar information, base station ID) - speed conversion table T4) including the measured throughput average are updated using the latest logs of the number of (21_log) acquired from the viewing log R stored in the storage unit 24 (Step S213).
- Then, throughput calculation (throughput average average = average of measured throughput average, throughput average deviation = deviation of measured throughput average, throughput deviation average = average of measured throughput deviation) is performed on the target logs acquired in step S212 or S213 (step S214).
- Then, with respect to the throughput average average, the throughput average deviation, and the throughput deviation average calculated in step S214, the target rows of the corresponding speed conversion table T4 / T5 / T6 are updated (step S215).
- For each call by the automatic activation, for each of the above (calendar information, base station ID) - speed conversion table T4, (calendar information, NW name) - speed conversion table T5, and (calendar information, use server) - speed conversion table T6, the throughput table
information update function 21 is executed for a combination in which logs, containing the information of the measured throughput average, the number of which is equal to or greater than the number (21_threshold) which is a calculation condition from the previous update, are accumulated in the viewing log R. - Note that, based on the time when the system is in operation, the current calendar information, and a part corresponding to calendar information one hour after are calculated.
- As a result, the (calendar information, base station ID)-speed conversion table T4, the (calendar information, NW name) - speed conversion table T5, the (calendar information, use server) - speed conversion table T6 are always updated to the latest state, so that calculation of each function in the estimation value·recommend
value calculation unit 10 can be executed. -
Figs. 26A and26B are diagrams for explaining processing executed by the viewinglog update function 22 of the quality-of-experience optimization apparatus 1.Fig 26A shows a procedure of the process andFig.26B shows the viewing log. - It is determined whether or not (date and time, user ID, service ID, design ID) are included as input data from the OTT (step S221).
- In the case where it is determined that (date and time, user ID, service ID, design ID) are included as the input data, when the date and time is included, the (day of week, time)- calendar information table T1 is referred to, and calendar information corresponding to the date and time is added, when an IP address is included, the IP address-IP conversion table T2 is referred to, and the carrier name corresponding to the IP address is added, when a carrier name is included, the carrier name-carrier identifier conversion table T3 is referred to, and a carrier identifier corresponding to the carrier name is added (step S 222).
- Then, it is determined whether or not a record having the same combination of the input (date and time, user ID, service ID, design ID) exists in the viewing log R (step S223).
- Then, when the record having the same combination of the input (date and time, user ID, service ID, design ID) exists in the viewing log R, content of a column input as an option of the combination is updated for the record having the combination of the input (date and time, user ID, service ID, design ID) (step S224).
- When the record having the combination of the input (date and time, user ID, service ID, design ID) does not exist in the viewing log R, all input columns are entered to newly create a record of the viewing log R (step S225).
- As a result, it is possible to always update the record of the viewing log R to the latest state and to perform calculation of each function in the estimation value·recommend
value calculation unit 10. - Therefore, according to the quality-of-experience optimization system having the above configuration, a recommend request and various distribution parameters for optimizing the QoE of the content distribution service are input from the
recommend request apparatus 40 of the OTT to the quality-of-experience optimization apparatus 1 via the parameter input andoutput unit 30. Then, thethroughput estimation function 11 estimates a throughput average average, throughput average deviation and the like on the basis of the input distribution parameter (including coding bit rate, resolution, frame rate) and various setting values (including coefficient arrays) stored in the storage unit 24 according to the distribution parameter and input data from the system administrator. Then, the real-time coding parameter recommendfunction 16 calculates coding parameters (including resolution and frame rate corresponding to each coding bit rate) by which the local average QoE becomes the largest, and outputs the coding parameters as recommendation values to the content distribution system OTT via the parameterinput output unit 30. - Also, according to the quality-of-experience optimization system having the above configuration, the
QoE estimation function 13 estimates a QoE on the basis of the input distribution parameter (including coding bit rate, resolution, frame rate) and various setting values (including coefficient arrays) stored in the storage unit 24 according to the distribution parameter and input data from the system administrator. Then, the resolution·frame rate recommendfunction 14 calculates a resolution and a frame rate by which estimated QoE becomes the largest, the initial coding parameter recommendfunction 15 calculates coding parameters (including a resolution and a frame rate for each coding bit rate) by which an average QoE of the whole of content distribution target users becomes the largest, so that these parameters are output to the content distribution system OTT via the parameter input andoutput unit 30. - Accordingly, in the OTT, a distribution parameter such as a distribution rate and the like of the content distribution service can be set according to the coding parameter, obtained as the recommend value, by which the local average QoE or the average QoE of the whole of the content distribution target users becomes the largest. Therefore, it becomes possible to select a content distribution method that maximizes QoE of the user, and quality improvement effect can be expected such as not causing rebuffering with fixed distribution rate.
- Also, according to the quality-of-experience optimization system having the above configuration, various setting values (including various tables Tn, various coefficients (constants)) stored in the storage unit 24 are updated by the setting
value update unit 20 based on distribution parameters newly input via the parameter input andoutput unit 30 and input data from a system administrator. Thus, it is possible to estimate the QoE, to calculate a resolution and a frame rate by which the QoE becomes the largest, and to calculate coding parameters by which the whole average QoE becomes the largest, by always updating the setting values to new state. - By the technique described in the present embodiment, the problems presented in (1) to (3) of the "problem to be solved by the invention" can be solved. Specifically, it becomes possible to select a content distribution method that maximizes QoE of the user, and quality improvement effect can be expected such as not causing rebuffering with fixed distribution rate.
- Each of methods of processing by the quality-of-experience optimization system described in each of the above embodiments can be stored in a medium of an external recording device, such as a memory card (ROM card, RAM card, etc.), a magnetic disk (floppy (registered trademark) disk, hard disk etc.), an optical disk (CD-ROM, DVD etc.), and a semiconductor memory, and can be distributed, as a program that can be executed by a computer, in which the methods of processing include each method of the recommend request processing accompanied by output of the distribution parameter from the OTT by the
recommend request apparatus 40 ofFig. 1 , the reception processing of the estimation value / recommend value from the quality-of-experience optimization apparatus 1, the processing of thethroughput estimation function 11 shown inFig. 8 , the processing of the playback stopstate estimation function 12 shown inFig. 9 , the processing of theQoE estimation function 13 shown inFig. 10 , the processing of the resolution·frame rate recommendfunction 14 shown inFig. 11 , the processing of the initial coding parameter recommendfunction 15 shown inFigs. 12∼18 , the processing of the real-time coding parameter recommendfunction 16 shown inFigs. 19 ∼ 24 , the processing of the throughput tableinformation update function 21 shown inFig. 25 , and the processing of the viewinglog update function 22 shown inFig. 26 . - Then, a computer (control device: CPU) of an electronic device reads the program stored in the medium of the external storage device into a storage device, and operation is controlled by the read program, so that the recommend request function, the estimation value· recommend value calculation function, and the setting value update function described in each embodiment are realized, and processing the same as that of the before-mentioned methods can be realized.
- Data of the program for realizing each of the methods can be transmitted on a NW as a form of program code. An electronic device downloads the data of the program from a computer device connected to this NW to store the data of the program in a storage device, so that the before-mentioned recommend request function, the estimation value· recommend value calculation function, and the setting value update function can be also realized.
- The present invention is not limited to the above embodiments, and various modifications can be made in carrying-out stages without departing from the gist thereof. Further, each embodiment includes inventions at various stages, and various inventions can be extracted by appropriately combining a plurality of disclosed constituent components. For example, in the case where the problem described in the section of "problem to be solved by the invention" can be solved and the effect described in the section of the effect of the invention can be obtained even if some constituent components are deleted from all of the constituent components shown in each embodiment, or even if some constituent components are combined in a different form, a configuration in which these constituent components are deleted or combined can be extracted as an invention.
- The present patent application claims priority based on Japanese patent application No.
2015-020500 2015-020500 -
- 1 quality-of-experience optimization apparatus
- 10 estimation/recommend function (estimation value · recommend value calculation unit)
- 11 throughput estimation function
- 12 playback stop state estimation function
- 13 QoE estimation function
- 14 resolution · frame rate recommend function
- 15 initial coding parameter recommend function
- 16 real-time coding parameter recommend function
- 20 data accumulation function (setting value update unit)
- 21 throughput table information update function
- 22 viewing log update function
- 23 setting value reference function
- 24 storage unit
- 25 input and output apparatus
- 30 parameter input and output unit
- 40 recommend request apparatus
- 41 distribution parameter output unit
- 42 recommend value reception unit
- OTT content distribution system
Claims (9)
- A quality-of-experience optimization system configured to optimize quality (QoE: Quality of Experience) that a user experiences in a content distribution service, comprising:a recommend request apparatus configured to output a distribution parameter candidate of content distribution for optimizing QoE of content distribution, and to receive a distribution parameter for optimizing the QoE as a recommend value; anda quality-of-experience optimization apparatus configured to estimate QoE from the distribution parameter candidate received from the recommend request apparatus, and to calculate a distribution parameter for optimizing the QoE as a recommend value to output the recommend value.
- A quality-of-experience optimization apparatus configured to optimize quality (QoE: Quality of Experience) that a user experiences in a content distribution service, comprising:a parameter input output unit configured to input a distribution parameter candidate for content distribution, and to output a recommend value for optimizing QoE; andan estimation value·recommend value calculation unit configured to estimate QoE based on the distribution parameter candidate input by the parameter input output unit, and to calculate a distribution parameter for optimizing the QoE as the recommend value.
- The quality-of-experience optimization apparatus as claimed in claim 2, the estimation value·recommend value calculation unit including:a QoE estimation function unit configured to calculate QoE from information on coding of the distribution parameter candidate;a resolution·frame rate recommend function unit configured to calculate a resolution and a frame rate by which the QoE calculated by the QoE estimation unit becomes the largest; andan initial coding parameter recommend function unit configured to calculate a coding parameter by which an average QoE of the whole of content distribution target users becomes the largest.
- The quality-of-experience optimization apparatus as claimed in claim 2 or 3, wherein the estimation value·recommend value calculation unit
estimates QoE based on a distribution parameter candidate input by the parameter input output unit and a setting value according to input data from a system administrator to calculate a distribution parameter that optimizes the QoE as the recommend value, and
the quality-of-experience optimization apparatus further includes a setting value update unit configured to update the setting value based on a distribution parameter candidate that is newly input by the parameter input output unit or new input data from the system administrator. - A recommend request apparatus for optimizing QoE in a content distribution service, comprising:a distribution parameter output unit configured to output a distribution parameter candidate for content distribution, to a quality-of-experience optimization apparatus, in order to request a distribution parameter for optimizing QoE as a recommend value; anda recommend value reception unit configured to receive the recommend value from the quality-of-experience optimization apparatus.
- A quality-of-experience optimization method, executed by a quality-of-experience optimization apparatus, for optimizing QoE in a content distribution service, comprising:a distribution parameter input step of inputting a distribution parameter candidate for content distribution;an estimation value·recommend value calculation step of estimating QoE based on the distribution parameter candidate input in the parameter input step, and calculating a distribution parameter for optimizing the QoE as the recommend value; anda recommend value output step of outputting the recommend value calculated in the estimation value·recommend value calculation step.
- A recommend request method executed by a recommend request apparatus for optimizing QoE in a content distribution service, comprising:a distribution parameter output step of outputting a distribution parameter candidate for content distribution, to a quality-of-experience optimization apparatus, in order to request a distribution parameter for optimizing QoE as a recommend value; anda recommend value reception step of receiving the recommend value from the quality-of-experience optimization apparatus.
- A program that causes a computer to function as each unit in the quality-of-experience optimization apparatus as claimed in any one of claims 2 - 4.
- A program that causes a computer to function as each unit in the recommend request apparatus as claimed in claim 5.
Applications Claiming Priority (2)
| Application Number | Priority Date | Filing Date | Title |
|---|---|---|---|
| JP2015020500 | 2015-02-04 | ||
| PCT/JP2015/086087 WO2016125415A1 (en) | 2015-02-04 | 2015-12-24 | Quality-of-experience optimization system, quality-of-experience optimization device, recommendation request device, quality-of-experience optimization method, recommendation request method and program |
Publications (3)
| Publication Number | Publication Date |
|---|---|
| EP3255894A1 true EP3255894A1 (en) | 2017-12-13 |
| EP3255894A4 EP3255894A4 (en) | 2018-09-26 |
| EP3255894B1 EP3255894B1 (en) | 2021-01-20 |
Family
ID=56563772
Family Applications (1)
| Application Number | Title | Priority Date | Filing Date |
|---|---|---|---|
| EP15881232.1A Active EP3255894B1 (en) | 2015-02-04 | 2015-12-24 | Quality-of-experience optimization system, quality-of-experience optimization device, recommendation request device, quality-of-experience optimization method, recommendation request method and program |
Country Status (5)
| Country | Link |
|---|---|
| US (1) | US10681416B2 (en) |
| EP (1) | EP3255894B1 (en) |
| JP (1) | JP6572245B2 (en) |
| CN (1) | CN107211178B (en) |
| WO (1) | WO2016125415A1 (en) |
Families Citing this family (14)
| Publication number | Priority date | Publication date | Assignee | Title |
|---|---|---|---|---|
| US10674409B2 (en) * | 2017-06-09 | 2020-06-02 | At&T Intellectual Property I, L.P. | System and method for fine grained service management using SDN-NFV networks |
| JP6611271B2 (en) * | 2017-07-07 | 2019-11-27 | 日本電信電話株式会社 | Video quality control apparatus, bit rate selection method, and program |
| JP6992813B2 (en) * | 2017-08-30 | 2022-01-13 | 日本電気株式会社 | Video playback bit rate estimation device, video playback bit rate estimation method, video playback bit rate estimation program and communication quality measurement device |
| JP7082282B2 (en) * | 2018-06-06 | 2022-06-08 | 富士通株式会社 | Packet analysis program, packet analysis method and packet analysis device |
| US10819760B2 (en) | 2018-10-01 | 2020-10-27 | At&T Intellectual Property I, L.P. | Method and apparatus for streaming video applications in cellular networks |
| US11128869B1 (en) * | 2018-10-22 | 2021-09-21 | Bitmovin, Inc. | Video encoding based on customized bitrate table |
| JP7280535B2 (en) * | 2019-12-16 | 2023-05-24 | 日本電信電話株式会社 | Encoded data generation method, encoded data generation device, and program |
| JP7630293B2 (en) * | 2021-02-09 | 2025-02-17 | 日本放送協会 | Rate control server, distribution system and rate control program |
| WO2022185534A1 (en) * | 2021-03-05 | 2022-09-09 | 日本電信電話株式会社 | Coding parameter derivation device, coding parameter derivation method, and program |
| CN116941245A (en) * | 2021-03-10 | 2023-10-24 | 日本电信电话株式会社 | Information processing device, analysis method, and program |
| WO2022190263A1 (en) * | 2021-03-10 | 2022-09-15 | 日本電信電話株式会社 | Information processing device, analysis method, and program |
| WO2022201225A1 (en) * | 2021-03-22 | 2022-09-29 | 日本電信電話株式会社 | Control apparatus, control method, and program |
| US12267149B2 (en) * | 2021-12-21 | 2025-04-01 | Dish Network Technologies India Private Limited | Methods, devices, and systems for distributing content in community of over-the-air broadcast content receivers |
| US11824766B2 (en) * | 2022-04-13 | 2023-11-21 | Cisco Technology, Inc. | Adaptive selection of network paths based on long-term predictions of user experience |
Family Cites Families (36)
| Publication number | Priority date | Publication date | Assignee | Title |
|---|---|---|---|---|
| US5742892A (en) * | 1995-04-18 | 1998-04-21 | Sun Microsystems, Inc. | Decoder for a software-implemented end-to-end scalable video delivery system |
| FI109072B (en) * | 1999-06-16 | 2002-05-15 | Nokia Corp | Method and arrangement for selecting channel coding and interleaving schedules in some packet data connections |
| US7424268B2 (en) * | 2002-04-22 | 2008-09-09 | Cisco Technology, Inc. | System and method for management of a shared frequency band |
| US7747255B2 (en) * | 2003-03-26 | 2010-06-29 | Sony Corporation | System and method for dynamic bandwidth estimation of network links |
| JP2005354126A (en) * | 2004-06-08 | 2005-12-22 | Hitachi Communication Technologies Ltd | Wireless communication terminal, wireless base station, and wireless communication system |
| US20080068995A1 (en) * | 2004-07-05 | 2008-03-20 | Robert Skog | Devices and Methods for Push Message Initiated Service |
| BRPI0418974A8 (en) * | 2004-07-27 | 2017-12-26 | Telecom Italia Spa | METHOD FOR PERFORMING A COMMUNICATION BETWEEN A FIRST USER AND A SECOND USER AND TELEPHONE EQUIPMENT FOR PERFORMING A COMMUNICATION IN A COMMUNICATION NETWORK |
| US7773672B2 (en) * | 2006-05-30 | 2010-08-10 | Freescale Semiconductor, Inc. | Scalable rate control system for a video encoder |
| FR2903259A1 (en) * | 2006-06-29 | 2008-01-04 | Thomson Licensing Sa | METHOD FOR MANAGING REMOTE ACCESS REQUESTS TO MULTIMEDIA CONTENT |
| EP1879392A3 (en) * | 2006-07-11 | 2011-11-02 | Magix Ag | System and method for dynamically creating online multimedia slideshows |
| US20080278582A1 (en) * | 2007-05-07 | 2008-11-13 | Sentinel Ave Llc | Video Fusion Display Systems |
| US8819106B1 (en) * | 2008-12-12 | 2014-08-26 | Amazon Technologies, Inc. | Managing distributed execution of programs |
| FR2954036B1 (en) * | 2009-12-11 | 2012-01-13 | Thales Sa | METHOD AND SYSTEM FOR DETERMINING ENCODING PARAMETERS ON VARIABLE RESOLUTION FLOWS |
| KR20110102135A (en) * | 2010-03-10 | 2011-09-16 | 엘지전자 주식회사 | Method and apparatus for scheduling AFP service in broadband wireless access system |
| EP2429190A1 (en) * | 2010-09-13 | 2012-03-14 | NTT DoCoMo, Inc. | Method and apparatus for transferring a video stream |
| US9107197B2 (en) * | 2011-04-13 | 2015-08-11 | Telefonaktiebolaget L M Ericsson (Publ) | Terminal-based selection of radio parameters among a parameter subset offered by the network |
| CN103875248B (en) * | 2011-08-30 | 2018-09-07 | 帝威视有限公司 | System and method for encoding and streaming video encoded by using multiple maximum bitrate levels |
| US9456387B2 (en) | 2011-10-05 | 2016-09-27 | Alcatel Lucent | Method and apparatus for improving adaptive streaming video quality by optimizing resource allocation |
| WO2013100968A1 (en) * | 2011-12-28 | 2013-07-04 | Intel Corporation | Video adaptation for content-aware wireless streaming |
| JP6396808B2 (en) | 2012-02-17 | 2018-09-26 | インターデイジタル パテント ホールディングス インコーポレイテッド | Hierarchical traffic segmentation to handle congestion and / or manage user experience quality |
| US9712887B2 (en) * | 2012-04-12 | 2017-07-18 | Arris Canada, Inc. | Methods and systems for real-time transmuxing of streaming media content |
| US8762563B2 (en) * | 2012-04-16 | 2014-06-24 | Adobe Systems Incorporated | Method and apparatus for improving the adaptive bit rate behavior of a streaming media player |
| US8792347B2 (en) * | 2012-06-01 | 2014-07-29 | Opera Software Ireland Limited | Real-time network monitoring and subscriber identification with an on-demand appliance |
| US9571827B2 (en) * | 2012-06-08 | 2017-02-14 | Apple Inc. | Techniques for adaptive video streaming |
| US9357272B2 (en) | 2012-08-03 | 2016-05-31 | Intel Corporation | Device orientation capability exchange signaling and server adaptation of multimedia content in response to device orientation |
| US9125073B2 (en) * | 2012-08-03 | 2015-09-01 | Intel Corporation | Quality-aware adaptive streaming over hypertext transfer protocol using quality attributes in manifest file |
| US9172646B2 (en) * | 2013-03-15 | 2015-10-27 | International Business Machines Corporation | Dynamic reconfiguration of network devices for outage prediction |
| US10187433B2 (en) * | 2013-03-15 | 2019-01-22 | Swyme Ip Bv | Methods and systems for dynamic adjustment of session parameters for effective video collaboration among heterogenous devices |
| EP2806633A1 (en) * | 2013-05-23 | 2014-11-26 | Alcatel Lucent | Method and apparatus for improved network optimization for providing video from a plurality of sources to a plurality of clients |
| US9413806B2 (en) * | 2013-05-24 | 2016-08-09 | Broadcom Corporation | Adaptive bit rate proxy |
| WO2015057212A1 (en) * | 2013-10-16 | 2015-04-23 | Empire Technology Development, Llc | Dynamic frequency and power resource allocation with granular policy management |
| US10321361B2 (en) * | 2014-10-10 | 2019-06-11 | Huawei Technologies Co., Ltd. | Method and device for requesting a quality of experience in a communications network |
| US10412182B2 (en) * | 2014-12-18 | 2019-09-10 | Nippon Telegraph And Telephone Corporation | Communication speed estimation apparatus, communication speed estimation method, and program |
| WO2016172473A1 (en) * | 2015-04-24 | 2016-10-27 | Vid Scale, Inc. | Detecting man-in-the-middle attacks in adaptive streaming |
| EP3145201A1 (en) * | 2015-09-17 | 2017-03-22 | Harmonic Inc. | Video processing with dynamic resolution changes |
| GB2556925B (en) * | 2016-11-25 | 2020-07-29 | Canon Kk | Method and system for determining encoding parameters of video sources in large scale video surveillance systems |
-
2015
- 2015-12-24 US US15/548,108 patent/US10681416B2/en active Active
- 2015-12-24 EP EP15881232.1A patent/EP3255894B1/en active Active
- 2015-12-24 JP JP2016573208A patent/JP6572245B2/en active Active
- 2015-12-24 WO PCT/JP2015/086087 patent/WO2016125415A1/en not_active Ceased
- 2015-12-24 CN CN201580075264.6A patent/CN107211178B/en active Active
Also Published As
| Publication number | Publication date |
|---|---|
| JP6572245B2 (en) | 2019-09-04 |
| WO2016125415A1 (en) | 2016-08-11 |
| EP3255894A4 (en) | 2018-09-26 |
| US10681416B2 (en) | 2020-06-09 |
| EP3255894B1 (en) | 2021-01-20 |
| CN107211178B (en) | 2020-10-09 |
| JPWO2016125415A1 (en) | 2017-12-21 |
| CN107211178A (en) | 2017-09-26 |
| US20180027293A1 (en) | 2018-01-25 |
Similar Documents
| Publication | Publication Date | Title |
|---|---|---|
| EP3255894B1 (en) | Quality-of-experience optimization system, quality-of-experience optimization device, recommendation request device, quality-of-experience optimization method, recommendation request method and program | |
| US11887133B2 (en) | Methods and apparatus to generate electronic mobile measurement census data | |
| US10321361B2 (en) | Method and device for requesting a quality of experience in a communications network | |
| CN103914475B (en) | A kind of Forecasting Methodology, system and the device of video playing amount | |
| US20180376176A1 (en) | Quality-of-experience optimization apparatus, network quality estimation apparatus, mobile terminal, quality-of-experience optimization method, network quality estimation method, and program | |
| US9781474B2 (en) | Content playback information estimation apparatus and method and program | |
| CN104378220A (en) | Method, device, user terminal and network server for evaluating user experience quality | |
| US10412182B2 (en) | Communication speed estimation apparatus, communication speed estimation method, and program | |
| CN104883376A (en) | Application program recommendation method and terminal | |
| CN108429701A (en) | network acceleration system | |
| CN111882349B (en) | Data processing method, device and storage medium | |
| Xu et al. | QoE analysis of media streaming in wireless data networks | |
| US20210049618A1 (en) | Methods and apparatus to determine weights for panelists in large scale problems | |
| EP3593493B1 (en) | Prediction of a performance indicator | |
| Einziger et al. | Scheduling advertisement delivery in vehicular networks | |
| US9326296B2 (en) | Method and apparatus for scheduling delivery of content according to quality of service parameters | |
| CN111582527A (en) | Travel time estimation method and device, electronic equipment and storage medium | |
| JP5807102B1 (en) | Communication band calculation device, communication band calculation method and program | |
| KR101430648B1 (en) | Method and apparatus for exposing targeting advertisement | |
| WO2018192414A1 (en) | Qoe determining method and apparatus, storage medium, and processor | |
| CN103957230A (en) | A method for determining the number of client users, server, client and system | |
| US11489904B2 (en) | Poor-QoE assessment method and related device | |
| CN111787046B (en) | Data center routing method and device | |
| CN120091331B (en) | Methods, systems, equipment, and media for handling poor video quality in mobile networks. | |
| CN114993329B (en) | Road data updating method and device |
Legal Events
| Date | Code | Title | Description |
|---|---|---|---|
| STAA | Information on the status of an ep patent application or granted ep patent |
Free format text: STATUS: THE INTERNATIONAL PUBLICATION HAS BEEN MADE |
|
| PUAI | Public reference made under article 153(3) epc to a published international application that has entered the european phase |
Free format text: ORIGINAL CODE: 0009012 |
|
| STAA | Information on the status of an ep patent application or granted ep patent |
Free format text: STATUS: REQUEST FOR EXAMINATION WAS MADE |
|
| 17P | Request for examination filed |
Effective date: 20170830 |
|
| AK | Designated contracting states |
Kind code of ref document: A1 Designated state(s): AL AT BE BG CH CY CZ DE DK EE ES FI FR GB GR HR HU IE IS IT LI LT LU LV MC MK MT NL NO PL PT RO RS SE SI SK SM TR |
|
| AX | Request for extension of the european patent |
Extension state: BA ME |
|
| DAV | Request for validation of the european patent (deleted) | ||
| DAX | Request for extension of the european patent (deleted) | ||
| REG | Reference to a national code |
Ref country code: DE Ref legal event code: R079 Ref document number: 602015065095 Country of ref document: DE Free format text: PREVIOUS MAIN CLASS: H04N0021266200 Ipc: H04L0029060000 |
|
| A4 | Supplementary search report drawn up and despatched |
Effective date: 20180824 |
|
| RIC1 | Information provided on ipc code assigned before grant |
Ipc: H04L 12/70 20130101ALI20180820BHEP Ipc: H04N 21/2662 20110101ALI20180820BHEP Ipc: G06F 13/00 20060101ALI20180820BHEP Ipc: H04N 21/6379 20110101ALI20180820BHEP Ipc: H04L 29/06 20060101AFI20180820BHEP Ipc: H04L 12/811 20130101ALI20180820BHEP |
|
| STAA | Information on the status of an ep patent application or granted ep patent |
Free format text: STATUS: EXAMINATION IS IN PROGRESS |
|
| 17Q | First examination report despatched |
Effective date: 20190516 |
|
| GRAP | Despatch of communication of intention to grant a patent |
Free format text: ORIGINAL CODE: EPIDOSNIGR1 |
|
| STAA | Information on the status of an ep patent application or granted ep patent |
Free format text: STATUS: GRANT OF PATENT IS INTENDED |
|
| INTG | Intention to grant announced |
Effective date: 20200707 |
|
| GRAS | Grant fee paid |
Free format text: ORIGINAL CODE: EPIDOSNIGR3 |
|
| GRAA | (expected) grant |
Free format text: ORIGINAL CODE: 0009210 |
|
| STAA | Information on the status of an ep patent application or granted ep patent |
Free format text: STATUS: THE PATENT HAS BEEN GRANTED |
|
| AK | Designated contracting states |
Kind code of ref document: B1 Designated state(s): AL AT BE BG CH CY CZ DE DK EE ES FI FR GB GR HR HU IE IS IT LI LT LU LV MC MK MT NL NO PL PT RO RS SE SI SK SM TR |
|
| REG | Reference to a national code |
Ref country code: GB Ref legal event code: FG4D |
|
| REG | Reference to a national code |
Ref country code: CH Ref legal event code: EP |
|
| REG | Reference to a national code |
Ref country code: DE Ref legal event code: R096 Ref document number: 602015065095 Country of ref document: DE |
|
| REG | Reference to a national code |
Ref country code: AT Ref legal event code: REF Ref document number: 1357322 Country of ref document: AT Kind code of ref document: T Effective date: 20210215 |
|
| REG | Reference to a national code |
Ref country code: IE Ref legal event code: FG4D |
|
| REG | Reference to a national code |
Ref country code: NL Ref legal event code: MP Effective date: 20210120 |
|
| REG | Reference to a national code |
Ref country code: LT Ref legal event code: MG9D |
|
| REG | Reference to a national code |
Ref country code: AT Ref legal event code: MK05 Ref document number: 1357322 Country of ref document: AT Kind code of ref document: T Effective date: 20210120 |
|
| PG25 | Lapsed in a contracting state [announced via postgrant information from national office to epo] |
Ref country code: PT Free format text: LAPSE BECAUSE OF FAILURE TO SUBMIT A TRANSLATION OF THE DESCRIPTION OR TO PAY THE FEE WITHIN THE PRESCRIBED TIME-LIMIT Effective date: 20210520 Ref country code: NO Free format text: LAPSE BECAUSE OF FAILURE TO SUBMIT A TRANSLATION OF THE DESCRIPTION OR TO PAY THE FEE WITHIN THE PRESCRIBED TIME-LIMIT Effective date: 20210420 Ref country code: BG Free format text: LAPSE BECAUSE OF FAILURE TO SUBMIT A TRANSLATION OF THE DESCRIPTION OR TO PAY THE FEE WITHIN THE PRESCRIBED TIME-LIMIT Effective date: 20210420 Ref country code: HR Free format text: LAPSE BECAUSE OF FAILURE TO SUBMIT A TRANSLATION OF THE DESCRIPTION OR TO PAY THE FEE WITHIN THE PRESCRIBED TIME-LIMIT Effective date: 20210120 Ref country code: FI Free format text: LAPSE BECAUSE OF FAILURE TO SUBMIT A TRANSLATION OF THE DESCRIPTION OR TO PAY THE FEE WITHIN THE PRESCRIBED TIME-LIMIT Effective date: 20210120 Ref country code: GR Free format text: LAPSE BECAUSE OF FAILURE TO SUBMIT A TRANSLATION OF THE DESCRIPTION OR TO PAY THE FEE WITHIN THE PRESCRIBED TIME-LIMIT Effective date: 20210421 Ref country code: LT Free format text: LAPSE BECAUSE OF FAILURE TO SUBMIT A TRANSLATION OF THE DESCRIPTION OR TO PAY THE FEE WITHIN THE PRESCRIBED TIME-LIMIT Effective date: 20210120 |
|
| PG25 | Lapsed in a contracting state [announced via postgrant information from national office to epo] |
Ref country code: SE Free format text: LAPSE BECAUSE OF FAILURE TO SUBMIT A TRANSLATION OF THE DESCRIPTION OR TO PAY THE FEE WITHIN THE PRESCRIBED TIME-LIMIT Effective date: 20210120 Ref country code: LV Free format text: LAPSE BECAUSE OF FAILURE TO SUBMIT A TRANSLATION OF THE DESCRIPTION OR TO PAY THE FEE WITHIN THE PRESCRIBED TIME-LIMIT Effective date: 20210120 Ref country code: RS Free format text: LAPSE BECAUSE OF FAILURE TO SUBMIT A TRANSLATION OF THE DESCRIPTION OR TO PAY THE FEE WITHIN THE PRESCRIBED TIME-LIMIT Effective date: 20210120 Ref country code: PL Free format text: LAPSE BECAUSE OF FAILURE TO SUBMIT A TRANSLATION OF THE DESCRIPTION OR TO PAY THE FEE WITHIN THE PRESCRIBED TIME-LIMIT Effective date: 20210120 Ref country code: AT Free format text: LAPSE BECAUSE OF FAILURE TO SUBMIT A TRANSLATION OF THE DESCRIPTION OR TO PAY THE FEE WITHIN THE PRESCRIBED TIME-LIMIT Effective date: 20210120 |
|
| PG25 | Lapsed in a contracting state [announced via postgrant information from national office to epo] |
Ref country code: IS Free format text: LAPSE BECAUSE OF FAILURE TO SUBMIT A TRANSLATION OF THE DESCRIPTION OR TO PAY THE FEE WITHIN THE PRESCRIBED TIME-LIMIT Effective date: 20210520 |
|
| REG | Reference to a national code |
Ref country code: DE Ref legal event code: R097 Ref document number: 602015065095 Country of ref document: DE |
|
| PG25 | Lapsed in a contracting state [announced via postgrant information from national office to epo] |
Ref country code: SM Free format text: LAPSE BECAUSE OF FAILURE TO SUBMIT A TRANSLATION OF THE DESCRIPTION OR TO PAY THE FEE WITHIN THE PRESCRIBED TIME-LIMIT Effective date: 20210120 Ref country code: EE Free format text: LAPSE BECAUSE OF FAILURE TO SUBMIT A TRANSLATION OF THE DESCRIPTION OR TO PAY THE FEE WITHIN THE PRESCRIBED TIME-LIMIT Effective date: 20210120 Ref country code: CZ Free format text: LAPSE BECAUSE OF FAILURE TO SUBMIT A TRANSLATION OF THE DESCRIPTION OR TO PAY THE FEE WITHIN THE PRESCRIBED TIME-LIMIT Effective date: 20210120 |
|
| PLBE | No opposition filed within time limit |
Free format text: ORIGINAL CODE: 0009261 |
|
| REG | Reference to a national code |
Ref country code: DE Ref legal event code: R079 Ref document number: 602015065095 Country of ref document: DE Free format text: PREVIOUS MAIN CLASS: H04L0029060000 Ipc: H04L0065000000 |
|
| STAA | Information on the status of an ep patent application or granted ep patent |
Free format text: STATUS: NO OPPOSITION FILED WITHIN TIME LIMIT |
|
| PG25 | Lapsed in a contracting state [announced via postgrant information from national office to epo] |
Ref country code: DK Free format text: LAPSE BECAUSE OF FAILURE TO SUBMIT A TRANSLATION OF THE DESCRIPTION OR TO PAY THE FEE WITHIN THE PRESCRIBED TIME-LIMIT Effective date: 20210120 Ref country code: RO Free format text: LAPSE BECAUSE OF FAILURE TO SUBMIT A TRANSLATION OF THE DESCRIPTION OR TO PAY THE FEE WITHIN THE PRESCRIBED TIME-LIMIT Effective date: 20210120 Ref country code: SK Free format text: LAPSE BECAUSE OF FAILURE TO SUBMIT A TRANSLATION OF THE DESCRIPTION OR TO PAY THE FEE WITHIN THE PRESCRIBED TIME-LIMIT Effective date: 20210120 |
|
| 26N | No opposition filed |
Effective date: 20211021 |
|
| PG25 | Lapsed in a contracting state [announced via postgrant information from national office to epo] |
Ref country code: AL Free format text: LAPSE BECAUSE OF FAILURE TO SUBMIT A TRANSLATION OF THE DESCRIPTION OR TO PAY THE FEE WITHIN THE PRESCRIBED TIME-LIMIT Effective date: 20210120 Ref country code: ES Free format text: LAPSE BECAUSE OF FAILURE TO SUBMIT A TRANSLATION OF THE DESCRIPTION OR TO PAY THE FEE WITHIN THE PRESCRIBED TIME-LIMIT Effective date: 20210120 |
|
| PG25 | Lapsed in a contracting state [announced via postgrant information from national office to epo] |
Ref country code: SI Free format text: LAPSE BECAUSE OF FAILURE TO SUBMIT A TRANSLATION OF THE DESCRIPTION OR TO PAY THE FEE WITHIN THE PRESCRIBED TIME-LIMIT Effective date: 20210120 |
|
| PG25 | Lapsed in a contracting state [announced via postgrant information from national office to epo] |
Ref country code: IT Free format text: LAPSE BECAUSE OF FAILURE TO SUBMIT A TRANSLATION OF THE DESCRIPTION OR TO PAY THE FEE WITHIN THE PRESCRIBED TIME-LIMIT Effective date: 20210120 |
|
| PG25 | Lapsed in a contracting state [announced via postgrant information from national office to epo] |
Ref country code: IS Free format text: LAPSE BECAUSE OF FAILURE TO SUBMIT A TRANSLATION OF THE DESCRIPTION OR TO PAY THE FEE WITHIN THE PRESCRIBED TIME-LIMIT Effective date: 20210520 |
|
| PG25 | Lapsed in a contracting state [announced via postgrant information from national office to epo] |
Ref country code: MC Free format text: LAPSE BECAUSE OF FAILURE TO SUBMIT A TRANSLATION OF THE DESCRIPTION OR TO PAY THE FEE WITHIN THE PRESCRIBED TIME-LIMIT Effective date: 20210120 |
|
| REG | Reference to a national code |
Ref country code: CH Ref legal event code: PL |
|
| REG | Reference to a national code |
Ref country code: BE Ref legal event code: MM Effective date: 20211231 |
|
| PG25 | Lapsed in a contracting state [announced via postgrant information from national office to epo] |
Ref country code: LU Free format text: LAPSE BECAUSE OF NON-PAYMENT OF DUE FEES Effective date: 20211224 Ref country code: IE Free format text: LAPSE BECAUSE OF NON-PAYMENT OF DUE FEES Effective date: 20211224 |
|
| PG25 | Lapsed in a contracting state [announced via postgrant information from national office to epo] |
Ref country code: BE Free format text: LAPSE BECAUSE OF NON-PAYMENT OF DUE FEES Effective date: 20211231 |
|
| PG25 | Lapsed in a contracting state [announced via postgrant information from national office to epo] |
Ref country code: LI Free format text: LAPSE BECAUSE OF NON-PAYMENT OF DUE FEES Effective date: 20211231 Ref country code: CH Free format text: LAPSE BECAUSE OF NON-PAYMENT OF DUE FEES Effective date: 20211231 |
|
| PG25 | Lapsed in a contracting state [announced via postgrant information from national office to epo] |
Ref country code: HU Free format text: LAPSE BECAUSE OF FAILURE TO SUBMIT A TRANSLATION OF THE DESCRIPTION OR TO PAY THE FEE WITHIN THE PRESCRIBED TIME-LIMIT; INVALID AB INITIO Effective date: 20151224 |
|
| PG25 | Lapsed in a contracting state [announced via postgrant information from national office to epo] |
Ref country code: NL Free format text: LAPSE BECAUSE OF NON-PAYMENT OF DUE FEES Effective date: 20210120 Ref country code: CY Free format text: LAPSE BECAUSE OF FAILURE TO SUBMIT A TRANSLATION OF THE DESCRIPTION OR TO PAY THE FEE WITHIN THE PRESCRIBED TIME-LIMIT Effective date: 20210120 |
|
| PG25 | Lapsed in a contracting state [announced via postgrant information from national office to epo] |
Ref country code: MK Free format text: LAPSE BECAUSE OF FAILURE TO SUBMIT A TRANSLATION OF THE DESCRIPTION OR TO PAY THE FEE WITHIN THE PRESCRIBED TIME-LIMIT Effective date: 20210120 |
|
| PG25 | Lapsed in a contracting state [announced via postgrant information from national office to epo] |
Ref country code: TR Free format text: LAPSE BECAUSE OF FAILURE TO SUBMIT A TRANSLATION OF THE DESCRIPTION OR TO PAY THE FEE WITHIN THE PRESCRIBED TIME-LIMIT Effective date: 20210120 |
|
| PG25 | Lapsed in a contracting state [announced via postgrant information from national office to epo] |
Ref country code: MT Free format text: LAPSE BECAUSE OF FAILURE TO SUBMIT A TRANSLATION OF THE DESCRIPTION OR TO PAY THE FEE WITHIN THE PRESCRIBED TIME-LIMIT Effective date: 20210120 |
|
| PGFP | Annual fee paid to national office [announced via postgrant information from national office to epo] |
Ref country code: DE Payment date: 20251211 Year of fee payment: 11 |
|
| PGFP | Annual fee paid to national office [announced via postgrant information from national office to epo] |
Ref country code: GB Payment date: 20251219 Year of fee payment: 11 |
|
| PGFP | Annual fee paid to national office [announced via postgrant information from national office to epo] |
Ref country code: FR Payment date: 20251229 Year of fee payment: 11 |
|
| REG | Reference to a national code |
Ref country code: DE Ref legal event code: R081 Ref document number: 602015065095 Country of ref document: DE Owner name: NTT, INC., JP Free format text: FORMER OWNER: NIPPON TELEGRAPH AND TELEPHONE CORPORATION, TOKYO, JP Ref country code: DE Ref legal event code: R082 Ref document number: 602015065095 Country of ref document: DE Representative=s name: DENNEMEYER & ASSOCIATES RECHTSANWALTSGESELLSCH, DE |