EP3255411A1 - Gas analyzing method and gas analyzing device - Google Patents
Gas analyzing method and gas analyzing device Download PDFInfo
- Publication number
- EP3255411A1 EP3255411A1 EP15881155.4A EP15881155A EP3255411A1 EP 3255411 A1 EP3255411 A1 EP 3255411A1 EP 15881155 A EP15881155 A EP 15881155A EP 3255411 A1 EP3255411 A1 EP 3255411A1
- Authority
- EP
- European Patent Office
- Prior art keywords
- gas
- sample
- infrared light
- signal value
- intensity
- Prior art date
- Legal status (The legal status is an assumption and is not a legal conclusion. Google has not performed a legal analysis and makes no representation as to the accuracy of the status listed.)
- Withdrawn
Links
Images





Classifications
-
- G—PHYSICS
- G01—MEASURING; TESTING
- G01N—INVESTIGATING OR ANALYSING MATERIALS BY DETERMINING THEIR CHEMICAL OR PHYSICAL PROPERTIES
- G01N21/00—Investigating or analysing materials by the use of optical means, i.e. using sub-millimetre waves, infrared, visible or ultraviolet light
- G01N21/17—Systems in which incident light is modified in accordance with the properties of the material investigated
- G01N21/25—Colour; Spectral properties, i.e. comparison of effect of material on the light at two or more different wavelengths or wavelength bands
- G01N21/31—Investigating relative effect of material at wavelengths characteristic of specific elements or molecules, e.g. atomic absorption spectrometry
- G01N21/35—Investigating relative effect of material at wavelengths characteristic of specific elements or molecules, e.g. atomic absorption spectrometry using infrared light
- G01N21/3504—Investigating relative effect of material at wavelengths characteristic of specific elements or molecules, e.g. atomic absorption spectrometry using infrared light for analysing gases, e.g. multi-gas analysis
-
- G—PHYSICS
- G01—MEASURING; TESTING
- G01N—INVESTIGATING OR ANALYSING MATERIALS BY DETERMINING THEIR CHEMICAL OR PHYSICAL PROPERTIES
- G01N21/00—Investigating or analysing materials by the use of optical means, i.e. using sub-millimetre waves, infrared, visible or ultraviolet light
- G01N21/17—Systems in which incident light is modified in accordance with the properties of the material investigated
- G01N21/25—Colour; Spectral properties, i.e. comparison of effect of material on the light at two or more different wavelengths or wavelength bands
- G01N21/31—Investigating relative effect of material at wavelengths characteristic of specific elements or molecules, e.g. atomic absorption spectrometry
- G01N21/39—Investigating relative effect of material at wavelengths characteristic of specific elements or molecules, e.g. atomic absorption spectrometry using tunable lasers
-
- G—PHYSICS
- G01—MEASURING; TESTING
- G01N—INVESTIGATING OR ANALYSING MATERIALS BY DETERMINING THEIR CHEMICAL OR PHYSICAL PROPERTIES
- G01N33/00—Investigating or analysing materials by specific methods not covered by groups G01N1/00 - G01N31/00
- G01N33/48—Biological material, e.g. blood, urine; Haemocytometers
- G01N33/483—Physical analysis of biological material
- G01N33/497—Physical analysis of biological material of gaseous biological material, e.g. breath
-
- G—PHYSICS
- G01—MEASURING; TESTING
- G01N—INVESTIGATING OR ANALYSING MATERIALS BY DETERMINING THEIR CHEMICAL OR PHYSICAL PROPERTIES
- G01N21/00—Investigating or analysing materials by the use of optical means, i.e. using sub-millimetre waves, infrared, visible or ultraviolet light
- G01N21/17—Systems in which incident light is modified in accordance with the properties of the material investigated
- G01N21/25—Colour; Spectral properties, i.e. comparison of effect of material on the light at two or more different wavelengths or wavelength bands
- G01N21/31—Investigating relative effect of material at wavelengths characteristic of specific elements or molecules, e.g. atomic absorption spectrometry
- G01N21/39—Investigating relative effect of material at wavelengths characteristic of specific elements or molecules, e.g. atomic absorption spectrometry using tunable lasers
- G01N2021/396—Type of laser source
- G01N2021/399—Diode laser
-
- G—PHYSICS
- G01—MEASURING; TESTING
- G01N—INVESTIGATING OR ANALYSING MATERIALS BY DETERMINING THEIR CHEMICAL OR PHYSICAL PROPERTIES
- G01N2201/00—Features of devices classified in G01N21/00
- G01N2201/12—Circuits of general importance; Signal processing
- G01N2201/13—Standards, constitution
Definitions
- This invention relates to a gas analysis method and a gas analysis device.
- the laser device emitting infrared light is applied to a gas analysis device.
- gases absorb infrared radiation in accordance with their intrinsic absorption spectra.
- the absorbance depends on gas concentration.
- the absorbance can be determined by measuring transmitted light intensity with respect to the incident light intensity of infrared light.
- the concentration of a gas can be determined by measuring the transmission intensity of infrared light in the gas.
- the amount of e.g. CO 2 , NO 2 , NH 3 , acetone, and methane contained therein is very small.
- it is required to improve the accuracy of gas concentration measurement.
- Patent Document 1 JP 4108297 B2
- An object of the invention is to provide a gas analysis method and a gas analysis device that can measure gas concentration with high accuracy.
- a gas analysis method includes irradiating a sample gas introduced into a gas cell with infrared light tuned to a wavelength corresponding to one absorption line of a target gas contained in the sample gas, measuring a sample signal value corresponding to intensity of transmitted light of the infrared light transmitted through the gas cell, evacuating the sample gas in the gas cell and then replacing by a reference gas, measuring a reference signal value corresponding to intensity of transmitted light of the infrared light transmitted through the reference gas, and calculating gas concentration at the one absorption line from ratio of the sample signal value to the reference signal value.
- FIG. 1 is a configuration view of a gas analysis device according to this embodiment.
- the gas analysis device 5 includes a light source 10, a gas cell 20, a detection section 40, and a control section 50.
- the light source 10 emits infrared light G.
- the wavelength of the infrared light G can be tuned to an absorption line of the target gas contained in the sample gas SG.
- the light source 10 may be e.g. a QCL (quantum cascade laser), semiconductor laser, or VCSEL (vertical cavity surface emitting laser).
- the infrared light G can be laser light having high optical density.
- the wavelength of the infrared light G may be set to e.g. 3-12 ⁇ m. This enables measurement of the concentration of many organic gases and inorganic gases.
- the gas cell 20 has an introduction port 22 and an ejection port 26.
- a reference gas RG and a sample gas SG are selectively introduced into the gas cell 20.
- a vacuum pump 26 may be provided outside the ejection port 24. Then, the gas can be switched rapidly.
- the gas cell 20 includes an incoming section 30 and an outgoing section 32.
- the incoming section 30 is irradiated with infrared light corresponding to a first absorption line among the absorption lines of one gas.
- the infrared light travels out of the outgoing section 32.
- the detection section 40 detects a sample signal value corresponding to the transmitted light intensity I of the sample gas SG with respect to the reference signal value corresponding to the transmitted light intensity IO of the reference gas RG.
- the reference gas RG has sufficiently low optical absorption.
- the detection section 40 can be e.g. a cooled detector (made of MCT (HgCdTe)) or photodiode.
- the control section 50 selects a gas introduction sequence so as to measure the sample signal value earlier than the reference signal value at the first absorption line.
- the control section 50 calculates the gas concentration c at one absorption line from the ratio of the sample signal value to the reference signal value.
- Concave mirrors 28, 29 opposed to each other can be placed in the gas cell 20. This provides a multipath configuration and can substantially lengthen the optical length L of the infrared light G. Thus, the absorbance A can be improved by equation (1).
- FIG. 2 is a flow chart of a gas analysis method according to a first embodiment.
- the gas analysis device of the embodiment shown in FIG. 1 can analyze various gases such as environmental gas, H 2 O, chemical substances, and biogas.
- gases such as environmental gas, H 2 O, chemical substances, and biogas.
- This figure illustrates an example in which the sample gas SG is human expired breath. It is understood that the sample gas SG is not limited to expired breath.
- the gas analysis device is switched on.
- the light source 10 can be switched on.
- Step S200 includes the step of introducing a sample gas SG, tuning the wavelength of infrared light to one of the absorption lines of the sample gas SG, irradiating the sample gas SG with the infrared light, and measuring the transmitted light intensity I.
- the target sample gas SG contains a plurality of gas components
- the sample signal value is measured at a plurality of absorption lines.
- sample gas SG in the gas cell 20 is replaced by a reference gas RG containing air (S202).
- Step S204 includes the step of tuning the wavelength of infrared light to one of the absorption lines of the sample gas SG, irradiating the reference gas with the infrared light, and measuring the transmitted light intensity I.
- the reference signal value is measured at a plurality of absorption lines.
- the control section 50 calculates the gas concentration c at one absorption line from the ratio of the sample signal value to the reference signal value using e.g. equations (1)-(3) (S206).
- step S200 When another sample gas SG is measured (yes), the flow returns to step S200. In this case, the gas cell 20 has been filled with the reference gas RG. Thus, the degree of contamination therein is low. This enables introduction of a sample gas SG in step S200. When another sample gas SG is not measured (no), the measurement is ended.
- measuring a trace amount of CO 2 , NO 2 , NH 3 , acetone, and methane contained in human expired breath facilitates prevention and early detection of various diseases.
- FIG. 3 is a flow chart of a gas analysis method according to a comparative example.
- the gas analysis device is the same as that of FIG. 1 . However, the gas introduction sequence is different.
- the gas remaining in the gas cell 20 is ejected.
- the gas cell 20 is cleaned by introducing e.g. air, and then replaced by a reference gas RG (S300).
- Step S302 includes the step of tuning the wavelength of infrared light to one of the absorption lines of the sample gas SG, irradiating the reference gas RG with the infrared light, and measuring the transmitted light intensity I0.
- the reference signal value is measured at a plurality of absorption lines.
- the gas cell 20 is replaced by a sample gas SG containing air (S304).
- Step S306 includes the step of tuning the wavelength of infrared light to one of the absorption lines of the sample gas SG, irradiating the sample gas SG with the infrared light, and measuring the transmitted light intensity I0.
- the sample signal value is measured at a plurality of absorption lines.
- the control section 50 calculates the gas concentration c at a first absorption line from the ratio of the sample signal value to the reference signal value using e.g. equations (1)-(3) (S308).
- step 300 When another sample gas SG is measured (yes), the flow returns to step 300. In this case, the gas cell 20 is filled with the sample gas for a long time. Thus, the inside of the gas cell 20 is often contaminated. This requires cleaning of step 300. Thus, the measurement time is longer compared with the first gas analysis method. When another sample gas SG is not measured (no), the measurement is ended.
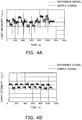
- FIG. 4A is a graph showing the light intensity waveform in the comparative example.
- FIG. 4B is a graph showing the light intensity waveform in the first embodiment.
- both the reference signal value indicated by the dashed line and the sample signal value indicated by the solid line have large temporal variation.
- the variation of the ratio between the two signal values is large and decreases the measurement accuracy.
- both the reference signal value indicated by the dashed line and the sample signal value indicated by the solid line have small change and are stable.
- the change of the ratio between the two signal values is also reduced. Accordingly, the measurement accuracy can be improved.
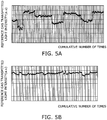
- FIG. 5A is a graph showing the dependence of reference gas transmitted light intensity on the cumulative number of times in the comparative example.
- FIG. 5B is a graph showing the dependence of reference gas transmitted light intensity on the cumulative number of times in the first embodiment.
- FIGS. 5A and 5B show the result of measuring the light intensity of light transmitted through the reference gas when the gas analysis device is operated for approximately eight days.
- the gas cell 20 is filled with the sample gas during the period when the gas analysis device does not perform measurement.
- the change of the light intensity of infrared light transmitted through the reference gas is large.
- the change of light intensity becomes large particularly when no measurement is performed for a long time.
- the inside of the gas cell 20 is filled with the reference gas such as air at the end of one measurement cycle.
- the reference gas such as air at the end of one measurement cycle.
- FIG. 6 shows a first variation of the gas analysis device of this embodiment.
- the gas analysis device includes a light source 10, a gas cell 20, a detection section 40, a control section 50, and an adsorption column 54.
- the adsorption column 54 is provided in the path for introducing the reference gas RG such as air.
- the adsorption column 54 can be e.g. a filter containing an impurity adsorbent material.
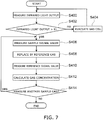
- FIG. 7 is a flow chart of a gas analysis method according to a second embodiment.
- the second embodiment first, it is determined whether the light intensity of infrared light is higher than a prescribed value.
- the gas measurement device is switched on. Then, the light intensity of infrared light is measured (S400) before introducing a sample gas SG into the gas cell 20.
- Step 406 when the light intensity of infrared light is less than or equal to the prescribed value E1, the gas cell 20 is evacuated and cleaned (S404). If the transmitted light I 0 of infrared light is higher than the prescribed value E1, the degree of contamination in the gas cell 20 can be considered to be low. Thus, the measurement of the sample signal value in step 406 is performed (S406). Step 406 and the subsequent steps are identical to step 200 and the subsequent steps of the first embodiment.
- the prescribed value E1 can be set by determining the average of the relative transmitted light intensity of the reference gas represented on the vertical axis of FIG. 5B .
- the prescribed value E1 can be set to e.g. approximately 95% of this average.
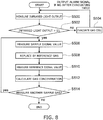
- FIG. 8 is a flow chart of a gas analysis method according to a third embodiment.
- the light intensity of infrared light may be less than or equal to the prescribed value E1 even after repeating evacuation and cleaning in the gas cell 20 a plurality of times (e.g., twice). Then, an alarm signal for e.g. requesting exchange of the adsorption column 54 can be outputted.
- Step 506 and the subsequent steps are identical to step 200 and the subsequent steps of the first embodiment. This dispenses with spending wasteful time for evacuation and cleaning.
- FIG. 9 is a flow chart showing an alternative example of the sequence for outputting an alarm signal.
- the light intensity of infrared light may be less than or equal to the prescribed value E1 (S600).
- E1 the prescribed value
- an alarm signal for requesting exchange of the adsorption column 54 is outputted (S622).
- evacuation is performed after exchanging the adsorption column 54 (S604).
- an alarm signal is further outputted.
- the light intensity of infrared light may become higher than the prescribed value. Then, measurement of the sample gas SG and the reference gas RG is performed (S620). After the measurement, the gas cell 20 is filled with the reference gas RG. In this state, it is determined whether the light intensity is less than or equal to the prescribed value E1. Then, steps 622-626 can be performed as necessary.
- FIG. 10 is a configuration view of measuring the gas concentration off-line.
- the sample gas SG is expired breath. By opening the valve 82, the sample gas SG is temporarily stored in the sampling bag 80.
- the capacity of the sampling bag can be set to e.g. 150 liters.
- the reference gas RG passes through the adsorption column 54 and is introduced into the gas analysis device 5 by the switching valve 84. Thus, gas analysis can be performed off-line.
- the present embodiments provide a gas analysis method and a gas analysis device capable of measuring the gas concentration with high accuracy. For instance, measuring the concentration of a trace amount of gas contained in expired breath facilitates prevention and early detection of various diseases.
Landscapes
- Physics & Mathematics (AREA)
- Health & Medical Sciences (AREA)
- Life Sciences & Earth Sciences (AREA)
- Chemical & Material Sciences (AREA)
- Spectroscopy & Molecular Physics (AREA)
- Engineering & Computer Science (AREA)
- Immunology (AREA)
- General Health & Medical Sciences (AREA)
- General Physics & Mathematics (AREA)
- Analytical Chemistry (AREA)
- Pathology (AREA)
- Biochemistry (AREA)
- Biomedical Technology (AREA)
- Molecular Biology (AREA)
- Hematology (AREA)
- Biophysics (AREA)
- Urology & Nephrology (AREA)
- Food Science & Technology (AREA)
- Medicinal Chemistry (AREA)
- Optics & Photonics (AREA)
- Investigating Or Analysing Materials By Optical Means (AREA)
Abstract
Description
- This invention relates to a gas analysis method and a gas analysis device.
- The laser device emitting infrared light is applied to a gas analysis device.
- Most gases absorb infrared radiation in accordance with their intrinsic absorption spectra. The absorbance depends on gas concentration. The absorbance can be determined by measuring transmitted light intensity with respect to the incident light intensity of infrared light. Thus, the concentration of a gas can be determined by measuring the transmission intensity of infrared light in the gas.
- For instance, when the gas is expired breath, the amount of e.g. CO2, NO2, NH3, acetone, and methane contained therein is very small. Thus, it is required to improve the accuracy of gas concentration measurement.
- [Patent Document 1]
JP 4108297 B2 - An object of the invention is to provide a gas analysis method and a gas analysis device that can measure gas concentration with high accuracy.
- According to one embodiment, a gas analysis method includes irradiating a sample gas introduced into a gas cell with infrared light tuned to a wavelength corresponding to one absorption line of a target gas contained in the sample gas, measuring a sample signal value corresponding to intensity of transmitted light of the infrared light transmitted through the gas cell, evacuating the sample gas in the gas cell and then replacing by a reference gas, measuring a reference signal value corresponding to intensity of transmitted light of the infrared light transmitted through the reference gas, and calculating gas concentration at the one absorption line from ratio of the sample signal value to the reference signal value.
-
- [
FIG. 1] FIG. 1 is a configuration view of a gas analysis device according to this embodiment. - [
FIG. 2] FIG. 2 is a flow chart of a gas analysis method according to a first embodiment. - [
FIG. 3] FIG. 3 is a flow chart of a gas analysis method according to a comparative example. - [
FIG. 4] FIG. 4A is a graph showing the light intensity waveform in the comparative example.FIG. 4B is a graph showing the light intensity waveform in the first embodiment. - [
FIG. 5] FIG. 5A is a graph showing the dependence of reference gas transmitted light intensity on the cumulative number of times in the comparative example.FIG. 5B is a graph showing the dependence of reference gas transmitted light intensity on the cumulative number of times in the first embodiment. - [
FIG. 6] FIG. 6 shows a first variation of the gas analysis device of this embodiment. - [
FIG. 7] FIG. 7 is a flow chart of a gas analysis method according to a second embodiment. - [
FIG. 8] FIG. 8 is a flow chart of a gas analysis method according to a third embodiment. - [
FIG. 9] FIG. 9 is a flow chart showing an alternative example of the sequence for outputting an alarm signal. - [
FIG. 10] FIG. 10 is a configuration view of measuring the gas concentration off-line. - Embodiments of the invention will now be described with reference to the drawings.
-
FIG. 1 is a configuration view of a gas analysis device according to this embodiment. - The
gas analysis device 5 includes alight source 10, agas cell 20, adetection section 40, and acontrol section 50. - The
light source 10 emits infrared light G. The wavelength of the infrared light G can be tuned to an absorption line of the target gas contained in the sample gas SG. Thelight source 10 may be e.g. a QCL (quantum cascade laser), semiconductor laser, or VCSEL (vertical cavity surface emitting laser). Then, the infrared light G can be laser light having high optical density. The wavelength of the infrared light G may be set to e.g. 3-12 µm. This enables measurement of the concentration of many organic gases and inorganic gases. - The
gas cell 20 has anintroduction port 22 and anejection port 26. A reference gas RG and a sample gas SG are selectively introduced into thegas cell 20. Avacuum pump 26 may be provided outside theejection port 24. Then, the gas can be switched rapidly. - The
gas cell 20 includes anincoming section 30 and anoutgoing section 32. Theincoming section 30 is irradiated with infrared light corresponding to a first absorption line among the absorption lines of one gas. The infrared light travels out of theoutgoing section 32. - The
detection section 40 detects a sample signal value corresponding to the transmitted light intensity I of the sample gas SG with respect to the reference signal value corresponding to the transmitted light intensity IO of the reference gas RG. The reference gas RG has sufficiently low optical absorption. Thedetection section 40 can be e.g. a cooled detector (made of MCT (HgCdTe)) or photodiode. - The
control section 50 selects a gas introduction sequence so as to measure the sample signal value earlier than the reference signal value at the first absorption line. Thecontrol section 50 calculates the gas concentration c at one absorption line from the ratio of the sample signal value to the reference signal value. - The absorbance A is given by equation (1).

- where A: Absorbance
- IO: Incident Light Intensity
- I: Transmitted Light Intensity
- T (=I/IO): Transmittance
- α: Absorption Coefficient
- L: Optical Length
- The absorption coefficient α is given by equation (2).

- where c: Gas Concentration
- ε: Molar Absorption Coefficient
- The gas concentration c can be calculated from equation (3).

- Concave mirrors 28, 29 opposed to each other can be placed in the
gas cell 20. This provides a multipath configuration and can substantially lengthen the optical length L of the infrared light G. Thus, the absorbance A can be improved by equation (1). -
FIG. 2 is a flow chart of a gas analysis method according to a first embodiment. - The gas analysis device of the embodiment shown in
FIG. 1 can analyze various gases such as environmental gas, H2O, chemical substances, and biogas. This figure illustrates an example in which the sample gas SG is human expired breath. It is understood that the sample gas SG is not limited to expired breath. - First, the gas analysis device is switched on. In this case, the
light source 10 can be switched on. - Next, a sample signal value is measured (S200). Step S200 includes the step of introducing a sample gas SG, tuning the wavelength of infrared light to one of the absorption lines of the sample gas SG, irradiating the sample gas SG with the infrared light, and measuring the transmitted light intensity I. When the target sample gas SG contains a plurality of gas components, the sample signal value is measured at a plurality of absorption lines.
- Next, the sample gas SG in the
gas cell 20 is replaced by a reference gas RG containing air (S202). - Next, a reference signal vale is measured (S204). Step S204 includes the step of tuning the wavelength of infrared light to one of the absorption lines of the sample gas SG, irradiating the reference gas with the infrared light, and measuring the transmitted light intensity I. When the target sample gas SG contains a plurality of gas components, the reference signal value is measured at a plurality of absorption lines.
- The
control section 50 calculates the gas concentration c at one absorption line from the ratio of the sample signal value to the reference signal value using e.g. equations (1)-(3) (S206). - When another sample gas SG is measured (yes), the flow returns to step S200. In this case, the
gas cell 20 has been filled with the reference gas RG. Thus, the degree of contamination therein is low. This enables introduction of a sample gas SG in step S200. When another sample gas SG is not measured (no), the measurement is ended. - For instance, measuring a trace amount of CO2, NO2, NH3, acetone, and methane contained in human expired breath facilitates prevention and early detection of various diseases.
-
FIG. 3 is a flow chart of a gas analysis method according to a comparative example. - The gas analysis device is the same as that of
FIG. 1 . However, the gas introduction sequence is different. - First, the gas remaining in the
gas cell 20 is ejected. Thegas cell 20 is cleaned by introducing e.g. air, and then replaced by a reference gas RG (S300). - Next, a reference signal vale is measured (S302). Step S302 includes the step of tuning the wavelength of infrared light to one of the absorption lines of the sample gas SG, irradiating the reference gas RG with the infrared light, and measuring the transmitted light intensity I0. When the target sample gas SG contains a plurality of gas components, the reference signal value is measured at a plurality of absorption lines.
- Next, the
gas cell 20 is replaced by a sample gas SG containing air (S304). - Next, a sample signal value is measured (S306). Step S306 includes the step of tuning the wavelength of infrared light to one of the absorption lines of the sample gas SG, irradiating the sample gas SG with the infrared light, and measuring the transmitted light intensity I0. When the target sample gas SG contains a plurality of gas components, the sample signal value is measured at a plurality of absorption lines.
- The
control section 50 calculates the gas concentration c at a first absorption line from the ratio of the sample signal value to the reference signal value using e.g. equations (1)-(3) (S308). - When another sample gas SG is measured (yes), the flow returns to step 300. In this case, the
gas cell 20 is filled with the sample gas for a long time. Thus, the inside of thegas cell 20 is often contaminated. This requires cleaning of step 300. Thus, the measurement time is longer compared with the first gas analysis method. When another sample gas SG is not measured (no), the measurement is ended. -
FIG. 4A is a graph showing the light intensity waveform in the comparative example.FIG. 4B is a graph showing the light intensity waveform in the first embodiment. - In the comparative example of
FIG. 4A , both the reference signal value indicated by the dashed line and the sample signal value indicated by the solid line have large temporal variation. Thus, the variation of the ratio between the two signal values is large and decreases the measurement accuracy. On the other hand, in the first embodiment shown inFIG. 4B , both the reference signal value indicated by the dashed line and the sample signal value indicated by the solid line have small change and are stable. Thus, the change of the ratio between the two signal values is also reduced. Accordingly, the measurement accuracy can be improved. -
FIG. 5A is a graph showing the dependence of reference gas transmitted light intensity on the cumulative number of times in the comparative example.FIG. 5B is a graph showing the dependence of reference gas transmitted light intensity on the cumulative number of times in the first embodiment. -
FIGS. 5A and 5B show the result of measuring the light intensity of light transmitted through the reference gas when the gas analysis device is operated for approximately eight days. In the comparative example ofFIG. 5A , thegas cell 20 is filled with the sample gas during the period when the gas analysis device does not perform measurement. Thus, the change of the light intensity of infrared light transmitted through the reference gas is large. The change of light intensity becomes large particularly when no measurement is performed for a long time. On the other hand, in the first embodiment ofFIG. 5B , the inside of thegas cell 20 is filled with the reference gas such as air at the end of one measurement cycle. Thus, even in the operation for approximately eight days, contamination inside thegas cell 20 is suppressed, and the change of light intensity is small. This allows high accuracy measurement even if the next measurement cycle is started with the introduction of the sample gas. -
FIG. 6 shows a first variation of the gas analysis device of this embodiment. - The gas analysis device includes a
light source 10, agas cell 20, adetection section 40, acontrol section 50, and anadsorption column 54. - The
adsorption column 54 is provided in the path for introducing the reference gas RG such as air. Theadsorption column 54 can be e.g. a filter containing an impurity adsorbent material. -
FIG. 7 is a flow chart of a gas analysis method according to a second embodiment. - In the second embodiment, first, it is determined whether the light intensity of infrared light is higher than a prescribed value.
- The gas measurement device is switched on. Then, the light intensity of infrared light is measured (S400) before introducing a sample gas SG into the
gas cell 20. - Next, when the light intensity of infrared light is less than or equal to the prescribed value E1, the
gas cell 20 is evacuated and cleaned (S404). If the transmitted light I0 of infrared light is higher than the prescribed value E1, the degree of contamination in thegas cell 20 can be considered to be low. Thus, the measurement of the sample signal value in step 406 is performed (S406). Step 406 and the subsequent steps are identical to step 200 and the subsequent steps of the first embodiment. - The prescribed value E1 can be set by determining the average of the relative transmitted light intensity of the reference gas represented on the vertical axis of
FIG. 5B . The prescribed value E1 can be set to e.g. approximately 95% of this average. -
FIG. 8 is a flow chart of a gas analysis method according to a third embodiment. - The light intensity of infrared light may be less than or equal to the prescribed value E1 even after repeating evacuation and cleaning in the gas cell 20 a plurality of times (e.g., twice). Then, an alarm signal for e.g. requesting exchange of the
adsorption column 54 can be outputted. Step 506 and the subsequent steps are identical to step 200 and the subsequent steps of the first embodiment. This dispenses with spending wasteful time for evacuation and cleaning. -
FIG. 9 is a flow chart showing an alternative example of the sequence for outputting an alarm signal. - For instance, the light intensity of infrared light may be less than or equal to the prescribed value E1 (S600). When it is less than or equal to the prescribed value E1 even after evacuating the gas cell a prescribed number of times, an alarm signal for requesting exchange of the
adsorption column 54 is outputted (S622). Furthermore, evacuation is performed after exchanging the adsorption column 54 (S604). For instance, when the light intensity is less than or equal to the prescribed value E1 even after evacuation for a prescribed period of time, an alarm signal is further outputted. - The light intensity of infrared light may become higher than the prescribed value. Then, measurement of the sample gas SG and the reference gas RG is performed (S620). After the measurement, the
gas cell 20 is filled with the reference gas RG. In this state, it is determined whether the light intensity is less than or equal to the prescribed value E1. Then, steps 622-626 can be performed as necessary. -
FIG. 10 is a configuration view of measuring the gas concentration off-line. - The sample gas SG is expired breath. By opening the
valve 82, the sample gas SG is temporarily stored in thesampling bag 80. The capacity of the sampling bag can be set to e.g. 150 liters. The reference gas RG passes through theadsorption column 54 and is introduced into thegas analysis device 5 by the switchingvalve 84. Thus, gas analysis can be performed off-line. - The present embodiments provide a gas analysis method and a gas analysis device capable of measuring the gas concentration with high accuracy. For instance, measuring the concentration of a trace amount of gas contained in expired breath facilitates prevention and early detection of various diseases.
- While certain embodiments have been described, these embodiments have been presented by way of example only, and are not intended to limit the scope of the inventions. Indeed, the novel embodiments described herein may be embodied in a variety of other forms; furthermore, various omissions, substitutions and changes in the form of the embodiments described herein may be made without departing from the spirit of the inventions. The accompanying claims and their equivalents are intended to cover such forms or modifications as would fall within the scope and spirit of the invention.
Claims (10)
- A gas analysis method comprising:irradiating a sample gas introduced into a gas cell with infrared light tuned to a wavelength corresponding to one absorption line of a target gas contained in the sample gas;measuring a sample signal value corresponding to intensity of transmitted light of the infrared light transmitted through the gas cell;evacuating the sample gas in the gas cell and then replacing by a reference gas;measuring a reference signal value corresponding to intensity of transmitted light of the infrared light transmitted through the reference gas; andcalculating gas concentration at the one absorption line from ratio of the sample signal value to the reference signal value.
- The method according to claim 1, wherein
light intensity of the infrared light is measured before introducing the sample gas into the gas cell, and
when the intensity of the infrared light is less than or equal to a prescribed value, a control section outputs a signal for cleaning inside of the gas cell. - The method according to claim 2, wherein the reference gas is passed through an adsorption column and then introduced into the gas cell.
- The method according to claim 3, wherein an alarm signal for exchanging the adsorption column is outputted when the intensity of the infrared light does not become higher than the prescribed value even after repeating cleaning the inside of the gas cell a prescribed number of times.
- The method according to claim 1, wherein the infrared light is QCL laser light.
- A gas analysis device comprising:a light source configured to emit infrared light whose wavelength can be tuned to an absorption line of a target gas contained in a sample gas;a gas cell to which either of a reference gas and the sample gas is selectively introduced, the gas cell including an incoming section irradiated with infrared light corresponding to one absorption line, and an outgoing section from which the infrared light travels out;a detection section configured to detect a reference signal value corresponding to intensity of transmitted light of the reference gas and a sample signal value corresponding to intensity of transmitted light of the sample gas; anda control section configured to select a gas introduction sequence so as to measure the sample signal value earlier than the reference signal value at the one absorption line, and to calculate gas concentration at the one absorption line from ratio of the sample signal value to the reference signal value.
- The device according to claim 6, wherein when the detection section detects that the intensity of the transmitted light of the reference gas is less than or equal to a prescribed value, the control section outputs a signal for cleaning inside of the gas cell.
- The device according to claim 7, further comprising:an adsorption column configured to clean the reference gas.
- The device according to claim 8, wherein an alarm signal for exchanging the adsorption column is outputted when the light intensity of the infrared light is less than or equal to the prescribed value even after repeating cleaning the inside of the gas cell a prescribed number of times.
- The device according to claim 6, wherein the infrared light is QCL laser light.
Applications Claiming Priority (2)
| Application Number | Priority Date | Filing Date | Title |
|---|---|---|---|
| JP2015022683 | 2015-02-06 | ||
| PCT/JP2015/076995 WO2016125338A1 (en) | 2015-02-06 | 2015-09-24 | Gas analyzing method and gas analyzing device |
Publications (1)
| Publication Number | Publication Date |
|---|---|
| EP3255411A1 true EP3255411A1 (en) | 2017-12-13 |
Family
ID=56563697
Family Applications (1)
| Application Number | Title | Priority Date | Filing Date |
|---|---|---|---|
| EP15881155.4A Withdrawn EP3255411A1 (en) | 2015-02-06 | 2015-09-24 | Gas analyzing method and gas analyzing device |
Country Status (5)
| Country | Link |
|---|---|
| US (1) | US20170016816A1 (en) |
| EP (1) | EP3255411A1 (en) |
| JP (1) | JPWO2016125338A1 (en) |
| CN (1) | CN106062534A (en) |
| WO (1) | WO2016125338A1 (en) |
Cited By (1)
| Publication number | Priority date | Publication date | Assignee | Title |
|---|---|---|---|---|
| CN113092412A (en) * | 2021-04-13 | 2021-07-09 | 内蒙古光能科技有限公司 | Multi-component trace gas online detection device and method under negative pressure state |
Families Citing this family (7)
| Publication number | Priority date | Publication date | Assignee | Title |
|---|---|---|---|---|
| US9835550B2 (en) | 2015-03-18 | 2017-12-05 | Kabushiki Kaisha Toshiba | Breath analyzer |
| JP2017129374A (en) * | 2016-01-18 | 2017-07-27 | 株式会社堀場製作所 | Analysis device and analysis method |
| KR101840191B1 (en) * | 2016-11-02 | 2018-03-21 | 한국전력공사 | Device for acetylene gas analysis of underground transmission cables and method for acetylene gas analysis |
| KR101846794B1 (en) | 2017-10-18 | 2018-05-18 | (주)세성 | Portable Toxic Gas Measurement System with Implanted GPS Using Cloud Computing and It’s Measuring Methods |
| CN109444064A (en) * | 2018-12-25 | 2019-03-08 | 青岛海纳光电环保有限公司 | Calibrating gas detection device and system |
| CN110132808A (en) * | 2019-04-08 | 2019-08-16 | 中国船舶重工集团公司第七一九研究所 | A kind of thorax mouth smoke density detection method |
| CN113189023A (en) * | 2020-01-14 | 2021-07-30 | 深圳市先亚生物科技有限公司 | Method and system for measuring trace components of expired air by spectroscopy |
Family Cites Families (8)
| Publication number | Priority date | Publication date | Assignee | Title |
|---|---|---|---|---|
| JPS63167254A (en) * | 1986-12-27 | 1988-07-11 | Rikagaku Kenkyusho | Electron counting device |
| JP3402718B2 (en) * | 1993-12-20 | 2003-05-06 | 株式会社堀場製作所 | Fluid modulation gas analysis method |
| JP3041827B2 (en) * | 1995-05-29 | 2000-05-15 | 株式会社島津製作所 | Infrared gas analyzer |
| JP3183165B2 (en) * | 1996-04-30 | 2001-07-03 | 株式会社島津製作所 | Continuous gas analyzer |
| AT408376B (en) * | 1999-04-07 | 2001-11-26 | Lendl Bernhard Dr | METHOD FOR INFRARED-OPTICALLY DETERMINING THE CONCENTRATION OF AT LEAST ONE ANALYTIC IN A LIQUID SAMPLE |
| JP3941679B2 (en) * | 2002-11-28 | 2007-07-04 | 株式会社島津製作所 | Infrared gas analyzer |
| US20090306527A1 (en) * | 2006-02-03 | 2009-12-10 | Yasuhiro Kubo | Method of Exhaled Gas Measurement and Analysis and Apparatus Therefor |
| JP5423496B2 (en) * | 2010-03-15 | 2014-02-19 | 富士電機株式会社 | Laser gas analyzer |
-
2015
- 2015-09-24 EP EP15881155.4A patent/EP3255411A1/en not_active Withdrawn
- 2015-09-24 CN CN201580011732.3A patent/CN106062534A/en active Pending
- 2015-09-24 JP JP2016573172A patent/JPWO2016125338A1/en active Pending
- 2015-09-24 WO PCT/JP2015/076995 patent/WO2016125338A1/en not_active Ceased
- 2015-09-24 US US15/125,092 patent/US20170016816A1/en not_active Abandoned
Non-Patent Citations (1)
| Title |
|---|
| See references of WO2016125338A1 * |
Cited By (1)
| Publication number | Priority date | Publication date | Assignee | Title |
|---|---|---|---|---|
| CN113092412A (en) * | 2021-04-13 | 2021-07-09 | 内蒙古光能科技有限公司 | Multi-component trace gas online detection device and method under negative pressure state |
Also Published As
| Publication number | Publication date |
|---|---|
| JPWO2016125338A1 (en) | 2017-04-27 |
| US20170016816A1 (en) | 2017-01-19 |
| WO2016125338A1 (en) | 2016-08-11 |
| CN106062534A (en) | 2016-10-26 |
Similar Documents
| Publication | Publication Date | Title |
|---|---|---|
| US20170016816A1 (en) | Gas analysis method and gas analysis device | |
| EP1380833B1 (en) | Apparatus for spectrometrically measuring an isotopic gas | |
| EP2630469B1 (en) | Method for determining the concentration of an analyte compound in a sample gas | |
| US7324204B2 (en) | Method and apparatus for trace gas detection | |
| US20100116027A1 (en) | Pressurized detectors substance analyzer | |
| CA2279561C (en) | Gas detector with reference cell | |
| EP3049806B1 (en) | Method and system for gas concentration measurement of gas dissolved in liquids | |
| KR101842799B1 (en) | Method for Computing NDIR Correction Factors and Gas Concentration Measurement Method Using the Computed Correction Factors | |
| US10024749B2 (en) | Method and system for leak rate testing of pressurized containers | |
| JP2012215567A (en) | Non-extractive gas analyzer | |
| JP2010190824A (en) | Absorption spectrometric apparatus for semiconductor manufacturing process | |
| US5835230A (en) | Method for calibration of a spectroscopic sensor | |
| Cossel et al. | Analysis of trace impurities in semiconductor gas via cavity-enhanced direct frequency comb spectroscopy | |
| US20140319352A1 (en) | Long-path infrared spectrometer | |
| US6762410B1 (en) | Analysis apparatus | |
| US6138497A (en) | Method and apparatus for simultaneously measuring CO2, O2 and N2 dissolved in liquid | |
| US9007592B2 (en) | Gas analyzer | |
| KR20230112634A (en) | Gas analysis device and gas analysis method | |
| US20130145813A1 (en) | Method for Measuring the Concentration of at Least One Gas Component in a Measurement Gas | |
| EP4111516B1 (en) | Flow-through protective system of hydrogen fuel receiver and method of protection of hydrogen fuel receiver | |
| JP2004037192A (en) | Photodiode array spectrometer | |
| WO2018222942A1 (en) | Quantum cascade laser trace-gas detection for in-situ monitoring, process control, and automating end-point determination of chamber clean in semiconductor manufacturing | |
| WO2023120231A1 (en) | Analysis device and analysis method | |
| JP2026026714A (en) | CO2 gas sensor | |
| KR20250071482A (en) | Method for drawing concentration using absorption spectrum |
Legal Events
| Date | Code | Title | Description |
|---|---|---|---|
| STAA | Information on the status of an ep patent application or granted ep patent |
Free format text: STATUS: THE INTERNATIONAL PUBLICATION HAS BEEN MADE |
|
| PUAI | Public reference made under article 153(3) epc to a published international application that has entered the european phase |
Free format text: ORIGINAL CODE: 0009012 |
|
| STAA | Information on the status of an ep patent application or granted ep patent |
Free format text: STATUS: REQUEST FOR EXAMINATION WAS MADE |
|
| 17P | Request for examination filed |
Effective date: 20160909 |
|
| AK | Designated contracting states |
Kind code of ref document: A1 Designated state(s): AL AT BE BG CH CY CZ DE DK EE ES FI FR GB GR HR HU IE IS IT LI LT LU LV MC MK MT NL NO PL PT RO RS SE SI SK SM TR |
|
| AX | Request for extension of the european patent |
Extension state: BA ME |
|
| STAA | Information on the status of an ep patent application or granted ep patent |
Free format text: STATUS: THE APPLICATION HAS BEEN WITHDRAWN |
|
| 18W | Application withdrawn |
Effective date: 20180228 |