EP3254086B1 - Methods and systems for identifying a real-time polymerase chain reaction site - Google Patents
Methods and systems for identifying a real-time polymerase chain reaction site Download PDFInfo
- Publication number
- EP3254086B1 EP3254086B1 EP16706294.2A EP16706294A EP3254086B1 EP 3254086 B1 EP3254086 B1 EP 3254086B1 EP 16706294 A EP16706294 A EP 16706294A EP 3254086 B1 EP3254086 B1 EP 3254086B1
- Authority
- EP
- European Patent Office
- Prior art keywords
- amplification
- list
- amplification curves
- display screen
- curves
- Prior art date
- Legal status (The legal status is an assumption and is not a legal conclusion. Google has not performed a legal analysis and makes no representation as to the accuracy of the status listed.)
- Active
Links
Images









Classifications
-
- G—PHYSICS
- G16—INFORMATION AND COMMUNICATION TECHNOLOGY [ICT] SPECIALLY ADAPTED FOR SPECIFIC APPLICATION FIELDS
- G16B—BIOINFORMATICS, i.e. INFORMATION AND COMMUNICATION TECHNOLOGY [ICT] SPECIALLY ADAPTED FOR GENETIC OR PROTEIN-RELATED DATA PROCESSING IN COMPUTATIONAL MOLECULAR BIOLOGY
- G16B45/00—ICT specially adapted for bioinformatics-related data visualisation, e.g. displaying of maps or networks
-
- G—PHYSICS
- G01—MEASURING; TESTING
- G01N—INVESTIGATING OR ANALYSING MATERIALS BY DETERMINING THEIR CHEMICAL OR PHYSICAL PROPERTIES
- G01N21/00—Investigating or analysing materials by the use of optical means, i.e. using sub-millimetre waves, infrared, visible or ultraviolet light
- G01N21/62—Systems in which the material investigated is excited whereby it emits light or causes a change in wavelength of the incident light
- G01N21/63—Systems in which the material investigated is excited whereby it emits light or causes a change in wavelength of the incident light optically excited
- G01N21/64—Fluorescence; Phosphorescence
- G01N21/6428—Measuring fluorescence of fluorescent products of reactions or of fluorochrome labelled reactive substances, e.g. measuring quenching effects, using measuring "optrodes"
-
- G—PHYSICS
- G01—MEASURING; TESTING
- G01N—INVESTIGATING OR ANALYSING MATERIALS BY DETERMINING THEIR CHEMICAL OR PHYSICAL PROPERTIES
- G01N33/00—Investigating or analysing materials by specific methods not covered by groups G01N1/00 - G01N31/00
- G01N33/48—Biological material, e.g. blood, urine; Haemocytometers
-
- G—PHYSICS
- G06—COMPUTING OR CALCULATING; COUNTING
- G06T—IMAGE DATA PROCESSING OR GENERATION, IN GENERAL
- G06T11/00—Two-dimensional [2D] image generation
- G06T11/20—Drawing from basic elements
- G06T11/26—Drawing of charts or graphs
-
- C—CHEMISTRY; METALLURGY
- C12—BIOCHEMISTRY; BEER; SPIRITS; WINE; VINEGAR; MICROBIOLOGY; ENZYMOLOGY; MUTATION OR GENETIC ENGINEERING
- C12Q—MEASURING OR TESTING PROCESSES INVOLVING ENZYMES, NUCLEIC ACIDS OR MICROORGANISMS; COMPOSITIONS OR TEST PAPERS THEREFOR; PROCESSES OF PREPARING SUCH COMPOSITIONS; CONDITION-RESPONSIVE CONTROL IN MICROBIOLOGICAL OR ENZYMOLOGICAL PROCESSES
- C12Q1/00—Measuring or testing processes involving enzymes, nucleic acids or microorganisms; Compositions therefor; Processes of preparing such compositions
- C12Q1/68—Measuring or testing processes involving enzymes, nucleic acids or microorganisms; Compositions therefor; Processes of preparing such compositions involving nucleic acids
- C12Q1/6844—Nucleic acid amplification reactions
- C12Q1/686—Polymerase chain reaction [PCR]
-
- G—PHYSICS
- G01—MEASURING; TESTING
- G01N—INVESTIGATING OR ANALYSING MATERIALS BY DETERMINING THEIR CHEMICAL OR PHYSICAL PROPERTIES
- G01N21/00—Investigating or analysing materials by the use of optical means, i.e. using sub-millimetre waves, infrared, visible or ultraviolet light
- G01N21/62—Systems in which the material investigated is excited whereby it emits light or causes a change in wavelength of the incident light
- G01N21/63—Systems in which the material investigated is excited whereby it emits light or causes a change in wavelength of the incident light optically excited
- G01N21/64—Fluorescence; Phosphorescence
- G01N21/645—Specially adapted constructive features of fluorimeters
- G01N21/6452—Individual samples arranged in a regular 2D-array, e.g. multiwell plates
-
- G—PHYSICS
- G01—MEASURING; TESTING
- G01N—INVESTIGATING OR ANALYSING MATERIALS BY DETERMINING THEIR CHEMICAL OR PHYSICAL PROPERTIES
- G01N21/00—Investigating or analysing materials by the use of optical means, i.e. using sub-millimetre waves, infrared, visible or ultraviolet light
- G01N21/62—Systems in which the material investigated is excited whereby it emits light or causes a change in wavelength of the incident light
- G01N21/63—Systems in which the material investigated is excited whereby it emits light or causes a change in wavelength of the incident light optically excited
- G01N21/64—Fluorescence; Phosphorescence
- G01N21/645—Specially adapted constructive features of fluorimeters
- G01N21/6456—Spatial resolved fluorescence measurements; Imaging
-
- G—PHYSICS
- G06—COMPUTING OR CALCULATING; COUNTING
- G06F—ELECTRIC DIGITAL DATA PROCESSING
- G06F3/00—Input arrangements for transferring data to be processed into a form capable of being handled by the computer; Output arrangements for transferring data from processing unit to output unit, e.g. interface arrangements
- G06F3/01—Input arrangements or combined input and output arrangements for interaction between user and computer
- G06F3/048—Interaction techniques based on graphical user interfaces [GUI]
- G06F3/0481—Interaction techniques based on graphical user interfaces [GUI] based on specific properties of the displayed interaction object or a metaphor-based environment, e.g. interaction with desktop elements like windows or icons, or assisted by a cursor's changing behaviour or appearance
- G06F3/0482—Interaction with lists of selectable items, e.g. menus
-
- G—PHYSICS
- G06—COMPUTING OR CALCULATING; COUNTING
- G06F—ELECTRIC DIGITAL DATA PROCESSING
- G06F3/00—Input arrangements for transferring data to be processed into a form capable of being handled by the computer; Output arrangements for transferring data from processing unit to output unit, e.g. interface arrangements
- G06F3/01—Input arrangements or combined input and output arrangements for interaction between user and computer
- G06F3/048—Interaction techniques based on graphical user interfaces [GUI]
- G06F3/0484—Interaction techniques based on graphical user interfaces [GUI] for the control of specific functions or operations, e.g. selecting or manipulating an object, an image or a displayed text element, setting a parameter value or selecting a range
- G06F3/04842—Selection of displayed objects or displayed text elements
-
- G—PHYSICS
- G06—COMPUTING OR CALCULATING; COUNTING
- G06F—ELECTRIC DIGITAL DATA PROCESSING
- G06F3/00—Input arrangements for transferring data to be processed into a form capable of being handled by the computer; Output arrangements for transferring data from processing unit to output unit, e.g. interface arrangements
- G06F3/01—Input arrangements or combined input and output arrangements for interaction between user and computer
- G06F3/048—Interaction techniques based on graphical user interfaces [GUI]
- G06F3/0484—Interaction techniques based on graphical user interfaces [GUI] for the control of specific functions or operations, e.g. selecting or manipulating an object, an image or a displayed text element, setting a parameter value or selecting a range
- G06F3/0485—Scrolling or panning
-
- G—PHYSICS
- G06—COMPUTING OR CALCULATING; COUNTING
- G06F—ELECTRIC DIGITAL DATA PROCESSING
- G06F3/00—Input arrangements for transferring data to be processed into a form capable of being handled by the computer; Output arrangements for transferring data from processing unit to output unit, e.g. interface arrangements
- G06F3/01—Input arrangements or combined input and output arrangements for interaction between user and computer
- G06F3/048—Interaction techniques based on graphical user interfaces [GUI]
- G06F3/0487—Interaction techniques based on graphical user interfaces [GUI] using specific features provided by the input device, e.g. functions controlled by the rotation of a mouse with dual sensing arrangements, or of the nature of the input device, e.g. tap gestures based on pressure sensed by a digitiser
- G06F3/0488—Interaction techniques based on graphical user interfaces [GUI] using specific features provided by the input device, e.g. functions controlled by the rotation of a mouse with dual sensing arrangements, or of the nature of the input device, e.g. tap gestures based on pressure sensed by a digitiser using a touch-screen or digitiser, e.g. input of commands through traced gestures
-
- G—PHYSICS
- G06—COMPUTING OR CALCULATING; COUNTING
- G06T—IMAGE DATA PROCESSING OR GENERATION, IN GENERAL
- G06T3/00—Geometric image transformations in the plane of the image
- G06T3/40—Scaling of whole images or parts thereof, e.g. expanding or contracting
Definitions
- users perform biological studies by gathering and comparing various sets of biological data. For example, a user may run various qPCR-based experiments to gather distinct types of biological data, such as genotyping data or gene expression data, about a gene of interest to the study. If the user wishes to compare various types of biological data, it is often done manually. The number of samples needed for one experiment may also be great and it is often difficult to isolate a particular sample for a user to examine and visualize so that a user may quickly and easily get valuable information from the data. Further, labs or facilities often operate several biological instruments. It may be difficult to track maintenance or calibration of the instruments.
- WO 2013/049443 A1 discloses a graphical user interface of a RT-PCR system wherein a results table is displayed alongside an amplification curve plot showing a plurality of amplification curves. A selection of several samples in various wells, which have been bookmarked in the results table is reflected on the amplification plot, e.g. a selected sample is reflected as a selected amplification curve. Unselected wells are also displayed in the background of the amplification plot.
- a method according to claim 1 is provided.
- a computer-readable storage medium encoded with instructions, according to claim 6 is provided.
- RT-PCR Real-Time Polymerase Chain Reaction
- the measured signals include fluorescence data acquired from the plurality of reaction sites to detect the amount of nucleic acid within the reaction site over time as the sample within the reaction site is amplified.
- the fluorescence data for each reaction site is plotted to generate an amplification curve. Since fluorescence data is measure from every reaction site, there are often hundreds, sometimes thousands, of generated amplification curves. As one could imagine, to view a single amplification curve and associated information related to the sample, is challenging. According to various embodiments described herein, methods and systems allow a user to easily select a particular amplification curve that is of interest and view information associated with the amplification curve so that the user is able to quickly get useful information from the real-time amplification curves or mark the curves for further analysis later.
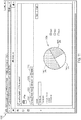
- a graphical user interface 100 displaying a plurality of amplification curves 104 within amplification curve plot 102 is depicted.
- the details of each well associated with the amplification curve can be viewed by activating well detail button 106.
- different portions of the plurality of amplification curves may be viewed by zooming or unzooming the amplification curve plot 102 by activating zoom button 108.
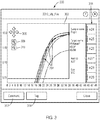
- amplification curve plot 202 displays a portion of amplification curves 204.
- the view of amplification curve plot 202 may be shifted by activating arrows 206.
- the view of amplification curve plot 202 may be zoomed in by activating zoom button 208 or zoomed out using unzoom button 210.
- zoom button 208 By changing the view of amplification curve plot 202, the portion of amplification curves displayed may dynamically change.
- scroll bar 216 further information for the viewable amplification curves are displayed.
- well locations of amplification curves 204 are indicated by color in well scroll bar 216. If the number of amplification curves visible in amplification curve plot 202 exceeds the amount of available space in well scroll bar 216, the user may scroll down or up to view the information about the other amplification curve s. If more information is desired about a particular amplification curve, a user may select the associated well location information in well scroll bar 216 to view further details, such as sample type loaded into the well. In this way, individual amplification curves may be more easily selected and information associated with the selected amplification curve can be quickly and easily identified.
- a comment button 212 and tag button 214 may be provided to a user for the user to choose to add in a comment or a tag for a specific amplification curve. For example, a user may notice an amplification curve has an unusual characteristic and would like to make a comment associated with the amplification curve to store for future reference. Comment button 212 and tag button 214 may be selected by the user to input tags and/or comments.
- Arrows 206, zoom in button 208, zoom out button 210, and well scroll bar 216 may be activated by touch control.
- a user may also be able to perform pinch-to-zoom touch screen gestures on amplification curve plot 202 to zoom in and zoom out the viewable area of amplification curve plot 202.
- Well scroll bar 216 may also be controlled by touch screen gestures, such as flicking upwards to move well scroll bar 216 up or flicking downwards to move well scroll bar 216 down.
- FIG. 3 illustrates another example of a graphical user interface 300 for identifying amplification curves according to various embodiments described herein.
- amplification curve plot 302 displays a portion of amplification curves 304.
- the view of amplification curve plot 302 may be shifted by activating arrows 306.
- the view of amplification curve plot 302 may be zoomed in by activating zoom button 308 or zoomed out using zoom out button 310.
- the portion of amplification curves displayed may dynamically change.
- well scroll bar 316 further information for the viewable amplification curves are displayed. For example, well locations of amplification curves 304 are indicated by color in well scroll bar 316.
- the user may scroll down or up to view the information about the other amplification curve s. If more information is desired about a particular amplification curve, a user may select the associated well location information in well scroll bar 316 to view further details, such as sample type loaded into the well. In this example, A27 is selected from well scroll bar 316. Other information associated with A27 is displayed adjacent to well scroll bar 316. Furthermore, the amplification curve associated with A27 may be highlighted in amplification curve plot 302 so that the user is able to easily identify all associated information to well A27. In this way, individual amplification curves may be more easily selected and information associated with the selected amplification curve can be quickly and easily identified.
- a comment button 312 and tag button 314 may be provided to a user for the user to choose to add in a comment or a tag for a specific amplification curve. For example, a user may notice an amplification curve has an unusual characteristic and would like to make a comment associated with the amplification curve to store for future reference. Comment button 312 and tag button 314 may be selected by the user to input tags and/or comments.
- Arrows 306, zoom button 308, zoom out button 310, and well scroll bar 316 may be activated by touch control.
- a user may also be able to perform pinch-to-zoom touch screen gestures on amplification curve plot 302 to zoom and zoom out the viewable area of amplification curve plot 302.
- Well scroll bar 316 may also be controlled by touch screen gestures, such as flicking upwards to move well scroll bar 316 up or flicking downwards to move well scroll bar 316 down.
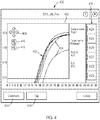
- FIG. 4 illustrates another example of a graphical user interface 400 for identifying amplification curves according to various embodiments of described herein.
- a selected amplification curve is shown highlighted in amplification plot 402.
- Well scroll bar 418 displays well location of the portion of a plurality of amplification curves 404.
- a user can select a particular well, in this case, A27 and view sample name, target name, well ID, and dye associated with A27.
- the amplification curve associated with A27 is shown to be in green.
- the system also displays the amplification curve associated with A27 406 in a highlighted manner so that the other curves are dimmed to highlight amplification curve 406.
- FIG. 5 illustrates an example of a graphical user interface 500 for inputting tags or comments.
- comment button 414 and tag button 416 allow a user to choose to input a comment or tag for a selected amplification curve.
- a keyboard is displayed to the user. The user may enter a comment or tag in the input field box 502 using the keyboard. The keyboard may also be displayed on a touch screen so that the user may directly interact with the images displayed.
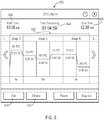
- FIG. 6 illustrates an example of a graphical user interface for displaying and editing a thermal cycling protocol.
- a user may set up the thermal cycling protocol using graphical user interface 600. The user may adjust the protocol before the run is started on the instrument. The user may also adjust the protocol after the run has started. If the user wants to revise/adjust the thermal cycling protocol, the user may select the portion of the graphical representation of the thermal cycling protocol 602 they wish to edit and then select the edit button 610. The user may then adjust the temperature or length of a particular portion of the cycle, for example. This feature allows a user to make on the fly changes without having to stop the entire experiment run.
- GUI 600 may also be displayed on a touch screen capable of being activated by a user interacting directly with GUI 600.
- FIG. 7 illustrates another example of a graphical user interface for displaying and editing a thermal cycling protocol.
- the user can add or delete from the graphical representation of the thermal cycling protocol 702 by activating the addition buttons 704 or deletion button 706.
- GUI 800 may be displayed to a user to indicate the status of each of the instruments in the network of instruments used by a lab, for example.
- a graphical user interface 800 for displaying a plurality of instrument statuses 802 is depicted.
- a user viewing GUI 800 can view the instruments within the same network and easily view the instrument status, such as available or in use, and other information such as calibration status. More detailed information about an individual instrument may also be viewed.
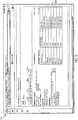
- FIG. 9 illustrates an example of a graphical user interface 900 for displaying information about an instrument.
- GUI 900 illustrates a summary page 902 for an individual instrument.
- the various calibration statuses and expiration dates are viewed in the calibration status table 904.
- a user may also choose to view event history tab 906, calibration history tab 908, and statistics tab 910.
- summary page 902 a user is able to view the calibration status of the instrument.
- FIG. 10 illustrates an example of a graphical user interface 1000 for displaying statistical information about an instrument.
- the statistic page 1010 shows the type of runs this particular instrument for which this instrument has been used.
- Statistics page 1010 also indicates the number of hours of usage of this experiment.
- FIG. 11 illustrates another example of a graphical user interface 1100 for displaying statistical information about an instrument.
- pie chart 1104 graphically shows the amount of use of the instrument by user.
- Pie chart 1104 shows that this instrument has been used most often by user 1.
- FIG. 12 is a block diagram that illustrates a computer system 1200 that may be employed to carry out processing functionality, according to various embodiments. Instruments to perform experiments may be connected to the exemplary computing system 1200.
- Computing system 1200 can include one or more processors, such as a processor 1204.
- Processor 1204 can be implemented using a general or special purpose processing engine such as, for example, a microprocessor, controller or other control logic. In this example, processor 1204 is connected to a bus 1202 or other communication medium.
- a computing system 1200 of FIG. 12 may be embodied in any of a number of forms, such as a rack-mounted computer, mainframe, supercomputer, server, client, a desktop computer, a laptop computer, a tablet computer, handheld computing device (e.g., PDA, cell phone, smart phone, palmtop, etc.), cluster grid, netbook, embedded systems, or any other type of special or general purpose computing device as may be desirable or appropriate for a given application or environment.
- a computing system 1200 can include a conventional network system including a client/server environment and one or more database servers, or integration with LIS/LIMS infrastructure.
- computing system 1200 may be configured to connect to one or more servers in a distributed network.
- Computing system 1200 may receive information or updates from the distributed network.
- Computing system 1200 may also transmit information to be stored within the distributed network that may be accessed by other clients connected to the distributed network.
- Computing system 1200 may include bus 1202 or other communication mechanism for communicating information, and processor 1204 coupled with bus 1202 for processing information.
- Computing system 1200 also includes a memory 1206, which can be a random access memory (RAM) or other dynamic memory, coupled to bus 1202 for storing instructions to be executed by processor 1204. Memory 1206 also may be used for storing temporary variables or other intermediate information during execution of instructions to be executed by processor 1204. Computing system 1200 further includes a read only memory (ROM) 1208 or other static storage device coupled to bus 1202 for storing static information and instructions for processor 1204.
- ROM read only memory
- Computing system 1200 may also include a storage device 1210, such as a magnetic disk, optical disk, or solid state drive (SSD) is provided and coupled to bus 1202 for storing information and instructions.
- Storage device 1210 may include a media drive and a removable storage interface.
- a media drive may include a drive or other mechanism to support fixed or removable storage media, such as a hard disk drive, a floppy disk drive, a magnetic tape drive, an optical disk drive, a CD or DVD drive (R or RW), flash drive, or other removable or fixed media drive.
- the storage media may include a computer-readable storage medium having stored therein particular computer software, instructions, or data.
- storage device 1210 may include other similar instrumentalities for allowing computer programs or other instructions or data to be loaded into computing system 1200.
- Such instrumentalities may include, for example, a removable storage unit and an interface, such as a program cartridge and cartridge interface, a removable memory (for example, a flash memory or other removable memory module) and memory slot, and other removable storage units and interfaces that allow software and data to be transferred from the storage device 1210 to computing system 1200.
- Computing system 1200 can also include a communications interface 1218.
- Communications interface 1218 can be used to allow software and data to be transferred between computing system 1200 and external devices.
- Examples of communications interface 1218 can include a modem, a network interface (such as an Ethernet or other NIC card), a communications port (such as for example, a USB port, a RS-232C serial port), a PCMCIA slot and card, Bluetooth, etc.
- Software and data transferred via communications interface 1218 are in the form of signals which can be electronic, electromagnetic, optical or other signals capable of being received by communications interface 1218. These signals may be transmitted and received by communications interface 1218 via a channel such as a wireless medium, wire or cable, fiber optics, or other communications medium.
- Some examples of a channel include a phone line, a cellular phone link, an RF link, a network interface, a local or wide area network, and other communications channels.
- Computing system 1200 may be coupled via bus 1202 to a display 1212, such as a cathode ray tube (CRT) or liquid crystal display (LCD), for displaying information to a computer user.
- a display 1212 such as a cathode ray tube (CRT) or liquid crystal display (LCD)
- An input device 1214 is coupled to bus 1202 for communicating information and command selections to processor 1204, for example.
- An input device may also be a display, such as an LCD display, configured with touchscreen input capabilities.
- cursor control 1216 is Another type of user input device, such as a mouse, a trackball or cursor direction keys for communicating direction information and command selections to processor 1204 and for controlling cursor movement on display 1212.
- This input device typically has two degrees of freedom in two axes, a first axis (e.g., x) and a second axis (e.g., y), that allows the device to specify positions in a plane.
- a computing system 1200 provides data processing and provides a level of confidence for such data. Consistent with certain implementations of embodiments of the present teachings, data processing and confidence values are provided by computing system 1200 in response to processor 1204 executing one or more sequences of one or more instructions contained in memory 1206. Such instructions may be read into memory 1206 from another computer-readable medium, such as storage device 1210. Execution of the sequences of instructions contained in memory 1206 causes processor 1204 to perform the process states described herein. Alternatively hard-wired circuitry may be used in place of or in combination with software instructions to implement embodiments of the present teachings. Thus implementations of embodiments of the present teachings are not limited to any specific combination of hardware circuitry and software.
- Non-volatile media includes, for example, solid state, optical or magnetic disks, such as storage device 1210.
- Volatile media includes dynamic memory, such as memory 1206.
- Transmission media includes coaxial cables, copper wire, and fiber optics, including the wires that comprise bus 1202.
- Computer-readable media include, for example, a floppy disk, a flexible disk, hard disk, magnetic tape, or any other magnetic medium, a CD-ROM, any other optical medium, punch cards, paper tape, any other physical medium with patterns of holes, a RAM, PROM, and EPROM, a FLASH-EPROM, any other memory chip or cartridge, a carrier wave as described hereinafter, or any other medium from which a computer can read.
- Various forms of computer readable media may be involved in carrying one or more sequences of one or more instructions to processor 1204 for execution.
- the instructions may initially be carried on magnetic disk of a remote computer.
- the remote computer can load the instructions into its dynamic memory and send the instructions over a telephone line using a modem.
- a modem local to computing system 1200 can receive the data on the telephone line and use an infra-red transmitter to convert the data to an infra-red signal.
- An infra-red detector coupled to bus 1202 can receive the data carried in the infra-red signal and place the data on bus 1202.
- Bus 1202 carries the data to memory 1206, from which processor 1204 retrieves and executes the instructions.
- the instructions received by memory 1206 may optionally be stored on storage device 1210 either before or after execution by processor 1204.
- FIG. 13 Some of the elements of a typical Internet network configuration 1300 are shown in FIG. 13 , wherein a number of client machines 1302 possibly in a remote local office, are shown connected to a gateway/hub/tunnel-server/etc 1310 which is itself connected to the internet 1308 via some internet service provider (ISP) connection 1310. Also shown are other possible clients 1312 similarly connected to the internet 1308 via an ISP connection 1314, with these units communicating to possibly a central lab or office, for example, via an ISP connection 1316 to a gateway/tunnel-server 1318 which is connected 1320 to various enterprise application servers 1322 which could be connected through another hub/router 1326 to various local clients 1330. Any of these servers 1322 could function as a development server for the analysis of potential content management and delivery design solutions as described in the present invention, as more fully described below.
- ISP internet service provider
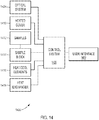
- FIG. 14 is a block diagram that illustrates a PCR instrument 1400.
- PCR instrument 1400 may include a heated cover 1410 that is placed over a plurality of samples 1412 contained in a substrate (not shown).
- a substrate may be a glass or plastic slide with a plurality of sample regions, which sample regions have a cover between the sample regions and heated cover 1410.
- a substrate may include, but are not limited to, a multi-well plate, such as a standard microtiter 96-well, a 384-well plate, or a microcard, or a substantially planar support, such as a glass or plastic slide.
- the reaction sites in various embodiments of a substrate may include depressions, indentations, ridges, and combinations thereof, patterned in regular or irregular arrays formed on the surface of the substrate.
- Various embodiments of PCR instruments include a sample block 1414, elements for heating and cooling 1416, a heat exchanger 1418, control system 1420, and user interface 1422.
- Various embodiments of a thermal block assembly according to the present teachings comprise components 1414-1418 of PCR instrument 1400 of FIG. 14 .
- Real-time PCR instrument 1400 has an optical system 1424.
- an optical system 1424 may have an illumination source (not shown) that emits electromagnetic energy, an optical sensor, detector, or imager (not shown), for receiving electromagnetic energy from samples 1412 in a substrate, and optics 1440 used to guide the electromagnetic energy from each DNA sample to the imager.
- control system 1420 may be used to control the functions of the detection system, heated cover, and thermal block assembly. Control system 1420 may be accessible to an end user through user interface 1422 of PCR instrument 1400 in FIG. 14 and real-time PCR instrument 1400 in FIG. 14 .
- a computer system 1400 may serve as to provide the control the function of PCR instrument 1400 in FIG. 14 , as well as the user interface function. Additionally, computer system 400 of FIG. 4 may provide data processing, display and report preparation functions. All such instrument control functions may be dedicated locally to the PCR instrument, or computer system 400 of FIG. 4 may provide remote control of part or all of the control, analysis, and reporting functions, as will be discussed in more detail subsequently.
- FIG. 15 depicts an exemplary optical system 1500 that may be used for imaging. It should be recognized that optical system 1500 is an exemplary optical system and one skilled in the art would recognize that other optical systems may be used to capture images an object-of-interest.
- An object of interest may be a sample holder such as, for example, a calibration plate as described herein.
- An optical sensor 1502 included in a camera 1504, for example, may image an object-of-interest 1510.
- the optical sensor 1502 may be a CCD senor and the camera 1504 may be a CCD camera. Further, the optical sensor includes a camera lens 1506.
- an emission filter 1508 can be chosen for imagining the object-of-interest 1510 according to various embodiments.
- Emission filter 1508 may be changed to image fluorescent emission emitted from the object-of-interest 1501 in other embodiments.
- Optical system 1500 may use a reflected light source 1512 to image object-of-interest 1510.
- the light from light source 1512 may be filtered through an asphere 1514, a focuser/diverger 1516, and excitation filter 1518 before being reflected to the object-of-interest 1510 by beamsplitter 1520.
- Optical system 1500 may also include a field lens 1522.
- the excitation filter 1518 can be chosen or changed for imagining the object-of-interest 1510 according to various embodiments.
Landscapes
- Engineering & Computer Science (AREA)
- Physics & Mathematics (AREA)
- Health & Medical Sciences (AREA)
- Theoretical Computer Science (AREA)
- Life Sciences & Earth Sciences (AREA)
- General Physics & Mathematics (AREA)
- Chemical & Material Sciences (AREA)
- General Engineering & Computer Science (AREA)
- Immunology (AREA)
- General Health & Medical Sciences (AREA)
- Biochemistry (AREA)
- Analytical Chemistry (AREA)
- Pathology (AREA)
- Nuclear Medicine, Radiotherapy & Molecular Imaging (AREA)
- Human Computer Interaction (AREA)
- Chemical Kinetics & Catalysis (AREA)
- Biotechnology (AREA)
- Bioinformatics & Cheminformatics (AREA)
- Biophysics (AREA)
- Optics & Photonics (AREA)
- Bioinformatics & Computational Biology (AREA)
- Data Mining & Analysis (AREA)
- Evolutionary Biology (AREA)
- Spectroscopy & Molecular Physics (AREA)
- Medical Informatics (AREA)
- Organic Chemistry (AREA)
- Proteomics, Peptides & Aminoacids (AREA)
- Wood Science & Technology (AREA)
- Zoology (AREA)
- Molecular Biology (AREA)
- Microbiology (AREA)
- Genetics & Genomics (AREA)
- Hematology (AREA)
- Biomedical Technology (AREA)
- Urology & Nephrology (AREA)
- Food Science & Technology (AREA)
- Medicinal Chemistry (AREA)
- Apparatus Associated With Microorganisms And Enzymes (AREA)
- Automatic Analysis And Handling Materials Therefor (AREA)
- User Interface Of Digital Computer (AREA)
Description
- Generally, users perform biological studies by gathering and comparing various sets of biological data. For example, a user may run various qPCR-based experiments to gather distinct types of biological data, such as genotyping data or gene expression data, about a gene of interest to the study. If the user wishes to compare various types of biological data, it is often done manually. The number of samples needed for one experiment may also be great and it is often difficult to isolate a particular sample for a user to examine and visualize so that a user may quickly and easily get valuable information from the data. Further, labs or facilities often operate several biological instruments. It may be difficult to track maintenance or calibration of the instruments.
-
WO 2013/049443 A1 discloses a graphical user interface of a RT-PCR system wherein a results table is displayed alongside an amplification curve plot showing a plurality of amplification curves. A selection of several samples in various wells, which have been bookmarked in the results table is reflected on the amplification plot, e.g. a selected sample is reflected as a selected amplification curve. Unselected wells are also displayed in the background of the amplification plot. - The manual "Applied Biosystems 7500/7500 Fast Real-Time PCR System Genotyping Experiments Getting Started Guide" (2010) discloses a similar graphical user interface of a RT-PCR system.
- The manual "Data Analysis on the ABI PRISM 7700 Sequence Detection System: Setting Baselines and thresholds." (2002) discloses another graphical user interface of a RT-PCR system.
- In one exemplary embodiment, a method according to
claim 1 is provided. - In another exemplary embodiment, a computer-readable storage medium encoded with instructions, according to
claim 6 is provided. - In yet another exemplary embodiment, a system according to
claim 7 is provided. -
-
FIG. 1 illustrates an example of a graphical user interface for displaying amplification curves; -
FIG. 2 illustrates an example of a graphical user interface for viewing a selection of amplification curves according to various embodiments described herein; -
FIG. 3 illustrates an example of a graphical user interface for identifying amplification curves according to various embodiments described herein; -
FIG. 4 illustrates an example of a graphical user interface for identifying amplification curves according to various embodiments of described herein; -
FIG. 5 illustrates an example of a graphical user interface for inputting tags or comments; -
FIG. 6 illustrates an example of a graphical user interface for displaying and editing a thermal cycling protocol; -
FIG. 7 illustrates an example of a graphical user interface for displaying and editing a thermal cycling protocol; -
FIG. 8 illustrates an example of a graphical user interface for displaying a plurality of instrument status; -
FIG. 9 illustrates an example of a graphical user interface for displaying information about an instrument; -
FIG. 10 illustrates an example of a graphical user interface for displaying statistical information about an instrument; -
FIG. 11 illustrates an example of a graphical user interface for displaying statistical information about an instrument; -
FIG. 12 illustrates a computing system upon which various embodiments described herein may be implemented; -
FIG. 13 illustrates an exemplary distributed network system; -
FIG. 14 is a block diagram that illustrates a PCR instrument; and -
FIG. 15 depicts an exemplaryoptical system 1500 that may be used for imaging. - To provide a more thorough understanding of the present invention, the following description sets forth numerous specific details, such as specific configurations, parameters, examples, and the like. It should be recognized, however, that such description is not intended as a limitation on the scope of the present invention, which is defined in the appended independent claims.
- Researchers use biological instrument to perform various experiments to study genes of interest. The present teachings are described with reference to Real-Time Polymerase Chain Reaction (RT-PCR) instruments. In particular, an embodiment of the present teachings is implemented for RT-PCR instruments employing optical imaging of well plates. Such instruments can be capable of simultaneously measuring signals from a plurality of samples, spots, or reaction sites for analytical purposes.
- The measured signals include fluorescence data acquired from the plurality of reaction sites to detect the amount of nucleic acid within the reaction site over time as the sample within the reaction site is amplified. The fluorescence data for each reaction site is plotted to generate an amplification curve. Since fluorescence data is measure from every reaction site, there are often hundreds, sometimes thousands, of generated amplification curves. As one could imagine, to view a single amplification curve and associated information related to the sample, is challenging. According to various embodiments described herein, methods and systems allow a user to easily select a particular amplification curve that is of interest and view information associated with the amplification curve so that the user is able to quickly get useful information from the real-time amplification curves or mark the curves for further analysis later.
- With reference to
FIG. 1 , agraphical user interface 100 displaying a plurality ofamplification curves 104 withinamplification curve plot 102 is depicted. For the portion of the plurality ofamplification curves 104 visible inamplification curve plot 102, the details of each well associated with the amplification curve can be viewed by activatingwell detail button 106. Further, different portions of the plurality of amplification curves may be viewed by zooming or unzooming theamplification curve plot 102 by activatingzoom button 108. - In another embodiment shown in
FIG. 2 , an example of agraphical user interface 200 for viewing a selection ofamplification curves 204 is illustrated. In this example,amplification curve plot 202 displays a portion ofamplification curves 204. The view ofamplification curve plot 202 may be shifted by activatingarrows 206. Further, the view ofamplification curve plot 202 may be zoomed in by activatingzoom button 208 or zoomed out usingunzoom button 210. By changing the view ofamplification curve plot 202, the portion of amplification curves displayed may dynamically change. In wellscroll bar 216, further information for the viewable amplification curves are displayed. For example, well locations ofamplification curves 204 are indicated by color inwell scroll bar 216. If the number of amplification curves visible inamplification curve plot 202 exceeds the amount of available space inwell scroll bar 216, the user may scroll down or up to view the information about the other amplification curve s. If more information is desired about a particular amplification curve, a user may select the associated well location information in wellscroll bar 216 to view further details, such as sample type loaded into the well. In this way, individual amplification curves may be more easily selected and information associated with the selected amplification curve can be quickly and easily identified. - Additionally, according to various embodiments, a
comment button 212 andtag button 214 may be provided to a user for the user to choose to add in a comment or a tag for a specific amplification curve. For example, a user may notice an amplification curve has an unusual characteristic and would like to make a comment associated with the amplification curve to store for future reference.Comment button 212 andtag button 214 may be selected by the user to input tags and/or comments. -
Arrows 206, zoom inbutton 208, zoom outbutton 210, and wellscroll bar 216 may be activated by touch control. In various embodiments, a user may also be able to perform pinch-to-zoom touch screen gestures onamplification curve plot 202 to zoom in and zoom out the viewable area ofamplification curve plot 202. Wellscroll bar 216 may also be controlled by touch screen gestures, such as flicking upwards to move wellscroll bar 216 up or flicking downwards to move wellscroll bar 216 down. -
FIG. 3 illustrates another example of agraphical user interface 300 for identifying amplification curves according to various embodiments described herein. In this example,amplification curve plot 302 displays a portion ofamplification curves 304. The view ofamplification curve plot 302 may be shifted by activatingarrows 306. Further, the view ofamplification curve plot 302 may be zoomed in by activatingzoom button 308 or zoomed out using zoom outbutton 310. By changing the view ofamplification curve plot 302, the portion of amplification curves displayed may dynamically change. Inwell scroll bar 316, further information for the viewable amplification curves are displayed. For example, well locations of amplification curves 304 are indicated by color inwell scroll bar 316. If the number of amplification curves visible inamplification curve plot 302 exceeds the amount of available space inwell scroll bar 316, the user may scroll down or up to view the information about the other amplification curve s. If more information is desired about a particular amplification curve, a user may select the associated well location information inwell scroll bar 316 to view further details, such as sample type loaded into the well. In this example, A27 is selected fromwell scroll bar 316. Other information associated with A27 is displayed adjacent towell scroll bar 316. Furthermore, the amplification curve associated with A27 may be highlighted inamplification curve plot 302 so that the user is able to easily identify all associated information to well A27. In this way, individual amplification curves may be more easily selected and information associated with the selected amplification curve can be quickly and easily identified. - Additionally, according to various embodiments, a
comment button 312 andtag button 314 may be provided to a user for the user to choose to add in a comment or a tag for a specific amplification curve. For example, a user may notice an amplification curve has an unusual characteristic and would like to make a comment associated with the amplification curve to store for future reference.Comment button 312 andtag button 314 may be selected by the user to input tags and/or comments. -
Arrows 306,zoom button 308, zoom outbutton 310, andwell scroll bar 316 may be activated by touch control. In various embodiments, a user may also be able to perform pinch-to-zoom touch screen gestures onamplification curve plot 302 to zoom and zoom out the viewable area ofamplification curve plot 302. Wellscroll bar 316 may also be controlled by touch screen gestures, such as flicking upwards to move wellscroll bar 316 up or flicking downwards to move wellscroll bar 316 down. -
FIG. 4 illustrates another example of agraphical user interface 400 for identifying amplification curves according to various embodiments of described herein. In this example, a selected amplification curve is shown highlighted inamplification plot 402. Well scroll bar 418 displays well location of the portion of a plurality of amplification curves 404. A user can select a particular well, in this case, A27 and view sample name, target name, well ID, and dye associated with A27. The amplification curve associated with A27 is shown to be in green. In addition to the color to identify the associated amplification curve, the system also displays the amplification curve associated withA27 406 in a highlighted manner so that the other curves are dimmed to highlightamplification curve 406. -
FIG. 5 illustrates an example of agraphical user interface 500 for inputting tags or comments. With reference back toFIG. 4 ,comment button 414 andtag button 416 allow a user to choose to input a comment or tag for a selected amplification curve. Once a user selectscomment button 414 ortag button 416, a keyboard is displayed to the user. The user may enter a comment or tag in theinput field box 502 using the keyboard. The keyboard may also be displayed on a touch screen so that the user may directly interact with the images displayed. -
FIG. 6 illustrates an example of a graphical user interface for displaying and editing a thermal cycling protocol. A user may set up the thermal cycling protocol usinggraphical user interface 600. The user may adjust the protocol before the run is started on the instrument. The user may also adjust the protocol after the run has started. If the user wants to revise/adjust the thermal cycling protocol, the user may select the portion of the graphical representation of thethermal cycling protocol 602 they wish to edit and then select theedit button 610. The user may then adjust the temperature or length of a particular portion of the cycle, for example. This feature allows a user to make on the fly changes without having to stop the entire experiment run. - Additionally, the user is able to view the
start time 606,end time 608 and time remaining for theexperiment 604.GUI 600 may also be displayed on a touch screen capable of being activated by a user interacting directly withGUI 600. -
FIG. 7 illustrates another example of a graphical user interface for displaying and editing a thermal cycling protocol. In this example, the user can add or delete from the graphical representation of thethermal cycling protocol 702 by activating theaddition buttons 704 ordeletion button 706. - In a laboratory setting, there is often multiple instruments used by the researchers using the lab. It is often difficult to monitor that status, and routine maintenance and calibration schedules of the instruments.
GUI 800 may be displayed to a user to indicate the status of each of the instruments in the network of instruments used by a lab, for example. With reference toFIG. 8 , agraphical user interface 800 for displaying a plurality ofinstrument statuses 802 is depicted. Auser viewing GUI 800 can view the instruments within the same network and easily view the instrument status, such as available or in use, and other information such as calibration status. More detailed information about an individual instrument may also be viewed. -
FIG. 9 illustrates an example of agraphical user interface 900 for displaying information about an instrument.GUI 900 illustrates asummary page 902 for an individual instrument. The various calibration statuses and expiration dates are viewed in the calibration status table 904. A user may also choose to viewevent history tab 906,calibration history tab 908, andstatistics tab 910. Insummary page 902, a user is able to view the calibration status of the instrument. -
FIG. 10 illustrates an example of agraphical user interface 1000 for displaying statistical information about an instrument. Thestatistic page 1010 shows the type of runs this particular instrument for which this instrument has been used.Statistics page 1010 also indicates the number of hours of usage of this experiment. -
FIG. 11 illustrates another example of agraphical user interface 1100 for displaying statistical information about an instrument. In this example,pie chart 1104 graphically shows the amount of use of the instrument by user.Pie chart 1104 shows that this instrument has been used most often byuser 1. - Those skilled in the art will recognize that the operations of the various embodiments may be implemented using hardware, software, firmware, or combinations thereof, as appropriate. For example, some processes can be carried out using processors or other digital circuitry under the control of software, firmware, or hard-wired logic. (The term "logic" herein refers to fixed hardware, programmable logic and/or an appropriate combination thereof, as would be recognized by one skilled in the art to carry out the recited functions.) Software and firmware can be stored on non-transitory computer-readable media. Some other processes can be implemented using analog circuitry, as is well known to one of ordinary skill in the art. Additionally, memory or other storage, as well as communication components, may be employed in embodiments of the invention.
-
FIG. 12 is a block diagram that illustrates acomputer system 1200 that may be employed to carry out processing functionality, according to various embodiments. Instruments to perform experiments may be connected to theexemplary computing system 1200.Computing system 1200 can include one or more processors, such as aprocessor 1204.Processor 1204 can be implemented using a general or special purpose processing engine such as, for example, a microprocessor, controller or other control logic. In this example,processor 1204 is connected to abus 1202 or other communication medium. - Further, it should be appreciated that a
computing system 1200 ofFIG. 12 may be embodied in any of a number of forms, such as a rack-mounted computer, mainframe, supercomputer, server, client, a desktop computer, a laptop computer, a tablet computer, handheld computing device (e.g., PDA, cell phone, smart phone, palmtop, etc.), cluster grid, netbook, embedded systems, or any other type of special or general purpose computing device as may be desirable or appropriate for a given application or environment. Additionally, acomputing system 1200 can include a conventional network system including a client/server environment and one or more database servers, or integration with LIS/LIMS infrastructure. A number of conventional network systems, including a local area network (LAN) or a wide area network (WAN), and including wireless and/or wired components, are known in the art. Additionally, client/server environments, database servers, and networks are well documented in the art. According to various embodiments described herein,computing system 1200 may be configured to connect to one or more servers in a distributed network.Computing system 1200 may receive information or updates from the distributed network.Computing system 1200 may also transmit information to be stored within the distributed network that may be accessed by other clients connected to the distributed network. -
Computing system 1200 may includebus 1202 or other communication mechanism for communicating information, andprocessor 1204 coupled withbus 1202 for processing information. -
Computing system 1200 also includes amemory 1206, which can be a random access memory (RAM) or other dynamic memory, coupled tobus 1202 for storing instructions to be executed byprocessor 1204.Memory 1206 also may be used for storing temporary variables or other intermediate information during execution of instructions to be executed byprocessor 1204.Computing system 1200 further includes a read only memory (ROM) 1208 or other static storage device coupled tobus 1202 for storing static information and instructions forprocessor 1204. -
Computing system 1200 may also include astorage device 1210, such as a magnetic disk, optical disk, or solid state drive (SSD) is provided and coupled tobus 1202 for storing information and instructions.Storage device 1210 may include a media drive and a removable storage interface. A media drive may include a drive or other mechanism to support fixed or removable storage media, such as a hard disk drive, a floppy disk drive, a magnetic tape drive, an optical disk drive, a CD or DVD drive (R or RW), flash drive, or other removable or fixed media drive. As these examples illustrate, the storage media may include a computer-readable storage medium having stored therein particular computer software, instructions, or data. - In alternative embodiments,
storage device 1210 may include other similar instrumentalities for allowing computer programs or other instructions or data to be loaded intocomputing system 1200. Such instrumentalities may include, for example, a removable storage unit and an interface, such as a program cartridge and cartridge interface, a removable memory (for example, a flash memory or other removable memory module) and memory slot, and other removable storage units and interfaces that allow software and data to be transferred from thestorage device 1210 tocomputing system 1200. -
Computing system 1200 can also include acommunications interface 1218. Communications interface 1218 can be used to allow software and data to be transferred betweencomputing system 1200 and external devices. Examples ofcommunications interface 1218 can include a modem, a network interface (such as an Ethernet or other NIC card), a communications port (such as for example, a USB port, a RS-232C serial port), a PCMCIA slot and card, Bluetooth, etc. Software and data transferred viacommunications interface 1218 are in the form of signals which can be electronic, electromagnetic, optical or other signals capable of being received bycommunications interface 1218. These signals may be transmitted and received bycommunications interface 1218 via a channel such as a wireless medium, wire or cable, fiber optics, or other communications medium. Some examples of a channel include a phone line, a cellular phone link, an RF link, a network interface, a local or wide area network, and other communications channels. -
Computing system 1200 may be coupled viabus 1202 to adisplay 1212, such as a cathode ray tube (CRT) or liquid crystal display (LCD), for displaying information to a computer user. Aninput device 1214, including alphanumeric and other keys, is coupled tobus 1202 for communicating information and command selections toprocessor 1204, for example. An input device may also be a display, such as an LCD display, configured with touchscreen input capabilities. Another type of user input device iscursor control 1216, such as a mouse, a trackball or cursor direction keys for communicating direction information and command selections toprocessor 1204 and for controlling cursor movement ondisplay 1212. This input device typically has two degrees of freedom in two axes, a first axis (e.g., x) and a second axis (e.g., y), that allows the device to specify positions in a plane. Acomputing system 1200 provides data processing and provides a level of confidence for such data. Consistent with certain implementations of embodiments of the present teachings, data processing and confidence values are provided bycomputing system 1200 in response toprocessor 1204 executing one or more sequences of one or more instructions contained inmemory 1206. Such instructions may be read intomemory 1206 from another computer-readable medium, such asstorage device 1210. Execution of the sequences of instructions contained inmemory 1206 causesprocessor 1204 to perform the process states described herein. Alternatively hard-wired circuitry may be used in place of or in combination with software instructions to implement embodiments of the present teachings. Thus implementations of embodiments of the present teachings are not limited to any specific combination of hardware circuitry and software. - The term "computer-readable medium" and "computer program product" as used herein generally refers to any media that is involved in providing one or more sequences or one or more instructions to
processor 1204 for execution. Such instructions, generally referred to as "computer program code" (which may be grouped in the form of computer programs or other groupings), when executed, enable thecomputing system 1200 to perform features or functions of embodiments of the present invention. These and other forms of non-transitory computer-readable media may take many forms, including but not limited to, non-volatile media, volatile media, and transmission media. Non-volatile media includes, for example, solid state, optical or magnetic disks, such asstorage device 1210. Volatile media includes dynamic memory, such asmemory 1206. Transmission media includes coaxial cables, copper wire, and fiber optics, including the wires that comprisebus 1202. - Common forms of computer-readable media include, for example, a floppy disk, a flexible disk, hard disk, magnetic tape, or any other magnetic medium, a CD-ROM, any other optical medium, punch cards, paper tape, any other physical medium with patterns of holes, a RAM, PROM, and EPROM, a FLASH-EPROM, any other memory chip or cartridge, a carrier wave as described hereinafter, or any other medium from which a computer can read.
- Various forms of computer readable media may be involved in carrying one or more sequences of one or more instructions to
processor 1204 for execution. For example, the instructions may initially be carried on magnetic disk of a remote computer. The remote computer can load the instructions into its dynamic memory and send the instructions over a telephone line using a modem. A modem local tocomputing system 1200 can receive the data on the telephone line and use an infra-red transmitter to convert the data to an infra-red signal. An infra-red detector coupled tobus 1202 can receive the data carried in the infra-red signal and place the data onbus 1202.Bus 1202 carries the data tomemory 1206, from whichprocessor 1204 retrieves and executes the instructions. The instructions received bymemory 1206 may optionally be stored onstorage device 1210 either before or after execution byprocessor 1204. - It will be appreciated that, for clarity purposes, the above description has described embodiments of the invention with reference to different functional units and processors. However, it will be apparent that any suitable distribution of functionality between different functional units, processors or domains may be used without detracting from the invention. For example, functionality illustrated to be performed by separate processors or controllers may be performed by the same processor or controller. Hence, references to specific functional units are only to be seen as references to suitable means for providing the described functionality, rather than indicative of a strict logical or physical structure or organization.
- Some of the elements of a typical
Internet network configuration 1300 are shown inFIG. 13 , wherein a number ofclient machines 1302 possibly in a remote local office, are shown connected to a gateway/hub/tunnel-server/etc 1310 which is itself connected to theinternet 1308 via some internet service provider (ISP)connection 1310. Also shown are otherpossible clients 1312 similarly connected to theinternet 1308 via anISP connection 1314, with these units communicating to possibly a central lab or office, for example, via anISP connection 1316 to a gateway/tunnel-server 1318 which is connected 1320 to variousenterprise application servers 1322 which could be connected through another hub/router 1326 to variouslocal clients 1330. Any of theseservers 1322 could function as a development server for the analysis of potential content management and delivery design solutions as described in the present invention, as more fully described below. - As mentioned above, an instrument that may be utilized according to various embodiments, but is not limited to, is a polymerase chain reaction (PCR) instrument.
FIG. 14 is a block diagram that illustrates aPCR instrument 1400.PCR instrument 1400 may include aheated cover 1410 that is placed over a plurality ofsamples 1412 contained in a substrate (not shown). In various embodiments, a substrate may be a glass or plastic slide with a plurality of sample regions, which sample regions have a cover between the sample regions andheated cover 1410. Some examples of a substrate may include, but are not limited to, a multi-well plate, such as a standard microtiter 96-well, a 384-well plate, or a microcard, or a substantially planar support, such as a glass or plastic slide. The reaction sites in various embodiments of a substrate may include depressions, indentations, ridges, and combinations thereof, patterned in regular or irregular arrays formed on the surface of the substrate. Various embodiments of PCR instruments include asample block 1414, elements for heating andcooling 1416, aheat exchanger 1418,control system 1420, anduser interface 1422. Various embodiments of a thermal block assembly according to the present teachings comprise components 1414-1418 ofPCR instrument 1400 ofFIG. 14 . - Real-
time PCR instrument 1400 has anoptical system 1424. InFIG. 14 , anoptical system 1424 may have an illumination source (not shown) that emits electromagnetic energy, an optical sensor, detector, or imager (not shown), for receiving electromagnetic energy fromsamples 1412 in a substrate, and optics 1440 used to guide the electromagnetic energy from each DNA sample to the imager. For embodiments ofPCR instrument 1400 inFIG. 14 and real-time PCR instrument 1400 inFIG. 14 ,control system 1420, may be used to control the functions of the detection system, heated cover, and thermal block assembly.Control system 1420 may be accessible to an end user throughuser interface 1422 ofPCR instrument 1400 inFIG. 14 and real-time PCR instrument 1400 inFIG. 14 . Also acomputer system 1400, as depicted inFIG. 14 , may serve as to provide the control the function ofPCR instrument 1400 inFIG. 14 , as well as the user interface function. Additionally,computer system 400 ofFIG. 4 may provide data processing, display and report preparation functions. All such instrument control functions may be dedicated locally to the PCR instrument, orcomputer system 400 ofFIG. 4 may provide remote control of part or all of the control, analysis, and reporting functions, as will be discussed in more detail subsequently. -
FIG. 15 depicts an exemplaryoptical system 1500 that may be used for imaging. It should be recognized thatoptical system 1500 is an exemplary optical system and one skilled in the art would recognize that other optical systems may be used to capture images an object-of-interest. An object of interest may be a sample holder such as, for example, a calibration plate as described herein. Anoptical sensor 1502 included in acamera 1504, for example, may image an object-of-interest 1510. Theoptical sensor 1502 may be a CCD senor and thecamera 1504 may be a CCD camera. Further, the optical sensor includes acamera lens 1506. - Depending on the object of interest, an
emission filter 1508 can be chosen for imagining the object-of-interest 1510 according to various embodiments.Emission filter 1508 may be changed to image fluorescent emission emitted from the object-of-interest 1501 in other embodiments. -
Optical system 1500 may use a reflectedlight source 1512 to image object-of-interest 1510. The light fromlight source 1512 may be filtered through anasphere 1514, a focuser/diverger 1516, andexcitation filter 1518 before being reflected to the object-of-interest 1510 bybeamsplitter 1520.Optical system 1500 may also include afield lens 1522. Depending on the object of interest, theexcitation filter 1518 can be chosen or changed for imagining the object-of-interest 1510 according to various embodiments. - The descriptions of various implementations of the present teachings have been presented for purposes of illustration and description. It is not exhaustive and does not limit the present teachings to the precise form disclosed. Modifications and variations are possible in light of the above teachings or may be acquired from practicing of the present teachings. Additionally, the described implementation includes software but the present teachings may be implemented as a combination of hardware and software or in hardware alone. The present teachings may be implemented with both object-oriented and non-object-oriented programming systems.
Claims (10)
- A method for identifying a real-time polymerase chain reaction site associated with an amplification curve from a plurality of amplification curves, the method comprising:receiving amplification data from a plurality of reaction sites, wherein each reaction site contains a sample;generating a plurality of amplification curves (204) from the amplification data;displaying a first portion of the plurality of amplification curves (204) on a display screen;displaying a list of indications of reaction sites (216) associated with the first portion of amplification curves (204) alongside the first portion of amplification curves (204) on the display screen;shifting from a view of the first portion of the plurality of amplification curves (204) to display a view comprising a second portion of the plurality of amplification curves (204), wherein different portions of the plurality of amplification curves (204) can be viewed in an amplification curve plot (202) by zooming or unzooming the amplification curve plot (202) by activating a zoom button (208, 210); anddynamically adjusting the list to display indications of reaction sites (216) associated with the second portion of the plurality of amplification curves (204) alongside the second portion of the plurality of amplification curves (204) on the display screen, wherein the list (216) is configured to be scrollable.
- The method of claim 1, wherein the first portion of the list (216) is viewable on the display screen.
- The method of claim 2, wherein the second portion of the list (216) is viewable after scrolling the list down.
- The method of claim 1, further comprising:
providing information about the sample in a reaction site after a user selects an indication of the reaction site from the list (216). - The method of claim 1, where the display screen is a touch screen.
- A computer-readable storage medium encoded with instructions, the instructions causing the respective components of a system to perform the method steps of a method of one of claims 1-5, wherein the system comprises- a receiver configured to receive amplification data from a plurality of real-time polymerase chain reaction sites;- a data processor;- a display screen; and- a zoom button (208, 210).
- A system for identifying a real-time polymerase chain reaction site associated with an amplification curve from a plurality of amplification curves, the system comprising:- a receiver configured to receive amplification data from a plurality of reaction sites;- a data processor;- a display screen;- a zoom button (208, 210); and
a memory having stored therein encoded instructions, the instructions comprising instructions for:causing the receiver to receive amplification data from a plurality of reaction sites, wherein each reaction site is adapted to contain a sample;causing the processor to generate a plurality of amplification curves (204) from the amplification data;causing the display screen to display a first portion of the plurality of amplification curves (204) on the display screen;causing the display screen to display a list of indications of reaction sites (216) associated with the first portion of amplification curves (204) alongside the first portion of amplification curves (204) on the display screen;causing the display to shift from a view of the first portion of the plurality of amplification curves (204) to display a view comprising a second portion of the plurality of amplification curves (204), wherein different portions of the plurality of amplification curves (204) can be viewed in an amplification curve plot (202) by zooming or unzooming the amplification curve plot (202) by activating the zoom button (208, 210); andcausing the display to dynamically adjust the list to display indications of reaction sites (216) associated with the second portion of the plurality of amplification curves (204) alongside the second portion of the plurality of amplification curves (204) on the display screen, wherein the list (216) is configured to be scrollable. - The system of claim 7, wherein the first portion of the list (216) is viewable on the display screen.
- The system of claim 8, wherein the second portion of the list (216) is viewable after scrolling the list down.
- The system of claim 7, further comprising instructions for:
causing the display to provide information about the sample in a reaction site after a user selects an indication of the reaction site from the list (216).
Applications Claiming Priority (2)
| Application Number | Priority Date | Filing Date | Title |
|---|---|---|---|
| US201562113006P | 2015-02-06 | 2015-02-06 | |
| PCT/US2016/016827 WO2016127086A1 (en) | 2015-02-06 | 2016-02-05 | Methods and systems for experiment design and analysis |
Publications (2)
| Publication Number | Publication Date |
|---|---|
| EP3254086A1 EP3254086A1 (en) | 2017-12-13 |
| EP3254086B1 true EP3254086B1 (en) | 2020-08-05 |
Family
ID=55411750
Family Applications (1)
| Application Number | Title | Priority Date | Filing Date |
|---|---|---|---|
| EP16706294.2A Active EP3254086B1 (en) | 2015-02-06 | 2016-02-05 | Methods and systems for identifying a real-time polymerase chain reaction site |
Country Status (9)
| Country | Link |
|---|---|
| US (1) | US10102653B2 (en) |
| EP (1) | EP3254086B1 (en) |
| JP (1) | JP6496417B2 (en) |
| KR (1) | KR102541746B1 (en) |
| CN (1) | CN107223249B (en) |
| BR (1) | BR112017016932B1 (en) |
| RU (1) | RU2719346C2 (en) |
| SG (2) | SG11201706356XA (en) |
| WO (1) | WO2016127086A1 (en) |
Families Citing this family (3)
| Publication number | Priority date | Publication date | Assignee | Title |
|---|---|---|---|---|
| EP3746225B1 (en) * | 2018-01-29 | 2024-10-30 | Gen-Probe Incorporated | Analytical systems and methods |
| USD872109S1 (en) | 2018-08-07 | 2020-01-07 | Caterpillar Inc. | Display screen or portion thereof with graphical user interface |
| USD1089275S1 (en) | 2021-11-03 | 2025-08-19 | Caterpillar Inc. | Display screen or portion thereof with graphical user interface |
Family Cites Families (18)
| Publication number | Priority date | Publication date | Assignee | Title |
|---|---|---|---|---|
| CA2329061C (en) * | 1999-03-27 | 2006-11-14 | Applied Biosystems, Llc | Methods for exogenous, internal controls during nucleic acid amplification |
| US6518068B1 (en) * | 1999-07-21 | 2003-02-11 | Tropix, Inc. | Luminescence detection workstation |
| CA2453360A1 (en) * | 2001-07-11 | 2003-01-23 | Applera Corporation | Internal calibration standards for electrophoretic analyses |
| US7363168B2 (en) * | 2001-10-02 | 2008-04-22 | Stratagene California | Adaptive baseline algorithm for quantitative PCR |
| US7315376B2 (en) * | 2005-01-07 | 2008-01-01 | Advanced Molecular Systems, Llc | Fluorescence detection system |
| US7630849B2 (en) * | 2005-09-01 | 2009-12-08 | Applied Biosystems, Llc | Method of automated calibration and diagnosis of laboratory instruments |
| WO2008067552A2 (en) * | 2006-11-30 | 2008-06-05 | Fluidigm Corporation | Method and apparatus for biological sample analysis |
| CN102395977B (en) * | 2009-04-16 | 2014-10-22 | 皇家飞利浦电子股份有限公司 | Nucleic Acid Quantification Methods |
| US8754890B2 (en) * | 2009-07-31 | 2014-06-17 | Oracle International Corporation | Graphical interface with data presence indicators |
| EP2556459B1 (en) * | 2010-04-08 | 2020-06-10 | Life Technologies Corporation | Systems and methods for genotyping by angle configuration search |
| SG184480A1 (en) * | 2010-04-09 | 2012-11-29 | Life Technologies Corp | VISUALIZATION TOOL FOR qPCR GENOTYPING DATA |
| WO2011130184A2 (en) * | 2010-04-11 | 2011-10-20 | Life Technologies Corporation | SYSTEMS AND METHODS FOR MODEL-BASED qPCR |
| US20120045368A1 (en) * | 2010-08-18 | 2012-02-23 | Life Technologies Corporation | Chemical Coating of Microwell for Electrochemical Detection Device |
| CA2819553C (en) * | 2010-12-15 | 2018-09-04 | Akzo Nobel Chemicals International B.V. | Aqueous starch containing polymer dispersion for paper applications |
| WO2012106481A1 (en) * | 2011-02-01 | 2012-08-09 | Life Technologies Coporation | Systems and methods for the analysis of protein melt curve data |
| KR20120103496A (en) * | 2011-03-09 | 2012-09-19 | 삼성테크윈 주식회사 | Method for acquiring a standard curve and a threshold in real-time pcr |
| CN107377025B (en) * | 2011-09-30 | 2020-11-10 | 生命技术公司 | System and method for biological analysis |
| EP2761027B1 (en) * | 2011-09-30 | 2017-10-25 | Life Technologies Corporation | Methods and systems for visualizing and evaluating data |
-
2016
- 2016-02-05 KR KR1020177025095A patent/KR102541746B1/en active Active
- 2016-02-05 SG SG11201706356XA patent/SG11201706356XA/en unknown
- 2016-02-05 RU RU2017131044A patent/RU2719346C2/en active
- 2016-02-05 BR BR112017016932-0A patent/BR112017016932B1/en active IP Right Grant
- 2016-02-05 WO PCT/US2016/016827 patent/WO2016127086A1/en not_active Ceased
- 2016-02-05 SG SG10202006588UA patent/SG10202006588UA/en unknown
- 2016-02-05 JP JP2017541375A patent/JP6496417B2/en active Active
- 2016-02-05 US US15/017,136 patent/US10102653B2/en active Active
- 2016-02-05 EP EP16706294.2A patent/EP3254086B1/en active Active
- 2016-02-05 CN CN201680009017.0A patent/CN107223249B/en active Active
Non-Patent Citations (1)
| Title |
|---|
| None * |
Also Published As
| Publication number | Publication date |
|---|---|
| KR20170135832A (en) | 2017-12-08 |
| CN107223249A (en) | 2017-09-29 |
| BR112017016932A2 (en) | 2018-04-03 |
| SG10202006588UA (en) | 2020-08-28 |
| US20160239990A1 (en) | 2016-08-18 |
| JP2018506974A (en) | 2018-03-15 |
| WO2016127086A1 (en) | 2016-08-11 |
| US10102653B2 (en) | 2018-10-16 |
| SG11201706356XA (en) | 2017-09-28 |
| EP3254086A1 (en) | 2017-12-13 |
| RU2017131044A (en) | 2019-03-06 |
| RU2719346C2 (en) | 2020-04-17 |
| KR102541746B1 (en) | 2023-06-09 |
| RU2017131044A3 (en) | 2019-07-17 |
| CN107223249B (en) | 2021-06-18 |
| JP6496417B2 (en) | 2019-04-03 |
| BR112017016932B1 (en) | 2021-04-20 |
Similar Documents
| Publication | Publication Date | Title |
|---|---|---|
| US20230127610A1 (en) | Methods and systems for visualizing data quality | |
| US20250182855A1 (en) | Methods and systems for visualizing and evaluating data | |
| US12614320B2 (en) | Visualization tools for digital PCR data | |
| US20120030618A1 (en) | Systems and methods for assigning attributes to a plurality of samples | |
| JP5191482B2 (en) | System and method for managing sample test results and respective result context information | |
| US10102653B2 (en) | Methods and systems for identifying polymerase chain reaction sites | |
| CN109313926B (en) | Method and system for graphical user interface for biological data | |
| EP4145307A1 (en) | Data management system, data management method, and program | |
| EP3254080B1 (en) | Methods and systems for instrument validation | |
| US11238958B2 (en) | System for determining a copy number of a genomic sequence | |
| SG184483A1 (en) | Systems and methods for genotyping by angle configuration search | |
| KR20260006608A (en) | Multidimensional data visualization for multi-sample quantification |
Legal Events
| Date | Code | Title | Description |
|---|---|---|---|
| STAA | Information on the status of an ep patent application or granted ep patent |
Free format text: STATUS: THE INTERNATIONAL PUBLICATION HAS BEEN MADE |
|
| PUAI | Public reference made under article 153(3) epc to a published international application that has entered the european phase |
Free format text: ORIGINAL CODE: 0009012 |
|
| STAA | Information on the status of an ep patent application or granted ep patent |
Free format text: STATUS: REQUEST FOR EXAMINATION WAS MADE |
|
| 17P | Request for examination filed |
Effective date: 20170901 |
|
| AK | Designated contracting states |
Kind code of ref document: A1 Designated state(s): AL AT BE BG CH CY CZ DE DK EE ES FI FR GB GR HR HU IE IS IT LI LT LU LV MC MK MT NL NO PL PT RO RS SE SI SK SM TR |
|
| AX | Request for extension of the european patent |
Extension state: BA ME |
|
| DAV | Request for validation of the european patent (deleted) | ||
| DAX | Request for extension of the european patent (deleted) | ||
| STAA | Information on the status of an ep patent application or granted ep patent |
Free format text: STATUS: EXAMINATION IS IN PROGRESS |
|
| 17Q | First examination report despatched |
Effective date: 20190118 |
|
| GRAP | Despatch of communication of intention to grant a patent |
Free format text: ORIGINAL CODE: EPIDOSNIGR1 |
|
| STAA | Information on the status of an ep patent application or granted ep patent |
Free format text: STATUS: GRANT OF PATENT IS INTENDED |
|
| RIC1 | Information provided on ipc code assigned before grant |
Ipc: G01N 21/64 20060101AFI20200122BHEP Ipc: G16B 45/00 20190101ALI20200122BHEP |
|
| INTG | Intention to grant announced |
Effective date: 20200214 |
|
| GRAJ | Information related to disapproval of communication of intention to grant by the applicant or resumption of examination proceedings by the epo deleted |
Free format text: ORIGINAL CODE: EPIDOSDIGR1 |
|
| GRAL | Information related to payment of fee for publishing/printing deleted |
Free format text: ORIGINAL CODE: EPIDOSDIGR3 |
|
| GRAS | Grant fee paid |
Free format text: ORIGINAL CODE: EPIDOSNIGR3 |
|
| STAA | Information on the status of an ep patent application or granted ep patent |
Free format text: STATUS: EXAMINATION IS IN PROGRESS |
|
| GRAJ | Information related to disapproval of communication of intention to grant by the applicant or resumption of examination proceedings by the epo deleted |
Free format text: ORIGINAL CODE: EPIDOSDIGR1 |
|
| GRAR | Information related to intention to grant a patent recorded |
Free format text: ORIGINAL CODE: EPIDOSNIGR71 |
|
| STAA | Information on the status of an ep patent application or granted ep patent |
Free format text: STATUS: GRANT OF PATENT IS INTENDED |
|
| GRAA | (expected) grant |
Free format text: ORIGINAL CODE: 0009210 |
|
| STAA | Information on the status of an ep patent application or granted ep patent |
Free format text: STATUS: THE PATENT HAS BEEN GRANTED |
|
| INTC | Intention to grant announced (deleted) | ||
| AK | Designated contracting states |
Kind code of ref document: B1 Designated state(s): AL AT BE BG CH CY CZ DE DK EE ES FI FR GB GR HR HU IE IS IT LI LT LU LV MC MK MT NL NO PL PT RO RS SE SI SK SM TR |
|
| INTG | Intention to grant announced |
Effective date: 20200626 |
|
| REG | Reference to a national code |
Ref country code: GB Ref legal event code: FG4D |
|
| REG | Reference to a national code |
Ref country code: CH Ref legal event code: EP |
|
| REG | Reference to a national code |
Ref country code: AT Ref legal event code: REF Ref document number: 1299404 Country of ref document: AT Kind code of ref document: T Effective date: 20200815 |
|
| REG | Reference to a national code |
Ref country code: DE Ref legal event code: R096 Ref document number: 602016041279 Country of ref document: DE |
|
| REG | Reference to a national code |
Ref country code: IE Ref legal event code: FG4D |
|
| REG | Reference to a national code |
Ref country code: LT Ref legal event code: MG4D |
|
| REG | Reference to a national code |
Ref country code: NL Ref legal event code: MP Effective date: 20200805 |
|
| REG | Reference to a national code |
Ref country code: AT Ref legal event code: MK05 Ref document number: 1299404 Country of ref document: AT Kind code of ref document: T Effective date: 20200805 |
|
| PG25 | Lapsed in a contracting state [announced via postgrant information from national office to epo] |
Ref country code: AT Free format text: LAPSE BECAUSE OF FAILURE TO SUBMIT A TRANSLATION OF THE DESCRIPTION OR TO PAY THE FEE WITHIN THE PRESCRIBED TIME-LIMIT Effective date: 20200805 Ref country code: FI Free format text: LAPSE BECAUSE OF FAILURE TO SUBMIT A TRANSLATION OF THE DESCRIPTION OR TO PAY THE FEE WITHIN THE PRESCRIBED TIME-LIMIT Effective date: 20200805 Ref country code: GR Free format text: LAPSE BECAUSE OF FAILURE TO SUBMIT A TRANSLATION OF THE DESCRIPTION OR TO PAY THE FEE WITHIN THE PRESCRIBED TIME-LIMIT Effective date: 20201106 Ref country code: NO Free format text: LAPSE BECAUSE OF FAILURE TO SUBMIT A TRANSLATION OF THE DESCRIPTION OR TO PAY THE FEE WITHIN THE PRESCRIBED TIME-LIMIT Effective date: 20201105 Ref country code: SE Free format text: LAPSE BECAUSE OF FAILURE TO SUBMIT A TRANSLATION OF THE DESCRIPTION OR TO PAY THE FEE WITHIN THE PRESCRIBED TIME-LIMIT Effective date: 20200805 Ref country code: BG Free format text: LAPSE BECAUSE OF FAILURE TO SUBMIT A TRANSLATION OF THE DESCRIPTION OR TO PAY THE FEE WITHIN THE PRESCRIBED TIME-LIMIT Effective date: 20201105 Ref country code: HR Free format text: LAPSE BECAUSE OF FAILURE TO SUBMIT A TRANSLATION OF THE DESCRIPTION OR TO PAY THE FEE WITHIN THE PRESCRIBED TIME-LIMIT Effective date: 20200805 Ref country code: LT Free format text: LAPSE BECAUSE OF FAILURE TO SUBMIT A TRANSLATION OF THE DESCRIPTION OR TO PAY THE FEE WITHIN THE PRESCRIBED TIME-LIMIT Effective date: 20200805 Ref country code: PT Free format text: LAPSE BECAUSE OF FAILURE TO SUBMIT A TRANSLATION OF THE DESCRIPTION OR TO PAY THE FEE WITHIN THE PRESCRIBED TIME-LIMIT Effective date: 20201207 Ref country code: ES Free format text: LAPSE BECAUSE OF FAILURE TO SUBMIT A TRANSLATION OF THE DESCRIPTION OR TO PAY THE FEE WITHIN THE PRESCRIBED TIME-LIMIT Effective date: 20200805 |
|
| PG25 | Lapsed in a contracting state [announced via postgrant information from national office to epo] |
Ref country code: IS Free format text: LAPSE BECAUSE OF FAILURE TO SUBMIT A TRANSLATION OF THE DESCRIPTION OR TO PAY THE FEE WITHIN THE PRESCRIBED TIME-LIMIT Effective date: 20201205 Ref country code: PL Free format text: LAPSE BECAUSE OF FAILURE TO SUBMIT A TRANSLATION OF THE DESCRIPTION OR TO PAY THE FEE WITHIN THE PRESCRIBED TIME-LIMIT Effective date: 20200805 Ref country code: LV Free format text: LAPSE BECAUSE OF FAILURE TO SUBMIT A TRANSLATION OF THE DESCRIPTION OR TO PAY THE FEE WITHIN THE PRESCRIBED TIME-LIMIT Effective date: 20200805 Ref country code: RS Free format text: LAPSE BECAUSE OF FAILURE TO SUBMIT A TRANSLATION OF THE DESCRIPTION OR TO PAY THE FEE WITHIN THE PRESCRIBED TIME-LIMIT Effective date: 20200805 Ref country code: NL Free format text: LAPSE BECAUSE OF FAILURE TO SUBMIT A TRANSLATION OF THE DESCRIPTION OR TO PAY THE FEE WITHIN THE PRESCRIBED TIME-LIMIT Effective date: 20200805 |
|
| PG25 | Lapsed in a contracting state [announced via postgrant information from national office to epo] |
Ref country code: DK Free format text: LAPSE BECAUSE OF FAILURE TO SUBMIT A TRANSLATION OF THE DESCRIPTION OR TO PAY THE FEE WITHIN THE PRESCRIBED TIME-LIMIT Effective date: 20200805 Ref country code: CZ Free format text: LAPSE BECAUSE OF FAILURE TO SUBMIT A TRANSLATION OF THE DESCRIPTION OR TO PAY THE FEE WITHIN THE PRESCRIBED TIME-LIMIT Effective date: 20200805 Ref country code: RO Free format text: LAPSE BECAUSE OF FAILURE TO SUBMIT A TRANSLATION OF THE DESCRIPTION OR TO PAY THE FEE WITHIN THE PRESCRIBED TIME-LIMIT Effective date: 20200805 Ref country code: SM Free format text: LAPSE BECAUSE OF FAILURE TO SUBMIT A TRANSLATION OF THE DESCRIPTION OR TO PAY THE FEE WITHIN THE PRESCRIBED TIME-LIMIT Effective date: 20200805 Ref country code: EE Free format text: LAPSE BECAUSE OF FAILURE TO SUBMIT A TRANSLATION OF THE DESCRIPTION OR TO PAY THE FEE WITHIN THE PRESCRIBED TIME-LIMIT Effective date: 20200805 |
|
| REG | Reference to a national code |
Ref country code: DE Ref legal event code: R097 Ref document number: 602016041279 Country of ref document: DE |
|
| PG25 | Lapsed in a contracting state [announced via postgrant information from national office to epo] |
Ref country code: AL Free format text: LAPSE BECAUSE OF FAILURE TO SUBMIT A TRANSLATION OF THE DESCRIPTION OR TO PAY THE FEE WITHIN THE PRESCRIBED TIME-LIMIT Effective date: 20200805 |
|
| PLBE | No opposition filed within time limit |
Free format text: ORIGINAL CODE: 0009261 |
|
| STAA | Information on the status of an ep patent application or granted ep patent |
Free format text: STATUS: NO OPPOSITION FILED WITHIN TIME LIMIT |
|
| PG25 | Lapsed in a contracting state [announced via postgrant information from national office to epo] |
Ref country code: SK Free format text: LAPSE BECAUSE OF FAILURE TO SUBMIT A TRANSLATION OF THE DESCRIPTION OR TO PAY THE FEE WITHIN THE PRESCRIBED TIME-LIMIT Effective date: 20200805 |
|
| 26N | No opposition filed |
Effective date: 20210507 |
|
| PG25 | Lapsed in a contracting state [announced via postgrant information from national office to epo] |
Ref country code: IT Free format text: LAPSE BECAUSE OF FAILURE TO SUBMIT A TRANSLATION OF THE DESCRIPTION OR TO PAY THE FEE WITHIN THE PRESCRIBED TIME-LIMIT Effective date: 20200805 |
|
| PG25 | Lapsed in a contracting state [announced via postgrant information from national office to epo] |
Ref country code: SI Free format text: LAPSE BECAUSE OF FAILURE TO SUBMIT A TRANSLATION OF THE DESCRIPTION OR TO PAY THE FEE WITHIN THE PRESCRIBED TIME-LIMIT Effective date: 20200805 |
|
| PG25 | Lapsed in a contracting state [announced via postgrant information from national office to epo] |
Ref country code: MC Free format text: LAPSE BECAUSE OF FAILURE TO SUBMIT A TRANSLATION OF THE DESCRIPTION OR TO PAY THE FEE WITHIN THE PRESCRIBED TIME-LIMIT Effective date: 20200805 |
|
| REG | Reference to a national code |
Ref country code: BE Ref legal event code: MM Effective date: 20210228 |
|
| PG25 | Lapsed in a contracting state [announced via postgrant information from national office to epo] |
Ref country code: CH Free format text: LAPSE BECAUSE OF NON-PAYMENT OF DUE FEES Effective date: 20210228 Ref country code: LI Free format text: LAPSE BECAUSE OF NON-PAYMENT OF DUE FEES Effective date: 20210228 Ref country code: LU Free format text: LAPSE BECAUSE OF NON-PAYMENT OF DUE FEES Effective date: 20210205 |
|
| PG25 | Lapsed in a contracting state [announced via postgrant information from national office to epo] |
Ref country code: IE Free format text: LAPSE BECAUSE OF NON-PAYMENT OF DUE FEES Effective date: 20210205 |
|
| PG25 | Lapsed in a contracting state [announced via postgrant information from national office to epo] |
Ref country code: BE Free format text: LAPSE BECAUSE OF NON-PAYMENT OF DUE FEES Effective date: 20210228 |
|
| PG25 | Lapsed in a contracting state [announced via postgrant information from national office to epo] |
Ref country code: CY Free format text: LAPSE BECAUSE OF FAILURE TO SUBMIT A TRANSLATION OF THE DESCRIPTION OR TO PAY THE FEE WITHIN THE PRESCRIBED TIME-LIMIT Effective date: 20200805 |
|
| PG25 | Lapsed in a contracting state [announced via postgrant information from national office to epo] |
Ref country code: HU Free format text: LAPSE BECAUSE OF FAILURE TO SUBMIT A TRANSLATION OF THE DESCRIPTION OR TO PAY THE FEE WITHIN THE PRESCRIBED TIME-LIMIT; INVALID AB INITIO Effective date: 20160205 |
|
| PG25 | Lapsed in a contracting state [announced via postgrant information from national office to epo] |
Ref country code: MK Free format text: LAPSE BECAUSE OF FAILURE TO SUBMIT A TRANSLATION OF THE DESCRIPTION OR TO PAY THE FEE WITHIN THE PRESCRIBED TIME-LIMIT Effective date: 20200805 |
|
| PG25 | Lapsed in a contracting state [announced via postgrant information from national office to epo] |
Ref country code: TR Free format text: LAPSE BECAUSE OF FAILURE TO SUBMIT A TRANSLATION OF THE DESCRIPTION OR TO PAY THE FEE WITHIN THE PRESCRIBED TIME-LIMIT Effective date: 20200805 |
|
| PG25 | Lapsed in a contracting state [announced via postgrant information from national office to epo] |
Ref country code: MT Free format text: LAPSE BECAUSE OF FAILURE TO SUBMIT A TRANSLATION OF THE DESCRIPTION OR TO PAY THE FEE WITHIN THE PRESCRIBED TIME-LIMIT Effective date: 20200805 |
|
| PGFP | Annual fee paid to national office [announced via postgrant information from national office to epo] |
Ref country code: GB Payment date: 20260210 Year of fee payment: 11 |
|
| PGFP | Annual fee paid to national office [announced via postgrant information from national office to epo] |
Ref country code: DE Payment date: 20260113 Year of fee payment: 11 |
|
| PGFP | Annual fee paid to national office [announced via postgrant information from national office to epo] |
Ref country code: FR Payment date: 20260209 Year of fee payment: 11 |